Embed Size (px)
Citation preview

ROI Report – an example
Based on sample data

Campaign Summary
The objective of this campaign was to drive more sales of their products –
through driving more sales traffic to their online catalogue.
The campaign consisted of quarterly email campaigns and online advertising, using
a promotional incentive to encourage purchases.

Report SummaryThis report is designed to do the following:
• To explain the impact of the quarterly promotions to the audience
• To explain what works and what doesn’t when communicating to this audience
• To explain whether quarterly promotions detract from direct sales revenues, or whether these provide net increase in sales
• To provide sufficient learning to influence the direction of future communication strategy to this audience

The 5 minute review
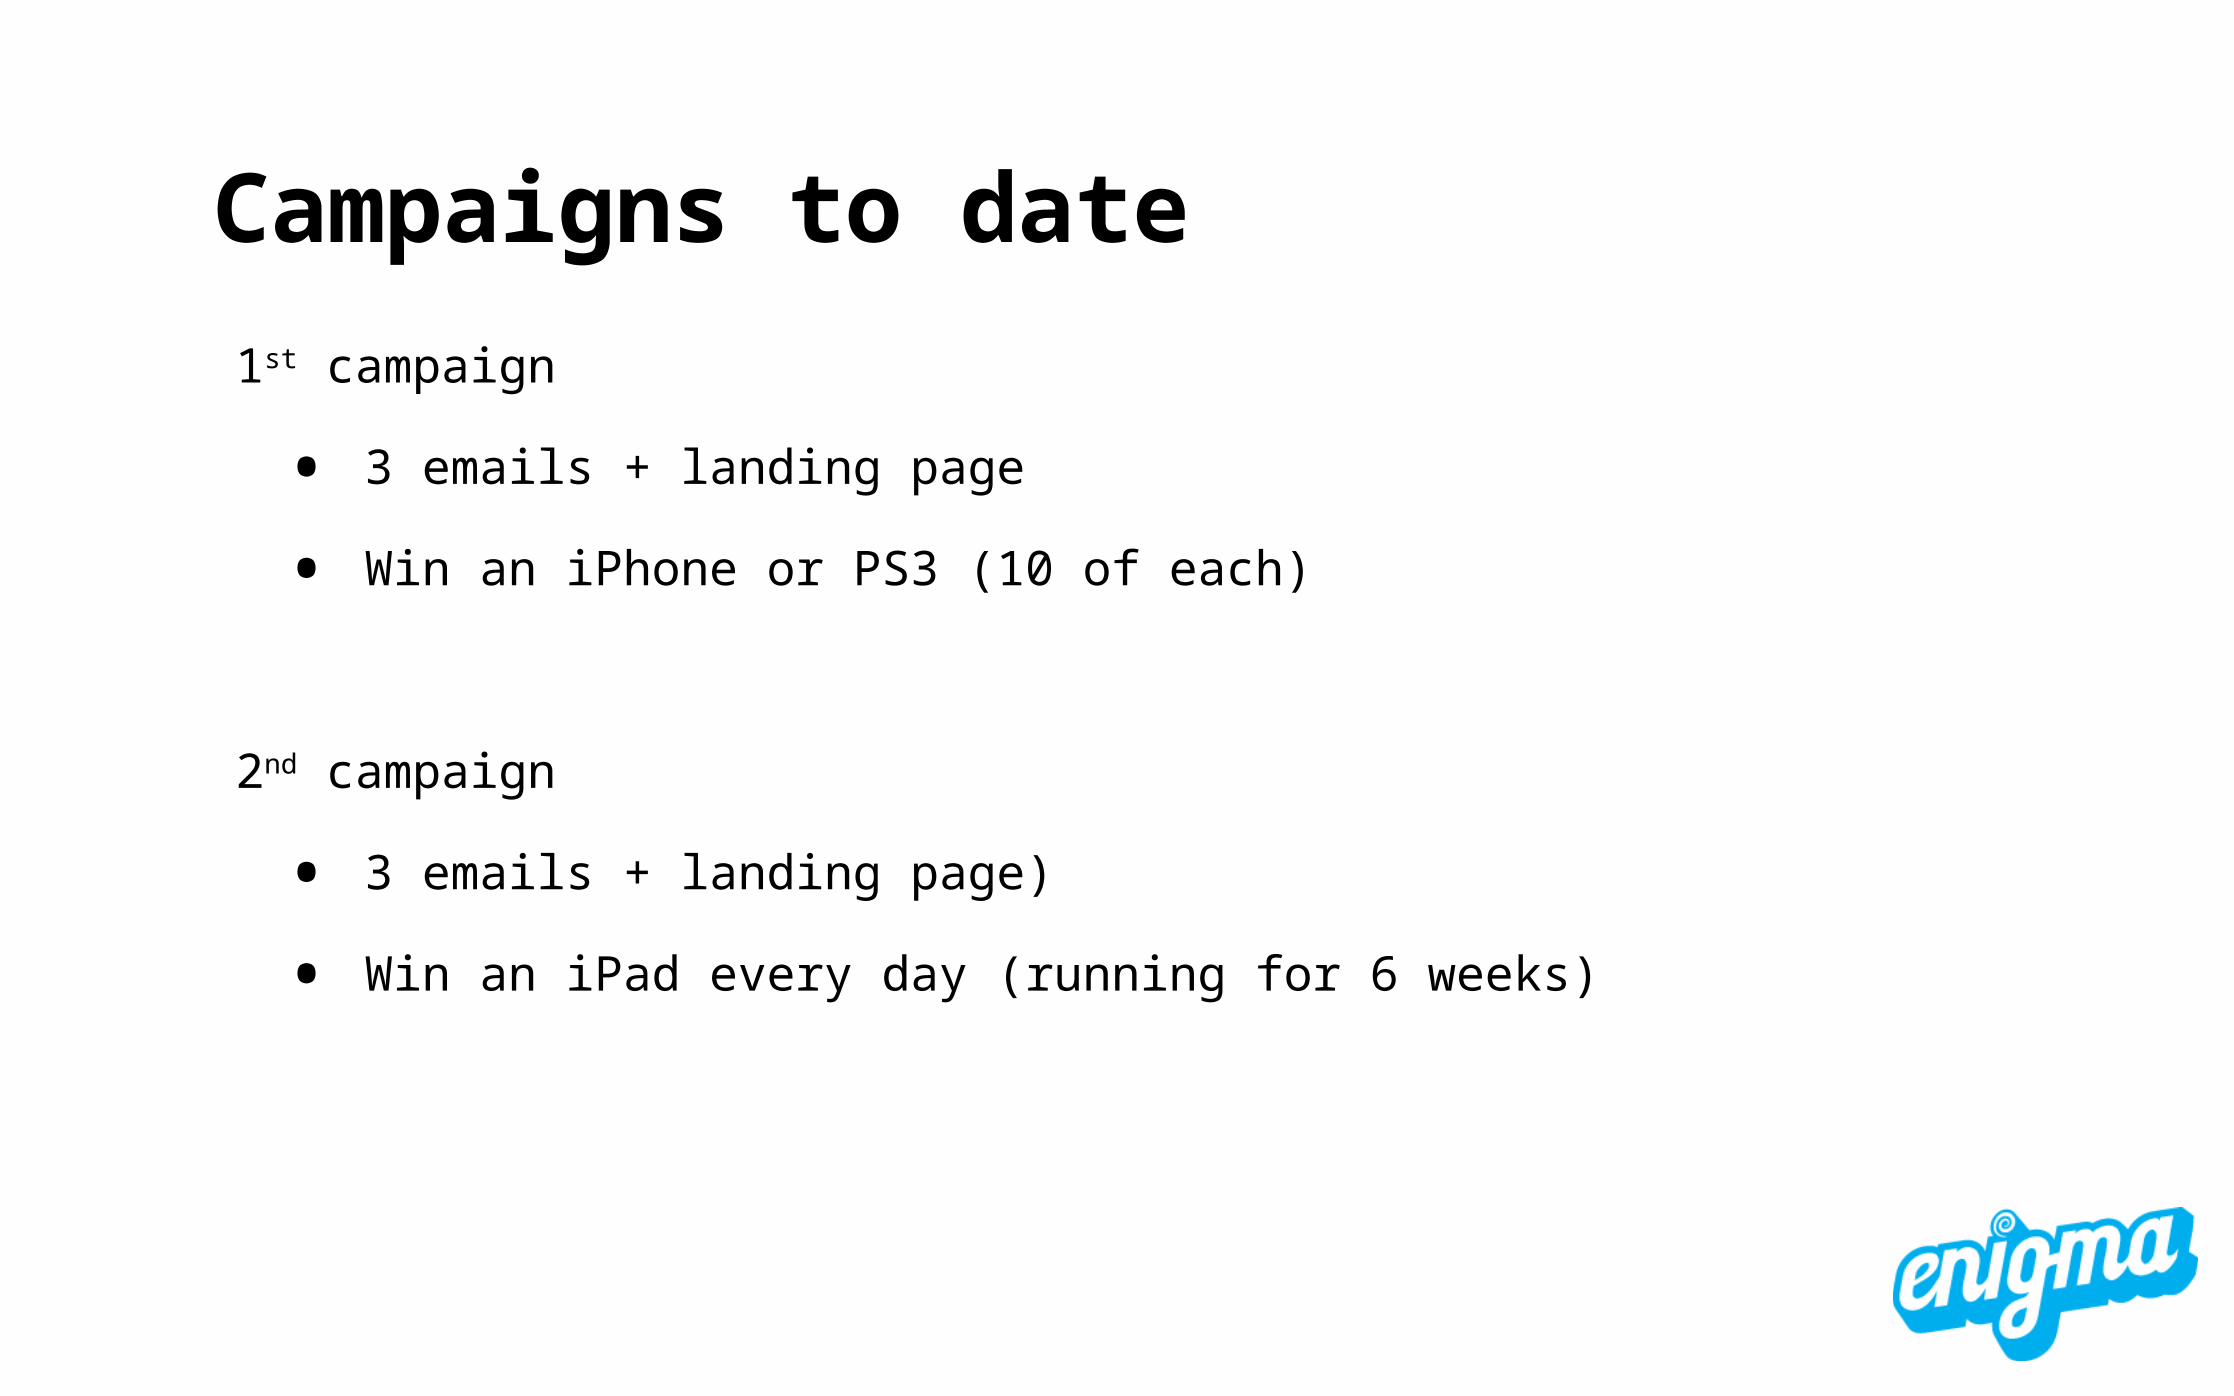
Campaigns to date
1st campaign
• 3 emails + landing page
• Win an iPhone or PS3 (10 of each)
2nd campaign
• 3 emails + landing page)
• Win an iPad every day (running for 6 weeks)
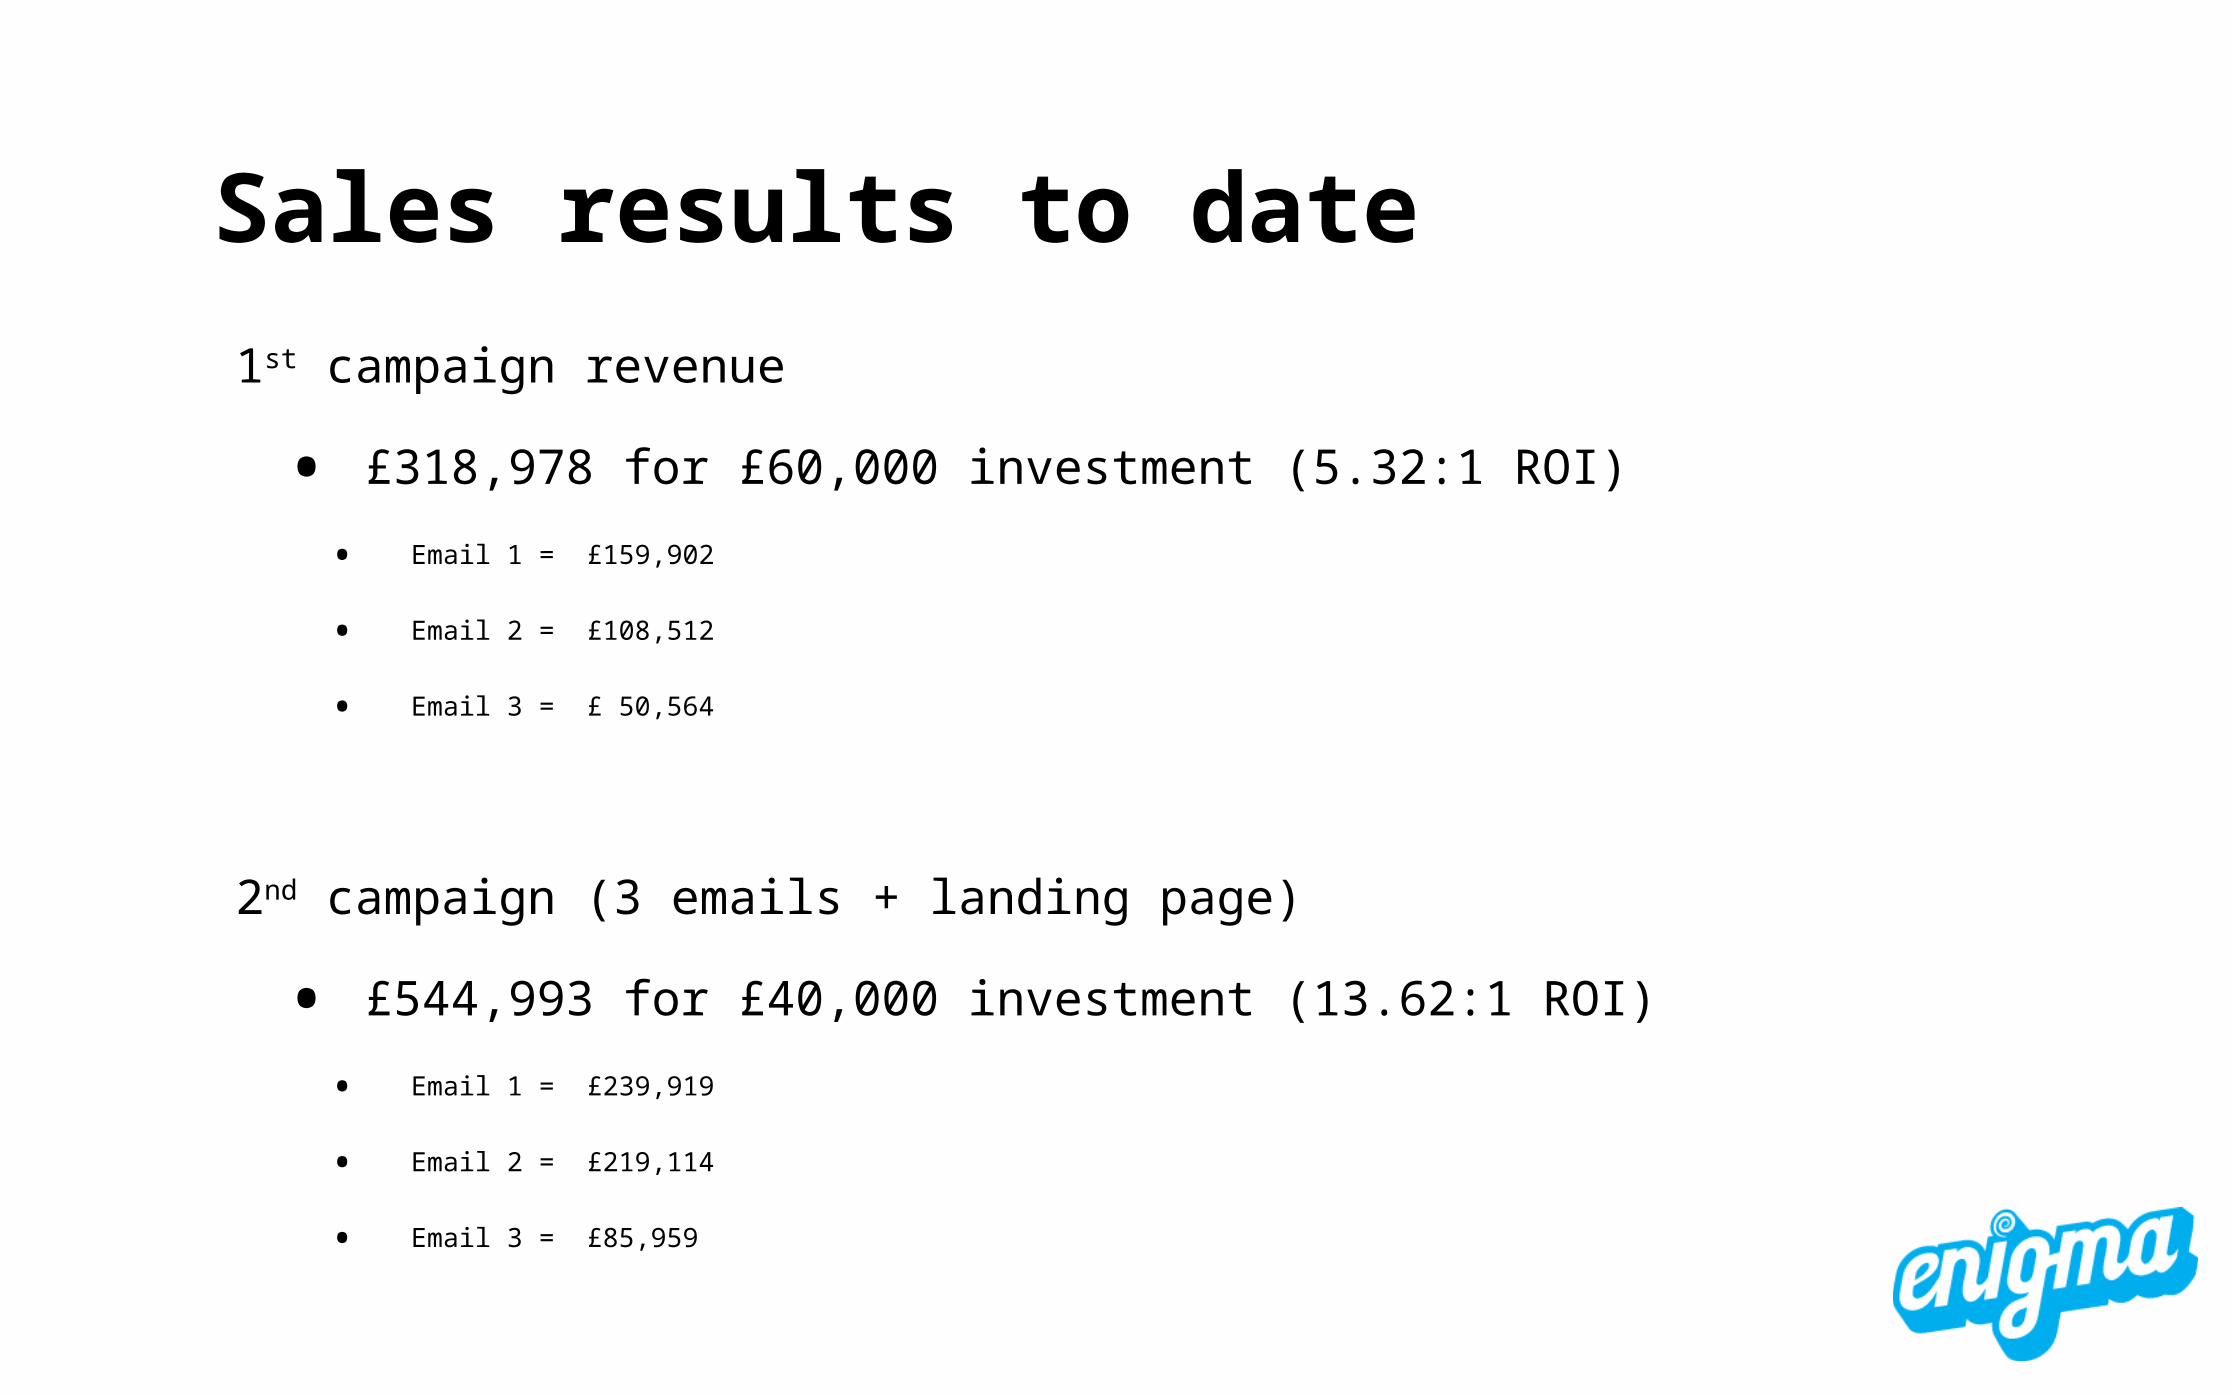
Sales results to date
1st campaign revenue
• £318,978 for £60,000 investment (5.32:1 ROI)
• Email 1 = £159,902
• Email 2 = £108,512
• Email 3 = £ 50,564
2nd campaign (3 emails + landing page)
• £544,993 for £40,000 investment (13.62:1 ROI)
• Email 1 = £239,919
• Email 2 = £219,114
• Email 3 = £85,959

Sales impact of each emailIt can be seen from the graph below that each email had a large impact on sales.
The impact declined over a sequence of 3 emails for each campaign.
Email 1
Email 2
Email 3
Email 1
Email 2
Email 3
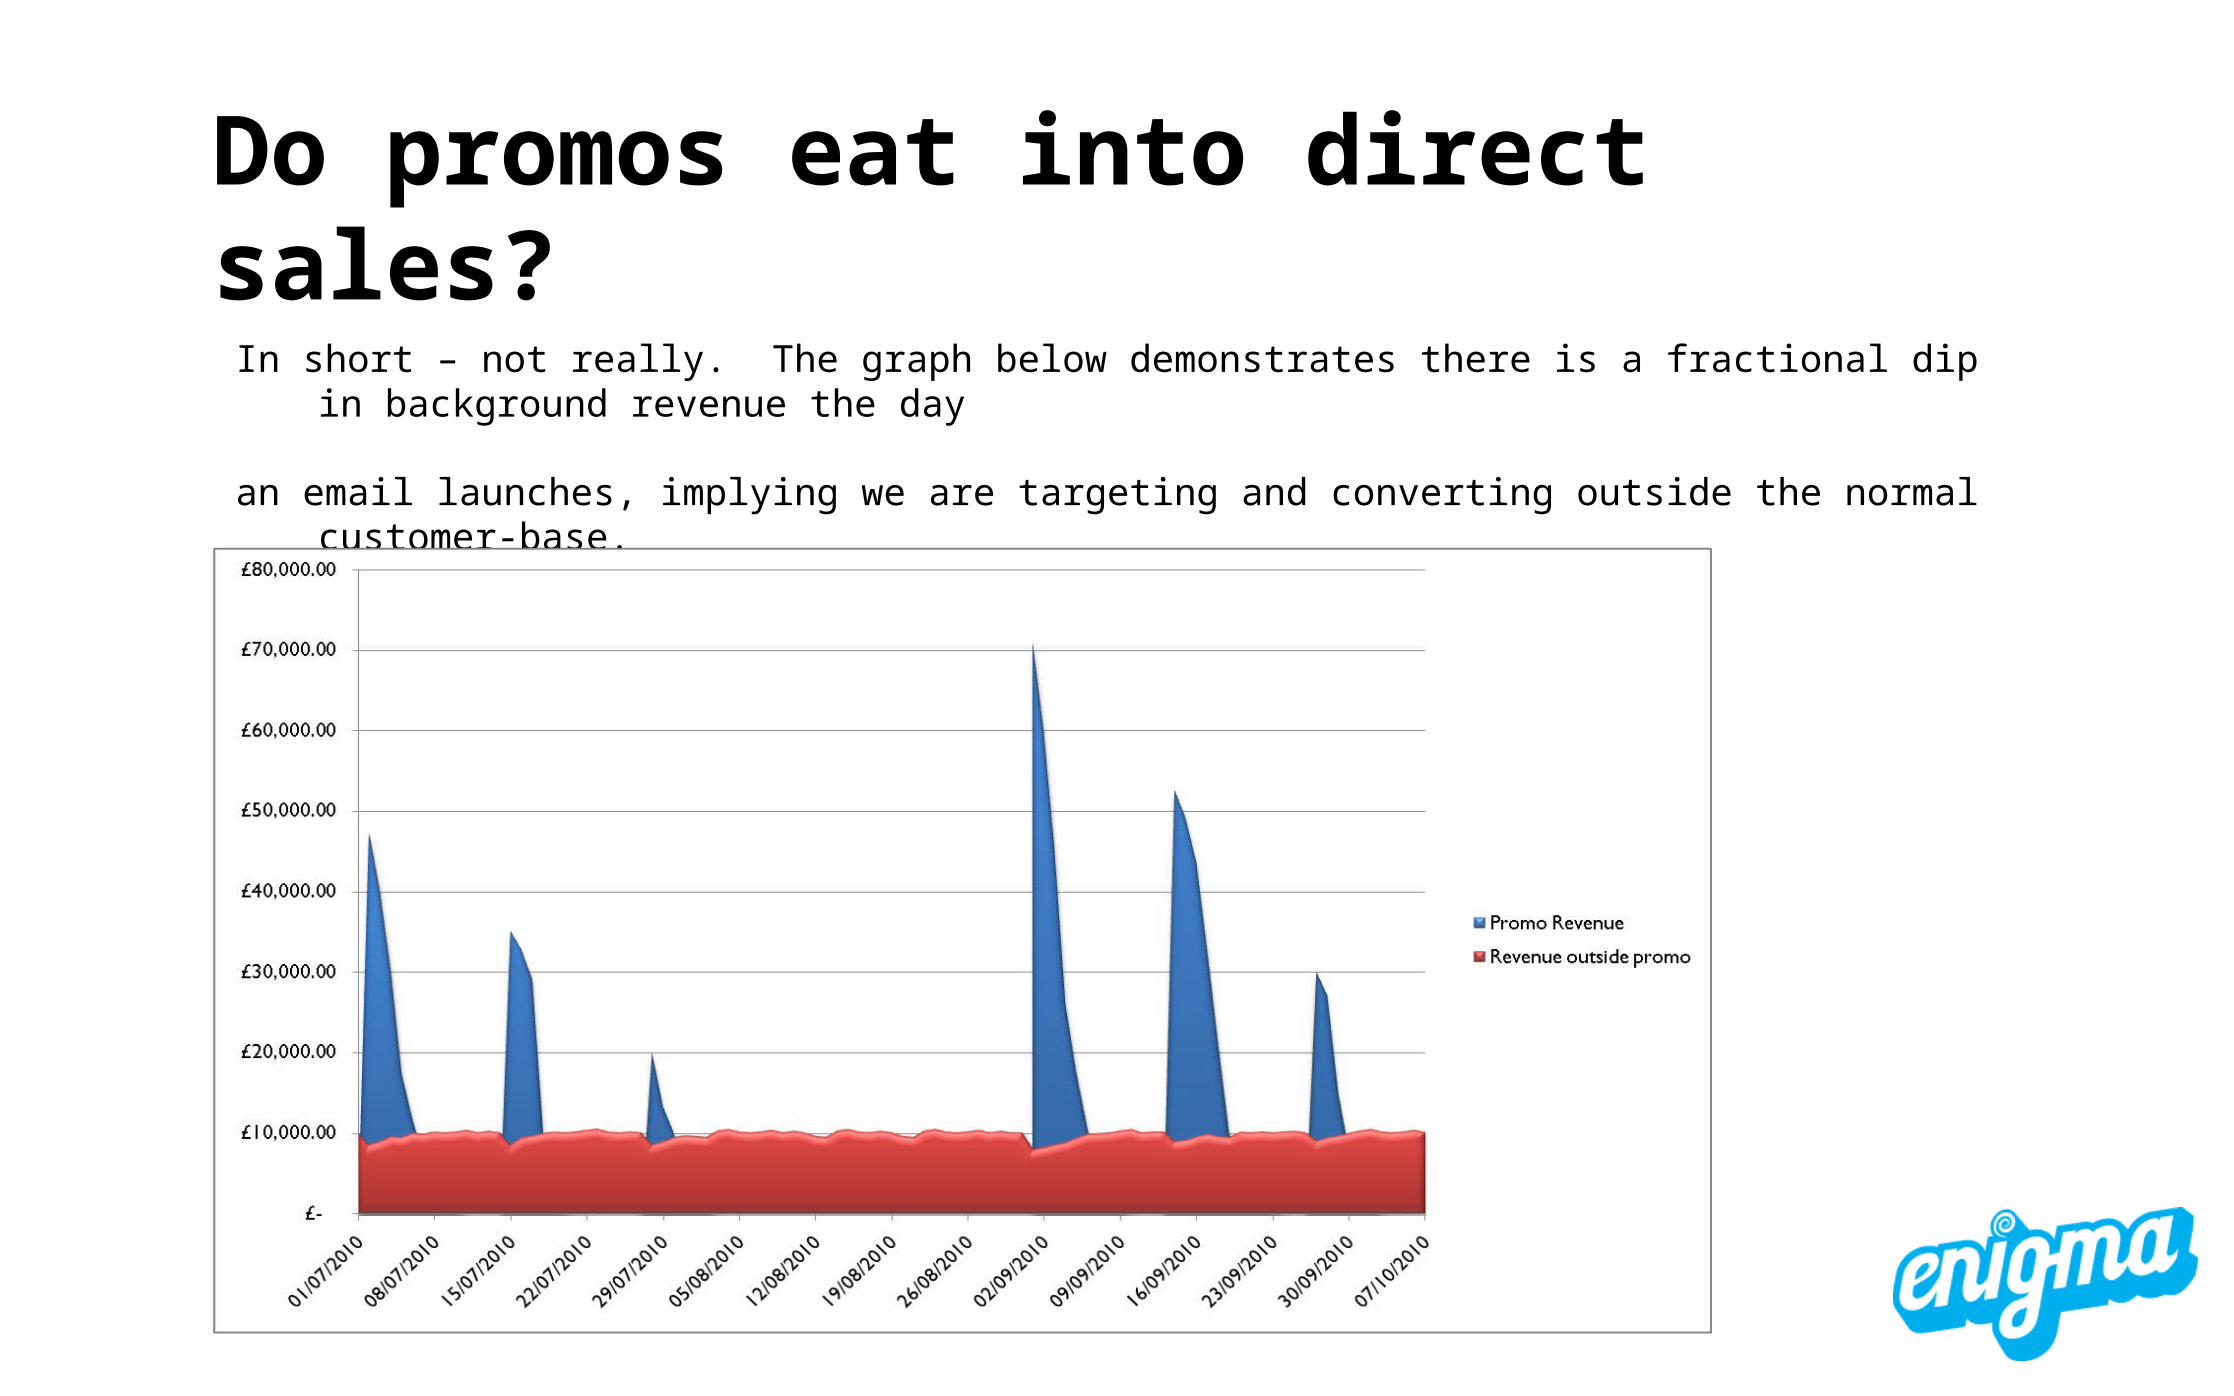
Do promos eat into direct sales?In short – not really. The graph below demonstrates there is a fractional dip in background
revenue the day
an email launches, implying we are targeting and converting outside the normal customer-base.

Response rates for emails
• All rates are unique rates
• Both campaigns demonstrate better response from the first email – pointing to a declining interest over the campaign
• Unsubscribes are well below 0.3% (which we view as our cut-off for acceptable unsubscribe levels)
Email Open Rate CTR UnsubscribeeDM1 40.1% 7.2% 0.02%eDM2 38.5% 6.5% 0.01%eDM3 32.0% 6.4% 0.01%
eDM1 45.2% 12.5% 0.02%eDM2 44.1% 10.2% 0.01%eDM3 40.2% 9.8% 0.01%

Conclusions
• The campaigns did not erode normal sales revenue
• Response rates declined over each campaign – sending more than 3 emails would be expected to yield lower response to email 4 and beyond
• The second campaign approach achieved significantly better response and sales results than the first campaign – implying this would be a better approach for future campaigns

A Deeper Analysis

What we haven’t looked at yet
• How the different countries respond to the campaigns
• Do we need a promo item, or can we just email people to drive sales up?
• ROI – a qualitative understanding, why is it increasing?

Responses by country

A/B Testing: Promo vs. No Promo item
A/B test was run on campaign Email 1 to all UK customers. This was a 50/50 split across the whole target audience (20,525 contacts).
The A/B target groups received the following different deliverables:
• A: Normal incentive (win a PS3)
• B: No incentive
Resulting revenue from this split was:
• A: £141,501
• B: £18,401
• This effectively demonstrates that including a promo item in campaign deliverables will generate over 7 times the return compared to not including a promo item. Even subtracting the cost of the promo items you still get more than 7 times the return from the promo email
Marketing fact: Promos items are effective as a tactic to increase response rates

ROI – changing over timeReviewing the ROI over time seen for the campaigns we can see that
Campaign 2
has a far higher ROI than Campaign 1. Also for each email in the sequence of 3 the
ROI drops significantly (due to lower impact of message from repeat sends).
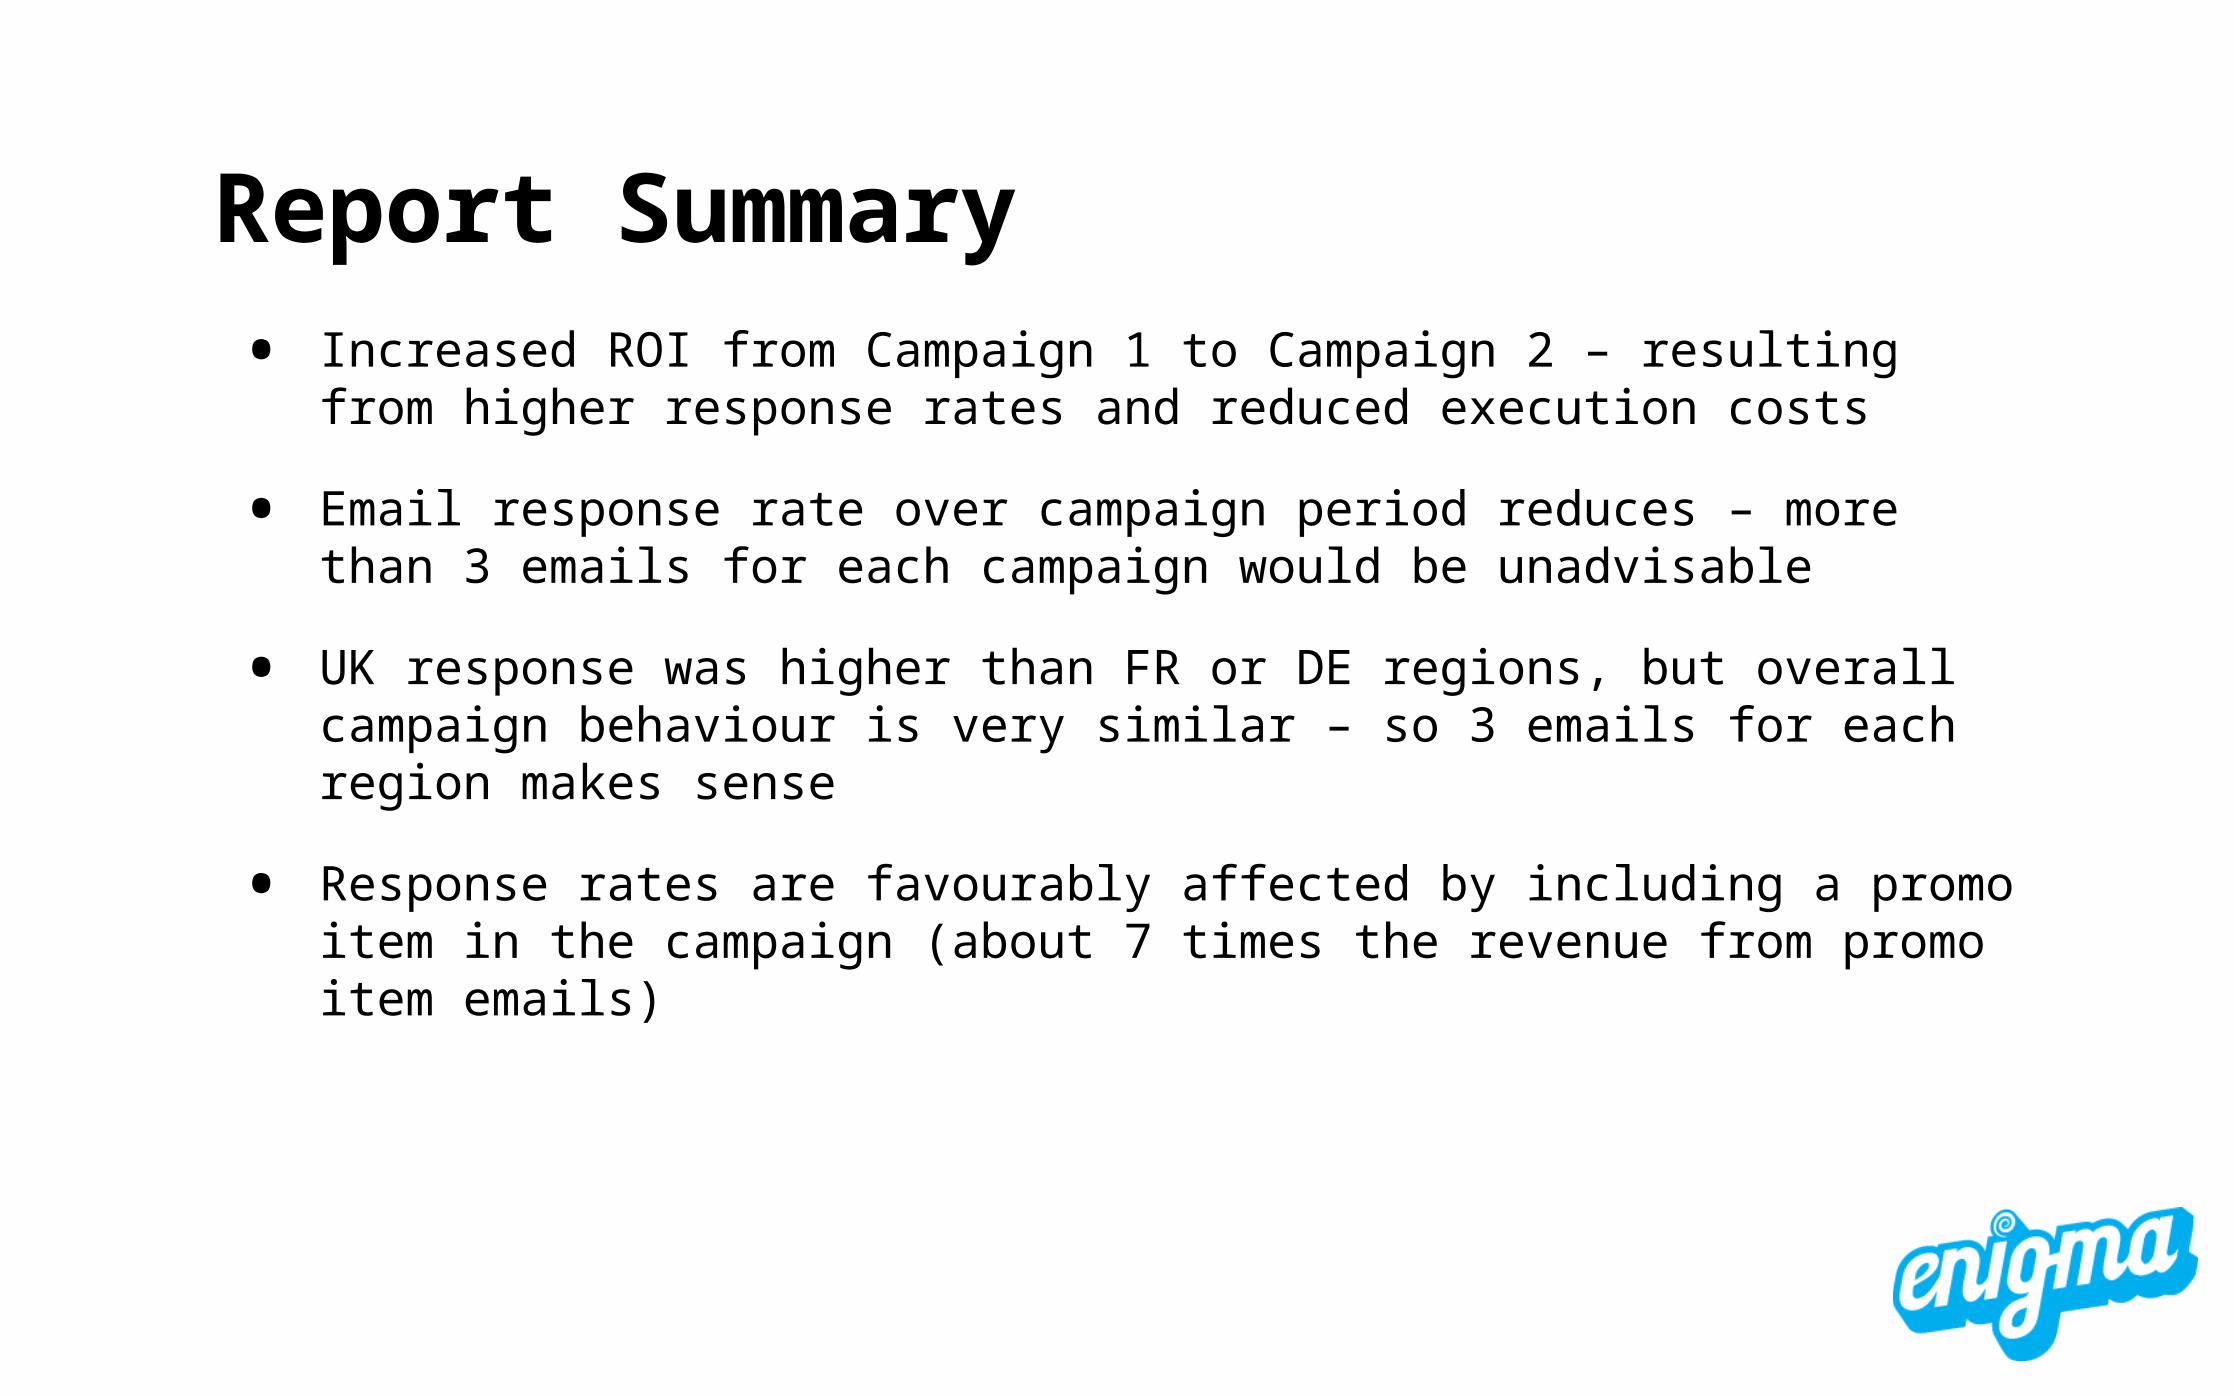
Report Summary• Increased ROI from Campaign 1 to Campaign 2 – resulting from higher
response rates and reduced execution costs
• Email response rate over campaign period reduces – more than 3 emails for each campaign would be unadvisable
• UK response was higher than FR or DE regions, but overall campaign behaviour is very similar – so 3 emails for each region makes sense
• Response rates are favourably affected by including a promo item in the campaign (about 7 times the revenue from promo item emails)

Thank you