Embed Size (px)
Citation preview

This article was downloaded by: 10.3.98.104On: 12 Feb 2022Access details: subscription numberPublisher: CRC PressInforma Ltd Registered in England and Wales Registered Number: 1072954 Registered office: 5 Howick Place, London SW1P 1WG, UK
Handbook of Geotechnical Investigation and Design Tables
Burt G. Look
Rock classification
Publication detailshttps://www.routledgehandbooks.com/doi/10.1201/b16520-4
Burt G. LookPublished online on: 10 Feb 2014
How to cite :- Burt G. Look. 10 Feb 2014, Rock classification from: Handbook of GeotechnicalInvestigation and Design Tables CRC PressAccessed on: 12 Feb 2022https://www.routledgehandbooks.com/doi/10.1201/b16520-4
PLEASE SCROLL DOWN FOR DOCUMENT
Full terms and conditions of use: https://www.routledgehandbooks.com/legal-notices/terms
This Document PDF may be used for research, teaching and private study purposes. Any substantial or systematic reproductions,re-distribution, re-selling, loan or sub-licensing, systematic supply or distribution in any form to anyone is expressly forbidden.
The publisher does not give any warranty express or implied or make any representation that the contents will be complete oraccurate or up to date. The publisher shall not be liable for an loss, actions, claims, proceedings, demand or costs or damageswhatsoever or howsoever caused arising directly or indirectly in connection with or arising out of the use of this material.

Dow
nloa
ded
By:
10.
3.98
.104
At:
22:4
3 12
Feb
202
2; F
or: 9
7813
1581
3233
, cha
pter
3, 1
0.12
01/b
1652
0-4
Chapter 3
Rock classification
3.1 Important rock information
• This table offers indicators on the relative importance of the data to be obtained.All information is required.
Table 3.1 Relative importance of ground information.
Relative importance Information Refer
1 Referencing: site, location, test number, Table 3.2sheet number of total
2 Drilling information: depth, drilling and test method Tables 3.2 to 2.3(test pit, borehole), water level
3/4 Rock weathering Table 3.53/4 Rock strength and rock quality designation (RQD) Table 3.8 and 3.95 Rock description: colour, defects, spacing Table 3.11 to 3.146 Rock type/Origin Table 3.15 and 3.16
3.2 Rock description
• Rocks are generally described in the borelog using the following sequence of termsshown, and with delineation between the soil log and rock log.◦ Identification of the test log is also required with the following data
– Client– Project description– Project location– Project number– Sheet No. __ of __– Reference: Easting, northing, elevation, inclination– Date started and completed
Dow
nloa
ded
By:
10.
3.98
.104
At:
22:4
3 12
Feb
202
2; F
or: 9
7813
1581
3233
, cha
pter
3, 1
0.12
01/b
1652
0-4
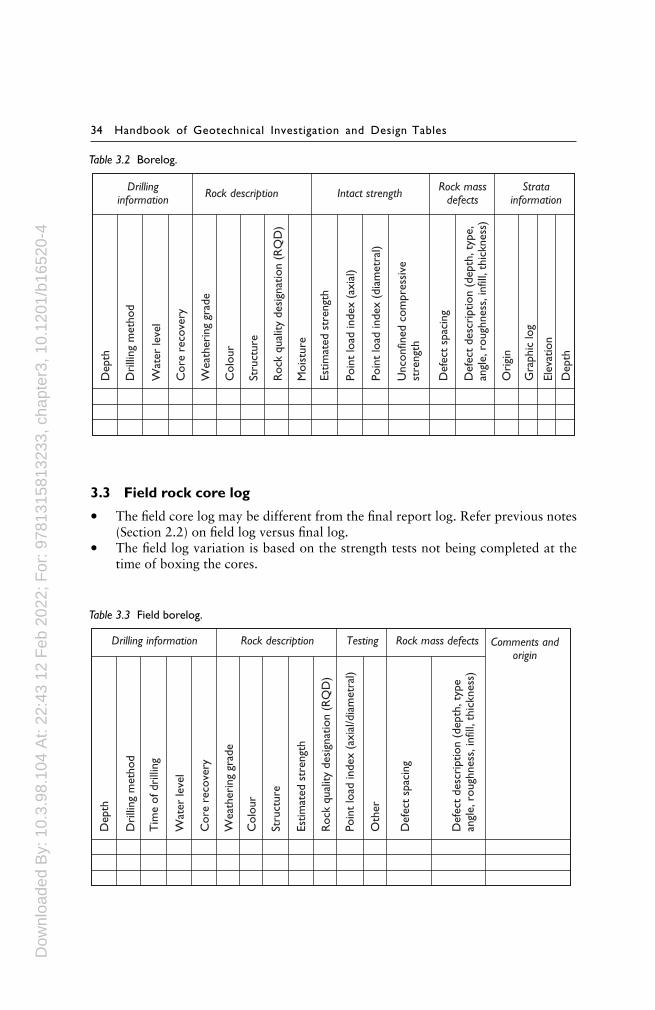
34 Handbook of Geotechnical Investigation and Design Tables
Table 3.2 Borelog.
Drillinginformation Rock description Intact strength Rock mass
defectsStrata
information
Dep
th
Dri
lling
met
hod
Wat
er le
vel
Cor
e re
cove
ry
Wea
ther
ing
grad
e
Col
our
Stru
ctur
e
Roc
k qu
ality
des
igna
tion
(RQ
D)
Moi
stur
e
Estim
ated
str
engt
h
Poin
t lo
ad in
dex
(axi
al)
Poin
t lo
ad in
dex
(dia
met
ral)
Unc
onfin
ed c
ompr
essi
vest
reng
th
Def
ect
spac
ing
Def
ect
desc
ript
ion
(dep
th, t
ype,
angl
e, r
ough
ness
, inf
ill, t
hick
ness
)
Ori
gin
Gra
phic
log
Elev
atio
n
Dep
th
3.3 Field rock core log
• The field core log may be different from the final report log. Refer previous notes(Section 2.2) on field log versus final log.
• The field log variation is based on the strength tests not being completed at thetime of boxing the cores.
Table 3.3 Field borelog.
Drilling information Rock description Testing Rock mass defects
Dep
th
Dri
lling
met
hod
Tim
e of
dri
lling
Wat
er le
vel
Cor
e re
cove
ry
Wea
ther
ing
grad
e
Col
our
Stru
ctur
e
Estim
ated
str
engt
h
Roc
k qu
ality
des
igna
tion
(RQ
D)
Poin
t lo
ad in
dex
(axi
al/d
iam
etra
l)
Oth
er
Def
ect
spac
ing
Def
ect
desc
ript
ion
(dep
th, t
ype
angl
e, r
ough
ness
, inf
ill, t
hick
ness
)
Comments andorigin

Dow
nloa
ded
By:
10.
3.98
.104
At:
22:4
3 12
Feb
202
2; F
or: 9
7813
1581
3233
, cha
pter
3, 1
0.12
01/b
1652
0-4
Rock classification 35
• Due to the relatively slow rate of obtaining samples (as compared to soil) then therewould be time to make some assessments. However, some supervisors prefer tolog all samples in the laboratory, as there is a benefit in observing the full corelength at one session.– For example, the rock quality designation (RQD). If individual box cores are
used, the assessment is on the core run length. If all boxes for a particularborehole are logged simultaneously, the assessment RQD is on the domainlength (preferable).
• Typical bore box sizes are 1.0 m to 1.5 m in length with 5 to 4 slots. This controlsthe weight to 25 kg maximum for lifting purposes.◦ Rock origins are in 3 groups
– Sedimentary rocks– Igneous rocks– Metamorphic rocks
3.4 Drilling information
• The typical symbols only are shown. Each consultant or authority has their ownvariation.
Table 3.4 Typical symbols used for rock drilling equipment.
Symbol Equipment
PQ Coring using 85 mm (inside diameter) core barrelHQ Coring using 63 mm core barrelNMLC Coring using 52 mm core barrelNQ Coring using 47 mm core barrelRR Tricone (Rock Roller) BitDB Drag Bit
3.5 Rock weathering
• The rock weathering is the most likely parameter to be assessed.• Weathering is often used to assess strength as a quick and easily identifiable
approach – but should not be used as a standalone. This approach must be firstsuitably calibrated with the assessment of other rock properties such as intactstrength, and defects.
Figure 3.1 Rock mass behaviour.

Dow
nloa
ded
By:
10.
3.98
.104
At:
22:4
3 12
Feb
202
2; F
or: 9
7813
1581
3233
, cha
pter
3, 1
0.12
01/b
1652
0-4
36 Handbook of Geotechnical Investigation and Design Tables
Table 3.5 Rock weathering classification.
Term Symbol Field assessment
Residual soil RS Soil developed on extremely weathered rock; the massstructure and substance fabric are no longer evident; thereis a large change in volume but the soil has not beensignificantly transported. Described with soil properties onthe log
Extremely Weathered XW Soil is weathered to such an extent that it has ‘soil’properties i.e. it either disintegrates or can be remoulded,in water. May be described with soil properties
Distinctly Weathered DW (MW/HW) Rock strength usually changed by weathering. The rockmay be highly discoloured, usually by iron staining. Porositymay be increased by leaching, or may be decreased due todeposition of weathering products in pores.
Slightly Weathered SW Rock is slightly discoloured but shows little or no changeof strength from fresh rock.
Fresh FR Rock shows no sign of decomposition or staining.
◦ RS is not a rock type and represents the completely weathered product in situ◦ Sometimes aspect is important with deeper weathering in the warmth of
northern sunlight (for countries in the southern hemisphere)◦ Distinctly weathered may be further classified into Highly (HW) and moder-
ately weathered (MW). The former represents greater than 50% soil, whilethe latter represents less than 50% soil.
◦ This table is appropriate for field assessment. Detailed testing on rock strength(Table 6.9) show that strength can vary between intact samples of SW and FRweathered rock.
3.6 Colour
• Colour charts are useful for core photography.
Table 3.6 Colour description.
Parameter Description
Tone Light/dark/mottledShade Pinkish/reddish/yellowish/brownish/greenish/bluish/greyishHue Pink/red/yellow/orange/brown/green/blue/purple/white/grey/blackDistribution Uniform/non-uniform (spotted/mottled/streaked/striped)
◦ For core photographs ensure proper lighting/no shadows and damp samplesto highlight defects and colours.
3.7 Rock structure
• The rock structure describes the frequency of discontinuity spacing and thicknessof bedding.

Dow
nloa
ded
By:
10.
3.98
.104
At:
22:4
3 12
Feb
202
2; F
or: 9
7813
1581
3233
, cha
pter
3, 1
0.12
01/b
1652
0-4
Rock classification 37
• The use of defects descriptors typically used in place of below individualdescriptors.
• Persistence reflects the joint continuity.
Table 3.7 Rock structure.
Rock structure Description Dimensions
Thickness of bedding Massive >2.0 mThick-bedded 0.6 to 2.0 mMid-bedded 0.2 to 0.6 mThin-bedded 0.06 m to 0.2 mVery thinly bedded/laminated <0.06 m
Degree of fracturing/jointing Unfractured >2.0 mSlightly fractured 0.6 to 2.0 mModerately fractured 0.2 to 0.6 mHighly fractured 0.06–0.2 mIntensely fractured <0.06 m
Dip of bed or fracture Flat 0 to 15 degreesGently dipping 15 to 45 degreesSteeply dipping 45 to 90 degrees
Persistence Very high >20 mHigh 10–20 mMedium 3–10 mLow 1–3 mVery low >1 m
3.8 Rock quality designation
• RQD (%) is a measure of the degree of fracturing. This is influenced also by qualityof drilling, and handling of the rock cores.
Table 3.8 Rock quality designation.
RQD (%) Rock description Definition
0–25 Very poor
RQD (%) =Sound core pieces > 100 mmTotal core run length
∗ 10025–50 Poor50–75 Fair75–90 Good>90 Excellent
◦ Many variations for measurement of this supposedly simple measurement.◦ Drilling induced fractures should not be included in the RQD measurement.◦ The domain rather than the core length should be used to assess the RQD.
Different values result if the RQD is measured in a per-metre length or adomain area. The latter represents the true RQD values while the formerwould have an averaging effect.
◦ Figure 3.2 shows the RQD measurement procedure.◦ RQD is dependent on the borehole orientation. An inclined borehole adjacent
to a vertical borehole is expected to give a different RQD value.

Dow
nloa
ded
By:
10.
3.98
.104
At:
22:4
3 12
Feb
202
2; F
or: 9
7813
1581
3233
, cha
pter
3, 1
0.12
01/b
1652
0-4
38 Handbook of Geotechnical Investigation and Design Tables
Figure 3.2 RQD measurement.
3.9 Rock strength
• This table refers to the strength of the intact rock material and not to the strength ofthe rock mass, which may be considerably weaker due to the effect of rock defects.

Dow
nloa
ded
By:
10.
3.98
.104
At:
22:4
3 12
Feb
202
2; F
or: 9
7813
1581
3233
, cha
pter
3, 1
0.12
01/b
1652
0-4
Rock classification 39
Table 3.9 Rock strength.
Strength Symbol Field assessment
By hand Hammer with hand held specimen
Extremely low EL Easily remoulded to a material with soil properties.Very low VL Easily crumbled in 1 hand.Low L Broken into pieces in 1 hand.Medium M Broken with difficulty in 2 hands. Easily broken with light blow (thud).High H 1 firm blow to break (rings).Very high VH >1 blow to break (rings)Extremely high EH Many blows to break (rings).
3.10 Rock hardness
• The rock hardness is not the same as the rock strength.
Table 3.10 Field assessment of hardness.
Description Moh’s Characteristic using pocket knifeof hardness hardness
Rock dust Scratch marks Knife damage
Friable 1–2 Little powder None. Easily crumbled. Too softto cut. Crumbled by hand
Low 2–4 Heavy trace Deeply gouged No damageModerately 4–6 Significant trace Readily visible (after powderHard of powder blown away)Hard 6–8 Little powder Faintly visible Slight damaged; trace
of steel on rockVery hard 8–10 None None Damaged; steel left
on rock
3.11 Discontinuity scale effects
• The scale effects are an order of magnitude only, with significant overlap.
Table 3.11 Discontinuity scale effects.
Discontinuity group Typical range Typical scale
Defect thickness 2 mm to 60 cm 20 mmBedding, foliation, jointing 0.2 m to 60 m 2 mMajor shear zones, seams 20 m to 6 km 200 mRegional fault zones 2 km to 600 km 20 km
3.12 Rock defects spacing
• The rock defects are generally described using the following sequence of terms:– [Defect spacing]; [Depth (metres from surface), defect type, defect angle
(degrees from horizontal), surface roughness, infill, defect thickness (mm)].

Dow
nloa
ded
By:
10.
3.98
.104
At:
22:4
3 12
Feb
202
2; F
or: 9
7813
1581
3233
, cha
pter
3, 1
0.12
01/b
1652
0-4
40 Handbook of Geotechnical Investigation and Design Tables
Table 3.12 Defect spacing.
Description Spacing
Extremely closely spaced (Crushed) <20 mmVery closely spaced 20 mm to 60 mmClosely spaced (Fractured) 60 mm to 200 mmMedium spaced 0.2 m to 0.6 mWidely spaced (Blocky) 0.6 m to 2.0 mVery widely spaced 2.0 m to 6.0 mExtremely widely spaced (Solid) >6.0 m
3.13 Rock defects description
• The defects are also called discontinuities.• The continuity of discontinuities is difficult to judge in rock cores. An open
exposure is required to evaluate (trench, existing cutting).• Even in an existing cutting, the defects in the vertical and lateral direction can be
measured, but the continuity into the face is not readily evident.
Table 3.13 Rock defect descriptors.
Rock defects Descriptors Typical details
Joints Type Bedding, cleavage, foliation, schistiosityJoint wall separation Open (size of open) or Closed (zero size)
Filled or cleanRoughness Macro surface (stepped, curved, undulating. Irregular, planar);
Micro surface (rough, smooth, slicken-sided)Infilling Clays (low friction); crushed rock (medium to high friction);
Calcite/Gypsum (may dissolve)
Faults and Extent Thicknessshear zones Character Coating, infill, crushed rock, clay infilling
◦ Continuity may be relative to the type of structure, loading or cutting.◦ Discontinuities considered continuous under structures if it is equal to the
base width, when sliding can be possible.
3.14 Rock defect symbols
• Typical symbols only. Each consultant or authority has their own variation.
Table 3.14 Defect description.
Defect type Surface roughness Coating or infill
Macro-surface geometry Micro-surface geometry
Bp – Bedding parting St – Stepped Ro – Rough cn – cleanFp – Foliation parting Cu – Curved Sm – Smooth sn – stainedJo – Joint Un – Undulating Sl – Slickensided vn – veneerSh – Sheared zone Ir – Irregular cg – coatingCs – Crushed seam Pl – PlanarDs – Decomposed seamIs – Infilled seam

Dow
nloa
ded
By:
10.
3.98
.104
At:
22:4
3 12
Feb
202
2; F
or: 9
7813
1581
3233
, cha
pter
3, 1
0.12
01/b
1652
0-4
Rock classification 41
◦ The application of this data is considered in later chapters.◦ For example, friction angle of an infill fracture < for a smooth fracture <
rough fracture. But the orientation and continuity of the defects woulddetermine whether it is a valid release mechanism.
◦ The opening size and number of the joints would determine its permeability.
3.15 Sedimentary and pyroclastic rock types
• The grain size and shape as used to describe soils can be also used for rocks.• Sedimentary rocks are the most common rock type at the earth’s surface and
sea floor. They are formed from soil sediments or organic remains of plantsand animals which have been lithified under significant heat and pressure of theoverburden, or by chemical reactions.
• This rock type tends to be bedded.• Pyroclastic Rocks are a type of igneous rock. Pyroclasts have been formed by an
explosive volcanic origin, falling back to the earth, and becoming indurated. Theparticle sizes thrown into the air can vary from 1000 tonne block sizes to a veryfine ash (Tuff).
Table 3.15 Rock type descriptor (adapted from AS 1726 – 1993, Mayne, 2001 and Geoguide 3, 1988).

Dow
nloa
ded
By:
10.
3.98
.104
At:
22:4
3 12
Feb
202
2; F
or: 9
7813
1581
3233
, cha
pter
3, 1
0.12
01/b
1652
0-4
42 Handbook of Geotechnical Investigation and Design Tables
◦ Even for rocks in a similar descriptor other factors may determine its overallstrength properties.
◦ For example, Sandstone, Arkose and Greywacke are similarly classed, butsandstone would usually have rounded grains, which are one size, Arkosewould be Sub-angular and well graded while Greywacke would be angularand well graded. This results in an intact Greywacke being stronger thansandstone.
3.16 Metamorphic and igneous rock types
• The grain sizes are more appropriate (measurable) for the assessment of the sed-imentary rocks. However the size is shown in the table below for comparisonpurposes.
• Igneous rocks are formed when hot molten rock solidifies. Igneous rocks areclassified mainly on its mineral content and texture.
• Metamorphic rocks are formed from other rock types, when they undergo pressureand/or temperature changes. Metamorphic rocks are classed as foliated and non-foliated.
Table 3.16 Rock type descriptor (adapted from AS 1726 – 1993, Mayne, 2001 and Geoguide 3, 1988).

Dow
nloa
ded
By:
10.
3.98
.104
At:
22:4
3 12
Feb
202
2; F
or: 9
7813
1581
3233
, cha
pter
3, 1
0.12
01/b
1652
0-4
Rock classification 43
Figure 3.3 Engineering concerns of various rock types for durability slope stability and excavatabil-ity. Aggregate and stones are seldom selected on basis of rock type alone. Preliminaryconsideration only.