Embed Size (px)
Citation preview
Roads and Works Conference
Rod Ellis
August 2012
Materials for Unsealed Roads – Developments in testing, additive/blending protocols and its
place in Asset management
Introduction
• Local Government Research and Development Scheme 2009 -2012
• Trialing new techniques for improving the composition of material used for unsealed roads
Outcomes
• Results of the 3 trial sites monitored over 3 years
• Protocol in the assessment process and decision making for material selection
• Monitoring forms and process
• Whole of life considerations
Purpose
• To better understand what makes a good material for unsealed roads (before it is used)
• To acknowledge the large volumes of material used in unsealed road construction and to attempt to become smarter by introducing some science to compliment practical experience
• Acknowledge some Councils Works Managers will not have years of local experience so setting up a framework and knowledge base to assist good decisions in material selection and treatment is critical for future success
Trial Process
• Pit Material testing against ARRB specifications• Assess options to improved material properties
– Blending– Additives– Adapting works practices
• Examine Whole of Life benefits of various treatments
• Setup and monitor trial sites
• Recording findings and reporting
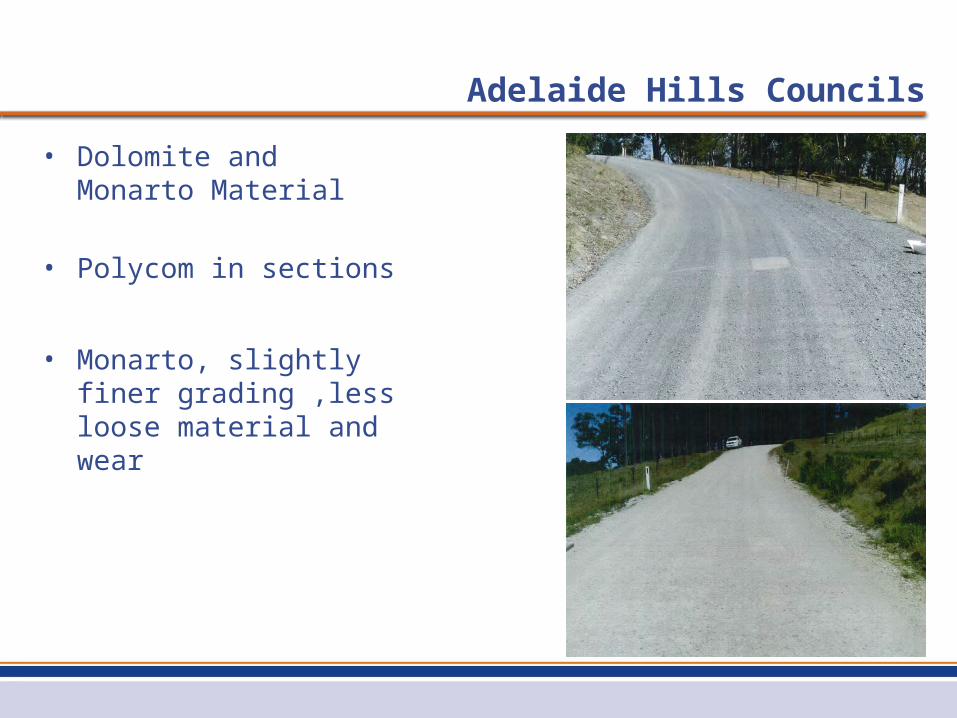
Adelaide Hills Councils
• Dolomite and Monarto Material
• Polycom in sections
• Monarto, slightly finer grading ,less loose material and wear
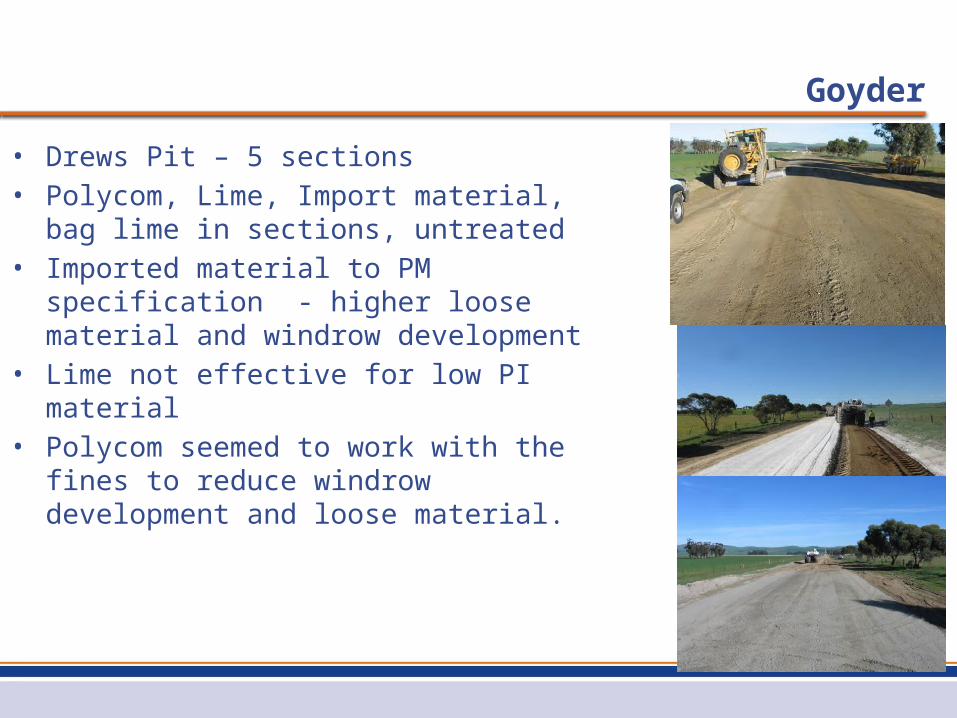
Goyder
• Drews Pit – 5 sections• Polycom, Lime, Import material, bag lime in
sections, untreated• Imported material to PM specification -
higher loose material and windrow development
• Lime not effective for low PI material• Polycom seemed to work with the fines to
reduce windrow development and loose material.
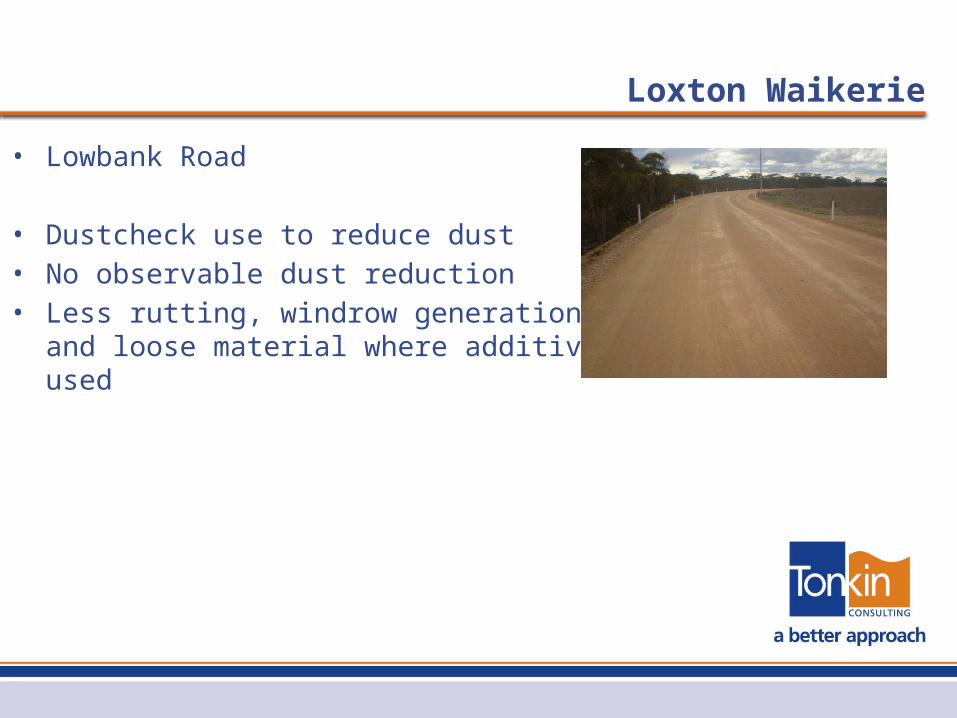
Loxton Waikerie
• Lowbank Road
• Dustcheck use to reduce dust• No observable dust reduction• Less rutting, windrow generation and loose
material where additive used
Pit Material
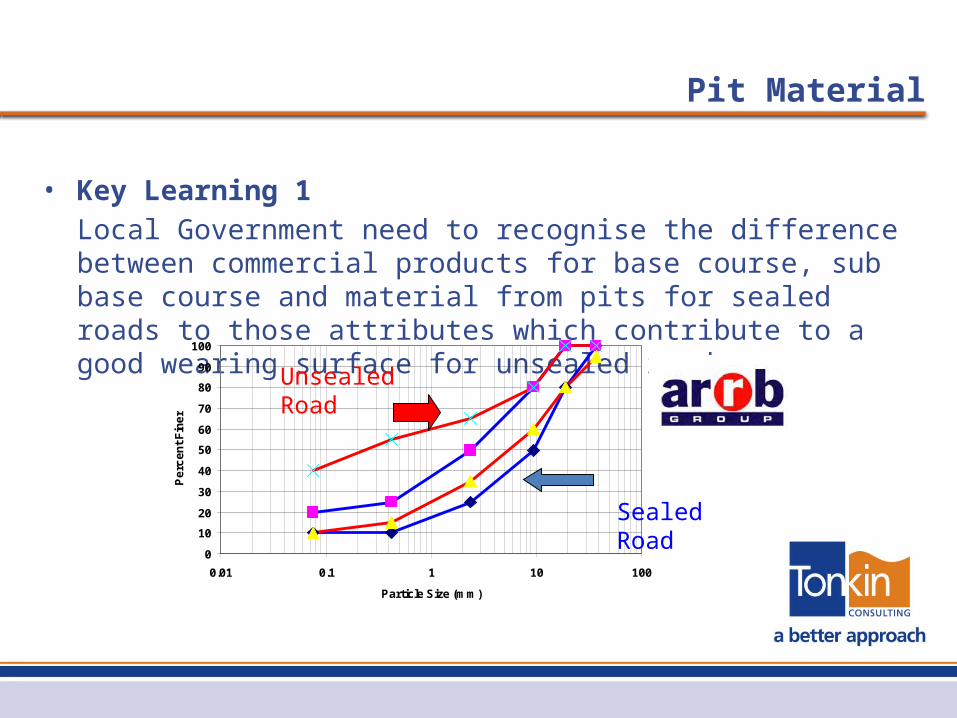
• Key Learning 1
Local Government need to recognise the difference between commercial products for base course, sub base course and material from pits for sealed roads to those attributes which contribute to a good wearing surface for unsealed roads.
0
10
20
30
40
50
60
70
80
90
100
0.01 0.1 1 10 100
Particle Size (mm)
Pe
rce
nt
Fin
er
Sealed Road
Unsealed Road
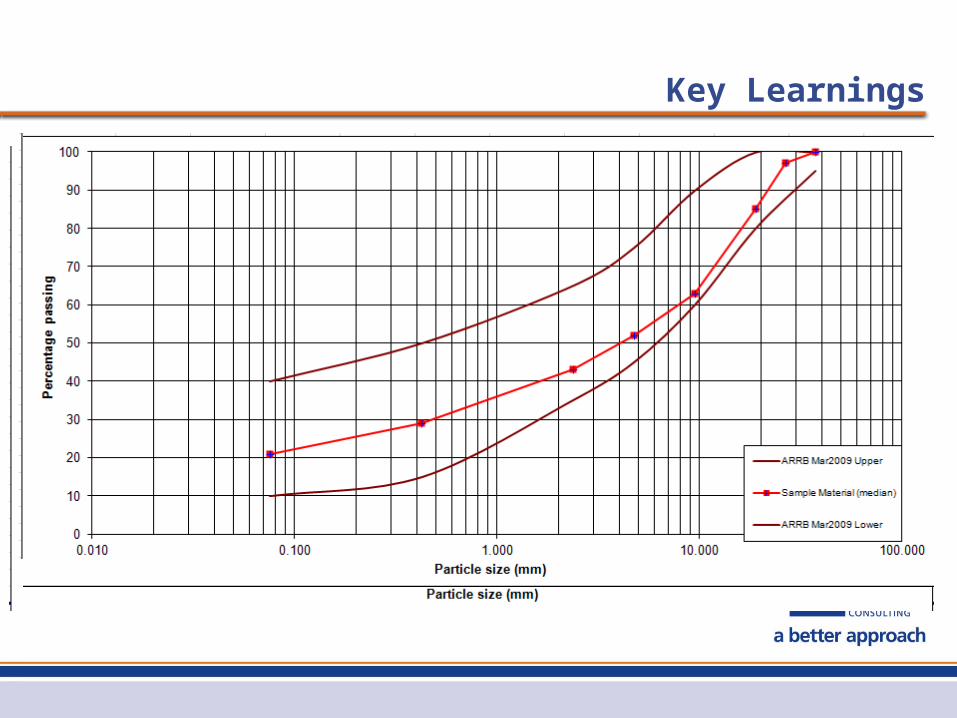
Key Learnings
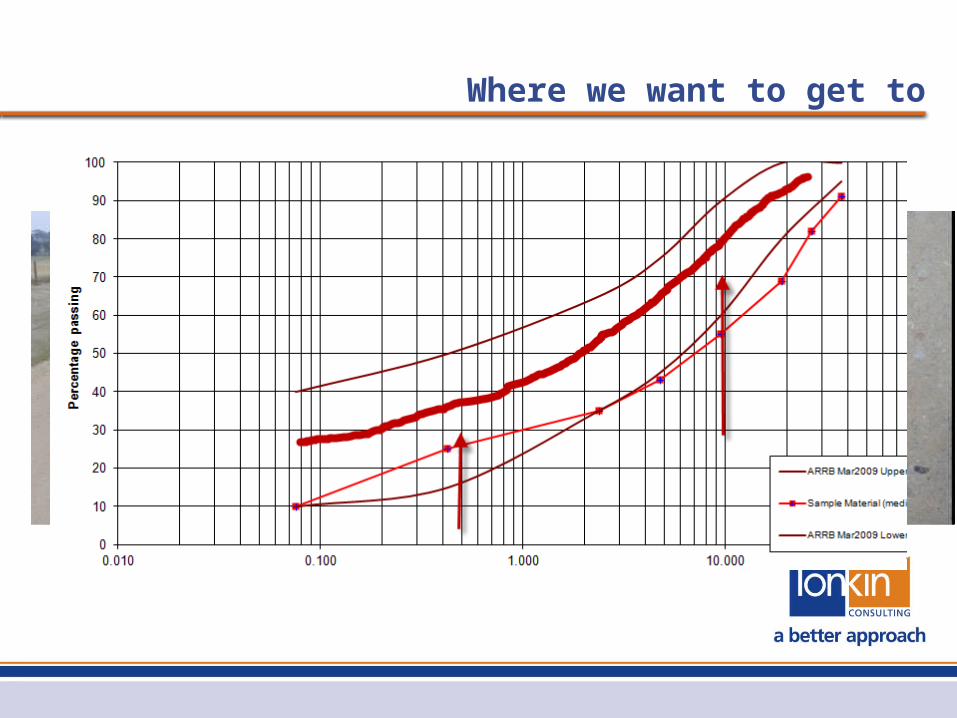
Where we want to get to
Key Learning
• Key Learning 2
• Improve raw material before using additives• Clear specification for grading and plasticity• Pit operators need to blend stone, gravel and fines in
proportion to develop acceptable material
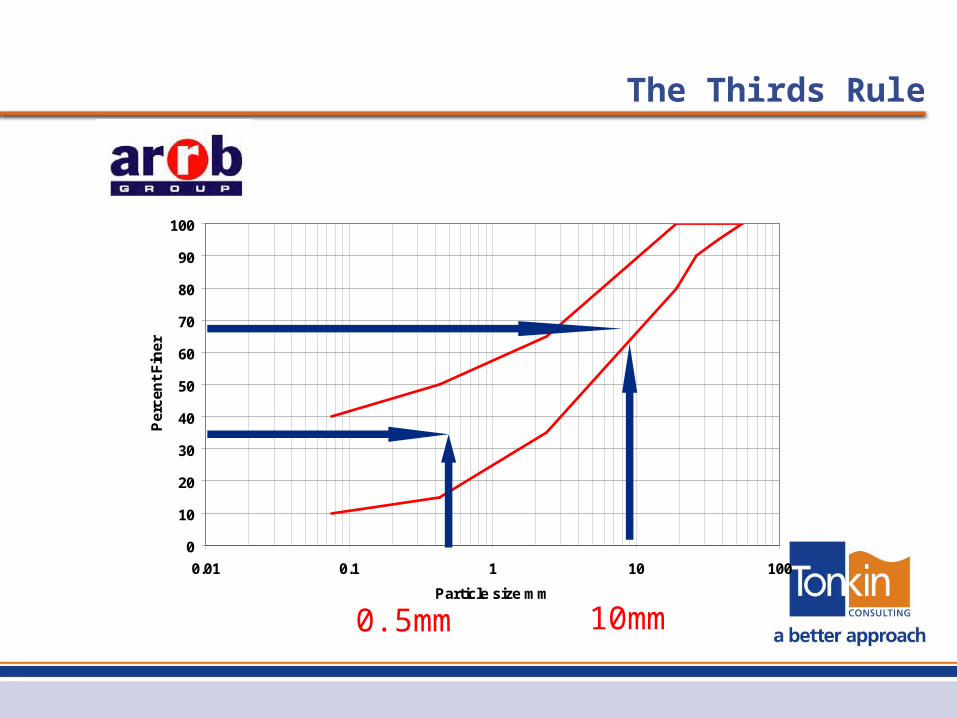
The Thirds Rule
0
10
20
30
40
50
60
70
80
90
100
0.01 0.1 1 10 100
Particle size mm
Per
cen
t F
iner
0.5mm 10mm
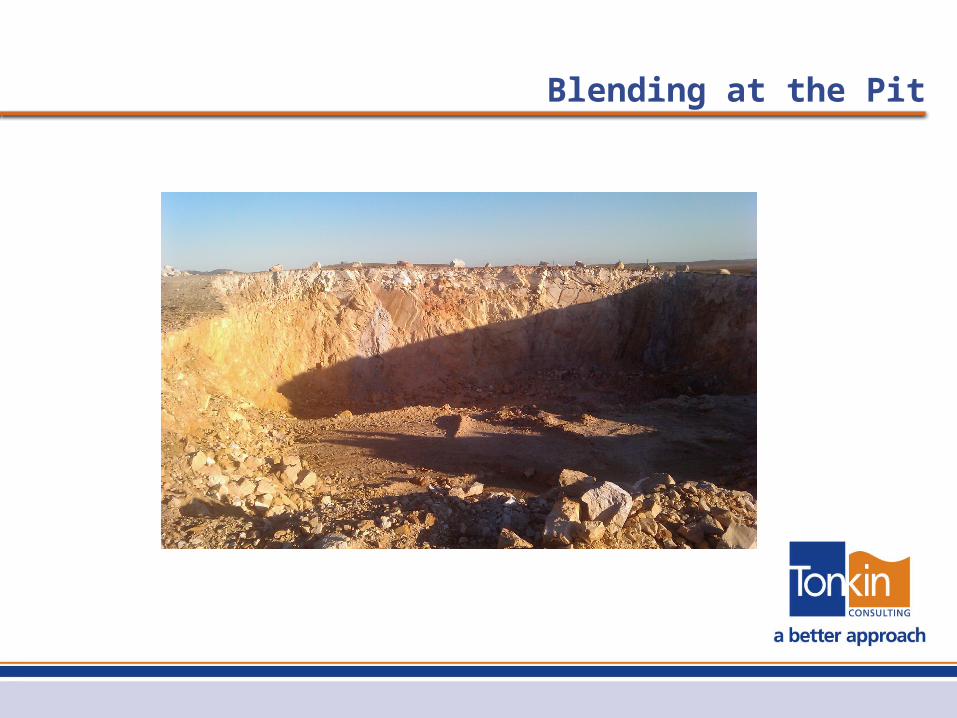
Blending at the Pit
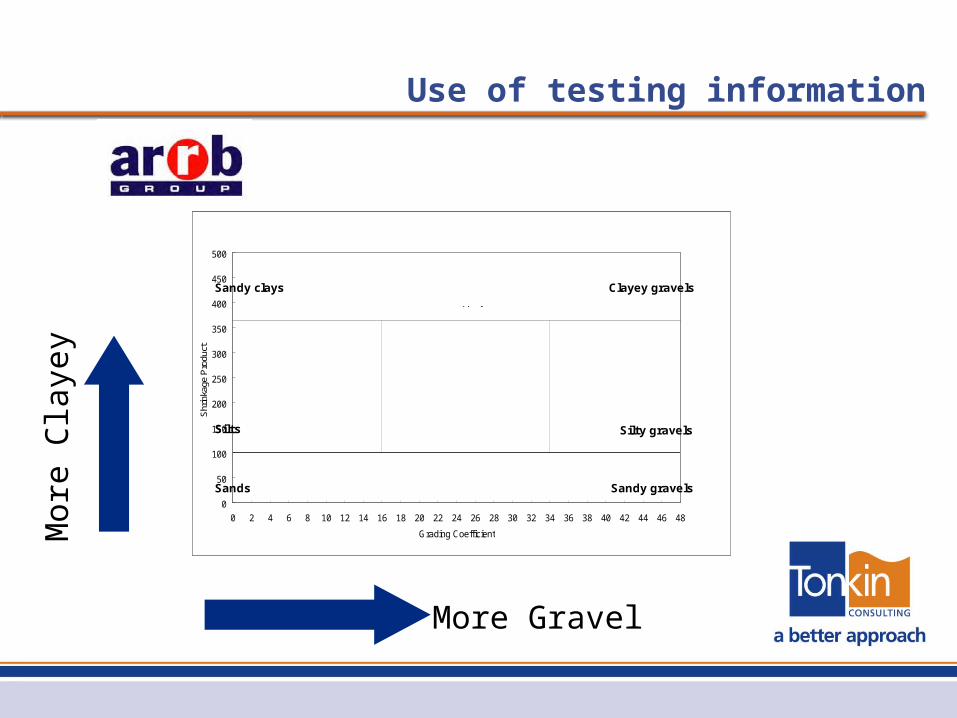
Use of testing information
1050
10230
5010
5038
0
50
100
150
200
250
300
350
400
450
500
0 2 4 6 8 10 12 14 16 18 20 22 24 26 28 30 32 34 36 38 40 42 44 46 48
Grading Coefficient
Shr
inka
ge P
rodu
ct
D Slippery
AErodible
CRavels
EGood
BCorrugates and ravels
Sandy clays
Silts
Clayey gravels
Silty gravels
Sandy gravelsSands
1050
10230
5010
5038
0
50
100
150
200
250
300
350
400
450
500
0 2 4 6 8 10 12 14 16 18 20 22 24 26 28 30 32 34 36 38 40 42 44 46 48
Grading Coefficient
Shr
inka
ge P
rodu
ct
D Slippery
AErodible
CRavels
EGood
BCorrugates and ravels
Sandy clays
Silts
Clayey gravels
Silty gravels
Sandy gravelsSands
Mor
e C
laye
y
More Gravel
Key Learning
Key Learning 3
• Properties in the pit will be different on the road.• Select the right equipment to suit the material• Test post compaction from the road to determine
compliance to grading and Plasticity
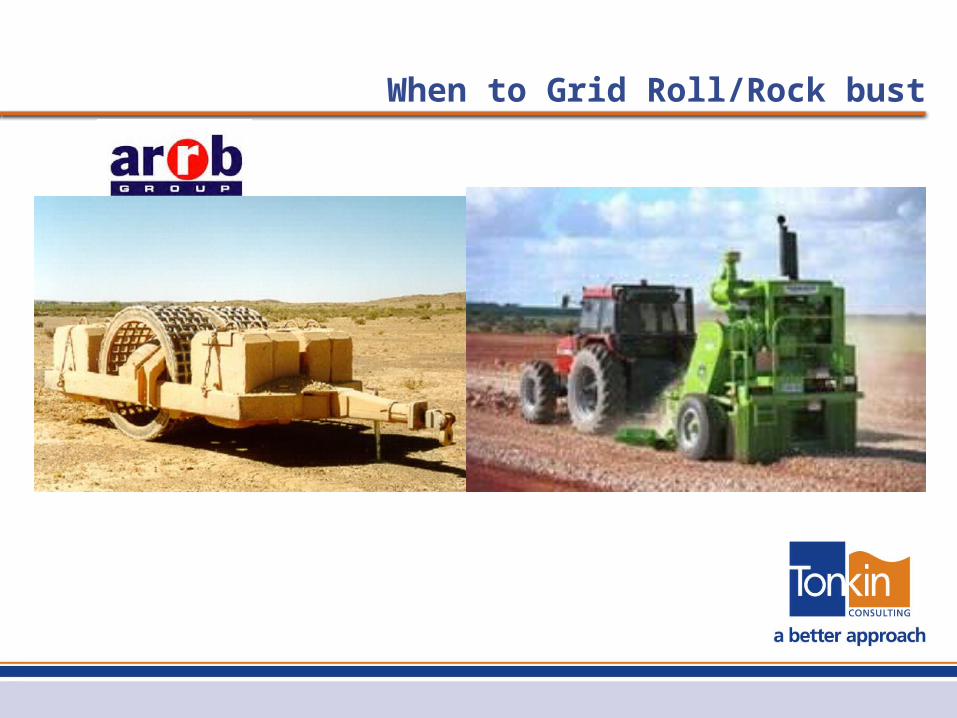
When to Grid Roll/Rock bust
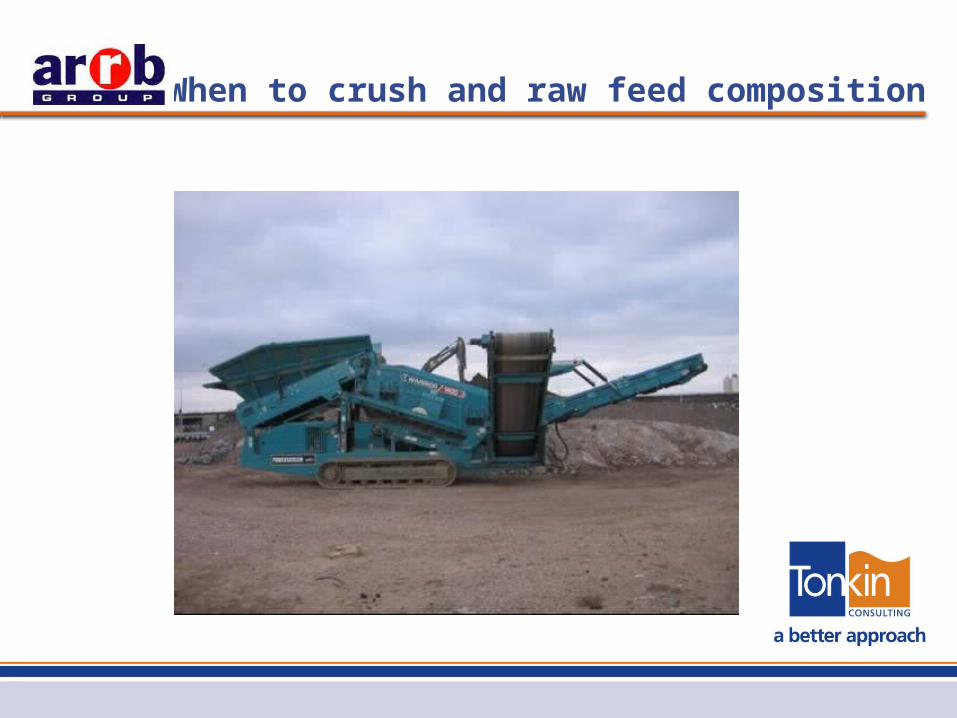
When to crush and raw feed composition
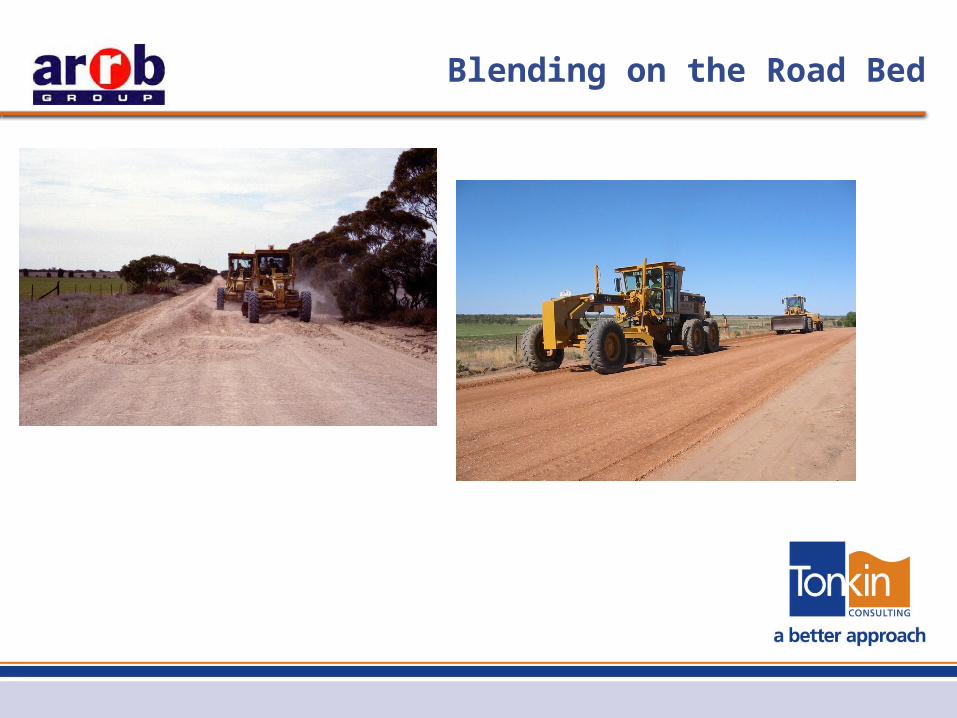
Blending on the Road Bed
Additives
» Key Learning 4» For Drews Pit material at Goyder in hindsight the
use of lime was inappropriate, however lime/fly ash may be an alternative in future trials.
» Key Learning 5» Polycom needs fines in the material to work.
Further monitoring is recommended for each Council to determine if there is longer term benefits. After 2 years of monitoring there are positive indicators.
Monitoring
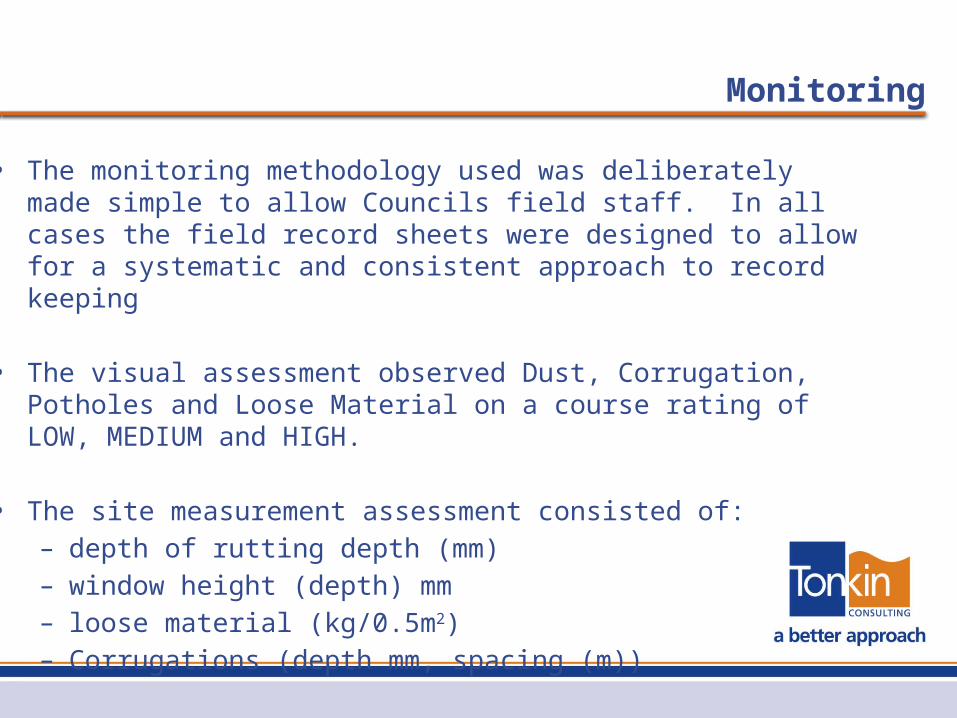
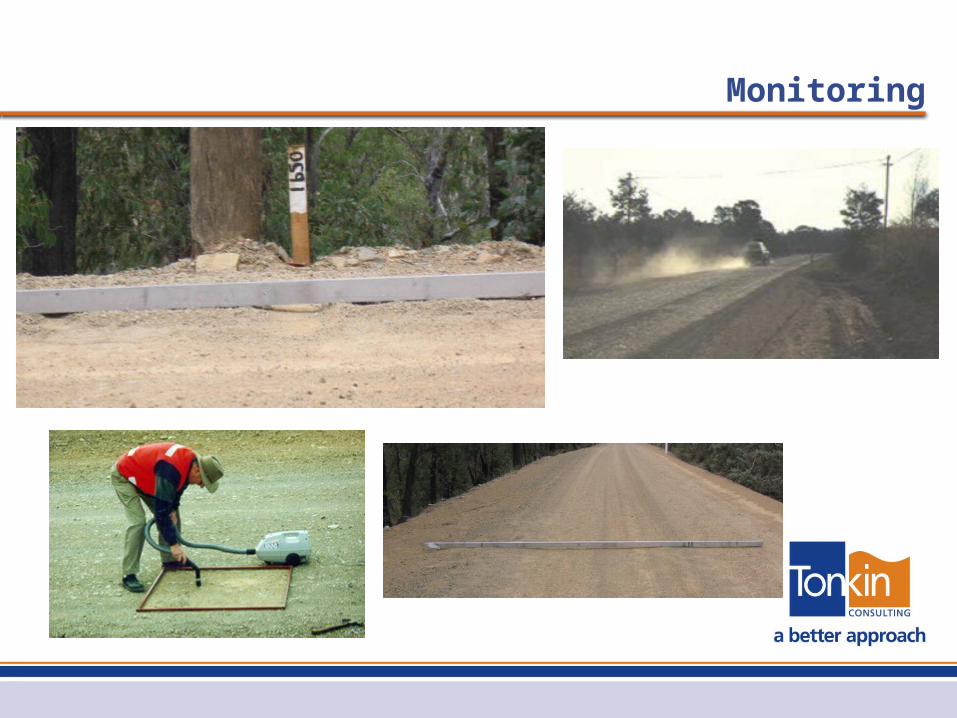
• The monitoring methodology used was deliberately made simple to allow Councils field staff. In all cases the field record sheets were designed to allow for a systematic and consistent approach to record keeping
• The visual assessment observed Dust, Corrugation, Potholes and Loose Material on a course rating of LOW, MEDIUM and HIGH.
• The site measurement assessment consisted of:– depth of rutting depth (mm)– window height (depth) mm– loose material (kg/0.5m2)– Corrugations (depth mm, spacing (m))
Monitoring
Monitoring
Key Learning 6
Dust assessment discernment is very difficult visually. The extent of humidity at time of assessment i.e. overcast, clear or recent rain needs to be recorded.
Key Learning 7
While visual assessment of loose material may not be discernible, the measurement of windrow height and loose material are more indicative.
Key Learning 8
Trial sites should be left without maintenance grading interventions if possible to develop a longer term trend of deterioration. Several Councils undertook grading operation during the trial period.
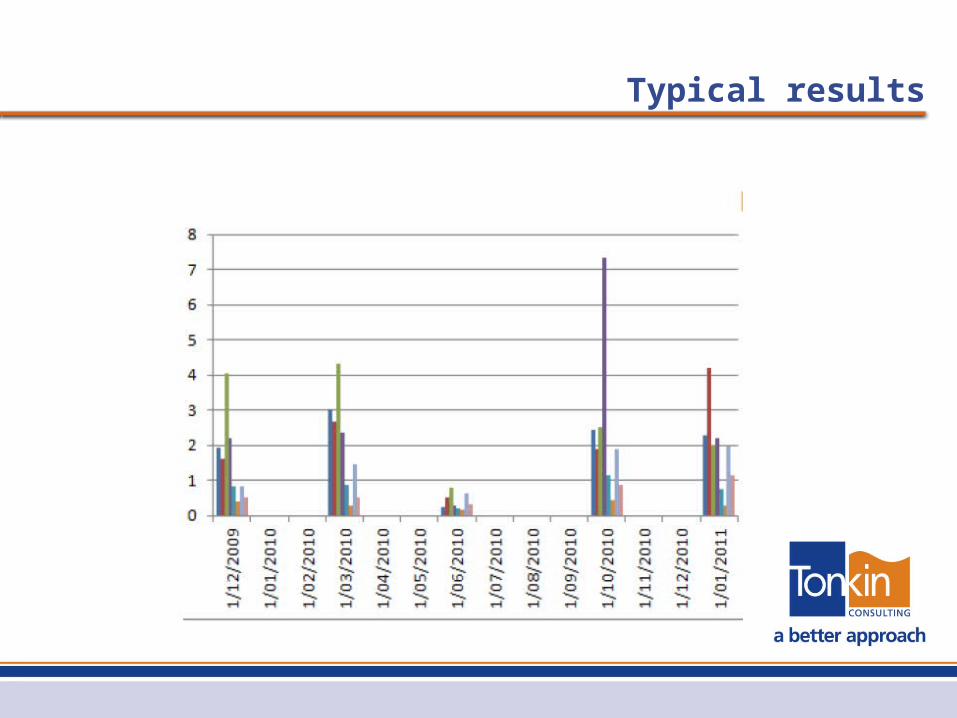
Typical results
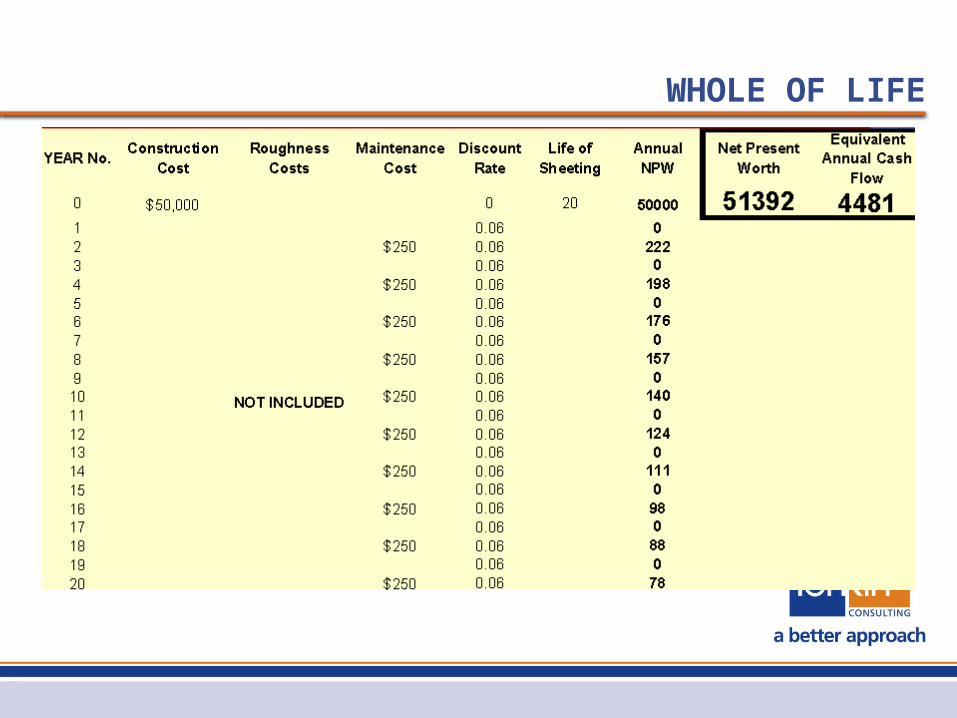
WHOLE OF LIFE
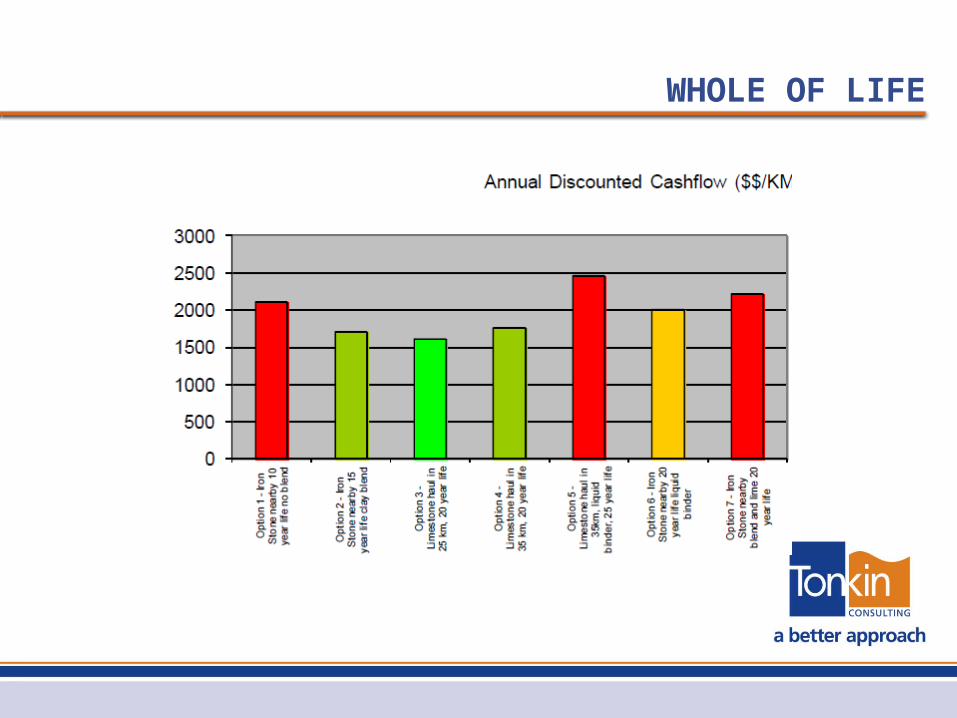
WHOLE OF LIFE
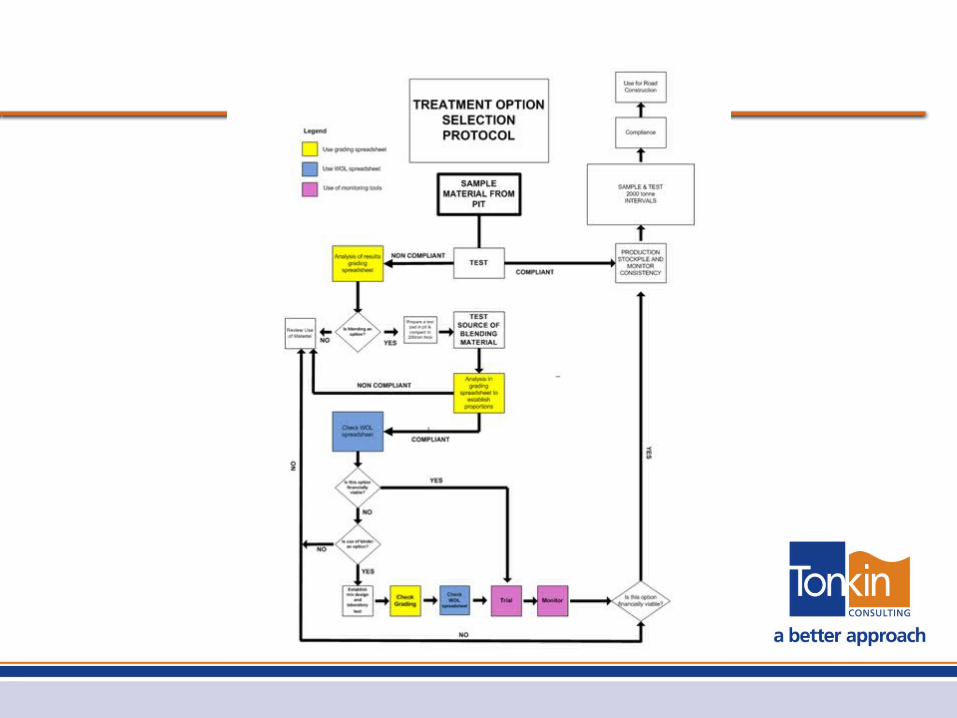
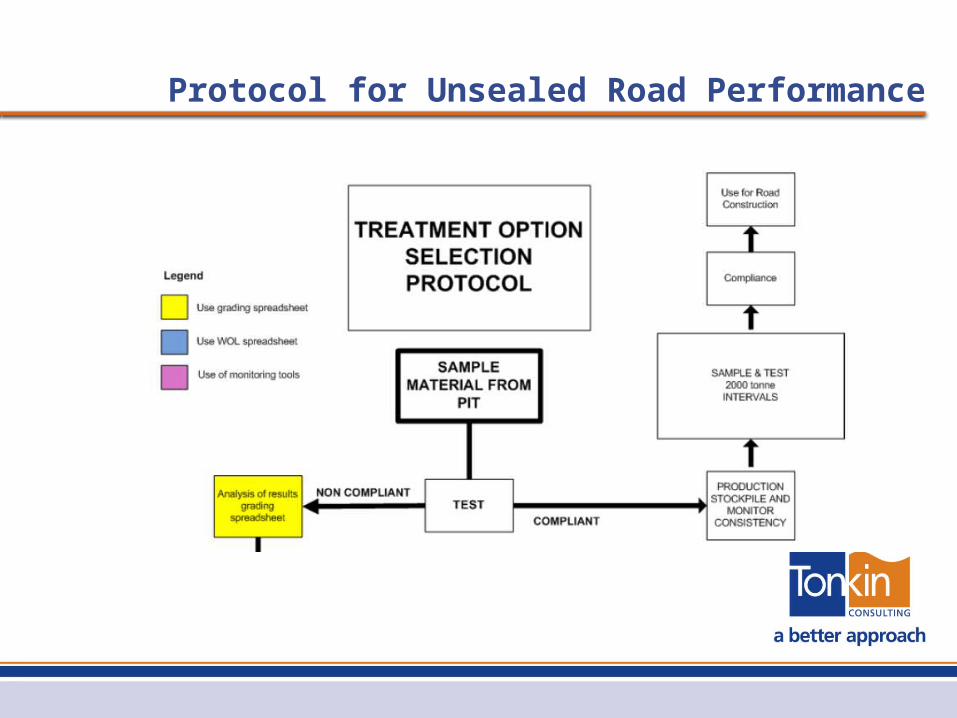
Protocol for Unsealed Road Performance
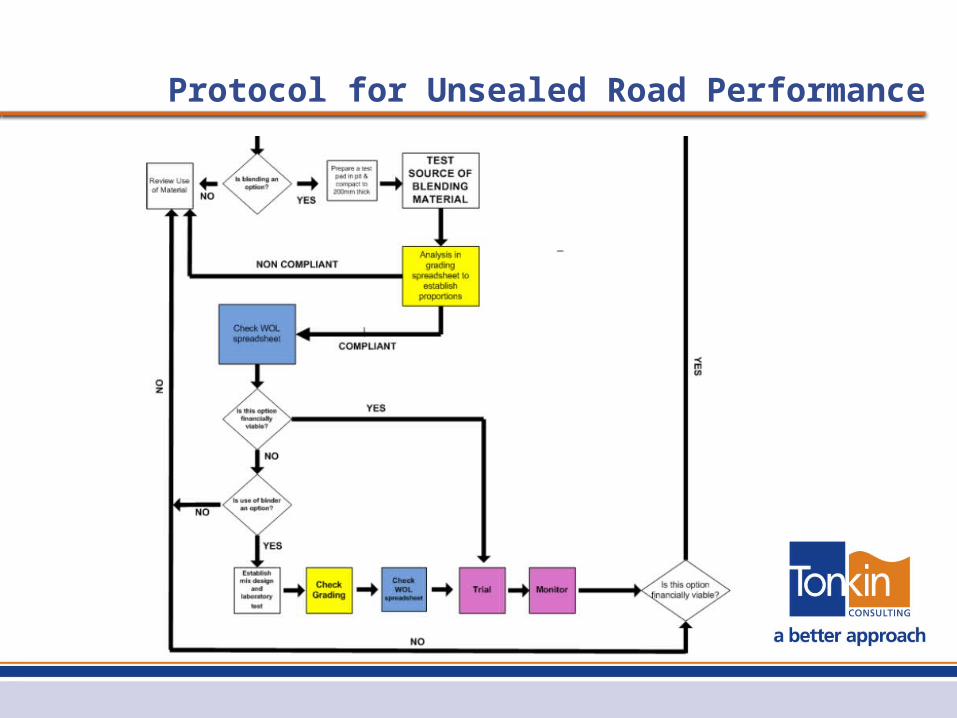
Protocol for Unsealed Road Performance

Application to the wider local government
Promotion
Roads Conference and SALGSOA groups
Get other Councils involved
Kingston and Kangaroo Island are planning trials
Support
Tonkin/ARRB through Rod Ellis and Bob Andrews
Tools– Grading Assessment Tools– Material performance Charts– WOL Spreadsheets– Field Trial monitoring forms– Reporting Framework
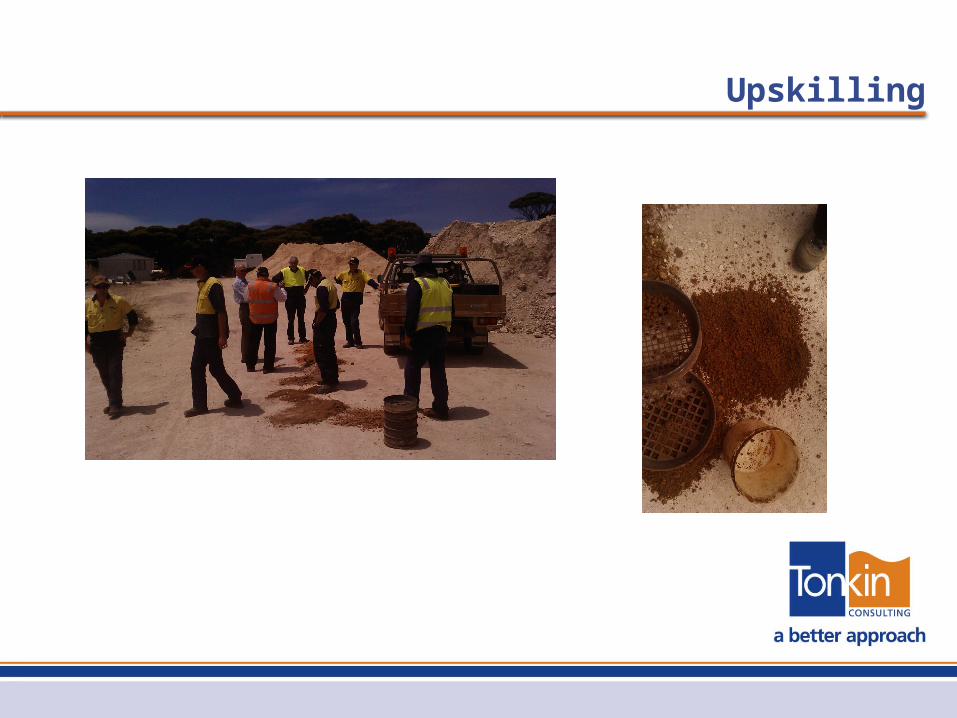
Upskilling
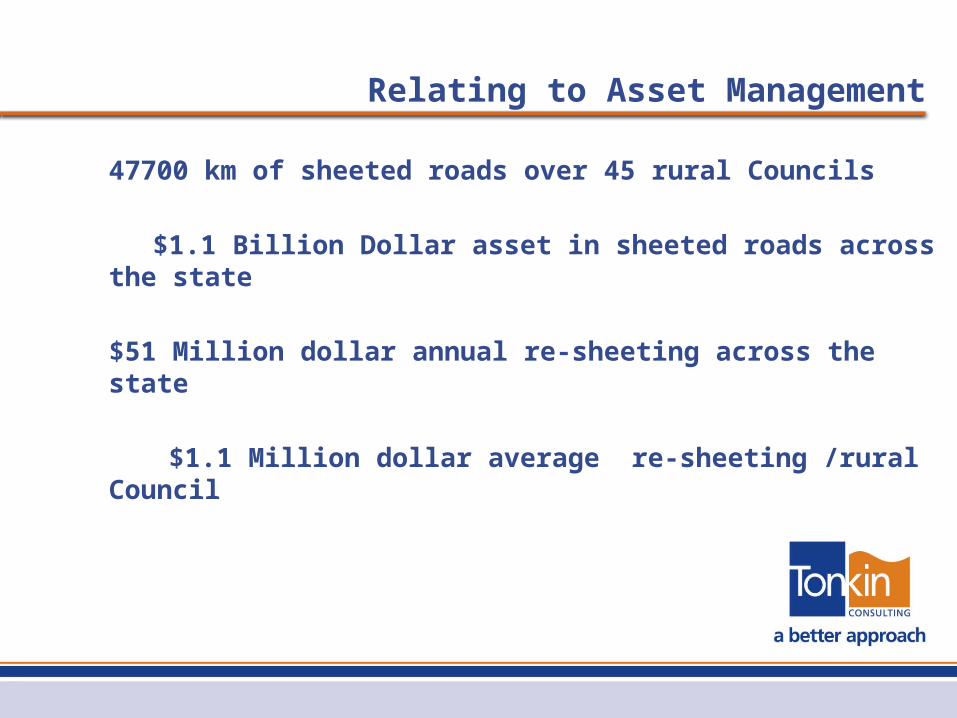
Relating to Asset Management
47700 km of sheeted roads over 45 rural Councils
$1.1 Billion Dollar asset in sheeted roads across the state
$51 Million dollar annual re-sheeting across the state
$1.1 Million dollar average re-sheeting /rural Council
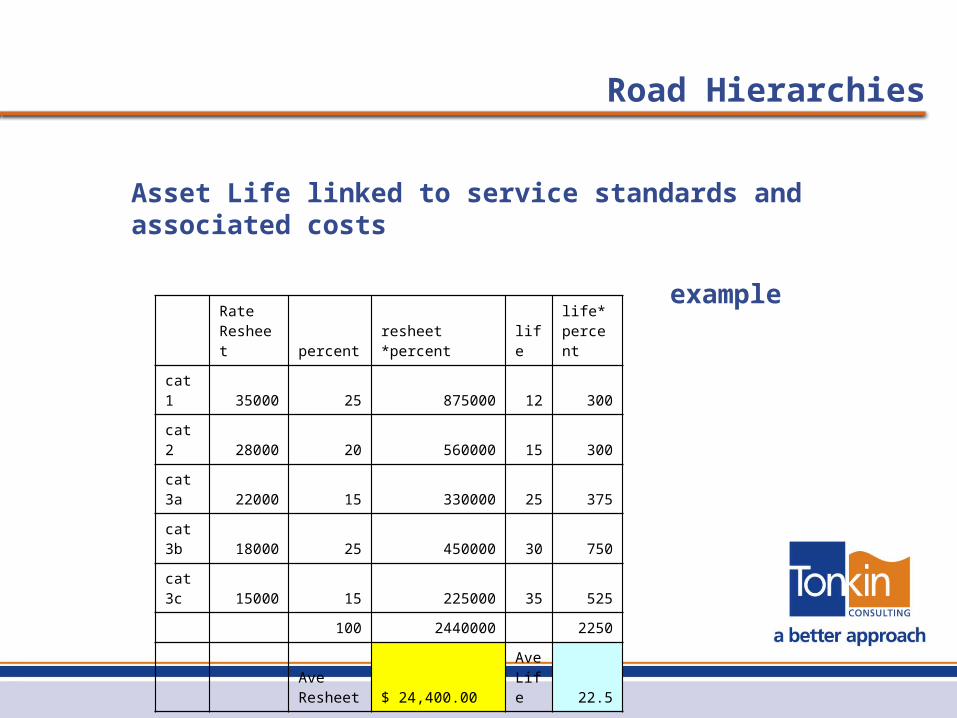
Road Hierarchies
Rate Resheet percent resheet *percent life
life*percent
cat1 35000 25 875000 12 300
cat2 28000 20 560000 15 300
cat3a 22000 15 330000 25 375
cat3b 18000 25 450000 30 750
cat3c 15000 15 225000 35 525
100 2440000 2250
Ave Resheet $ 24,400.00
Ave Life 22.5
Asset Life linked to service standards and associated costs
example
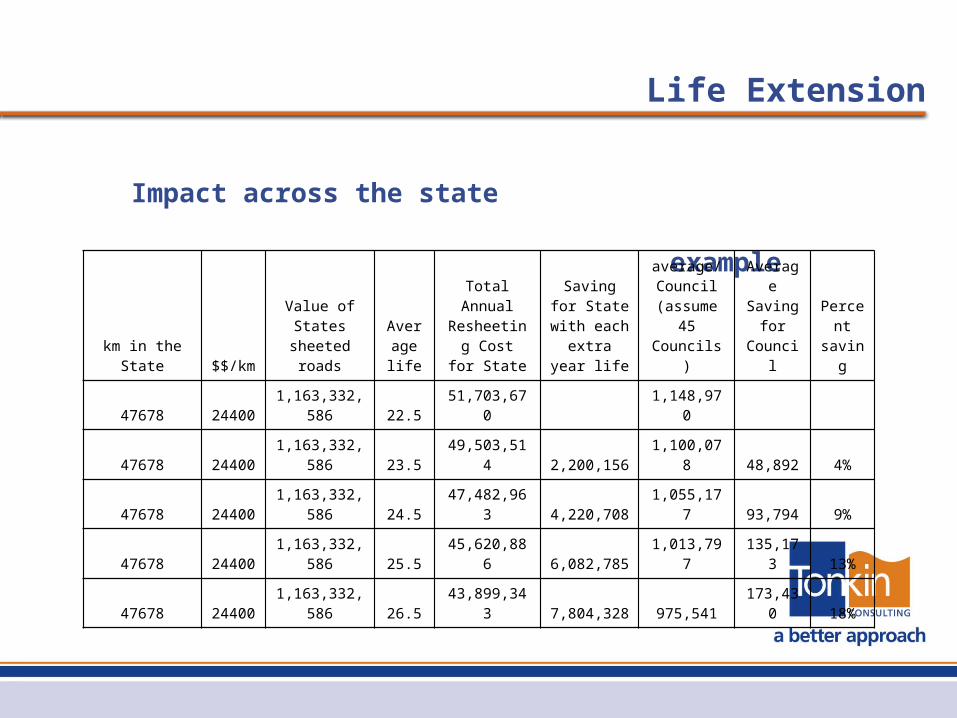
Life Extension
Impact across the state
example
km in the State $$/kmValue of States sheeted roads
Average life
Total Annual Resheeting
Cost for State
Saving for State with each extra
year life
average/Council
(assume 45 Councils)
Average Saving
for Council
Percent
saving
47678 24400 1,163,332,586 22.5 51,703,670 1,148,970
47678 24400 1,163,332,586 23.5 49,503,514 2,200,156 1,100,078 48,892 4%
47678 24400 1,163,332,586 24.5 47,482,963 4,220,708 1,055,177 93,794 9%
47678 24400 1,163,332,586 25.5 45,620,886 6,082,785 1,013,797 135,173 13%
47678 24400 1,163,332,586 26.5 43,899,343 7,804,328 975,541 173,430 18%
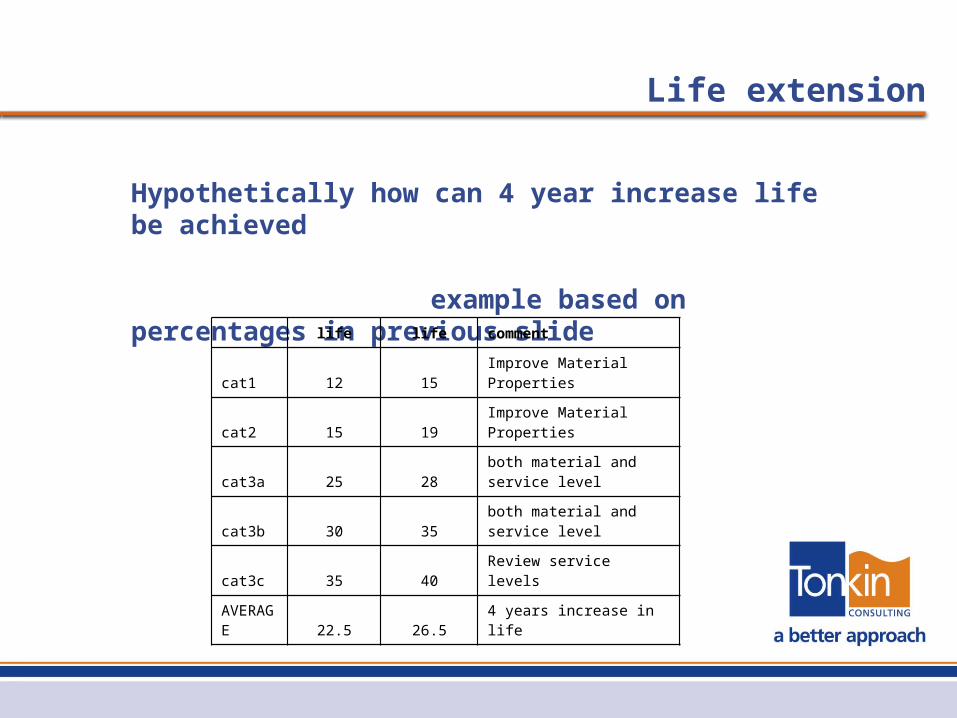
Life extension
Hypothetically how can 4 year increase life be achieved
example based on percentages in previous slide
life life comment
cat1 12 15 Improve Material Properties
cat2 15 19 Improve Material Properties
cat3a 25 28both material and service level
cat3b 30 35both material and service level
cat3c 35 40 Review service levels
AVERAGE 22.5 26.5 4 years increase in life
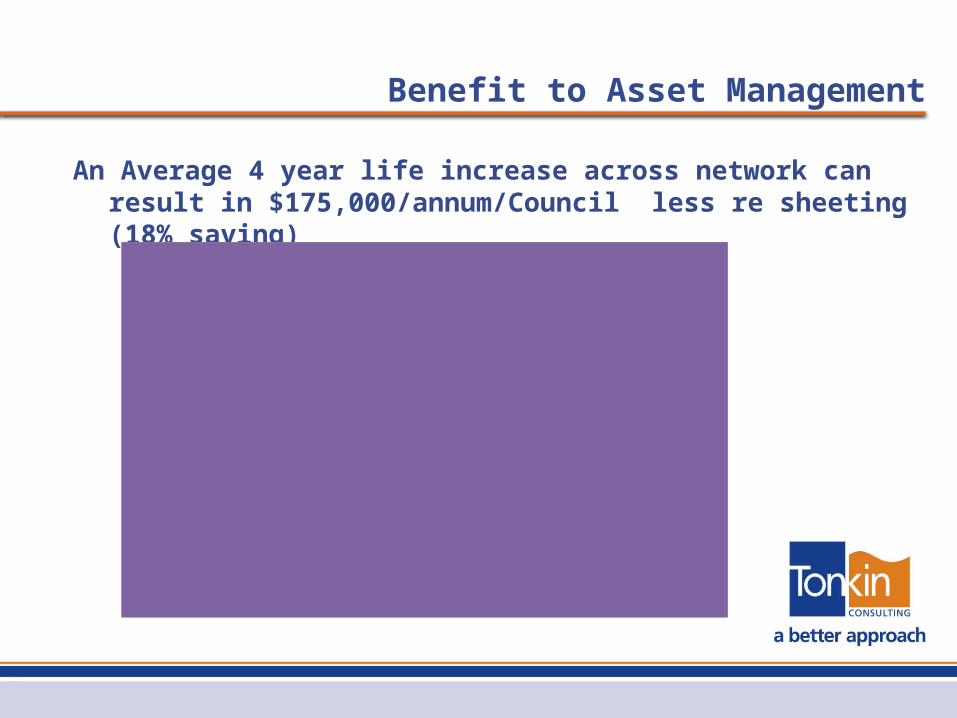
Benefit to Asset Management
An Average 4 year life increase across network can result in $175,000/annum/Council less re sheeting (18% saving)
Average for 45 Councils/annum
$-
$200,000.00
$400,000.00
$600,000.00
$800,000.00
$1,000,000.00
$1,200,000.00
$1,400,000.00
22.5 23.5 24.5 25.5 26.5
Ave Life
Ann
ual r
eshe
eting
cos
t
av/Council
Saving
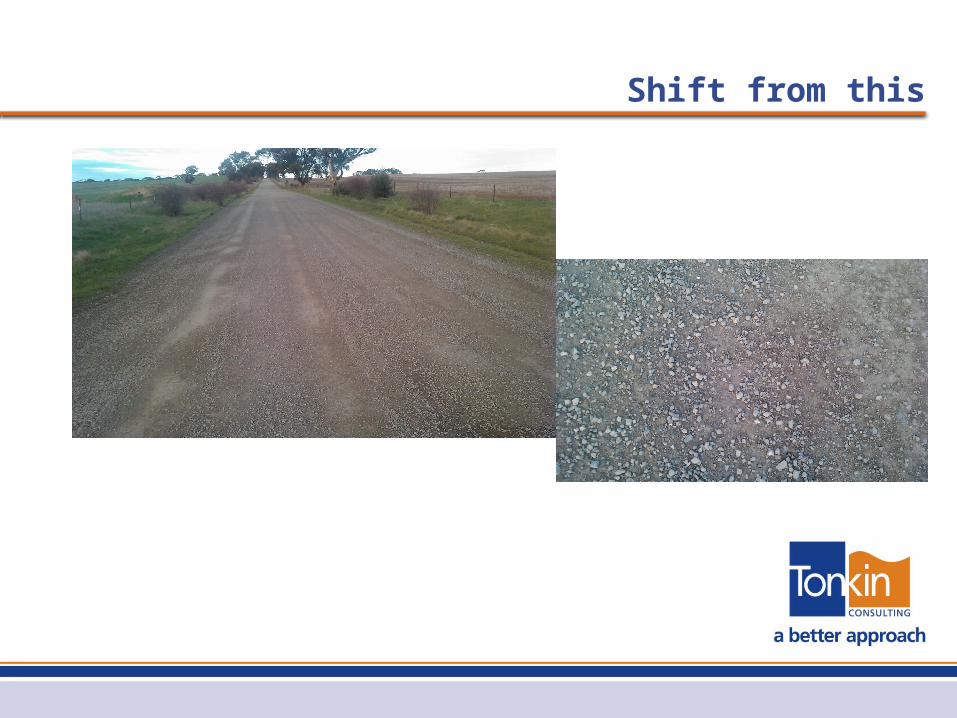
Shift from this
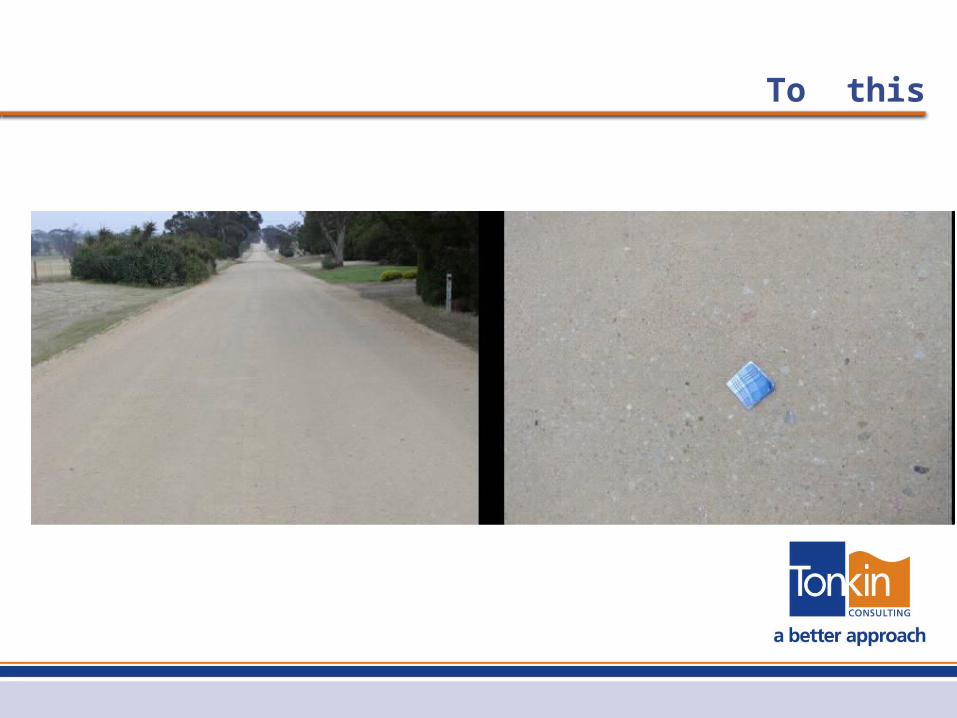
To this