Embed Size (px)
Citation preview

Road Distance (in Kms)
Shillong to:-
Jowai - 66 Khliehriat- 100
Nongstoin 93 Mawsynram- 58
Tura- 323 Mawkynrew- 46
Williamnagar- 312 Mawryngkneng- 37
Nongpoh- 53 Umling- 70
Baghmara- 445 Umsning- 30
(Via Tura)
Sohra- 49 Umroi- 35
(Cherrapunjee)
Shella- 93 Mylliem- 8
(5th Mile Upper Shillong)
Mairang- 44 Mawphlang- 24
Mawkyrwat- 74 Pynursla- 55
Betasing- 370 Dadengiri- 377
Amlarem 93
Jowai to:-
Amlarem- 27 Thadlaskein- 10
Khliehriat- 34 New Garampani- 67
Laskein- 35 Dawki 59

Nongstoin to:-
Mairang- 49 Balat- 149
Mawkyrwat- 127 Ranikor- 168
(Via Balat)
Sonapahar- 45
Tura to:-
Baghmara- 122 Resubelpara- 88
Dadengiri- 54 Zikzak- 51
Betasing- 47 Dalu- 50
Rongram- 15 Chokpot- 53
Selsella- 47 Ampati- 59
Rongara- 145
Williamnagar to:-
Resubelpara- 74 Songsak- 30
Rongjeng- 35 Samanda- 19
Shillong to other North Eastern States Capitals
Itanagar- 406 Dispur- 103
(Guwahati)
Imphal- 576 Aizwal- 415
Kohima- 434 Agartala- 662

TOURIST SPOT
Water Falls:-
Sweetfalls Rangbang Falls
Beadon Falls Bishop Falls
Spread Eagles Falls Nongsngithiang
Dainthlen Nohkalikai
Kynrem
Caves:-
Mawsynram Cave Mawsmai Cave
Syndai Cave
Others:
Ward’s Lake & Lady Hydari Park
Botanical Garden Thangkharang Park
Shillong Peak Jakrem Hot Spring
Cathedral Church Umiam Water Sport
Kyllang Rock Orchid Lake Resort
Nehru Park Syntu Ksiar
Kiang Nongbah Chibragre Tourist Sport
Monument
Tura Peak Balpakram National Park.

AREA AND POPULATION
TABLE: 1.01 DISTRICT WISE NUMBER OF VILLAGES, TOWNS, POLICE STATIONS, OUTPOSTS &
COMMUNITY DEV. BLOCKS
District Area
(Sq. Km) 2001
Population(2001)
Sub Division
(ExcludingDistrict
Hq)
Villages (including
uninha- bited
villages)
Towns
PoliceStations2003-2004
Police Outposts
Community Develop-
ment Blocks
1. 2. 3. 4. 5. 6. 7. 8. 9. Jaintia Hills 3819 299108 2 499 1 3 4 5
East Khasi Hills 2748 660923 1 962 8 10 8 8
Ri-Bhoi 2448 192790 - 570 1 3 7 3
West Khasi Hills 5247 296049 2 943 2 3 5 6
East Garo Hills 2603 250582 1 888 2 5 3 5
Contd… 1
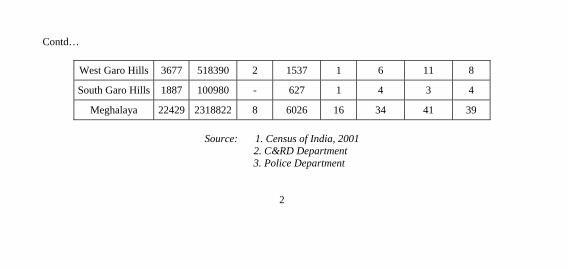
Contd…
West Garo Hills 3677 518390 2 1537 1 6 11 8
South Garo Hills 1887 100980 - 627 1 4 3 4
Meghalaya 22429 2318822 8 6026 16 34 41 39
Source: 1. Census of India, 2001 2. C&RD Department 3. Police Department
2
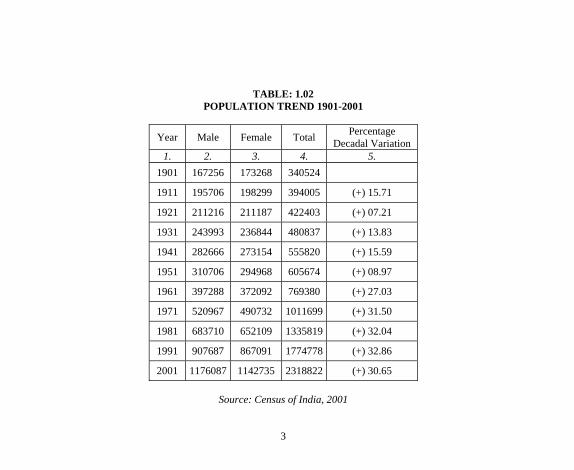
TABLE: 1.02
POPULATION TREND 1901-2001
Year Male Female Total Percentage Decadal Variation
1. 2. 3. 4. 5. 1901 167256 173268 340524
1911 195706 198299 394005 (+) 15.71
1921 211216 211187 422403 (+) 07.21
1931 243993 236844 480837 (+) 13.83
1941 282666 273154 555820 (+) 15.59
1951 310706 294968 605674 (+) 08.97
1961 397288 372092 769380 (+) 27.03
1971 520967 490732 1011699 (+) 31.50
1981 683710 652109 1335819 (+) 32.04
1991 907687 867091 1774778 (+) 32.86
2001 1176087 1142735 2318822 (+) 30.65
Source: Census of India, 2001
3
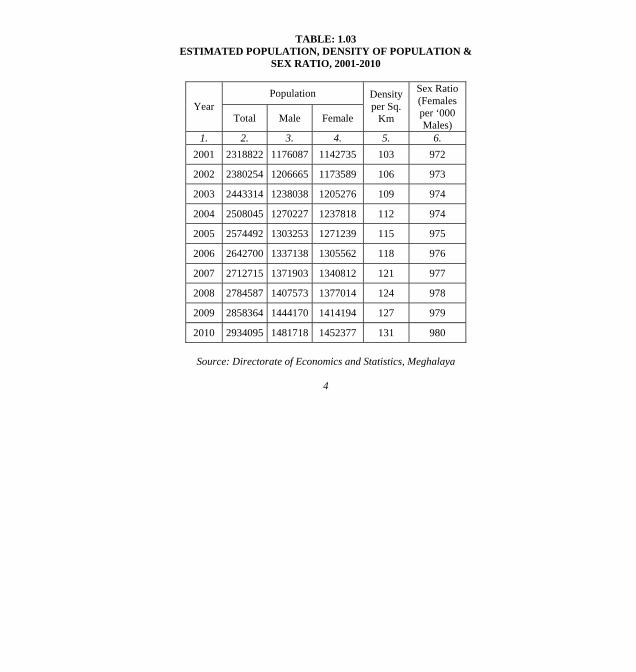
TABLE: 1.03 ESTIMATED POPULATION, DENSITY OF POPULATION &
SEX RATIO, 2001-2010
Population Year
Total Male Female
Density per Sq.
Km
Sex Ratio (Females per ‘000 Males)
1. 2. 3. 4. 5. 6. 2001 2318822 1176087 1142735 103 972
2002 2380254 1206665 1173589 106 973
2003 2443314 1238038 1205276 109 974
2004 2508045 1270227 1237818 112 974
2005 2574492 1303253 1271239 115 975
2006 2642700 1337138 1305562 118 976
2007 2712715 1371903 1340812 121 977
2008 2784587 1407573 1377014 124 978
2009 2858364 1444170 1414194 127 979
2010 2934095 1481718 1452377 131 980
Source: Directorate of Economics and Statistics, Meghalaya
4
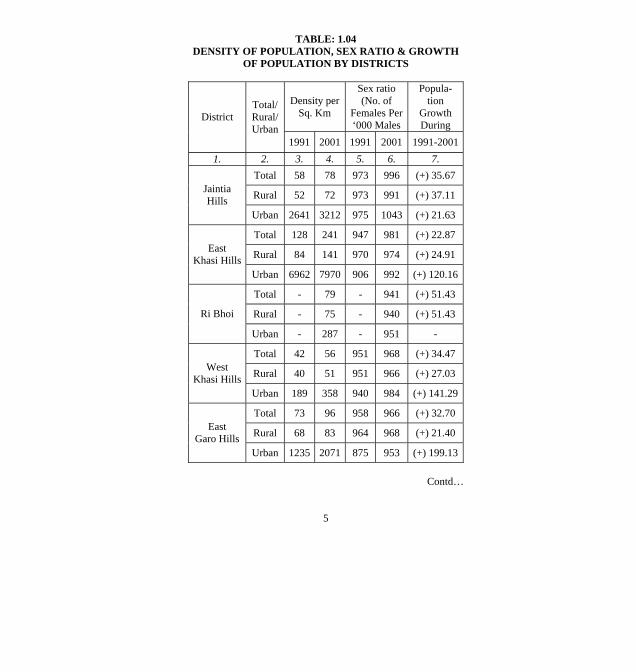
TABLE: 1.04 DENSITY OF POPULATION, SEX RATIO & GROWTH
OF POPULATION BY DISTRICTS
Density per Sq. Km
Sex ratio (No. of
Females Per ‘000 Males
Popula- tion
Growth During
District Total/ Rural/ Urban
1991 2001 1991 2001 1991-20011. 2. 3. 4. 5. 6. 7.
Total 58 78 973 996 (+) 35.67
Rural 52 72 973 991 (+) 37.11 Jaintia Hills
Urban 2641 3212 975 1043 (+) 21.63
Total 128 241 947 981 (+) 22.87
Rural 84 141 970 974 (+) 24.91 East Khasi Hills
Urban 6962 7970 906 992 (+) 120.16
Total - 79 - 941 (+) 51.43
Rural - 75 - 940 (+) 51.43 Ri Bhoi
Urban - 287 - 951 -
Total 42 56 951 968 (+) 34.47
Rural 40 51 951 966 (+) 27.03 West Khasi Hills
Urban 189 358 940 984 (+) 141.29
Total 73 96 958 966 (+) 32.70
Rural 68 83 964 968 (+) 21.40 East Garo Hills
Urban 1235 2071 875 953 (+) 199.13
Contd…
5
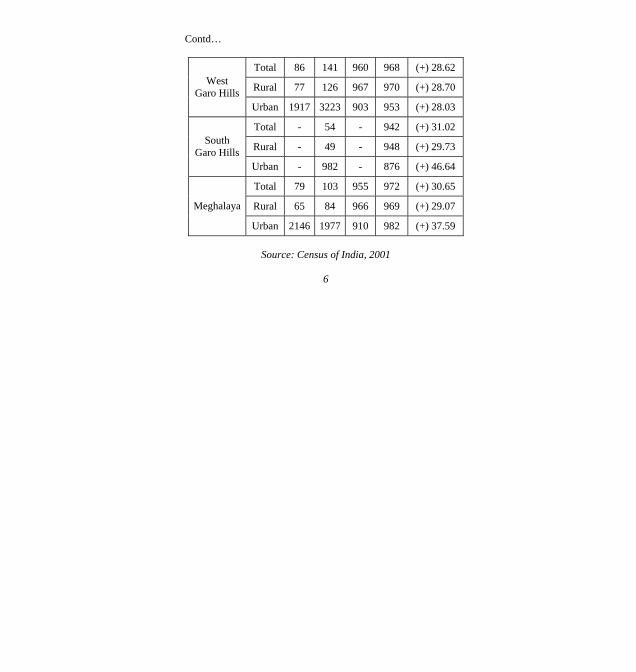
Contd…
Total 86 141 960 968 (+) 28.62
Rural 77 126 967 970 (+) 28.70 West Garo Hills
Urban 1917 3223 903 953 (+) 28.03
Total - 54 - 942 (+) 31.02
Rural - 49 - 948 (+) 29.73 South Garo Hills
Urban - 982 - 876 (+) 46.64
Total 79 103 955 972 (+) 30.65
Rural 65 84 966 969 (+) 29.07 Meghalaya
Urban 2146 1977 910 982 (+) 37.59
Source: Census of India, 2001
6

TABLE: 1.05 POPULATION OF SCHEDULED CASTES/ TRIBES BY
DISTRICT, 2001
District Scheduled Castes
Scheduled Tribes Others Total
1. 2. 3. 4. 5. Jaintia Hills 456 287049 11603 299108
East Khasi Hills 2332 512152 146439 660923
Ri-Bhoi 300 167779 24711 192790
West Khasi Hills 42 290184 5823 296049
East Garo Hills 347 241916 8319 250582
West Garo Hills 7436 397166 113788 518390
South Garo Hills 226 96616 4138 100980
Meghalaya 11139 1992862 314821 2318822
Source: Census of India, 2001
7

TABLE: 1.06 POPULATION OF TOWNS, 2001 & ESTIMATED POPULATION (2002-2010)
Class/ Towns 2001 2002 2003 2004 2005 2006 2007 2008 2009 2010
1. 2. 3. 4. 5. 6. 7. 8. 9. 10 11. Shillong Municipality 132867 132973 133079 133185 133292 133399 133506 133613 133720 133827
Shillong Cantonment 12396 12532 12670 12809 12950 13092 13236 13382 13529 13678
Madanryting 16318 17313 18369 19490 20679 21940 23278 24698 26205 27804
Mawlai 38303 39107 39928 40766 41622 42496 43388 44299 45229 46179
Nongthymmai 34292 35115 35958 36821 37705 38610 39537 40486 41458 42453 Pynthor- umkhrah 22115 23199 24336 25528 26779 28091 29467 30911 32426 34015
Nongmynsong 11371 - - - - - - - - - Shillong Agglomeration 267662 260239 264340 268599 273027 277628 282412 287389 292567 297956
Contd…
8
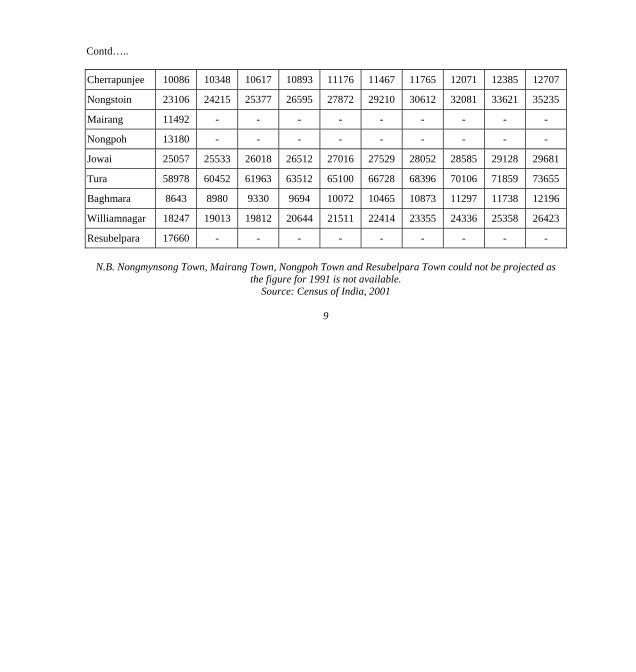
Contd…..
Cherrapunjee 10086 10348 10617 10893 11176 11467 11765 12071 12385 12707
Nongstoin 23106 24215 25377 26595 27872 29210 30612 32081 33621 35235
Mairang 11492 - - - - - - - - -
Nongpoh 13180 - - - - - - - - -
Jowai 25057 25533 26018 26512 27016 27529 28052 28585 29128 29681
Tura 58978 60452 61963 63512 65100 66728 68396 70106 71859 73655
Baghmara 8643 8980 9330 9694 10072 10465 10873 11297 11738 12196
Williamnagar 18247 19013 19812 20644 21511 22414 23355 24336 25358 26423
Resubelpara 17660 - - - - - - - - -
N.B. Nongmynsong Town, Mairang Town, Nongpoh Town and Resubelpara Town could not be projected as the figure for 1991 is not available.
Source: Census of India, 2001
9

TABLE: 1.07 POPULATION BY LANGUAGE
1991 2001
Languages Population
Percentage to total
population Population
Percentage to total
population 1. 2. 3. 4. 5.
Khasi 879192 49.54 1091087 47.05
Garo 547690 30.86 728424 31.41
Assamese 34118 1.92 36576 1..58
Bengalee 144261 8.13 185692 8 Gorkhalee/ Nepali 49186 2.77 52155 2.25
Hindi 38930 2.20 50055 2.16
Koch 18698 1.05 20834 0.90
Rabha 20455 1.15 22395 0.97 Other Languages 42248 2.38 131604 5.68
Meghalaya 1774778 100 2318822 100
Source: Census of India, 1991 & 2001
10

TABLE: 1.08 POPULATION BY AGE GROUP, 2001
Total Male Female Age Group Person P.C. Person P.C. Person P.C.
1. 2. 3. 4. 5. 6. 7. All Ages 2318822 100.00 1176087 100.00 1142735 100.00
0-4 324566 14.00 164343 13.97 160223 14.02
5-9 337157 14.54 170722 14.52 166435 14.57
10-14 319154 13.76 161632 13.74 157522 13.78
15-19 249780 10.77 126857 10.79 122923 10.76
20-24 195187 8.42 94446 8.03 100741 8.82
25-29 184137 7.94 87233 7.42 96904 8.48
30-34 147732 6.37 74672 6.35 73060 6.39
35-39 151079 6.52 78859 6.71 72220 6.32
40-44 103535 4.46 55573 4.72 47962 4.20
45-49 90705 3.91 48622 4.13 42083 3.68
50-54 63787 2.75 34715 2.95 29072 2.54
55-59 43117 1.86 22596 1.92 20521 1.80
60-64 39326 1.70 20448 1.74 18878 1.65
65-69 26664 1.15 13611 1.16 13053 1.14
Contd… 11
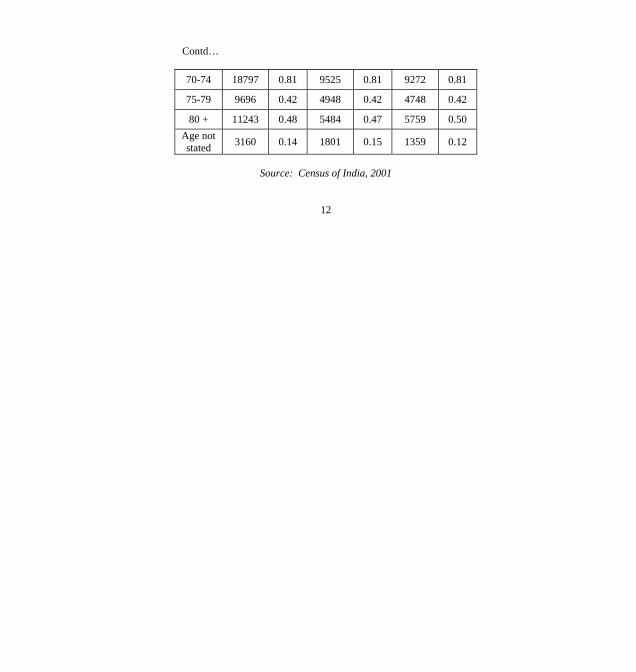
Contd…
70-74 18797 0.81 9525 0.81 9272 0.81
75-79 9696 0.42 4948 0.42 4748 0.42
80 + 11243 0.48 5484 0.47 5759 0.50 Age not stated 3160 0.14 1801 0.15 1359 0.12
Source: Census of India, 2001
12
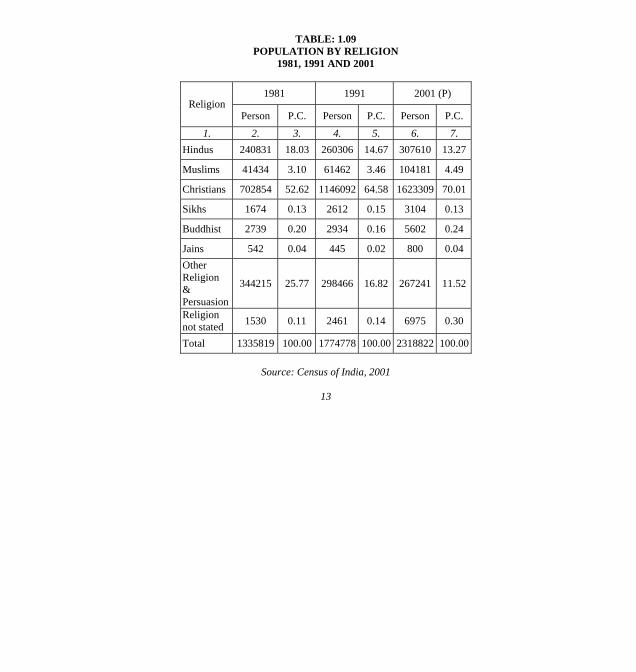
TABLE: 1.09 POPULATION BY RELIGION
1981, 1991 AND 2001
1981 1991 2001 (P) Religion
Person P.C. Person P.C. Person P.C.
1. 2. 3. 4. 5. 6. 7. Hindus 240831 18.03 260306 14.67 307610 13.27
Muslims 41434 3.10 61462 3.46 104181 4.49
Christians 702854 52.62 1146092 64.58 1623309 70.01
Sikhs 1674 0.13 2612 0.15 3104 0.13
Buddhist 2739 0.20 2934 0.16 5602 0.24
Jains 542 0.04 445 0.02 800 0.04 Other Religion & Persuasion
344215 25.77 298466 16.82 267241 11.52
Religion not stated 1530 0.11 2461 0.14 6975 0.30
Total 1335819 100.00 1774778 100.00 2318822 100.00
Source: Census of India, 2001
13
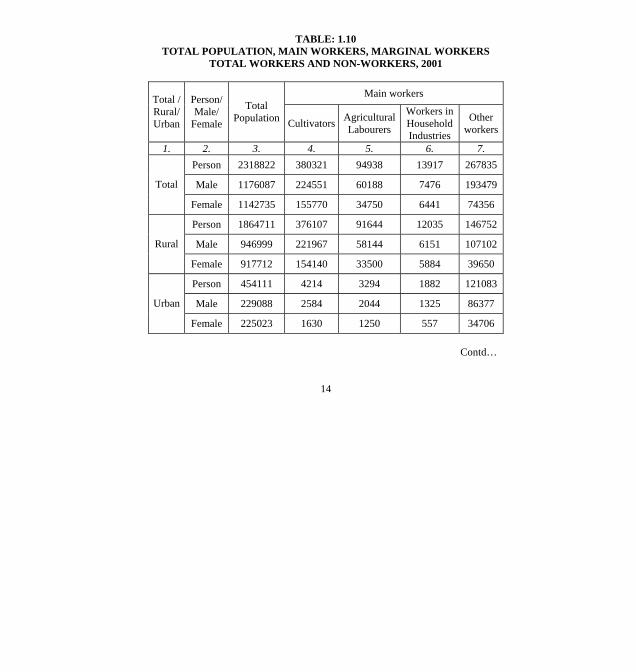
TABLE: 1.10 TOTAL POPULATION, MAIN WORKERS, MARGINAL WORKERS
TOTAL WORKERS AND NON-WORKERS, 2001
Main workers Total / Rural/ Urban
Person/ Male/
Female
Total Population Cultivators Agricultural
Labourers
Workers in Household Industries
Other workers
1. 2. 3. 4. 5. 6. 7. Person 2318822 380321 94938 13917 267835
Male 1176087 224551 60188 7476 193479 Total
Female 1142735 155770 34750 6441 74356
Person 1864711 376107 91644 12035 146752
Male 946999 221967 58144 6151 107102 Rural
Female 917712 154140 33500 5884 39650
Person 454111 4214 3294 1882 121083
Male 229088 2584 2044 1325 86377 Urban
Female 225023 1630 1250 557 34706
Contd…
14
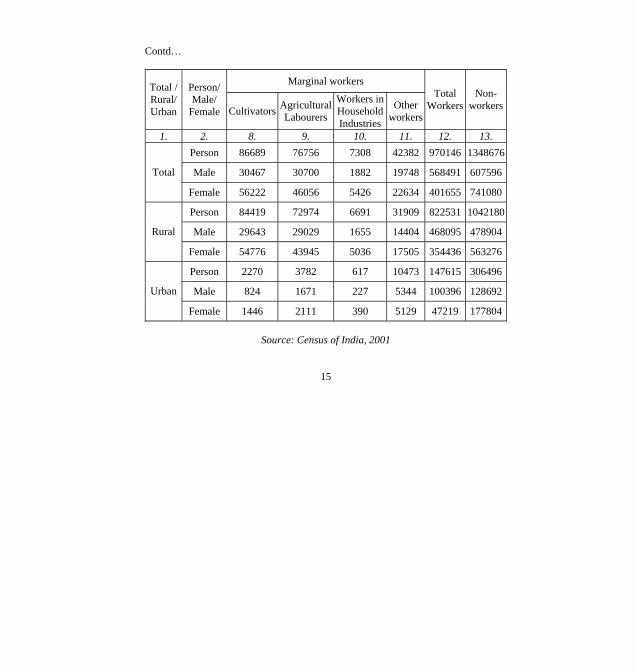
Contd…
Marginal workers Total / Rural/ Urban
Person/ Male/
Female Cultivators AgriculturalLabourers
Workers inHouseholdIndustries
Other workers
Total Workers
Non- workers
1. 2. 8. 9. 10. 11. 12. 13. Person 86689 76756 7308 42382 970146 1348676
Male 30467 30700 1882 19748 568491 607596 Total
Female 56222 46056 5426 22634 401655 741080
Person 84419 72974 6691 31909 822531 1042180
Male 29643 29029 1655 14404 468095 478904 Rural
Female 54776 43945 5036 17505 354436 563276
Person 2270 3782 617 10473 147615 306496
Male 824 1671 227 5344 100396 128692 Urban
Female 1446 2111 390 5129 47219 177804
Source: Census of India, 2001
15
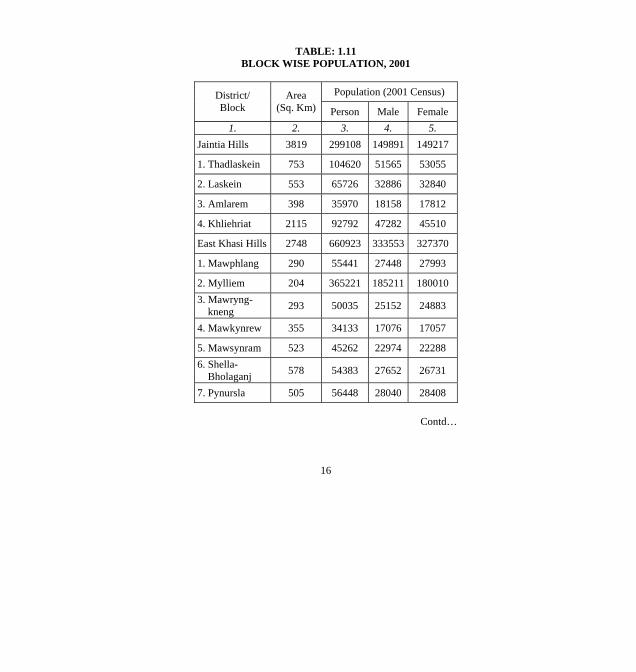
TABLE: 1.11
BLOCK WISE POPULATION, 2001
Population (2001 Census) District/ Block
Area (Sq. Km) Person Male Female
1. 2. 3. 4. 5. Jaintia Hills 3819 299108 149891 149217
1. Thadlaskein 753 104620 51565 53055
2. Laskein 553 65726 32886 32840
3. Amlarem 398 35970 18158 17812
4. Khliehriat 2115 92792 47282 45510
East Khasi Hills 2748 660923 333553 327370
1. Mawphlang 290 55441 27448 27993
2. Mylliem 204 365221 185211 180010 3. Mawryng- kneng 293 50035 25152 24883
4. Mawkynrew 355 34133 17076 17057
5. Mawsynram 523 45262 22974 22288 6. Shella- Bholaganj 578 54383 27652 26731
7. Pynursla 505 56448 28040 28408
Contd…
16

Contd….
West Khasi Hills 5247 296049 150419 145630
1. Mawshynrut 1614 56222 28684 27538
2. Nongstoin 974 75512 38397 37115
3. Mairang 1106 80792 40982 39810
4. Ranikor 695 32140 16556 15584 5. Mawkyr- wat 858 51383 25800 25583
Ri-Bhoi 2448 192790 99319 93471
1. Umling 1216 75622 38874 36748
2. Umsning 1232 117168 60445 56723
East Garo Hills 2603 250582 127474 123108
1. Resubelpara 468 86189 43738 42451 2. Dambo- Rongjeng 885 79224 40273 38951
3. Songsak 703 41992 21362 20630
4. Samanda 547 43177 22101 21076
Contd….
17
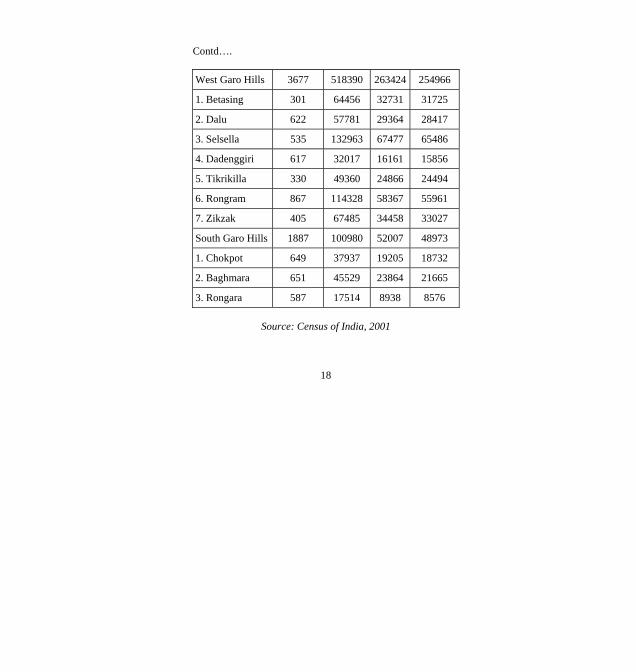
Contd….
West Garo Hills 3677 518390 263424 254966
1. Betasing 301 64456 32731 31725
2. Dalu 622 57781 29364 28417
3. Selsella 535 132963 67477 65486
4. Dadenggiri 617 32017 16161 15856
5. Tikrikilla 330 49360 24866 24494
6. Rongram 867 114328 58367 55961
7. Zikzak 405 67485 34458 33027
South Garo Hills 1887 100980 52007 48973
1. Chokpot 649 37937 19205 18732
2. Baghmara 651 45529 23864 21665
3. Rongara 587 17514 8938 8576
Source: Census of India, 2001
18
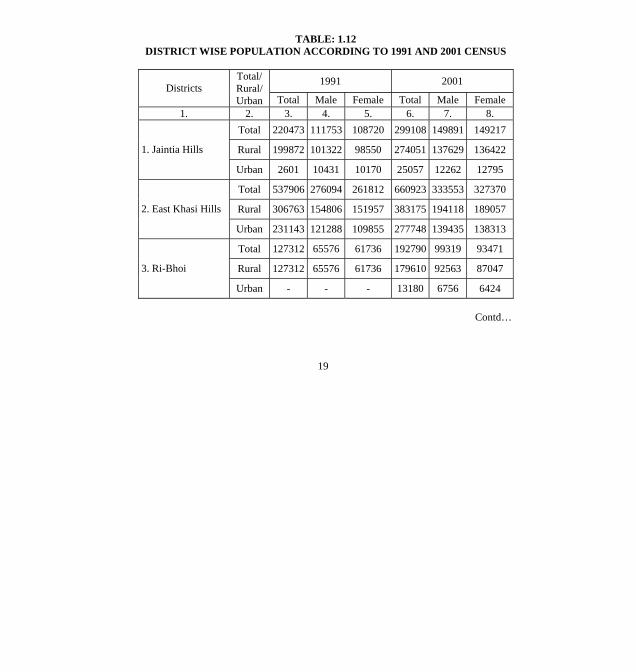
TABLE: 1.12 DISTRICT WISE POPULATION ACCORDING TO 1991 AND 2001 CENSUS
1991 2001 Districts Total/ Rural/ Urban Total Male Female Total Male Female
1. 2. 3. 4. 5. 6. 7. 8. Total 220473 111753 108720 299108 149891 149217
Rural 199872 101322 98550 274051 137629 136422 1. Jaintia Hills
Urban 2601 10431 10170 25057 12262 12795
Total 537906 276094 261812 660923 333553 327370
Rural 306763 154806 151957 383175 194118 189057 2. East Khasi Hills
Urban 231143 121288 109855 277748 139435 138313
Total 127312 65576 61736 192790 99319 93471
Rural 127312 65576 61736 179610 92563 87047 3. Ri-Bhoi
Urban - - - 13180 6756 6424
Contd…
19
Contd…
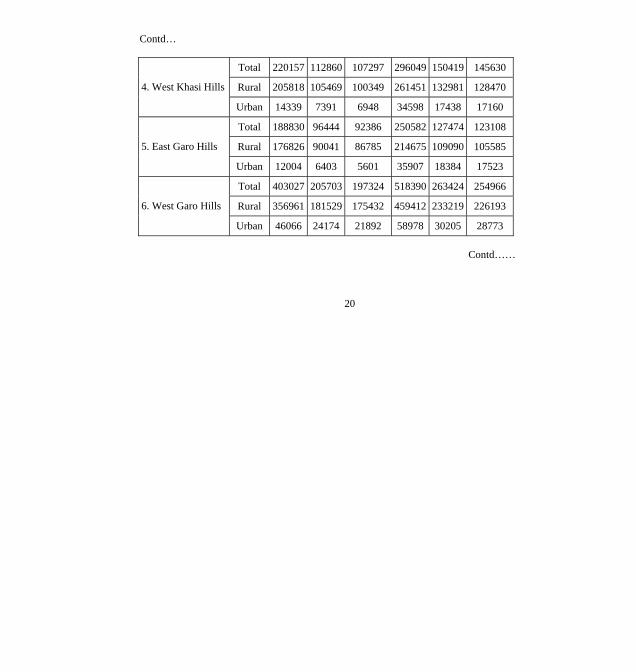
Total 220157 112860 107297 296049 150419 145630
Rural 205818 105469 100349 261451 132981 128470 4. West Khasi Hills
Urban 14339 7391 6948 34598 17438 17160
Total 188830 96444 92386 250582 127474 123108
Rural 176826 90041 86785 214675 109090 105585 5. East Garo Hills
Urban 12004 6403 5601 35907 18384 17523
Total 403027 205703 197324 518390 263424 254966
Rural 356961 181529 175432 459412 233219 226193 6. West Garo Hills
Urban 46066 24174 21892 58978 30205 28773
Contd……
20

Contd…
Total 77073 39257 37816 100980 52007 48973
Rural 71179 36122 35057 92337 47399 44938 South Garo Hills
Urban 5894 3135 2759 8643 4608 4035
Total 1774778 907687 867091 2318822 1176087 1142735
Rural 1444731 734865 709866 1864711 946999 917712 Meghalaya
Urban 330047 172822 157225 454111 229088 225023
Source: Census of India, 2001
21

TABLE: 1.13 BLOCK-WISE NUMBER OF VILLAGES AS PER
2001 CENSUS
District C&RD Blocks Total number of Villages
1. 2. 3. 1. Thadlaskein 130
2. Laskein 88
3. Amlarem 87
4. Khliehriat 194
Jaintia Hills
5. Saipung -
1. Mawphlang 214
2. Mylliem 96
3. Mawryngkneng 64
4. Mawkynrew 71
5. Mawsynram 160 6. Shella- Bholaganj 202
7. Pynursla 155
East Khasi Hills
8. Khadarshnong- Laitkroh -
1. Umling 247
2. Umsning 323 Ri-Bhoi
3. Jirang -
Contd… 22

Contd…
1. Mawshynrut 310
2. Nongstoin 218
3. Mairang 143
4. Ranikor 131
5. Mawkyrwat 141
West Khasi Hills
6. Mawthadrai- shan -
1. Resubelpara 238 2. Dambo- Rongjeng 313
3. Songsak 198
4. Samanda 139
East Garo Hills
5. Kharkutta -
1. Betasing 212
2. Dalu 264
3. Selsella 330
4. Dadenggiri 125
5. Tikrikilla 171
6. Rongram 233
7. Zikzak 202
West Garo Hills
8. Gambegre -
Contd……
23
Contd…
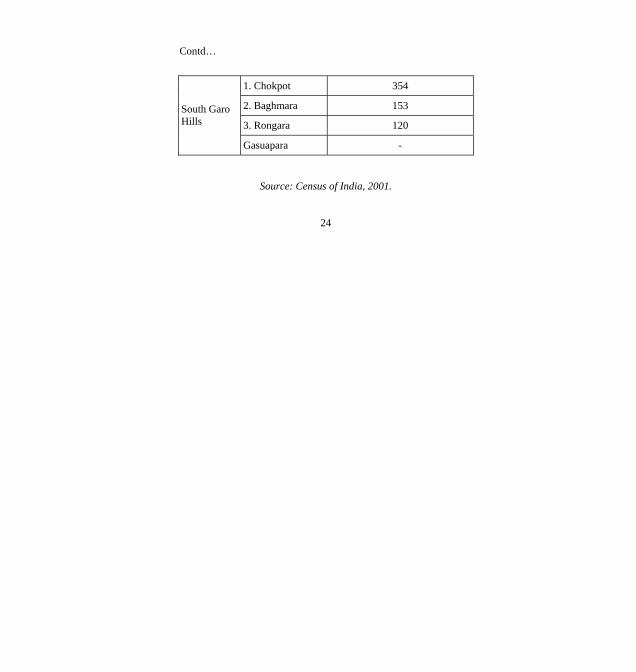
1. Chokpot 354
2. Baghmara 153
3. Rongara 120 South Garo Hills
Gasuapara -
Source: Census of India, 2001.
24

TABLE: 1.14 POPULATION OF THE DISABLED
BY SEX - 2001
District Sex Total Rural Urban
1. 2. 3. 4. 5. Person 28803 22740 6063
Male 15317 12052 3265 Meghalaya
Female 13486 10688 2798
Person 6970 6197 773
Male 3786 3332 454 West Garo Hills
Female 3184 2865 319
Person 2528 2215 313
Male 1357 1191 166 East Garo Hills
Female 1171 1024 147
Person 1426 1313 113
Male 754 693 61 South Garo Hills
Female 672 620 52
Person 4077 3805 272
Male 2092 1956 136 West Khasi Hills
Female 1985 1849 136
Contd…
25

Contd…
Person 2180 1949 231
Male 1224 1097 127 Ri-Bhoi
Female 956 852 104
Person 9084 4917 4167
Male 4807 2587 2220 East Khasi Hills
Female 4277 2330 1947
Person 2538 2344 194
Male 1297 1196 101 Jaintia Hills
Female 1241 1148 93
Source: Census of India, 2001
26
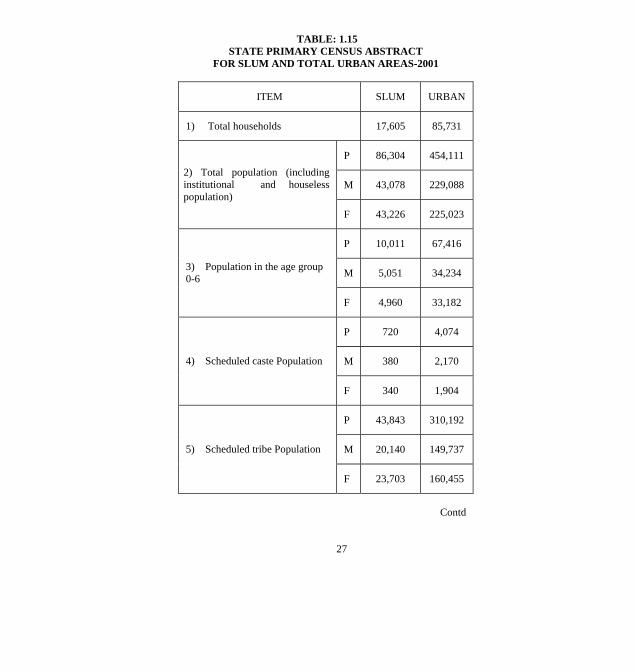
TABLE: 1.15 STATE PRIMARY CENSUS ABSTRACT
FOR SLUM AND TOTAL URBAN AREAS-2001
ITEM SLUM URBAN
1) Total households 17,605 85,731
P 86,304 454,111
M 43,078 229,088 2) Total population (including institutional and houseless population)
F 43,226 225,023
P 10,011 67,416
M 5,051 34,234 3) Population in the age group 0-6
F 4,960 33,182
P 720 4,074
M 380 2,170 4) Scheduled caste Population
F 340 1,904
P 43,843 310,192
M 20,140 149,737 5) Scheduled tribe Population
F 23,703 160,455
Contd
27

Contd…
P 67,365 333,702
M 34,661 173,517 6) Literates
F 32,704 160,185
P 28,939 147,615
M 19,926 100,396 7) Total Workers
F 9,013 47,219
P 27,463 130,473
M 19,131 92,330 8. Main Workers
F 8,332 38,143
P 1,476 17,142
M 795 8,066 9) Marginal Workers
F 681 9,076
P 57,365 306,496
M 23,152 128,692 10) Non-Workers
F 34,213 177,804
Source: Census of India, 2001
28
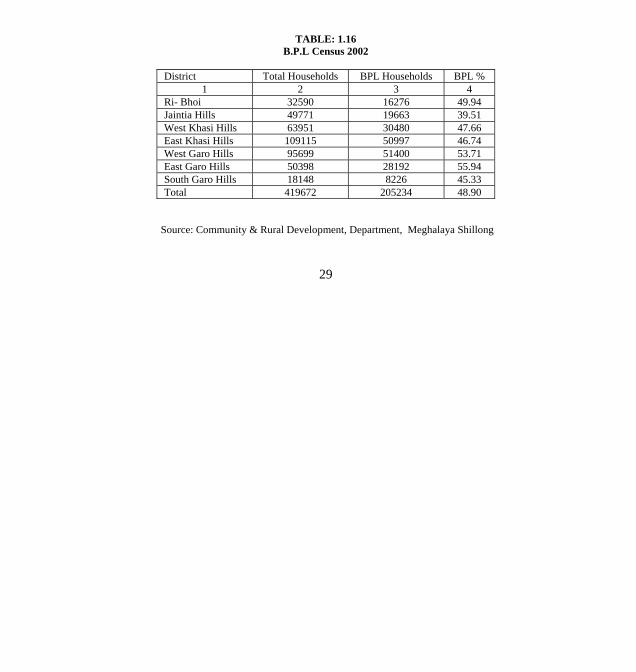
TABLE: 1.16 B.P.L Census 2002
District Total Households BPL Households BPL %
1 2 3 4 Ri- Bhoi 32590 16276 49.94 Jaintia Hills 49771 19663 39.51 West Khasi Hills 63951 30480 47.66 East Khasi Hills 109115 50997 46.74 West Garo Hills 95699 51400 53.71 East Garo Hills 50398 28192 55.94 South Garo Hills 18148 8226 45.33 Total 419672 205234 48.90
Source: Community & Rural Development, Department, Meghalaya Shillong
29

2. HOUSING & HOUSEHOLD STATISTICS
TABLE: 2.01 NUMBER OF CENSUS HOUSES & HOUSEHOLDS
DURING 1971 TO 2001
Items 1971 1981 1991 2001
1. 2. 3. 4. 5.
1. Houses (Vacant + Occupied) 224538 255826 400428 520602
2. Households 201123 255131 327295 420246
Decadal Growth Rate
1. Houses (Vacant + Occupied) - 13.93 56.52 30.01
2. Households - 26.85 28.29 28.40
Source: Census of India, 2001
30
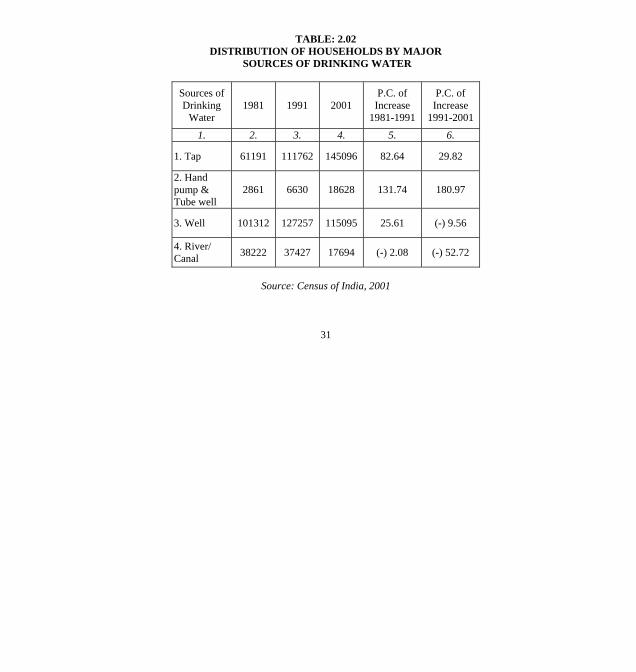
TABLE: 2.02 DISTRIBUTION OF HOUSEHOLDS BY MAJOR
SOURCES OF DRINKING WATER
Sources of Drinking
Water 1981 1991 2001
P.C. of Increase
1981-1991
P.C. of Increase
1991-2001
1. 2. 3. 4. 5. 6.
1. Tap 61191 111762 145096 82.64 29.82
2. Hand pump & Tube well
2861 6630 18628 131.74 180.97
3. Well 101312 127257 115095 25.61 (-) 9.56
4. River/ Canal 38222 37427 17694 (-) 2.08 (-) 52.72
Source: Census of India, 2001
31

TABLE: 2.03 NUMBER OF CENSUS HOUSES, RURAL &
URBAN DURING 2001
Houses Total P.C. Rural P.C. Urban P.C.
1. 2. 3. 4. 5. 6. 7.
A. Total Census Houses
520602 100.00 401392 77.1 119210 22.9
A.1 Vacant Census Houses
18568 3.6 12327 3.1 6241 5.2
A.2 Occupied Census Houses
502034 96.4 389065 96.9 112969 94.8
Source: Census of India, 2001
32

TABLE: 2.04 USES OF OCCUPIED CENSUS HOUSES
Rural Urban Uses Total
P.C. to total
occupied houses No. P.C. No. P.C.
1. 2. 3. 4. 5. 6. 7.
1. Residence 406357 80.9 319718 82.2 86639 76.7
2. Residence cum other uses 6900 1.4 4955 1.3 1945 1.7
3. Shop, office 29107 5.8 14020 3.6 15087 13.4
4. School, college etc 7381 1.5 6569 1.7 812 0.7
5. Hotel, lodge Guest House Etc
1429 0.3 878 0.2 551 0.5
6. Hospital Dispensary 1062 0.2 800 0.2 262 0.2
7. Factory, Workshop, workshed etc
3602 0.7 2272 0.6 1330 1.2
8. Place of worship 5771 1.1 5289 1.3 482 0.4
9. Other non residential use 40425 8.1 34564 8.9 5861 5.2
Total 502034 100 389065 100 112969 100
Source: Census of India, 2001
33

TABLE: 2.05 AVAILABILITY OF AMENITIES viz. ELECTRICITY & LATRINE IN THE HOUSEHOLDS
Electricity (No.) 1981 P.C. to totalHouseholds 1991 P.C. to total
Households 2001 P.C. to total Households
1. 2. 3. 4. 5. 6. 7. A. Amenities 1. Available 42966 16.85 67186 20.53 179597 42.74
2. Not available 212165 83.15 260109 79.47 240649 57.26
Total 255131 - 327295 - 420246 -
B. Latrine (No.) 1. Available
-
-
-
-
215144
51.20
2. Not available - - - - 205102 48.80
Total - - - - 420246 -
Source: Census of India, 2001
34
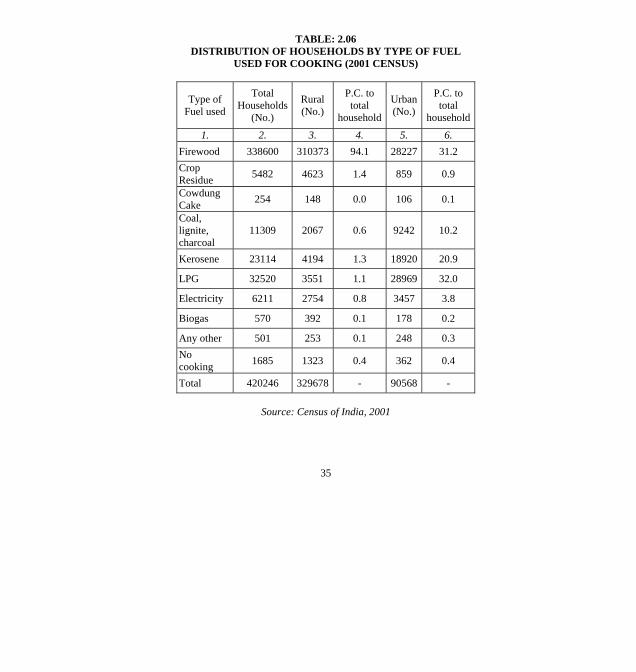
TABLE: 2.06 DISTRIBUTION OF HOUSEHOLDS BY TYPE OF FUEL
USED FOR COOKING (2001 CENSUS)
Type of Fuel used
Total Households
(No.)
Rural (No.)
P.C. to total
household
Urban(No.)
P.C. to total
household
1. 2. 3. 4. 5. 6. Firewood 338600 310373 94.1 28227 31.2 Crop Residue 5482 4623 1.4 859 0.9
Cowdung Cake 254 148 0.0 106 0.1
Coal, lignite, charcoal
11309 2067 0.6 9242 10.2
Kerosene 23114 4194 1.3 18920 20.9
LPG 32520 3551 1.1 28969 32.0
Electricity 6211 2754 0.8 3457 3.8
Biogas 570 392 0.1 178 0.2
Any other 501 253 0.1 248 0.3 No cooking 1685 1323 0.4 362 0.4
Total 420246 329678 - 90568 -
Source: Census of India, 2001
35

TABLE: 2.07 NUMBER OF HOUSEHOLDS HAVING EACH OF THE SPECIFIED ASSET – 2001
Rural Urban
Name of Assets No. of Households
P.C. to totalHouseholds No. of
HouseholdsP.C. to totalHouseholds
No. of Households
P.C. to total Household s
1. 2. 3. 4. 5. 6. 7.
1. Radio, Transistor 134323 32.0 95421 28.9 38902 43.0
2. Television 87785 20.9 34760 10.5 53025 58.5
3. Telephone 25100 6.0 5176 1.6 19924 22.0
4. Bicycle 46060 11.0 39009 11.8 7051 7.8
5. Scooter, Motor cycle, Moped 12150 2.9 5024 1.5 7126 7.9
6. Car, Jeep, Van 11308 2.7 4250 1.3 7058 7.8
7. None of the specified assets 231746 55.1 205362 62.3 26384 29.1
Source: Census of India, 2001
36

3. CLIMATE
TABLE: 3.01 MAXIMUM & MINIMUM TEMPERATURE OF SOME CENTRES, 2007
(In degree Celsius)
2007
Nongstoin Jowai Tura Nongpoh Baghmara Month
Max Min Max Min Max Min Max Min Max Min 1. 2. 3. 4. 5. 6. 7. 8. 9. 10. 11.
January 13.8 8.3 18.36 8.23 21.6 18.4 20.9 16.3 25.0 18.0
February 15.5 10.7 17.66 9.36 23.0 19.5 20.7 16.9 28.0 18.0
March 19.4 13.8 22.07 12.58 25.7 22.4 25.8 21.0 34.0 20.0
April 23.3 16.9 23.09 15.25 27.4 24.3 27.6 22.1 35.0 24.0
May 25.2 19.1 24.70 18.00 28.8 25.5 28.7 23.9 36.0 25.0
June 26.2 19.6 24.10 18.59 27.5 23.5 27.3 24.4 35.0 23.0
Contd…
37

Contd…..
July 25.6 20.0 22.79 18.97 26.5 24.4 20.9 16.3 34.0 24.0
August 25.9 20.3 25.40 19.40 27.6 23.5 20.7 16.9 36.0 26.0
September 24.9 18.6 24.12 19.40 27.9 24.4 25.8 21.0 36.0 23.0
October 22.9 17.8 22.10 19.07 27.7 24.3 27.6 22.1 35.0 24.0
November 19.3 14.9 21.66 17.01 26.6 22.8 28.7 23.9 32.0 22.0
December 15.0 10.0 18.70 9.79 24.8 21.1 27.3 24.4 28.0 22.0
Source: Indian Meteorological Department
38
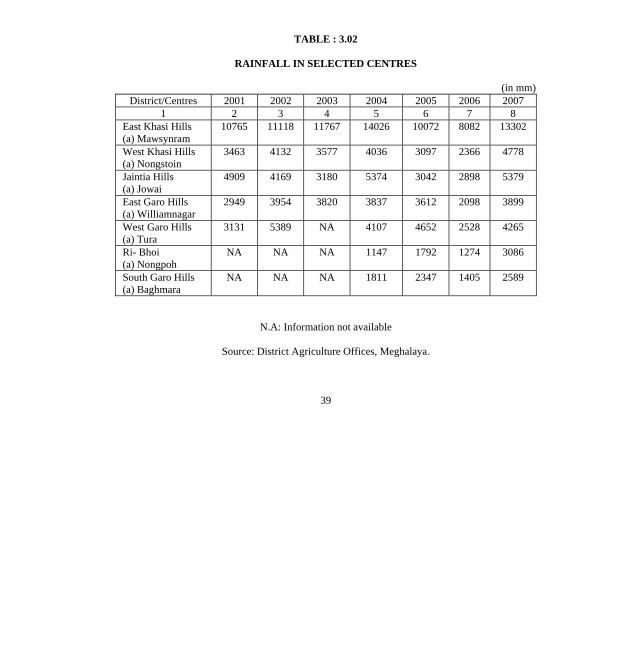
TABLE : 3.02
RAINFALL IN SELECTED CENTRES
(in mm) District/Centres 2001 2002 2003 2004 2005 2006 2007
1 2 3 4 5 6 7 8 East Khasi Hills (a) Mawsynram
10765 11118 11767 14026 10072 8082 13302
West Khasi Hills (a) Nongstoin
3463 4132 3577 4036 3097 2366 4778
Jaintia Hills (a) Jowai
4909 4169 3180 5374 3042 2898 5379
East Garo Hills (a) Williamnagar
2949 3954 3820 3837 3612 2098 3899
West Garo Hills (a) Tura
3131 5389 NA 4107 4652 2528 4265
Ri- Bhoi (a) Nongpoh
NA NA NA 1147 1792 1274 3086
South Garo Hills (a) Baghmara
NA NA NA 1811 2347 1405 2589
N.A: Information not available
Source: District Agriculture Offices, Meghalaya.
39

4. AGRICULTURE
Table: 4.01 Land Use Statistics
(Hectares)
Particulars 2002-03 2003-04 2004-05
1. 2. 3. 4. Reporting Area for land utilisation statistics 2227100 2227100 2227100
1. Forest 947038 947219 941786 2. Not available for cultivation 225321 225380 227945
3. Other uncultivated land excluding fallow land
600824 599589 607717
4. Fallow land 238392 235688 230760
5. Net Area Sown 215525 219224 218892 6. Area sown more than once 46597 46650 46680
7. Total cropped area 262122 265874 265572
Source: Directorate of Economics and Statistics, Meghalaya
40
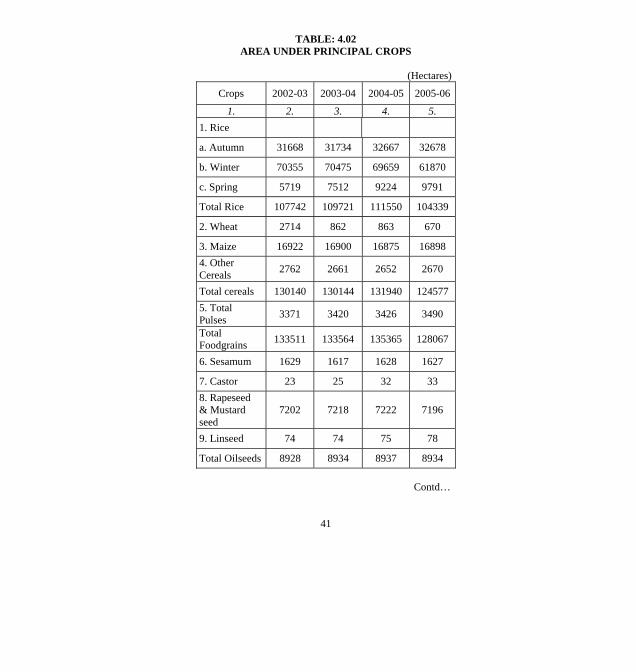
TABLE: 4.02 AREA UNDER PRINCIPAL CROPS
(Hectares)
Crops 2002-03 2003-04 2004-05 2005-06
1. 2. 3. 4. 5. 1. Rice
a. Autumn 31668 31734 32667 32678
b. Winter 70355 70475 69659 61870
c. Spring 5719 7512 9224 9791
Total Rice 107742 109721 111550 104339
2. Wheat 2714 862 863 670
3. Maize 16922 16900 16875 16898 4. Other Cereals 2762 2661 2652 2670
Total cereals 130140 130144 131940 124577 5. Total Pulses 3371 3420 3426 3490
Total Foodgrains 133511 133564 135365 128067
6. Sesamum 1629 1617 1628 1627
7. Castor 23 25 32 33 8. Rapeseed & Mustard seed
7202 7218 7222 7196
9. Linseed 74 74 75 78
Total Oilseeds 8928 8934 8937 8934
Contd…
41
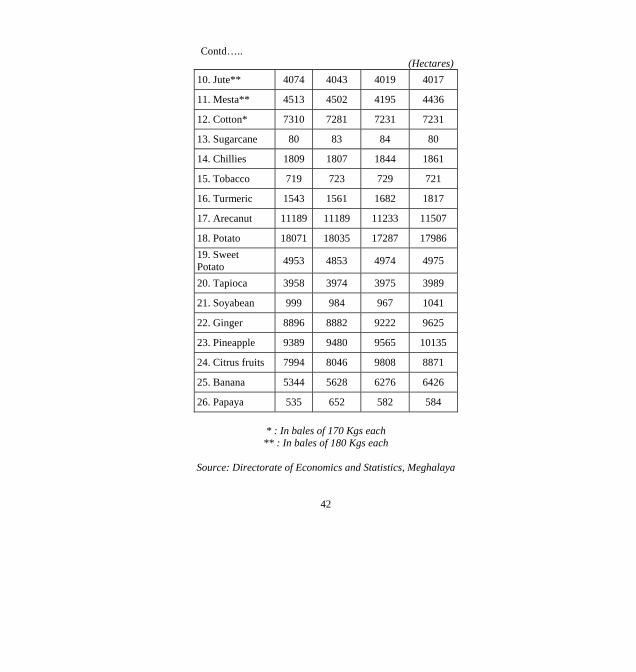
Contd…..
(Hectares) 10. Jute** 4074 4043 4019 4017
11. Mesta** 4513 4502 4195 4436
12. Cotton* 7310 7281 7231 7231
13. Sugarcane 80 83 84 80
14. Chillies 1809 1807 1844 1861
15. Tobacco 719 723 729 721
16. Turmeric 1543 1561 1682 1817
17. Arecanut 11189 11189 11233 11507
18. Potato 18071 18035 17287 17986 19. Sweet Potato 4953 4853 4974 4975
20. Tapioca 3958 3974 3975 3989
21. Soyabean 999 984 967 1041
22. Ginger 8896 8882 9222 9625
23. Pineapple 9389 9480 9565 10135
24. Citrus fruits 7994 8046 9808 8871
25. Banana 5344 5628 6276 6426
26. Papaya 535 652 582 584
* : In bales of 170 Kgs each ** : In bales of 180 Kgs each
Source: Directorate of Economics and Statistics, Meghalaya
42

TABLE: 4.03 PRODUCTION OF PRINCIPAL CROPS
(Tonnes)
Crops 2002-03 2003-04 2004-05 2005-06
1. 2. 3. 4. 5. Rice
a. Autumn 37766 35822 37766 43762
b. Winter 131031 134723 118514 119813
c. Spring 22140 30157 37439 39910
Total Rice 190937 200702 193719 203485
2. Wheat 4745 1540 1564 1198
3. Maize 25879 25929 24000 24424 4. Other Cereals 2313 2209 2241 2272
Total cereals 223874 230380 221524 231379
5. Total Pulses 2546 2603 2622 2671 Total Foodgrains 226420 232983 224146 234050
6. Sesamum 858 849 860 868
7. Castor 12 14 20 21 8. Rapeseed & Mustard seed
4670 4645 4797 4759
9. Linseed 36 34 35 37
Total Oilseeds 5576 5542 5658 5685 Contd…
43
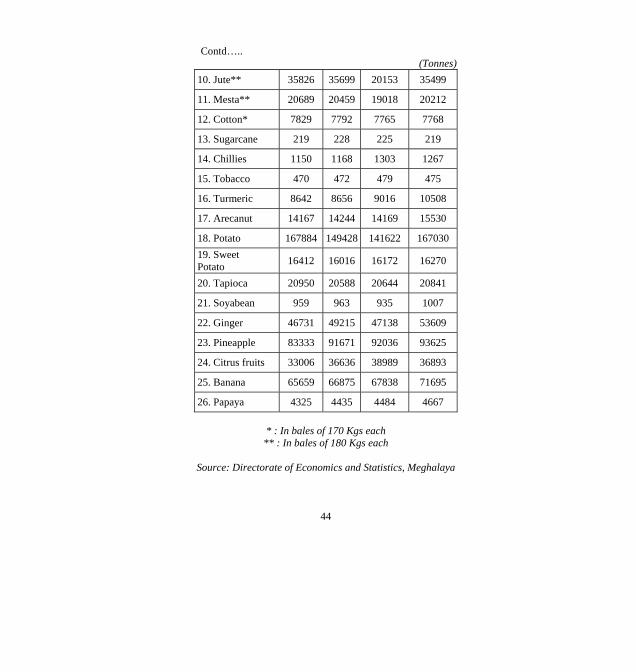
Contd…..
(Tonnes) 10. Jute** 35826 35699 20153 35499
11. Mesta** 20689 20459 19018 20212
12. Cotton* 7829 7792 7765 7768
13. Sugarcane 219 228 225 219
14. Chillies 1150 1168 1303 1267
15. Tobacco 470 472 479 475
16. Turmeric 8642 8656 9016 10508
17. Arecanut 14167 14244 14169 15530
18. Potato 167884 149428 141622 167030 19. Sweet Potato 16412 16016 16172 16270
20. Tapioca 20950 20588 20644 20841
21. Soyabean 959 963 935 1007
22. Ginger 46731 49215 47138 53609
23. Pineapple 83333 91671 92036 93625
24. Citrus fruits 33006 36636 38989 36893
25. Banana 65659 66875 67838 71695
26. Papaya 4325 4435 4484 4667
* : In bales of 170 Kgs each ** : In bales of 180 Kgs each
Source: Directorate of Economics and Statistics, Meghalaya
44
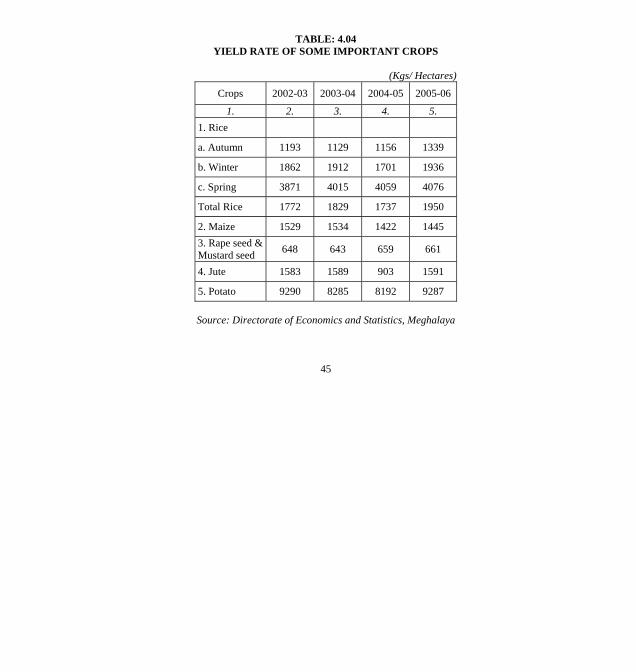
TABLE: 4.04 YIELD RATE OF SOME IMPORTANT CROPS
(Kgs/ Hectares)
Crops 2002-03 2003-04 2004-05 2005-06
1. 2. 3. 4. 5. 1. Rice
a. Autumn 1193 1129 1156 1339
b. Winter 1862 1912 1701 1936
c. Spring 3871 4015 4059 4076
Total Rice 1772 1829 1737 1950
2. Maize 1529 1534 1422 1445 3. Rape seed &Mustard seed 648 643 659 661
4. Jute 1583 1589 903 1591
5. Potato 9290 8285 8192 9287
Source: Directorate of Economics and Statistics, Meghalaya
45
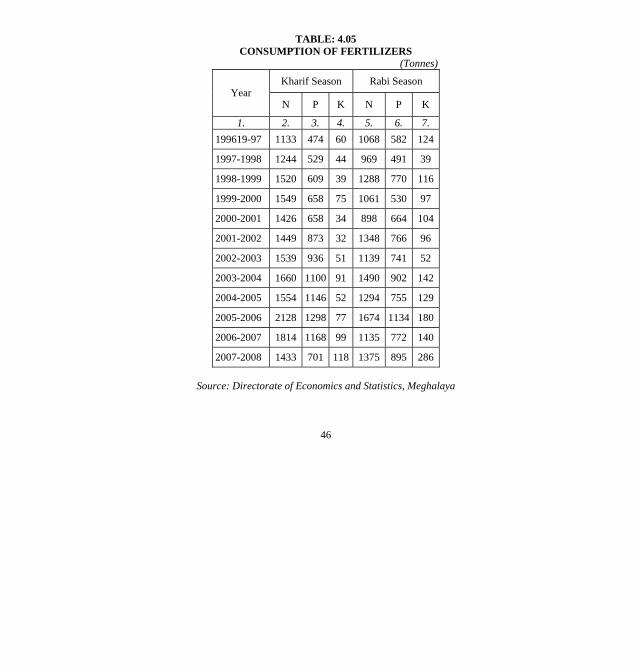
TABLE: 4.05 CONSUMPTION OF FERTILIZERS
(Tonnes)
Kharif Season Rabi Season Year
N P K N P K
1. 2. 3. 4. 5. 6. 7. 199619-97 1133 474 60 1068 582 124
1997-1998 1244 529 44 969 491 39
1998-1999 1520 609 39 1288 770 116
1999-2000 1549 658 75 1061 530 97
2000-2001 1426 658 34 898 664 104
2001-2002 1449 873 32 1348 766 96
2002-2003 1539 936 51 1139 741 52
2003-2004 1660 1100 91 1490 902 142
2004-2005 1554 1146 52 1294 755 129
2005-2006 2128 1298 77 1674 1134 180
2006-2007 1814 1168 99 1135 772 140
2007-2008 1433 701 118 1375 895 286
Source: Directorate of Economics and Statistics, Meghalaya
46
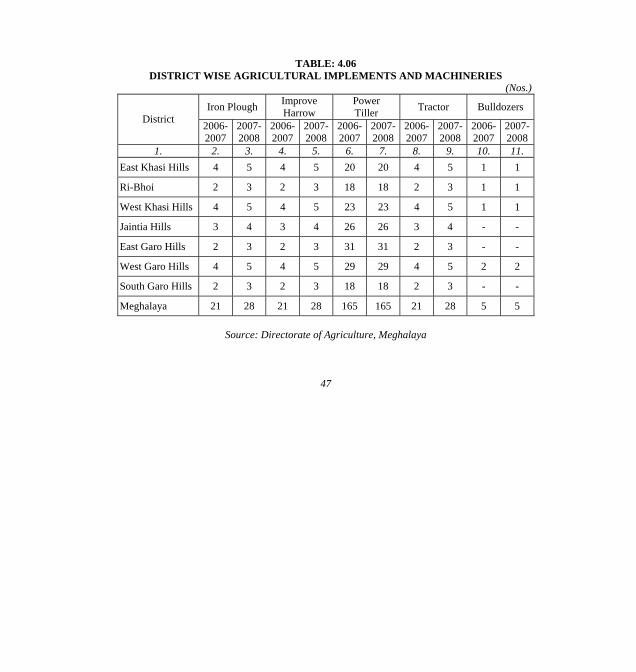
TABLE: 4.06 DISTRICT WISE AGRICULTURAL IMPLEMENTS AND MACHINERIES
(Nos.)
Iron Plough Improve Harrow
Power Tiller Tractor Bulldozers
District 2006- 2007
2007-2008
2006-2007
2007-2008
2006-2007
2007-2008
2006-2007
2007-2008
2006- 2007
2007- 2008
1. 2. 3. 4. 5. 6. 7. 8. 9. 10. 11. East Khasi Hills 4 5 4 5 20 20 4 5 1 1
Ri-Bhoi 2 3 2 3 18 18 2 3 1 1
West Khasi Hills 4 5 4 5 23 23 4 5 1 1
Jaintia Hills 3 4 3 4 26 26 3 4 - -
East Garo Hills 2 3 2 3 31 31 2 3 - -
West Garo Hills 4 5 4 5 29 29 4 5 2 2
South Garo Hills 2 3 2 3 18 18 2 3 - -
Meghalaya 21 28 21 28 165 165 21 28 5 5
Source: Directorate of Agriculture, Meghalaya
47
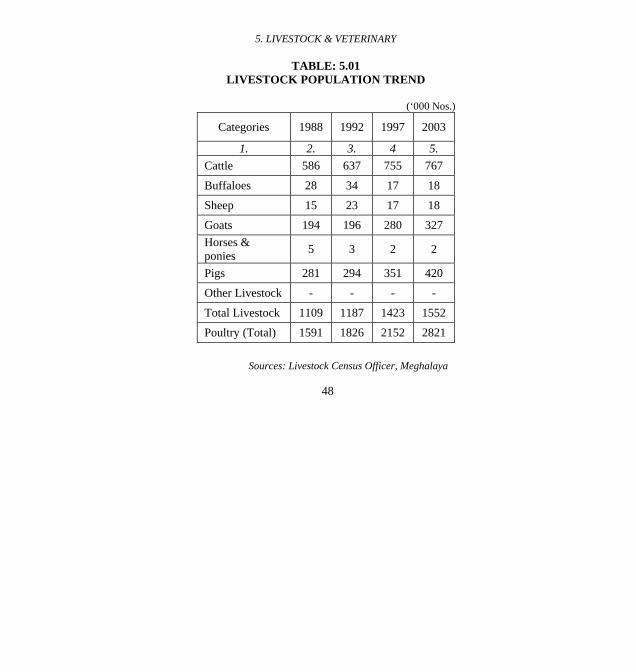
5. LIVESTOCK & VETERINARY
TABLE: 5.01 LIVESTOCK POPULATION TREND
(‘000 Nos.)
Categories 1988 1992 1997 2003
1. 2. 3. 4 5. Cattle 586 637 755 767
Buffaloes 28 34 17 18
Sheep 15 23 17 18
Goats 194 196 280 327 Horses & ponies 5 3 2 2
Pigs 281 294 351 420
Other Livestock - - - -
Total Livestock 1109 1187 1423 1552
Poultry (Total) 1591 1826 2152 2821
Sources: Livestock Census Officer, Meghalaya
48
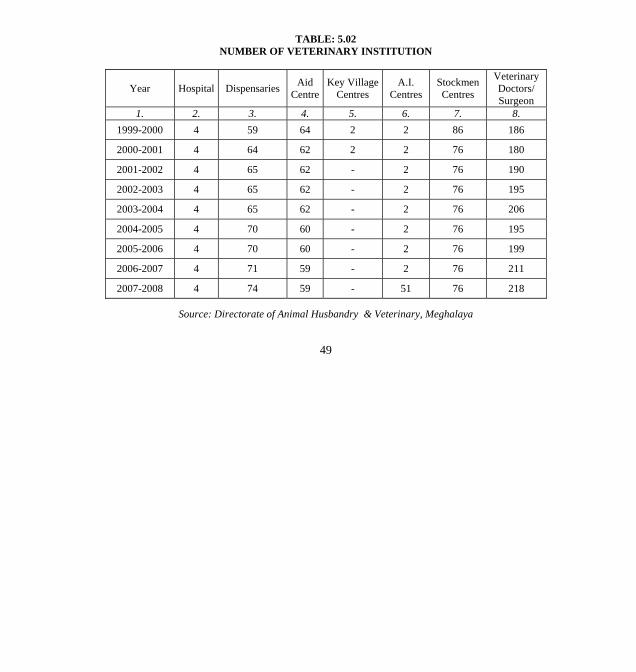
TABLE: 5.02 NUMBER OF VETERINARY INSTITUTION
Year Hospital Dispensaries Aid Centre
Key VillageCentres
A.I. Centres
Stockmen Centres
Veterinary Doctors/ Surgeon
1. 2. 3. 4. 5. 6. 7. 8. 1999-2000 4 59 64 2 2 86 186
2000-2001 4 64 62 2 2 76 180
2001-2002 4 65 62 - 2 76 190
2002-2003 4 65 62 - 2 76 195
2003-2004 4 65 62 - 2 76 206
2004-2005 4 70 60 - 2 76 195
2005-2006 4 70 60 - 2 76 199
2006-2007 4 71 59 - 2 76 211
2007-2008 4 74 59 - 51 76 218
Source: Directorate of Animal Husbandry & Veterinary, Meghalaya
49
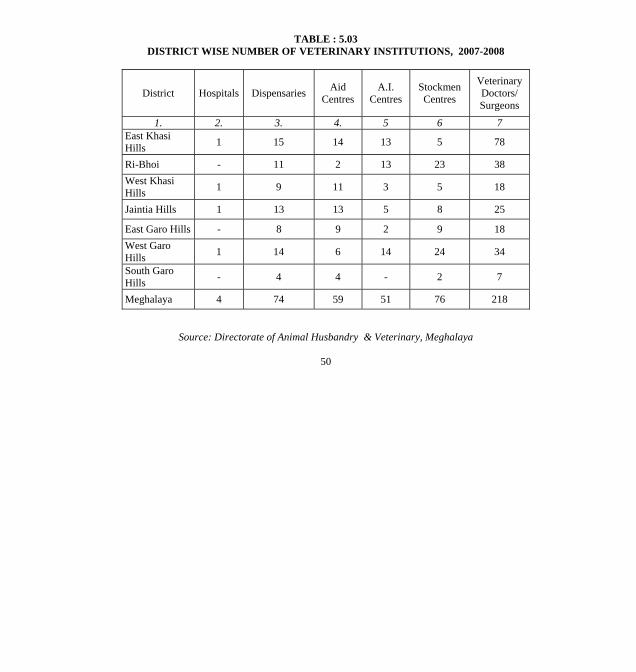
TABLE : 5.03 DISTRICT WISE NUMBER OF VETERINARY INSTITUTIONS, 2007-2008
District Hospitals Dispensaries Aid Centres
A.I. Centres
Stockmen Centres
Veterinary Doctors/ Surgeons
1. 2. 3. 4. 5 6 7 East Khasi Hills 1 15 14 13 5 78
Ri-Bhoi - 11 2 13 23 38 West Khasi Hills 1 9 11 3 5 18
Jaintia Hills 1 13 13 5 8 25
East Garo Hills - 8 9 2 9 18 West Garo Hills 1 14 6 14 24 34
South Garo Hills - 4 4 - 2 7
Meghalaya 4 74 59 51 76 218
Source: Directorate of Animal Husbandry & Veterinary, Meghalaya
50
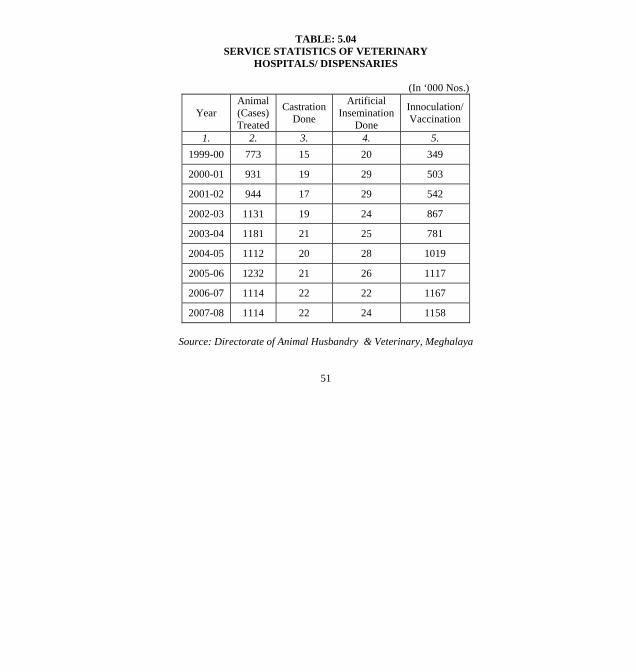
TABLE: 5.04 SERVICE STATISTICS OF VETERINARY
HOSPITALS/ DISPENSARIES
(In ‘000 Nos.)
Year Animal (Cases) Treated
Castration Done
Artificial Insemination
Done
Innoculation/ Vaccination
1. 2. 3. 4. 5. 1999-00 773 15 20 349
2000-01 931 19 29 503
2001-02 944 17 29 542
2002-03 1131 19 24 867
2003-04 1181 21 25 781
2004-05 1112 20 28 1019
2005-06 1232 21 26 1117
2006-07 1114 22 22 1167
2007-08 1114 22 24 1158
Source: Directorate of Animal Husbandry & Veterinary, Meghalaya
51

TABLE: 5.05 ESTIMATED TOTAL EGG PRODUCTION 2007-2008
(Lakh nos.)
Total egg Name of District Fowls Ducks
Annual Production
Current year 2007-08
Annual Production
Previous year2006-07
1. 2. 3. 4. 5. East Khasi Hills 153.50 2.29 155.79 153.14
Ri-Bhoi 115.49 2.24 117.73 117.52
West Khasi Hills 118.50 0.98 119.48 118.38
Jaintia Hills 147.20 3.74 150.94 151.10
East Garo Hills 113.65 0.68 114.33 113.66
West Garo Hills 255.39 17.61 273.00 268.63
South Garo Hills 55.81 1.56 57.39 55.54
Meghalaya 959.54 29.10 988.66 977.97
Source: Directorate of Animal Husbandry & Veterinary, Meghalaya
52
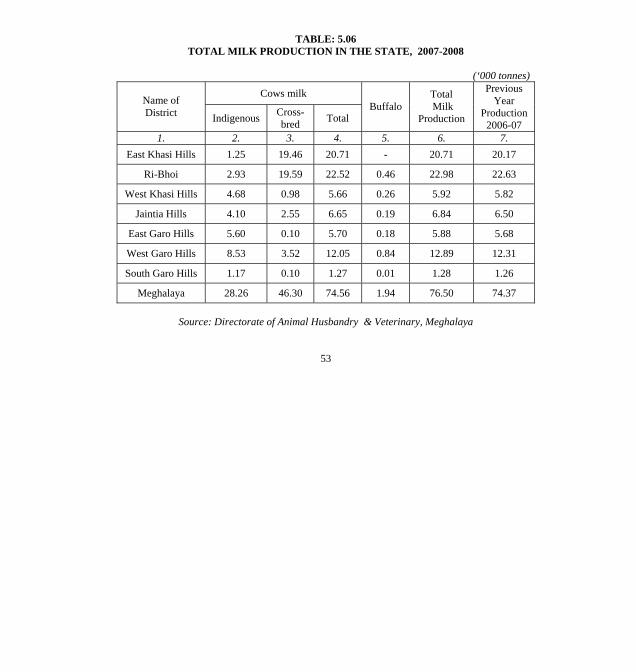
TABLE: 5.06 TOTAL MILK PRODUCTION IN THE STATE, 2007-2008
(‘000 tonnes)
Cows milk Name of District Indigenous Cross-
bred Total Buffalo
Total Milk
Production
Previous Year
Production 2006-07
1. 2. 3. 4. 5. 6. 7. East Khasi Hills 1.25 19.46 20.71 - 20.71 20.17
Ri-Bhoi 2.93 19.59 22.52 0.46 22.98 22.63
West Khasi Hills 4.68 0.98 5.66 0.26 5.92 5.82
Jaintia Hills 4.10 2.55 6.65 0.19 6.84 6.50
East Garo Hills 5.60 0.10 5.70 0.18 5.88 5.68
West Garo Hills 8.53 3.52 12.05 0.84 12.89 12.31
South Garo Hills 1.17 0.10 1.27 0.01 1.28 1.26
Meghalaya 28.26 46.30 74.56 1.94 76.50 74.37
Source: Directorate of Animal Husbandry & Veterinary, Meghalaya
53
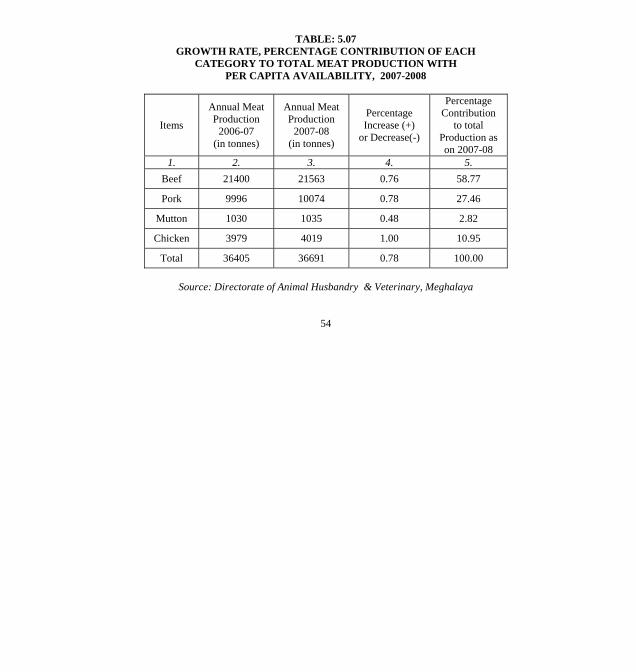
TABLE: 5.07 GROWTH RATE, PERCENTAGE CONTRIBUTION OF EACH
CATEGORY TO TOTAL MEAT PRODUCTION WITH PER CAPITA AVAILABILITY, 2007-2008
Items
Annual Meat Production
2006-07 (in tonnes)
Annual Meat Production
2007-08 (in tonnes)
Percentage Increase (+)
or Decrease(-)
Percentage Contribution
to total Production as on 2007-08
1. 2. 3. 4. 5. Beef 21400 21563 0.76 58.77
Pork 9996 10074 0.78 27.46
Mutton 1030 1035 0.48 2.82
Chicken 3979 4019 1.00 10.95
Total 36405 36691 0.78 100.00
Source: Directorate of Animal Husbandry & Veterinary, Meghalaya
54

TABLE: 5.08 COMPARATIVE ANALYSIS SHOWING ESTIMATE WITH
EFFECT FROM THE YEAR 1995-96 TO 2007-08
Year Milk
production (‘000 tonnes)
Meat production
(‘000 tonnes)
Eggs production
(Million Nos.)
1. 2. 3. 4. 1995-96 55.4 26.5 77.0
1996-97 57.4 27.7 79.2
1997-98 59.1 28.8 81.4
1998-99 60.7 29.6 82.6
1999-2000 61.6 31.6 84.7
2000-2001 64.0 33.0 87.0
2001-2002 65.8 34.0 90.2
2002-2003 67.7 35.5 91.6
2003-2004 68.2 35.6 93.5
2004-2005 71.6 37.8 94.9
2005-2006 N.A 27.1 97.2
2006-2007 74.4 36.4 97.8
2007-2008 76.5 36.7 98.9
N.A.: Not available Source: Directorate of Animal Husbandry & Veterinary, Meghalaya
55

6. FOREST
TABLE: 6.01 AREA UNDER FOREST
(‘000 Hectares)
Year ReservedForest
Protected Forest
NationalPark
Un- Classed Total
1. 2. 3. 4. 5. 6. 1994-1995 71.31 1.24 26.75 850.30 949.60
1995-1996 71.27 1.24 26.75 850.30 949.56
1996-1997 71.27 1.24 26.75 850.30 949.56
1997-1998 71.27 1.24 26.75 850.30 949.56
1998-1999 71.27 1.24 26.75 850.30 949.56
1999-2000 71.27 1.24 26.75 850.30 949.56
2000-2001 71.27 1.24 26.75 850.30 949.56
2001-2002 71.27 1.24 26.75 850.30 949.56
2002-2003 71.27 1.24 26.75 850.30 949.56
2003-2004 71.27 1.24 26.75 850.30 949.56
Source: Principal Chief Conservator of Forest, Meghalaya
56
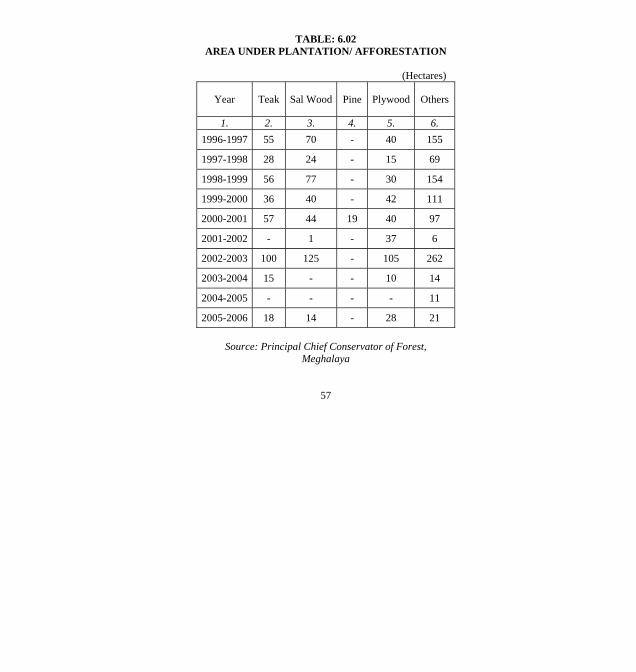
TABLE: 6.02 AREA UNDER PLANTATION/ AFFORESTATION
(Hectares)
Year Teak Sal Wood Pine Plywood Others
1. 2. 3. 4. 5. 6. 1996-1997 55 70 - 40 155
1997-1998 28 24 - 15 69
1998-1999 56 77 - 30 154
1999-2000 36 40 - 42 111
2000-2001 57 44 19 40 97
2001-2002 - 1 - 37 6
2002-2003 100 125 - 105 262
2003-2004 15 - - 10 14
2004-2005 - - - - 11
2005-2006 18 14 - 28 21
Source: Principal Chief Conservator of Forest, Meghalaya
57

TABLE: 6.03 PROGRESS OF FORESTRY SCHEMES
(Hectares)
Year Plantation of
quick growing species
Economic Plantation
Social Forestry
1. 2. 3. 4. 1996-1997 83 320 1943
1997-1998 15 218 75
1998-1999 57 317 100
1999-2000 11 229 630
2000-2001 44 257 630
2001-2002 - 44 810
2002-2003 64 528 640
2003-2004 - 39 -
2004-2005 11 - 3400
2005-2006 21 60 4000
Source: Principal Chief Conservator of Forest, Meghalaya
58

7. FISHERIES
TABLE: 7.01 FISH SEED DISTRIBUTION
(‘000 Nos.)
District 2003-2004 2004-2005 2005-2006 2006-2007 2007-2008
1. 2 3 4 5 6 East Khasi Hills 134.5 215.7 211.0 342.0 391
Ri-Bhoi 418.0 83.5 267.5 231.7 505
West Khasi Hills 450.0 367.0 352.0 142.0 442
Jaintia Hills 49.0 60.0 55.0 59.0 315
East Garo Hills 105.6 139.8 103.0 402.5 271
West Garo Hills 125.5 91.4 53.0 85.0 431
South Garo Hills - - 20.0 155.2 500
Meghalaya 1282.6 957.4 1061.5 1417.4 2854
Source: Directorate of Fisheries, Meghalaya
59

TABLE: 7.02 FISH SEED FARMS, PRODUCTION OF SPAWN & FRY FINGERLINGS
Particulars Units 2003-2004 2004-2005 2005-2006 2006-2007 2007-2008
1. 2. 3 4 5 6 7 Fish seed Farm Nos. 14 14 14 14 14
Nursery area Hect. 3.5 3.1 3.4 3.9 3.4
Bheel & Lakes Hect. 414.8 416.8 414.8 399.6 399.6 Total water area for composite fish farming
Hect. 369.4 115.9 130.5 277.7 404
Fry Fingerlings Millions 0.9 0.9 0.8 1.0 0.9 Inland fish production both captured & cultured fisheries
‘000 tonnes 5.1 5.6 5.5 5.0 4.0
Source: Directorate of Fisheries, Meghalaya
60
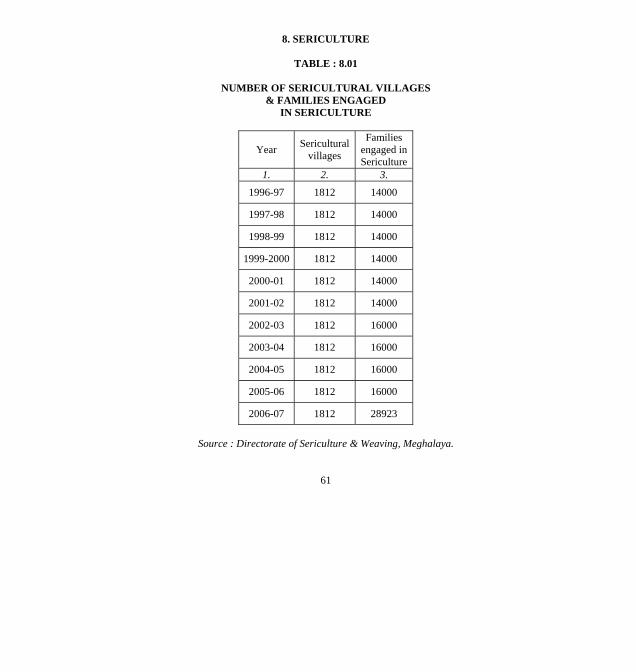
8. SERICULTURE
TABLE : 8.01
NUMBER OF SERICULTURAL VILLAGES & FAMILIES ENGAGED
IN SERICULTURE
Year Sericultural villages
Families engaged in Sericulture
1. 2. 3.
1996-97 1812 14000
1997-98 1812 14000
1998-99 1812 14000
1999-2000 1812 14000
2000-01 1812 14000
2001-02 1812 14000
2002-03 1812 16000
2003-04 1812 16000
2004-05 1812 16000
2005-06 1812 16000
2006-07 1812 28923
Source : Directorate of Sericulture & Weaving, Meghalaya.
61

TABLE : 8.02
NUMBER OF SERICULTURAL FARMS, ERI SEED GRAINAGE & SILK REELING UNITS
Particulars 2001-02 2002-03 2003-04 2004-05 2005-06 2006-07
1. 2 3 4 5 6 7 Sericultural Farms
a. Nos. 6 6 6 6 6 6
b. Area (Hect.) 130.00 130.00 130.00 130.00 130.00 130.00
Eri-seed grainage
a. Nos. 4 4 4 4 4 4
b. Area (Hect.) 55 42 42 42 42 42
Silk Reeling Units
a. Nos. (1) Mulberry 4 4 4 4 4 4
(2) Muga 4 4 4 4 4 4 b. Quantity of raw silk produced (Kgs.) 2391 13032 21762 13032 21762 13032
Source : Directorate of Sericulture & Weaving, Meghalaya.
62

TABLE : 8.03 PRODUCTION OF COCOONS
Year/ District
Mulberry (‘000 Kgs.)
Eri (‘000 Kgs.)
Muga (Lakh Nos.)
1. 2. 3. 4. 2000-01 22.55 322.15 127.73
2001-02 17.75 373.79 182.19
2002-03 18.05 360.75 216.96
2003-04 21.43 422.55 289.91
2004-05 21.77 341.29 253.70
2005-06 19.96 295.25 269.05
2006-07 10.62 251.84 302.20
2007-08 13.68 425.33 432.15
Jaintia Hills 3.21 54.00 -
East Khasi Hills 0.65 - -
Ri-Bhoi 0.14 217.03 1.85
West Khasi Hills 0.27 13.15 12.91
East Garo Hills 5.59 52.33 137.08
West Garo Hills 3.82 68.97 193.91
South Garo Hills - 19.85 86.40
Source : Directorate of Sericulture & Weaving, Meghalaya.
63

TABLE : 8.04 NUMBER OF WEAVING TRAINING CENTRES, WEAVING
DEMONSTRATION CENTRES, HANDLOOM DEMONSTRATION-CUM-PRODUCTION CENTRES
Year/ District
Weaving Training Centres
Weaving Demonstration
Centres
Handloom Demonstration cum-Production
Centres
Handloom Production
Centres
1. 2. 3. 4. 5.
2001-02 24 21 24 8
2002-03 24 21 24 8
2003-04 24 21 24 8
2004-05 24 21 24 8
2005-06 24 21 24 8
2006-07 24 21 24 8
2007-08 24 21 24 8
Jaintia Hills 1 1 1 1
East Khasi Hills 4 - 4 1
Ri-Bhoi 2 3 2 1
West Khasi Hills 2 2 2 -
East Garo Hills 3 7 3 3
West Garo Hills 7 7 7 2
South Garo Hills 5 1 5 -
Source : Directorate of Sericulture & Weaving, Meghalaya.
64
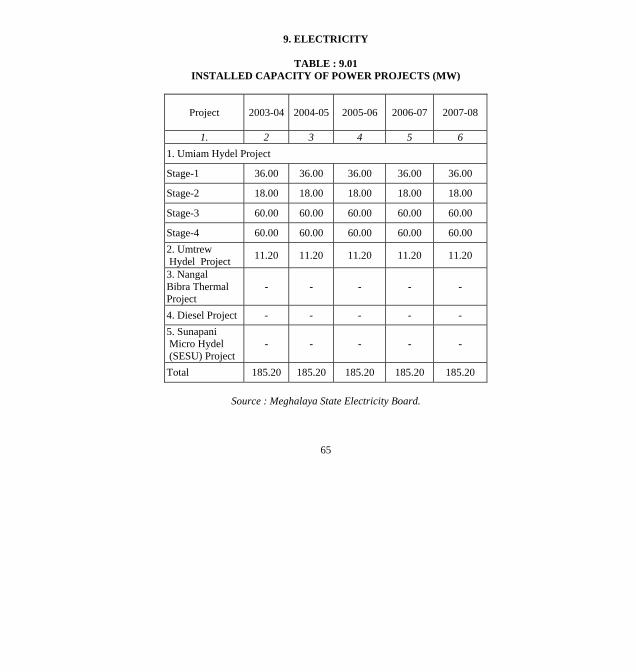
9. ELECTRICITY
TABLE : 9.01 INSTALLED CAPACITY OF POWER PROJECTS (MW)
Project 2003-04 2004-05 2005-06 2006-07 2007-08
1. 2 3 4 5 6 1. Umiam Hydel Project
Stage-1 36.00 36.00 36.00 36.00 36.00
Stage-2 18.00 18.00 18.00 18.00 18.00
Stage-3 60.00 60.00 60.00 60.00 60.00
Stage-4 60.00 60.00 60.00 60.00 60.00 2. Umtrew Hydel Project 11.20 11.20 11.20 11.20 11.20
3. Nangal Bibra Thermal Project
- - - - -
4. Diesel Project - - - - - 5. Sunapani Micro Hydel (SESU) Project
- - - - -
Total 185.20 185.20 185.20 185.20 185.20
Source : Meghalaya State Electricity Board.
65

TABLE : 9.02 GENERATION OF ELECTRICITY
Year Generation (MKWH)
1. 2.
1997-98 595.61
1998-99 555.79
1999-2000 633.54
2000-01 657.86
2001-02 675.59
2002-03 526.97
2003-04 526.97
2004-05 637.65
2005-06 514.44
2006-07 389.09
2007-08 663.06
Source : Meghalaya State Electricity Board.
66

TABLE : 9.03 SALE OF ELECTRICITY BY CLASS OF CONSUMERS
IN MEGHALAYA (MKWH)
Projects 2004-05 2005-06 2006-07 2007-08
1. 2 3 4 5 1. Domestic 171.58 163.39 199.57 211.65
2. Commercial 35.48 35.66 40.09 39.16
3. Industrial 490.82 396.28 394.36 507.67
4. Public lighting 1.48 1.6 6.48 1.50 5. Irrigation and Agriculture 0.93 0.32 0.42 0.60
6. Public water works & sewage pumping 24.63 23.07 25.58 24.95
7. Bulk supply (including licencess) 86.04 68.88 62.40 65.02
8. General purposes 6.86 9. Board’s office & Employees consumption 35.00
43.61 49.58 42.71
10. Total sale in the State 852.82 732.81 778.48 893.26
11. Total sale outside the state (Extra state consumer)
7.4 166.42 54.26 164.83
12. Grand total (inside+outside) 860.22 899.23 832.74 1058.09
13. Per capita consumption (KWH) 367.75 317.77 337.58 387.36
Source : Meghalaya State Electricity Board.
67
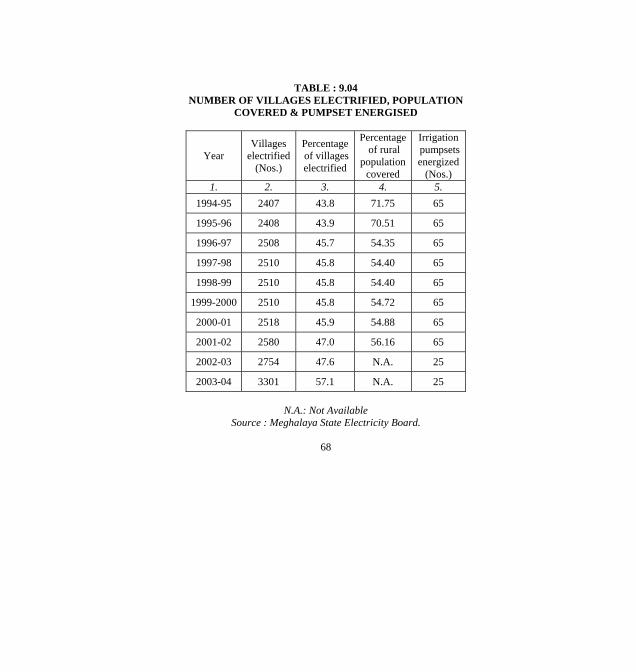
TABLE : 9.04 NUMBER OF VILLAGES ELECTRIFIED, POPULATION
COVERED & PUMPSET ENERGISED
Year Villages
electrified (Nos.)
Percentage of villages electrified
Percentage of rural
population covered
Irrigation pumpsets energized
(Nos.) 1. 2. 3. 4. 5.
1994-95 2407 43.8 71.75 65
1995-96 2408 43.9 70.51 65
1996-97 2508 45.7 54.35 65
1997-98 2510 45.8 54.40 65
1998-99 2510 45.8 54.40 65
1999-2000 2510 45.8 54.72 65
2000-01 2518 45.9 54.88 65
2001-02 2580 47.0 56.16 65
2002-03 2754 47.6 N.A. 25
2003-04 3301 57.1 N.A. 25
N.A.: Not Available Source : Meghalaya State Electricity Board.
68

10. INDUSTRY AND MINING
TABLE: 10.01 EMPLOYMENT IN REGISTERED FACTORIES
Year No. of
registered factories
Employees
1. 2. 3. 2000 118 7071
2001 118 7071
2002 118 7071
2003 118 7071
2004 118 7071
2005 118 7071
2006 118 7071
2007 118 7071
Source: Chief Inspector of Boilers & Factories, Meghalaya
69

TABLE: 10.02 EMPLOYMENT IN SMALL SCALE INDUSTRIES
REGISTERED WITH THE DIRECTORATE OF INDUSTRIES
Increase in the number of
persons employed
Year/ District
No. of small scale industries
No. of persons
employed Nos.
1. 2. 3. 4. 1997-98 3008 17259 1155
1998-99 3270 18585 1326
1999-2000 3530 20086 1501
2000-2001 3803 21416 1330
2001-2002 4070 23052 1636
2002-2003 4341 24332 1280
2003-2004 4664 26237 1905
2004-2005 5132 28894 2657
2005-2006 5591 31467 2573
2006-2007 6107 34158 2691
2007-2008 6511 36193 2035 Contd…
70
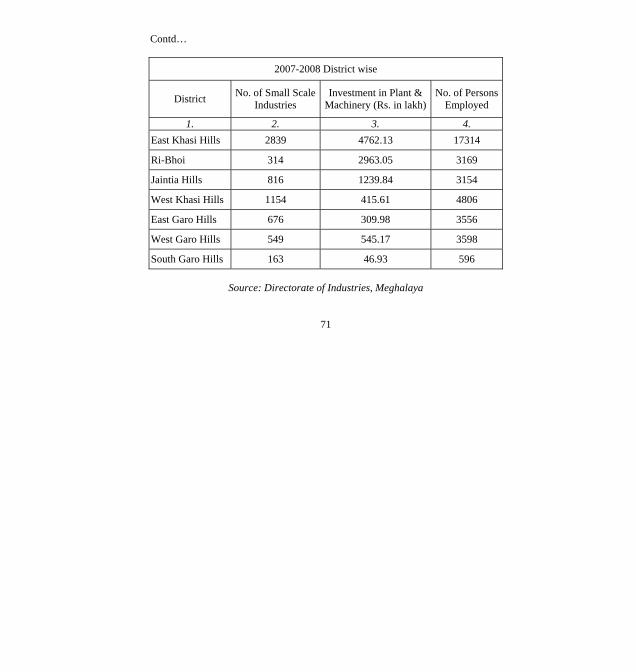
Contd…
2007-2008 District wise
District No. of Small ScaleIndustries
Investment in Plant & Machinery (Rs. in lakh)
No. of Persons Employed
1. 2. 3. 4. East Khasi Hills 2839 4762.13 17314
Ri-Bhoi 314 2963.05 3169
Jaintia Hills 816 1239.84 3154
West Khasi Hills 1154 415.61 4806
East Garo Hills 676 309.98 3556
West Garo Hills 549 545.17 3598
South Garo Hills 163 46.93 596
Source: Directorate of Industries, Meghalaya
71
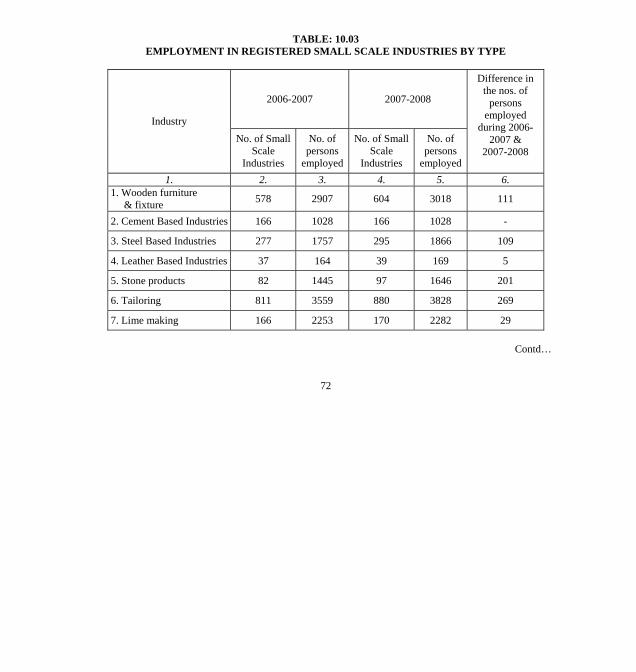
TABLE: 10.03 EMPLOYMENT IN REGISTERED SMALL SCALE INDUSTRIES BY TYPE
2006-2007 2007-2008
Industry No. of Small
Scale Industries
No. of persons
employed
No. of Small Scale
Industries
No. of persons
employed
Difference in the nos. of
persons employed
during 2006-2007 &
2007-2008
1. 2. 3. 4. 5. 6. 1. Wooden furniture & fixture 578 2907 604 3018 111
2. Cement Based Industries 166 1028 166 1028 -
3. Steel Based Industries 277 1757 295 1866 109
4. Leather Based Industries 37 164 39 169 5
5. Stone products 82 1445 97 1646 201
6. Tailoring 811 3559 880 3828 269
7. Lime making 166 2253 170 2282 29
Contd…
72
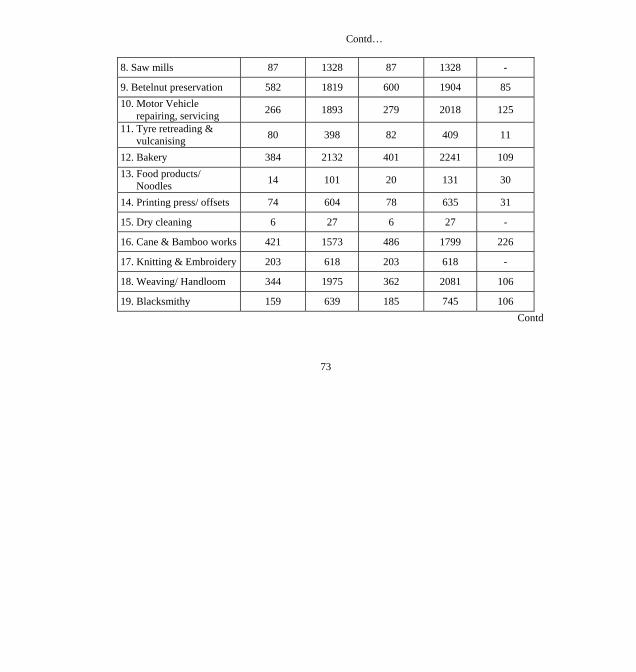
Contd…
8. Saw mills 87 1328 87 1328 -
9. Betelnut preservation 582 1819 600 1904 85 10. Motor Vehicle repairing, servicing 266 1893 279 2018 125
11. Tyre retreading & vulcanising 80 398 82 409 11
12. Bakery 384 2132 401 2241 109 13. Food products/ Noodles 14 101 20 131 30
14. Printing press/ offsets 74 604 78 635 31
15. Dry cleaning 6 27 6 27 -
16. Cane & Bamboo works 421 1573 486 1799 226
17. Knitting & Embroidery 203 618 203 618 -
18. Weaving/ Handloom 344 1975 362 2081 106
19. Blacksmithy 159 639 185 745 106 Contd
73

Contd…
20. Computer data processing 25 136 26 142 6
21. Atta chakki, Rice mill, Flour mill 260 1142 265 1166 24
22. Satellite Cable T.V. Network 25 206 25 206 -
23. Handicraft 53 202 53 202 -
24. Others 1007 6282 1100 6704 422
Total 6107 34158 6511 36193 2035
Source: Directorate of Industries, Meghalaya
74
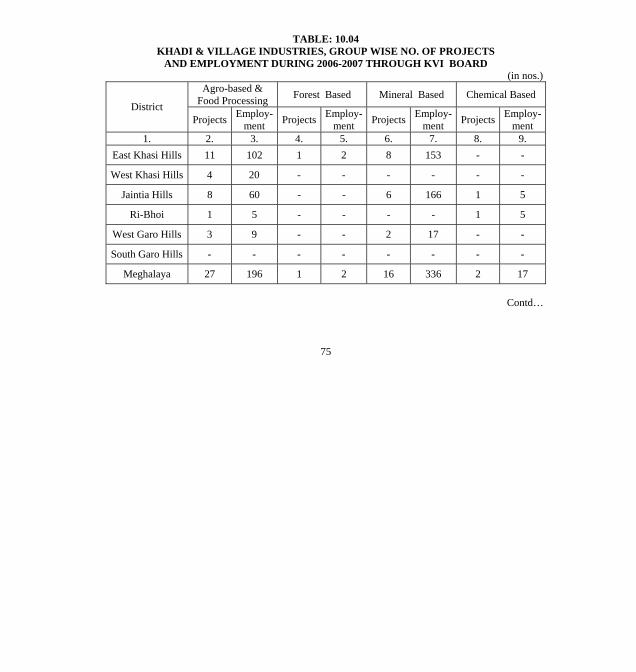
TABLE: 10.04 KHADI & VILLAGE INDUSTRIES, GROUP WISE NO. OF PROJECTS
AND EMPLOYMENT DURING 2006-2007 THROUGH KVI BOARD (in nos.)
Agro-based & Food Processing Forest Based Mineral Based Chemical Based
District Projects Employ-
ment Projects Employ-ment Projects Employ-
ment Projects Employ- ment
1. 2. 3. 4. 5. 6. 7. 8. 9. East Khasi Hills 11 102 1 2 8 153 - -
West Khasi Hills 4 20 - - - - - -
Jaintia Hills 8 60 - - 6 166 1 5
Ri-Bhoi 1 5 - - - - 1 5
West Garo Hills 3 9 - - 2 17 - -
South Garo Hills - - - - - - - -
Meghalaya 27 196 1 2 16 336 2 17
Contd…
75

Contd…
Rural Engineering & Bio-Tech Service/ Textile Total
District Projects Employ-
ment Projects Employ-ment Projects Employ-
ment 1. 10 11. 12. 13. 14. 15.
East Khasi Hills 3 39 21 172 44 468
West Khasi Hills 1 2 5 15 10 37
Jaintia Hills 1 3 16 246 32 480
Ri-Bhoi - - 6 33 8 50
West Garo Hills - - 1 1 6 27
South Garo Hills - - 1 1 1 1
Meghalaya 5 44 50 468 101 1063
Source: Meghalaya Khadi & Village Industries Board, Shillong
76

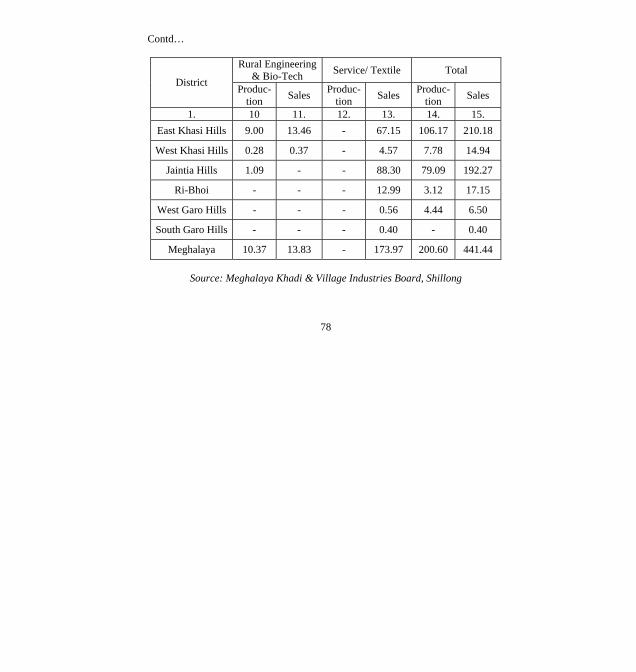
TABLE: 10.05 KHADI & VILLAGE INDUSTRIES, GROUP WISE PRODUCTION
AND SALES DURING 2006-2007 THROUGH KVI BOARD (Rs. in lakh)
Agro-based & Food Processing Forest Based Mineral Based Chemical Based
District Produc- tion Sales Produc-
tion Sales Produc-tion Sales Produc-
tion Sales
1. 2. 3. 4. 5. 6. 7. 8. 9. East Khasi Hills 45.47 60.64 0.63 0.84 46.30 61.73 4.77 6.36
West Khasi Hills 7.50 10.00 - - - - - -
Jaintia Hills 19.50 26.00 - - 56.93 75.88 1.57 2.09
Ri-Bhoi 3.12 4.16 - - - - - -
West Garo Hills 2.24 3.00 - - 2.20 2.94 - -
South Garo Hills - - - - - - - -
Meghalaya 77.83 103.80 0.63 0.84 105.43 140.55 6.34 8.45
Contd…
77
Contd…
Rural Engineering & Bio-Tech Service/ Textile Total
District Produc-tion Sales Produc-
tion Sales Produc-tion Sales
1. 10 11. 12. 13. 14. 15. East Khasi Hills 9.00 13.46 - 67.15 106.17 210.18
West Khasi Hills 0.28 0.37 - 4.57 7.78 14.94
Jaintia Hills 1.09 - - 88.30 79.09 192.27
Ri-Bhoi - - - 12.99 3.12 17.15
West Garo Hills - - - 0.56 4.44 6.50
South Garo Hills - - - 0.40 - 0.40
Meghalaya 10.37 13.83 - 173.97 200.60 441.44
Source: Meghalaya Khadi & Village Industries Board, Shillong
78

TABLE: 10.06 PRODUCTION OF CEMENT FROM MAWMLUH CHERRA
CEMENT LIMITED
Year
Production (‘000 MT)
Employment(Nos.)
1. 2. 3. 1995 124 653
1996 114 686
1997 99 705
1998 103 656
1999 114 -
2000 116 705
2001 113 716
2002 103 719
2003 102 695
2004 95 673
2005 100 658
2006 101 640
2007 32 639
Source: Mawmluh Cherra Cement Limited
79
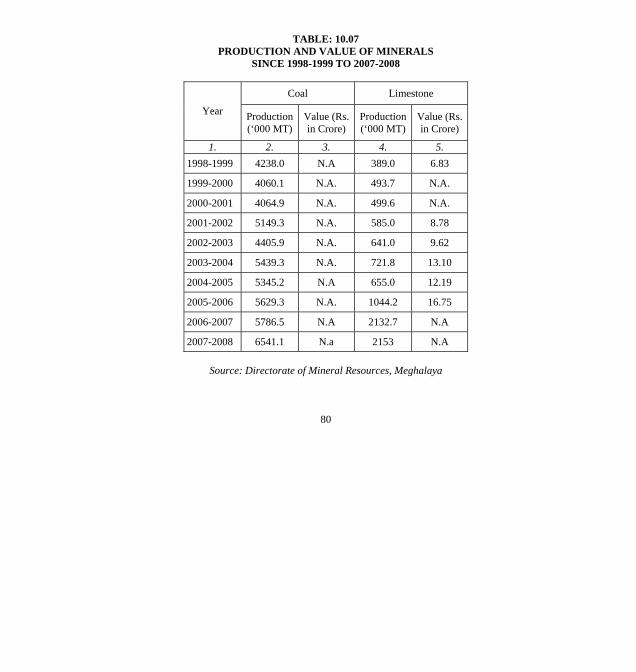
TABLE: 10.07 PRODUCTION AND VALUE OF MINERALS
SINCE 1998-1999 TO 2007-2008
Coal Limestone
Year Production (‘000 MT)
Value (Rs. in Crore)
Production (‘000 MT)
Value (Rs. in Crore)
1. 2. 3. 4. 5. 1998-1999 4238.0 N.A 389.0 6.83
1999-2000 4060.1 N.A. 493.7 N.A.
2000-2001 4064.9 N.A. 499.6 N.A.
2001-2002 5149.3 N.A. 585.0 8.78
2002-2003 4405.9 N.A. 641.0 9.62
2003-2004 5439.3 N.A. 721.8 13.10
2004-2005 5345.2 N.A 655.0 12.19
2005-2006 5629.3 N.A. 1044.2 16.75
2006-2007 5786.5 N.A 2132.7 N.A
2007-2008 6541.1 N.a 2153 N.A
Source: Directorate of Mineral Resources, Meghalaya
80

TABLE: 10.08 GROWTH OF JOINT STOCK COMPANIES
Companies at work as on 31st March Year
Public Private Total
1. 2. 3. 4. 1996 39 163 202
1997 43 173 216
1998 46 182 228
1999 48 192 240
2000 57 226 283
2001 60 271 331
2002 62 274 336
2003 66 305 371
2004 72 355 427
2005 77 382 459
2006 119 512 631
2007 119 512 631
Source: Registrar of Companies, Shillong
81

11. CO-OPERATION
TABLE: 11.01 GROWTH OF CO-OPERATIVE SOCIETIES
Year Societies(Nos.)
Membership(‘000 Nos.)
Share Capital(Rs. in Lakh)
Working Capital(Rs. in Lakh)
1. 2. 3. 4. 5. 1999-2000 908 151 3197.57 33402.47
2000-2001 997 159 4070.85 30624.13
2001-2002 1000 165 3029.87 31733.51
2002-2003 1018 150 4674.53 56790.97
2003-2004 1042 150 49407.97 4610.30
2004-2005 1118 151 954.82 5660.27
2005-2006 1153 167 3943.92 56667.77
2006-2007 1192 178 14932.57 15838.37
2007-2008 1239 181 23761.31 20748.50
Source: Registrar of Co-operative Societies, Meghalaya
82

TABLE: 11.02 STATISTICS RELATING TO THE PRIMARY
AGRICULTURAL CREDIT SOCIETIES
Items Unit 2004-2005 2005-2006 2006-2007 2007-2008
1. 2. 3. 4. 5. 6. 1. Number of Societies Nos. 179 179 179 179
2. Total members “ 91303 94314 93588 98631 3. Paid up share capital
Rs. inLakh 325.17 327.60 462.12 431.74
4. Deposits “ 99.16 112.47 116.47 114.68
5. Working Capital “ 156.61 1308.26 1812.79 1766.79
6. Loan issued during the year
a. Short term “ 179.73 233.95 303.04 140.23
b. Medium term “ 134.70 151.13 22.58 23.46
7. Loan outstanding “ 922.10 730.06 1114.96 1029.92
8. Sales turnover during the year a. Agriculture produce “ 83.17 56.26 73.80 74.03
b. Consumer goods “ 35.04 90.41 89.67 114.34
c. Others “ 22.93 91.69 70.12 62.65
Source: Registrar of Co-operative Societies, Meghalaya
83
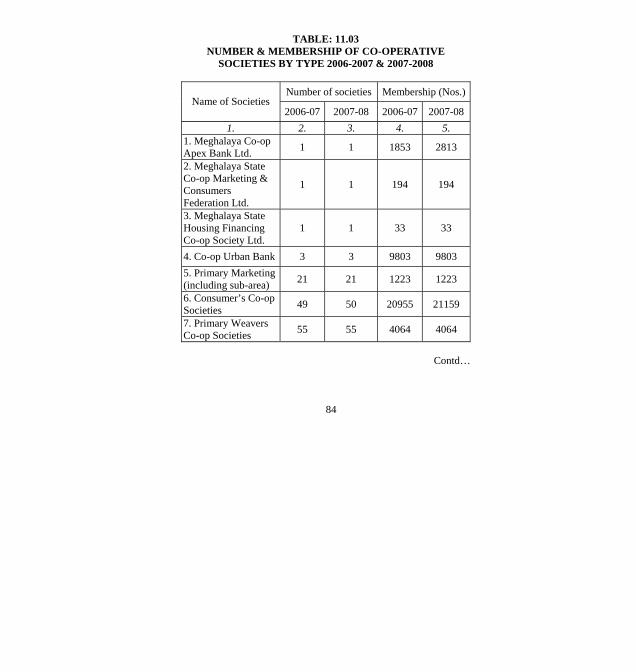
TABLE: 11.03 NUMBER & MEMBERSHIP OF CO-OPERATIVE
SOCIETIES BY TYPE 2006-2007 & 2007-2008
Number of societies Membership (Nos.)Name of Societies
2006-07 2007-08 2006-07 2007-08 1. 2. 3. 4. 5.
1. Meghalaya Co-op Apex Bank Ltd. 1 1 1853 2813
2. Meghalaya State Co-op Marketing & Consumers Federation Ltd.
1 1 194 194
3. Meghalaya State Housing Financing Co-op Society Ltd.
1 1 33 33
4. Co-op Urban Bank 3 3 9803 9803 5. Primary Marketing (including sub-area) 21 21 1223 1223
6. Consumer’s Co-op Societies 49 50 20955 21159
7. Primary Weavers Co-op Societies 55 55 4064 4064
Contd…
84
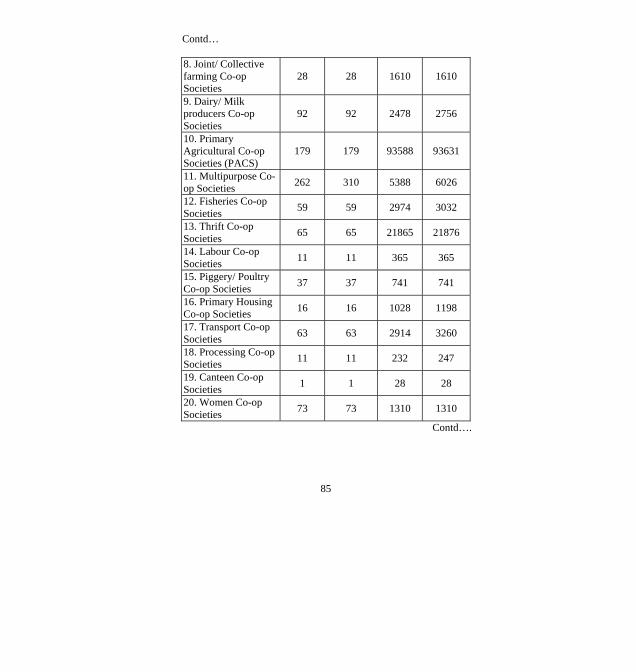
Contd…
8. Joint/ Collective farming Co-op Societies
28 28 1610 1610
9. Dairy/ Milk producers Co-op Societies
92 92 2478 2756
10. Primary Agricultural Co-op Societies (PACS)
179 179 93588 93631
11. Multipurpose Co-op Societies 262 310 5388 6026
12. Fisheries Co-op Societies 59 59 2974 3032
13. Thrift Co-op Societies 65 65 21865 21876
14. Labour Co-op Societies 11 11 365 365
15. Piggery/ Poultry Co-op Societies 37 37 741 741
16. Primary Housing Co-op Societies 16 16 1028 1198
17. Transport Co-op Societies 63 63 2914 3260
18. Processing Co-op Societies 11 11 232 247
19. Canteen Co-op Societies 1 1 28 28
20. Women Co-op Societies 73 73 1310 1310
Contd….
85

Contd…
21. Industrial Co-op Societies 94 94 2200 2647
22. Other types 70 68 2723 2667
Total 1192 1239 177569 180683
Source: Registrar of Co-operative Societies, Meghalaya
86

12. ROADS
TABLE : 12.01 ROAD LENGTH MAINTAINED BY PUBLIC
WORKS DEPARTMENT
Year Surfaced (Kms.)
Unsurfaced (Kms.)
Total (Kms.)
Road Density per 100 Sq.Km.
1. 2. 3. 4. 5. 1999-2000 3284 3833 7117 31.73
2000-01 3413 3915 7328 32.67
2001-02 3523 4075 7598 33.88
2002-03 4280 3210 7490 33.39
2003-04 4498 3184 7682 34.25
2004-05 4614 3263 7877 35.12
2005-06 4721 3257 7978 35.57
2006-07 5908 2051 7960 35.49
2007-08 5983 2181 8164 36.39
Source : P.W.D. (R&B), Meghalaya.
87
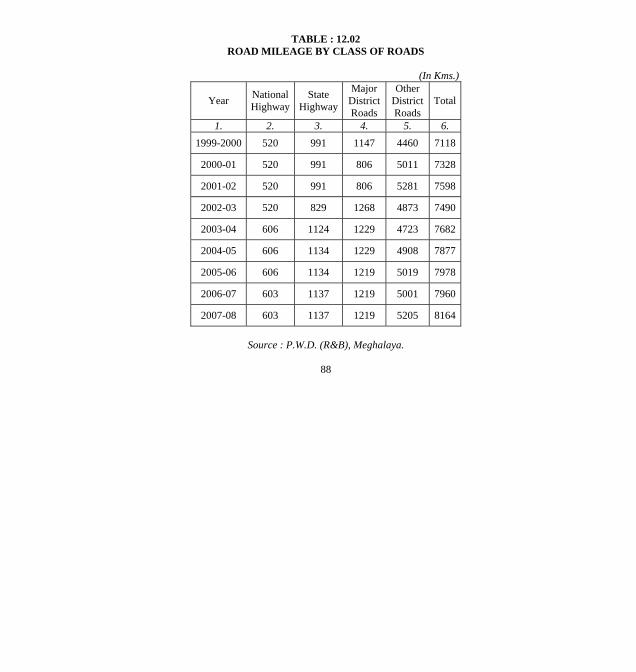
TABLE : 12.02 ROAD MILEAGE BY CLASS OF ROADS
(In Kms.)
Year National Highway
State Highway
Major District Roads
Other District Roads
Total
1. 2. 3. 4. 5. 6. 1999-2000 520 991 1147 4460 7118
2000-01 520 991 806 5011 7328
2001-02 520 991 806 5281 7598
2002-03 520 829 1268 4873 7490
2003-04 606 1124 1229 4723 7682
2004-05 606 1134 1229 4908 7877
2005-06 606 1134 1219 5019 7978
2006-07 603 1137 1219 5001 7960
2007-08 603 1137 1219 5205 8164
Source : P.W.D. (R&B), Meghalaya.
88

TABLE: 12.03 ROAD ACCIDENT & NUMBER OF PERSONS
KILLED & INJURED
Year Accidents Persons Killed
Persons Injured
1. 2. 3. 4. 1996 360 130 515
1997 382 204 753
1998 407 138 383
1999 286 161 446
2000 392 145 426
2001 593 176 454
2002 172 104 303
2003 617 168 523
2004 433 135 363
2005 368 126 543
2006 435 165 379
Source: Special Superintendent of Police, CID Meghalaya
89
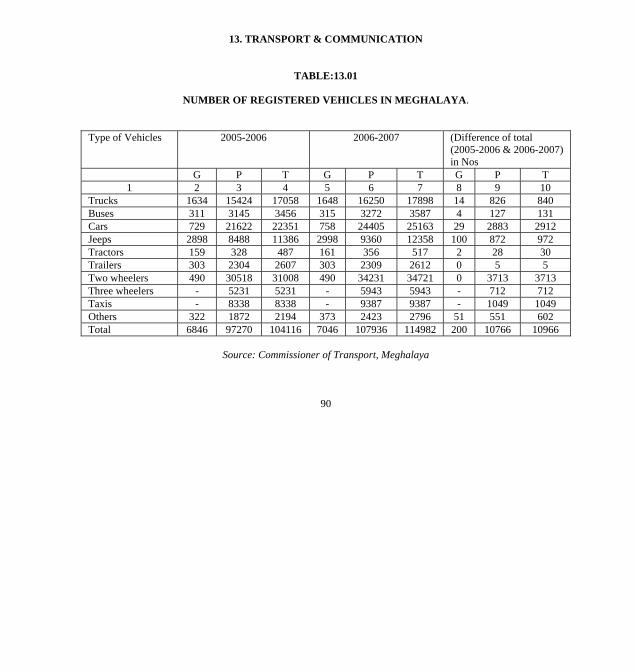
13. TRANSPORT & COMMUNICATION
TABLE:13.01
NUMBER OF REGISTERED VEHICLES IN MEGHALAYA.
Type of Vehicles 2005-2006 2006-2007 (Difference of total (2005-2006 & 2006-2007) in Nos
G P T G P T G P T 1 2 3 4 5 6 7 8 9 10
Trucks 1634 15424 17058 1648 16250 17898 14 826 840 Buses 311 3145 3456 315 3272 3587 4 127 131 Cars 729 21622 22351 758 24405 25163 29 2883 2912 Jeeps 2898 8488 11386 2998 9360 12358 100 872 972 Tractors 159 328 487 161 356 517 2 28 30 Trailers 303 2304 2607 303 2309 2612 0 5 5 Two wheelers 490 30518 31008 490 34231 34721 0 3713 3713 Three wheelers - 5231 5231 - 5943 5943 - 712 712 Taxis - 8338 8338 - 9387 9387 - 1049 1049 Others 322 1872 2194 373 2423 2796 51 551 602 Total 6846 97270 104116 7046 107936 114982 200 10766 10966
Source: Commissioner of Transport, Meghalaya
90

TABLE: 13.02 DISTRICTWISE NUMBER OF MOTOR VEHICLES
REGISTERED IN MEGHALAYA 2006-2007
District Type of vehicles Trucks Buses Cars Jeeps
1. 2. 3. 4. 5. 6. Govt. 1559 281 714 2661
Pvt. 7324 1636 17385 5638 East Khasi Hills
Total 8883 1917 18099 8299
Govt. 2 6 6 46
Pvt. 1135 103 1865 760 Ri-Bhoi
Total 1137 109 1871 806
Govt. 0 0 2 21
Pvt. 707 181 371 184 West Khasi Hills
Total 707 181 373 205
Govt. 27 21 8 82
Pvt. 4151 366 2246 928 Jaintia Hills
Total 4178 387 2254 1010
Govt. 11 1 7 54
Pvt. 1002 133 736 388 East Garo Hills
Total 1013 134 743 442
Govt. 42 6 19 110
Pvt. 1314 816 1514 1390 West Garo Hills
Total 1356 822 1533 1500
Contd…
91

Contd…
Govt. 7 0 2 24
Pvt. 617 37 288 72 South Garo Hills
Total 624 37 290 96
Govt. 1648 315 758 2998
Pvt. 16250 3272 24405 9360 Meghalaya
Total 17898 3587 25163 12358 Contd…
92

Contd…
District Type of vehicles Tractors Trailers Two
Wheelers 1. 2. 3. 4. 5.
Govt. 62 212 453
Pvt. 239 1951 16145 East Khasi Hills
Total 301 2163 16598
Govt. 2 3 4
Pvt. 27 67 1515 Ri-Bhoi
Total 29 70 1519
Govt. 3 8 1
Pvt. 14 25 322 West Khasi Hills
Total 17 33 323
Govt. 14 18 11
Pvt. 46 155 1157 Jaintia Hills
Total 60 173 1168
Govt. 2 4 0
Pvt. 6 12 5906 East Garo Hills
Total 8 16 5906
Govt. 78 58 9
Pvt. 24 97 7039 West Garo Hills
Total 102 155 7048
Contd…
93
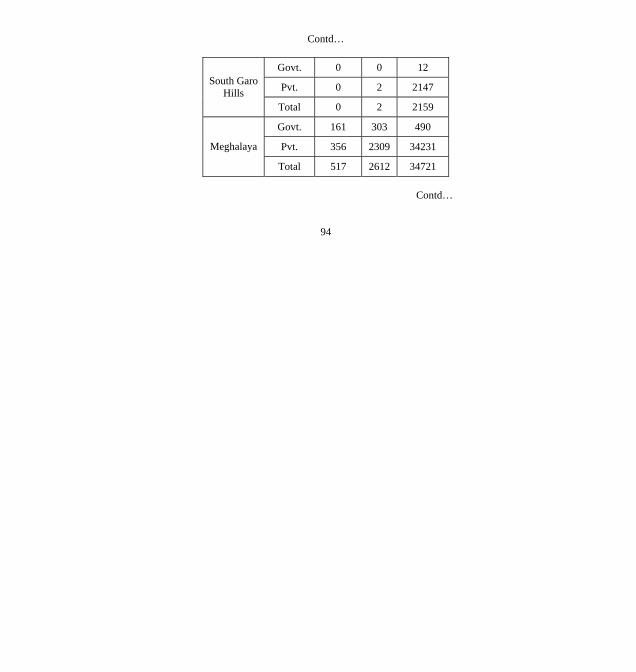
Contd…
Govt. 0 0 12
Pvt. 0 2 2147 South Garo Hills
Total 0 2 2159
Govt. 161 303 490
Pvt. 356 2309 34231 Meghalaya
Total 517 2612 34721 Contd…
94
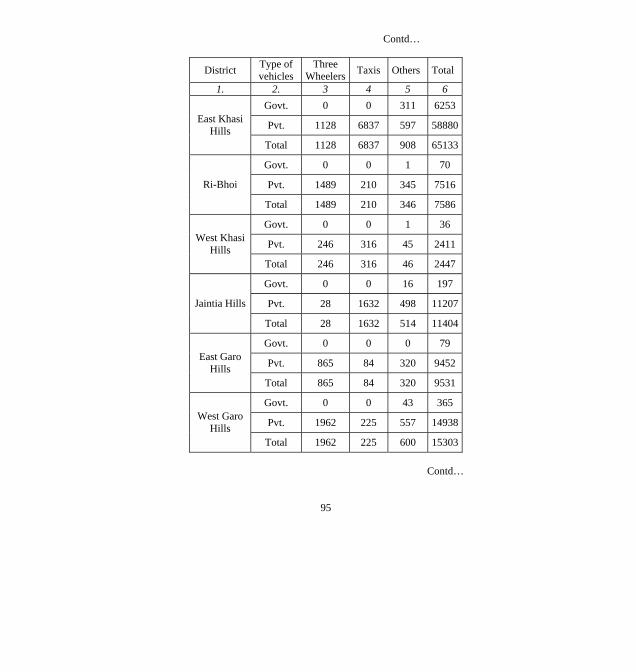
Contd…
District Type of vehicles
Three Wheelers Taxis Others Total
1. 2. 3 4 5 6 Govt. 0 0 311 6253
Pvt. 1128 6837 597 58880East Khasi Hills
Total 1128 6837 908 65133
Govt. 0 0 1 70
Pvt. 1489 210 345 7516 Ri-Bhoi
Total 1489 210 346 7586
Govt. 0 0 1 36
Pvt. 246 316 45 2411 West Khasi Hills
Total 246 316 46 2447
Govt. 0 0 16 197
Pvt. 28 1632 498 11207Jaintia Hills
Total 28 1632 514 11404
Govt. 0 0 0 79
Pvt. 865 84 320 9452 East Garo Hills
Total 865 84 320 9531
Govt. 0 0 43 365
Pvt. 1962 225 557 14938West Garo Hills
Total 1962 225 600 15303
Contd…
95

Contd…
Govt. 0 0 1 46
Pvt. 225 83 61 3532 South Garo Hills
Total 225 83 62 3578
Govt. 0 0 373 7046
Pvt. 5943 9387 2423 107936Meghalaya
Total 5943 9387 2796 114982
Source: Commissioner of Transport, Meghalaya
96
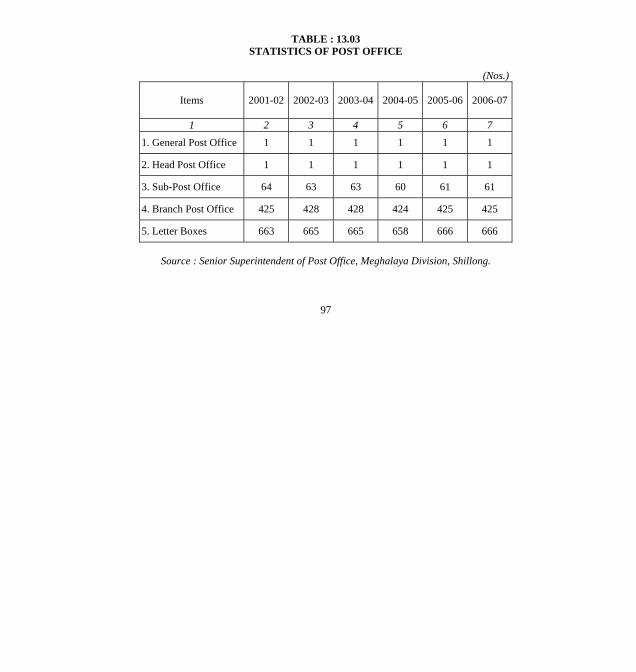
TABLE : 13.03 STATISTICS OF POST OFFICE
(Nos.)
Items 2001-02 2002-03 2003-04 2004-05 2005-06 2006-07
1 2 3 4 5 6 7
1. General Post Office 1 1 1 1 1 1
2. Head Post Office 1 1 1 1 1 1
3. Sub-Post Office 64 63 63 60 61 61
4. Branch Post Office 425 428 428 424 425 425
5. Letter Boxes 663 665 665 658 666 666
Source : Senior Superintendent of Post Office, Meghalaya Division, Shillong.
97

TABLE : 13.04 NUMBER OF TELEPHONE EXCHANGES, PUBLIC CALL OFFICES & NUMBER OF TELEPHONE CONNECTIONS
(Nos.)
Year Telephone Exchanges
Public Call Offices
Telephone Connections
1. 2. 3. 4.
1996-97 40 178 19616
1997-98 45 275 23630
1998-99 54 383 29944
1999-2000 61 512 38146
2000-01 74 655 46283
2001-02 78 867 52490**
2002-03 97 1105 60410
2003-04 100 1496 67006
2004-05 86 1932 65645
2005-06 86 2349 66285
2006-07 113 2676 68951
2007-08 118 3124 67766
** - Including 106 WLL Connection
Source : Assistant Director, Office of the T.D.M., Shillong.
98
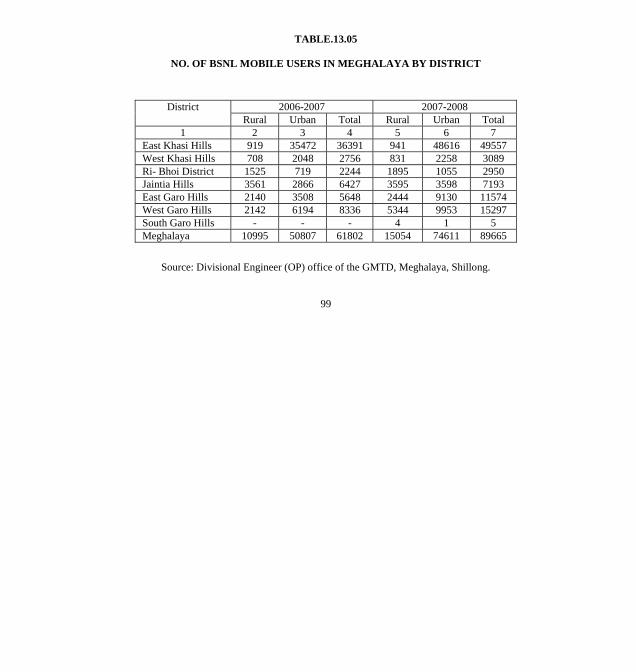
TABLE.13.05
NO. OF BSNL MOBILE USERS IN MEGHALAYA BY DISTRICT
2006-2007 2007-2008 District Rural Urban Total Rural Urban Total
1 2 3 4 5 6 7 East Khasi Hills 919 35472 36391 941 48616 49557 West Khasi Hills 708 2048 2756 831 2258 3089 Ri- Bhoi District 1525 719 2244 1895 1055 2950 Jaintia Hills 3561 2866 6427 3595 3598 7193 East Garo Hills 2140 3508 5648 2444 9130 11574 West Garo Hills 2142 6194 8336 5344 9953 15297 South Garo Hills - - - 4 1 5 Meghalaya 10995 50807 61802 15054 74611 89665
Source: Divisional Engineer (OP) office of the GMTD, Meghalaya, Shillong.
99
14. LABOUR & EMPLOYMENT
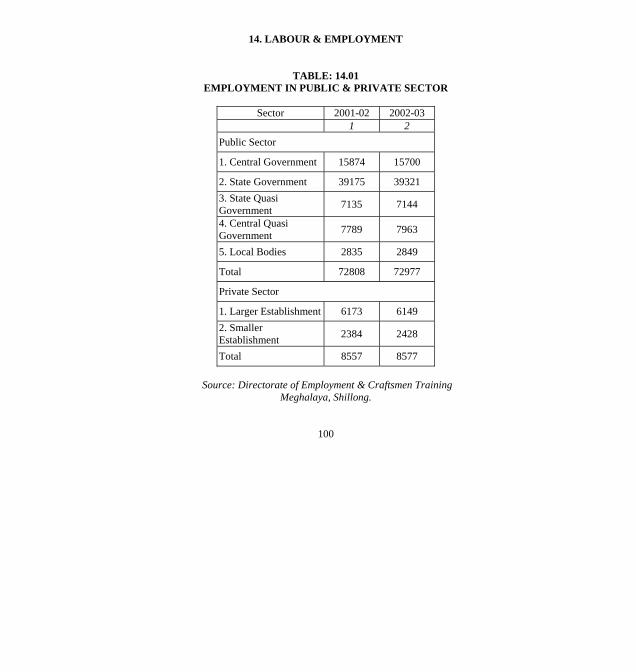
TABLE: 14.01 EMPLOYMENT IN PUBLIC & PRIVATE SECTOR
Sector 2001-02 2002-03
1 2 Public Sector
1. Central Government 15874 15700
2. State Government 39175 39321 3. State Quasi Government 7135 7144
4. Central Quasi Government 7789 7963
5. Local Bodies 2835 2849
Total 72808 72977
Private Sector
1. Larger Establishment 6173 6149 2. Smaller Establishment 2384 2428
Total 8557 8577
Source: Directorate of Employment & Craftsmen Training Meghalaya, Shillong.
100
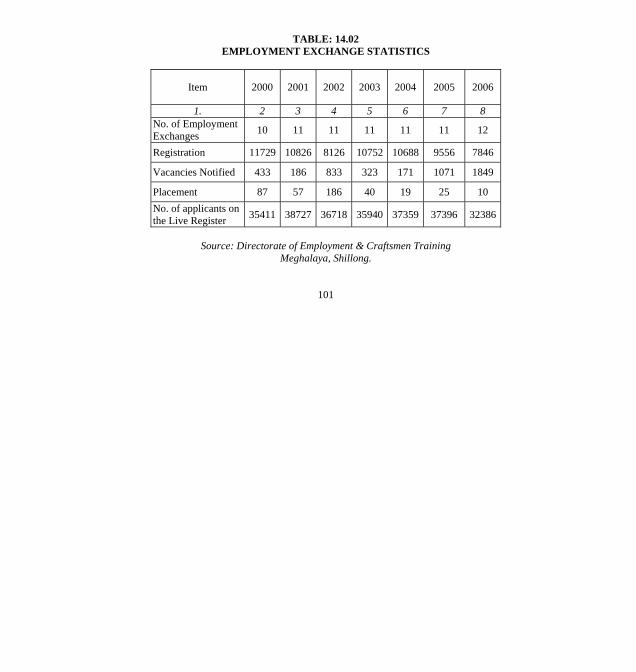
TABLE: 14.02 EMPLOYMENT EXCHANGE STATISTICS
Item 2000 2001 2002 2003 2004 2005 2006
1. 2 3 4 5 6 7 8 No. of Employment Exchanges 10 11 11 11 11 11 12
Registration 11729 10826 8126 10752 10688 9556 7846
Vacancies Notified 433 186 833 323 171 1071 1849
Placement 87 57 186 40 19 25 10 No. of applicants on the Live Register 35411 38727 36718 35940 37359 37396 32386
Source: Directorate of Employment & Craftsmen Training
Meghalaya, Shillong.
101

TABLE: 14.03 DISTRIBUTION OF EDUCATED APPLICANTS IN THE
LIVE REGISTER BY LEVEL OF EDUCATION
(In Nos.)
Level of Education 2000 2001 2002 2003 2004 2005 2006
1. 3. 4. 5. 6. 7. 8. 9 1. Matriculation 9883 10497 9435 10019 10775 10728 7933
2. HSSLC/PU/ Intermediate 6194 6722 6159 6901 7499 8119 6939
3. Graduates
a. Engineering 189 1085 541 92 109 83 91
b. Agriculture 12 15 11 8 16 13 15
c. Medicine 2 19 2 4 6 7 8
d. Veterinary - - - - 1 9 1
e. Arts 2362 2485 2408 2429 2954 3268 2557
f. Science 627 549 549 573 606 613 311
g. Commerce 429 430 405 446 521 534 475
h. Law - - 2 2 - - 5
i. Education 158 1311 142 113 237 3 70
j. Others - - - - 2 80 8
4. Post Graduates
a. Engineering 10 30 - 4 3 11 -
b. Agriculture - - 6 - - - -
Contd…
102

Contd…
c. Education 20 14 8 5 - - -
d. Arts 152 1595 342 199 242 335 238
e. Science 94 79 86 92 124 166 101
f. Commerce 20 - 19 23 34 32 23
g. Law - 33 1 - 2 - -
h.Others 2 1 - 15 35 36 47 5. Diploma Engineering 309 297 301 212 257 234 228
Total 20463 25162 20417 21137 23423 24271 19051
Source: Directorate of Employment & Craftsmen Training Meghalaya, Shillong.
103
15. HEALTH & FAMILY WELFARE
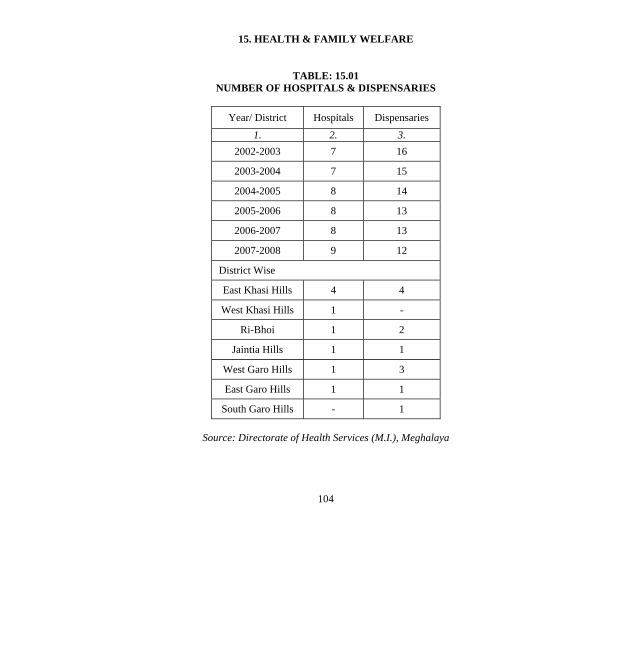
TABLE: 15.01 NUMBER OF HOSPITALS & DISPENSARIES
Year/ District Hospitals Dispensaries
1. 2. 3. 2002-2003 7 16
2003-2004 7 15
2004-2005 8 14
2005-2006 8 13
2006-2007 8 13
2007-2008 9 12
District Wise
East Khasi Hills 4 4
West Khasi Hills 1 -
Ri-Bhoi 1 2
Jaintia Hills 1 1
West Garo Hills 1 3
East Garo Hills 1 1
South Garo Hills - 1
Source: Directorate of Health Services (M.I.), Meghalaya
104

TABLE: 15.02
NUMBER OF PRIMARY HEALTH CENTRES, COMMUNITY HEALTH CENTRES, SUB-CENTRES, (INCLUDING M.C.W.
CENTRES Etc.) LEPROSY COLONIES, LEPROSY CONTROL UNIT & SURVEY & EDUCATION
TREATMENT CENTRES
Year/ District P.H.C. C.H.C. Sub
Centre L.C. L.C.U. Set Centre
1. 2. 3. 4. 5. 6. 7. 2002-2003 90 19 401 1 2 20
2003-2004 94 22 401 1 2 20
2004-2005 101 24 401 1 2 20
2005-2006 104 25 433 1 2 20
2006-2007 100 27 401 1 2 20
2007-2008 104 28 404 2 2 20
District Wise East Khasi Hills 22 6 65 - - 3
West Khasi Hills 16 4 64 - - 2
Ri-Bhoi 8 3 27 - 1 1
Jaintia Hills 16 5 74 1 - 4 West Garo Hills 18 6 82 - - 7
East Garo Hills 17 2 70 - 1 3
South Garo Hills 7 2 22 1 - -
Source: Directorate of Health Services (M.I.), Meghalaya
105

TABLE: 15.03
NUMBER OF PARA MEDICAL STAFF
Year/ District Doctors Nurses Phar-
macist A.N.M. Health Visitors
Lab- Techni-
cians
Vacc- inator
1. 2. 3. 4. 5. 6. 7. 8. 2002-2003 419 703 148 713 32 124 90
2003-2004 453 781 160 727 50 139 90
2004-2005 498 956 168 754 68 151 90
2005-2006 568 862 188 687 71 172 106
2006-2007 639 809 200 723 80 153 N.A
2007-2008 671 893 206 753 80 156 N.A
District Wise East Khasi Hills 262 450 59 146 17 40 N.A
West Khasi Hills 61 103 32 109 9 23 N.A
Ri-Bhoi 43 51 14 52 4 15 N.A
Jaintia Hills 90 99 32 131 22 23 N.A West Garo Hills 139 120 34 147 13 26 N.A
East Garo Hills 51 53 24 129 9 21 N.A
South Garo Hills 25 17 11 39 6 8 N.A
Source: Directorate of Health Services (M.I.), Meghalaya
106

TABLE: 15.04 NUMBER & TYPES OF BEDS BY DISTRICT
Year/
District General
Beds Maternity
Beds Paediatric
Beds T.B. Beds
OtherBeds Total
1. 2. 3. 4. 5. 6. 7. 2003-2004 2406 235 227 259 19 3146
2004-2005 2426 235 227 259 19 3166
2005-2006 2704 236 227 287 113 3567
2006-2007 2804 236 227 287 113 3667
2007-2008 2854 245 227 287 113 3726
District Wise East Khasi Hills 1038 128 179 217 84 1646
West Khasi Hills 380 30 10 - - 420
Ri-Bhoi 200 - - - 29 229
Jaintia Hills 362 21 18 - - 401 West Garo Hills 438 22 5 70 - 535
East Garo Hills 330 20 15 - - 365
South Garo Hills 106 24 - - - 130
Source: Directorate of Health Services (M.I.), Meghalaya
107

TABLE: 15.05 NUMBER OF FAMILY WELFARE CLINICS/ CENTRES
Year/
District Total Rural Urban Other Bodies
1. 2. 3. 4. 5.
1993-1994 75 63 8 4
1994-1995 112 98 10 4
1995-1996 112 98 10 4
1996-1997 112 98 9 4
1999-2000 522 509 13 9
2003-2004 546 532 14 10
2004-2005 546 532 14 10
District wise
East Khasi Hills 103 94 9 7
West Khasi Hills 85 84 1 -
Ri-Bhoi 38 38 - -
Jaintia Hills 90 89 1 1
West Garo Hills 108 107 1 1
East Garo Hills 89 88 1 1
South Garo Hills 33 32 1 -
1997-1998, 1998-1999, 2000-2001 to 2002-2003 not reported
* - The data includes only under the Family Welfare Programme Source: Directorate of Health Services M.C.H. & F.W., Meghalaya
108
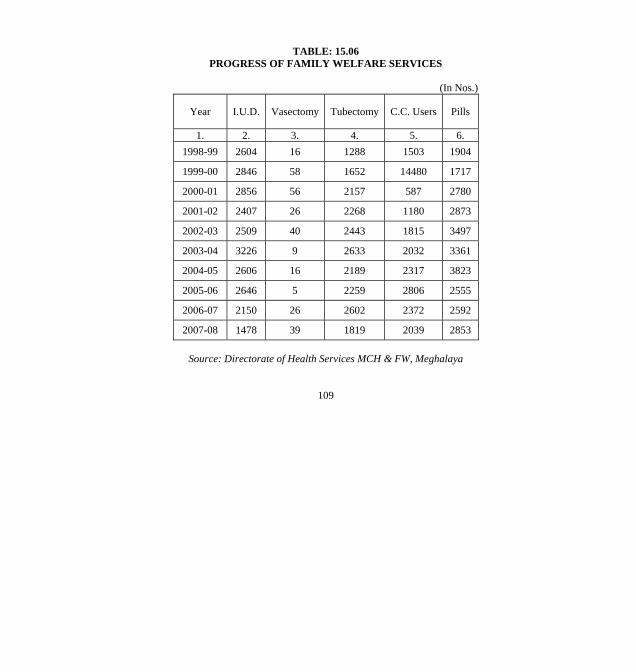
TABLE: 15.06
PROGRESS OF FAMILY WELFARE SERVICES
(In Nos.)
Year I.U.D. Vasectomy Tubectomy C.C. Users Pills
1. 2. 3. 4. 5. 6. 1998-99 2604 16 1288 1503 1904
1999-00 2846 58 1652 14480 1717
2000-01 2856 56 2157 587 2780
2001-02 2407 26 2268 1180 2873
2002-03 2509 40 2443 1815 3497
2003-04 3226 9 2633 2032 3361
2004-05 2606 16 2189 2317 3823
2005-06 2646 5 2259 2806 2555
2006-07 2150 26 2602 2372 2592
2007-08 1478 39 1819 2039 2853
Source: Directorate of Health Services MCH & FW, Meghalaya
109

TABLE: 15.07 NUMBER OF PATIENTS TREATED : DISTRICT WISE
(In ‘000 Nos.)
2005-2006 2006 2007
District Out- door
In- door Total Out-
door In-
door Total Out- door
In- door Total
1. 2. 3. 4. 5. 6. 7. 8. 9. 10. Jaintia Hills 308 37 345 226 21 247 240 24 264 East Khasi Hills 787 75 862 422 40 462 411 38 449
Ri-Bhoi 121 5 126 75 2 77 69 2 71 West Khasi Hills 160 9 169 18 1 19 198 19 217
East Garo Hills 125 13 138 84 2 86 97 2 99
West Garo Hills 355 11 366 258 17 275 225 18 243
South Garo Hills 67 8 75 69 4 73 68 4 72
Meghalaya 1923 158 2081 1152 87 1239 1308 107 1415
Source: Directorate of Health Services MCH & FW, Meghalaya
110
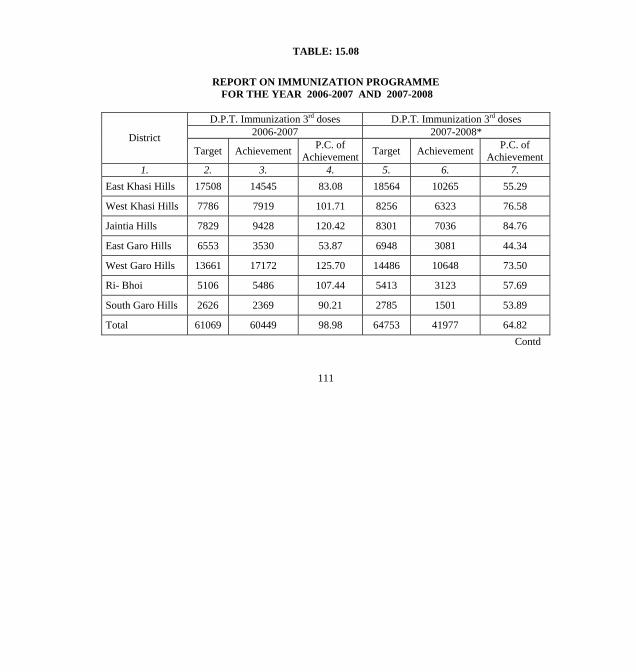
TABLE: 15.08
REPORT ON IMMUNIZATION PROGRAMME
FOR THE YEAR 2006-2007 AND 2007-2008
D.P.T. Immunization 3rd doses D.P.T. Immunization 3rd doses 2006-2007 2007-2008* District
Target Achievement P.C. of Achievement Target Achievement P.C. of
Achievement 1. 2. 3. 4. 5. 6. 7.
East Khasi Hills 17508 14545 83.08 18564 10265 55.29
West Khasi Hills 7786 7919 101.71 8256 6323 76.58
Jaintia Hills 7829 9428 120.42 8301 7036 84.76
East Garo Hills 6553 3530 53.87 6948 3081 44.34
West Garo Hills 13661 17172 125.70 14486 10648 73.50
Ri- Bhoi 5106 5486 107.44 5413 3123 57.69
South Garo Hills 2626 2369 90.21 2785 1501 53.89
Total 61069 60449 98.98 64753 41977 64.82 Contd
111

Contd O.P.V. 3rd doses O.P.V. 3rd doses
2006-2007 2007-2008 District Target Achievement P.C. of
Achievement Target Achievement P.C. of Achievement
1. 2. 3. 4. 5. 6. 7. East Khasi Hills 17508 14528 82.97 18564 10056 54.16
West Khasi Hills 7786 7919 101.70 8256 6323 76.58
Jaintia Hills 7829 9343 119.33 8301 5768 69.48
West Garo Hills 6553 2926 44.65 6948 2958 42.57
East Garo Hills 13661 17206 125.94 14486 10663 73.60
Ri- Bhoi District 5106 5439 106.52 5413 3720 68.72
South Garo Hills 2626 2434 92.68 2785 1252 44.95
Total 61069 59795 97.91 64753 40740 62.91 Contd
112
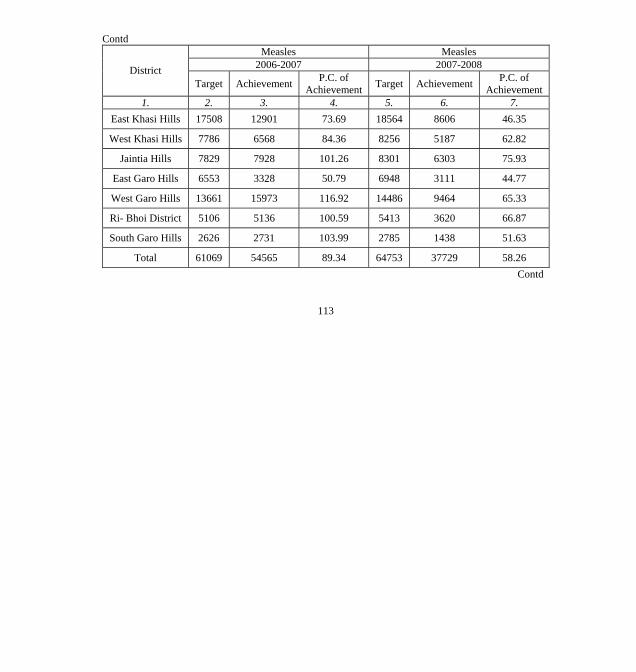
Contd Measles Measles
2006-2007 2007-2008 District Target Achievement P.C. of
Achievement Target Achievement P.C. of Achievement
1. 2. 3. 4. 5. 6. 7. East Khasi Hills 17508 12901 73.69 18564 8606 46.35
West Khasi Hills 7786 6568 84.36 8256 5187 62.82
Jaintia Hills 7829 7928 101.26 8301 6303 75.93
East Garo Hills 6553 3328 50.79 6948 3111 44.77
West Garo Hills 13661 15973 116.92 14486 9464 65.33
Ri- Bhoi District 5106 5136 100.59 5413 3620 66.87
South Garo Hills 2626 2731 103.99 2785 1438 51.63
Total 61069 54565 89.34 64753 37729 58.26 Contd
113

Contd B.C.G. completed doses B.C.G. completed doses
2006-2007 2007-2008 District Target Achievement P.C. of
Achievement Target Achievement P.C. of Achievement
1. 2. 3. 4. 5. 6. 7. East Khasi Hills 17508 20655 117.97 18564 15030 80.96
West Khasi Hills 7786 8229 105.68 8256 6772 82.02
Jaintia Hills 7829 11906 152.07 8301 8231 99.15
East Garo Hills 6553 4069 62.09 6948 4158 59.84
West Garo Hills 13661 17380 127.22 14486 11926 82.32
Ri- Bhoi District 5106 5910 115.74 5413 4104 75.81
South Garo Hills 2626 3278 124.82 2785 1536 55.15
Total 61069 71427 116.96 64753 51757 79.92 Contd
114

Contd Fully Immunization completed doses Fully immunization complete doses
2006-2007 2007-2008* District Target Achievement P.C. of
Achievement Target Achievement P.C. of Achievement
1. 2. 3. 4. 5. 6. 7. East Khasi Hills 17508 14218 81.20 18564 8112 43.69
West Khasi Hills 7786 8729 112.11 8256 7730 93.62
Jaintia Hills 7829 8961 114.45 8301 7450 89.74
East Garo Hills 6553 1494 22.79 6948 3439 49.49
West Garo Hills 13661 14286 104.57 14486 7913 54.62
Ri- Bhoi District 5106 5221 102.25 5413 4921 90.91
South Garo Hills 2626 2990 113.86 2785 2507 90.01
Total 61069 55899 91.53 64753 42072 64.97 Contd
115

Contd D.T. (5 years)completed doses D.T. (5 years) completed doses
2006-2007 2007-2008* District Target Achievement P.C. of
Achievement Target Achievement P.C. of Achievement
1. 2. 3. 4. 5. 6. 7. East Khasi Hills 19544 14423 73.79 20221 36740 181.69
West Khasi Hills 8691 11229 129.20 8993 6673 74.20
Jaintia Hills 8739 11196 128.11 9042 13946 154.23
East Garo Hills 7314 4836 66.11 7568 3999 52.84
West Garo Hills 15249 25406 166.60 15778 14371 91.08
Ri- Bhoi District 5699 7786 136.62 5896 8349 141.60
South Garo Hills 2931 3407 116.24 3033 2274 74.97
Total 68167 78283 114.84 70531 86352 122.43 Contd
116
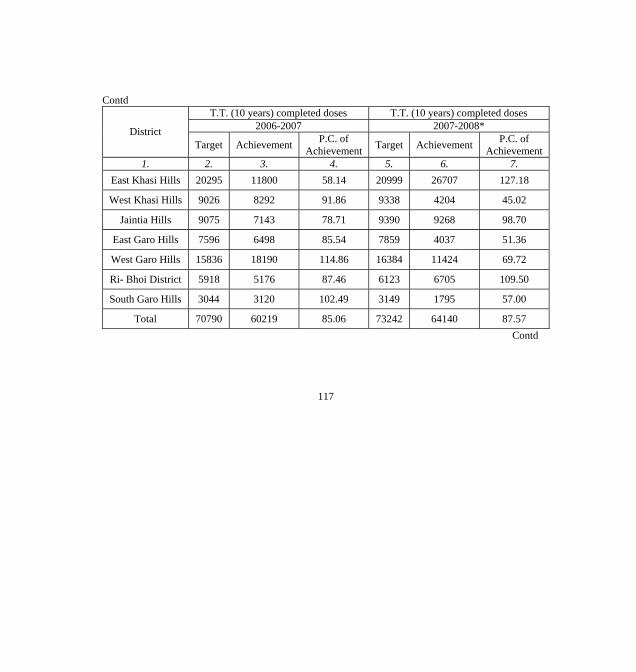
Contd T.T. (10 years) completed doses T.T. (10 years) completed doses
2006-2007 2007-2008* District Target Achievement P.C. of
Achievement Target Achievement P.C. of Achievement
1. 2. 3. 4. 5. 6. 7. East Khasi Hills 20295 11800 58.14 20999 26707 127.18
West Khasi Hills 9026 8292 91.86 9338 4204 45.02
Jaintia Hills 9075 7143 78.71 9390 9268 98.70
East Garo Hills 7596 6498 85.54 7859 4037 51.36
West Garo Hills 15836 18190 114.86 16384 11424 69.72
Ri- Bhoi District 5918 5176 87.46 6123 6705 109.50
South Garo Hills 3044 3120 102.49 3149 1795 57.00
Total 70790 60219 85.06 73242 64140 87.57 Contd
117

Contd
T.T. (16 years) completed doses T.T. (16 years) completed doses 2006-2007 2007-2008* District
Target Achievement P.C. of Achievement Target Achievement P.C. of
Achievement 1. 2. 3. 4. 5. 6. 7.
East Khasi Hills 17289 5680 32.85 17888 11754 65.70
West Khasi Hills 7689 3448 44.84 7955 1546 19.43
Jaintia Hills 7731 2086 26.98 7999 3423 42.79
East Garo Hills 6470 2086 32.24 6695 4165 62.21
West Garo Hills 13490 16023 118.77 13957 13403 96.03
Ri- Bhoi District 5041 1884 37.37 5216 4166 79.86
South Garo Hills 2593 2015 77.70 2683 1574 58.66
Total 60303 33222 55.09 62393 40031 64.15
* April 2007 to December, 2007 Source: Directorate of Health Services MCH & FW, Meghalaya, Shillong
118

16. PUBLIC HEALTH & VITAL STATISTICS
TABLE : 16.01 NUMBER OF HABITATIONS PROVIDED WITH
DRINKING WATER SUPPLY FACILITIES
Source : Chief Engineer (PHE), Meghalaya, Shillong.
119
Year/ District
Number of habitations covered
1. 2.
2000-01 397
2001-02 362
2002-03 375
2003-04 397
2004-05 419
2005-06 472
2006-07 1118
2007-08 1205
District-wise
East Khasi Hills 151
Ri-Bhoi 221
West Khasi Hills 195
Jaintia Hills 64
East Garo Hills 163
West Garo Hills 291
South Garo Hills 120

TABLE : 16.02
BIRTH & DEATH RATES
(Per thousand)
Meghalaya All India Year Birth
Rate Death Rate Birth Rate Death Rate
1. 2. 3. 4. 5.
1996 30.4 8.9 27.5** 9.0**
1997 30.2 8.8 27.2** 8.9**
1998 29.2 9.0 26.5* 9.0*
1999 28.7 9.1 26.1* 8.7*
2000 28.5 9.2 25.8* 8.5*
2001 28.3 9.0 25.4* 8.4*
2002 25.8 7.7 25.0* 8.1*
2003 24.7 7.4 24.8* 8.0*
2004 25.2 7.2 24.1 7.5
2005 25.1 7.5 23.8 7.6
2006 24.7 8.0 23.5 7.5
2007 24.4 7.5 23.1 7.4
* - Excludes Nagaland (Rural) due to part receipts of returns
** - Excludes Jammu & Kashmir
Source : Registrar General, Ministry of Home Affairs, Govt. of India..
120

TABLE : 16.03
THREE YEAR MOVING AVERAGE OF INFANT MORTALITY RATES
(Per thousand)
Meghalaya All India Year
Rural Urban Combined Rural Urban Combined1. 2. 3. 4. 5. 6. 7.
1994-96 50 35 48 77 46 72**
1995-97 56 52 54 77 45 71**
1996-98 54 36 52 77 45 72*
1997-99 59 33 56 75 44 70*
1998-2000 61 32 58 74 43 68*
1999-2001 57 41 56 72 42 66*
2000-2002 62 49 61 69 40 63*
2001-2003 59 44 57 66 38 60*
2002-2004 55 43 54 64 40 58
2003-2005 50 42 49 64 40 58
2004-2006 54 43 53 62 39 57
2006-2007 57 46 56 61 37 55
* - Excludes Nagaland (Rural) due to part receipts of returns ** - Excludes Jammu & Kashmir
Note : Infant Mortality Rates for All India are for single years with effect from 1995.
Source : Registrar General, Ministry of Home Affairs, Govt. of India..
121
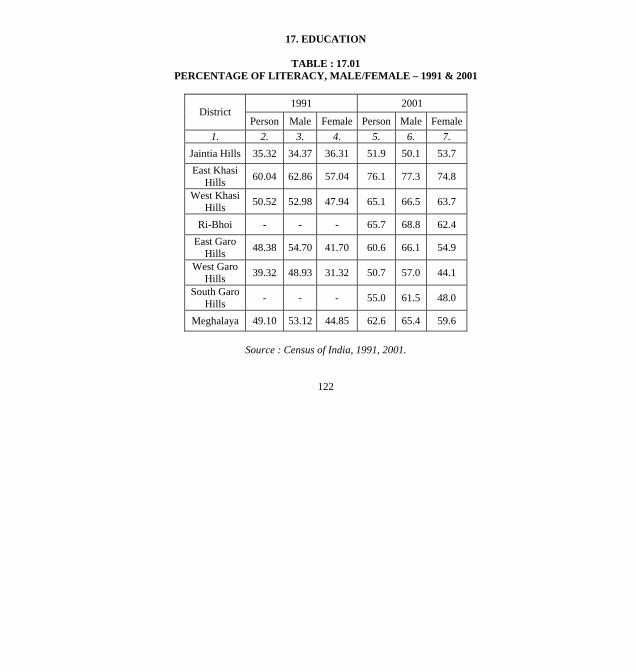
17. EDUCATION
TABLE : 17.01 PERCENTAGE OF LITERACY, MALE/FEMALE – 1991 & 2001
1991 2001
District Person Male Female Person Male Female
1. 2. 3. 4. 5. 6. 7. Jaintia Hills 35.32 34.37 36.31 51.9 50.1 53.7 East Khasi
Hills 60.04 62.86 57.04 76.1 77.3 74.8
West Khasi Hills 50.52 52.98 47.94 65.1 66.5 63.7
Ri-Bhoi - - - 65.7 68.8 62.4 East Garo
Hills 48.38 54.70 41.70 60.6 66.1 54.9
West Garo Hills 39.32 48.93 31.32 50.7 57.0 44.1
South Garo Hills - - - 55.0 61.5 48.0
Meghalaya 49.10 53.12 44.85 62.6 65.4 59.6
Source : Census of India, 1991, 2001.
122
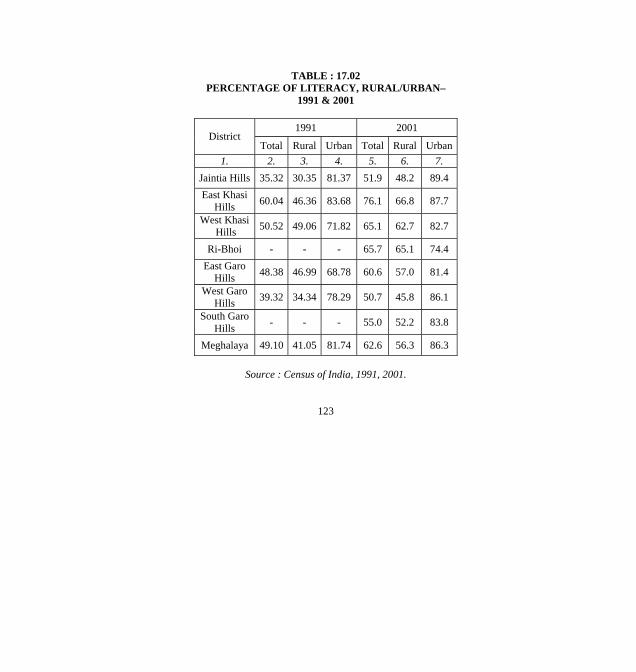
TABLE : 17.02 PERCENTAGE OF LITERACY, RURAL/URBAN–
1991 & 2001
1991 2001 District
Total Rural Urban Total Rural Urban1. 2. 3. 4. 5. 6. 7.
Jaintia Hills 35.32 30.35 81.37 51.9 48.2 89.4 East Khasi
Hills 60.04 46.36 83.68 76.1 66.8 87.7
West Khasi Hills 50.52 49.06 71.82 65.1 62.7 82.7
Ri-Bhoi - - - 65.7 65.1 74.4 East Garo
Hills 48.38 46.99 68.78 60.6 57.0 81.4
West Garo Hills 39.32 34.34 78.29 50.7 45.8 86.1
South Garo Hills - - - 55.0 52.2 83.8
Meghalaya 49.10 41.05 81.74 62.6 56.3 86.3
Source : Census of India, 1991, 2001.
123

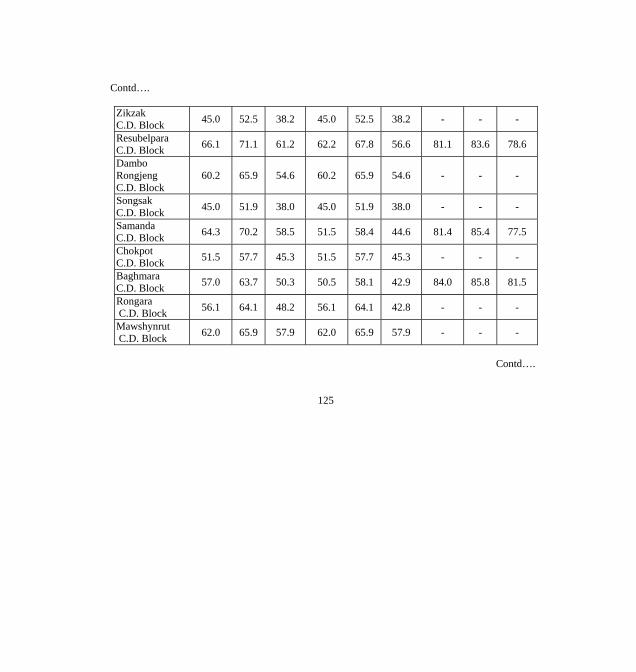
TABLE : 17.03 LITERACY RATE – BLOCK-WISE, 2001
Total Rural Urban
Name of Blocks Person Male Female Person Male Female Person Male Female
1. 2. 3. 4. 5. 6. 7. 8. 9. 10.
Meghalaya 62.6 65.4 59.6 56.3 59.2 53.2 86.3 89.0 83.5
Betasing C.D. Block 49.0 55.7 42.2 49.0 55.7 42.2 - - -
Dalu C.D. Block 50.0 57.0 42.9 50.0 57.0 42.9 - - -
Selsella C.D. Block 41.5 47.9 35.1 41.5 47.9 35.1 - - -
Dadenggiri C.D. Block 31.0 38.1 23.9 31.0 38.1 23.9 - - -
Tikrikilla C.D. Block 46.6 54.2 38.9 46.6 54.2 38.9 - - -
Rongram C.D. Block 72.0 76.7 67.1 55.9 61.9 49.8 86.0 89.5 82.4
Contd…
124
Contd….
Zikzak C.D. Block 45.0 52.5 38.2 45.0 52.5 38.2 - - -
Resubelpara C.D. Block 66.1 71.1 61.2 62.2 67.8 56.6 81.1 83.6 78.6
Dambo Rongjeng C.D. Block
60.2 65.9 54.6 60.2 65.9 54.6 - - -
Songsak C.D. Block 45.0 51.9 38.0 45.0 51.9 38.0 - - -
Samanda C.D. Block 64.3 70.2 58.5 51.5 58.4 44.6 81.4 85.4 77.5
Chokpot C.D. Block 51.5 57.7 45.3 51.5 57.7 45.3 - - -
Baghmara C.D. Block 57.0 63.7 50.3 50.5 58.1 42.9 84.0 85.8 81.5
Rongara C.D. Block 56.1 64.1 48.2 56.1 64.1 42.8 - - -
Mawshynrut C.D. Block 62.0 65.9 57.9 62.0 65.9 57.9 - - -
Contd….
125
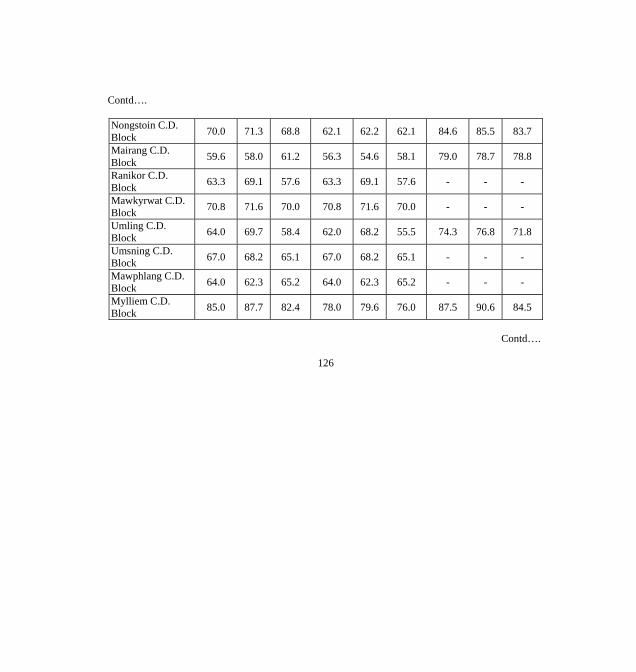
Contd….
Nongstoin C.D. Block 70.0 71.3 68.8 62.1 62.2 62.1 84.6 85.5 83.7
Mairang C.D. Block 59.6 58.0 61.2 56.3 54.6 58.1 79.0 78.7 78.8
Ranikor C.D. Block 63.3 69.1 57.6 63.3 69.1 57.6 - - -
Mawkyrwat C.D. Block 70.8 71.6 70.0 70.8 71.6 70.0 - - -
Umling C.D. Block 64.0 69.7 58.4 62.0 68.2 55.5 74.3 76.8 71.8
Umsning C.D. Block 67.0 68.2 65.1 67.0 68.2 65.1 - - -
Mawphlang C.D. Block 64.0 62.3 65.2 64.0 62.3 65.2 - - -
Mylliem C.D. Block 85.0 87.7 82.4 78.0 79.6 76.0 87.5 90.6 84.5
Contd….
126

Contd….
Mawryngkneng C.D. Block 63.2 59.1 67.3 63.2 59.1 67.3 - - -
Mawkynrew C.D. Block 52.7 48.2 57.2 52.7 48.2 57.2 - - -
Mawsynram C.D. Block 65.0 67.7 62.3 65.0 67.7 62.3 - - -
Shella-Bholaganj C.D. Block 68.4 69.4 67.3 63.2 64.5 61.9 91.0 91.9 89.5
Pynursla C.D. Block 66.1 66.2 66.0 66.1 66.2 66.0 - - -
Thadlaskein C.D. Block 56.2 53.1 59.3 45.0 40.2 49.5 90.0 91.4 87.6
Laskein C.D. Block 42.0 36.7 47.2 42.0 36.7 47.2 - - -
Contd….
127

Contd….
Amlarem C.D.
Block 66.1 65.8 66.5 66.1 65.8 66.5 - - -
Khliehriat C.D. Block 48.1 49.7 46.5 48.1 49.7 46.5 - - -
Source : Census of India, 2001.
128

TABLE : 17.04 NUMBER OF EDUCATIONAL INSTITUTIONS
Institutions 2004-05 2005-06 2006-07
1. 2. 3. 4 1. Primary and Junior Basic 5851 5851 6351
2. Middle and Senior Basic 1759 1759 2259
3. High & Higher Secondary 711 655 774
4. Basic and Non-Basic training school 7 12 12
5. Teachers Training College 2 3 3
6. Polytechnic 1 1 1
7. College for Arts, Science & Commerce 54 54 56
8. University 1 1 1
All Institutions 8386 8337 9457
Source : Directorate of Elementary& Mass Education , Meghalaya
129
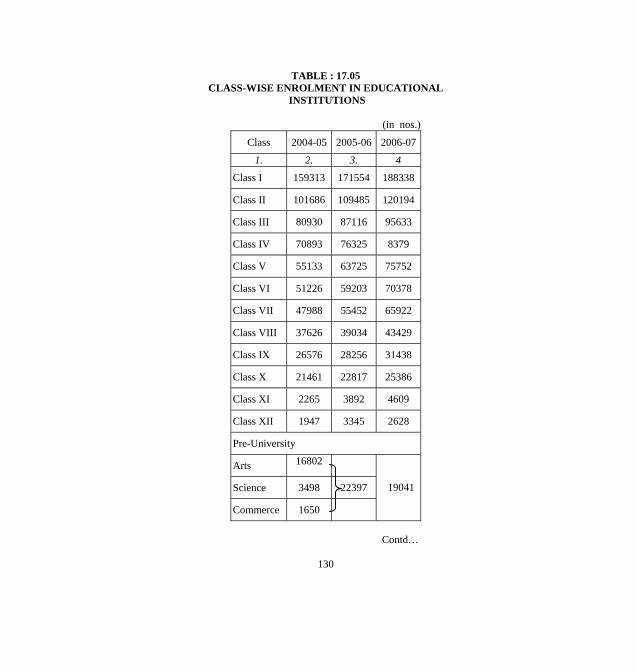
TABLE : 17.05 CLASS-WISE ENROLMENT IN EDUCATIONAL
INSTITUTIONS
(in nos.)
Class 2004-05 2005-06 2006-07
1. 2. 3. 4
Class I 159313 171554 188338
Class II 101686 109485 120194
Class III 80930 87116 95633
Class IV 70893 76325 8379
Class V 55133 63725 75752
Class VI 51226 59203 70378
Class VII 47988 55452 65922
Class VIII 37626 39034 43429
Class IX 26576 28256 31438
Class X 21461 22817 25386
Class XI 2265 3892 4609
Class XII 1947 3345 2628
Pre-University
Arts 16802
Science 3498 22397
Commerce 1650
19041
Contd…
130
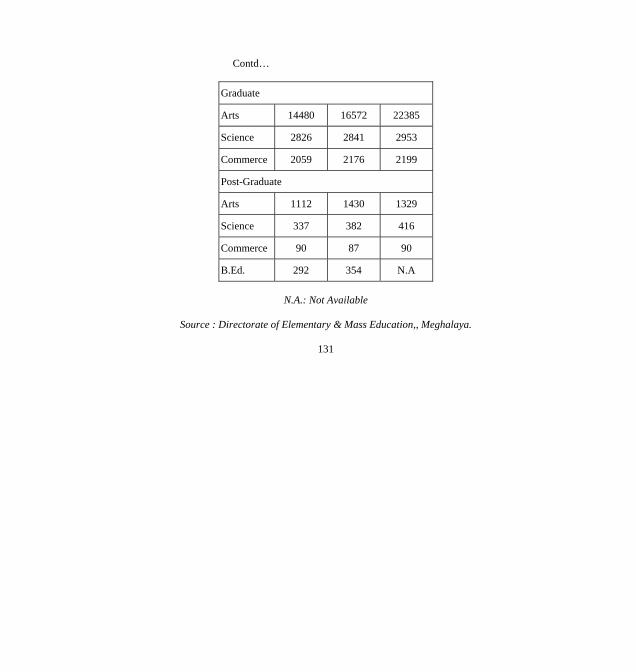
Contd…
Graduate
Arts 14480 16572 22385
Science 2826 2841 2953
Commerce 2059 2176 2199
Post-Graduate
Arts 1112 1430 1329
Science 337 382 416
Commerce 90 87 90
B.Ed. 292 354 N.A
N.A.: Not Available
Source : Directorate of Elementary & Mass Education,, Meghalaya.
131

TABLE : 17.06 NUMBER OF SCHEDULED TRIBE & SCHEDULED CASTE
STUDENTS BY TYPE OF INSTITUTIONS
2005-06 2006-07 Type of
Institutions StudentsST SC ST SC
1. 2. 3. 4. 5. 6. Boys 181568 1404 20013 1446
Girls 174019 1176 190231 12001. Primary/ Junior Basic Schools
Total 355587 2580 390366 2646
Boys 70099 1110 82706 1127
Girls 73067 983 87503 9112. Middle/ Senior Basic Schools
Total 143166 2093 170209 2038
Boys 38016 879 41993 1001
Girls 40638 863 44863 9473. High/Higher Secondary Schools
Total 78654 1742 86856 1948
Boys 8475 369 9829 380
Girls 7837 278 8542 2904. P.U./Intermediate
Total 16312 647 18371 670
Boys 8667 205 11032 213
Girls 9015 212 11880 2205. Graduate
Total 17682 417 22912 433
Contd… 132

Contd….
Boys 573 11 510 11
Girls 806 22 750 9 6. Post-Graduate
Total 1379 33 1260 20
Source : Directorate of Elementary & Mass Education, Meghalaya.
133
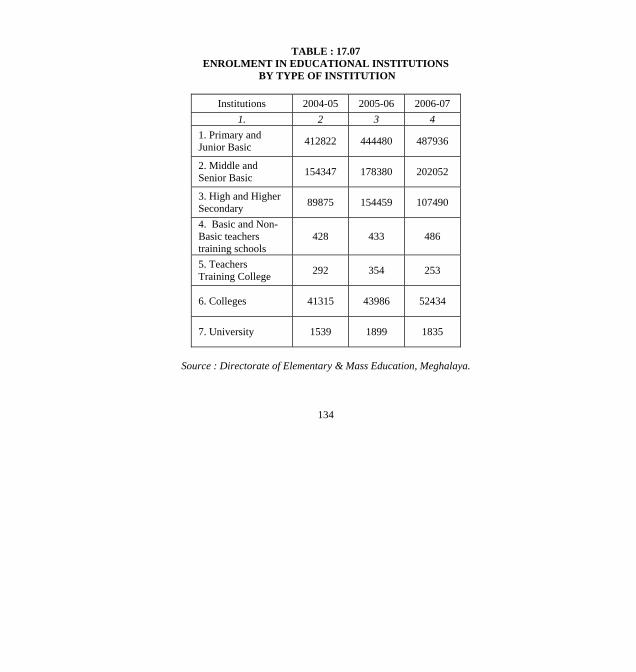
TABLE : 17.07
ENROLMENT IN EDUCATIONAL INSTITUTIONS BY TYPE OF INSTITUTION
Institutions 2004-05 2005-06 2006-07
1. 2 3 4 1. Primary and Junior Basic 412822 444480 487936
2. Middle and Senior Basic 154347 178380 202052
3. High and Higher Secondary 89875 154459 107490
4. Basic and Non-Basic teachers training schools
428 433 486
5. Teachers Training College 292 354 253
6. Colleges 41315 43986 52434
7. University 1539 1899 1835
Source : Directorate of Elementary & Mass Education, Meghalaya.
134
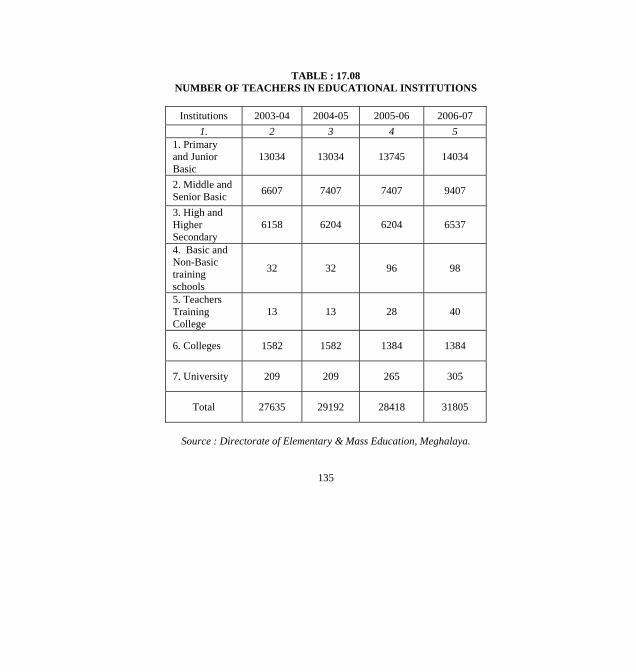
TABLE : 17.08 NUMBER OF TEACHERS IN EDUCATIONAL INSTITUTIONS
Institutions 2003-04 2004-05 2005-06 2006-07
1. 2 3 4 5 1. Primary and Junior Basic
13034 13034 13745 14034
2. Middle and Senior Basic 6607 7407 7407 9407
3. High and Higher Secondary
6158 6204 6204 6537
4. Basic and Non-Basic training schools
32 32 96 98
5. Teachers Training College
13 13 28 40
6. Colleges 1582 1582 1384 1384
7. University 209 209 265 305
Total 27635 29192 28418 31805
Source : Directorate of Elementary & Mass Education, Meghalaya.
135

18. POLICE & CRIME STATISTICS
TABLE: 18.01 NUMBER OF POLICE STATIONS, OUTPOST ETC
Particulars 2004-05 2005-06 2006-07 2007-08
1. 2. 3 4 5. Police station 36 36 56 56
Outposts 56 56 62 62
Patrolling Post 3 3 6 6
Check posts 21 21 29 29
Beat Houses 9 9 18 18
Fire Stations 34 36 26 26
Source: Assistant Inspector General of Police, Shillong
136
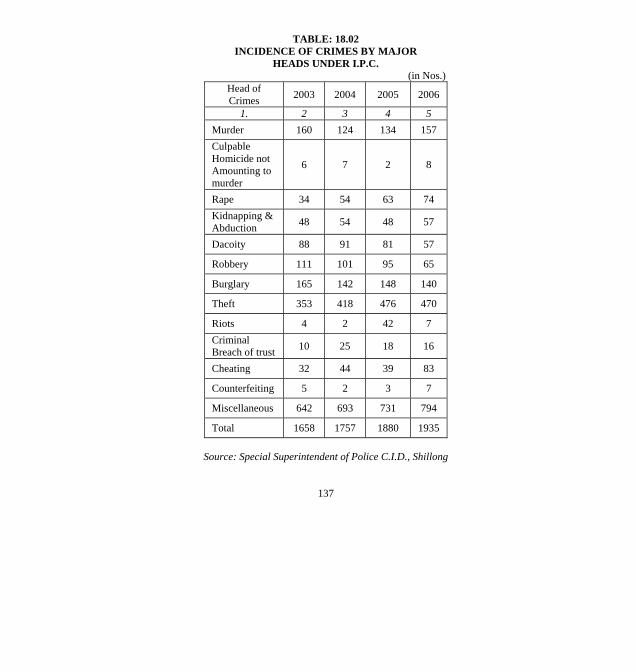
TABLE: 18.02 INCIDENCE OF CRIMES BY MAJOR
HEADS UNDER I.P.C. (in Nos.)
Head of Crimes 2003 2004 2005 2006
1. 2 3 4 5 Murder 160 124 134 157 Culpable Homicide not Amounting to murder
6 7 2 8
Rape 34 54 63 74 Kidnapping & Abduction 48 54 48 57
Dacoity 88 91 81 57
Robbery 111 101 95 65
Burglary 165 142 148 140
Theft 353 418 476 470
Riots 4 2 42 7 Criminal Breach of trust 10 25 18 16
Cheating 32 44 39 83
Counterfeiting 5 2 3 7
Miscellaneous 642 693 731 794
Total 1658 1757 1880 1935
Source: Special Superintendent of Police C.I.D., Shillong
137

19 BANKING
TABLE: 19.01
NUMBER OF SCHEDULED COMMERCIAL BANKS AS ON DECEMBER
Particulars 2004 2005 2006 2007 2008*
1. 4. 5. 6. S.B.I. and its Associates 86 86 85 84 84
Nationalised Banks 44 45 46 48 48
Regional Rural Banks 51 51 51 51 52
Other Scheduled Commercial Banks 1 4 4 4 4
All Scheduled Commercial Banks 182 186 186 187 188
* As on March, 2008
Source: Banking Statistics, Reserve Bank of India
138

TABLE: 19.02
DEPOSITS AND CREDIT OF SCHEDULED COMMERCIAL BANKS
(Rs. in Crore) As on December
2006 As on December
2007 As on March
2008 Particulars Deposits Credit Deposits Credit Deposits Credit
1. 2. 3. 4. 5. 6. 7. S.B.I. and its Associates 1642 786 2076 847 2453 875
Nationalised Banks 1351 466 1542 445 1705 469
Regional Rural Banks 260 76 293 92 316 97
Other Scheduled Commercial Banks
192 17 350 16 337 23
All Scheduled Commercial Banks
3445 1345 4261 1400 4811 1464
Source: Banking Statistics, Reserve Bank of India
139

TABLE: 19.03
DEPOSITS AND CREDIT OF SCHEDULED COMMERCIAL BANKS BY DISTRICT
(Rs. in Crore) As on December 2007 As on March 2008
Districts No. of Offices Deposits Credit
Credit/ Deposit
Percentage
No. of Offices Deposits Credit
Credit/ Deposit
Percentage 1. 2. 3. 4. 5. 6. 7. 8. 9.
Jaintia Hills 23 377 72 19.10 24 413 72 17.43
East Khasi Hills 86 3190 936 29.34 85 3617 988 27.32
West Khasi Hills 20 104 63 60.58 20 119 65 54.62
Ri-Bhoi 14 200 94 47.00 14 196 96 48.98
East Garo Hills 15 105 70 66.66 15 130 72 51.28
West Garo Hills 26 264 154 58.33 27 312 160 51.60
South Garo Hills 3 21 11 52.38 3 24 11 45.83
Meghalaya 187 4261 1400 32.86 188 4811 1464 30.43
Source: Banking Statistics, Reserve Bank of India
140

20. STATE FINANCE
TABLE: 20.01 OVERALL BUDGETARY POSITION OF THE
STATE OF MEGHALAYA
(Rs. in Lakh)
Particulars 2005-2006 Actual
2006-2007 Actual
2007-2008 R.E.
2008-2009 B.E.
1. 2. 3. 4. 5. 1. Opening balance (-) 21190.81 (-) 1725.56 (-) 7438.59 (-) 4416.37
2. Total Revenue a. Receipts
174693.55
214219.12
324177.47
370286.00
b. Expenditure 167447.64 190749.65 273324.85 318047.07
c. Surplus (+) or Deficit (-) on Revenue account
(+) 7245.91 (+) 23469.47 (+) 50852.62 (+) 52238.93
3. Total Capital a. Receipts
54785.94
12078.10
27741.57
32381.35
b. Expenditure 42566.60 41260.61 75571.97 83325.30
c. Surplus (+) or Deficit (-) on Revenue account
(+) 12219.34 (-) 29182.51 (-) 47830.40 (-) 50943.95
4. Overall surplus(+) Deficit(-)
(+) 19465.25 (-) 5713.04 (+) 3022.22 (+) 1294.98
Closing Balance (-) 1725.56 (-) 7438.60 (-) 4416.37 (-) 3121.39
R.E. Revised Estimates B.E. Budget Estimates
Source: Budget at a Glance 2008-2009 Govt. of Meghalaya
141

TABLE: 20.02 REVENUE RECEIPTS OF THE STATE OF MEGHALAYA
(Rs. in lakh)
Heads 2005-2006 (Actual)
2006-2007 (Actual)
2007-2008 (R.E.)
2008-2009 (B.E)
1. 2. 3. 4. 5. 1. Share of Central taxes 35057.00 44718.00 52924.00 66417.00
2. State Taxes 25266.42 30474.01 33193.00 38461.00 3. Non-tax Revenue 14600.79 18437.02 18035.00 19870.00 4. Grant in aid from the Centre 99769.34 120590.09 220025.47 245538.00
5. Total revenue 174693.55 214219.12 324177.47 370286.00
R.E. – Revised Estimates B.E. – Budget Estimates
Source: Budget at a Glance, 2008-2009 Govt. of Meghalaya
142

TABLE: 20.03 REVENUE EXPENDITURE OF THE STATE OF MEGHALAYA
(Rs. in lakh)
Heads 2005-2006(Actual)
2006-2007(Actual)
2007-2008(R.E.)
2008-2009(B.E)
1. 2. 3. 4. 5. 1. General Services 62532.88 70308.58 77433.65 89716.08 2. Social & Community Services 55474.88 61429.98 93542.42 108295.71
3. Economic Services 49439.88 59011.09 102348.78 120035.28
4. Total Revenue 167447.64 190749.65 273324.85 318047.07
R.E. – Revised Estimates B.E. – Budget Estimates
Source: Budget at a Glance, 2008-2009 Govt. of Meghalaya
143

TABLE: 20.04 CAPITAL RECEIPTS OF THE STATE OF MEGHALAYA
(Rs. in Lakh)
Heads 2005-2006(Actual)
2006-2007 (Actual)
2007-2008 (R.E.)
2008-2009 (B.E)
1. 2. 3. 4. 5. 1. Market Loans 15825.40 19186.20 28246.00 25377.00 2. Loans from the NABARD 1403.03 2124.64 3000.00 3000.00
3. Loans from the NCDC of India 153.58 87.13 167.95 167.95
4. Ways & Means Advance from RBI 9233.69 - 4050.00 4050.00
5. Other Loans (HUDCO) 1700.00 500.00 500.00 500.00 6. Special Securities Issued to National Small Saving Fund
5641.25 2409.00 4640.00 4640.00
7. Loans and advances from Central Government 322.85 298.27 861.50 871.56
8. Recoveries of Loans and Advances 1851.84 1710.74 1800.00 1600.00
9. Contingency Fund & Public Account (Net) 18654.30 (-) 14237.88 (-) 15523.88 (-) 7825.16
Total 54785.94 12078.10 27741.57 32381.35
R.E. – Revised Estimates B.E. – Budget Estimates
Source: Budget at a Glance, 2008-2009 Govt. of Meghalaya
144
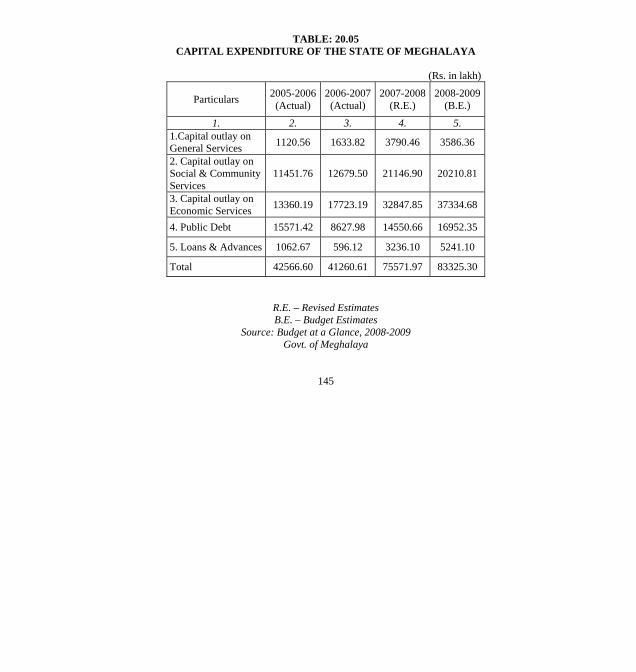
TABLE: 20.05 CAPITAL EXPENDITURE OF THE STATE OF MEGHALAYA
(Rs. in lakh)
Particulars 2005-2006(Actual)
2006-2007(Actual)
2007-2008(R.E.)
2008-2009(B.E.)
1. 2. 3. 4. 5. 1.Capital outlay on General Services 1120.56 1633.82 3790.46 3586.36
2. Capital outlay on Social & CommunityServices
11451.76 12679.50 21146.90 20210.81
3. Capital outlay on Economic Services 13360.19 17723.19 32847.85 37334.68
4. Public Debt 15571.42 8627.98 14550.66 16952.35
5. Loans & Advances 1062.67 596.12 3236.10 5241.10
Total 42566.60 41260.61 75571.97 83325.30
R.E. – Revised Estimates B.E. – Budget Estimates
Source: Budget at a Glance, 2008-2009 Govt. of Meghalaya
145
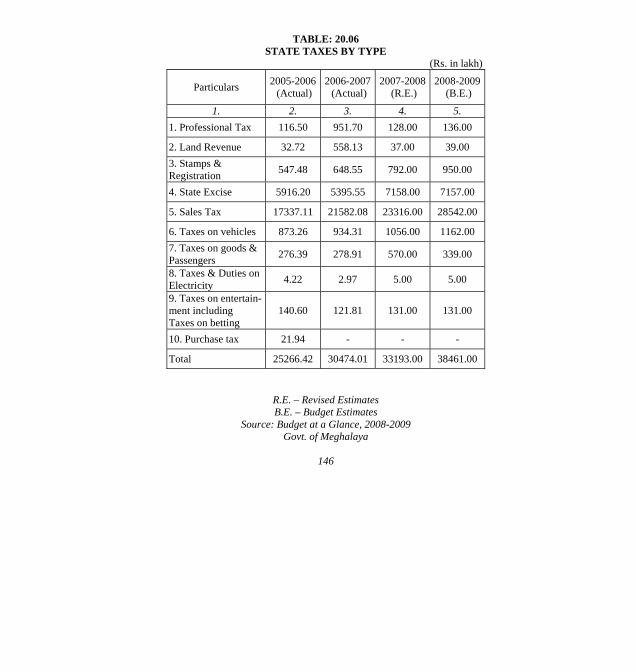
TABLE: 20.06 STATE TAXES BY TYPE
(Rs. in lakh)
Particulars 2005-2006 (Actual)
2006-2007 (Actual)
2007-2008 (R.E.)
2008-2009 (B.E.)
1. 2. 3. 4. 5. 1. Professional Tax 116.50 951.70 128.00 136.00
2. Land Revenue 32.72 558.13 37.00 39.00 3. Stamps & Registration 547.48 648.55 792.00 950.00
4. State Excise 5916.20 5395.55 7158.00 7157.00
5. Sales Tax 17337.11 21582.08 23316.00 28542.00
6. Taxes on vehicles 873.26 934.31 1056.00 1162.00 7. Taxes on goods & Passengers 276.39 278.91 570.00 339.00
8. Taxes & Duties on Electricity 4.22 2.97 5.00 5.00
9. Taxes on entertain-ment including Taxes on betting
140.60 121.81 131.00 131.00
10. Purchase tax 21.94 - - -
Total 25266.42 30474.01 33193.00 38461.00
R.E. – Revised Estimates B.E. – Budget Estimates
Source: Budget at a Glance, 2008-2009 Govt. of Meghalaya
146
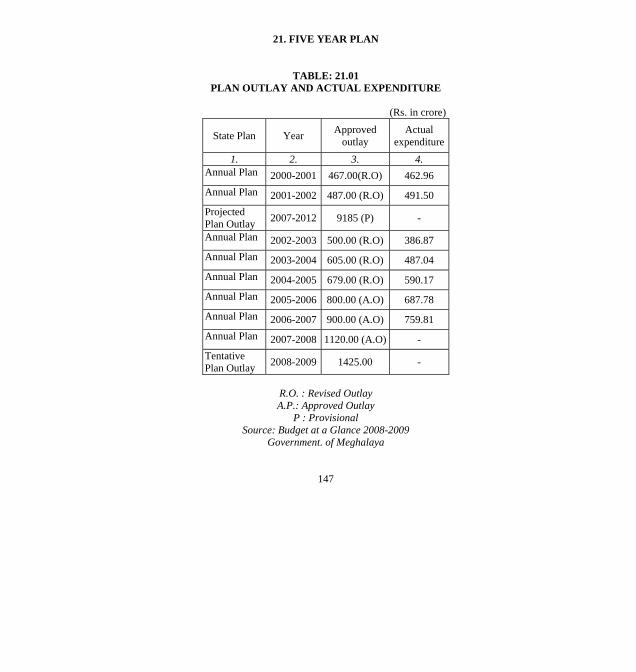
21. FIVE YEAR PLAN
TABLE: 21.01 PLAN OUTLAY AND ACTUAL EXPENDITURE
(Rs. in crore)
State Plan Year Approved outlay
Actual expenditure
1. 2. 3. 4. Annual Plan 2000-2001 467.00(R.O) 462.96 Annual Plan 2001-2002 487.00 (R.O) 491.50 Projected Plan Outlay 2007-2012 9185 (P) -
Annual Plan 2002-2003 500.00 (R.O) 386.87 Annual Plan 2003-2004 605.00 (R.O) 487.04 Annual Plan 2004-2005 679.00 (R.O) 590.17 Annual Plan 2005-2006 800.00 (A.O) 687.78 Annual Plan 2006-2007 900.00 (A.O) 759.81 Annual Plan 2007-2008 1120.00 (A.O) - Tentative Plan Outlay 2008-2009 1425.00 -
R.O. : Revised Outlay A.P.: Approved Outlay
P : Provisional Source: Budget at a Glance 2008-2009
Government. of Meghalaya
147
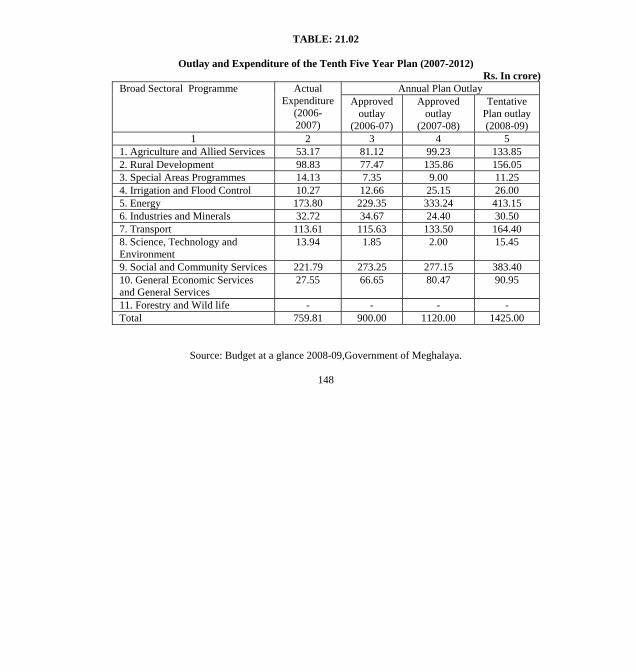
TABLE: 21.02
Outlay and Expenditure of the Tenth Five Year Plan (2007-2012) Rs. In crore)
Annual Plan Outlay Broad Sectoral Programme Actual Expenditure
(2006-2007)
Approved outlay
(2006-07)
Approved outlay
(2007-08)
Tentative Plan outlay (2008-09)
1 2 3 4 5 1. Agriculture and Allied Services 53.17 81.12 99.23 133.85 2. Rural Development 98.83 77.47 135.86 156.05 3. Special Areas Programmes 14.13 7.35 9.00 11.25 4. Irrigation and Flood Control 10.27 12.66 25.15 26.00 5. Energy 173.80 229.35 333.24 413.15 6. Industries and Minerals 32.72 34.67 24.40 30.50 7. Transport 113.61 115.63 133.50 164.40 8. Science, Technology and Environment
13.94 1.85 2.00 15.45
9. Social and Community Services 221.79 273.25 277.15 383.40 10. General Economic Services and General Services
27.55 66.65 80.47 90.95
11. Forestry and Wild life - - - - Total 759.81 900.00 1120.00 1425.00
Source: Budget at a glance 2008-09,Government of Meghalaya.
148

TABLE: 21.03
Tenth Five Year Plan (2007-2012)
(Rs. In crore)
Tenth Plan (2007-2012) Annual Plan (2008-2009) Sectoral Groups
Projected Plan outlay
Percentage to total
Tentative Plan outlay
Percentage to total
1 2 3 4 5 1. Agriculture and Allied Services
735.22 8.00 133.85 9.39
2. Rural Development 802.30 8.74 156.05 10.95 3. Special Areas Programmes (Border Areas Development)
189.09 2.06 11.25 0.79
4. Irrigation and Flood Control 219.72 2.39 26.00 1.83 5. Energy 1084.88 11.81 413.15 28.99 6. Industries and Minerals 290.50 3.16 30.50 2.14 7. Transport 1623.62 17.68 164.40 11.54 8. Science, Technology and Environment
245.07 2.67 15.45 1.08
9. Social and Community Services
3481.74 37.91 383.40 26.91
10. General Economic Services and General Services
512.86 5.58 90.95 6.38
Total 9185.00 100.00 1425.00 100.00
Source: Budget at a glance 2008-09, Government of Meghalaya
149

PRICE INDICES
TABLE: 22.01
Consumer Price Index numbers for Urban Non- Manual Employees
1984-85=100 Year/Month Shillong Delhi Mumbai Kolkata Guwahati All
India 1 2 3 4 5 6 7
2004 442 437 429 393 423 431 2005 458 468 446 412 445 451 2006 488 492 469 432 474 478 2007 549 516 498 467 505 509 2008 January
580 525 509 479 516 520
February 582 529 510 482 519 523 March 584 532 513 484 524 528
Source: Labour Bureau, Government of India.
150

TABLE: 22.02
Consumer Price Index numbers for Industrial Worker
Base year 1982=100 2001=100 Year/Month All India 2004 514 2005 536 2006 123 2007 131 2008 January 134 February 135 March 137 April 138 May 139 June 140 July 143 August 145 September 146
Source: Labour Bureau, Government of India.
151

TABLE: 22.03
Consumer Price Index number for Agricultural Labourers
Base year 1986=100 Agricultural year Meghalaya Assam All India 1 2 3 4 2004 355 347 337 2005 368 352 349 2006 397 373 372 2007 423 403 402 2008 January 439 410 413 February 435 412 417 March 441 417 423 April 444 423 429 May 450 424 431 June 452 430 434 July 464 437 442 August 470 442 450 September 475 444 455
Source: Labour Bureau, Government of India.
152
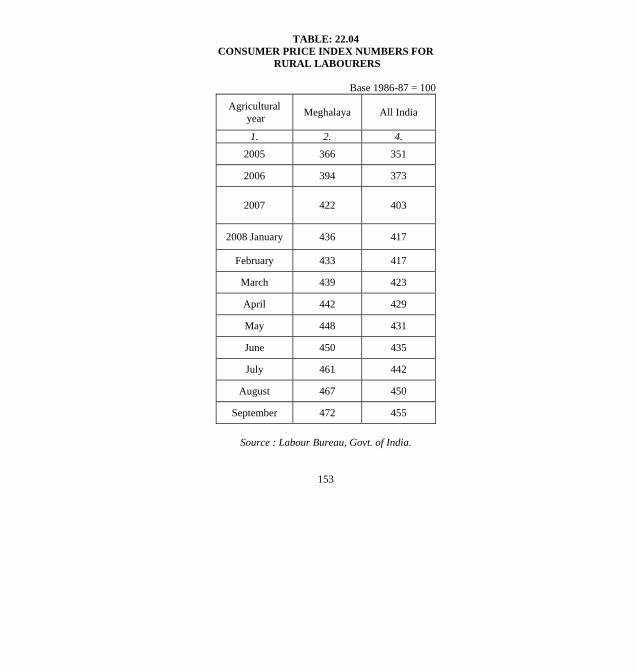
TABLE: 22.04 CONSUMER PRICE INDEX NUMBERS FOR
RURAL LABOURERS
Base 1986-87 = 100
Agricultural year Meghalaya All India
1. 2. 4. 2005 366 351
2006 394 373
2007
422 403
2008 January 436 417
February 433 417
March 439 423
April 442 429
May 448 431
June 450 435
July 461 442
August 467 450
September 472 455
Source : Labour Bureau, Govt. of India.
153
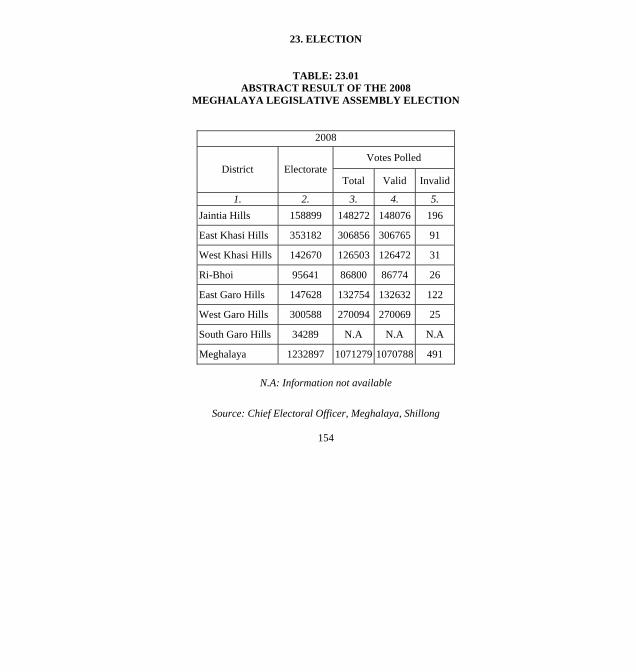
23. ELECTION
TABLE: 23.01 ABSTRACT RESULT OF THE 2008
MEGHALAYA LEGISLATIVE ASSEMBLY ELECTION
2008
Votes Polled District Electorate
Total Valid Invalid
1. 2. 3. 4. 5. Jaintia Hills 158899 148272 148076 196
East Khasi Hills 353182 306856 306765 91
West Khasi Hills 142670 126503 126472 31
Ri-Bhoi 95641 86800 86774 26
East Garo Hills 147628 132754 132632 122
West Garo Hills 300588 270094 270069 25
South Garo Hills 34289 N.A N.A N.A
Meghalaya 1232897 1071279 1070788 491
N.A: Information not available
Source: Chief Electoral Officer, Meghalaya, Shillong
154

TABLE: 23.02 CONSTITUENCY WISE NO. OF ELECTORATES MALE,
FEMALE AND NO. OF VOTES POLLED, VALID AND INVALID, KHASI HILLS AUTONOMOUS
DISTRICT COUNCIL, 2004
Electorate Votes Polled Name of Constituency Male Female Total Valid Invalid Total
1. 2. 3. 4. 5. 6. 7. 1. Jirang 9670 9479 19149 10076 347 10423
2. Nongpoh 11357 12022 23379 14167 294 14461
3. Mawhati 9058 9118 18176 10929 307 11236
4. Umroi 12124 12153 24277 14174 263 144375. Sohryng- kham 8718 8895 17613 11245 187 11432
6. Dienglieng 7973 8134 16107 10807 165 10972
7. Nongkrem 6710 6945 13655 9367 116 9483
8. Lyngkyrdem 7296 7631 14927 9343 195 9538
9. Nongskhen 9157 7262 16419 9767 200 9967
10. Shella 6348 6398 12746 7363 131 7494
11. Mawsynram 9627 9283 18910 12488 298 12786
12. Sohra 8392 8513 16905 10328 131 10459
13. Laitkroh 6065 6293 12358 8533 116 8649
14. Mylliem 8647 9488 18135 10748 84 1083215. Laban- Mawprem 3762 5023 8785 4549 42 4591
16. Nongthym- mai 7243 8840 16083 5998 62 6060
Contd…
155
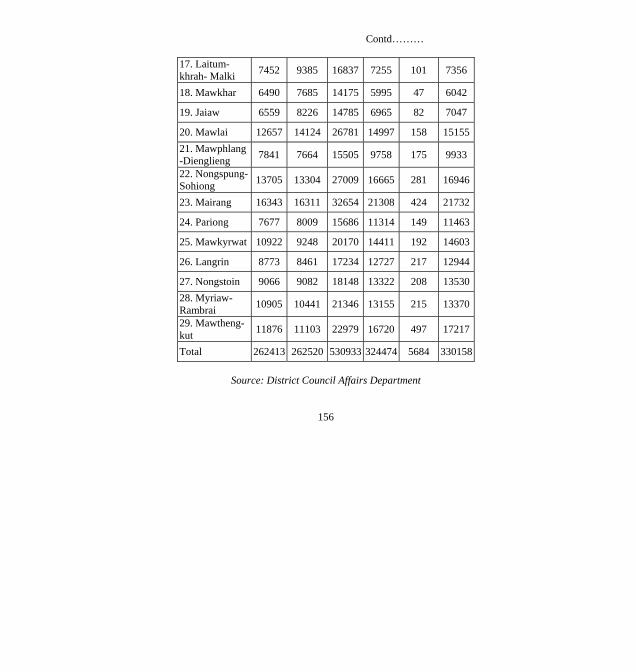
Contd………
17. Laitum- khrah- Malki 7452 9385 16837 7255 101 7356
18. Mawkhar 6490 7685 14175 5995 47 6042
19. Jaiaw 6559 8226 14785 6965 82 7047
20. Mawlai 12657 14124 26781 14997 158 1515521. Mawphlang-Dienglieng 7841 7664 15505 9758 175 9933
22. Nongspung-Sohiong 13705 13304 27009 16665 281 16946
23. Mairang 16343 16311 32654 21308 424 21732
24. Pariong 7677 8009 15686 11314 149 11463
25. Mawkyrwat 10922 9248 20170 14411 192 14603
26. Langrin 8773 8461 17234 12727 217 12944
27. Nongstoin 9066 9082 18148 13322 208 1353028. Myriaw- Rambrai 10905 10441 21346 13155 215 13370
29. Mawtheng- kut 11876 11103 22979 16720 497 17217
Total 262413 262520 530933 324474 5684 330158
Source: District Council Affairs Department
156
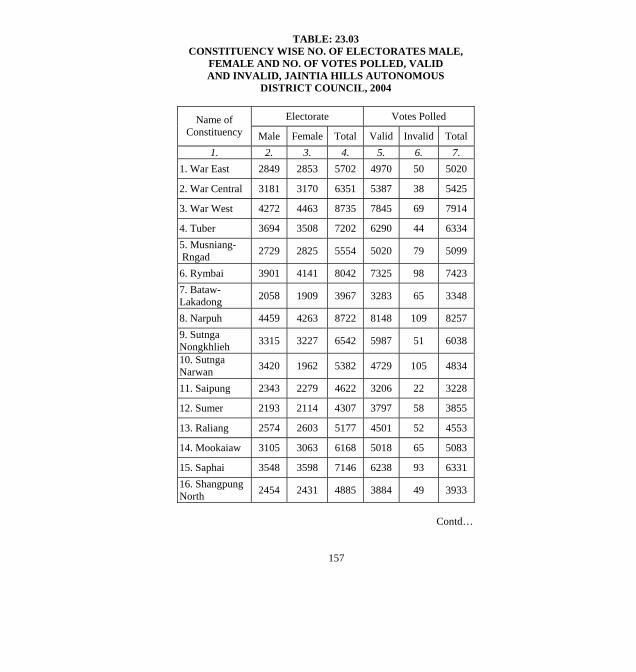
TABLE: 23.03 CONSTITUENCY WISE NO. OF ELECTORATES MALE,
FEMALE AND NO. OF VOTES POLLED, VALID AND INVALID, JAINTIA HILLS AUTONOMOUS
DISTRICT COUNCIL, 2004
Electorate Votes Polled Name of Constituency Male Female Total Valid Invalid Total
1. 2. 3. 4. 5. 6. 7. 1. War East 2849 2853 5702 4970 50 5020
2. War Central 3181 3170 6351 5387 38 5425
3. War West 4272 4463 8735 7845 69 7914
4. Tuber 3694 3508 7202 6290 44 6334 5. Musniang- Rngad 2729 2825 5554 5020 79 5099
6. Rymbai 3901 4141 8042 7325 98 7423 7. Bataw- Lakadong 2058 1909 3967 3283 65 3348
8. Narpuh 4459 4263 8722 8148 109 8257 9. Sutnga Nongkhlieh 3315 3227 6542 5987 51 6038
10. Sutnga Narwan 3420 1962 5382 4729 105 4834
11. Saipung 2343 2279 4622 3206 22 3228
12. Sumer 2193 2114 4307 3797 58 3855
13. Raliang 2574 2603 5177 4501 52 4553
14. Mookaiaw 3105 3063 6168 5018 65 5083
15. Saphai 3548 3598 7146 6238 93 6331 16. Shangpung North 2454 2431 4885 3884 49 3933
Contd…
157

Contd………
17. Shangpung South 2562 2616 5178 4577 116 4693
18. Borato Mukroh 2976 2835 5811 5407 26 5433
19. Shiliang Myntang 2231 2286 4517 4133 53 4186
20. MoobakhonKhanduli 2786 2799 5585 5335 44 5379
21. Nongjngi 2692 2790 5482 4784 43 4827
22. Nartiang 3176 3313 6489 5631 80 5711
23. Nongbah 3107 3301 6408 5179 76 5255 24. Ummulong Moodymmai 3067 3085 6152 5622 49 5671
25. Amwi- Khliehtyrshi 3547 3525 7072 6411 69 6480
26. Mukhla Wahiajer 3193 3226 6419 5580 57 5637
27. Jowai North 4643 4850 9493 8313 149 8462 28. Jowai Central 2223 2510 4733 3507 30 3537
29. Jowai South 3481 3816 7297 6128 61 6279
Total 89779 89361 179140 156325 1900 158225
Source: District Council Affairs Department
158

TABLE: 23.04 CONSTITUENCY WISE NO. OF ELECTORATES MALE,
FEMALE AND NO. OF VOTES POLLED, VALID AND INVALID, GARO HILLS AUTONOMOUS
DISTRICT COUNCIL, 2004
Electorate Votes Polled Name of Constituency Male Female Total Valid Invalid Total
1. 2. 3. 4. 5. 6. 7. 1. Siju 6962 6074 13036 8225 225 8450
2. Wagesik 6024 5621 11645 7644 103 7747
3. Silkigre 6097 5719 11816 8033 136 8169 4. Rongri- kimgre 4940 4847 9787 6526 194 6720
5. Gasuapara 5661 5620 11281 7493 123 7616
6. Barengapara 5289 5074 10363 7030 110 7140
7. Babelapara 5897 5881 11778 8590 124 8714
8. Amongpara 8263 7697 15960 10998 207 11205
9. Tura 21931 19797 41728 19412 256 1966810. Dengnak- para 8944 8450 17394 12289 230 12519
11. Boldamgre 7164 7217 14381 10002 177 10179
12. Nogorpara 7270 7064 14334 9730 234 9964
13. Zikzak 8730 8604 17334 13253 162 13415
14. Betasing 8149 6030 14179 9678 116 9794
15. Rochonpara 7516 7414 14930 10138 166 10304
16. Asanang 8494 8189 16683 10429 248 10677
Contd…
159
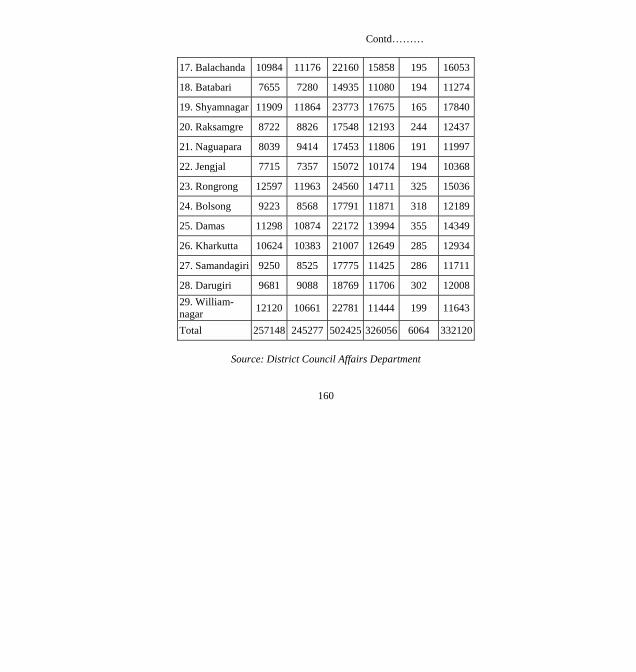
Contd………
17. Balachanda 10984 11176 22160 15858 195 16053
18. Batabari 7655 7280 14935 11080 194 11274
19. Shyamnagar 11909 11864 23773 17675 165 17840
20. Raksamgre 8722 8826 17548 12193 244 12437
21. Naguapara 8039 9414 17453 11806 191 11997
22. Jengjal 7715 7357 15072 10174 194 10368
23. Rongrong 12597 11963 24560 14711 325 15036
24. Bolsong 9223 8568 17791 11871 318 12189
25. Damas 11298 10874 22172 13994 355 14349
26. Kharkutta 10624 10383 21007 12649 285 12934
27. Samandagiri 9250 8525 17775 11425 286 11711
28. Darugiri 9681 9088 18769 11706 302 1200829. William- nagar 12120 10661 22781 11444 199 11643
Total 257148 245277 502425 326056 6064 332120
Source: District Council Affairs Department
160

TABLE: 23.05 NUMBER OF CONSTITUENCIES AND NUMBER OF ELECTORATES, 2008
Particulars Jaintia Hills
East Khasi Hills
West Khasi Hills
Ri-BhoiEast Garo Hills
West Garo Hills
SouthGaro Hills
Total
1. 2. 3. 4. 5. 6. 7. 8. 9. 1. No. of Constituencies
a. General - 3 - - - 2 - 5 b. Reserved for Scheduled tribe 7 16 6 4 7 13 2 55
2. No. of Polling stations 231 459 167 122 199 333 38 1549
3. Total Electorate 158899 353182 142670 95641 147628 300588 34289 1232897
Source: Chief Electoral Officer, Meghalaya, Shillong
161

TABLE: 23.06
RESULT OF THE LOK SABHA ELECTION 2004
Electorate Votes Polled Constituencies
No. of Contesting Candidates Male Female Total Valid Invalid Total
1. 2. 3. 4. 5. 6. 7. 8. Shillong
Parliamentary 3 391114 393948 785062 368120 - 368120
Tura Parliamentary 2 257540 246772 504312 311637 - 311637
Meghalaya 5 648654 640720 1289374 679757 - 679757
Source: Chief Electoral Officer, Meghalaya, Shillong.
162
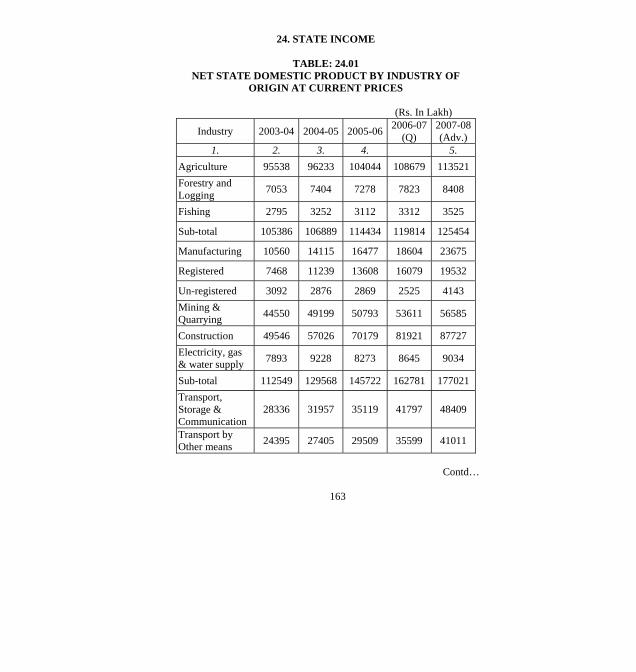
24. STATE INCOME
TABLE: 24.01 NET STATE DOMESTIC PRODUCT BY INDUSTRY OF
ORIGIN AT CURRENT PRICES
(Rs. In Lakh)
Industry 2003-04 2004-05 2005-06 2006-07(Q)
2007-08(Adv.)
1. 2. 3. 4. 5. Agriculture 95538 96233 104044 108679 113521 Forestry and Logging 7053 7404 7278 7823 8408
Fishing 2795 3252 3112 3312 3525
Sub-total 105386 106889 114434 119814 125454
Manufacturing 10560 14115 16477 18604 23675
Registered 7468 11239 13608 16079 19532
Un-registered 3092 2876 2869 2525 4143 Mining & Quarrying 44550 49199 50793 53611 56585
Construction 49546 57026 70179 81921 87727 Electricity, gas & water supply 7893 9228 8273 8645 9034
Sub-total 112549 129568 145722 162781 177021 Transport, Storage & Communication
28336 31957 35119 41797 48409
Transport by Other means 24395 27405 29509 35599 41011
Contd…
163
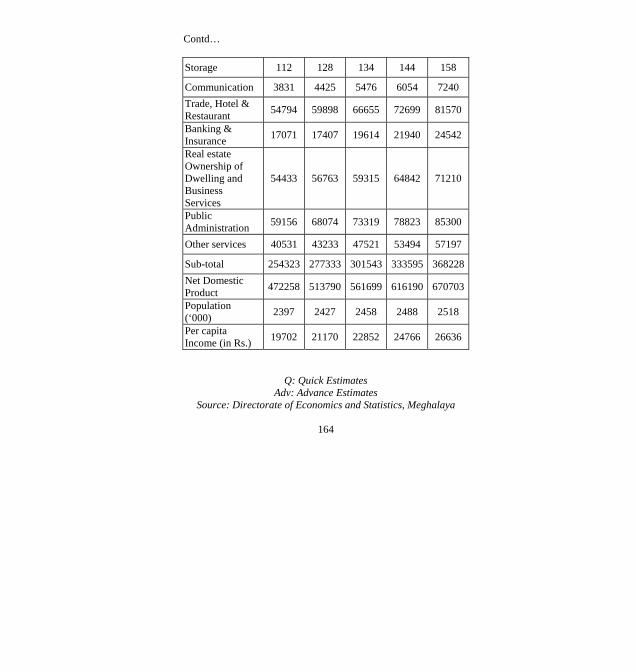
Contd…
Storage 112 128 134 144 158
Communication 3831 4425 5476 6054 7240 Trade, Hotel & Restaurant 54794 59898 66655 72699 81570
Banking & Insurance 17071 17407 19614 21940 24542
Real estate Ownership of Dwelling and Business Services
54433 56763 59315 64842 71210
Public Administration 59156 68074 73319 78823 85300
Other services 40531 43233 47521 53494 57197
Sub-total 254323 277333 301543 333595 368228Net Domestic Product 472258 513790 561699 616190 670703
Population (‘000) 2397 2427 2458 2488 2518
Per capita Income (in Rs.) 19702 21170 22852 24766 26636
Q: Quick Estimates Adv: Advance Estimates
Source: Directorate of Economics and Statistics, Meghalaya
164
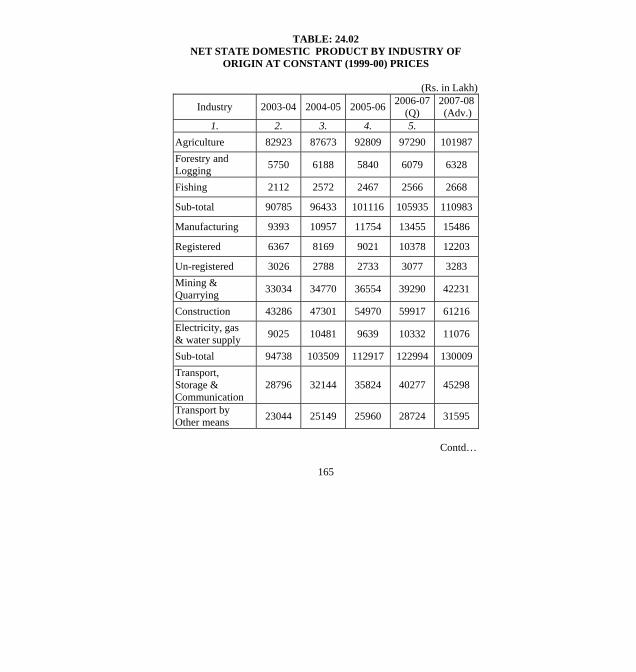
TABLE: 24.02 NET STATE DOMESTIC PRODUCT BY INDUSTRY OF
ORIGIN AT CONSTANT (1999-00) PRICES
(Rs. in Lakh)
Industry 2003-04 2004-05 2005-06 2006-07(Q)
2007-08 (Adv.)
1. 2. 3. 4. 5. Agriculture 82923 87673 92809 97290 101987 Forestry and Logging 5750 6188 5840 6079 6328
Fishing 2112 2572 2467 2566 2668
Sub-total 90785 96433 101116 105935 110983
Manufacturing 9393 10957 11754 13455 15486
Registered 6367 8169 9021 10378 12203
Un-registered 3026 2788 2733 3077 3283 Mining & Quarrying 33034 34770 36554 39290 42231
Construction 43286 47301 54970 59917 61216 Electricity, gas & water supply 9025 10481 9639 10332 11076
Sub-total 94738 103509 112917 122994 130009 Transport, Storage & Communication
28796 32144 35824 40277 45298
Transport by Other means 23044 25149 25960 28724 31595
Contd…
165

Storage 95 104 106 112 118
Communication 5657 6890 9758 11441 13585 Trade, Hotel & Restaurant 46232 48271 52137 54615 59341
Banking & Insurance 13641 14263 16100 17269 18524
Real estate Ownership of Dwelling and Business Services
37504 38132 38756 39315 39930
Public Administration 50635 56028 57877 58266 59691
Other services 36970 38245 40029 41304 42183
Sub-total 213778 227082 240723 251046 264967Net Domestic Product 399301 427024 454756 479975 505959
Population (‘000) 2397 2427 2458 2488 2518
Per capita Income (in Rs.) 16658 17595 18501 19292 20094
Q: Quick Estimates
Adv: Advance Estimates Source: Directorate of Economics and Statistics, Meghalaya
166
Contd
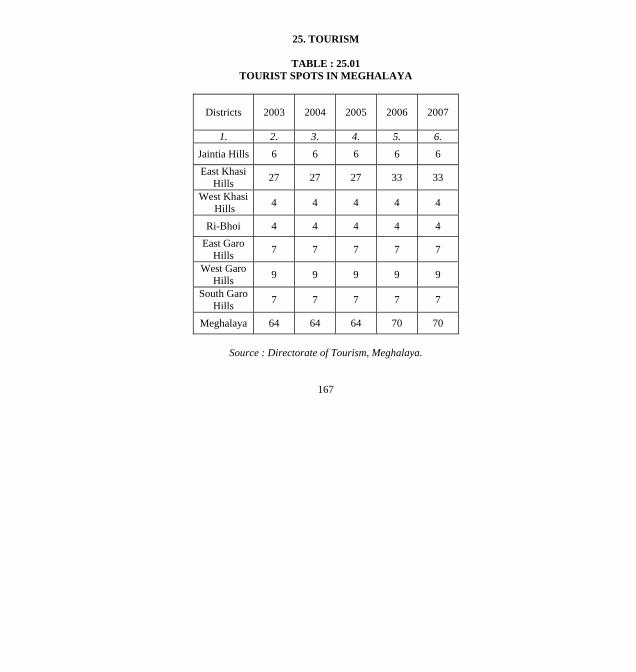
25. TOURISM
TABLE : 25.01 TOURIST SPOTS IN MEGHALAYA
Districts 2003 2004 2005 2006 2007
1. 2. 3. 4. 5. 6. Jaintia Hills 6 6 6 6 6 East Khasi
Hills 27 27 27 33 33
West Khasi Hills 4 4 4 4 4
Ri-Bhoi 4 4 4 4 4 East Garo
Hills 7 7 7 7 7
West Garo Hills 9 9 9 9 9
South Garo Hills 7 7 7 7 7
Meghalaya 64 64 64 70 70
Source : Directorate of Tourism, Meghalaya.
167

TABLE : 25.02
TOURISTS VISITING MEGHALAYA
Year Indian Foreign Total
1. 2. 3. 4.
1998 136952 1055 138007
1999 159730 1971 161701
2000 169929 2327 172256
2001 178697 2390 181087
2002 268529 3191 271720
2003 371953 6304 378257
2004 433495 12407 445902
2005 375911 5099 381010
2006 400287 4259 404546
2007 457685 5267 462952
Source : Directorate of Tourism, Meghalaya.
168

26. CENSUS OF MEGHALAYA STATE GOVERNMENT EMPLOYEES
TABLE: 26.01
CLASSIFICATION OF THE EMPLOYEES ACCORDING TO STATUS AND
TENURE OF SERVICE AS ON 31ST MARCH, 2006
Status Permanent Temporary Total Percentage to total
1. 2. 3. 4. 5. Group A 2171 455 2626 5.23
Gazetted Group B 476 118 594 1.18
Group B 1857 492 2349 4.68
Group C 25248 8768 34016 67.75 Non-Gazetted
Group D 6356 4269 10625 21.16
Total 36108 (71.91)
14102 (28.09) 50210 100.00
Figures in bracket are percentage to total
Source: Directorate of Economics and Statistics, Meghalaya
169
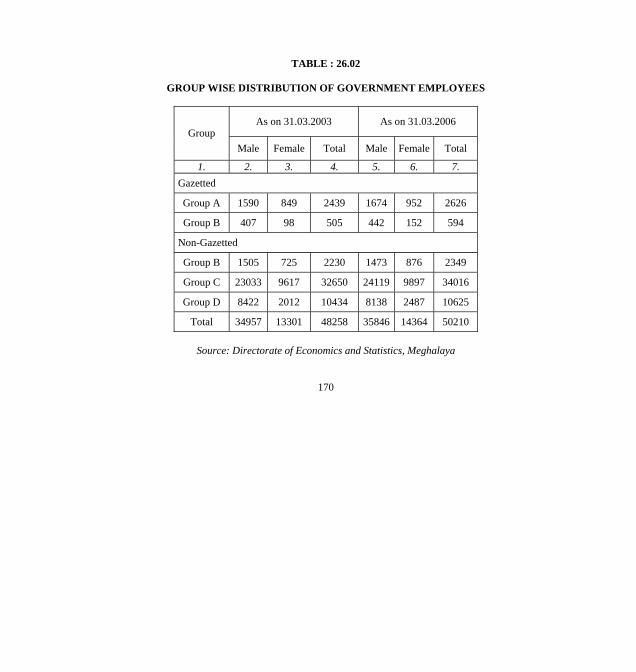
TABLE : 26.02
GROUP WISE DISTRIBUTION OF GOVERNMENT EMPLOYEES
As on 31.03.2003 As on 31.03.2006 Group
Male Female Total Male Female Total
1. 2. 3. 4. 5. 6. 7. Gazetted
Group A 1590 849 2439 1674 952 2626
Group B 407 98 505 442 152 594
Non-Gazetted
Group B 1505 725 2230 1473 876 2349
Group C 23033 9617 32650 24119 9897 34016
Group D 8422 2012 10434 8138 2487 10625
Total 34957 13301 48258 35846 14364 50210
Source: Directorate of Economics and Statistics, Meghalaya
170
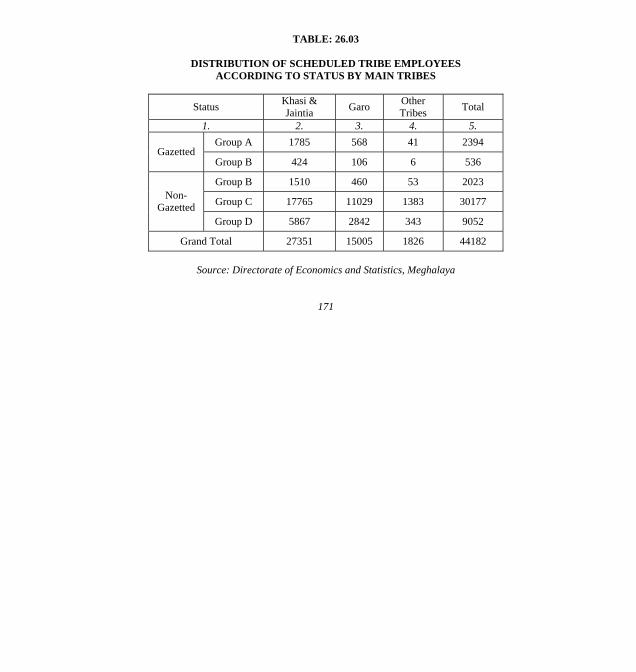
TABLE: 26.03
DISTRIBUTION OF SCHEDULED TRIBE EMPLOYEES ACCORDING TO STATUS BY MAIN TRIBES
Status Khasi & Jaintia Garo Other
Tribes Total
1. 2. 3. 4. 5. Group A 1785 568 41 2394
Gazetted Group B 424 106 6 536
Group B 1510 460 53 2023
Group C 17765 11029 1383 30177 Non-Gazetted
Group D 5867 2842 343 9052
Grand Total 27351 15005 1826 44182
Source: Directorate of Economics and Statistics, Meghalaya
171
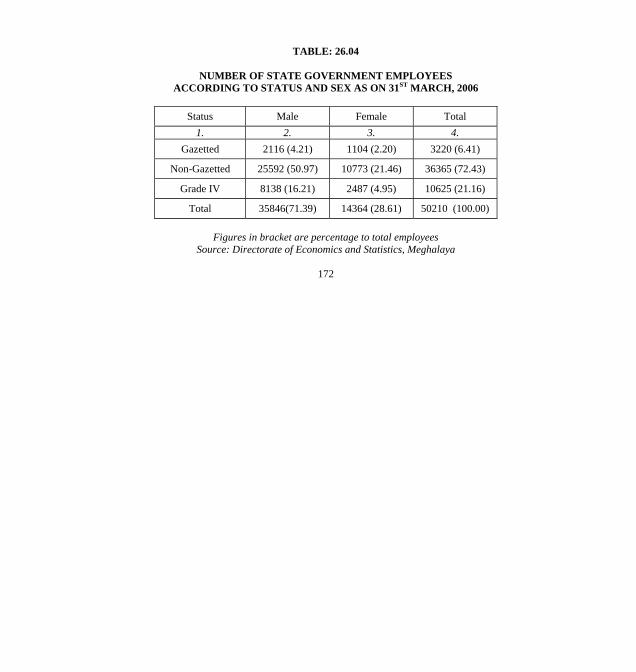
TABLE: 26.04
NUMBER OF STATE GOVERNMENT EMPLOYEES
ACCORDING TO STATUS AND SEX AS ON 31ST MARCH, 2006
Status Male Female Total 1. 2. 3. 4.
Gazetted 2116 (4.21) 1104 (2.20) 3220 (6.41)
Non-Gazetted 25592 (50.97) 10773 (21.46) 36365 (72.43)
Grade IV 8138 (16.21) 2487 (4.95) 10625 (21.16)
Total 35846(71.39) 14364 (28.61) 50210 (100.00)
Figures in bracket are percentage to total employees Source: Directorate of Economics and Statistics, Meghalaya
172
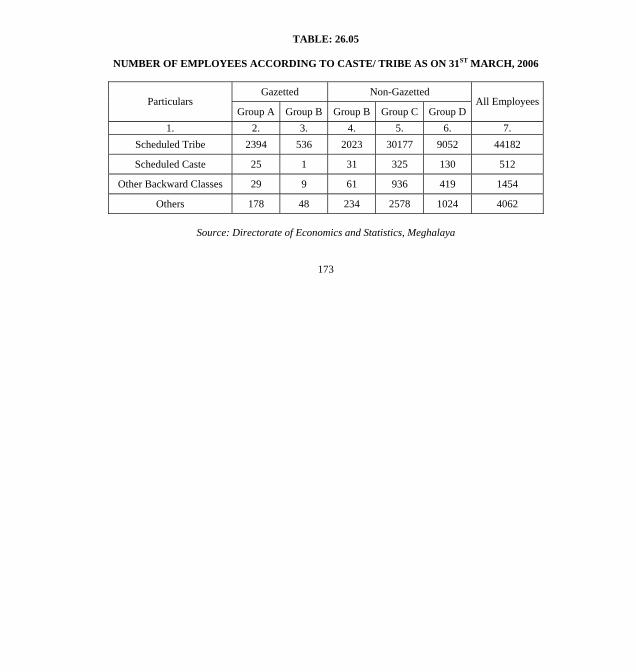
TABLE: 26.05
NUMBER OF EMPLOYEES ACCORDING TO CASTE/ TRIBE AS ON 31ST MARCH, 2006
Gazetted Non-Gazetted Particulars
Group A Group B Group B Group C Group DAll Employees
1. 2. 3. 4. 5. 6. 7. Scheduled Tribe 2394 536 2023 30177 9052 44182
Scheduled Caste 25 1 31 325 130 512
Other Backward Classes 29 9 61 936 419 1454
Others 178 48 234 2578 1024 4062
Source: Directorate of Economics and Statistics, Meghalaya
173

TABLE: 27.01
SOCIO ECONOMIC INDICATORS-MEGHALAYA, NORTH EASTERN REGION & INDIA
Sl. No. Items Meghalaya NER India 1. Area (Sq.Km) 22429 262179 3287263 2. No. of Districts 7 80 595 3. No. of C&RD Blocks 39 503 5537 4. No. of Sub- Divisions 8 NA NA 5. No. of Villages 5782 42462 638588 6. No. of Towns 16 254 5161 7. Population (in lakhs) 23.18 389.85 10287.37 8. Population Density (Per
sq.km) 103 134 313
9. Sex Ratio 972 936 933 10. Sex Ratio (0-6 years) 973 965 927 11. Literacy rate – Total 62.6 64.8 64.8 Male 65.4 72.3 75.3 Female 59.6 56.8 53.7 Gender gap in literacy rate
5.8 15.5 21.6
Contd
Source: Census of India, 2001
174

12 P.C. of Forest cover
(2003-04) 42.33 66.10 (2003) 20.64 (2003)
13. (a) Production of Rice (Lakh tonnes) (2006-07)
1.89 51.67 (2004-05)
831.32 (2004-05)
14. Production of Food grains (Lakh tonnes) (2006-07)
2.70 57.07 (2004-05)
1983.63 (2004-05)
15. Installed Power generating capacity (MW) (2006-07)
185.20 1141* (2004-05)
117594* (2004-05)
16. Percentage of villages electrified (2003-04)
57.1** 71** (2004-05) 74.1 ** (2004-05)
17. Percentage of household electrified 43% N.A. N.A. Contd
* ‘000 KW ** - Total villages as per 2001 Census
P - Provisional
Source: Chief Conservator of Forest Meghalaya Dte. of Economics and Statistics,
Meghalaya State Electricity Board, Meghalaya Statistical Abstract India, 2006
175

18. CD Ratio (Commercial Banks) March, 2008
30.43 39.39 74.16
19. CD Ratio (Regional Rural Banks )March, 2008
30.70 49.92 60.18
20. Birth Rate (Per ‘000) 2007 24.4 - 23.1 21. Death Rate (per ‘000) 2007 7.5 - 7.4 22. Infant Mortality rate (per ‘000)
2006 56 - 55
States Birth Rate Death Rate Infant mortality Rate
1 2 3 4 Arunachal Pradesh
22.2 5.1 37
Assam 24.3 8.6 66 Manipur 14.6 4.4 12 Mizoram 18.2 5.2 23 Nagaland 17.4 5.0 21 Sikkim 18.1 5.3 34 Tripura 17.1 6.5 39
Source: Registrar General of India
23. Maternal Mortality rate (MMR) 292 (2005-06) NA NA Contd
Source: Meghalaya Human Development Report, 2008
176
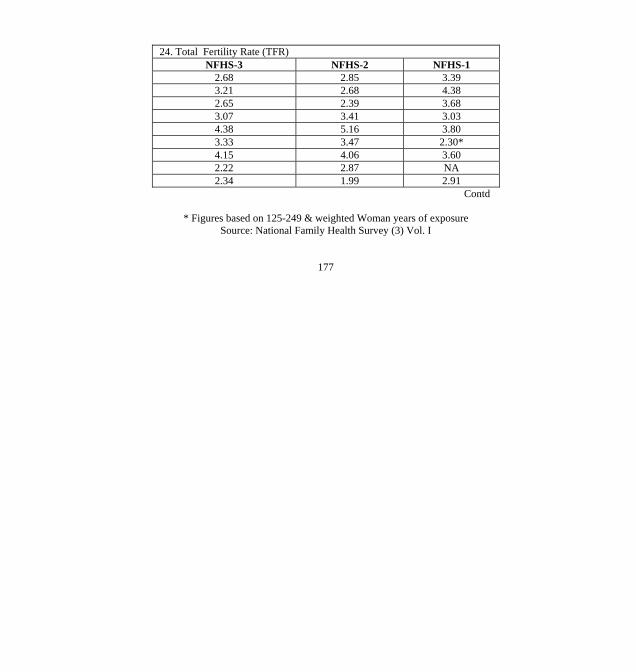
24. Total Fertility Rate (TFR)
NFHS-3 NFHS-2 NFHS-1 2.68 2.85 3.39 3.21 2.68 4.38 2.65 2.39 3.68 3.07 3.41 3.03 4.38 5.16 3.80 3.33 3.47 2.30* 4.15 4.06 3.60 2.22 2.87 NA 2.34 1.99 2.91
Contd
* Figures based on 125-249 & weighted Woman years of exposure Source: National Family Health Survey (3) Vol. I
177

Sl. No. Items Meghalaya NER India
25. Drop out rates in Primary level (Class I- IV) India 8.61 (2005-06) N.A N.A Meghalaya 9.14 (2007-08) N.A N.A Assam 9.32 (2005-06) N.A N.A Manipur 20.21 (2005-06) N.A N.A Mizoram 5.52 (2005-06) N.A N.A Nagaland 3.10 (2005-06) N.A N.A Sikkim 8.30 (2005-06) N.A N.A Tripura 7.35 (2005-06) N.A N.A Arunachal Pradesh 16.85 (2005-06) N.A N.A
Source : District Information system on Education published by National University Educational Planning and Administration
26. Road density (Per’ 00 Sq km
(2007-08) 36.40 66.09
(2002) (P)
75.54 (2002) (P)
Contd
Source: Chief Engineer P.W.D. Meghalaya, Shillong. Central Statistical Organisation, Government of India, 2005-2006
178

Percentage of Anaemia in Women 15-49 years by States, India, 2005-2006
Mild Anaemia
Moderate Anaemia
Severe Anaemia
Any Anaemia
States
India 38.6 15.0 1.8 55.3 Arunachal Pradesh
36.6 12.5 1.6 50.6
Assam 44.8 21.2 3.4 69.5 Manipur 30.1 5.1 0.5 35.7 Meghalaya 32.8 12.6 1.8 47.2 Mizoram 29.1 8.8 0.7 38.6 Sikkim 42.1 16.2 1.7 60.0 Tripura 49.0 14.8 1.3 65.1 Nagaland NA NA NA NA
P- Provisional N.A.- Not available
Source: (1) Chief Engineer P.W.D, Meghalaya, Shillong (2) Chief Conservator of Forest, Meghalaya, Shillong
(3) Directorate of Economics and Statistics, Meghalaya, Shillong (4) Meghalaya State Electricity Board, Shillong
(5) Reserve Bank of India, March, 2007 (6) Central Statistical Organisation, Government of India, 2005-2006.
(7) National Family Health Survey, NFHS 3 Vol. I
179
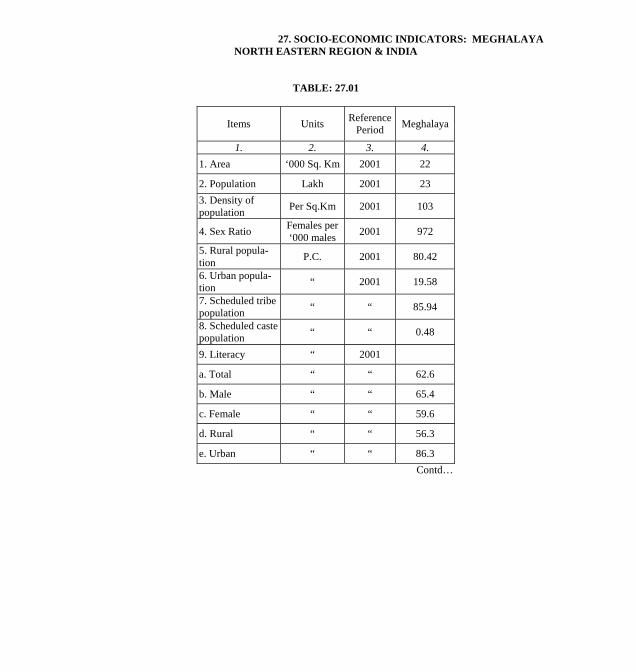
27. SOCIO-ECONOMIC INDICATORS: MEGHALAYA NORTH EASTERN REGION & INDIA
TABLE: 27.01
Items Units ReferencePeriod Meghalaya
1. 2. 3. 4. 1. Area ‘000 Sq. Km 2001 22
2. Population Lakh 2001 23 3. Density of population Per Sq.Km 2001 103
4. Sex Ratio Females per ‘000 males 2001 972
5. Rural popula- tion P.C. 2001 80.42
6. Urban popula- tion “ 2001 19.58
7. Scheduled tribepopulation “ “ 85.94
8. Scheduled castepopulation “ “ 0.48
9. Literacy “ 2001
a. Total “ “ 62.6
b. Male “ “ 65.4
c. Female “ “ 59.6
d. Rural “ “ 56.3
e. Urban “ “ 86.3 Contd…

Contd…
10. Total workers (main + marginal)as percentage to total population
P.C. 2001 41.8
11. Percentage to total workers (main + marginal)
“ “
a. Cultivators “ “ 48.14 b. Agricultural labourers “ “ 17.70
c. Workers engaged in house-hold industry, manufacturing, processing & repairs
“ “ 2.19
d. Other workers “ “ 31.97
12. Birth rate Per ‘000 2005 25.1
13. Death rate Per ‘000 2005 7.5 14. Infant mortality rate Per ‘000 2003-05 49
15. Net area sownas percentage to total area
P.C. 2004-2005(P) 9.76
Contd…..
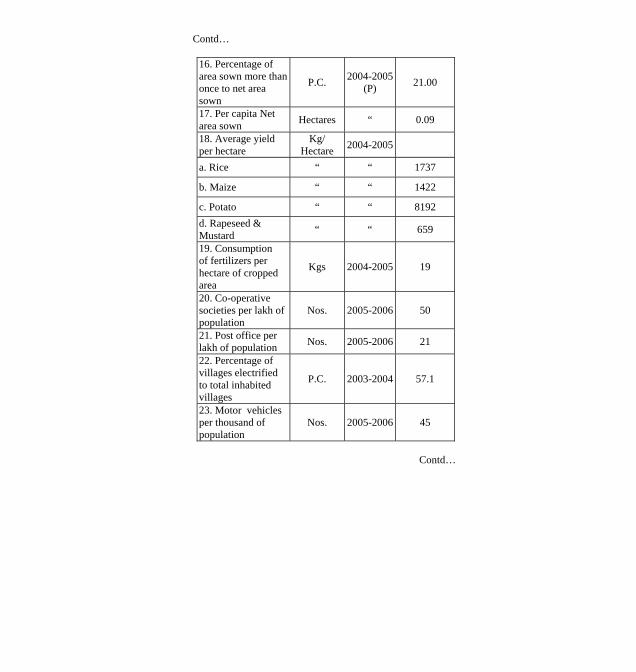
Contd…
16. Percentage of area sown more than once to net area sown
P.C. 2004-2005(P) 21.00
17. Per capita Net area sown Hectares “ 0.09
18. Average yield per hectare
Kg/ Hectare 2004-2005
a. Rice “ “ 1737
b. Maize “ “ 1422
c. Potato “ “ 8192 d. Rapeseed & Mustard “ “ 659
19. Consumption of fertilizers per hectare of cropped area
Kgs 2004-2005 19
20. Co-operative societies per lakh of population
Nos. 2005-2006 50
21. Post office per lakh of population Nos. 2005-2006 21
22. Percentage of villages electrified to total inhabited villages
P.C. 2003-2004 57.1
23. Motor vehicles per thousand of population
Nos. 2005-2006 45
Contd…

Contd…
24. Road length per 100 sq.km of area Kms 2005-2006 36
25. Surfaced road per 100 sq. Km of area
Kms 2005-2006 21
26. Percentage of surface road to total road length
P.C. 2005-2006 59
27. Primary schools per thousand of population
Nos. 2005-2006 3
28. Middle schools per ten thousand of population
Nos. 2005-2006 8
29. High & Higher Secondary schools Per lakh of population
Nos. 2005-2006 28
30. Teacher-pupil ratio Nos. 2005-2006
a. Primary “ “ 34
b. Middle “ “ 24 c. High/ Higher Secondary “ “ 25
Contd…..
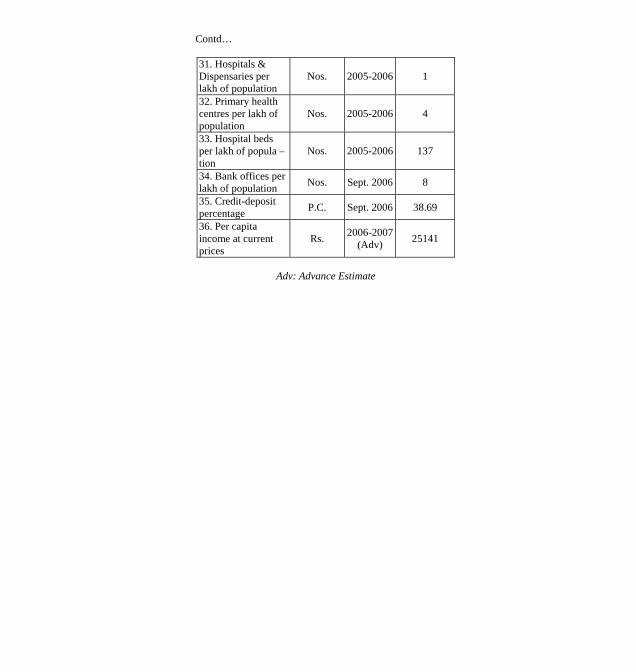
Contd…
31. Hospitals & Dispensaries per lakh of population
Nos. 2005-2006 1
32. Primary health centres per lakh of population
Nos. 2005-2006 4
33. Hospital beds per lakh of popula –tion
Nos. 2005-2006 137
34. Bank offices perlakh of population Nos. Sept. 2006 8
35. Credit-deposit percentage P.C. Sept. 2006 38.69
36. Per capita income at current prices
Rs. 2006-2007 (Adv) 25141
Adv: Advance Estimate
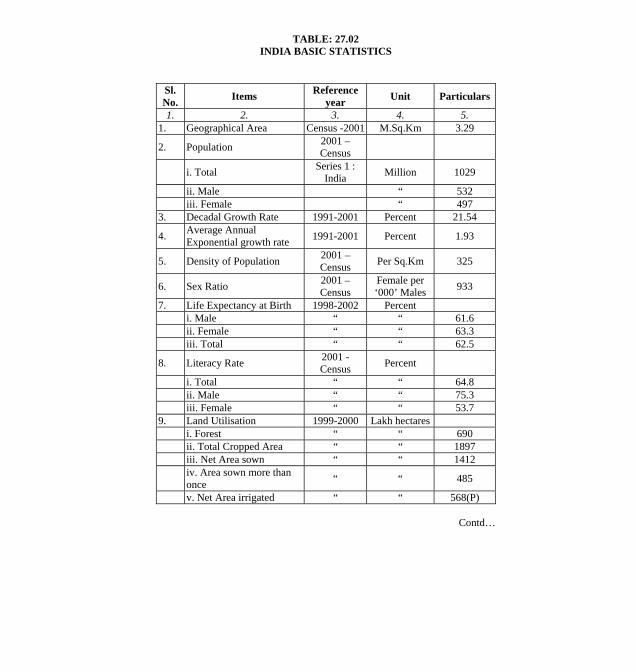
TABLE: 27.02 INDIA BASIC STATISTICS
Sl. No. Items Reference
year Unit Particulars
1. 2. 3. 4. 5. 1. Geographical Area Census -2001 M.Sq.Km 3.29
2. Population 2001 – Census
i. Total Series 1 : India Million 1029
ii. Male “ 532 iii. Female “ 497 3. Decadal Growth Rate 1991-2001 Percent 21.54
4. Average Annual Exponential growth rate 1991-2001 Percent 1.93
5. Density of Population 2001 – Census Per Sq.Km 325
6. Sex Ratio 2001 – Census
Female per ‘000’ Males 933
7. Life Expectancy at Birth 1998-2002 Percent i. Male “ “ 61.6 ii. Female “ “ 63.3 iii. Total “ “ 62.5
8. Literacy Rate 2001 - Census Percent
i. Total “ “ 64.8 ii. Male “ “ 75.3 iii. Female “ “ 53.7 9. Land Utilisation 1999-2000 Lakh hectares i. Forest “ “ 690 ii. Total Cropped Area “ “ 1897 iii. Net Area sown “ “ 1412
iv. Area sown more than once “ “ 485
v. Net Area irrigated “ “ 568(P) Contd…

Contd…
10. Production of some principal crops 2003-2004 Million
tonnes
i. Rice “ “ 88.2
ii. Wheat “ “ 72.1
iii. Total cereals “ “ 198.5
iv. Total pulses “ “ 14.9
v. Total foodgrains “ “ 213.5
vi. Rape & mustard “ “ 6.2
vii. Potato “ “ 23.3
viii. Sugarcane “ “ 237.3
ix. Maize “ “ 14.9
11. Index Number of (Base: Trennium ending 1981-82 = 100)
2003-2004
i. Area under principal crops “ “ 99.9
ii. Agricultural production “ “ 181.0
iii. Yield of principal crops “ “ 160.0
12. Index Number of 2004-2005
i. Wholesale price of all commodities (Base: 1933-94 = 100)
“ “ 187.3
ii. Consumer price of Industrial Workers (Base: 1982 = 100) General
“ “ 520
13. Gross National Product at factor cost (Quick Estimates)
2004-2005(Q) Rs. crore
i. At Current Prices “ 2825981
ii. At Constant (1999-2000) Prices “ 2376729
Contd…
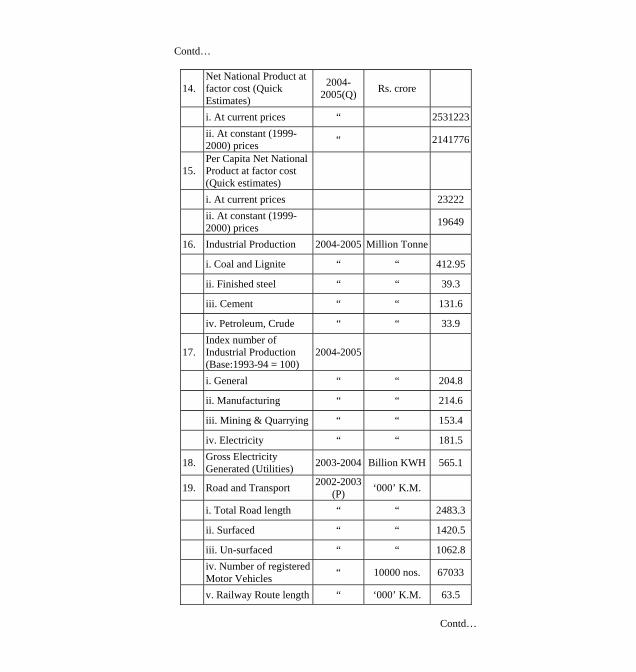
Contd…
14. Net National Product at factor cost (Quick Estimates)
2004-2005(Q) Rs. crore
i. At current prices “ 2531223
ii. At constant (1999-2000) prices “ 2141776
15. Per Capita Net National Product at factor cost (Quick estimates)
i. At current prices 23222
ii. At constant (1999-2000) prices 19649
16. Industrial Production 2004-2005 Million Tonne
i. Coal and Lignite “ “ 412.95
ii. Finished steel “ “ 39.3
iii. Cement “ “ 131.6
iv. Petroleum, Crude “ “ 33.9
17. Index number of Industrial Production (Base:1993-94 = 100)
2004-2005
i. General “ “ 204.8
ii. Manufacturing “ “ 214.6
iii. Mining & Quarrying “ “ 153.4
iv. Electricity “ “ 181.5
18. Gross Electricity Generated (Utilities) 2003-2004 Billion KWH 565.1
19. Road and Transport 2002-2003 (P) ‘000’ K.M.
i. Total Road length “ “ 2483.3
ii. Surfaced “ “ 1420.5
iii. Un-surfaced “ “ 1062.8
iv. Number of registered Motor Vehicles “ 10000 nos. 67033
v. Railway Route length “ ‘000’ K.M. 63.5 Contd…
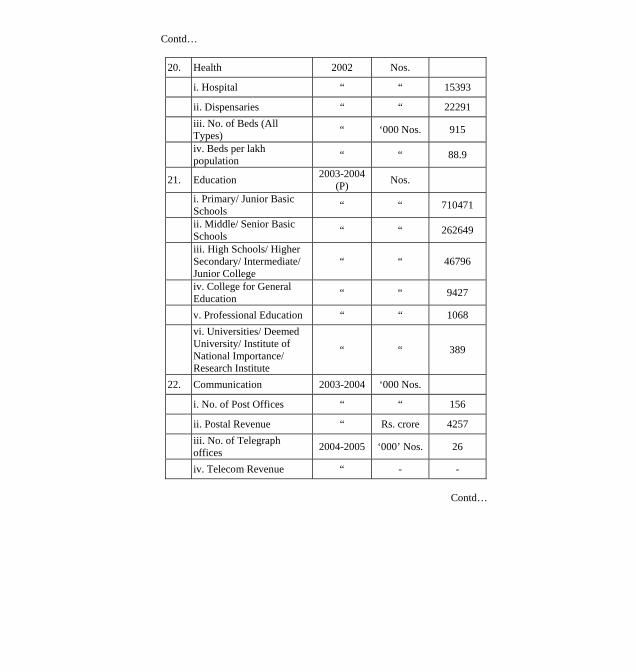
Contd…
20. Health 2002 Nos.
i. Hospital “ “ 15393
ii. Dispensaries “ “ 22291
iii. No. of Beds (All Types) “ ‘000 Nos. 915
iv. Beds per lakh population “ “ 88.9
21. Education 2003-2004 (P) Nos.
i. Primary/ Junior Basic Schools “ “ 710471
ii. Middle/ Senior Basic Schools “ “ 262649
iii. High Schools/ Higher Secondary/ Intermediate/ Junior College
“ “ 46796
iv. College for General Education “ “ 9427
v. Professional Education “ “ 1068
vi. Universities/ Deemed University/ Institute of National Importance/ Research Institute
“ “ 389
22. Communication 2003-2004 ‘000 Nos.
i. No. of Post Offices “ “ 156
ii. Postal Revenue “ Rs. crore 4257
iii. No. of Telegraph offices 2004-2005 ‘000’ Nos. 26
iv. Telecom Revenue “ - -
Contd…

Contd…
23. Banking
A. Reserve Bank of India liabilities
i. Notes in circulation 2005-2006 Rs. Crore 421922
ii. Notes held in Banking Department 2005-2006 Rs. Crore 18
B. Assets
i. Gold coin and Bullion 2005-2006 Rs. Crore 20974
ii. Foreign Securities “ “ 399769
iii. Rupee Coins “ “ 150
iv. Government of India Rupee Securities “ “ 1046
C. All Scheduled Commercial Banks
i. No. of Bank Offices (Reporting)
As on March 2006 Nos. 68681
ii. Deposits “ Rs. Crore 2093042
iii. Credit “ “ 1517497
iv. Credit Deposits Ratio “ “ 72.50
24. Foreign Trades 2004-2005 Rs. Crore
i. Exports (Merchandise) “ “ 361879
ii. Imports ( Merchandise) “ “ 490532
iii. Trade Balance (Merchandise) “ “ (-) 28653
Note: Professional Education includes Engineering, Technology and Architecture, Medical & Teacher Training Colleges P = Provisional; Q = Quick Estimates
Source: (1) Report on Population Census of India, 2001; (2) Economic Survey, India 2005-2006
(3) Quarterly Statistics on Deposits and Credit of Scheduled Commercial Banks, March, 2006 (4) Monthly Abstract of Statistics, Volume -59, March, 2006 (5) India in Figures, 2005