Embed Size (px)
Citation preview

RNASEL G1385A VARIANT AND
BREAST CANCER SUSCEPTIBILITY
A THESIS SUBMITTED TO
THE DEPARTMENT OF MOLECULAR BIOLOGY AND GENETICS
AND
THE INSTITUTE OF ENGINEERING AND SCIENCE OF
BILKENT UNIVERSITY
IN PARTIAL FULFILLMENT OF THE REQUIREMENTS
FOR THE DEGREE OF MASTER OF SCIENCE
BY
AKIN SEVİNÇ
AUGUST, 2003

i
I certify that I have read the thesis, and that in my opinion it is fully adequate, in scope
and in quality, as a thesis for the Master of Science.
____________________________________
Assoc. Prof. Dr. Uğur ÖZBEK
I certify that I have read the thesis, and that in my opinion it is fully adequate, in scope
and in quality, as a thesis for the Master of Science.
____________________________________
Asst. Prof. Dr. Işık G. YULUĞ
I certify that I have read the thesis, and that in my opinion it is fully adequate, in scope
and in quality, as a thesis for the Master of Science.
____________________________________
Assoc. Prof. Dr. Tayfun ÖZÇELİK
Approved for the Institute of Engineering and Science
____________________________________
Prof. Dr. Mehmet BARAY
Director of the Institute of Engineering and Science

ii
ABSTRACT
RNASEL G1385A VARIANT AND
BREAST CANCER SUSCEPTIBILITY
Akın SEVİNÇ
M.Sc. in Molecular Biology and Genetics
Supervisor: Assoc. Prof. Dr. Tayfun ÖZÇELİK
August 2003, 128 pages
RNASEL (MIM# 180435) encodes for the ubiquitously expressed ribonuclease L
(RNase L), which mediates the antiviral and pro-apoptotic activities of the 2-5A system.
Recently, RNASEL Arg462Gln (G1385A) variant is shown to be implicated in up to
13% of prostate cancer cases. Furthermore, RNASEL mutations segregating with disease
within hereditary prostate cancer (HPC) families, and loss of heterozygosity (LOH) in
tumor tissues have been reported. RNase L has been proposed to suppress the
development of cancer through its ability to degrade RNA and initiate a cellular stress
that leads to apoptosis. Analysis for allelic losses at the long arm of the chromosome 1
suggested that inactivation of a gene(s) on 1q23-32, which encompasses the RNASEL
locus, might contribute to the genesis of breast cancer. Based on chromosomal location
and function of RNASEL, and pleitropic effects of cancer associated mutations, we south
to investigate the hypothesis that Arg462Gln variant of RNASEL is associated with
breast cancer risk. The homozygote mutant (odds ratio (OR) = 0.75, 95% CI= 0.49-
1.14), heterozygote (OR=1.02, 95% CI= 0.76-1.37), or the genotype having at least one
mutant allele (OR= 0.94, 95% CI=0.72-1.24) was found to be not associated with the
breast cancer risk. The adjustment of the data with age, menopausal, smoking status,
body-mass-index, age at menarche, age of 1st pregnancy, number of children, and family
history of breast cancer did not change the results (homozygote mutant (OR= 0.72, 95%
CI= 0.46-1.12), heterozygote (OR= 0.95, 95% CI= 0.70-1.29), or genotype having at
least one mutant allele (OR= 0.89, 95% CI= 0.66-1.18)). In conclusion, our study
reports no association between the RNASEL G1385A variant and breast cancer risk.

iii
ÖZET
RNASEL G1385A MUTASYONUNUN
MEME KANSERİ İLE İLİŞKİSİ
Akın SEVİNÇ
Moleküler Biyoloji ve Genetik Yüksek Lisansı
Tez Yöneticisi: Doç.Dr. Tayfun ÖZÇELİK
Ağustos 2003, 128 sayfa
RNASEL (MIM# 180435), tüm dokularımizda sentezlenen ve 2-5A sisteminin
antivirütik ve pro-apoptotik aktivitelerini gerçekleştiren, “ribonükleaz L” (RNase L)
enzimini kodlar. RNASEL Arg462Gln (G1385A) varyantının, prostat kanserli hastaların
%13’ ünde etkili olduğu saptanmıştır. Ayrıca, RNASEL mutasyonlarının prostat kanserli
ailelerde hastalık ile kalıtıldığı ve tümör dokularında heterozigotluğun kaybı (Loss of
heterozygosity, LOH) rapor edilmiştir. RNase L’in, hücresel stress yaratarak
programlanmış hücre ölümünü başlattığı, ve kanser oluşumunu engellediği önerilmiştir.
1. kromozomun kısa kolundaki allel kayıplarının incelenmesi ile, RNASEL lokusunu da
içeren 1q23-32 bölgesindeki gen veya genlerin işlevlerini yitirebilecekleri ve meme
kanserinin oluşumunda etkili olabilecekleri gösterilmiştir. RNASEL’in kromozomal
lokalizasyonu ve fonksiyonu, ve kanserle ilişkili genlerin “pleiotropik” etkilerini göz
önüne alarak, RNASEL Arg462Gln varyantının meme kanseri ile ilişkisinin olduğu
hipotezini kurduk. Çalışmamız, homozigot mütant (odds ratio (OR) = 0.75, 95% CI=
0.49-1.14), heterozigot (OR=1.02, 95% CI= 0.76-1.37), veya en az bir mutant allele
sahip genotiplerin (OR= 0.94, 95% CI=0.72-1.24) meme kanseri oluşumuna bir etkisinin
olmadığını göstermiştir. Verilerin yaş, menaposal, sigara içme durumları, vücud-kütle
endeksleri, menarche ve ilk hamilelik yaşları, çocuk sayıları, ve ailelerindeki kanser
hikayelerine göre ayarlanmaları da sonucu değiştirmedi (homozigot mütantlarda (OR=
0.72, 95% CI= 0.46-1.12), heterozigotlarda (OR= 0.95, 95% CI= 0.70-1.29), veya en az
bir mütant allele sahip genotiplerde (OR= 0.89, 95% CI= 0.66-1.18)). Sonuç olarak,
çalışmamız RNASEL G1385A varyantı ile meme kanseri arasında bir ilişki olmadığını
gösterdi.

iv
ACKNOWLEDGEMENT
I gratefully acknowledge my advisor, Assoc.Prof.Dr. Tayfun ÖZÇELİK, for
teaching me how to be a scientist.
I also would like to thank Assist.Prof.Dr. Işık G. YULUĞ, Prof.Dr. Mehmet
ÖZTÜRK and all researchers of our department for providing us a scientific
environment to work.
I also gratefully acknowledge my undergraduate advisor, Prof.Dr. Feride
SEVERCAN for her invaluable and unconditioned support and help. She guided me
throughout during my undergraduate education and on the following years, as well. I
would also like to thank to Ayşegül GÖZEN for her help.
I extend my thanks to our collaborators (Betül BOZKURT and Ömer CENGİZ
from Ankara Numune Research and Teaching Hospital; Ali Esat KARAKAYA, Semra
SARDAŞ and Neslihan Aygün KOCABAŞ from Gazi University, Faculty of Pharmacy;
Güven LÜLECİ, Taner ÇOLAK and Esra MANGUOĞLU from Akdeniz University,
Faculty of Medicine; Drakoulis YANNOUKAKOS and Irene KONSTANTOPOULOU
from National Center for Scientific Research Demokritos Moelcular Diagnostic
Laboratory; Voutsinas GERASSIMOS and George NASIOULAS from National Center
for Scientific Research Demokritos Institute of Biology; Eirene PAPADOPOULOU
from Molecular Biology Research Center “HYGEIA”, Molecular Biology and
Cytogenetics Center; Lina FLORENTIN from Alfalab; Elena KONTOGIANNI from
IVF&GENETICS) for kindly providing us the samples used in our study, and Atilla
Halil Elhan for his help in statistical analysis.
I would also like to thank all Bilkent-MBG family for their help and friendship,
including our group members Cemaliye AKYERLİ, Elif UZ, and Gülsün Sevgi
BAĞIŞLAR for their help, and Banu SÜRÜCÜ, Suha KOÇOĞLU for their friendship.

v
I would like to also thank my close friends Ziya Haktan KARADENİZ, Burcu
DÜZEN, Hande ERSOY, Sevgi ADAK, Bengü SEVİL, Ayşe AYYILDIZ, İlter SEVER
and Gülsen ÇOLAKOĞLU for always being with me for all the time I know them.
Lastly, but most importantly, I extend my most sincere gratitude to my family for
their unconditional support.

vi
TABLE OF CONTENTS
SIGNATURE PAGE ………………………………………………………………...…....i
ABSTRACT ……….…………………………………………………………………..….ii
ÖZET ...………………………………………………………..………………………..…iii
ACKNOWLEDGEMENT…………………………………………………………...…....iv
TABLE OF CONTENTS ………………………………………………………………....vi
LIST OF TABLES ………………………....…………………………………………..…ix
LIST OF FIGURES ………………………….……………………………………...….....xi
ABBREVATIONS ………………………………………………………………..……....xiii
1. Introduction……………………………………………......………………………..……1
1.1. Introduction to cancer…………………………...…...……………………..……1
1.1.1. History of cancer……………………………………...……………………..…..1
1.1.2. Epidemiology of cancer……………….……...………...…………………….…2
1.1.3. Conceptualizing cancer………………………………...………………………..4
1.1.4. Cancer and related genes……………………...…………...……………………6
1.1.4.1. Tumor suppressor genes…….………….…………….………………….8
1.1.4.2. Oncogenes…………………….…………..…………….………………..9
1.1.4.3. Genomic variations at a glance………………………….…….………...10
1.1.5. Molecular profiling of cancer………………………………….…….…………12
1.1.6. Inherited predisposition………………………………………….….………….13
1.1.6.1. Strong predisposition……………………………………..….………….15
1.1.6.2. Weak predisposition……..…………………………………….………..18
1.2. Breast Cancer……………………..…………………………………….…….…20
1.2.1. Setting the stage…………………..…………………………………….………20
1.2.2. Genetics of breast cancer…………..…………………………………….……..26
1.2.2.1. Somatic mutations in breast cancer….……………………………..…...26
1.2.2.2. Germline mutations in breast cancer….……………………………..….28

vii
1.3. RNASEL……………………………………………...…………………………32
1.3.1. Prostate cancer………………………………………………………………….32
1.3.2. RNase L………………………………………………..……………………….35
1.3.3. RNASEL………………………………………………..……………………….40
1.4. Our Aim…………………………………………………..……………………..43
2. Materials and Methods……………………………………………..……………………44
2.1. Materials……………………………………………………..………………….44
2.1.1. DNA samples and collaborators…………..……………………………………44
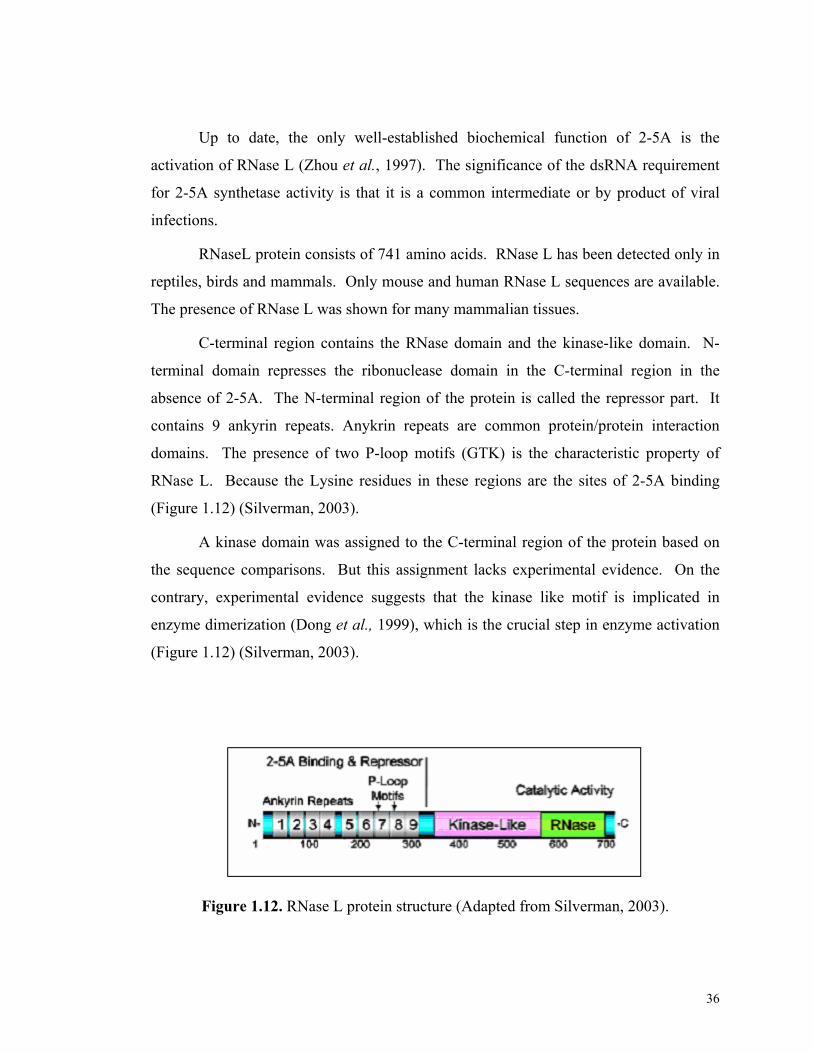
2.1.2. Study population………………………………………………………………..45
2.1.2.1. Patients……………………………………………….…………………46
2.1.2.2. Control group……………………………………………...…………….46
2.1.3. Primers………………………………………………………..………………...50
2.1.4. Chemicals and reagents…………………………………………………..…….51
2.1.5. PCR materials…………………………..………………………………………51
2.1.6. Standard solutions and buffers…………..……………………………………..52
2.2. Methods…………………………………..……………………………………..54
2.2.1. Amplification Refractory Mutation System (ARMS)…..……………………...55
2.2.1.1. Polymerase Chain Reaction (PCR) for ARMS…………..……………..56
2.2.2. Agarose gel electrophoresis……………………………..……………….…….56
2.2.3. Genotyping of individuals………………………………..…………………….57
2.2.4. Statistical analysis………………………………………..……………………59
2.2.4.1. Chi-square (χ2) test……………………………......……………….…...59
2.2.4.2. P-value calculation……………………………………………………..60
2.2.4.3. Odds ratio calculation……………………………..…………………...61
2.2.4.4. Mutlivariate adjusted odds ratio calculation…….…………………......63
2.2.4.5. Calculation of the power of our study………………..……………..…64

viii
3. Results…………………………………………………………………...………………65
3.1. Cohort information………………………………………………...……………65
3.2. Genotyping of RNASEL and genotype distributions…………...……………….66
3.3. Statistical analysis………………………………………………………………75
3.3.1. P-value calculation……………………………………………………………..75
3.3.2. Results of odds-ratio calculation (Crude)………………….…………………...76
3.3.3. Results of odds-ratio calculation (Adjusted)………….……………..................77
3.3.4. Results of power calculation for our study……………………………………..78
3.3.5. Further possible stratification of the Turkish group data………………………78
3.3.5.1. Stratification according to body-mass-index………………….………...78
4. Discussion………………………………………………………………….……………80
5. Conclusion and Future Perspectives…………………………………………………….85
6. References……………………………………………………………………….………87
6.1. Articles………………………………………………………………………….87
APPENDIX A: The results……………………………………………………………….102

ix
LIST OF TABLES
Table 1.1.
Inherited predisposition to cancer…………………………………………….14
Table 1.2.
List of familial cancer genes and syndromes………………………………….17
Table 1.3.
TNM staging…………………………………………………………………...25
Table 1.4.
Hereditary cancer syndromes that feature breast cancer………………………28
Table 1.5.
Summary of RNASEL sequence variants implicated in patients with HPC.…..42
Table 2.1.
Selected characteristics of our study population………………………………48
Table 2.2
List of primers for the amplification reactions………………………………..50
Table 2.3.
Chemicals, reagents and their producers……………………………………...51

x
Table 2.4.
Sample 2x2 Table for Odds Ratio Analysis…………………………………..63
Table 3.1.
Characteristics of participants in our study……………………………………67
Table 3.2.
Distribution of RNASEL G1385A genotypes and
breast cancer risk in the age matched controls and breast cancer patients……70
Table 3.3.
The allele frequencies and
sample odds ratios in subgroups according to menopausal status……………..71
Table 3.4.
P-values………………………………………………………………………...75
Table 3.5.
Odds ratios in low and high bmi of Turkish group…………………………….79

xi
LIST OF FIGURES
Figure 1.1.
Hallmarks of cancer……………………………………………………………5
Figure 1.2.
Genetic alterations in progression of cancer…………………………………...7
Figure 1.3.
Caretakers and gatekeepers…………………………………………………….9
Figure 1.4.
DNA damage, repair and consequences……………………………………….11
Figure 1.5.
Breast cancer susceptibility genes……………………………………………..19
Figure 1.6.
Mammary gland and its development…………………………………………21
Figure 1.7.
Main anatomic structures of breast……………………………………………22
Figure 1.8.
Summary of factors influencing breast carcinogenesis………………………..23
Figure1.9.
A hypothetical multi stage model of breast carcinogenesis…………………..24
Figure 1.10.
Possible role of RNase L in prostate carcinogenesis………………………….34
Figure 1.11.
Role of RNase L in the antiviral activity of IFNs…………………………….35

xii
Figure 1.12.
RNase L protein structure………………………………………………….36
Figure 1.13.
Functional model for the activation of RNase L by 2-5A…………………37
Figure 1.14.
The pro-apoptotic role of RNase L………………………………………...39
Figure 1.15.
RNASEL……………………………………………………………………40
Figure 2.1.
Cohort facts………………………………………………………………...45
Figure 2.2.
“Hasta Anket Formu”……………………………………………………...49
Figure 2.3.
pUC Mix Marker, 8………………………………………………………...52
Figure 2.4.
Mass Ruler…………………………………………………………………53
Figure 2.5.
Schematic representation of RNASEL genotyping…………………………58
Figure 3.1.
Genotyping of RNASEL……………………………………………………68

xiii
ABBREVATIONS
2-5A 2’,5’-linked oligoadenylates
A Adenine nucleotide
APC Adenopolyposis Coli
Arg Arginine
ARMS Amplification Refractory Mutation System
ASPCR Allele Specific Polymerase Chain Reaction
AT Ataxia telangiectasia
ATM Ataxia telangiectasia mutated
BMI Body Mass Index
Bp Base pairs
BRCA1 Breast Cancer Susceptibility Gene 1
BRCA2 Breast Cancer Susceptibility Gene 2
Cdk Cyclin dependent kinase
CHEK2 Cell cycle checkpoint kinase 2
CI Confidence interval
DNA Deoxyribonucleic Acid
dNTP Deoxynucleotide triphosphate
E Expected (in statistical calculations)
EDTA Ethylene diamine tetra acetic acid
F Forward primer
G Guanine nucleotide
G6PD Glucose-6-phosphate dehydrogenase
Gln Glutamine
GTP Guanosine Triphosphate
HPC Hereditary Prostate Cancer
IBC Inflammatory Breast Cancer
IFN Interferons
IL Interleukin
kb Kilobase(s)
kDa Kilo Dalton(s)

xiv
LOH Loss of Heterozygosity
M Molar
mg Milligram
min Minutes
ml Milliliter
MLH1 Mut H Homolog 1
MSH2 Mut S Homolog 2
mM Millimolar
µl Microliter
µg Microgram
O Observed (in statistical calculations)
OAS 2-5A synthetases
OR Odds Ratio
PASA Polymerase chain reaction amplification of specific alleles
PC Prostate Cancer
PCR Polymerase Chain Reaction
PIN Prostate intraepithelial neoplasia
pmol Picomol
R Reverse primer
RB Retinoblastoma
RNA Ribonucleic Acids
rpm Revolutions per minute
s second(s)
T Tymine
TBE Tris Borate EDTA
TP53 Tumor Protein p53
UV Ultraviolet light
w/v Weight per volume
WHO World Health Organization
χ2 Chi-square

1
1. Introduction
1.1. Introduction to cancer
“Cancer” is accepted as a group of diseases characterized by uncontrolled
cellular growth and the spread of abnormal cells, which is believed to be dictated by a
series of genetic alterations.
It is now well recognized that, cancer is one of the most common and severe
problems of human population. According to World Health Organization (WHO), more
than 1.2 million people worldwide are diagnosed with breast cancer annually. An
estimated 211,300 new cases of invasive breast cancer are expected to occur among
women in the United States during 2003, being the most commonly diagnosed non-skin
cancer in women. In addition, 1,300 cases of male breast cancer are also predicted. An
estimated 40,200 deaths (39,800 women and 400 men) are anticipated from breast
cancer this year in U.S. only (American Cancer Society, “http://www.cancer.org”). In
order to completely understand the concept of cancer, we must also know the history of
today’s problem.
1.1.1. History of cancer
Although the ancient origin of the word “cancer” is uncertain, it is believed to be
derived from Latin for “crab”, presumably because the cancer “adheres to any part that it
seizes upon in an obstinate manner like the crab”.
Incidents of breast cancer have been documented back to the early Egyptians,
when the popular treatment was “cautery” of the diseased tissue. Surgery was practiced,
but it was an extremely radical treatment since anesthesia or antisepsis was not
available. The reason for the disease was suggested to be melancholia (by the Greek
physician Caudius Galen, 130-200 AD), where the suggested treatments were special
diets. The next suggested treatment to control bleeding was mastectomy (by Andreas

2
Vesalius, a Flemish anatomist of Renaissance). Due to lack of detailed records, the level
of success associated with these archaic treatments is not known.
After the mid 1800’s, surgeons first began to keep detailed records, which
provides us the information that the patients treated with mastectomy had a high rate of
recurrence within eight years – especially when the glands or lymph nodes were
affected. Nevertheless, the common therapy was removal of the breast and the
surrounding glands in an effort to stave off any further tumor development, which shows
us the belief, that breast cancer is a systemic disease and could spread and affect other
parts of the body. The cure was based only on a “three-year survival rate”. Although it
is hardly for today, such a survival rate was acceptable at those times.
The treatment improvements were noticeable between the 1930’s and 1950’s,
because of a better classification of the stage and progression of the tumors. Therefore,
the survival rates increased dramatically during the 1900’s (ten year survival rate, 10%
in the 1920’s to roughly 50% in the 1950’s).
It was not before 1975, that the role of the accumulation of the genetic variations
was shown in the development of cancer. Following that discovery, scientists identified
approximately 70 genes that can spur cancerous growths and at least a dozen genes that
should deter such growth but do not (Breast Cancer Society of Canada,
“http://www.bcsc.ca”).
1.1.2. Epidemiology of cancer
Knudson’s “two-hit” hypothesis and its molecular confirmation in
retinoblastoma focused attention in certain rare cancers (Knudson, 1971), and the
contribution of “genetic susceptibility” (Macleod, 2000).
Before 1980s, the origins of common cancers were dominantly viewed as
“environmental”. This was because of the studies performed in 1960s and 1970s. The
varying frequencies of cancer types observed in different populations and the
convergence towards local cancer rates among immigrants also strengthened the

3
“environmental view” (Peto, 2001). The transition of the cancer pattern of an immigrant
population from their original to the pattern of their new country was another supporting
evidence (Balmain et al., 2003). The transition of cancer pattern was also verified
among the Turks residing in Germany (Zeeb et al., 2002). The results of these studies
led scientists to conclude that most cancers are in principle preventable and many could
be avoided by a suitable choice of life style and environment.
By the early 1980s, many important clues about the causes of cancer were
identified and this increased the emphasis on the role of genetic predisposition in the
common cancers (Peto, 2001, and Balmain et al., 2003).
After a quarter century of rapid advances, cancer research has generated a rich
and complex body of knowledge, underlining the involvement of dynamic changes in
the genome (Hanahan et al., 2000). Besides the genetic susceptibility, many other
factors have been identified. The most important ones being;
1. Oncogenic viruses: Identification of the carcinogenic effects of infectious
pathogens was one of the most important discoveries of the past two decades
(Peto, 2001).
2. Smoking: The identification of the effect of tobacco in cancer development
was one of the most important hallmarks in history of cancer epidemiology
(Peto, 2001). Now it is well understood that incidences of many cancer types
are increased by tobacco use, i.e. lung cancer, esophageal cancer, stomach
cancer, liver cancer. Tobacco use cause 13% (and will probably cause 33%)
of deaths in men (Liu et al., 1998).
3. Reproductive and hormonal factors: The impact of reproductive and
hormonal factors was first verified on breast and ovarian cancer (Peto, 2001,
and Baselga et al., 2003).
4. Obesity: Up to a third of cancers of breast, colon, kidney, and digestive tract
were shown to be due to obesity (Josefson et al., 2001). Although the impact
of obesity is subject to change among populations, it is clearly stated for the
post-menopausal breast cancer and cancer of the endometrium, gall-bladder
and kidney (Bergstorm et al., 2001).

4
1.1.3. Conceptualizing cancer
The word “cancer” does not refer to a single disease. Actually it is used to name
a great variety of diseases characterized by masses of growth in an uncontrolled manner.
The growth of the mass of the cells is autonomous, uncontrollable, increasingly
malignant, and if untreated, invariably fatal. A tumor is formed by a parenchyma of
proliferating cells, with a stroma of connective tissue and blood vessels (Thompson,
1991, p365). There are three main forms of tumors,
1. Sarcomas, in which the tumor has arisen in mesenchymal tissue,
2. Carcinomas, which originate in epithelial tissue,
3. Hematopoetic and lymphoid malignancies, such as leukemias and lymphomas.
Within the major groups, tumors are classified by site, tissue type and degree of
malignancy (Thompson, 1991, p365).
The presence of “uncontrolled growth” is gained through the accumulated
variations in the genetic materials of the cells. It was suggested that, the vast catalog of
cancer cell genotypes is a manifestation of six essential alterations in cell physiology
that collectively dictate malignant growth: self-sufficiency in growth signals,
insensitivity to growth-inhibitory (antigrowth) signals, evasion of programmed cell
death (apoptosis), limitless replicative potential, sustained angiogenesis, and tissue
invasion and metastasis (Hanahan et al., 2000). These alterations are summarized in
Figure 1.1, where the crab is the cancer, and the six legs are the acquired capabilities of
cancer.

5
Figure 1.1. Hallmarks of cancer.
Genomic integrity may be disrupted in many ways. It may be sporadic, because
of environmental factors (i.e. ionizing radiation), lifestyle (i.e. smoking, diet), or
hereditary (i.e. germ line tumor-suppressor gene mutations).
Up to now, the only environmental exposure proven to induce breast cancer is
ionizing radiation (Grover et al., 2002). The reactive oxygen species (ROS) produced
upon radiation exposure causes the genomic damage.
Documentation of family history in different types of cancers has shown that
some individuals are more susceptible to cancer because of their genomic heritage.
More than a century ago, Paul Broca described four generations of breast cancer in his
wife’s family which underlined, probably for the first time, contribution of the
hereditary factors in tumorigenesis (Lynch et al., 1994).
Population-based epidemiological studies showed the familial pattern of some
cancers. This supported the implementation of genetic models rather than the
environmental ones. Furthermore, it was also shown that, genetic alterations might
account for a substantial fraction of cancer incidence without necessarily causing evident
familial clustering. The demonstration of genetic linkage in breast cancer (Hall et al.,
1990) by the use of DNA sequence polymorphisms dispelled the contribution of genetic
susceptibility (Balmain et al., 2003).

6
1.1.4. Cancer and related genes
All cancers are found to be the result of abnormalities in DNA sequence. During
its life, genetic material is subject to changes, and these changes are repaired by the
sophisticated genome maintenance mechanisms. If these changes can not be repaired,
they may result in the stable alteration of a critical gene, possibly providing a growth
advantage to the cell in which it has occurred and result in the emergence of an
expanded clone, derived from this cell (Figure 1.2) (Futreal et al., 2001).
With few exceptions, cancers are derived from single somatic cells and their
progeny (Ponder, 2001). This clonal nature of cancer is supported by many evidences.
The original evidence came from the study of tumors in women heterozygous for the X-
linked enzyme glucose-6-phophate dehydrogenase (G6PD). Due to the process of X-
inactivation, only one pair of a pair of X-linked allele in a female heterozygote is
expressed in a somatic cell. Cell lines derived from tumors in these women expressed
one or the other G6PD allele, but not both, indicating that each tumor had grown from a
single cell. Some other chromosomal deformations also occur in the same way. All of
the evidences indicate that these malignancies are of single-cell origin (Thompson, 1991,
p366).
Genetic instability has long been hypothesized to be a cardinal feature of cancer.
A huge body of evidence also strengthened the proposal that mutational alterations
conferring instability occur early during tumor formation. The ensuing genetic
instability drives tumor progression by generating mutations in oncogenes and tumor-
suppressor genes. These mutant genes provide the cancer cells the selective advantages
(Cahill et al., 1999).

7
Figure 1.2. Genetic alterations in progression of cancer.
Studies of inherited and sporadic colorectal cancer have demonstrated that in the
overwhelming number of cases the primary mutation targets a single signal transduction
pathway (Bienz et al., 2000).
After the initial promoting mutation in the primary cell of the tumor clone,
additional mutations in the relevant target genes, and consequent waves of clonal
expansion, produce cells that invade surrounding tissues and metastasize (Futreal et al.,
2001). It is obvious that, any alterations in any gene will show its effect through the
protein product of this gene. Mostly, this altered protein product is found to be involved
in important cellular processes. Some critical ones are,
- Transcription factors in breast cancer development (reviewed in, Benz ,1998),
- Telomerase in breast cancer (reviewed in, Herbert et al., 2001),
- Centrosome abnormalities in carcinogenic progression (reviewed in, Duensing et al.,
2001),

8
While considering the genes in the progression of cancer, we may classify them
into two broad groups, tumor-suppressor genes and oncogenes. The two classes have
opposite effects on tumor development in their activated forms. Tumor-suppressor
genes block tumor development, and oncogenes facilitate malignant transformation. So,
cell proliferation and cell death are essential yet opposing cellular processes. Crosstalk
between these processes promotes a balance between proliferation and death, and it
limits the growth and survival of cells with oncogenic mutations (Guo et al., 1999).
1.1.4.1. Tumor suppressor genes
Tumor suppressor genes encode for the proteins that block the abnormal growth
and malignant transformation. These proteins are generally involved in the growth
regulatory or differentiation pathways. They generally contribute to malignancy when
both alleles are lost. So, the mutations in these genes are told to be “recessive” at the
cellular level.
The identification of cancer-susceptibility genes has revolutionized our
understanding of cancer. Most of these genes were originally thought to control cellular
proliferation directly, acting as “gatekeepers”. But afterwards it became clear that genes
that maintain the integrity of the genome (“caretakers”) may be even more frequent
causes of inherited predisposition to cancer (Kinzler et al., 1997). So the tumor
suppressor genes are divided into two categories: gatekeepers and caretakers. By
definition, the genes whose mutation or altered expression disrupts the cell-cycle control
and cell division, death or life-span, promoting the outgrowth of cancer cells are termed
“gatekeepers” (e.g. Rb). And those, which cause genomic instability, increase the
frequency of alteration in gatekeeper genes are defined as “caretakers” (i.e. MLH1,
BRCA1) (Figure 1.3).

9
Figure 1.3. Caretakers and gatekeepers (Adapted from Kinzler et al., 1997).
1.1.4.2. Oncogenes
Oncogenes encode for the proteins that dictate cell growth and development.
“Proto-oncogene” is the name used for the unaltered form of these genes. The protein
products of these genes are generally involved in the regulation of cell cycle, cell
division, and differentiation. If a proto-oncogene is altered or over expressed (that is,
become an oncogene), the cell undergoes uncontrolled growth, and eventually become
malignant.
Oncogenes exhibit a “dominant” phenotype at the cellular level, and activation of
one copy of oncogenes is enough to result in gain-of-function. The activation is gained
through several different ways; a point mutation due to a small change, partial deletions
and chromosomal translocations as large scale changes. These changes may occur in the
exons of the gene (protein coding sequences) or in the sequences controlling the
expression levels of the gene. Another way to achieve high expression levels may be the
presence of extra copies of the gene, due to gene amplification events. Oncogenes may
be transmitted from generation to generation when the mutation is present in the germ-
line.

10
1.1.4.3. Genomic variations at a glance
It is widely accepted that cancer results from the accumulation of mutations in
the genes that directly control cell birth or cell death. But the way a cell acquires these
changes is a subject of continuing debate. It is suggested that an underlying “mutator
phenotype” is required to create the rest of the mutations (Lengauger et al., 1998).
However, the opposite argument claims that normal rates of mutation along with the
clonal nature of the cancer are enough to dictate malignant transformation (Heoijmakers,
2001).
Cells must guard the integrity of their genome to avoid both the inheritance of
deleterious mutations and the accumulation of mutations in genes that control cell
proliferation. Although cells employ many safeguards to protect their genomic integrity,
cellular DNA is constantly bombarded by mutagens from endogenous and exogenous
sources. DNA repair and cell-cycle checkpoints must all interlink to promote cell
survival following DNA damage and preserve the integrity of chromosomes (Levitt et
al., 2002).
There are three main types of causes leading to the formation of DNA lesions
that may lead to mutations if they are left unrepaired (Figure 1.4).
First type is the environmental agents such as ultraviolet (U.V) component of the
sunlight, ionizing radiation, and numerous genotoxic chemicals.
Second type is the (by) products of normal cellular metabolism. These include
the reactive oxygen species (superoxide anions, hydroxyl radicals and hydrogen
peroxide) derived from oxidative respiration and products of lipid peroxidation.

11
Figure 1.4. DNA damage, repair and consequences
(Adapted from Heoijemakers, 2001).
Finally, some chemical bonds in DNA tend to spontaneously disintegrate under
physiological conditions. For example, hydrolysis of nucleotide residues leaves non-
instructive abasic sites. Spontaneous or induced deamination of cytosine, adenine,
guanine or 5-methylcytosine converts these bases to the miscoding uracil, hypohxantine,
xanthine and thymine, respectively. Figure 1.4 summarizes some of the most common
types of DNA damage and their sources (Heoijmakers, 2001).

12
1.1.5. Molecular profiling of cancer
Categorization of the tumors has been performed on the basis of histology. But,
it is now clearly known that the staining patterns of cells viewed under the microscope is
not sufficient to reflect the underlying molecular events that drive the neoplastic process.
But, using today’s technology, reading the molecular signature of an individual’s tumor
by surveying thousands of genes at once –using DNA arrays– is possible (Liotta et al.,
2000). So the variations in the gene expression profiles will be beneficial to fully
understand different cancers. It is generally accepted that four to seven rate limiting
genetic events are required for the development of the common epithelial cancers
(Rennan et al., 1993). It is noteworthy that the patterns of genetic alterations differ
between cancers of different types and even of the same type. But fortunately, the
patterns are not random (Liotta et al., 2000 and Suzuki et al., 2000).
The main aim of the recent use of DNA arrays (also protein arrays) is to be able
to understand the sophisticated disease mechanisms and treatment targets (Liotta et al.,
2000). So, the identification of the molecular signatures of the tumors in genomic
alterations or expression profiles will enable us to understand the possible mechanisms
involved in tumor development, which may also enable us to obtain valuable
information about clinics (Suzuki et al., 2000).

13
1.1.6. Inherited predisposition
Family based studies led scientists to recognize the inherited predisposition to
cancer. Since, cancer is a common disease; some families may contain several cases
only due to chance. But there is a spectrum of probability that a given family history
reflects inherited predisposition from near-certainty of strong predisposition in the rare
inherited cancer syndromes, to the possibility of weak effects in familial clusters (Table
1.1) (Ponder, 2001).
Contribution of genetic factors to the development of cancer phenotype can be in
varying degrees. Some genes may confer a high cancer risk to the individual but some
not.
So, the concept of “inherited predisposition” must be investigated under two
sections of “strong predisposition” and “weak predisposition”. For example, germ-line
mutations in BRCA1 and BRCA2 genes confer a high risk of breast cancer (Bertwistle et
al., 1998; Ozdag et al., 2000, and Manguoğlu et al., 2003), whereas mutations in other
cancers such as GSTM1 do not confer a high breast cancer risk.
Ironically, the frequencies of these two types of mutations are inversely related to
their penetrances. The mutations, conferring a high risk are generally rare in the
populations, whereas the mutations conferring a low risk are generally more frequent.

14
Table 1.1. Inherited predisposition to cancer.
Contribution to overall cancer incidence
Clinical feature Frequency of predisposing alleles
Effect on individual risk
Inherited cancer syndromes
1-2% at most Rare/unusual cancers or combinations of cancers. Sometimes with associated developmental defects or non-neoplastic phenotype. Mendelian dominant inheritance.
Rare (nearly 1:1,000 or less)
Strong: lifetime risks of cancer up to 50-80%
Familial cancers
Up to 10% depending on definition Families with several cases of common cancers that fall into a recognized pattern of cancer types. Spectrum from families with multiple cases at young age to two or three cases at older ages: many of the latter will be due to chance or to combinations of weaker genes. Generally show pattern consistent with dominant inheritance.
Uncommon to common
Moderate to weak
Predisposition without evident familial clustering
No precise figure possible. Distribution of risk within population may result in substantial fraction of cancer incidence within predisposed minority.
Single cases of cancer at any site, some with one or two affected relatives. The distribution of these cases in the population is probably determined by the combined effects of multiple genetic and non-genetic risk factors.
Multiple common alleles
Weak

15
1.1.6.1. Strong predisposition
A number of relatively rare, high-risk genes have been identified which
predispose to common cancers such as breast, colon, and melanoma (Goldgar, 2002).
The human inherited cancer syndromes and their transgenic mouse counterparts have
been extensively studied. List of familial cancers and related genes are summarized in
Table 1.2. As a result of these studies it was clearly seen that the strong predisposition
to cancer results either through inheritance of one of the events on the cancer “pathway”,
or through effects on DNA repair of genome stability (Ponder, 2001).
The tissue specificity and variability of expression are two important features of
strong predisposition. All inherited predisposition to cancer seems to show a
considerable degree of tissue specificity, even in the case of defective DNA repair. The
mechanism governing tissue specificity is still unknown. There may also be
considerable variation in the age at onset of cancer and in the specific types of cancer
that predominate not only within a given syndrome, but also within a single family.
Some of this variation is due to different germ-line alleles of the main predisposing
gene, and some is environmental or chance. But much of the within-family variation is
probably attributable to the effects of genetic modifiers (Ponder, 2001).
Some other characteristics of strong predisposition are the vertical and not sex-
specific transmission of the cancer predisposition, specific clinical characteristics (early
age of diagnosis, presence of two or more primary cancers) (Ponder, 2001).
The first predisposing genes were identified as rare, mutated alleles. These
mutated genes result in multiple cases of the disease in families. They were identified
using genetic linkage and positional cloning. The prototypic gene associated with
familial cancer syndromes is the retinoblastoma gene (RB1), which has turned out to be
one of the most important hubs of cellular signaling. Other key signaling molecules
such as p53 (encoded by TP53) were initially identified as important targets of viruses or
somatic mutations in tumors and were subsequently found to function as germline-
inherited tumor predisposition genes (Balmain et al., 2003).

16
High penetrance alleles have provided many fundamental and unexpected insight
into various aspects of cancer biology, including identification of the adenomatosis
polyposis coli (APC), β-catenin and Tcf-4 pathway, and the phosphatase PTEN, which is
implicated in Cowden syndrome and in the development of a variety of tumor types
(Balmain et al., 2003).
It is important to consider that, most of the genes whose altered forms are found
to be involved in “strong predisposition”, encode for the proteins of DNA damage repair
or related pathways (i.e. BRCA1 and BRCA2) (Heojimakers et al., 2002). This is
obviously due to the high number of studies investigating the impact of DNA damage or
related pathway genes. But, considering the variety of the pathways in the cellular
metabolism, other pathways and genes must also be studied.
The explanation provided by the investigations on the high penetrance genes for
how cancers develop is very incomplete. For example, we still have no mechanisms for
the tissue specificity of many of the inherited cancer syndromes (Balmain et al., 2003).

17
Table 1.2. List of familial cancer genes and syndromes (Adapted from National Cancer
Institute web site; “http://www.cancer.gov”).
Gene Cancer syndrome Location DiscoveryAPC Familial polyposis of colon 5q21 1991
BRCA1 Hereditary Breast/Ovarian cancer 17q21 1994
BRCA2 Hereditary Breast/Ovarian cancer 13q12.3 1995
CDH1 Familial gastric sarcoma 16q22.1 1998
CDK4 Hereditary Melanoma 2 11q14 1996
CDKN2A Cutaneous malignant melanoma 9p21 1994
CDKN1C Beckwith-Weideman syndrome 11p15.5 1995
CYLD Familial cylindramotosis 16q12-q13 2000
EXT1 Multiple exostoses type 1 8q24.1 1995
EXT2 Multiple exostoses type 2 11p12 1996
MADH4 Juvenile polyposis 18q21.1 1996
MEN1 Multiple endocrine neoplasia type I 11q13 1997
MET Hereditary Papillary Renal Carcinoma 7q31 1997
MLH1 Hereditary non-polyposis colon cancer 3p21.3 1994
MSH2 Hereditary non-polyposis colon cancer 2p21 1993
NF1 Neurofibromatosis type 1 17q11.2 1990
NF2 Neurofibromatosis type 2 22q12.2 1993
PMS1 Hereditary Non-polyposis Colon Cancer3 2q32 1994
PMS2 Hereditary Non-polyposis Colon Cancer4 7p22 1994
PRKAR1A Cancer complex 17q23-q24 1996
PTCH Nevoid basal cell carcinoma 9q22.3 1996
PTEN Cowden’s syndrome 10q23.3 1997
RB1 Familial retinoblastoma 13q14.1 1986
RET Multiple endocrine neoplasia MEN2A, MEN2B and medullary thyroid carcinoma
10p11.2 1993
SDHD Familial paraganlioma 11q23 2000
SMARCB1 Rhabdoid predisposition syndrome 22q11 1996
TP53 Li-Fraumeni syndrome 17p13.1 1990
TSC1 Tuberous sclerosis 1 9q34 1996
TSC2 Tuberous sclerosis 1 16p13.3 1993
STK11 Peutz-Jegers syndrome 19p13.3 1997
VHL Von Hipple-Lindau syndrome 3p25 1993
WT1 Familial Wilms’ tumor 11p13 1990

18
1.1.6.2. Weak predispositon
Weak predisposition to cancer may in principle result from weak alleles of the
pathway or caretaker genes. The study of weak predisposition is of interest both for its
possible public-health implications and because just as the study of inherited cancer
syndromes identified “pathway” genes, so weak predisposition may point to a wider
range of processes that are relevant to cancer development, and to interactions between
them.
The risk attributable to the effect of pathway genes and the low penetrance genes
is more than the risk due to subtle sequence variants or polymorphisms (which can be
associated with small to moderately risk for cancer). Low penetrance gene candidates
are found in many pathways such as environmental carcinogen detoxification, steroid
hormone metabolism and DNA damage repair. There is no doubt about the future of
genetic medicine will allow us to identify more genes in several other pathways
(Chakravarti, 2001).
Such factors modifying the probability are of extreme importance in sporadic
cancers. They may be strongly associated either with disease susceptibility or with some
other aspects of the disease phenotype, such as the treatment response of survival
(Cardon et al., 2001).
Predisposition by combinations of weak genetic variants may be of much greater
significance to public health than the marked individual risks seen in inherited cancer
syndromes (Pharoah et al., 2002). Population based epidemiological studies have shown
that only 15-20% of the observed familial clustering of breast cancer occurs in families
that carry a strongly predisposing BRCA1 or BRCA2 mutation (Figure 1.5) (Balmain et
al., 2003). In principle, the remaining 80-85% of familial risk might have a genetic or
environmental origin, but evidence from studies of breast cancer in twins (Peto, 2001)
and the pattern of inheritance in families suggests that genetic factors predominate
(Balmain et al., 2003).

19
Figure 1.5. Breast cancer susceptibility genes (Adapted from Balmain et al., 2003).

20
1.2. Breast cancer
Breast cancer is the most commonly diagnosed cancer among women, after
nonmelanoma skin cancer. It is the second leading cause of cancer deaths after lung
cancer.
An estimated 211,300 new cases are expected to occur among women in United
States during 2003. About 1,300 new male breast cancer cases are also expected. This
year, 40,200 deaths from breast cancer will occur in United States only. It becomes the
first leading cause of death among women with age between 15-54 (Atlanta, 2002).
In recent years, improved diagnostic tools have made it possible to detect breast
cancers at early, even pre-invasive stages leading to a significant decrease in breast
cancer mortality rates over the past decades. Despite all these improvements in the
diagnostic tools of breast cancer, approximately a quarter of breast cancer patients die of
their disease (Polyak, 2001).
1.2.1. Setting the stage
The mammary gland is a remarkable organ with respect to its development and
functional differentiation. Unlike most mammalian organs, development of the
mammary gland is primarily postpubertal. Mammary glands start to develop during the
4th week of gestation in mammals. Mammary epithelium is derived from epidermis, but
the initiation is dependent on the presence of a specialized mesenchyma, called fat pad.
Signals from mammary fat pads underlying the epidermis direct epidermal cells to a
mammary differentiation pathway and induce their migration into the mammary fat pad
(Figure 1.6, part A) (Polyak, 2001).
Although, the genes governing the mammary gland development are not clearly
identified, the homeobox genes are suggested as the possible candidates based on their
roles in the development of other organs. Recent genetic and expression analyses

21
clarified the functions of homeobex genes at specific transition points in the mammary
gland development (Lewis, 2000).
Figure 1.6. Mammary gland and its development (Adapted from Polyak, 2001).
Only few, poorly branched mammary ducts are formed during embryogenesis.
The mammary gland remains in this rudimentary form until puberty. During puberty,
hormones, particularly estrogen and progesterone, induce further elongation, branching
and extension of the already existing ducts. This leads to the generation of lobules that
contain a terminal duct splitting into alveoli. These lobules are relatively simple and not
branched in nulliparous women (lobule 1 in Figure 1.6 part B). Fully mature gland
(extensive branching, alvoelogenesis, and terminal differentiation) only occur during
“full-term pregnancy” (Polyak, 2001).

22
Figure 1.7. Main anatomic structures of breast (http://www.imaginis.com).
The smallest structure in breast is the tiny bulbs that can produce milk. These
tiny bulbs form the lobules, and lobules forms the lobes. Ducts are the tiny tubes
connecting the bulbs, lobules, and lobes. These ducts lead to the nipple in the center of a
dark area of skin called areola.
The remaining part of the breast is filled with fat and vessels carrying the
colorless fluid named “lymph”. Muscle tissue is present only under the breast and
covers the ribs.
The main origin of the breast carcinoma is the epithelial tissue of the mammary
gland, including the milk-producing lobules and the ducts that carry milk to the nipple.
The stromal, vascular, or fatty components of the breast are not generally included in the
transformation process, excluding some very rare cases. The progression profile
somehow reflects the clinics of the disease. For example, inflammatory breast cancer
(IBC) is an aggressive form of locally advanced breast cancer that affects approximately
5% of women with breast cancer (Kleer et al., 2000).

23
Breast cancer results from a combination of many factors including inherited
mutations or polymorphisms of cancer susceptibility genes, environmental agents that
influence the acquisition of somatic genetic changes and several other systemic and local
factors (Figure 1.8) (Polyak, 2001). These factors may be grouped under sections of,
behavioral (i.e. parity, life-style), environmental (i.e. chemicals, radiation), systemic
(hormones, growth pressure, immune system), local factors (surrounding cells, autocrine
factors, paracrine factors), and lastly genetic factors which is accepted as the major
factor on the disease, since all the other factors may regulate and/or supplement the
contribution of genetic factors.
Figure 1.8. Summary of factors influencing breast carcinogenesis
(Adapted from Polyak, 2001).

24
The factors listed in Figure 1.8 actually act on the development of breast cancer
in various combinations. For example, when we consider, parity, we must also mention
the effect of hormones. So, the factors mentioned in Figure 1.8 is summarized below.
The frequency of breast cancer is clearly shown to be associated with the body-
mass-index (bmi) of the patient. Although the relationship between the bmi and the
development of breast cancer is complex, the underlying factor is supposed to be the
elevated levels of estrogen due to the production in adipose tissue (DeVita et al., 2001).
The development of breast cancer in many women appear to be related to the
exposure of female reproductive hormones. Early age at menarche, nulliparity, late age
at first full term pregnancy, late age at menopause increase the risk of breast cancer due
to the hormonal exposure levels (DeVita et al., 2001).
The natural history of breast cancer involves a sequential progression through
defined clinical and pathologic stages starting with atypical hyperproliferation,
progression to in situ then invasive carcinomas, and culminating in matestatic disease
(Figure 1.9 and Table 1.3) (Polyak, 2001).
Figure1.9. A hypothetical multi stage model of breast carcinogenesis
(Adapted from Polyak, 2001).

25
The stage at the time of diagnosis is very important in determining the treatment
modalities and prognosis. So the staging of breast cancer is very important. Although
many staging systems have been proposed, the most commonly used system is the one
adopted by both the American Joint Committee (AJC) and the International Union
Against Cancer (UICC). The staging system is a detailed TNM (tumor, nodes,
metastasis) (Table 1.3).
Table 1.3. TNM Staging.
Stage 0 Carcinoma in situ Stage I Tumor 2 cm, axillary nodes not involved Stage II Tumor between 2 and 5 cm and/or involved but mobile axillary lymph
nodes Stage III Tumor larger than 5 cm and/or fixed axillary lymph nodes; includes
inflammatory breast cancer Stage IV Distant metastases beyond ipsilateral axillary lymph nodes

26
1.2.2. Genetics of breast cancer
In breast cancer, the risk to close relatives of a case, averaged across all ages, is
about two-fold (Ponder, 2001). 5-10% of the cases have a first- or second-degree
relative with the disease. The remaining nearly 90% of cases are sporadic (non-
inherited) (Figure 1.5) (Wooster, 2003).
The hereditary breast and ovarian cancer syndromes are shown to involve genetic
alterations in various susceptibility genes such as BRCA1, BRCA2, p53, ATM, PTEN or
MSH2, MLH1, PMS1, MSH3, and MSH6 (Palevic, 2001). Two of these are regarded as
the major susceptibility genes, breast cancer susceptibility gene 1 (BRCA1) and breast
cancer susceptibility gene 2 (BRCA2) (Venkitaraman, 2002). However, mutations in
these genes account for only 2 to 3 percent of all breast cancers, which indicates the
presence of other susceptibility genes (Wooster, 2003).
Recently, the structure and expression of CHEK2 was analyzed in breast cancer.
CHEK2 was found to be implicated in a significant proportion of sporadic breast
cancers, but unlikely to represent a susceptibility gene for a high proportion of
hereditary breast cancer (Sullivan et al., 2002). In conclusion, CHEK2 1100DelC
variant is a low penetrance, and low frequency predisposing allele (Offit et al., 2003).
More recent experiments stated the association of this variant and prostate cancer risk
(Meijers-Heijboers et al., 2003, and Dong et al., 2003).
1.2.2.1. Somatic mutations in breast cancer
Studies of sporadic breast cancers led scientists to understand the pathogenetic
mechanisms underlying the development of breast cancer. Approximately 90% of all
breast cancer cases are sporadic. The genes coding for growth factors and receptors,
intracellular signaling molecules, regulators of cell cycle, genome maintenance
mechanisms, adhesion molecules and proteases are the first targets of the somatic
mutations. Some examples are:

27
- The tumor suppressor protein p53 plays a central role in regulating progression
through cell cycle and the genome maintenance. p53 mutations have been detected
in 15-45% of human breast cancer specimens in several studies.
- Cyclin proteins are regarded as the central regulators of cell cycle progression,
which are also shown to be over expressed in breast cancer (Evan, 2001).
- The proto-oncogene bcl-2 and c-myc which suppress apoptosis over expressed in
30-45% of breast cancer cases (Evan, 2001).
- Frequent alterations of the FHIT locus in breast cancer, suggest its role in the
pathogenesis of breast tumors. FHIT protein was shown to be directly involved in
the control of cell growth and/or proliferation. (Ingvarsson, 2001).

28
1.2.2.2. Germline mutations in breast cancer
Clinical investigations of familial aggregation of breast cancer have identified
several genetic syndromes with an autosomal dominant pattern of inheritance that
features breast cancer (Tonin, 2000). Breast cancer cases due to germline mutations
have several distinctive clinical features. For example, age-of-onset is relatively low
than sporadic breast cancer, the prevalence of bilateral breast cancer is higher, and in the
presence of associated tumors in affected individuals is noted in some families.
Associated tumors may include ovarian, colon, prostate, and endometrial cancers and
sarcomas. However, inherited breast cancer does not appear to be distinguished by
histologic type, metastatic pattern, or survival characteristics (Vogelstein et al., 1998).
The syndromes in which genes are known or are suggested to cause inherited
breast cancer and other cancers are shown in Table 1.4.
Table 1.4. Hereditary cancer syndromes that feature breast cancer (Tonin, 2000).
Sydrome Gene Manifestations
BRCA1 Breast (female and male), ovarian and pancreas cancers
Breast-ovarian cancer (MIM # 113705)
BRCA1 & BRCA2
Breast cancer (female and male)
Li-Fraumeni syndrome (MIM # 151623)
TP53 Sarcoma, leukemia, breast, brain and adrenal cancers
Cowden disease (MIM # 158350)
PTEN Breast and thyroid cancers, multiple hamartomas of skin and gastrointestinal tract
Ataxia telangiectasia (MIM # 208900)
ATM Leukemia, lymphoma, breast cancers

29
BRCA1 and BRCA2
The existence of the BRCA1 gene, which predispose to breast cancer, was
demonstrated by linkage analysis in 1990 (Hall et al., 1990). Using polymorphic
markers, which would distinguish the parental origins of alleles and are representative of
different chromosomal regions, linkage was established to the long arm of chromosome
17 at region q21. Families with early age of onset (pre-menopausal) of breast cancer
were more likely to be linked to the BRCA1 locus. Through an intense cloning effort,
the identity of BRCA1 was discovered in 1994 (Miki et al., 1994, and, Brown MA,
1995). In the following year, a human BRCA1 gene knockout (Boyd, 1995) and the
aberrant subcellular localization was identified (Chen et al., 1995).
In addition, linkage analyses provided sufficient evidence for the presence of
another susceptibility gene (Wooster et al., 1994), which was identified about a year
later (Wooster et al., 1995, and, Tavtigian et al., 1996). Germ-line mutations in BRCA1
and BRCA2 have been reported in at least two syndromes that feature breast-cancer: site-
specific breast cancer and breast-ovarian cancer syndrome (Table 1.14). The striking
feature common to families of both syndromes is the young age of onset of breast cancer
(Tonin, 2000).
Population-based studies have reported lower risks of breast and ovarian cancer
in mutation carriers. It has been suggested that other factors may modulate the risk in
mutation carriers, and may account for the reduced penetrance. Recent studies have
shown that lifestyle choices such as smoking may modulate the risk of breast cancer in
mutation carriers. More than 100 mutations in each gene have been described to date,
and the majority of the mutations is private and reported in only one family (Please refer
to the Breast Information Core Data Base).
BRCA1 is comprised of 5.592 nucleotide pairs with 24 exons. BRCA2 is
comprised of 10,254 nucleotide pairs and 27 exons. The coding sequences of both genes
are spread across large tracts of DNA, comprising more than 1,000,000 nucleotides. The
large size and complexity of each gene, and the absence of “hot-spots” for mutations,
have made sequence analysis an ardous and costly endeavor.

30
TP53
Li-Fraumeni syndrome (LFS), now known to be associated with germ line
mutations in TP53, was first identified as a syndrome in 1969 in a description of four
kindreds in which cousins or siblings had childhood soft-tissue sarcomas and other
relatives had excessive cancer occurrence (Vogelstein et al., 1998). Underlying genetic
defect in the Li-Fraumeni syndrome is a germline mutation in the TP53 gene (MIM#
191170) as first described by Malkin et al., in 1990. But now, there are nearly 250
independent germ-line TP53 mutations in numerous publications.
Li-fraumeni syndrome is associated with a variety of different tumor types
occurring over a wide age range, including childhood. The definition of LFS originated
from Li and Fraumeni’s work as a proband with a sarcoma aged under 45 years with a
first-degree relative aged under 45 years with any cancer, plus an additional first- or
second-degree relative in the same lineage with any cancer aged under 45 years or a
sarcoma at any age (Li et al., 1988). Now, LFS is defined as a proband with any
childhood tumor, or a sarcoma, brain tumor, or adrenocortical tumor aged under 45
years plus a first- or second-degree relative in the same lineage with a typical LFS tumor
at any age, and an additional first- or second-degree relative in the same lineage with
any cancer under the age of 60 years (Varley, 2003).
Bone and soft-tissue sarcomas, premenopausal breast carcinoma, brain tumors,
adrenocortical carcinomas and leukemias are the first identified tumors of LFs.
Subsequent studies reported wider range of tumors such as melanoma, Wilm’s tumor,
and lung, gastric, and pancreatic carcinoma (Varley, 2003).
The cellular role of p53 is well characterized. p53 is a sequence specific DNA
binding protein, that functions as a transcription factor. The sequence specific
transcription factor activity appears to be essential for its role as a tumor suppressor
(Picksley et al., 1994). The impact of p53 on multiple cellular functions such as gene
transcription, DNA synthesis and repair, cell cycle arrest, senescence, and apoptosis is
well documented (Hussain et al., 2001). The phosphorylation status of the protein is
found to be regulating its function (Prives et al., 2001).

31
ATM
ATM (ataxia telangiectasia mutated) is one of the key proteins involved in the
cellular response to DNA damage. In the autosomal recessive disorder ataxia
telangiectasia (A-T) ATM protein is defective. The heterozygous A-T gene carrier
frequency in the population is ~1% and the disease incidence is ~1/40000. Affected
individuals develop progressive cerebellar ataxia (loss of balance and coordination) such
that most are wheelchair bound by their early teenage years. Telangiectasias are
tortuous dilated blood vessels that develop in the eyes and sun-exposed skin. A-T is
associated with a 30–40% lifetime risk of developing a malignancy, usually of lymphoid
origin and occurring in childhood. And relevant studies showed that women with ATM
mutation have an elevated risk of developing breast cancer. A-T individuals are also
more susceptible to infections, and aspiration pneumonia is a common cause of death.
Life expectancy is reduced, with a median age at death of ~30 years (Levitt et al., 2002).
PTEN
Cowden disease is best characterized by multiple hamartomatous lesions,
especially of the skin, mucus membranes, colon, breast, and thyroid, and multiple facial
trichilemmomas. Hamartomatous polyps of the colon also occur, and there are
neoplasms of the thyroid and breast. Family-based analysis suggested an autosomal
dominant mode of inheritance with high penetrance in both sexes, and a high frequency
of breast cancer (up to 30%) in females. Linkage analysis of Cowden disease families
revealed a locus on chromosome 10q22-23. PTEN was the strongest candidate gene that
mapped to this interval on chromosome 10, and was previously shown to harbor somatic
mutations in a number of tumor types, particularly breast cancer, that feature in Cowden
disease. Therefore, a combination of linkage analysis and candidate gene approaches
led to the discovery that individuals with Cowden disease harbored germline mutations
in PTEN. Although the reported mutations are dispersed throughout the gene, there is a
tendency of mutations to cluster in exon 5 (Tonin et al., 2000).
32
1.3. RNASEL
RNASEL (MIM# 180435) encodes for the ubiquitously expressed ribonuclease L
(RNase L). The RNASEL gene maps to the hereditary prostate cancer (HPC)
predisposition locus at 1q24-q25 (HPC1).
1.3.1. Prostate cancer
Prostate cancer (PC) is the second leading cause of cancer deaths in men >50
years of age and the most frequent visceral cancer in males (Silverman, 2003). Prostate
cancer is a significant international public health problem, with a world-wide estimate of
239,000 deaths resulting from this disease annually, in the U.S. only (Xu et al., 2000).
The prostate is a walnut-sized gland of the male reproductive system located
beneath the bladder and in front of the rectum that produces and stores the seminal fluid
(Silverman, 2003). Precursor lesions known as prostate intraepithelial neoplasia (PIN)
can progress after many years of overt carcinoma and finally to metastatic cancer
(Figure 1.12) (Abate-Shen et al., 2002). The most common sites for metastasis are
lymph nodes and bones (pelvis and axial skeleton) (Silverman, 2003).
Aging, hormonal, environmental, and genetic factors are all believed to play
roles in the pathogenesis of prostate cancer.
This cancer type usually appears after the sixth decade, and so it is generally
considered as a disease of aging. Prostate cancer is diagnosed in very few people
younger than 50 years (<0.1% of all patients). The mean age of patients with this
disorder is 72-74 years, and about 85% of patients are diagnosed after age of 65 years
(Grönberg et al., 2003).
Prostate cancer is rare in males castrated before puberty and the tumor growth is
inhibited by orciectomy or chemical hormone-ablation theraphy. Also, there is a large
body of evidences indicating the role of “androgen signaling system” in the development
of prostate cancer (Grossman et al., 2001).

33
Environmental causes are found to be implicated in prostate cancer development
by the geographic data on prostate cancer incidence and observations that relative risk of
developing prostate cancer is associated with migrations between low and high
incidence regions of the world (Siverman, 2003).
It has been recognized for some time that prostate cancer tends to cluster in
families (Wang et al., 2002). Remarkably, men with three or more first degree relatives
with prostate cancer have a 100-fold increased risk compared with men that have no
family history of prostate cancer (Silverman, 2003). Segregation analysis suggests that
this familial clustering can best be explained by at least one rare dominant susceptibility
gene (Wang et al., 2002). And this dominant susceptibility gene must be rare,
autosomal, highly penetrant for the hereditary prostate cancer with early onset
(Silverman, 2003). However, there is also a considerable evidence on the presence of a
complex genetic basis, involving multiple susceptibility genes and variable phenotypic
expression (Simard et al., 2002). On the basis of linkage studies of families with high
risk of PC, six PC-susceptibility loci were identified (Eeles et al., 1998, and, Wang et
al., 2002).
1. HPC1 (1q24-25),
2. HPCX (Xq27-q28),
3. PCAP (1q42),
4. CAPB (1p36),
5. HPC20 (20q13), and
6. HPC2 (17p11) (reviewed in Ostrander et al., 2000).
HCP1 was the first such prostate cancer locus, mapped in 1996 to chromosome
1q24-25 (Smith et al., 1996). Initial gene mapping studies placed RNASEL and several
other genes in the critical HPC1 region in chromosome 1q25 (Carpten et al., 2000).
HPC2 was mapped to 17p11 (Tavtigian et al.2001, and, Suarez et al., 2001).

34
To overcome limitations due to genetic heterogeneity and a low frequency of
mutations in any particular susceptibility gene, the International Consortium for Prostate
Cancer Genetics (ICPCG) performed a joint analysis from 722 families. They have
confirmed linkage of hereditary prostate cancer to the HPC1 locus (Xu, 2000, and, Xu et
al., 2001). A second important study was performed with 2410 individuals, including
662 men with prostate cancer compared several potential prostate cancer susceptibility
loci (HPC1, PCAP, HPCX, and CAPB). They have demonstrated that only HPC1
commonly segregated within families with the most severe cases of prostate cancer
(Goode et al., 2001).
The linkage of HPC1 to RNASEL suggests that RNase L directly or indirectly
suppresses one or more steps is prostate tumorigenesis and/or metastasis (Figure 1.12).
Figure 1.10. Possible role of RNase L in prostate carcinogenesis
(Adapted from Silverman, 2003).

35
1.3.2. RNase L
RNase L is a fascinating tightly regulated endoribonuclease of higher vertebrates
that plays essential roles in mediating diverse types of cellular responses (Zhou, 1993).
The activation of RNase L requires the production of unusual effector molecules, 2’,5’-
linked oligoadenylates, p1-3A(2’p5’A)>=2 (2-5A) (Dong et al., 2001). 2-5As are
produced from ATP by 2-5A-synthetases (OAS enzymes). The genes coding for OAS
enzymes are activated upon interferon treatment of mammalian cells (Dong et al., 1997).
OAS enzymes were discovered in the mid-1970s by I.M.Kerr and colleagues.
They are found to be activated by double stranded RNA (dsRNA). They convert ATP to
PPi and a series of short 2’ to 5’ linked oligoadenylates, collectively referred to as 2-5As
(Figure 1.11) (Silverman, 2003).
IFN treatment of the cells activates the JAK-STAT pathway which also activates
the expression of OAS genes (Stark et al., 1998). In humans, there are four related
genes (OAS1, OAS2, OAS3, and OASL) encoding eight or more isoforms as a result of
alternative splicing (Silverman, 2003).
Figure 1.11. Role of RNase L in the antiviral activity of IFNs (Silverman, 2003).
36
Up to date, the only well-established biochemical function of 2-5A is the
activation of RNase L (Zhou et al., 1997). The significance of the dsRNA requirement
for 2-5A synthetase activity is that it is a common intermediate or by product of viral
infections.
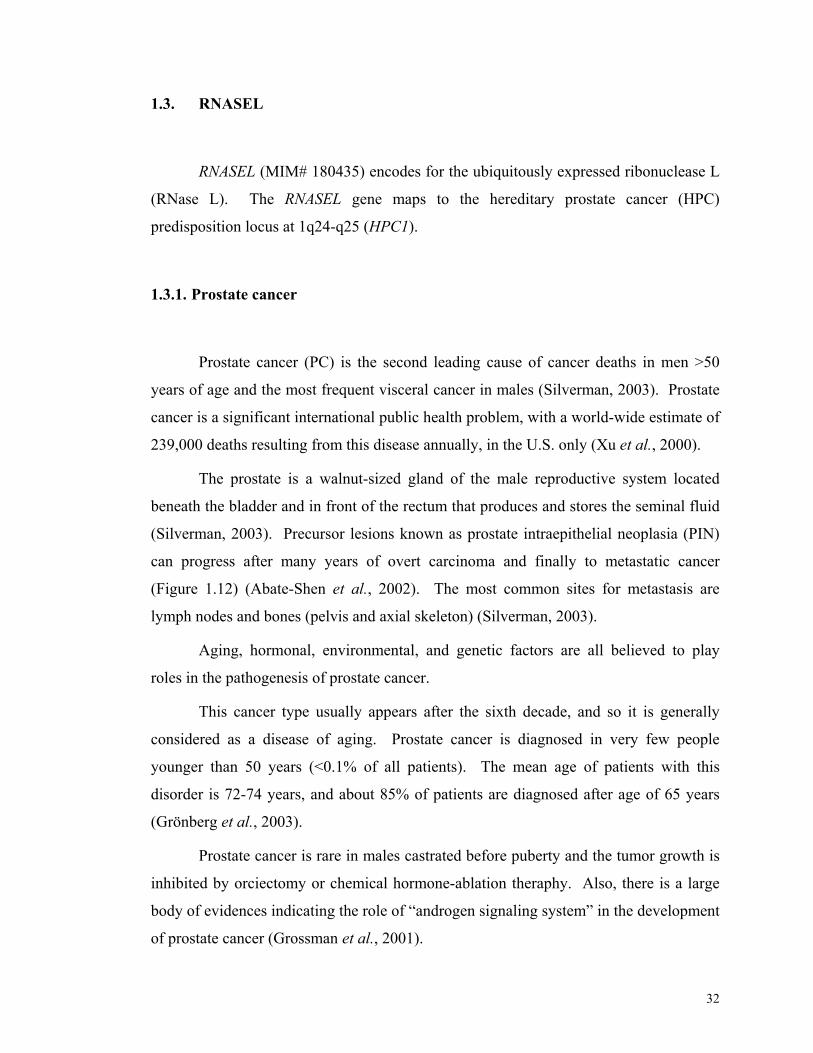
RNaseL protein consists of 741 amino acids. RNase L has been detected only in
reptiles, birds and mammals. Only mouse and human RNase L sequences are available.
The presence of RNase L was shown for many mammalian tissues.
C-terminal region contains the RNase domain and the kinase-like domain. N-
terminal domain represses the ribonuclease domain in the C-terminal region in the
absence of 2-5A. The N-terminal region of the protein is called the repressor part. It
contains 9 ankyrin repeats. Anykrin repeats are common protein/protein interaction
domains. The presence of two P-loop motifs (GTK) is the characteristic property of
RNase L. Because the Lysine residues in these regions are the sites of 2-5A binding
(Figure 1.12) (Silverman, 2003).
A kinase domain was assigned to the C-terminal region of the protein based on
the sequence comparisons. But this assignment lacks experimental evidence. On the
contrary, experimental evidence suggests that the kinase like motif is implicated in
enzyme dimerization (Dong et al., 1999), which is the crucial step in enzyme activation
(Figure 1.12) (Silverman, 2003).
Figure 1.12. RNase L protein structure (Adapted from Silverman, 2003).

37
Figure 1.13. Functional model for the activation of RNase L by 2-5A
(Adapted from Silverman, 2003).
The binding of 2-5As leads to the formation of a potent dimeric
endoribonuclease (Dong et al., 1995). 2-5A binding to the P-loops relieves binding of
repressor domain. This conformational change ceases the inhibition by the ankyrin
repeats on the dimerization and ribonuclease domains. Accessible dimerization domains
enables the dimerization of the enzyme, which enables formation of active enzyme
(Dong et al., 2001).
Cleavage sites for the RNase L enzyme are UpNp dinucleotide sequences
(primarily UU and UA) (Silverman, 2003).
Considering the production of 2-5As and the 2-5A dependent activation of the
enzyme, it may be concluded that the RNase L action is located in the vicinity of the
dsRNA. This enables specificity to the system to degrade only the viral RNA. The
experimental evidence is the preferential degradation of viral RNA in comparison to
cellular RNA in EMCV-infected cells (Li et al., 1998). Along with PKR, RNase L
constitutes the antiviral arm a group of mammalian stress response proteins (Williams,
1999).

38
The other important cellular role of RNase L is the initiation of apoptosis.
Presumably, this function of the enzyme is also atributable to RNA degradation activity
of the enzyme.
The degradation of 28S and 18S rRNA by RNase L in intact ribosomes has been
long known as a hallmark of IFN and viral infections. Cleavage of 28S rRNA by RNase
L maps to the L1 protuberance implicated in the formation of the exit of E site of the
ribosome, possibly interfering with the release of deacetylated tRNA (Iordanov et al.,
2000).
The possible sequence specific gene silencing activity of RNase L was also
investigated. Suggested mechanism involves the endoribonucleolytic activity of RNase
L directed towards a specific mRNA molecule. Antisense oligonucleotides conjugated
with 2-5A sequences are the mediators of the mRNA degradation. Where, the antisense
oligonucleotide provides the mRNA specificity, and the 2-5A molecule activates the
enzyme (Torrence et al.,1993).
The involvement of possible RNA decay pathways in the repression of tumor
development is not a new idea. The ribonuclease, onconase, the N-glucosidase ricin A
chain that attacks ribosomal RNA, and the anti-FLT-1 (VEGF receptor) ribozyme,
angiozyme, have been explored as cancer therapeutics in clinical trials with varying
success (Weng et al., 2001, Mikulski et al., 2002, and Schnell et al., 2002).

39
Figure 1.14. The pro-apoptotic role of RNase L (Silverman, 2003).
An RNaseL-based approach might have certain advantages in the treatment of
cancers. RNase L is a candidate tumor suppressor that is normally dormant but whose
antitumor activity can be activated by a small molecule, 2-5A. It is also possible to target
RNase L to particular cancer associated RNAs, such as telomerase RNA, by linking 2-
5A to antisense (Kondo et al., 1998). In cancers where RNase L is present, including
many prostate tumors, its activation by a 2-5A analogue might produce an antitumor
response as was demonstrated in a mouse model of human prostate cancer (Kondo et al.,
2000).

40
1.3.3. RNASEL
Ubiquitously expressed RNASEL consists of eight exons. Northern blot analysis
showed that there are two mRNA species of 5 kb and 9.5 kb in the spleen, thymus,
prostate, testis, uterus, small intestine, colon and peripheral blood leukocytes.
Expression level varies according to the tissue, with the highest expression in the spleen
and thymus.
Figure 1.15. RNASEL (Silverman, 2003).
RNASEL in cancer genetics
RNASEL has been proposed as a candidate tumor suppressor after the
involvement of RNase L in the antiproliferative activity of interferons was represented.
The location of the RNASEL in 1q25, a region found to be deleted or rearranged in some
breast cancers was the second evidence (Hassel et al., 1993, Lengyel, 1993, and Squire
et al., 1994). Furthermore, RNase L was shown to be deficient in human leptoma cell
line HEPG2 (Tnani et al., 1998). The important studies regarding the impact of
RNASEL in cancer genetics are summarized below.

41
The first in vivo evidence of RNase L as a tumor suppressor was the
identification as the candidate for HPC1. RNASEL was identified by using a
combination of recombination mapping and candidate gene analysis. Nonsense
mutations and mutation in initiation codon were shown to segregate independently in
two HPC1-linked families (Carpten et al., 2002).
The second important study was performed in 116 Finnish families with HPC,
492 patients with PRCA, 223 patients with benign prostatic hyperplasia (BPH), and 566
controls. In addition to 4 previously identified variations in RNASEL (Carpten et al.,
2002), they have identified 3 more variants in 66 patients with HPC. Neither E265X nor
R462Q was found to be sufficient for the familial clustering of the disease. But, both
mutations were shown to effect age of onset in HPC patients (Rökman et al., 2002).
Third study concerns the effects of 1385G→A (resulting in R462Q variant), and
1623T→G (resulting in D541E), on the enzymatic activity of RNase L and their possible
association with HPC. Enzymatic activity of the D541E variant was shown to be
identical to the wild-type of the enzyme. But the enzymatic activity of R462Q variant
was shown to be three times lower than the wild type of the enzyme. Relying on the
functional significance of the R462Q variation, the association of this variant to HPC
was investigated in a family based case-control study. Each control was chosen to have
an effected relative involved in the study as case. By using a standard statistical analysis
of matched data (conditional logistic regression), a log additive model was found to best
fit the results. This implied the significant association between the RNASEL 1385G→A
variant and prostate cancer (P=0.011). The association was a little bit more significant
among men of European descent only (P=0.007). The values of corresponding odds
ratios suggest that carrying one copy of the mutated allele increases risk of prostate
cancer by an approximately doubling a man’s risk of developing this disease. Their
study reported that approximately 13% of prostate cancer cases in population may be
attributable to 1385G→A mutation (Casey et al., 2002).
The conflicting conclusions about the impact of R462Q variant in two studies
(Rökman et al., 2002, and Casey et al., 2002), may be attributable to the sampling
methods of the studies. This underlines the possible impact of familial links.

42
Three RNASEL variants, I97L, R462Q, and D541E, were investigated in 499
sporadic cases and 510 controls. The variants I97L and D541E were shown not to be
associated with the disease. R462Q variant was shown to be associated with familial
(P=0.02) but not sporadic prostate cancer (P=0.92) incidence (Wang et al., 2002).
A recent study reported a founder null mutation in Ashkenazi Jewish men,
471delAAAG. But the results of that study is not found as statistically significant and
needs further support (Rennert et al., 2002).
The results of these studies are summarized in Table 1.5.
Table 1.5. Summary of RNASEL sequence variants implicated in HPC.
Variant Exon Codon Position & Change
175G→A 2 59 175; G→A (GGC→AGC / Gly→Ser)
793G→T 2 265 793; G→T (GAG→TAG / Glu→Stop)
1179G→A 2 393 1179; G→A
1217C→T 2 406 1217; C→T (TCT→TTT / Ser→Phe)
1385G→A 2 462 1385; G→A (CGA→CAA / Arg→Gln)
1623T→G 4 541 1623; T→G (GAT→GAG / Asp→Glu)
2172G→A 7 724 2127; G→A

43
The complete role of RNase L in the cellular metabolism is not fully understood
yet. But the dependence of the critical balance between hormonally regulated cell
growth and cell death on the pathways of this enzyme appears as a stong evidence for
the impact of this gene in the tumor development. It is rational to speculate that the
absence of the full-capacity of this enzyme may shift the balance towards the growth of
the cells, which will lead to a favorable environment for the development of cancer. In
conclusion, RNASEL is suggested as a candidate tumor-suppressor gene due to the
known cellular functions of RNase L, and the cancer association studies.
1.4. Our Aim
We sought to investigate the hypothesis that, Arg462Gln variant of RNASEL is
associated with breast cancer risk based on the following observations and
considerations:
1. The chromosomal location of RNASEL (1q25) in a region (1q23-q32) that was
found to be implicated in breast cancer (Chen et al., 1989),
2. The cellular function of RNASEL, and its involvement in pro-apoptotic and
antiviral activities (Silverman, 2003),
3. The pleitopic effects of cancer associated mutations, as exemplified by BRCA1 in
both breast and ovarian cancers or CHEK2 in both breast and prostate cancers (Dong
et al., 2003),
For this purpose, genotyping analysis of 835 individuals (453 affected and 382
controls) representing two Eastern Mediterranean populations, Turkish and Greek, was
performed and the possible association between this variant and breast cancer risk was
investigated.

44
1.
2. Materials and Methods
2.1. Materials
2.1.1. DNA samples and collaborators
DNA samples (453 affected and 382 controls, total 835) genotyped in the study
were kindly provided by our collaborators from Turkey and Greece.
List of participants:
1. Bilkent University – Department of Molecular Biology and Genetics, 06800,
Ankara, Turkey; Işık G. Yuluğ, Gülsen Çolakoğlu.
2. Gazi University –Faculty of Pharmacy, 06330, Ankara, Turkey; Ali Esat
Karakaya, Semra Sardaş, and Neslihan Aygün Kocabaş.
3. Akdeniz University – Departments of Medical Biology and Genetics, and
Surgery, Faculty of Medicide, 07070, Antalya, Turkey; Esra Manguoğlu, Güven
Lüleci, Taner Çolak.
4. Ankara Numune Research and Teaching Hospital – Department of Surgery,
06100, Ankara, Turkey; Betül Bozkurt and Ömer Cengiz.
5. Molecular Diagnostic Laboratory, I/R-RP, National Center for Scientific
Research Demokritos, Ag. Paraskevi Attikis, 15310, Athens, Greece; Drakoulis
Yannoukakos, Irene Konstantopoulou.
6. Institute of Biology, National Center for Scientific Research Demokritos, 15310,
Athens, Greece; Voutsinas Gerassimos, George Nasioulas.
7. Molecular Biology Research Center “HYGEIA” – “Antonis Papayiannis”,
15123, Athens, Greece; Eirene Papadopoulou.
8. Alfalab, Molecular Biology and Cytogenetics Center, 11524, Athens, Greece;
Lina Florentin.
9. IVF & Genetics, 15232, Athens, Greece; Elena Kontogianni.
45
2.1.2. Study population
Our study population consisted of 835 females (mean age: 49.23, standard
deviation: 13.37, age range: 15-88); divided into two groups of effected individuals
previously diagnosed with breast cancer (n=453) and control individuals with no history
of breast cancer (n=382). 301 affected and 218 control individuals were from Turkey,
and, 152 affected and 164 control individuals were from Greece (Figure 2.1). The
details of the groups are presented in the following sections.
GREEK TURKISH
AffectedControlAffectedControlGREEK TURKISH
62%38%
52% 48% 58%42%
Figure 2.1. Cohort facts.

46
Informed consent, blood samples and personal information was obtained from all
Turkish participants. At the time of blood donation, each individual completed a
standardized questionnaire (Figure 2.2) including data on age, weight, height, menstrual
and reproductive histories, family history of breast and other cancers (first degree
relatives; only mother, sister or daughters) and smoking status. Information about the
histopathology of the tumors, estrogen receptor status, and progesterone receptor status
were obtained from the medical records. The clinical information of the Greek
participants were not available except for the age and menopausal status, which were
kindly provided by our collaborators.
Selected characteristics of our study population are summarized in Table 2.1.
2.1.2.1. Patients
Our patient group consisted of 453 individuals previously diagnosed with breast
cancer (invasive breast carcinoma, mean age: 49.65, standard deviation: 12.95, age
range: 20-86). The individuals were from two countries, Greece and Turkey. Greek
patients (n = 152, mean age: 50.04, standard deviation: 15.02, age range: 20-86) were
diagnosed with breast cancer at the institutions 5-9 listed in Section 2.1.1. Turkish
patients (n = 301, mean age: 49.55, standard deviation: 12.50, age range: 20-80) were
diagnosed with breast cancer at the institutions 1-4 listed in Section 2.1.1.
The patient group was divided into two groups of premenopausal (n = 203, mean
age: 40.29, standard deviation: 7.82, age range: 20-58) and postmenopausal (n = 250,
mean age: 57.40, standard deviation: 11.15, age range 31-86).

47
2.1.2.2. Controls
Our control group consisted of 382 individuals, with no history of breast cancer
(mean age: 48.84, standard deviation: 13.68, age range: 15 - 88). The individuals were
from two countries, Greece and Turkey. Greek control individuals (n = 152, mean age:
50.83, standard deviation: 13.29, age range: 24-89) were from institutions 5-9 listed in
Section 2.1.1. Turkish control individuals (n = 218, mean age: 47.45, standard
deviation: 13.84, age range: 15-83) were from the institutions 1.4 listed in Section 2.1.1.
Control group was also divided into two groups of premenopausal (n=180, mean
age: 37.91, standard deviation: 8.05, age-range: 15-52), and post menopausal (n=202,
mean age: 58.55, standard deviation: 9.77, age range: 30-88).

48
Table 2.1. Selected characteristics of our study population.
Case
(n=453)
Control
(n=382)
Turkey
(n=301)
Greece
(n=152)
Turkey
(n=218)
Greece
(n=164)
Age mean (standard deviation) 49.55 (12.50) 50.04 (15.02) 47.45 (13.84) 50.83 (13.29)
Age range 20-80 20-86 15-83 (24-88)
Age at first birth, mean (standard deviation) 22.52 (5.17) 24.60 (4.90) 20.79 (3.99) 28 (3.74)
Age at menarche, mean (standard deviation) 13.61 (1.39) 12.73 (1.21) 13.87 (1.43) 12.25 (1.28)
Number of children, mean (standard deviation) 2.71 (1.95) 1.57 (2.40) 3.06 (2.08) 1.64 (1.08)
Body mass index (kg/m2), mean (standard
deviation) 27.44 (4.89) n/a* 27.10 (5.17) n/a*
Menopausal status at the time of blood donation
Premenopausal 121 82 107 73
Postmenopausal 180 70 111 91
n/a* : calculation was not performed due to the absence of the data.

49
HASTA ANKET FORMU
1. Adı Soyadı: 2. Yaşı: 3. Medeni hali: 4. Yaşadığı şehir ve süresi: 5. Ağırlığı: 6. Boyu (cm): 7. Mesleği: 8. İlk menstürasyon periyodunun başlama yaşı: 9. Menapozal durumu: Premenapozal ise; son menstürasyon periyodunun kaç gün önce olduğu: Postmenapozal ise; son menstürasyon periyodunun kaç gün önce olduğu: 10. Tanı konulduğu zamanki menapozal durumu: 11. Tanının ne zaman konulduğu: 12. Uygulanan tedavi: 13. Daha önce hormon tedavisi gördü mü? Ne tip? 14. Oral kontraseptif kullandimı? Nedir? 15. Kaç çocuğu var? a. İlk doğumunu yaptığı yaş? b. Son doğumunu yaptığı yaş? 16. Daha önce meme ile ilgili operasyon geçirdi mi? 17. Ooferektomi (yumutalıkların alınması) yapıldı mı? Yapıldı ise kaç yıl önce? 18. Sigara içme alışkanlığı: Hiç içmedim ( ) Eskiden içerdim ( ) 1-10 sigara/gün ( ) 11-20 sigara/gun ( ) 20 ve daha fazla/gün ( ) 1 yıldır içiyorum ( ) 2-5 yıldır içiyorum ( ) 5-10 yıldır içiyorum ( ) 10-15 yıldır içiyorum ( ) 15-20 yıldır içiyorum ( ) 20 ve daha fazla yıldır içiyorum ( ) 17. Sigara içilen ortamda sıkça bulunuyor musunuz? (a) Evet (b) Hayır 18. Alkol kullanıyor musunuz? (a) Evet (b) Hayır Nadiren Haftada 1 kez Haftada 2-3 kez Haftada 4-5 kez Haftada 6-7 kez 19. Beslenme alışkanlığınızda size en fazla uyan tanım aşağıdakilerden hangisidir? a. Kızartma ağırlıklı yağlı diyet b. Sebze ağırlıklı yağsız diyet c. Dengeli beslenme 20. Radyasyona maruz kaldınız mı? Hangi sıklıkla? a) Evet (b) Hayır 21. Tiroid ile ilgili bir rahatsılığınız var mı? (a) Evet (b) Hayır Hipertiroidizm ( ) Hipotiroidizm ( ) 22. Aile bireylerinde ve sizde genetik bir rahatsızlık var mı? Tipi. (a) Evet (b) Hayır 23. Ailenizde meme kanserli başka bireyler var mı? (Anne, kardeş, anneanne,vb) (a) Evet (b) Hayır 24. Tümörün histopatolojisi 25. Tümör grade 26. Tümör stage 27. Östrojen reseptör durumu (+) veya (-) 28. Progesteron reseptör durumu (+) veya (-)
Figure 2.2. “Hasta Anket Formu”.

50
2.1.3. Primers
Two pairs of primers (common reverse primer) for RNASEL and one pair of
primer for the amplification of a control gene were used in the study. The sequences of
the primers used in the study (Casey et al., 2002) are listed below (Table 2.2).
Table 2.2 List of primers for the amplification reactions.
Primer Sequence of the Primer Target
Gene
1385G 5’-GTGGAAAATGAGGAAGATGAATTTGCCAG-3’
1385A 5’-GTGGAAAATGAGGAAGATGAATTTGCCAG-3’
1385R 5’-ATTGGGGACTCACCTATTAAGATGTTTTG-3’
RNASEL
ARMS-A 5’-CCCACCTTCCCCTCTCTCCAGGCAAATGGG-3’
ARMS-B 5’-GGGCCTCAGTCCCAACATAGGCTAAGAGGTG-3’
Control
gene*
* The control amplicon is a 393-bp fragment of GKC (available in NCBI, Blast,
AV690557)

51
2.1.4. Chemicals and reagents
Table 2.3. Chemicals, reagents and their producers.
Chemical Used Producer
Agarose Basica LE, EU
Boric Acid Sigma, St. Louis, MO, USA
Bromophenol blue Sigma, St. Louis, MO, USA
EDTA Boehringer Mannheim, Mannheim, Germany
Ethidium Bromide Sigma, St. Louis, MO, USA
Ficoll Type 400 Sigma, St. Louis, MO, USA
TrisHCl Merck, Schuchardt, Germany
Xylene cyanol Sigma, St. Louis, MO, USA
2.1.5. PCR materials
The amplification was carried out using;
- Taq polymerase (5 U/µl) enzyme, MBI Fermentas Inc. , NY, USA.
- 10X PCR reaction buffer (100 mM Tris-HCl, pH 8. 8 at 25°C, 500 mM KCl, 0.
8% Nonidet P40), MBI Fermentas Inc., NY, USA.
- 25 mM MgCl2, MBI Fermentas Inc., NY, USA.
- 10 mM dNTP mix, MBI Fermentas Inc., NY, USA.
- Primers (listed in Table 2.2), Iontek Co, Bursa, TURKEY.
The amplification reactions were carried out in “Gene Amp PCR system 9600”,
Perkin Elmer, Foster City, CA, USA.

52
2.1.6. Standard solutions and buffers
• Agarose gel loading buffer (6X) (Maniatis et al., 1989, page B.24).
15 % ficoll
0.05 % bromophenol blue
0.05 % xylene cyanol
• Ethidium Bromide (10 mg/ml) (Maniatis et al., 1989, page B.11).
1 g of ethidium bromide
100 ml H2O
• Tris-boric-acid-EDTA (TBE) (10X) (1L) (Maniatis et al., 1989, page B.23).
108 g Tris HCl
55 g boric acid
20 m 0.5 M EDTA
Add ddH2O to a final volume of 1 L.

53
• Standard DNA size markers;
Figure 2.3. Standard DNA size markers. pUC Mix Marker, 8* (on the left) and
Mass RulerTM DNA Ladder, Mix, ready-to-use** (on the right).
* 1.7% agarose, 0.5µg/lane, 8cm length gel, 1X TBE, 12V/cm (MBI, Fermentas).
** 1% agarose, 20µl/lane, 8cm length gel, 1X TAE, 17V/cm (MBI, Fermentas).

54
2.2. Methods
2.2.1. Amplification Refractory Mutation System (ARMS)
The genotyping of the individuals were carried out using the Amplification
Refractory Mutation System (ARMS). ARMS, also known as Allele Specific PCR
(ASPCR) or PCR Amplification of Specific Alleles (PASA), is used in detection of
known single-base substitutions or micodeletions/insertions.
DNA polymerases are the enzymes responsible for the synthesis of a new DNA
strand on a template strand. During this process, these enzymes can add the new
nucleotide to the growing strand only if the previously added nucleotide is completely
matched with the previous nucleotide on the template strand. This is also valid for the
last nucleotide of the oligonucleotide primers, for the addition of the next nucleotide of
the strand to be synthesized. This is the basis of the “Refractory Mutation System”
(Lewin, 1997, pp472-7).
In Amplification Refractory Mutation System (ARMS) two complementary
reactions are performed. One reaction contains a specific primer for the normal allele
and the other for the mutant allele. They are included in the PCR reaction in addition to
the other common components of the PCR reaction (with one common primer)
(Stratchan et al., 1999, pp431-2).
Each of the primers perfectly matches one of the alleles, one for the wild-type
and one of the mutant. Genotyping is based on whether there is amplification in the
reaction. For example, if the amplification with the wild-type specific primer occurs,
this means the individual contains that allele, and the just in the same manner if the
amplification with the mutant-specific primer occurs, this means the individual contains
the allele. If a sample leads to only one band with the one type of reaction, this means
that, the individual is homozygote for that allele. And if a sample leads to two bands in
each lane, this means that the individual is heterozygote (Amplification Refractory
Mutation System, “www.ich.ucl.ac.uk/cmgs/arms98.htm”).

55
2.2.1.1. Polymerase Chain Reaction (PCR) for ARMS
One of the most notable developments in the field of applied molecular genetics
in the last decade was the invention of a simple DNA amplification strategy called the
polymerase chain reaction (PCR). The idea for PCR is credited to Karry Mulis, who
was a research scientist in the 1980s at a California biotechnology company called
Cetus. Karry Mullis showed that the amplification of defined segments of DNA (or
cDNA) could be performed with oligonucleotide primers. Mullis was awarded the
Nobel Prize in Chemistry in 1993 for his recognized contribution to the development of
PCR (Miesfeld, 1999, p143).
For the time being, PCR is a frequently used method for oligonucleotide primer
directed enzymatic amplification of a specific DNA sequence of interest, with two
important benefits, first the enormous amplification achieved, and the high specificity of
amplification. PCR amplification occurs under the dictation of two oligonucleotide
primers that flank the DNA fragment which is to be amplified. The amplification begins
with an initial denaturation of the template DNA. Following cycles includes
denaturation, annealing of the primers to their complementary sequences, and extension
of the annealed primers with heat stable Thermus aquaticus DNA polymerase (Old et al.,
1998, pp178-83).
This is just a simple copy of the naturally occurring event in vivo, under the
experimental conditions. Provided enzyme works on the template using the provided
substances (primers, dNTPs…) obeying to the physicochemical rules governed by the
conditions that the researcher adjusts. At the end of each cycle the number of the
amplicons grows exponentially, resulting in nearly 2n of amplicons at the end of n
cycles. And a final elongation step at the end of the cycles.
PCR reactions were carried out in a total of 15 µl of volume. 50-100 ng of
genomic DNA was amplified by using 5 pmol of primers of matching forward and
reverse. 3 pmol of control primers were used. 1 U Taq Polymerase, 1x Polymerase
Buffer, 1 µl of MgCl2, 0.3 µl of dNTP mix was used for each reaction. PCR conditions
are as follows; Initial denaturation is at 95°C for 5 minutes. Denaturation of 30 seconds

56
at 94°C, annealing 30 seconds at 56°C, polymerization for 40 seconds at 72°C is
repeated for 30 cycles. Final extension was 10 minutes at 72°C, which is followed by
4°C soak. This reaction amplifies a 123-bp fragment of our interest and 393–bp
fragment of internal control.
2.2.2. Agarose Gel Electrophoresis
The separation of nucleic acids by electrophoretic mobility is used for both
analytical and preparative purposes. DNA and RNA molecules are negatively charged
due to the phosphate backbone. The polymer structure leads to a constant charge to mass
ratio. Therefore, in a uniform electric field, nucleic acid molecules move through a solid
support matrix from the negatively charged cathode towards the positively charged
anode at a rate that is inversely proportional to the log10 of the molecular weight. There
are two types of matrices with different ranges of molecular weights of nucleic acids that
can be analyzed. Agarose gels are generally used to separate nucleic acid molecules of
0.2 – 10 kb, and acrylamide gels are best suited for resolving nucleic acids less than 500
kb nucleotides long.
Agarose is a linear polysaccharide polymer derived from a red seaweed. The
agarose powder is mixed with buffer to make the gel. This gel may also contain the
staining agents like Ethidium Bromide (EtBr). EtBr embeds between the nucleotides,
and due to the luminescence property of EtBr, the DNA molecules can be easily viewed
under UV light (Miesfeld, 1999, p18-9).
2% (w/v) agarose gels were prepared in 1xTBE buffer and 1µl of Ethidium
Bromide solution from 10 mg/ml was added to the buffer. 3 µl 6x loading buffer was
added to the PCR tube containing 15 µl of amplicon. And the mix was loaded onto the
gel. The products were run at 90 volts for nearly 45 minutes. The gel was then analyzed
under the transilluminator and photographs were taken. pUC mix8 or Mass RulerTM
DNA Ladder was used as the DNA size marker.

57
2.2.3. Genotyping of Individuals
The RNASEL G1385A mutation analysis was performed by using Amplification
Refractory Mutation System (ARMS). The genotypes of each individual were scored by
two independent researchers. In order to provide further reliability, some selected
samples are subjected to genotyping again.
Two different forms of the sequence were analyzed by the presence of the bands
in the corresponding reaction products. The presence of the control bands in both
reactions was expected to assure that the reaction has worked properly. The presence or
the absence of the bands in the corresponding region indicated the presence of the
genotype.
Both of the reactions were performed in same conditions for the two tubes. The
amplified fragments were electrophoresed in 2% agarose (Figure 2.5).

58
Sample 1 Sample 2 Sample 3
Marker
(pUC 8, Mix)
Sample 1 –
Wild-type
Reaction
Sample 1 –
Mutant-type
Reaction
Sample 2 –
Wild-type
Reaction
Sample 2 –
Mutant-type
Reaction
Sample 3 –
Wild-type
Reaction
Sample 3 –
Mutant-type
Reaction
393-bp
123-bp
Result
This sample carries two
alleles with normal sequence,
so, scored as,
Homozygote Wild-type.
This sample carries one allele
with normal sequence and one
allele with mutant sequence,
so, scored as,
Heterozygote.
This sample carries two
alleles with mutant sequence,
so, scored as,
Homozygote Mutant-type.
Figure 2.5. Schematic representation of RNASEL genotyping.
59
2.2.4. Statistical analyses
Statistical analyses (P-value, Crude Odds Ratio and Adjusted Odds Ratio with
95% Confidence Interval calculations), were carried out with the SPSS 9.0.0 software
program. The power calculation of the study was done with the EpiCacl 2000 v1.02.
We sought to investigate the hypothesis that the Arg462Gln variant of RNASEL
is implicated in the development of breast cancer. This was our null hypothesis. For the
statistical calculations, null hypothesis is the hypothesis to be tested. The opposite
statement is the alternative hypothesis, which holds true if our data rejects our null
hypothesis. The statistical analysis to proof the null hypothesis is called hypothesis
testing. For this purpose, appropriate statistical tests will be performed, and if the results
are in accordance with the acceptance of the null hypothesis, than we will conclude that
our hypothesis is true.
2.2.4.1. Chi-square (χ2) test for P-value calculation
In studies ending with count or frequency data, the chi-square distribution is the
most frequently used technique to understand if any relationship between the two
variables exists. Two types of variables yielding two types of data (numerical or
categorical) are generated from the randomly drawn populations. Numerical data is in
the format of continuous numbers (i.e. age; 1,2,3,…), but the categorical data is in the
format of two or more values representing the categories of data (i.e. smoking status; “1”
for smokers and “0” for nonsmokers).
The quantity chi-square is a measure of the agreement of the observed and
expected frequencies. The value of the chi-square is small when there is a close
agreement between the observed and expected frequencies, but the value is large, when
the agreement is poor. This can be easily understood regarding the formula of the chi-
square.

60
Χ2 = Σ [ (Oi – Ei)2 / Ei ]
Where, the Oi is the observed frequency for the ith category of the variable of
interest. Just in a similar manner, Ei is the expected frequency for the ith category of the
variable of interest.
When the distributions of the two variables are similar, the term “(Oi – Ei)” will
be close to zero, which will lead to a χ2 value smaller, or close to zero.
And in the case of small values for χ2, we are unable to reject the H0. When we
have a large χ2 value, we reject the H0, which means that, the distributions of the two
groups of data for the observed and expected are similar. And this tells us that the
association between the two variables is strong. In another words, the results are close
to the ones that we expect.
2.2.4.2. P-value calculation
P-value is generally used in the evaluation of the statistical significance of the
results. Chi-square test is used for the calculation of the P-value. P-value indicates a
probability ranging from zero to one. P-value operates in the manner of accepting or
rejecting a null hypothesis. The previously defined null hypothesis is tested by the P-
value.
If the P-value calculated from the study is smaller than the previously set
threshold value, then we may conclude that the results are significant. If the P-value is
larger than the previously set threshold value, then we may conclude that the results are
not significant. The threshold value for the P-value is traditionally chosen as 0.05.
The interval of results that are regarded as possible alternatives due to the size
and variability of the results are called confidence interval (CI). The intervals are
calculated for any desired degree of confidence. But the traditionally used confidence is
95%. The interval indicates that, if you continue the research, you will obtain data
within the interval in 95% of the trials.

61
2.2.4.3. Odds Ratio calculation
Observational study
An observational study is a scientific investigation, in which neither the subjects
nor any of the variables of interest are manipulated (For example, in our study, we do
not attempt to change the genotype of any individual).
We have two types of variables. First type is the dependent variable, which is
also named as the outcome. This is the breast cancer phenotype in our study. The other
type is the independent variable, which is also named the risk factor. The genotypes of
the individuals are the risk factors in our study, or in the calculation of the adjusted odds
ratio, when we defined more than one risk factor such as; the age or menopausal status,
they are the risk factors.
Two types of observational studies
Observational studies may be divided into two groups of prospective and
retrospective studies according to their sampling schemes. In prospective studies two
random samples of subjects are selected, one sample consisting of subjects possessing
the risk factor and the other sample consisting of subjects who do not possess the risk
factor. The classification of the subjects into the two sample groups of outcome variable
are recorded in the time interval that is they are followed prospectively. But in a
retrospective study, the samples are selected from those belonging to the two or more
categories of the outcome variable. Determination of the presence or the absence of the
risk factor in those groups is performed to evaluate the possible association of the risk
factor, and the outcome. So, we are setting two categories upon the outcome, the study
group of affected individuals and the control group of the individuals with no history of
outcome. By using the calculated frequencies of the risk factor in each group, we
perform statistical analysis to evaluate the association.
62
The data resulting from those studies involving two dichotomous variables are
generally displayed in a 2x2 contingency table. This table provides information about
the numbers of individuals with and without the risk factor, in the groups of exposed and
not exposed (Table 2.4).
Two ways of expressing the risk for two types of observational studies
The estimation of the risk of the outcome in a population can be done in two
different ways in two different types of observational studies. “Relative Risk” (RR) is
more commonly used in the risk estimation in prospective studies and the Ratio of the
Odds (Odds Ratio; OR) is more commonly used in the risk estimation in retrospective
studies. Both are actually the ratio of the risk of developing a disease among subject
with the risk factor to the risk of developing the disease among subjects without the risk
factor.
Odds ratio (OR) is an expression of the risk. It can have a value between zero
and infinity. If the OR has a value of zero, than we may conclude that the risk of
developing the disease does not have any association with the presence risk factor. The
OR smaller than 1 indicates the reduced odds of disease among the subjects with the risk
factor, than the subjects without the risk factors. But the OR bigger than 1 indicates the
increased odds of disease among the subjects in whom the risk factor is present.
As described before, we have also calculated a confidence interval (with 95%
confidence) for our OR. To assign an odds ratio as statistically significant, the
confidence interval must exclude the value of “1”. Only in such a condition we may say
with 95% confidence that the further trials will end with results within the interval.

63
Table 2.4. Sample 2x2 Table for Odds Ratio Analysis.
Risk Factor Control Case
Present a c
Absent b d
a: number of controls with the risk factor
b: number of controls without the risk factor
c: number of cases with the risk factor
d: number of cases without the risk factor
then;
OR = ad / bc
and,
95% CI = e ln [OR] ± 1. 96 times square root of (1/a + 1/b + 1/c + 1/d)
2.2.4.4. Multivariate adjusted odds ratio calculation
The association of the disease status and the risk factor may also be investigated
also considering other independent variables (risk factors). In other words, we also
calculated the association of the RNASEL genotype and the breast cancer status
considering the other possible risk factors for the breast cancer, such as the menopausal
status, age, reproductive and hormonal histories, smoking status, body-mass-index,
family histories of cancer, number of children of the individuals. The basis of the
selection of additional independent variables is a strong association with the outcome
but no association with other independent variables. Multiple variant descriptions on the

64
binary logistic regression analysis is performed to calculate the adjusted odds ratio for
these independent variables.
2.2.4.5. Calculation of the power of our study
In order to evaluate the reliability of the statistical analyses that we have
performed, we also calculated the “Statistical power” of our study. Statistical power of a
study depends on the following variables;
- The size of the study group (actually the ratio of the cases to controls is
important),
- The significance level must be set (traditionally the significance level is set as
α=0.05),
- The allele frequencies (the frequency of the controls that are exposed to the risk
factor is required),
- A specific odds ratio.
The ratio of the cases to controls must be as low as possible. That is the number
of controls must be high enough. Significance level is generally accepted as α = 0.05.
Apart from other variables, the involvement of a specific odds ratio is, somehow
unusual. The power may be calculated for a specific odds ratio of any value. That is,
knowing all the other variables, a researcher may calculate the power value for a specific
odds ratio of 2, or a specific odds ratio of 1. But as the specific odds ratio is decreased,
the power of the study also decreases. So, a balanced level must be set between these
two variables. A study must have adequate power for an acceptable specific odds ratio.
The traditionally acceptable power for such studies is 80% (or higher). So, a specific
odds ratio is chosen that study has a suitable power.

65
2.
3. Results
We investigated the association for RNASEL G1385A variant and breast cancer
risk. The genotyping of the individuals was done using Amplification Refractory
Mutation System (ARMS). The results were scored by two independent researchers and
some selected samples were subjected to second genotyping in order to check the
accuracy of our results.
3.1. Cohort information
We have also performed statistical analyses of the genotyping data. In order to
perform statistical calculations, we had to further analyze the characteristics of our study
population. For example, the percentage of individuals having a BMI value higher than
the mean BMI of the control individuals was calculated. These values are presented in
Table 3.1.
Table 3.1 also states the association between the cancer occurrence and the
established risk factors. The Odds Ratios (OR) were calculated for the risk factors and
the breast cancer, and the results are in accordance with the previously stated importances
of these factors.
The possible effect of menopausal status on the breast cancer risk well
documented. 40.20% of the Turkish and 53.95% of the Greek patients are
premenopausal, and 59.80% of the Turkish and 46.05% of the Greek patients are post
menopausal. 49.08% of the Turkish and 44.51% of the Greek controls were
premenopausal, and 50.92% of the Turkish and 55.49% of the Greek controls are post
menopausal. The mean age of menarche is 13.61 for the Turkish and 12.73 for the Greek
patients, and, 13.87 for the Turkish and 12.25 for the Greek patients.
Owing to the stated importance of the body mass index (BMI) on the breast
cancer risk, the percentage of individuals having BMI higher than a threshold value is
calculated. Since the BMI data was missing for the Greek samples, we could perform the

66
calculations for only the Turkish patients and controls. The mean BMI of the control
individuals were used as the threshold value. The 47.09% of the patients and 52.91% of
the control individuals were having a BMI value higher than the mean of controls. Of the
patients, 5.59% is premenopausal, and 41.50% is postmenopausal. Of the controls,
6.94% is premenopausal and 45.97% is post menopausal.
3.2. Genotyping of RNASEL and genotype distributions
We performed genotyping of RNASEL G1385A by using Amplification
Refractory Mutation System (ARMS). The samples were subjected to PCR amplification
due to the instructions of ARMS. The reaction produces a 123-bp fragment of our
interest if the allele (that the primer is specific for) is present. And upon the presence or
the absence of the bands the genotyping of the individuals were performed (An example
of the PCR result is shown in Figure 3.1). There were three possible outcomes, G/G,
G/A, and A/A. The wild-type form is G/G, and the homozygote mutant form is A/A.
The G/A genotype is the heterozygote. The G→A conversion in the RNASEL sequence
results in Arg→ Gln conversion in the protein product.
The number of patients and controls genotyped for RNASEL G1385A variant
were, 453 and 382, respectively. There were 301 Turkish and 152 Greek patients, and
218 Turkish and 164 Greek control individuals in our study.
The paired PCR amplification for the ARMS procedure with the specific primers
gives two separate bands of different length. First one is the control band (393-bp),
which indicates the success of the amplification. And the second band (123-bp), if
present, indicates the presence of the allele. Sample result of ARMS procedure is shown
in Figure 3.1 (Also refer to Figure 2.5 for schematic representation).
The genotype distribution in the whole group, the Turkish and the Greek
population is summarized in Table 3.2. Further sub-grouping of the results on the
menopausal status is presented in Table 3.3.

67
Table 3.1. Characteristics of participants in our study.
Cases n=453 Controls n=382
Tr1 n=301 Gr1 n=152 Tr1 n=218 Gr1 n=164 OR (95% CI)
Age (yr), mean 49.55 50.04 47.45 50.83 1.0045 (0.9938 – 1.0153) 1st degree relative with breast cancer 5.65% n/a2 0 n/a2
Body mass index, mean 27.44 n/a2 27.10 n/a2 Age at first live birth, mean 22.52 24.603 20.79 28.003 1.0670 (1.0243 – 1.1115) Number of children, mean 2.71 1.573 3.06 1.643 0.9702 (0.8953 – 1.0513)
Age at menarche, mean 13.61 12.733 13.87 12.253 1.0104 (0.9028 – 1.1308) Smoking Status 0.6775 (0.4251 – 1.0798)
Menopausal Status 1.0974 (0.8350 – 1.4422) Premenopausal 40.20% 53.95% 49.08% 44.51% Postmenopausal 59.80% 46.05% 50.92% 55.49%
BMI ≥ 27.103 (n=189) 47.09% n/a2 52.91% n/a2 1.0134 (0.9733 – 1.0551) Premenopausal 5.59% n/a2 6.94% n/a2 Postmenopausal 41.50% n/a2 45.97% n/a2
Age at menarche ≤ 13.873 62.13% n/a2 86.70% n/a2 1 Tr; Turkish, Gr; Greek
2This calculation was performed with Turkish data. Greek data excluded due to the high number or whole missing data. 3This value was calculated using the data for the known samples. The unknown samples are excluded.

68
Figure 3.1. Genotyping of RNASEL G1385A variant in breast cancer patients. A 123-bp RNASEL specific, and
a 393-bp GKC (control) specific amplicon is observed. The RNASEL G allele specific primers were used in lanes 1, 3,
5, 7, and 9; and RNASEL A allele specific primers were used in lanes 2, 4, 6, 8, and 10. The breast cancer patients
genotyped in this experiment are BC-211 (lanes 1 and 2), BC-303 (lanes 3 and 4), BC-305 (lanes 5 and 6), BC-306
(lanes 7 and 8), and BC-309 (lanes 9 and 10). Based on the results BC-211 and BC-309 are heterozygous for the
RNASEL G1385A variant. BC-303 and BC-306 are homozygous wild-type, and BC-305 is homozygous mutant. M:
DNA size marker (pUC mix 8).
331-bp
331-bp
1 2 3 4 5 6
7 8 9 10
147-bp
147-bp
M

69
Distribution of the genotypes and the alleles
In the whole study group, which consists of 453 affected and 382 control
individuals, genotype distributions are as follows; G/G 45.48% (n=206), G/A 42.16%
(n=191) and A/A 12.36% (n=56) in the patients and G/G 43.98% (n=168), G/A 40.05%
(n=153), and A/A 15.97% (n=61) in the control group, and G/G 50.00% (n=109), G/A
40.37% (n=88), and A/A 9.63% (n=21) for the controls. The combined frequency of G/A
and A/A genotypes, which represent the frequency of the presence of at least one allele is
54.52% (n=247) for the patients and 56.02% (n=214) for the controls (Table 3.2).
In the Turkish population, the genotype distributions for the patients are G/G
48.50% (n=146), G/A 41.20% (n=124), and A/A 10.30% (n=31), and G/G 50.00%
(n=109), G/A 40.37% (n=88), and A/A 9.63% (n=21) for the controls. The combined
frequency of G/A and A/A genotypes is 51.50% (n=155) for the patients and 50.00%
(n=109) for the controls (Table 3.2).
In the Greek population, G/G genotype was observed in 39.47% (n=60) of the
patients and 35.98% (n=59) of the controls, G/A genotype in 44.08% (n=67) of the
patients and 39.63% (n=65) of the controls, and A/A genotype in 10.30% (n=25) of the
patients and 9.63% (n=40) of the controls. The frequency of the individuals having at
least one mutant allele was 60.53% (n=92) in the patients and 64.02% (n=105) in the
controls (Table 3.2).

70
Table 3.2. Distribution of RNASEL G1385A genotypes and breast cancer risk in the age matched controls and breast cancer patients.
Population Genotype Case n=453 (%) Control n=382 (%OR (95% CI)
Crude OR (95% CI)
Adjusteda,b G/G 206 (45.48) 168 (43.98) 1.00 1.00
G/A 191 (42.16) 153 (40.05) 1.02 (0.76- 1.37) 0.95 (0.70- 1.29) A/A 56 (12.36) 61 (15.97) 0.75 (0.49- 1.14) 0.72 (0.46- 1.12) W
hole
gr
oup
G/A or A/A 247 (54.52) 214 (56.02) 0.94 (0.72- 1.24) 0.89 (0.66-1.18) G/G 60 (39.47) 59 (35.98) 1.00 1.00 G/A 67 (44.08) 65 (39.63) 1.01 (0.62- 1.66) 0.78 (0.42- 1.46) A/A 25 (16.45) 40 (24.39) 0.62 (0.33- 1.14) 0.67 (0.32- 1.42) G
reek
gr
oup
G/A or A/A 92 (60.53) 105 (64.02) 0.86 (0.55- 1.36) 0.74 (0.42- 1.31) G/G 146 (48.50) 109 (50.00) 1.00 1.00 G/A 124 (41.20) 88 (40.37) 1.05 (0.73- 1.52) 0.77 (0.46- 1.28) A/A 31 (10.30) 21 ( 9.63) 1.10 (0.60- 2.02) 1.07 (0.48- 2.39) T
urki
sh
grou
p
G/A or A/A 155 (51.50) 109 (50.00) 1.06 (0.75- 1.50) 0.82 (0.51-1.33)
Gr: Greek, Tr: Turkish populations. ORs and 95% CIs were calculated using binary logistic regression. Adjusted for;
aage and menopausal status (Gr, Gr+Tr) and bsmoking status, body-mass-index, age at menarche, age of 1st pregnancy, number of children, family history of breast cancer (Tr).

71
Table 3.3. The allele frequencies and sample odds ratios in subgroups according to
menopausal status.
Menopause Population Genotype Case n=453 (%)
Control n=382 (%)
Crude OR (95% CI)
G/G 206 (45.48) 168 (43.98) 1.00 G/A 191 (42.16) 153 (40.05) 1.02 (0.76- 1.37) A/A 56 (12.36) 61 (15.97) 0.75 (0.49- 1.14)
Whole group
G/A or A/A 247 (54.52) 214 (56.02) 0.94 (0.72- 1.24) G/G 60 (39.47) 59 (35.98) 1.00 G/A 67 (44.08) 65 (39.63) 1.01 (0.62- 1.66) A/A 25 (16.45) 40 (24.39) 0.62 (0.33- 1.14)
Greek group
G/A or A/A 92 (60.53) 105 (64.02) 0.86 (0.55- 1.36) G/G 146 (48.50) 109 (50.00) 1.00 G/A 124 (41.20) 88 (40.37) 1.05 (0.73-1.52) A/A 31 (10.30) 21 ( 9.63) 1.10 (0.60- 2.02)
All
Turkish group
G/A or A/A 155 (51.50) 109 (50.00) 1.06 (0.75- 1.50) G/G 92 (45.32) 75 (41.67) 1.00 G/A 86 (42.36) 77 (42.78) 0.91 (0.59- 1.40) A/A 25 (12.32) 28 (15.56) 0.73 (0.39- 1.35)
Whole group
G/A or A/A 111 (54.68) 105 (58.33) 0.86 (0.57- 1.29) G/G 29 (35.37) 22 (30.14) 1.00 G/A 39 (47.56) 31 (42.47) 1.88 (0.78- 4.54) A/A 14 (17.07) 20 (27.39) 1.80 (0.78- 4.12)
Greek group
G/A or A/A 53 (64.63) 51 (69.86) 0.79 (0.40- 1.55) G/G 63 (52.07) 53 (49.53) 1.00 G/A 47 (38.84) 46 (42.99) 0.86 (0.50- 1.49) A/A 11 ( 9.09) 8 ( 7.48) 1.16 (0.43- 3.09)
Premenopausal
Turkish group
G/A or A/A 58 (47.93) 54 (50.47) 0.90 (0.54- 1.52) G/G 114 (45.60) 93 (46.04) 1.00 G/A 105 (42.00) 76 (37.62) 1.31 (0.74- 2.29) A/A 31 (12.40) 33 (16.34) 1.47 (0.83- 2.61)
Whole group
G/A or A/A 136 (54.40) 109 (53.96) 1.02 (0.70- 1.48) G/G 31 (44.29) 37 (40.66) 1.00 G/A 28 (40.00) 34 (37.36) 1.52 (0.64- 3.66) A/A 11 (15.71) 20 (21.98) 1.50 (0.62- 3.65)
Greek group
G/A or A/A 39 (55.71) 54 (59.34) 0.86 (0.46- 1.62) G/G 83 (46.11) 56 (50.45) 1.00 G/A 77 (42.78) 42 (37.84) 0.96 (0.44- 2.09) A/A 20 (11.11) 13 (11.71) 1.19 (0.54- 2.63)
Postmenopausal
Turkish group
G/A or A/A 97 (53.89) 55 (49.55) 1.19 (0.74- 1.91)

72
Genotype distribution in different menopausal groups
The genotype distribution in our study population was also investigated in
different menopausal groups. The genotype distributions in premenopausal and post
menopausal individuals were calculated in whole group and the two countries separately
(Table 3.3).
The grouping of the individuals upon their menopausal status (regardless of their
country) did not reveal any statistically significant results. G/G genotype was detected
in 45.32% (n=92) and 41.67% (n=75) premenopausal patients and controls, respectively.
The same genotype was observed in 45.60% (n=114) and 46.04% (n=93)
postmenopausal patients and controls, respectively. 42.36% (n=86) and 42.78% (n=77)
premenopausal patients and controls, respectively, and 42.00% (n=105) and 37.62%
(n=76) postmenopausal patients and controls, respectively are found to be G/A
genotype. A/A genotype was observed in 12.32% (n=25) and 15.56% (n=28)
premenopausal patients and controls, and 12.40% (n=31) and 16.34% (n=33)
postmenopausal patients and controls, respectively. Finally, as mentioned in the
previous sections, in order to calculate the risk contribution correctly, the percentage of
the individuals having at least one mutant allele is also calculated. At least one mutant
allele was present in 54.68% (n=111) and 58.33% (n=105) premenopausal patients and
controls, and 54.40% (n=136) and 53.96% (n=109) postmenopausal patients and
controls, respectively.
Genotype distribution in different menopausal groups of Turkish
individuals
In the Turkish population, consisting of 301 affected and 218 control individuals,
the genotype frequencies in different menopausal groups were as follows; G/G 52.07%
(n=63) and 49.53% (n=53) in premenopausal Turkish patients and controls, 46.11%
(n=83) and 50.45% (n=56) in postmenopausal Turkish patients and controls,
respectively; G/A genotype in 38.84% (n=47) and 42.99% (n=46) premenopausal

73
Turkish patients and controls, 42.78% (n=77) and 37.84% (n=34) postmenopausal
Turkish patients and controls, respectively; A/A genotype in 9.09% (n=11) and 7.48%
(n=8) in premenopausal Turkish patients and controls, and 11.11% (n=20) and 11.71
(n=13) in postmenopausal Turkish patients and controls, respectively. Finally, the
individuals having at least one mutant allele is 47.93% (n=58) and 50.47% (n=54) in
premenopausal Turkish patients and controls, and 53.89% (n=97) and 49.55% (n=55) in
postmenopausal Turkish patients and controls, respectively.
Genotype distribution in different menopausal groups of Greek individuals
In the Greek populations, consisting of 152 affected and 164 control individuals,
the genotype distributions in different menopausal groups were as follows; G/G 35.37%
(n=29) and 30.14% (n=22) in premenopausal Greek patients and controls, and 44.29%
(n=31) and 40.66% (n=37) in postmenopausal Greek patients and controls, respectively.
G/A genotype in 47.56% (n=39) and 42.47% (n=31) in premenopausal Greek patients
and controls, and 40.00% (n=28) and 37.36% (n=34) in postmenopausal Greek patients
and controls, respectively. A/A genotype in 17.07% (n=14) and 27.39% (n=20) in
premenopausal Greek patients and controls, and 15.71% (n=11) and 21.98% (n=20) in
postmenopausal Greek patients and controls, respectively. Finally, the percentage of
individuals having at least one mutant allele is 64.63% (n=53) and 69.86% (n=51) in
premenopausal Greek patients and controls, and 53.89% (n=97) and 49.55% (n=55) in
postmenopausal Greek patients and controls, respectively.

74
3.3. Statistical analysis
We performed statistical analysis of the genotyping data. The statistical analyses
were performed by using SPSS 9.0.0 software program and EpiCalc 2000 v1.02 for the
power calculation of our study.
3.3.1. P-value calculation
In order to evaluate the association between the breast cancer risk and the risk
genotype in the cases and controls we have performed t-test to calculate p-values.
The P value for the whole group was P= 0.665. Since, the value is higher than
the threshold value of 0.05, it indicates the absence of association between the breast
cancer risk and RNASEL G1385A variant. The calculated P values for either
populations or either menopausal groups were similarly higher than the threshold value,
which again indicated the absence of association (Table 3.4).
Table 3.4. P-values.
Manopausal Status Population P-value Whole group 0.665 Greek group 0.521 All
Turkish group 0.737 Whole group 0.472 Greek group 0.489 Premenopausal
Turkish group 0.703 Whole group 0.926 Greek group 0.644 Postmenopausal
Turkish group 0.472

75
3.3.2. Results of Odds-Ratio calculation (Crude)
The possible association between the genotype and the development of breast
cancer risk was investigated using the odds ratio. The odds ratios calculated from these
data are summarized in Table 3.2.
1385G→A conversion is suggested to be a risk factor for the development of
breast cancer. So, the individuals with G/G genotype were assigned as the control
group. So, the G/A and A/A genotypes are assigned as the risk genotypes. Their
possible impact on the breast cancer risk was investigated either for each and both. In
order to investigate the impact of having one mutant and one wild-type allele, we
assigned the G/G genotype as the control and the G/A genotype as the risk factor. In
order to investigate the impact of having two mutant alleles, we assigned the G/G group
as the control and the A/A as the risk genotype. We also investigated the impact of
having at least one mutant allele. For this calculation, we assigned the individuals with
G/G as the control group, and the individuals with G/A or A/A genotypes as the risk
group. The results of the crude odds ratio calculation are summarized in Table 3.2.
Considering both the G/A and A/A genotypes as the risk factors, the crude odds
ratio for the study population is 0.94 (95% CI, 0.72-1.24). This value ia 1.02 (95% CI,
0.76-1.36) when the G/A genotype alone was assigned as the risk factor and 0.75 (95%
CI, 0.49-1.14) when the A/A genotype alone was assigned as the risk factor.
The crude odds ratio for the Greek group is 0.86 (95% CI, 0.55- 1.36) for the
G/A and A/A genotypes combined. This value is 1.01 (95% CI, 0.62- 1.66) for the G/A
genotype alone and 0.62 (95% CI, 0.33- 1.14) for the A/A genotype alone.
Considering the Turkish group, the crude odds is 1.06 (95% CI, 0.75-1.50) for
the G/A and A/A genotypes combined. This value is 1.05 (95% CI, 0.73-1.52) for the
G/A genotype alone and 1.10 (95% CI, 0.60-2.02) for the A/A genotype alone.
The crude odds ratio values for the menopausal groups are summarized in Table
3.3. The crude odds ratio values were 0.86 (95% CI, 0.57-1.29) for the premenopausal
group and 1.02 (95% CI, 0.70-1.48) for the postmenopausal group of our study
population. These values were 0.90 (95% CI, 0.54-1.52) and 1.19 (95% CI, 0.74-1.91)
76
for the premenopausal and postmenopausal Turkish groups, respectively. Considering
the Greek population, 0.79 (95% CI, 0.40-1.55) and 0.86 (95%CI, 0.46-1.62) were the
crude odds ratio values for the premenopausal and postmenopausal groups, respectively.
Although these results cannot be regarded as statistically significant results, the
crude odds ratio values are higher in post menopausal groups. They are also smaller
than 1, but with higher values. This may reflect a possible effect of menopausal status in
addition the RNASEL 1385G→A variant in our study group.
3.3.3. Results of Odds-Ratio calculation (Adjusted)
In order to provide further level of confidence to our statistical analyses, we have
also performed the calculation of adjusted odds ratio. For the calculation of the adjusted
odds ratio, all the variables that will be used in the adjustment of the data must be
available for every individual. But the only data available for all the Greek individuals
were the age and the menopausal status. So, the adjustment of the data in the Greek
group and the whole group was only done for the age and menopausal status. But the
adjusted odds ratio for the Turkish population was calculated for all the variables (age,
menopause status, smoking status, body-mass-index (BMI), age at menarche, age of first
pregnancy, number of children, and family history of breast cancer). Appendix A
includes the variables for all the individuals, as well as the genotypes.
In the whole study group, the adjusted odds ratios for the risk genotypes were as
follows; 0.89 (95% CI, 0.66-1.18) for the presence of at least one mutant allele, 0.95
(95%, CI 0.46-1.12) for the G/A genotype, and 0.72 (95% CI, 0.46-1.12) for the A/A
genotype.
The adjusted odds ratios in the Turkish population for the risk genotypes are 0.82
(95% CI, 0.51-1.33), 0.77 (95% CI, 0.46-1.28), and 1.07 (95% CI, 0.48-2.39) for the
presence of at least one mutant allele, G/A genotype and A/A genotype, respectively.
For the given risk genotypes, the adjusted odds ration in the Greek population
were as follows; 0.74 (95%, CI, 0.42-1.31) for the presence of at least one mutant allele,

77
0.78 (95% CI, 0.42-1.46) for the G/A genotype, and 0.67 (95% CI, 0.32-1.42) for the
A/A genotype.
3.3.4. Results of power calculation for our study
We investigated the statistical power of our study by performing power
calculation. We calculated the power of our study using EpiCacl v1.02 developed by
Joe Gilman & Mark Myatt 1998, Brixton Books.
We calculated that, given the sample size and the allele frequencies of the study
population, we had 90% of power to detect an odds ratio as low as O.R.=1.8 on a
significance level of α = 0.05. And to the best of our knowledge on the powers of
calculations a power of 90% is reliable (actually, a study having a power higher than
80% is accepted as a statistically strong study).

78
3.3.5. Further possible stratification of the Turkish group data
3.3.5.1. Stratification according to Body-Mass-Index
Considering the possible risk attributable by the high BMI, odds ratio for the
high BMI individuals and low BMI individuals was calculated. The results are
summarized in Table 3.5.
BMI data was available for 397 of the 519 individuals (192 patients and 195
controls). 89 of 192 patients had low-BMI, and 103 of them had high-BMI. 103 of 195
controls had low-BMI, and 92 of them had high-BMI.
Table 3.5 summarizes the odds ratio values in low and high BMI groups.
Although the odds ratios are slightly higher in high-BMI group, these odds ratios cannot
be regarded as statistically significant results.

79
Table 3.5. Odds ratios in low and high BMI of Turkish group.
Low BMI ( < 27.10 ) High BMI ( ≥ 27.10 )
Frequency in; Frequency in;
Cases (n=89)
Control (n=103)
Odds Ratio (95% CI)
Odds Ratioa (95% CI) Case
(n=103) Control (n=92)
Odds Ratio (95% CI)
Odds Ratioa (95% CI)
G/G 50.56% 46.60% 1.00 1.00 51.46% 51.09% 1.00 1.00
G/A 39.33% 42.72% 0.85 (0.50-1.55) 0.75 (0.36-1.56) 34.95% 39.13% 0.89 (0.48-1.64) 0.76 (0.37-1.55)
A/A 10.11% 10.68% 0.86 (0.31-2.36) 0.72 (0.20-2.57) 13.59% 9.78% 1.44 (0.55-3.78) 1.30 (0.45-3.73)
Gen
otyp
es
G/A or A/A 49.44% 53.40% 0.85 (0.48-1.51) 0.74 (0.37-1.50) 48.54% 48.91% 1.01 (0.57-1.79) 0.87 (0.45-1.68)
Odds ratios were calculated using “binary logistic regression”.
a Adjusted odds ratio were calculated by adjusting the data with age, menopausal status, smoking status, age at menarche, age
of 1st pregnancy, number of children, family history of breast cancer.

80
4. Discussion
The past decade has seen great strides in our understanding of the genetic basis
of cancer (Hanahan et al., 2000). Although the same conclusion is valid for the genetics
of breast cancer, it still remains as an important cause of death in women (Wooster et al.,
2003). The incidence rate is 111 and the mortality rate is 24 cases per 100,000 woman-
years in the United States (U.S.) (Baselga et al., 2002). In Turkey, breast cancer is
among the leading causes of death among women (Özsari et al., 1997). Therefore, the
improvements in the molecular based new therapies are of utmost importance. The key
to the improvement of such approaches lies in the identification of genes and pathways
involved in breast tumorigenesis (Polyak, 2001).
In the U.S., 10-20% of patients with breast cancer have a first- or second-degree
relative with the disease. Two major genes associated with susceptibility to breast
cancer –breast cancer susceptibility gene 1 (BRCA1) and breast cancer susceptibility
gene 2 (BRCA2)– have been identified. Population-based epidemiological studies have
shown that only 15-20% of the patients with familial clustering have alterations in the
two major breast cancer susceptibility genes, BRCA1 and BRCA2. Mutations in either of
these genes confer 60-85% lifetime risk of breast cancer. But their incidence is less than
5% in all cancer cases, and susceptibility alleles in other genes, such as TP53, PTEN,
and ATM, are even less common causes of breast cancer (Wooster et al., 2003). The
recent discovery of the common 1100delC mutation in the cell-cycle-checkpoint kinase
gene (CHEK2) validates the prediction that DNA-sequence variants confer a small but
appreciable enhanced risk of cancer. Although the penetrance is low, the genetic
analysis on other susceptibility genes needs further research. Therefore, we sought to
investigate RNASEL as a candidate for the development of breast cancer.
RNASEL encodes for the ubiquitously expressed ribonuclease L (RNase L).
RNase L is an endoribonuclease that is activated by 2’-5’ adenylated oligonucleotides
(2-5As). The 2-5As are produced upon interferon stimulation (Player et al., 1998), and
the activation of RNase L leads to RNA degradation. Consistent with its activity,

81
RNASEL has been shown to be mediating the pro-apoptotic and pro-inflammatory
responses of interferon.
IFN treatment of cells induces a family of OAS genes through the JAK-STAT
signal transduction pathway. To date, the only well established biochemical function of
2-5A is activation of RNase L (Silverman, 2003). The significance of the dsRNA
requirement for 2-5A synthetase activity is a common intermediate or byproduct of viral
infections. Thus, the 2-5A synthetases may be regarded as receptors/sensors for the
presence of viral dsRNA that allow the cell to respond by initiating a host-defense
mechanism resulting in activation of RNase L (Silverman, 2003). These evidences
underline the antiviral function of RNase L in the immune system.
RNase L is shown to be mediating the pro-apoptotic activities via the same
biochemical function. The activation and RNA degradation activity of RNase L creates
a cellular stress, which leads to the activation of programmed cell death (Castelli et al.,
1998). The involvement of RNA decay pathways in cancer development is not a new
idea. Several other candidate enzymes and genes have been investigated and some of
them received varying degrees of success in experimental investigations.
Furthermore, involvement of RNase L in sequence specific gene silencing
pathways was also suggested. Proposed mechanism involves 2-5A oligonucleotides
fused to antisense sequences. The sequence specificity is provided by the antisense
sequences, and 2-5A oligonucleotides activates the enzyme (Torrence et al., 1993).
The proapoptotic activity of the enzyme is another important phenomenon to
consider. The molecular machinery at the nexus of apoptosis and inflammation includes
caspase-1, an activator of IL-1 beta, and IL-18, as well as the double-stranded-RNA-
dependent protein kinase pathway and RNase L pathway, which are key regulators of
antiviral immunity (Restifo, 2000). Recent studies also increase the number of
candidate proteins. Along with the sequence homology with RNase L, down-regulation
in high-grade prostate cancers, and unaltered level of expression in low grade prostate
cancers, many new proteins are suggested as potential prognostic markers for the
prostate cancer (i.e. SAPC) (Yu et al., 2001).

82
Identification of germline mutations in RNASEL segregating in hereditary
prostate cancer families that show linkage to the HPC1 (hereditary prostate cancer 1)
region at 1q24-25, was the first in vivo evidence for the impact of this gene in the
development of prostate cancer. Furthermore, loss of heterozygosity (LOH) with
markers flanking the RNASEL locus was observed in tumor tissues obtained from
prostate cancer patients (Smith et al., 1996, and Carpten et al., 2002).
Consequently, several variants of RNASEL were identified and the association of
these variants with the risk of prostate cancer was also investigated. Most notably,
Arg462Gln variant was reported to be implicated in up to 13% of the prostate cancer
cases (Casey et al., 2002).
RNASEL was initially proposed as a candidate tumor suppressor on the basis of
its involvement in the antiproliferative activity of IFs (Lengyel, 1993). We believe, the
chromosomal location of this gene, which is 1q25 may also give important clues about
the involvement of RNASEL in cancer development. For example, HAS 1q25 is a region
found to be implicated in the genesis of breast cancer (Chen et al., 1989). Considering
the chromosomal localization and function of RNASEL, and the pleiotropic effects of
cancer associated mutations, as exemplified by CHEK2 in both breast and prostate
cancers (Dang et al., 2003), we sought to investigate the hypothesis that Arg462Gln
variant of this gene is associated with breast cancer risk.
In our study, 835 individuals (453 breast cancer patients and 382 controls) from
two countries (Turkey and Greece) were subjected to genotype analysis. The genotype
analysis of the individuals was performed using Amplification Refractory Mutation
System (ARMS). The genotype results were subjected to statistical analysis in order to
evaluate the association between RNASEL Arg462Gln variant and incidence of breast
cancer. Odds ratio calculation was performed using binary logistic regression procedure
of SPSS 9.0.0 software program. Finally, statistical power of our study was calculated
using EpiCalc 2000 v1.02.
The combined Greek and Turkish population allele frequencies of the A allele is
0.334 and 0.359 for cases and controls, respectively. Although the A allele frequencies
were slightly different in two populations (Greek cases: 0.385, and controls: 0.442;

83
Turkish cases: 0.309 and controls: 0.298), the genotype distributions in the control
groups were in Hardy-Weinberg equilibrium in both populations. The frequencies of the
G/G, G/A and A/A genotypes in the whole study group were, 45.48%, 42.16% and
12.36% in the cases and 43.98%, 40.05% and 15.97% in the controls, respectively. The
genotype frequencies in Greek population were, G/G: 39.47% and 35.98%, G/A:
44.08% and 39.63%, A/A: 16.45% and 24.39% in cases and controls, respectively.
These values were G/G: 48.50% and 50.00%, G/A: 41.20% and 40.37%, and A/A:
10.30% and 9.63% in cases and controls of the Turkish population.
Based on these results, the odds ratio calculations showed no significant
association between the RNASEL Arg462Gln variant and breast cancer risk (Table 3.3).
Calculated odds ratios were generally below the threshold value of “1”, indicating the
lack of association between the Arg462Gln variant and breast cancer risk. Although,
several odds ratio values were higher than the threshold value of “1” (i.e.
postmenopausal individuals in the whole group or Turkish population), they were not
regarded as statistically significant since their confidence intervals included “1”.
Adjusting the odds ratio for age and menopausal status in the Greek population;
age, menopausal status, smoking status, body-mass-index, age at menarche, age of first
pregnancy, number of children, family history of breast cancer in the Turkish
population; or age and menopausal status in both populations combined did not change
the results (Table 3.2).
The association of the RNASEL Arg462Gln variant with breast cancer risk was
also investigated in the Turkish patients and controls stratified according to body mass
index (BMI). The threshold BMI value was selected as the mean of the controls.
Individuals with BMI values higher than the threshold were grouped as “high-risk” and
individuals with lower values were grouped as “low-risk”. The crude odds ratio was
0.85 (95% CI, 0.48-1.51) for the low-risk group and 1.01 (95% CI, 0.57-1.79) for the
high-risk group. Neither value is statistically significant. Adjusted odds ratios
according to age, menopausal status, smoking status, age at menarche, age of 1st
pregnancy, number of children, family history of breast cancer, were not statistically
significant (Table 3.5).

84
Our cohort was also analyzed for established risk factors (Table 3.1). Since the
data for most of the variables are not available for the Greek population, most of the
calculations were performed with the Turkish population data;
• Age of menarche was not found to be significantly associated with the risk of
developing breast cancer (1.0104, 95% CI 0.9028 – 1.1308).
• High body mass index was also not found to be associated with breast cancer
(1.0134, 95% CI 0.9733 – 1.0551).
• Age of first pregnancy was found to be truly associated with the risk of developing
breast cancer (1.0670, 95% CI 1.0243 – 1.1115). This is also consistent with the
previous studies.
Given the sample size and allele frequencies, our study had a power of 90% to
confirm an odds ratio as low as OR =1.6 on a significance level of α =0.05. Such a
power value indicates the statistical strength of the study.
To the best of or knowledge this is the first genetic study that investigates the
association between RNASEL Arg462Gln variant with breast cancer. Inclusion of two
different Eastern Mediterranean populations and a fairly large number of cases and
controls makes our study relatively strong.

85
5. Conclusions and future perspectives
To the best of our knowledge, we performed the first study on the possible
association between the RNASEL G1385A variant and the risk of breast cancer
following the identification of this variant as the candidate susceptibility allele in
prostate cancer.
Our study has provided the following data;
• It appears there is no significant association between RNASEL G1385A variant
and breast cancer risk in the Turkish and Greek populations.
• Adjusting the odds ratio with the available variants did not change the results
(Turkish data could be adjusted for the age, menopausal status, smoking status,
BMI, age at menarche, age of 1st pregnancy, number of children, family history of
breast cancer, and the lack of significance remained unchanged. Greek data could
be adjusted only for age and menopausal status, and similarly the lack of
significance remained unchanged. The whole group of both populations could be
adjusted for age and menopausal status).
• The odds ratio analysis in low- and high-BMI groups did not reveal any
significant results in the Turkish population.
• Power calculation showed that our study had 90% of power to confirm an odds
ratio as low as OR =1.6 on a significance level of α = 0.05.
As next step, polymorphisms in other genes, which may have regulatory roles on
the action of RNASEL, can be studied. The possible interaction of these genes with our
variant can explain the further impact of our variant on breast cancer.

86
In conclusion, our study suggests no significant association between RNASEL
G1385A variant and breast cancer risk in the Greek and Turkish populations. These
results may need to be further corroborated by other investigations and in different
populations since this is the first study reporting on the association of RNASEL G1385A
variant and incidence of breast cancer.

87
6. References
Abate-Shen C, Shen MM (2002) Mouse models for prostate carcinogenesis. Trends
Genet 18:S1-5.
Atlanta G (2003) Cancer facts and figures. American Cancer Society.
Balmain A, Gray J, Ponder B (2003) The genetics and genomics of cancer. Nat Genet
33:238-44.
Barber GN (2001) Host defense, viruses and apoptosis. Cell Death Differ 8:113-26.
Baselga J, Norton L (2002) Focus on breast cancer. Cancer Cell 1:319-22.
Benz CC (1998) Transcription factors and breast cancer. Endoc-Rel Cancer 5:271-82.
Bergstorm A, Pisani P, Tenet V, Wolk A, Adami HO (2001) Overweight as an avoidable
cause of cancer in Europe. Int J Cancer 91:421-30.
Bertwistle S, Ashworth A (1998) Functions of the BRCA1 and BRCA2 genes. Curr Op in
Genet & Dev 8:14-20.
Bickell NA (2002) Race, ethinicity and disparities in breast cancer: victories and
chalanges. Women’s Health Issues 12:238-51.
Bienz M, Clevers H (2000) Linking colorectal cancer to Wnt signaling. Cell 103:311-20.

88
Boyd M, Harris F, McFarlane, Davidson HR, Black DM (1995) A human BRCA1 gene
knockout. Nature 375: 541-2.
Brown MA, Jones KA, Nicolai H, Bonjardim M, Black D, McFarlane, DeJong P, Quirk
JP, Lehrach H, Solomon E (1995) Physical mapping, cloning, and identification of genes
within a 500-kb region containing BRCA1. Proc Natl Acad Sci 92:4362-6.
Cahill DP, Kinzler KW, Vogelstein B, Lengauer C (1999) Genetic instability and
Darwinian selection in tumors. Science 9:M57-M60.
Cardon LR, Bell JI (2001) Association study designs for complex diseases. Nat Rev
Genet. 2:91-9.
Carpten J, Nupponen N, Isaacs S, Sood R, Robbins C, Xu J, Faruque M, Moses T,
Ewing C, Gillanders E, Hu P, Bujnovszky P, Makalowska I, Baffoe-Bonnie A, Faith D,
Smith J, Stephan D, Willey K, Brownstein M, Gildea D, Kelly B, Jenkins R, Hostetter
G, Matikainen M, Schleutker J, Klinger K, Connors T, Xiang Y, Wang Z, De Marzo A,
Papadopoulos N, Kallioniemi O-P, Burk R, Meyers D, Grönberg H, Meltzer P,
Silverman R, Bailey-Wilson J, Walsh P, Isaacs W, Trent J (2002) Germline mutations in
the ribonuclease L gene families showing linkage with HPC1. Nat Genet 30:181-4.
Carpten JD, Makalowska I, Robbins CM, Scott N, Sood R, Connors TD, Bonner TI,
Smith JR, Faruque MU, Stephan DA, Pinkett H, Morgenbesser SD, Su K, Graham C,
Gregory SG, Williams H, McDonals , Baxevanis A, Klingler KW, Landes GM, Trent
JM (2000) A 6-Mb high-resolution physical and transcription maps encompassing the
hereditary prostate cancer 1 (HPC1) region. Genomics 64:1-14.
Casey G, Neville PJ, Plummer SJ, Xiang Y, Krumroy LM, Klein EA, Catalona WJ,
Nupponen N, Carpten JD, Trent JM, Silverman RH, Witte JS (2002) RNASEL
Arg462Gln variant is implicated in up to 13 % of prostate cancer cases. Nature Genetics
32:581-3.

89
Castelli J, Wood KA, Youle RJ (1998) The 2-5A system in viral infection and apoptosis.
Biomed Pharmacother 52:386-90.
Castelli JC, Hassel BA, Maran A, Paranjape J, Hewitt JA, Li X-L, Hsu Y-T, Silverman
RH, Youle RJ (1998) The role of 2’-5’ oligoadenylate-activated ribonuclease L in
apoptosis. Cell Death Differ 5:313-20.
Chakravarti A (2001) To a future of genetic medicine. Nature 409:822-3.
Chen LC, Dollbaum C, Smith HS (1989) Loss of heterozygosity on chromosome 1q in
human breast cancer. Proc. Natl. Acad. Sci. U S A,. 86: 7204-7207.
Chen Y, Chen CF, Riley DJ, Allred DC, Chen PL, Hoff DV, Osborne CK, Lee WH
(1995) Aberrant subcellular localization of BRCA1 in breast cancer. Science 270:789-90.
Daniel WW (1999) Biostatistics: a foundation for analysis in the health sciences. Wiley
New York.
De Benedetti A, Baglioni C (1984) Inhibition of mRNA binding to ribosomes by
localized activation of dsRNA-dependent protein kinase. Nature 311:79-81.
Demir E (2002) Polymorphisms of glutathione s-transferase genes (GSTM1, GSTP1, and
GSTT1) and breast cancer susceptibility in the Turkish population. M.S. Thesis, Bilkent
University.
Dong B, Niwa M, Walter P, Silverman RH (2001) Basis for regulated RNA cleavage by
functional analysis of RNase L and Ire1p. RNA 7:361-73.
Dong B, Silverman BH (1999) Alternative function of a protein kinase homology
domain in 2', 5'-oligoadenylate dependent RNase L. Nucleic Acid Res 27:439-45.

90
Dong B, Silverman RH (1995) 2-5A dependent RNase molecules dimerize during
activation by 2-5A. J Biol Chem 270:4133-7.
Dong B, Silverman RH (1997) A bipartite model of 2-5A-dependent RNase L. J Biol
Chem 272;35:22236-22242.
Dong, X., Wang, L., Taniguchi, K., Wang, X., Cunningham, J.M., McDonnel, S.K.,
Qian, C., Marks, A.F., Slager, S.L., Peterson, B.J., Smith, D.I., Cheville, J.C., Blute,
M.L., Jacobsen, S.J., Schaid, D.J., Tindall, D.J., Thibodeau, S.N., Liu, W. Mutations in
CHEK2 associated with prostate cancer risk. Am. J. Hum. Genet. 72: 270-280, 2003.
Duensing S, Münger K (2001) Centrosome abnormalities, genomic instability and
carcinogenic progression. Biochimica et Biophysica Acta 1471:M81-M88.
Eeles RA, Durocher F, Edwards S, Teare D, Badzioch M, Hamoudi R, Gill S, Biggs P,
Dearnaley D, Ardern-Jones A, Dowe A, Shearer R, McLennan DL, Norman RL,
Ghadirian P, Aprikian A, Ford D, Amos C, King TM, The Cancer Research
Campaign/British Prostate Group U.K. Familial Prostate Cancer Study Collaborators,
Labrie F, Simard J, Narod SA, Easton D, Foulkes WD (1998) Linkage analysis of
chromosome 1q markers in 136 prostate cancer families. Am J Hum Genet 62:653-8.
Evan GI, Vousden KH (2001) Proliferation, cell cycle and apoptosis. Nature. 411:342-8.
Futreal PA, Kasprzyk A, Birney E, Mullinkin JC, Wooster R, Stratton MR (2001)
Cancer and Genomics. Nature 409:850-2.
Gitlin L, Karelsky S, Andino R (2002) Short interfering RNA confers intracellular
antiviral immunity in human cells. Nature 418:430-4.
Goldgar DE (2002) Population aspects of cancer genetics. Biochimie 84:19-25.

91
Goode EL, Stanford JL, Peters MA, Janer M, Gibbs M, Kolb S, Badziock MD, Hood L,
Ostrander EA, Jarvik GP (2001) Clinical characteristics of prostate cancer in an analysis
of linkage to four putative susceptibility loci. Clin Cancer Res 7:2739-49.
Grossmann ME, Huang H, Tindall DJ (2001) Androgen receptor signaling in androgen-
refractory prostate cancer. J Intl Canc Inst 93:1687-97.
Grover PL, Martin FL (2002) The initiation of breast and prostate cancer.
Carcinogenesis 23:1095-102.
Grönberg H (2003) Prostate cancer epidemiology. Lancet 361:859-64.
Guo M, Hay BA (1999) Cell proliferation and apoptosis. Curr Opin Cell Biol 11:745-52.
Hall JM, Lee MK, Newman B, Morrow JE, Anderson LA, Huey B, King MC (1990)
Linkage of early-onset breast cancer to chromosome 17q21. Science 250:1684-9.
Hanahan D, Weinberg RA (2000) The hallmarks of cancer. Cell 100:57-70.
Hassel BA, Zhou A, Sotomayor C, Maran A, Silverman RH (1993) A dominant negative
mutant of 2-5A dependent RNase suppresses antiproliferative and antiviral effects of
interferon. EMBO J 12:3297-304.
Herbert B-S, Wright WE, Shay JW (2001) Telomerase and breast cancer. Breast Cancer
Res 3:146-149.
Hoeijmakers JHJ (2001) Genome maintenance mechanisms for preventing cancer.
Nature 411:366-74.
Hussain SP, Hofseth LJ, Harris CC (2001) Tumor suppressor genes: at the crossroads of
molecular carcinogenesis, molecular epidemiology and human risk assessment. Lung
Cancer 34:S7-15.

92
Ingvarsson S (2001) FHIT alterations in breast cancer. Sem in Cancer Biol 11:361-6.
Iordanov MS, PAranjape JM, Zhou A, Wong J, Williams MR, Meurs EF, Silverman
RH, Magun BE (2000) Activation of p38 mitogen-activated protein kinase and c-Jun
NH(2)-terminal kinase by double-stranded RNA and encephalomyocarditis virus:
involvement of RNase L, protein kinase R, and alternative pathways. Mol Cell Biol
2:617-27.
Josefson D (2001) Obesity and inactivity fuel global cancer epidemic. Br. Med. J.
322:945.
Khabar KSA, Siddiqui YM, al-Zoghaibi F, al-Haj L, Dhalla M, Zhou A, Dong B,
Whitmore M, Paranjape J, Al-Ahdal MN, Al-Mohanna F, Williams BRG, Silverman RH
(2003) RNase L mediates transient control of the interferon response through
modulation of the double-stranded RNA dependent protein kinase PKR. J Biol Chem
30:20124-32.
Kinzler KW, Vogelstein B (1997) Cancer-susceptibility genes. Gatekeepers and
Caretakers. Nature 386:761-3.
Kleer CG, van Golen KL, Merajver SD (2000) Molecular biology of breast cancer
metastasis: Inflammatory breast cancer: clinical syndrome and molecular determinants.
Breast Cancer Res 2:423-9.
Knudson AG (2002) Cancer Genetics. Am J Med Genet 111:96-102.
Kondo S, Kondo Y, Li G, Silverman RH, Cowell JK (1998) Targeted therapy of human
malignant glioma in a mouse model by 2-5A antisense directed against telomerase RNA.
Oncogene 16:3323-30.

93
Kondo Y, Koga S, Komata T, Kondo S (2000) Treatment of prostate cancer in vitro and
in vivo with 2-5A-anti-telomerase RNA component. Oncogene 19:2205-11.
Kumar S, Mitnik C, Valente G, Floyd-Smith G (2000) Expansion and molecular
evolution of the interferon-induced 2’-5’ oligoadenylate synthetase family. Mol Biol
Evol 17:738-50.
Lengauer C, Kinzler KW, Vogelstein B (1998) Genetic instabilities in human cancers.
Nature 396:643-9.
Lengyel P (1993) Tumor-suppressor genes: news about the interferon connection. Proc
Natl Acad Sci U.S.A. 90:5893-5.
Levitt NC, Hickson ID (2002) Caretaker tumour suppressor genes that defend genome
integrity. Trends in Mol Med 8:179-186.
Lewin B (1997) Genes VI. Oxford University Press and Cell Press.
Lewis M (2000). Homeobox genes in mammary gland development and neoplasia.
Breast Cancer Res 2:158-64.
Li FP, Fraumeni JF, Mulvihill JJ, Blattner WA, Dreyfus MG, Tucker MA, Miller RW
(1988) A cancer family syndrome in twenty-four kindreds. Cancer Res 48:5358-62.
Li XL, Blackford JA, Hassel BA (1998) RNase L mediates the antiviral effect of
interferon through a selective reduction in viral RNA during encephalomyocarditis virus
infection. J Virol 72:2752-9.
Liotta L, Petricoin E (2000) Molecular profiling of human cancer. Nat Rev Genet 1:48-
56.

94
Liu BQ (1998) Emerging tobacco hazards in China: 1. Retrospective proportional
mortality study of one million deaths. Br. Med. J. 317:1411-22.
Lynch HT, Conway TA, Lynch JF (1994) Phenotypic variation in hereditary breast
cancer. Cancer control implications. Arch Surg. 129:806-13.
Macleod K (2000) Tumor suppressor genes. Curr Opin Genet Dev 10:81-93.
Manguoglu AE, Lüleci G, Özçelik T, Çolak T, Schayek H, Akaydin M, Friedman E
(2003) Germline mutations in the BRCA1 and BRCA2 genes in Turkish Breast/Ovarian
cancer patients. Hum Mutat 21:444-5.
Manning G, Whyte DB, Martinez R, Hunter T, Sudarsanam S (2002) The protein kinase
complement of the human genome. Science 298:1912-34.
Meijers-Heijboer H, Wijnen J, Vasen H, Wasielewski M, Wagner A, Hollestelle A,
Elstrodt F, van der Bos R, de Snoo A, Fat GTA, Brekelmans C, Jagmohan S, Franken P,
Verkujlen P, van de Ouweland A, Chapman P, Tops C, Möslein G, Burn J, Lynch H,
Klijn J, Fodde R, Schutte M (2003) the CHEK2 1100delC mutation identifies families
with a hereditary breast and colorectal cancer phenotype. Am J Hum Genet 72:1308-14.
Melo J, Toczyski D (2002) A unified view of the DNA-damage checkpoint. Curr Op in
Cell Biol 14:237-245.
Michels KB (2002) The contribution of the environment (especially diet) to breast
cancer risk. Breast Cancer Res 4:58-61.
Miesfeld RL (1999) Applied Molecular Genetics. John Wiley & Sons Publication.
95
Miki Y, Swensen J, Shattuk-Eidens D, Shattuck-Eidens S, Futreal PA, Harshman K,
Tavtigian S, Liu Q, Cochran C, Bennet LM, Ding W, Bell R, Rosenthal J, Hussey C,
Tran T, McClure M, Frye C, Hattier T, Phelps R, Haugen-Strano A, Katcher H, Yakumo
K, Gholami Z, Shaffer D, Stone S, Bayer S, Wray C, Bogden R, Dayananth P, Ward J,
Tonin P, Narod S, Bristow PK, Norris FH, Helvering L, Morrison P, Rpsteck P, Lai M,
Barret C, Lewis C, Neuhausen S, Cannon-Albright L, Goldgar D, Wiseman R, Kamb A,
Skolnick MH (1994): A strong candidate for the breast and ovarian cancer susceptibility
gene BRCA1. Science 266:66-71.
Mikulski, SM, Costanzi, JJ, Vogelzang NJ, McCachren S, Taub RN, Chun H, Mitteman
A, Panella T, Puccio C, Fine R, Shogen K (2002) Phase II trial of a single weekly
intravenous dose of ranpirnase in patients with unresectable malignant mesothelioma. J
Clin Oncol 20:274-81.
Offit K, Heather P, Kirchoff T, Prema K, Rapaport B, Gregersen P, Johnson S,
Yossepowitch O, Huang H, Satagopan J, Robson M, Scheuer L, Nafa K, Ellis N (2003)
Frequency of CHEK2*1100delC in New York breast cancer cases and controls. BMC
Med Genet 4:1.
Old RW, Primrose SB (1998) Principles of Gene Manipulation. 5th edition. Blackwell
Science Publishing.
Osin PP, Lakhani SR (1999) The pathology of familial breast cancer;
immunohistochemistry and molecular analysis. Breast Cancer Res 1:36-40.
Ostrander EA, Stanford JL (2000) Genetics of prostate cancer: too many loci, too few
genes. Am J Hum Genet 67:1367-75.
Ozdag H (2000) Analysis of BRCA1 and BRCA2 genes in Turkish breast cancer patients.
Ph.D. Thesis, Bilkent University.

96
Ozdag H, Tez M, Sayek I, Muslumanoglu M, Tarcan O, Icli F, Ozturk M, Ozcelik M
(2000) Germ line BRCA1 and BRCA2 gene mutations in Turkish breast cancer patients.
Eur J of Cancer 36:2076-82.
Özsari H, Atasever L (1997) Cancer Registry Report of Turkey 1993-1994. Turkish
Ministry of Health, Ankara.
Peto J (2001) Cancer epidemiology in the last century and the next decade. Nature
411:390-5.
Pharoah PD et al. (2002) Polygenic susceptibility to breast cancer and implications for
prevention. Nat Genet 31:33-36.
Picksley SM, Lane DP (1994) p53 and Rb: their cellular roles. Curr Op in Cell Biol.
6:853-8.
Player MR, Torrence PF (1998) The 2-5A system: modulation of viral and cellular
processes through acceleration of RNA degradation. Pharmacol Ther 78:55-113.
Polyak K (2001) On the birth of breast cancer. Biochimica et Biophysica Acta 1552:1-
13.
Ponder BAJ (2001) Cancer Genetics. Nature 411:336-41.
Prives C, Manley J (2001) Why is p53 acetylated? Cell 107:815-8.
Rennan MJ (1993) How many mutations are required for tumorigenesis? Implications
from human cancer data. Mol Carcinog 7:139-46.

97
Rennert H, Bercovich D, Hubert A, Abeliovich D, Rozovsky U, Bar-Shira A, Soloviov
S, Schreiber L, Matzkin H, Rennert G, Kadouri L, Peretz T, Yaron Y, Orr-Urtreger A
(2002) A novel mutation in the RNASEL gene, 471delAAAG, is associated with prostate
cancer in Ashkenazi Jews. Am J Hum Genet 71:981-4.
Restifo NP (2000) Bıilding better vaccines: how apoptotic cell death can induce
inflammation and activate innate and adaptive immunity. Curr Opin Immunol. 12:597-
603.
Rökman A, Ikonen T, Seppälä EH, Nupponen N, Autio V, Mononen N, Bailey-Wilson
J, Trent J, Carpten J, Matikainen MP, Koivisto PA, Tammela TLJ, Kallioniemi O-P,
Schleutker J (2002) Germline alterations of the RNASEL gene, a candidate HPC1 gene
at 1q25, in patients and families with prostate cancer. Am J Hum Genet 70:1299-304.
Sambrook J, Fristch EF, Maniatis T (1989) Molecular cloning: Molecular cloning. Cold
Spring Harbor Laboratories.
Schnell R, Staak O, Borchmann P, Schwartz C, Matthey B, Hansen H, Schindler J,
Ghetic V, Vitetta ES, Diehl V, Engert A (2002) A Phase I study with an anti-CD30 ricin
A-chain immunotoxin (Ki-4.dgA) in patients with refractory CD30+ Hodgkin's and non-
Hodgkin's lymphoma. Clin Cancer Res 8:1779-86.
Silverman RH (2003) Implications for RNase L in Prostate Cancer Biology.
Biochemistry. 2003 42:1805-12.
Silverman RH, Williams BR (1999) Translational control perks up. Science 298:1912-
34.
Simard J, Martine D, Penny S, Labrie F (2002) Perspective: Prostate cancer
susceptibility genes. Endocrinology 143:2029-40.

98
Smith JR, Freije D, Carpten JD, Gronberg H, Xu J, Isaacs SD, Brownstein MJ, Bova
GS, Guo H, Bujnovszky P, Nusskern DR, Damber JE, Berg A, Emanuelsson M,
Kallioniemi OP, Walker-Daniels J, Bailey-Wilson JE, Beaty TH, Meyers DA, Walsh
PC, Collins FS, Trent JM, Isaacs WM (1996) Major susceptibility locus for prostate
cancer on chromosome 1 suggested by a genome-wide search. Science 274:1371-4.
Squire J, Zhou A, Hassel BA, Nie H, Silverman RH (1994) Localization of the
interferon-induced, 2-5A-dependent RNase gene (RNS4) to human chromosome 1q25.
Genomics 19:174-5.
Stark GR, Kerr IM, Williams BR, Silverman RH, Schreiber RD (1998) How cells
respond to interferons. Annu Rev Biochem 67:227-64.
Stratchan T, Andrew PR (1999) Human Molecular Genetics. 2nd Edition. John Wiley &
Sons Publishing.
Stratton MR (1996) Recent advances in understanding of genetic susceptibility to breast
cancer. Hum Mol Genet 5:1515-9.
Suarez BK, Gerhard DS, Lin J, Haberer B, Nguyen L, Kesterson NK, Catalona WJ
(2001) Polymorphisms in the prostate cancer susceptibility gene HPC2/ELAC2 in
multiplex families and healthy controls. Cancer Res 61:4982-4.
Sullivan, A., Yuille, M., Repellin, C., Reddy, A., Reelfs, O., Bell, A., Dunne, B.,
Gusterson, B.A., Osin, P., Farrell, P.J., Yulug, I., Evans, A., Ozcelik, T., Gasco, M.,
Crook, T. (2002) Concomitant inactivation of p53 and Chk2 in breast cancer. Oncogene
21: 1316-24.
Suzuki S, Moore DH et al. (2000) An approach to analysis of large scale correlations
between genome changes and clinical endpoints in ovarian cancer. Cancer Res 60, 5382-
5.

99
Tavtigian SV, Simard J, Rommens J, et al. (1996) The complete BRCA2 gene and
mutations in chromosome 13q-linked kindreds. Nat Genet 12:676-89.
Tavtigian SV, Simard J, Teng DH, Abtin V, Baumgard M, Beck A, Camp NJ, Carillo
AR, Chen Y, Dayananth P, Desrochers M, Dumont M, Farnham JM, Frank D, Frye C,
Ghaffari S, Gupte JS, Hu R, Iliev D, Janecki T, Kort EN, Laity KV, Leatti A, Leblanc G,
McArthur-Morrison J, Pederson A, Penn B, Peterson KT, Reid JE, Richards S,
Schroeder M, Smith R, Synder SC, Swedlund B, Swensen J, Thomas A, Tranchant M,
Woodland AM, Labrie F, Skolnick MH, Neuhausen S, Rommens J, Cannon-Albright
LA (2001) A candidate prostate cancer susceptibility gene at chromosome 17p. Nat
Genet 27:172-80.
Thompson MW, McInnes RR, Willard HF (1991) Genetics in Medicine. W.B. Saunders
Company.
Tnani M, Bayard BA (1998) Lack of 2',5'-oligoadenylate-dependent RNase expression
in the human hepatoma cell line HepG2. Biochim Biophys Acta 1402:139-50.
Tonin PN (2000) Genes implicated in hereditary breast cancer syndromes. Sem in Surg
Oncol 18:281-6.
Torrence PF, Maitra RK, Lesiak K, Khamnei S, Zhou A, Silverman RH (1993)
Targeting RNA for degredation with a 2’-5’ oligoadenylate antisense chimera. Pro Natl
Acad Sci USA 90:1300-4.
Varley JM (2003) Germline TP53 mutations and Li-Fraumeni syndrome. Human
Mutation 21:313-20.

100
Venkitaraman AR (2002) Cancer susceptibility and the functions of BRCA1 and
BRCA2. Cell 108:171-82.
Vogelstein B, Kinzler KW (1998) The genetic basis of human cancer. McGraw-Hill;
Health professions division.
Wang L, McDonnel SK, Elkins DA, Slager SL, Christensen E, Marks AF, Cunningham
JM, Peterson BJ, Jacobsen SJ, Cerhan JR, Blute ML, Schaid DJ, Thibodeau SN (2002)
Analysis of the RNASEL gene in familial and sporadic prostate cancer. Am J Hum Genet
71:116-23.
Weng DE, Usman N (2001) Angiozyme: a novel angiogenesis inhibitor. Curr Oncol Rep
3:141-6.
Williams BRG (1999) PKR; a sentinel kinase for cellular stress. Oncogene 18:6112-20.
Wooster R, Neuhausen SL, Mangion J, et al. (1994) Localization of a breast cancer
susceptibility gene, BRCA2, to chromosome 13q12-13 by genetic linkage analysis.
Science 265:2088-90.
Wooster R, Bignell G, Lancaster J, et al. (1995) Identification of breast cancer
susceptibility gene BRCA2 [publishes erratum appears in Nature 1996;379:749]. Nature
378:789-92.
Wooster R, Weber, BL (2003) Breast and ovarian cancer. N Eng J Med 348:2339-2347.
Xu J and the International Consortium for Prostate Cancer Genetics (2000) Combined
analysis of hereditary prostate cancer linkage to 1q24-25: Results from 772 hereditary
prostate cancer families from the International Consortium for Prostate Cancer Genetics.
Am J Hum Genet 66:945-57.

101
Xu J, Zheng SL, Chang B, Smith JR, Carpten JD, Stne OC, Isaacs SD, Wiley KE,
Henning L, Ewing C, Bujnovszky P, Bleeker ER, Walsh PC, Trent J, Meyers DA, Isaacs
WB (2001) Linkage of prostate cancer susceptibility loci to chromosome 1. Hum Genet
108:335-45.
Yu YP, Lin F, Bisceglia, Krill D, Dhir R, Becich M, Luo J-H (2001) Identification of a
novel gene with increasing rate of suppression in high grade prostate cancers. Am J
Pathol 158:19-24.
Zeeb H, Razum O, Blettner M, Stegmaier C (2002) Transition in cancer patterns among
Turks residing in Germany. Eur. J. Cancer 38:705-11.
Zhou A, Hassel BA, Silverman RH (1993) Expression cloning of 2-5A-dependent
RNase: a uniquely regulated mediator of interferon action. Cell 72:753-65.
Zhou A, Paranjape J, Brown TL, Nie H, Naik S, Dong B, Chang A, Trapp B, Fairchld R,
Colmenares C, Silverman RH (1997) Interferon action and apoptosis are defective in
mice devoid of 2’,5’-oligoadenylate-dependent RNase L. EMBO J. 16:6355-63.

102
Appendix A. The Results.
C S ID ID Genotype Men. Stat. Age Smoking Weight Height BMI Age at
Men. 1st
Preg.# of
ChildrenFam. Hist.
1 1 001 MCK-001 GG 1 58 0 38 1,54 16,02 15 17 4 0 1 1 002 MCK-002 GA 1 58 0 84 1,51 36,84 15 17 6 0 1 1 003 MCK-003 GA 1 63 1 60 1,58 24,03 24 3 0 1 1 004 MCK-004 GG 1 52 0 95 1,64 35,32 17 6 0 1 1 005 MCK-005 GA 1 47 1 1 006 MCK-006 GG 1 49 1 1 007 MCK-007 GG 1 48 1 80 1,68 28,34 13 27 2 1 1 008 MCK-008 GA 1 47 1 1 009 MCK-009 GG 0 34 1 58 1,63 21,83 14 22 2 0 1 1 010 MCK-010 GG 0 44 0 68 1,67 24,38 12 20 3 0 1 1 011 MCK-011 GG 1 49 1 50 1,55 20,81 13 34 2 0 1 1 012 MCK-012 GG 0 41 0 65 1,55 27,06 13 21 1 0 1 1 013 MCK-013 GA 1 62 1 47 1,63 17,69 13 26 1 0 1 1 014 MCK-014 GA 0 38 1 76 1,7 26,30 13 3 0 1 1 015 MCK-015 GG 0 29 0 65 1,55 27,06 12 23 1 0 1 1 016 MCK-016 GG 0 50 0 66 1,67 23,67 12 29 2 0 1 1 017 MCK-017 GA 1 74 0 60 1,6 23,44 15 22 2 0 1 1 018 MCK-018 GG 1 58 0 65 1,55 27,06 14 20 4 0 1 1 019 MCK-019 GG 1 64 0 65 1,7 22,49 14 19 3 0 1 1 020 MCK-020 AA 1 61 0 72 1,52 31,16 15 21 5 0 1 1 021 MCK-021 GG 1 63 0 72 1,5 32,00 15 19 5 0 1 1 022 MCK-022 GG 1 60 0 85 1,65 31,22 14 20 6 0 1 1 023 MCK-023 GG 0 24 1 64 1,58 25,64 11 19 2 0 1 1 024 MCK-024 GG 1 47 0 70 1,5 31,11 15 21 2 0 1 1 025 MCK-025 GG 0 45 0 77 1,57 31,24 12 18 3 0 1 1 026 MCK-026 GG 0 43 0 62 1,53 26,49 14 20 4 0 1 1 027 MCK-027 GA 1 45 0 65 1,6 25,39 13 29 2 0 1 1 028 MCK-028 GA 1 65 0 13 16 8 0 1 1 029 MCK-029 GA 1 72 0 77 1,56 31,64 14 18 4 0 1 1 030 MCK-030 GG 1 55 0 82 1,62 31,25 15 21 2 0

103
C S ID ID Genotype Men. Stat. Age Smoking Weight Height BMI Age at
Men. 1st
Preg.# of
ChildrenFam. Hist.
1 1 031 MCK-031 AA 1 53 0 80 1,62 30,48 13 28 2 0 1 1 032 MCK-032 GA 1 65 0 70 1,55 29,14 16 19 5 0 1 1 033 MCK-033 GA 1 49 1 73 1,56 30,00 12 22 2 0 1 1 034 MCK-034 GA 0 50 0 80 1,55 33,30 21 3 0 1 1 035 MCK-035 GG 1 52 0 68 1,55 28,3 14 18 4 0 1 1 036 MCK-036 GG 0 42 0 72 1,6 28,12 17 21 2 0 1 1 037 MCK-037 GA 0 51 0 87 1,64 32,35 12 38 1 0 1 1 038 MCK-038 GG 1 58 0 75 1,63 28,23 14 19 4 0 1 1 039 MCK-039 AA 0 36 0 80 1,5 35,56 13 21 2 0 1 1 040 MCK-040 GA 1 45 0 91 1,63 34,25 13 26 2 0 1 1 041 MCK-041 GA 0 40 0 87 1,6 33,98 12 22 3 0 1 1 042 MCK-042 GA 1 48 1 47 1,5 20,89 14 33 2 0 1 1 043 MCK-043 GG 1 53 0 75 1,55 31,22 14 17 4 0 1 1 044 MCK-044 GG 1 68 0 70 1,65 25,71 14 20 6 0 1 1 045 MCK-045 GG 1 51 0 50 1,5 22,22 13 19 3 0 1 1 046 MCK-046 GA 1 69 0 70 1,58 28,04 12 18 2 0 1 1 047 MCK-047 GA 1 61 0 78 1,58 31,24 15 0 0 1 1 048 MCK-048 GA 1 66 0 62 1,58 24,84 14 20 3 0 1 1 049 MCK-049 AA 1 46 1 60 1,55 24,97 13 26 1 0 1 1 050 MCK-050 AA 0 42 1 95 1,57 38,54 15 20 2 0 1 1 051 MCK-051 GA 1 60 0 80 1,55 33,3 12 35 2 0 1 1 052 MCK-052 GA 1 54 0 57 1,56 23,42 13 22 6 0 1 1 053 MCK-053 GG 1 0 1 1 054 MCK-054 GA 1 48 1 67 1,57 27,18 12 19 2 0 1 1 055 MCK-055 GG 1 49 1 55 1,6 21,48 14 18 2 0 1 1 056 MCK-057 GG 1 55 0 75 1,6 29,3 13 23 5 0 1 1 057 MCK-058 GG 0 35 0 90 1,68 31,89 12 23 2 0 1 1 058 MCK-059 GA 1 42 1 60 1,58 24,03 12 27 2 0 1 1 059 MCK-060 GG 1 41 0 58 1,62 22,1 13 18 4 0 1 1 060 MCK-061 AA 1 50 1 84 1,65 30,85 11 27 1 0 1 1 061 MCK-062 GA 1 40 1 87 1,65 31,96 13 16 3 0 1 1 062 MCK-063 GA 0 48 0 75 1,6 29,3 13 0 0

104
C S ID ID Genotype Men. Stat. Age Smoking Weight Height BMI Age at
Men. 1st
Preg.# of
ChildrenFam. Hist.
1 1 063 MCK-064 AA 0 0 61 1,65 22,41 14 0 0 1 1 064 MCK-065 GG 0 48 0 68 1,54 28,67 14 17 8 0 1 1 065 MCK-066 AA 1 47 1 60 1,62 22,86 13 20 4 0 1 1 066 MCK-067 GG 1 56 0 70 1,55 29,14 14 16 4 0 1 1 067 MCK-068 GG 1 76 0 75 1,6 29,3 14 21 2 0 1 1 068 MCK-070 GA 0 35 1 63 1,66 22,86 11 0 0 1 1 069 MCK-071 GA 1 78 0 76 1,56 31,23 13 18 3 0 1 1 070 MCK-072 GG 1 43 0 72 1,62 27,43 12 23 2 0 1 1 071 MCK-073 GA 1 79 0 70 1,71 23,94 13 18 2 0 1 1 072 MCK-074 GG 1 70 0 63 1,59 24,92 13 17 4 0 1 1 073 MCK-075 GG 1 58 0 75 1,65 27,55 14 0 0 1 1 074 MCK-076 GA 0 33 1 67 1,62 25,53 13 21 2 0 1 1 075 MCK-077 GG 1 61 1 80 1,57 32,46 12 0 0 1 1 076 MCK-078 GG 1 56 0 78 1,67 27,97 12 21 5 0 1 1 077 MCK-079 GG 0 41 0 70 1,7 24,22 13 4 0 1 1 078 MCK-080 GG 1 48 1 65 1,6 25,39 12 0 0 1 1 079 MCK-081 GG 0 33 0 50 1,63 18,82 14 20 3 0 1 1 080 MCK-082 GA 1 51 0 66 1,56 27,12 14 0 0 1 1 081 MCK-083 AA 1 51 1 60 1,6 23,44 12 30 2 0 1 1 082 MCK-084 AA 1 80 0 11 20 3 0 1 1 083 MCK-085 GG 0 30 0 1,6 14 20 2 0 1 1 084 MCK-086 GA 1 56 0 1,6 14 17 4 0 1 1 085 MCK-087 GG 1 73 0 1,5 14 1 1 086 MCK-088 GG 1 50 0 1,7 14 1 1 087 MCK-089 AA 1 62 1 1,8 0 0 1 1 088 MCK-091 GA 1 68 0 1,6 13 0 1 1 089 MCK-092 GG 1 49 0 1,6 1 1 090 MCK-093 GG 1 51 0 1,7 14 18 3 0 1 1 091 MCK-094 AA 0 34 0 1,5 14 17 2 0 1 1 092 MCK-096 AA 1 51 0 1,6 14 29 1 0 1 1 093 MCK-097 GA 0 44 0 1,5 15 2 0 1 1 094 MCK-098 GA 1 58 0 1,7 13 17 2 0

105
C S ID ID Genotype Men. Stat. Age Smoking Weight Height BMI Age at
Men. 1st
Preg.# of
ChildrenFam. Hist.
1 1 095 MCK-099 GA 1 64 0 1,6 15 16 5 0 1 1 096 MCK-100 GG 0 34 0 60 1,57 24,34 13 26 2 0 1 1 097 MCK-101 GA 0 33 0 70 1,6 27,34 13 0 0 1 1 098 MCK-102 GG 0 20 0 59 1,65 21,67 14 0 0 1 1 099 MCK-103 GA 0 33 1 51 1,47 23,6 0 1 1 100 MCK-105 GG 0 49 1 73 1,65 26,81 13 0 1 1 101 MCK-106 GG 1 48 0 84 1,66 30,48 5 0 1 1 102 MCK-107 GA 1 50 0 85 1,6 33,2 13 18 8 0 1 1 103 MCK-108 GG 0 36 0 78 1,6 30,47 15 22 2 0 1 1 104 MCK-109 GG 1 79 0 80 1,5 35,56 13 0 0 1 1 105 MCK-110 GG 1 70 0 80 1,57 32,46 20 3 0 1 1 106 MCK-111 GG 1 43 0 78 1,6 30,47 12 18 2 0 1 1 107 MCK-112 AA 1 60 0 80 1,53 34,17 13 30 2 0 1 1 108 MCK-114 GG 1 43 0 60 1,57 24,34 13 19 2 0 1 1 109 MCK-115 GG 1 54 1 13 27 2 0 1 1 110 MCK-118 GA 0 37 0 66 1,63 24,84 13 25 2 0 1 1 111 MCK-119 GG 1 64 1 62 1,55 25,81 14 20 3 0 1 1 112 MCK-121 GA 0 38 1 61 1,55 25,39 13 18 2 0 1 1 113 MCK-122 GG 0 0 75 1,65 27,55 13 22 2 0 1 1 114 MCK-125 GA 0 33 1 48 1,65 17,63 23 1 0 1 1 115 MCK-126 GA 1 63 0 74 1,65 27,18 13 17 12 0 1 1 116 MCK-127 GG 1 43 0 63 1,47 29,15 0 0 1 1 117 MCK-128 GG 1 60 0 78 1,55 32,47 15 17 6 0 1 1 118 MCK-129 GA 1 77 0 62 1,48 28,31 14 0 0 1 1 119 MCK-130 AA 1 65 0 93 1,63 35 14 17 5 0 1 1 120 MCK-131 GG 0 30 0 70 1,6 27,34 13 18 2 0 1 1 121 MCK-132 AA 1 55 0 64 1,56 26,3 13 17 3 0 1 1 122 MCK-133 GA 1 62 0 87 1,52 37,66 12 16 3 0 1 1 123 MCK-135 GG 0 30 0 62 1,7 21,45 14 23 2 0 1 1 124 MCK-136 GG 0 44 0 76 14 24 2 0 1 1 125 MCK-138 GA 0 28 0 67 1,68 23,74 12 26 1 0 1 1 126 MCK-139 GA 1 74 1 50 1,58 20,03 20 21 5 0

106
C S ID ID Genotype Men. Stat. Age Smoking Weight Height BMI Age at
Men. 1st
Preg.# of
ChildrenFam. Hist.
1 1 127 MCK-140 GA 0 32 1 59 1,64 21,94 14 23 2 0 1 1 128 MCK-141 GG 1 74 0 74 1,57 30,02 12 0 0 1 1 129 MCK-142 GA 0 38 0 74 1,6 28,91 0 0 1 1 130 MCK-143 GG 0 45 0 57 1,65 20,94 13 19 2 0 1 1 131 MCK-144 AA 0 50 0 63 1,6 24,61 15 0 1 1 132 MCK-145 GG 1 64 1 1 133 MCK-148 GA 0 28 1 1 134 MCK-149 GG 0 33 1 1 135 MCK-150 GA 0 49 1 1 136 MCK-152 AA 0 38 1 1 137 MCK-155 GA 1 51 1 1 138 MCK-156 GG 1 70 1 1 139 MCK-159 GA 0 44 1 1 140 GB-001 AA 1 62 0 91 1,6 35,55 18 21 4 0 1 1 141 GB-003 GG 1 70 0 40 1,53 17,09 14 15 4 0 1 1 142 GB-004 GA 1 49 0 60 1,56 24,65 15 20 4 0 1 1 143 GB-006 GG 1 40 0 50 1,53 21,36 15 30 1 0 1 1 144 GB-007 GA 1 39 0 63 1,63 23,71 15 0 0 1 1 145 GB-008 GA 0 35 0 52 1,53 22,21 13 0 0 1 1 146 GB-010 GA 1 44 1 66 1,75 21,55 13 23 2 0 1 1 147 GB-011 GG 1 51 0 58 1,55 24,14 14 21 3 0 1 1 148 GB-012 GA 1 41 0 83 1,55 34,55 15 17 4 0 1 1 149 GB-013 GG 0 32 0 52 1,6 20,31 14 21 4 0 1 1 150 GB-016 GA 1 50 1 57 1,61 21,99 13 22 2 0 1 1 151 GB-017 GA 0 49 1 1 152 GB-018 GG 1 48 1 73 1,5 32,44 14 17 2 0 1 1 153 GB-019 GG 1 72 0 75 1,58 30,04 11 0 0 1 1 154 GB-020 GG 0 47 0 107 1,6 41,80 14 0 0 1 1 155 GB-021 GA 0 49 1 1 156 GB-022 GG 0 51 1 75 1,6 29,30 14 26 2 0 1 1 157 GB-023 GG 0 43 0 70 1,6 27,34 17 33 2 0 1 1 158 GB-024 GG 1 48 0 60 1,55 24,97 15 25 3 0

107
C S ID ID Genotype Men. Stat. Age Smoking Weight Height BMI Age at
Men. 1st
Preg.# of
ChildrenFam. Hist.
1 1 159 GB-026 GG 0 40 1 58 1,6 22,66 18 33 3 0 1 1 160 GB-027 GG 0 36 0 64 1,55 26,64 14 20 4 0 1 1 161 GB-028 GG 1 58 0 75 1,55 31,22 13 21 10 0 1 1 162 GB-029 GG 1 31 0 47 1,52 20,34 15 23 2 0 1 1 163 GB-030 GG 1 73 1 70 1,57 28,40 14 16 3 0 1 1 164 GB-032 AA 1 45 0 82 1,65 30,12 13 19 5 0 1 1 165 GB-033 GG 1 55 0 60 1,7 20,76 14 20 3 0 1 1 166 GB-034 AA 1 46 0 72 1,6 28,12 14 0 0 1 1 167 GB-036 GG 1 54 0 51 1,52 22,07 16 33 5 0 1 1 168 GB-037 GA 1 47 0 55 1,55 22,89 18 20 8 0 1 1 169 GB-038 GG 1 64 0 55 1,55 22,89 14 27 6 0 1 1 170 GB-039 AA 1 43 0 84 1,5 37,33 13 23 3 0 1 1 171 GB-040 GG 1 40 0 76 1,58 30,44 12 24 4 0 1 1 172 GB-041 GG 1 52 0 84 1,7 29,07 16 18 5 0 1 1 173 GB-042 GG 0 40 0 80 1,65 29,38 14 30 3 0 1 1 174 GB-043 AA 1 45 0 70 1,6 27,34 13 22 4 0 1 1 175 GB-044 GA 1 66 0 60 1,63 22,58 15 26 7 0 1 1 176 GB-045 GG 0 40 0 83 1,55 34,55 13 22 2 0 1 1 177 GB-046 GA 1 38 0 55 1,52 23,81 15 21 3 0 1 1 178 GB-047 GA 1 49 0 63 1,6 24,61 14 0 0 1 1 179 GB-048 GG 1 54 70 1,6 27,34 16 20 3 0 1 1 180 GB-049 GA 1 40 0 85 1,5 37,78 13 22 1 0 1 1 181 GB-050 GG 0 34 0 63 1,55 26,22 13 23 3 0 1 1 182 GB-051 GA 1 54 0 75 1,56 30,82 15 24 6 0 1 1 183 GB-052 GG 1 71 0 90 1,62 34,29 12 21 1 0 1 1 184 GB-053 GA 0 32 0 70 1,52 30,30 13 19 3 0 1 1 185 GB-054 GA 0 46 0 51 1,55 21,23 14 26 1 0 1 1 186 GB-055 GA 1 46 0 71 1,53 30,33 13 16 7 0 1 1 187 GB-056 GA 0 44 0 80 1,65 29,38 15 30 3 0 1 1 188 GB-057 AA 1 77 1 54 1,6 21,09 12 21 2 0 1 1 189 GB-058 GG 0 42 0 75 1,65 27,55 14 18 4 0 1 1 190 GB-059 GG 1 66 0 73 1,55 30,39 15 19 3 0

108
C S ID ID Genotype Men. Stat. Age Smoking Weight Height BMI Age at
Men. 1st
Preg.# of
ChildrenFam. Hist.
1 1 191 GB-060 AA 1 36 1 52 1,52 22,51 13 25 1 0 1 1 192 GB-062 GA 1 46 0 70 1,6 27,34 14 18 3 0 1 1 193 GB-063 GA 0 41 0 75 1,64 27,89 12 0 0 1 1 194 GB-064 GA 1 68 0 78 1,56 32,05 14 19 10 0 1 1 195 GB-065 GG 1 45 0 80 1,52 34,63 14 24 4 0 1 1 196 GB-066 GG 0 38 0 60 1,5 26,67 15 20 4 0 1 1 197 GB-067 GG 0 38 0 64 1,68 22,68 16 20 5 0 1 1 198 GB-068 GG 0 40 0 83 1,55 34,55 14 22 5 0 1 1 199 GB-069 GA 1 44 0 58 1,5 25,78 15 32 3 0 1 1 200 GB-070 GA 1 70 0 78 1,57 31,64 14 16 3 0 1 1 201 GB-071 GA 0 35 0 63 1,58 25,24 14 18 6 0 1 1 202 GB-072 GG 0 34 0 70 1,6 27,34 13 25 2 0 1 1 203 GB-073 GA 1 78 0 58 1,62 22,10 15 22 2 0 1 1 204 GB-074 GG 0 33 0 56 1,5 24,89 14 22 5 0 1 1 205 GB-075 GA 0 30 0 55 1,7 19,03 13 22 3 0 1 1 206 GB-076 GG 1 76 0 55 1,65 20,20 13 19 2 0 1 1 207 GB-077 GG 1 52 0 56 1,62 21,34 14 20 6 0 1 1 208 GB-080 GA 0 32 0 52 1,6 20,31 13 19 3 0 1 1 209 GB-081 GA 1 42 1 80 1,62 30,48 16 34 1 0 1 1 210 GB-082 GA 0 44 0 82 1,6 32,03 12 18 2 0 1 1 211 GB-083 GG 1 53 0 100 1,55 41,62 14 19 6 0 1 1 212 GB-084 GA 1 76 0 80 1,6 31,25 15 33 1 0 1 1 213 GB-088 GG 1 53 0 80 1,55 33,30 23 3 0 1 1 214 GB-089 AA 0 48 0 75 1,6 29,30 15 17 4 0 1 1 215 GB-090 GG 1 44 1 65 1,65 23,88 12 23 2 0 1 1 216 GB-091 GG 0 37 0 75 1,6 29,30 13 22 3 0 1 1 217 GB-092 GG 1 74 0 70 1,55 29,14 13 18 7 0 1 1 218 BC-001 GG 0 47 13 0 0 1 1 219 BC-002 GA 0 45 67 1.6 13 20 2 0 1 1 220 BC-003 GG 1 59 110 1.65 14.5 17 9 0 1 1 221 BC-004 GA 1 57 50 1.5 12 21 2 0 1 1 222 BC-005 GA 1 55 14 2 0
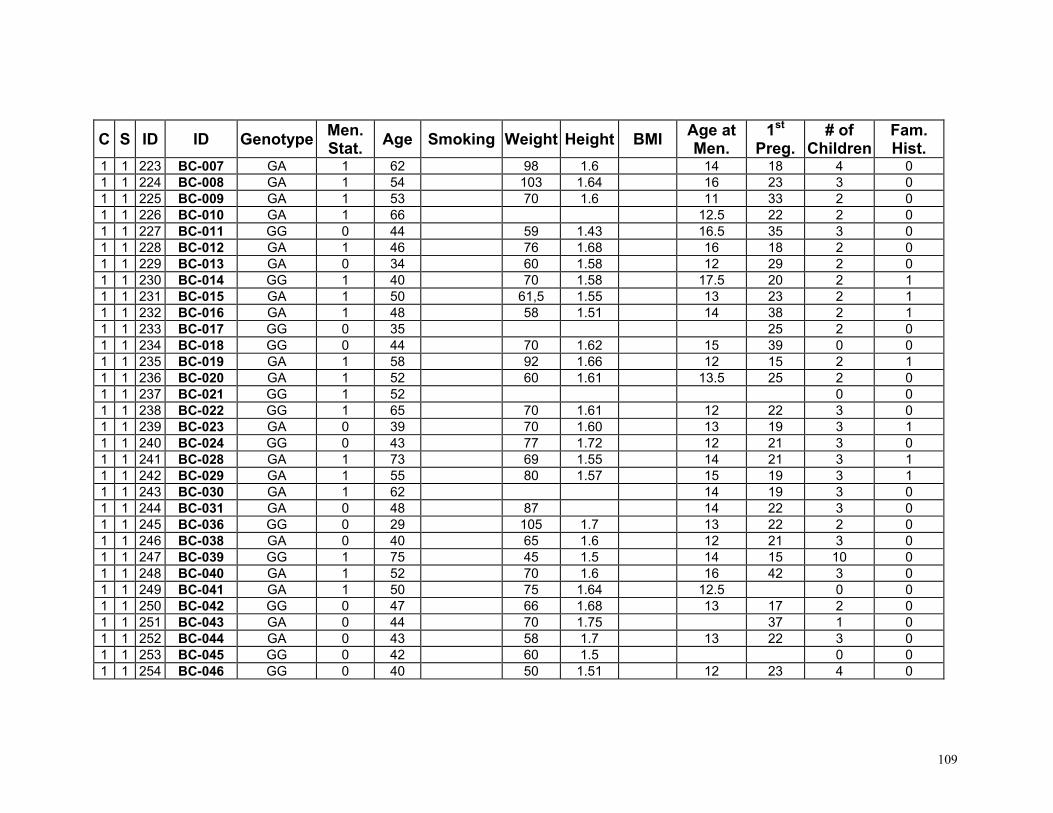
109
C S ID ID Genotype Men. Stat. Age Smoking Weight Height BMI Age at
Men. 1st
Preg.# of
ChildrenFam. Hist.
1 1 223 BC-007 GA 1 62 98 1.6 14 18 4 0 1 1 224 BC-008 GA 1 54 103 1.64 16 23 3 0 1 1 225 BC-009 GA 1 53 70 1.6 11 33 2 0 1 1 226 BC-010 GA 1 66 12.5 22 2 0 1 1 227 BC-011 GG 0 44 59 1.43 16.5 35 3 0 1 1 228 BC-012 GA 1 46 76 1.68 16 18 2 0 1 1 229 BC-013 GA 0 34 60 1.58 12 29 2 0 1 1 230 BC-014 GG 1 40 70 1.58 17.5 20 2 1 1 1 231 BC-015 GA 1 50 61,5 1.55 13 23 2 1 1 1 232 BC-016 GA 1 48 58 1.51 14 38 2 1 1 1 233 BC-017 GG 0 35 25 2 0 1 1 234 BC-018 GG 0 44 70 1.62 15 39 0 0 1 1 235 BC-019 GA 1 58 92 1.66 12 15 2 1 1 1 236 BC-020 GA 1 52 60 1.61 13.5 25 2 0 1 1 237 BC-021 GG 1 52 0 0 1 1 238 BC-022 GG 1 65 70 1.61 12 22 3 0 1 1 239 BC-023 GA 0 39 70 1.60 13 19 3 1 1 1 240 BC-024 GG 0 43 77 1.72 12 21 3 0 1 1 241 BC-028 GA 1 73 69 1.55 14 21 3 1 1 1 242 BC-029 GA 1 55 80 1.57 15 19 3 1 1 1 243 BC-030 GA 1 62 14 19 3 0 1 1 244 BC-031 GA 0 48 87 14 22 3 0 1 1 245 BC-036 GG 0 29 105 1.7 13 22 2 0 1 1 246 BC-038 GA 0 40 65 1.6 12 21 3 0 1 1 247 BC-039 GG 1 75 45 1.5 14 15 10 0 1 1 248 BC-040 GA 1 52 70 1.6 16 42 3 0 1 1 249 BC-041 GA 1 50 75 1.64 12.5 0 0 1 1 250 BC-042 GG 0 47 66 1.68 13 17 2 0 1 1 251 BC-043 GA 0 44 70 1.75 37 1 0 1 1 252 BC-044 GA 0 43 58 1.7 13 22 3 0 1 1 253 BC-045 GG 0 42 60 1.5 0 0 1 1 254 BC-046 GG 0 40 50 1.51 12 23 4 0

110
C S ID ID Genotype Men. Stat. Age Smoking Weight Height BMI Age at
Men. 1st
Preg.# of
ChildrenFam. Hist.
1 1 255 BC-047 GA 1 55 37 2 0 1 1 256 BC-048 GA 1 1 1 257 BC-049 GG 1 57 57 1.62 30 2 1 1 1 258 BC-050 GG 0 44 57 1.55 29 4 0 1 1 259 BC-051 GA 0 31 60 1.6 12 25 2 0 1 1 260 BC-052 AA 0 43 75 1.67 11 21 2 0 1 1 261 BC-053 GG 0 30 68 1.64 20 1 0 1 1 262 BC-055 GA 0 43 46 1.6 14 26 2 0 1 1 263 BC-060 GG 0 54 80 1.65 25 2 0 1 1 264 BC-061 GA 1 51 48 1.55 13 26 3 0 1 1 265 BC-062 GA 0 40 85 1.75 14 36 2 0 1 1 266 BC-063 AA 1 72 29 1 1 1 267 BC-064 GG 0 37 70 1.65 13 23 2 0 1 1 268 BC-065 GG 1 46 86 1.67 11 28 0 1 1 1 269 BC-068 GG 0 43 22 2 0 1 1 270 BC-069 GA 1 65 64 1.57 13 24 2 0 1 1 271 BC-070 GG 0 43 65 1.58 13 23 2 0 1 1 272 BC-071 GG 1 54 87 1.67 13 0 1 1 1 273 BC-072 GG 1 44 87 1.67 13 18 4 1 1 1 274 BC-073 GG 1 51 60 1.55 16 30 2 0 1 1 275 BC-074 GG 0 34 94 12.5 30 1 1 1 1 276 BC-075 GA 1 62 50 1.61 12 25 4 0 1 1 277 BC-076 GA 0 45 1 1 1 278 BC-077 GG 0 48 75 1.57 16 20 3 0 1 1 279 BC-078 AA 0 48 96 1.7 13 23 4 0 1 1 280 BC-080 GG 0 40 25 2 0 1 1 281 BC-081 GG 1 78 86 1.55 12 18 3 0 1 1 282 BC-082 GG 0 37 60 1.55 12.5 27 2 0 1 1 283 BC-085 GG 0 42 59 1.5 12 24 1 0 1 1 284 BC-086 GA 1 55 70 1.6 13 26 2 0 1 1 285 BC-087 GG 1 53 28 2 0 1 1 286 BC-088 GG 0 37 59 1.68 13 25 2 0

111
C S ID ID Genotype Men. Stat. Age Smoking Weight Height BMI Age at
Men. 1st
Preg.# of
ChildrenFam. Hist.
1 1 287 BC-089 GG 1 70 34 3 0 1 1 288 BC-090 GA 0 30 20 2 0 1 1 289 BC-091 GG 0 40 12 20 1 0 1 1 290 BC-202 GA 1 54 78 1.58 13 20 2 0 1 1 291 BC-203 GA 0 40 60 1.6 13 25 2 0 1 1 292 BC-204 GA 0 34 62 1.5 13.5 16 2 0 1 1 293 BC-207 GG 0 43 62 1.56 27 3 1 1 1 294 BC-208 GA 1 61 15 2 0 1 1 295 BC-209 GA 0 35 85 1.74 13 26 2 1 1 1 296 BC-210 AA 0 51 77 1.69 13 0 0 1 1 297 BC-211 GA 0 38 56 1.6 18 24 3 0 1 1 298 BC-303 GG 1 51 66 1.65 14 23 3 1 1 1 299 BC-305 AA 0 47 66 1.72 14 24 2 0 1 1 300 BC-306 GG 1 53 63 .153 13 18 2 1 1 1 301 BC-309 GA 0 27 73 1.62 13 20 2 0 2 1 302 62 GG 0 54 12 28 1 2 1 303 63 AA 0 50 11 24 2 1 2 1 304 64 GA 0 48 62.5 13 25 2 1 2 1 305 65 GG 1 74 14 26 1 2 1 306 66 GG 0 52 12 23 1 2 1 307 67 AA 1 59 13 19 1 2 1 308 68 GA 0 48 12 23 2 1 2 1 309 70 GG 0 45 12 21 2 1 2 1 310 71 GG 0 51 13 21 2 1 2 1 311 72 GG 1 1 2 1 312 73 GG 1 81 13 23 1 2 1 313 74 GG 0 12 23 1 2 1 314 75 GA 0 50 13 0 1 2 1 315 76 GG 1 13 25 1 2 1 316 77 AA 1 82 14 26 1 2 1 317 78 AA 0 51 13 31 1 2 1 318 79 GG 1 72 11 36 1

112
C S ID ID Genotype Men. Stat. Age Smoking Weight Height BMI Age at
Men. 1st
Preg.# of
ChildrenFam. Hist.
2 1 319 80 GG 1 72 13 1 2 1 320 81 GG 1 80 0 1 2 1 321 83 GG 1 11 18 1 2 1 322 85 AA 0 42 13 35 1 1 2 1 323 86 AA 1 48 14 29 2 1 2 1 324 87 GA 0 1 2 1 325 88 AA 1 60 12 20 2 1 2 1 326 90 GG 0 56 13 22 1 2 1 327 92 GG 1 50 1 2 1 328 94 GA 1 52 13 24 1 2 1 329 98 GA 0 56 81 1.67 13 18 3 1 2 1 330 99 GG 0 60 1.68 11 21 2 1 2 1 331 120 GA 1 1 2 1 332 123 GA 1 65 13 0 1 2 1 333 124 GG 0 38 13 0 1 2 1 334 125 GA 0 56 14 2 1 2 1 335 126 GG 0 43 13 2 1 2 1 336 127 GA 1 66 13 18 3 1 2 1 337 128 GA 0 30 15 1 1 2 1 338 129 GA 0 32 12 21 2 1 2 1 339 130 AA 0 32 14 0 1 2 1 340 131 GA 0 37 12 25 2 1 2 1 341 132 GA 0 28 10 0 1 2 1 342 133 GA 0 28 0 1 2 1 343 134 GG 0 53 2 1 2 1 344 137 GA 0 42 14 20 1 2 1 345 138 GA 1 86 12 22 2 1 2 1 346 139 GG 1 49 14 24 1 1 2 1 347 140 GA 1 73 12 1 2 1 348 141 GA 0 58 21 1 2 1 349 143 AA 0 1 2 1 350 145 GA 1 1

113
C S ID ID Genotype Men. Stat. Age Smoking Weight Height BMI Age at
Men. 1st
Preg.# of
ChildrenFam. Hist.
2 1 351 146 AA 0 1 2 1 352 150 GG 1 1 2 1 353 151 GA 0 1 2 1 354 152 GG 1 1 2 1 355 153 GA 0 1 2 1 356 154 AA 0 1 2 1 357 155 GA 1 1 2 1 358 156 GA 0 1 2 1 359 157 GA 0 1 2 1 360 158 GA 0 1 2 1 361 159 GG 1 1 2 1 362 160 GG 0 1 2 1 363 162 GG 1 1 2 1 364 163 GA 1 1 2 1 365 165 GG 1 1 2 1 366 167 GG 1 1 2 1 367 169 AA 1 14 0 1 2 1 368 171 GA 0 40 11 23 2 1 2 1 369 174 GA 1 1 2 1 370 175 AA 0 48 1 2 1 371 176 GA 0 51 1 2 1 372 180 AA 0 1 2 1 373 182 AA 1 1 2 1 374 186 GA 0 1 2 1 375 197 GA 1 1 2 1 376 198 GG 0 1 2 1 377 199 GA 1 1 2 1 378 200 GA 1 1 2 1 379 201 GG 1 1 2 1 380 206 AA 0 1 2 1 381 207 AA 1 1 2 1 382 208 GG 0 39 13 29 1 1

114
C S ID ID Genotype Men. Stat. Age Smoking Weight Height BMI Age at
Men. 1st
Preg.# of
ChildrenFam. Hist.
2 1 383 209 GA 0 1 2 1 384 211 GA 1 1 2 1 385 219 GG 1 40 1 2 1 386 221 GG 0 50 1 2 1 387 222 GG 0 25 1 2 1 388 224 AA 1 54 1 2 1 389 227 GA 0 48 1 2 1 390 228 GG 0 49 1 2 1 391 229 GA 0 1 2 1 392 230 GA 0 1 2 1 393 231 GA 0 49 1 2 1 394 232 GG 1 63 1 2 1 395 233 GA 0 1 2 1 396 234 GA 1 53 1 2 1 397 235 GA 1 1 2 1 398 239 GA 0 47 14 0 1 2 1 399 240 GA 0 36 12 0 1 2 1 400 244 GA 0 49 15 30 1 1 2 1 401 245 GA 1 1 2 1 402 246 GA 0 1 2 1 403 247 GG 0 1 2 1 404 248 GA 1 1 2 1 405 249 GG 0 20 1 2 1 406 250 AA 0 42 1 2 1 407 251 AA 0 31 1 2 1 408 252 GG 0 28 1 2 1 409 253 AA 0 32 1 2 1 410 254 GA 0 45 11 22 2 1 2 1 411 255 GA 0 1 2 1 412 256 GG 1 63 12 0 1 2 1 413 257 AA 1 69 15 30 1 1 2 1 414 258 GG 0 39 16 0 1

115
C S ID ID Genotype Men. Stat. Age Smoking Weight Height BMI Age at
Men. 1st
Preg.# of
ChildrenFam. Hist.
2 1 415 259 GG 1 2 1 2 1 416 260 GA 1 1 2 1 417 261 AA 1 59 63 1.58 33 2 1 2 1 418 262 GG 0 38 13 26 2 1 2 1 419 266 GG 1 1 2 1 420 267 GG 1 1 2 1 421 270 GA 0 1 2 1 422 271 GA 0 45 1 2 1 423 273 GA 0 38 14 32 1 1 2 1 424 274 GG 1 1 2 1 425 275 GA 0 1 2 1 426 276 GA 0 29 1 2 1 427 277 AA 0 1 2 1 428 279 GG 0 21 1 2 1 429 281 GA 1 1 2 1 430 282 GA 1 1 2 1 431 283 GG 0 39 12 0 1 2 1 432 284 GA 1 11 2 1 2 1 433 286 AA 1 62 12 0 1 2 1 434 287 GG 0 72 13 35 2 1 2 1 435 288 GA 0 29 12 0 1 2 1 436 289 GA 1 1 2 1 437 291 GG 1 1 2 1 438 292 GG 0 1 2 1 439 293 GA 1 15 0 1 2 1 440 294 GA 1 74 12 2 1 2 1 441 295 GG 1 54 12 17 1 2 1 442 296 GA 1 58 13 1 2 1 443 297 GA 1 1 2 1 444 303 GG 0 1 2 1 445 304 GG 1 71 1 2 1 446 305 GG 1 1

116
C S ID ID Genotype Men. Stat. Age Smoking Weight Height BMI Age at
Men. 1st
Preg.# of
ChildrenFam. Hist.
2 1 447 306 GG 1 72 1 2 1 448 307 GG 0 1 2 1 449 308 GA 1 49 1 2 1 450 310 GG 0 36 12 20 2 1 2 1 451 311 GG 1 60 12 21 2 1 2 1 452 312 GG 0 38 11 20 2 1 2 1 453 317 GG 1 1 1 0 454 NK-001 GA 0 38 1 55 1,6 21,48 13 23 3 0 1 0 455 NK-002 GA 1 50 0 75 1,57 30,43 14 23 5 0 1 0 456 NK-003 GA 0 43 1 73 1,65 26,81 13 19 3 0 1 0 457 NK-004 AA 1 51 1 55 1,57 22,31 15 15 4 0 1 0 458 NK-005 GG 1 69 0 85 1,7 29,41 29 7 0 1 0 459 NK-006 GG 1 63 1 0 460 NK-007 AA 1 72 0 48 1,47 22,21 15 20 5 0 1 0 461 NK-008 GG 1 75 0 75 1,52 32,46 13 20 4 0 1 0 462 NK-009 GG 0 41 1 0 463 NK-010 AA 1 57 0 84 1,63 31,62 13 20 3 0 1 0 464 NK-011 GA 1 51 1 0 465 NK-012 GG 0 52 0 53 1,63 19,95 14 18 3 0 1 0 466 NK-013 GA 1 56 0 48 1,34 26,73 14 16 7 0 1 0 467 NK-014 GA 1 73 0 65 1,47 30,08 14 22 3 0 1 0 468 NK-015 GA 0 42 0 81 1,66 29,39 13 19 3 0 1 0 469 NK-016 AA 1 62 0 55 1,56 22,60 18 22 2 0 1 0 470 NK-017 GG 0 40 0 58 1,6 22,66 15 20 3 0 1 0 471 NK-018 GG 0 34 1 50 1,67 17,93 15 0 0 1 0 472 NK-019 GG 1 50 0 58 1,57 23,53 15 20 2 0 1 0 473 NK-020 GA 1 41 0 92 1,6 35,94 10 20 2 0 1 0 474 NK-021 GA 0 42 1 0 475 NK-022 GA 0 37 1 57 1,55 23,73 16 33 1 0 1 0 476 NK-025 AA 0 46 1 71 1,61 27,39 15 23 2 0 1 0 477 NK-026 GG 0 15 0 70 1,57 28,40 13 0 1 0 478 NK-027 GG 0 18 0 50 1,55 20,81 15 0

117
C S ID ID Genotype Men. Stat. Age Smoking Weight Height BMI Age at
Men. 1st
Preg.# of
ChildrenFam. Hist.
1 0 479 NK-029 GG 1 64 0 61 1,52 26,40 16 22 2 0 1 0 480 NK-030 GG 1 64 1 0 481 NK-031 GG 0 34 0 85 1,64 31,60 14 22 1 0 1 0 482 NK-032 GA 0 18 1 55 1,68 19,49 12 0 1 0 483 NK-034 GA 0 27 0 63 1,6 24,61 14 18 2 0 1 0 484 NK-035 GA 1 53 0 80 1,6 31,25 14 21 3 0 1 0 485 NK-036 GA 0 41 0 89 1,64 33,09 13 23 2 0 1 0 486 NK-037 GA 1 30 1 116 1,68 41,10 12 0 0 1 0 487 NK-038 GA 0 32 1 60 1,58 24,03 14 16 2 0 1 0 488 NK-039 GA 0 47 0 84 1,58 33,65 14 16 5 0 1 0 489 NK-040 GG 0 34 0 80 1,6 31,25 14 21 4 0 1 0 490 NK-043 GA 0 47 0 65 1,62 24,77 12 19 5 0 1 0 491 NK-045 GA 0 46 0 63 1,57 25,56 14 18 2 0 1 0 492 NK-046 GG 1 70 0 72 1,6 28,12 12 0 0 1 0 493 NK-047 GG 1 70 1 0 494 NK-048 GG 0 47 0 61 1,62 23,24 14 0 0 1 0 495 NK-049 GA 1 74 0 55 1,6 21,48 14 0 0 1 0 496 NK-050 GA 1 67 0 55 1,51 24,12 17 20 5 0 1 0 497 NK-051 GG 1 66 0 77 1,5 34,22 14 16 6 0 1 0 498 NK-052 GA 0 37 1 45 1,6 17,58 17 25 2 0 1 0 499 NK-053 GA 0 46 1 84 1,53 35,88 13 16 2 0 1 0 500 NK-054 GA 1 53 0 63 1,51 27,63 14 19 7 0 1 0 501 NK-055 GG 0 34 1 58 1,63 21,83 15 21 2 0 1 0 502 NK-057 GG 1 53 1 0 503 NK-058 GG 0 47 0 80 15 30 1 0 1 0 504 NK-059 GA 1 71 1 55 1,5 24,44 13 24 6 0 1 0 505 NK-061 GA 0 45 1 0 506 NK-062 GG 1 65 0 70 1,5 31,11 12 15 6 0 1 0 507 NK-063 GG 1 58 0 65 1,57 26,37 14 21 4 0 1 0 508 NK-065 GG 0 34 0 65 1,59 25,71 14 24 3 0 1 0 509 NK-066 GA 1 63 0 80 1,6 31,25 13 20 3 0 1 0 510 NK-067 GG 0 41 0 63 1,5 28 12 30 2 0

118
C S ID ID Genotype Men. Stat. Age Smoking Weight Height BMI Age at
Men. 1st
Preg.# of
ChildrenFam. Hist.
1 0 511 NK-068 GG 1 51 0 12 22 3 0 1 0 512 NK-069 GG 0 20 0 55 1,57 22,31 12 18 1 0 1 0 513 NK-072 GA 0 46 0 72 1,6 28,12 16 18 5 0 1 0 514 NK-073 GA 1 56 0 65 1,56 26,71 12 18 6 0 1 0 515 NK-074 GA 1 54 0 74 1,56 30,41 16 17 4 0 1 0 516 NK-075 GG 0 49 0 89 1,51 39,03 13 15 7 0 1 0 517 NK-076 GA 1 66 0 50 1,52 21,64 12 20 5 0 1 0 518 NK-077 GA 0 17 0 59 1,54 24,88 14 0 0 1 0 519 NK-078 GG 0 34 0 70 1,58 28,04 15 20 3 0 1 0 520 NK-079 AA 1 57 0 80 1,54 33,73 17 19 4 0 1 0 521 NK-083 GA 0 45 1 63 1,67 22,59 11 15 2 0 1 0 522 NK-084 GG 0 45 0 13 17 3 0 1 0 523 NK-086 GG 0 20 0 61 1,68 21,61 14 0 0 1 0 524 NK-091 GA 0 33 1 57 1,65 20,94 13 20 1 0 1 0 525 NK-092 GA 0 35 0 52 1,6 20,31 14 0 0 1 0 526 NK-094 GG 1 56 1 59 1,6 23,05 13 15 4 0 1 0 527 NK-095 GG 0 24 0 45 1,55 18,73 13 0 0 1 0 528 NK-096 GA 0 26 0 65 1,6 25,39 15 0 0 1 0 529 NK-097 GG 0 28 0 14 18 1 0 1 0 530 NK-098 GG 0 41 1 66 1,55 27,47 24 2 0 1 0 531 NK-100 GA 1 55 0 85 1,55 35,38 12 20 4 0 1 0 532 NK-101 GA 0 37 1 68 1,69 23,81 13 0 0 1 0 533 NK-102 GA 0 48 0 70 19 20 2 0 1 0 534 NK-103 GA 1 75 0 70 1,6 27,34 14 27 2 0 1 0 535 NK-104 GA 1 55 0 66 1,6 25,78 17 21 1 0 1 0 536 NK-105 GA 0 19 0 60 1,55 24,97 13 0 0 1 0 537 NK-106 GG 1 59 0 86 1,66 31,21 13 19 4 0 1 0 538 NK-107 GA 1 63 0 92 1,7 31,83 0 1 0 539 NK-108 GA 1 83 0 76 1,55 31,63 3 0 1 0 540 NK-109 GG 1 50 0 80 1,6 31,25 13 17 3 0 1 0 541 NK-110 GG 1 64 1 75 1,65 27,55 12 16 5 0 1 0 542 NK-111 GA 0 32 1 70 1,56 28,76 13 20 3 0

119
C S ID ID Genotype Men. Stat. Age Smoking Weight Height BMI Age at
Men. 1st
Preg.# of
ChildrenFam. Hist.
1 0 543 NK-112 GA 0 36 0 58 1,5 25,78 12 24 2 0 1 0 544 NK-113 GA 1 50 0 70 1,59 27,69 15 19 8 0 1 0 545 NK-114 GG 1 55 0 44 1,62 16,77 15 16 5 0 1 0 546 NK-116 GG 1 53 0 70 1,5 31,11 14 17 10 0 1 0 547 NK-117 GG 0 33 1 40 1,65 14,69 14 24 3 0 1 0 548 NK-118 GA 0 43 0 80 1,6 31,25 13 19 3 0 1 0 549 NK-119 GG 1 75 0 95 1,63 35,76 13 23 8 0 1 0 550 NK-122 GA 1 50 0 73 1,6 28,52 16 21 5 0 1 0 551 NK-127 GG 0 31 0 74 1,64 27,51 12 19 1 0 1 0 552 NK-128 AA 1 52 0 60 1,58 24,03 14 21 5 0 1 0 553 NK-131 AA 0 27 1 41 1,52 17,75 13 19 2 0 1 0 554 NK-133 GA 0 38 0 63 1,56 25,89 17 0 0 1 0 555 NK-134 GG 1 61 0 83 1,61 32,02 15 18 6 0 1 0 556 NK-135 GA 0 43 0 64 1,58 25,64 15 17 4 0 1 0 557 NK-137 GG 1 54 0 61 1,55 25,39 14 29 2 0 1 0 558 NK-138 GG 0 45 1 60 1,5 26,67 14 16 6 0 1 0 559 NK-139 GA 1 52 1 92 1,6 35,94 14 18 5 0 1 0 560 NK-140 GG 1 45 0 83 1,58 33,25 13 18 5 0 1 0 561 NK-142 GG 0 27 0 50 1,68 17,72 13 20 1 0 1 0 562 NK-143 GG 0 46 0 110 1,58 44,06 16 16 4 0 1 0 563 NK-147 GG 0 39 1 84 1,7 29,07 14 22 2 0 1 0 564 NK-148 GG 1 51 0 78 1,61 30,09 16 20 3 0 1 0 565 NK-149 AA 0 40 1 60 1,59 23,73 15 19 3 0 1 0 566 NK-151 GA 0 47 0 67 1,6 26,17 17 22 5 0 1 0 567 NK-153 GA 1 77 1 0 568 NK-154 GA 1 70 1 0 569 NK-155 AA 0 26 1 0 570 NK-156 AA 1 52 1 0 571 NK-159 GA 0 33 1 0 572 NK-163 GA 1 64 1 0 573 NK-164 GG 1 55 1 0 574 NK-165 GG 0 38

120
C S ID ID Genotype Men. Stat. Age Smoking Weight Height BMI Age at
Men. 1st
Preg.# of
ChildrenFam. Hist.
1 0 575 NK-169 GG 0 45 1 0 576 NK-170 GA 1 74 1 0 577 GK-001 GG 1 69 0 62 1,59 24,52 25 3 0 1 0 578 GK-002 GG 0 36 1 55 1,56 22,60 14 22 2 0 1 0 579 GK-003 GG 1 52 1 52 1,52 22,51 15 2 0 1 0 580 GK-004 GG 0 34 0 75 1,64 27,89 13 21 2 0 1 0 581 GK-005 GA 1 49 1 90 1,65 33,06 13 17 4 0 1 0 582 GK-007 GG 1 56 0 60 1,55 24,97 12 17 4 0 1 0 583 GK-008 GG 0 52 0 66 1,61 25,46 13 21 2 0 1 0 584 GK-009 AA 0 43 0 73 1,56 30,00 13 20 1 0 1 0 585 GK-010 GG 1 65 0 58 1,5 25,78 13 17 5 0 1 0 586 GK-011 GG 1 53 1 72 1,65 26,45 14 22 3 0 1 0 587 GK-012 GG 1 48 0 68 1,68 24,09 13 27 2 0 1 0 588 GK-013 GG 1 50 0 60 1,6 23,44 14 22 1 0 1 0 589 GK-014 GG 1 44 0 81 1,62 30,86 16 0 1 0 590 GK-015 GA 1 42 0 103 1,61 39,74 20 4 0 1 0 591 GK-016 GG 1 69 1 0 592 GK-017 GG 0 1 0 593 GK-018 GG 1 69 1 0 594 GK-019 GA 1 69 1 0 595 GK-020 GG 1 55 0 70 1,56 28,76 11 25 5 0 1 0 596 GK-021 GG 0 37 0 89 1,5 39,56 13 17 5 0 1 0 597 GK-022 AA 1 46 0 60 1,52 25,97 19 2 0 1 0 598 GK-023 GG 1 39 0 70 1,58 28,04 13 14 10 0 1 0 599 GK-024 GA 1 55 0 80 1,5 35,56 14 17 3 0 1 0 600 GK-025 AA 1 56 1 75 1,56 30,82 13 19 3 0 1 0 601 GK-026 GG 1 42 0 80 1,63 30,11 22 3 0 1 0 602 GK-027 GG 0 39 1 61 1,56 25,07 14 24 1 0 1 0 603 GK-028 GG 0 47 0 67 1,6 26,17 13 17 2 0 1 0 604 GK-029 GG 1 67 0 80 1,55 33,30 27 5 0 1 0 605 GK-030 GG 1 65 0 65 1,65 23,88 13 24 4 0 1 0 606 GK-031 GG 1 62 0 66 1,6 25,78 15 17 3 0

121
C S ID ID Genotype Men. Stat. Age Smoking Weight Height BMI Age at
Men. 1st
Preg.# of
ChildrenFam. Hist.
1 0 607 GK-032 GG 1 32 0 63 1,56 25,89 20 2 0 1 0 608 GK-033 GG 0 39 0 80 1,62 30,48 15 16 3 0 1 0 609 GK-034 GG 1 55 0 80 1,62 30,48 15 20 5 0 1 0 610 GK-035 GA 0 45 0 63 1,58 25,24 13 17 2 0 1 0 611 GK-036 GG 0 38 0 90 1,64 33,46 13 18 2 0 1 0 612 GK-037 GG 0 45 1 75 1,59 29,67 11 27 2 0 1 0 613 GK-038 GA 0 52 0 65 1,52 28,13 12 20 3 0 1 0 614 GK-039 GA 1 60 1 85 1,66 30,85 15 21 4 0 1 0 615 GK-040 GG 0 31 1 67 1,68 23,74 13 19 3 0 1 0 616 GK-041 GG 1 69 0 87 1,52 37,66 14 18 3 0 1 0 617 GK-042 GA 1 55 0 75 1,64 27,89 15 19 4 0 1 0 618 GK-043 GA 0 40 0 72 1,6 28,12 15 26 1 0 1 0 619 GK-044 GA 1 56 0 65 1,54 27,41 15 27 4 0 1 0 620 GK-045 GG 0 45 1 61 1,6 23,83 14 27 2 0 1 0 621 GK-046 GA 0 47 0 72 1,5 32,00 13 21 2 0 1 0 622 GK-047 AA 0 29 1 60 1,65 22,04 14 29 1 0 1 0 623 GK-048 GG 1 44 1 59 1,56 24,24 14 24 2 0 1 0 624 GK-049 GA 1 49 0 60 1,6 23,44 15 23 4 0 1 0 625 GK-051 GG 1 50 1 0 626 GK-052 GG 0 33 1 54 1,64 20,08 15 0 0 1 0 627 GK-053 GG 1 50 0 75 1,53 32,04 14 24 6 0 1 0 628 GK-054 GA 1 67 0 66 1,62 25,15 16 20 5 0 1 0 629 GK-055 GA 1 49 1 55 1,55 22,89 14 23 2 0 1 0 630 GK-056 GA 1 45 0 65 1,65 23,88 13 22 4 0 1 0 631 GK-057 GA 0 39 1 69 1,6 26,95 12 27 0 1 0 632 GK-058 GA 0 41 0 54 1,7 18,69 13 0 0 1 0 633 GK-059 GA 1 53 0 66 1,65 24,24 12 26 2 0 1 0 634 GK-060 GG 0 46 0 97 1,73 32,41 14 21 1 0 1 0 635 GK-061 GG 0 34 0 59 1,55 24,56 14 16 4 0 1 0 636 GK-062 GG 0 36 0 54 1,64 20,08 15 22 4 0 1 0 637 GK-063 GG 0 46 0 97 1,73 32,41 14 21 1 0 1 0 638 GK-064 GG 0 37 0 80 1,5 35,56 15 25 3 0
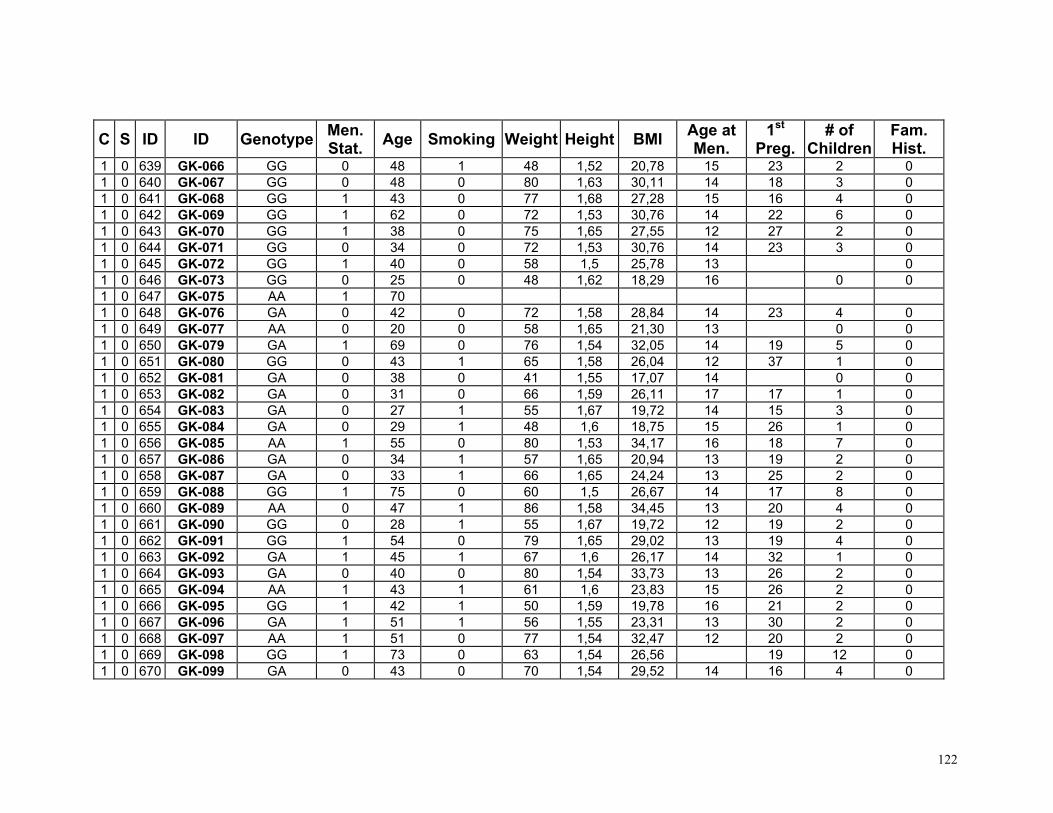
122
C S ID ID Genotype Men. Stat. Age Smoking Weight Height BMI Age at
Men. 1st
Preg.# of
ChildrenFam. Hist.
1 0 639 GK-066 GG 0 48 1 48 1,52 20,78 15 23 2 0 1 0 640 GK-067 GG 0 48 0 80 1,63 30,11 14 18 3 0 1 0 641 GK-068 GG 1 43 0 77 1,68 27,28 15 16 4 0 1 0 642 GK-069 GG 1 62 0 72 1,53 30,76 14 22 6 0 1 0 643 GK-070 GG 1 38 0 75 1,65 27,55 12 27 2 0 1 0 644 GK-071 GG 0 34 0 72 1,53 30,76 14 23 3 0 1 0 645 GK-072 GG 1 40 0 58 1,5 25,78 13 0 1 0 646 GK-073 GG 0 25 0 48 1,62 18,29 16 0 0 1 0 647 GK-075 AA 1 70 1 0 648 GK-076 GA 0 42 0 72 1,58 28,84 14 23 4 0 1 0 649 GK-077 AA 0 20 0 58 1,65 21,30 13 0 0 1 0 650 GK-079 GA 1 69 0 76 1,54 32,05 14 19 5 0 1 0 651 GK-080 GG 0 43 1 65 1,58 26,04 12 37 1 0 1 0 652 GK-081 GA 0 38 0 41 1,55 17,07 14 0 0 1 0 653 GK-082 GA 0 31 0 66 1,59 26,11 17 17 1 0 1 0 654 GK-083 GA 0 27 1 55 1,67 19,72 14 15 3 0 1 0 655 GK-084 GA 0 29 1 48 1,6 18,75 15 26 1 0 1 0 656 GK-085 AA 1 55 0 80 1,53 34,17 16 18 7 0 1 0 657 GK-086 GA 0 34 1 57 1,65 20,94 13 19 2 0 1 0 658 GK-087 GA 0 33 1 66 1,65 24,24 13 25 2 0 1 0 659 GK-088 GG 1 75 0 60 1,5 26,67 14 17 8 0 1 0 660 GK-089 AA 0 47 1 86 1,58 34,45 13 20 4 0 1 0 661 GK-090 GG 0 28 1 55 1,67 19,72 12 19 2 0 1 0 662 GK-091 GG 1 54 0 79 1,65 29,02 13 19 4 0 1 0 663 GK-092 GA 1 45 1 67 1,6 26,17 14 32 1 0 1 0 664 GK-093 GA 0 40 0 80 1,54 33,73 13 26 2 0 1 0 665 GK-094 AA 1 43 1 61 1,6 23,83 15 26 2 0 1 0 666 GK-095 GG 1 42 1 50 1,59 19,78 16 21 2 0 1 0 667 GK-096 GA 1 51 1 56 1,55 23,31 13 30 2 0 1 0 668 GK-097 AA 1 51 0 77 1,54 32,47 12 20 2 0 1 0 669 GK-098 GG 1 73 0 63 1,54 26,56 19 12 0 1 0 670 GK-099 GA 0 43 0 70 1,54 29,52 14 16 4 0

123
C S ID ID Genotype Men. Stat. Age Smoking Weight Height BMI Age at
Men. 1st
Preg.# of
ChildrenFam. Hist.
1 0 671 GK-100 GG 1 43 0 83 1,56 34,11 11 16 4 0 2 0 672 7264 GA 1 58 2 0 673 8215 GG 1 63 2 0 674 7861 AA 1 54 2 0 675 7224 AA 1 55 2 0 676 8495 GA 0 29 2 0 677 8268 GA 0 32 2 0 678 4423 GA 0 34 2 0 679 5932 GA 0 39 2 0 680 1493 GA 1 71 2 0 681 1828 GA 0 47 2 0 682 7462 GG 1 59 2 0 683 8209 GA 0 49 2 0 684 8428 GA 1 52 2 0 685 7977 GG 0 2 0 686 8313 GA 0 40 2 0 687 4396 GG 0 40 2 0 688 5887 AA 0 35 2 0 689 4718 GG 1 57 2 0 690 1891 GA 0 41 2 0 691 7311 GA 0 46 2 0 692 7956 GA 1 54 2 0 693 7726 GG 1 58 2 0 694 8126 GG 1 2 0 695 8500 GA 1 65 2 0 696 8259 GA 0 33 2 0 697 4606 GA 0 45 2 0 698 8359 AA 0 39 2 0 699 7164 GG 1 60 2 0 700 5713 GG 1 55 2 0 701 1717 GG 0 38 2 0 702 4720 GA 1 55

124
C S ID ID Genotype Men. Stat. Age Smoking Weight Height BMI Age at
Men. 1st
Preg.# of
ChildrenFam. Hist.
2 0 703 1944 GG 0 45 2 0 704 5846 AA 0 48 2 0 705 2290 GA 1 58 2 0 706 1751 GA 0 44 2 0 707 2195 GA 0 36 2 0 708 8100 GG 1 64 2 0 709 7363 GA 1 50 2 0 710 8150 GG 1 59 2 0 711 7688 AA 0 47 2 0 712 8408 GG 0 37 2 0 713 7693 GA 0 32 2 0 714 2540 GG 0 43 2 0 715 2718 AA 1 56 2 0 716 6096 AA 0 2 0 717 1883 GA 1 2 0 718 7127 GG 0 44 2 0 719 8097 GG 0 45 2 0 720 7715 GG 1 57 2 0 721 8293 AA 0 34 2 0 722 7000 GA 0 31 2 0 723 4610 GG 0 35 2 0 724 2670 AA 0 41 2 0 725 6355 AA 1 56 2 0 726 1889 GA 1 60 2 0 727 7342 GA 0 49 2 0 728 8053 AA 0 38 2 0 729 7685 AA 0 42 2 0 730 5948 GG 1 62 2 0 731 6536 GG 0 49 2 0 732 2504 GG 1 55 2 0 733 2910 GG 1 62 2 0 734 6391 AA 0 41

125
C S ID ID Genotype Men. Stat. Age Smoking Weight Height BMI Age at
Men. 1st
Preg.# of
ChildrenFam. Hist.
2 0 735 2852 GG 1 56 2 0 736 7355 AA 0 43 2 0 737 8408 GG 0 37 2 0 738 7273 GA 0 45 2 0 739 6648 AA 0 2 0 740 4509 GG 0 43 2 0 741 2884 AA 1 58 2 0 742 4729 GA 0 35 2 0 743 1727 GG 1 58 2 0 744 8281 GA 1 50 2 0 745 7940 GG 1 60 2 0 746 8013 GG 1 61 2 0 747 5820 GG 0 36 2 0 748 6559 GG 1 55 2 0 749 3081 GA 1 56 2 0 750 6316 GA 0 40 2 0 751 1499 GA 0 49 2 0 752 7931 GA 1 51 2 0 753 8431 AA 0 49 2 0 754 6584 GA 0 48 2 0 755 8530 AA 0 46 2 0 756 8125 GG 0 35 2 0 757 3001 GA 1 2 0 758 4918 GG 1 58 2 0 759 1452 GG 0 2 0 760 A1 AA 1 59 12 3 2 0 761 A2 GG 1 70 13 2 2 0 762 A3 GA 1 68 12 2 2 0 763 A4 GA 1 70 12 3 2 0 764 A5 GA 1 60 11 2 2 0 765 A6 AA 1 58 10 2 2 0 766 A7 GA 1 50 12 2

126
C S ID ID Genotype Men. Stat. Age Smoking Weight Height BMI Age at
Men. 1st
Preg.# of
ChildrenFam. Hist.
2 0 767 A8 GG 1 79 12 4 2 0 768 A10 GG 1 62 12 2 2 0 769 A11 AA 1 53 11 1 2 0 770 A12 GG 1 66 14 2 2 0 771 A13 GG 1 52 12 0 2 0 772 A14 AA 1 88 11 4 2 0 773 A15 AA 1 65 14 4 2 0 774 A16 AA 1 78 12 2 2 0 775 A17 GA 1 72 13 2 2 0 776 A18 GA 1 54 13 2 2 0 777 A19 GG 1 52 12 2 2 0 778 A20 GA 1 70 12 2 2 0 779 A21 GA 1 51 13 1 2 0 780 A22 GA 1 64 11 2 2 0 781 A23 GA 1 61 12 2 2 0 782 A24 GG 1 60 14 1 2 0 783 A25 GG 0 49 13 2 2 0 784 A26 GG 1 77 15 1 2 0 785 A27 AA 1 71 13 0 2 0 786 A28 GA 1 71 12 0 2 0 787 A29 GG 1 52 13 2 2 0 788 A30 AA 1 52 10 2 2 0 789 A31 GA 1 53 11 2 2 0 790 A32 GA 1 74 13 1 2 0 791 A34 GA 1 72 12 2 2 0 792 A35 GG 1 56 13 2 2 0 793 A36 AA 1 55 13 0 2 0 794 A38 GG 1 68 11 2 2 0 795 A39 GG 1 69 12 2 2 0 796 A40 AA 1 58 10 1 2 0 797 A42 GA 1 60 13 2 2 0 798 A44 GA 1 56 12 3

127
C S ID ID Genotype Men. Stat. Age Smoking Weight Height BMI Age at
Men. 1st
Preg.# of
ChildrenFam. Hist.
2 0 799 A46 GG 1 62 56 14 3 2 0 800 A48 AA 1 51 11 2 2 0 801 A49 GG 1 63 14 3 2 0 802 A50 AA 1 51 13 2 2 0 803 A51 GG 1 80 15 5 2 0 804 A53 AA 1 58 11 2 2 0 805 A54 AA 1 70 12 2 2 0 806 A55 GG 1 68 14 1 2 0 807 A56 GG 1 68 11 1 2 0 808 A57 GA 1 50 13 2 2 0 809 A59 GA 1 13 2 0 810 A60 GG 0 11 2 0 811 A62 AA 1 13 2 0 812 O1 AA 0 37 68 1.67 12 25 2 2 0 813 O2 AA 0 35 62 1.68 14 30 2 2 0 814 O3 AA 0 32 58 1.72 14 27 1 2 0 815 O4 AA 0 24 62 1.64 13 21 2 2 0 816 O10 GG 0 42 58 1.70 14 23 2 2 0 817 O12 GA 0 41 54 1.60 12 26 2 2 0 818 O13 GA 0 34 105 1.68 12 30 2 2 0 819 O14 AA 0 41 59 1.59 14 30 2 2 0 820 O15 AA 0 35 52 1.60 13 0 2 0 821 O16 GA 1 52 50 1.59 11 28 2 2 0 822 O17 GA 1 52 68 1.67 15 0 2 0 823 O18 GG 1 51 75 1.60 12 35 1 2 0 824 O19 GA 0 46 64 1.65 12 26 2 2 0 825 O20 GA 0 30 59 1.60 11 0 2 0 826 O21 GG 0 31 50 1.69 12 0 2 0 827 O22 GG 0 26 55 1.70 11 0 2 0 828 O23 GA 0 26 60 1.60 10 0 2 0 829 O24 GG 0 47 67 1.60 10 33 2 2 0 830 O25 GG 0 27 50 1.65 10 0

128
C S ID ID Genotype Men. Stat. Age Smoking Weight Height BMI Age at
Men. 1st
Preg.# of
ChildrenFam. Hist.
2 0 831 O27 GA 0 30 60 1.58 13 30 1 2 0 832 O28 GA 0 31 65 1.65 12 28 1 2 0 833 O30 GA 0 24 64 1.54 10 0 2 0 834 O31 GA 0 40 55 1.55 12 0 2 0 835 O32 GA 0 26 88 1.62 11 0
"C", Country (1: Turkey, 2: Greece) "S", Status of the individual (1: Patient, 0: Control) "ID", ID number assigned just to order. "S. ID", Sample ID written on the sample DNA. "Men. Stat.", Menopausal Status (0: Premenopausal, 1: Post menopausal)
"Smoking", Smoking Status (1: Smoker, 0: Never Smoke) "BMI", Body-mass-index "Age at Men.", Age at menarche "1st Preg.", Age of first pregnancy "# of Children", Number of healthy born children "Fam. Hist.", Family history of breast cancer (0: No, 1:Yes)