Embed Size (px)
Citation preview

674
Braz J Med Biol Res 42(7) 2009
R.J. Riella et al.
www.bjournal.com.br
Brazilian Journal of Medical and Biological Research (2009) 42: 674-684ISSN 0100-879X
Method for automatic detection of wheezingin lung soundsR.J. Riella1,2, P. Nohama1 and J.M. Maia1
1Departamento de Eletrônica e Centro de Pós-Graduação em Engenharia Elétrica e InformáticaIndustrial, Universidade Tecnológica Federal do Paraná, Curitiba, PR, Brasil2Instituto de Tecnologia para o Desenvolvimento, Curitiba, PR, Brasil
Correspondence to: R.J. Riella, DPEE/DVEL, LACTEC, Centro Politécnico, UFPR, BR-116, km 98, s/n,81531-980 Curitiba, PR, BrasilE-mail: [email protected], [email protected] and [email protected]
The present report describes the development of a technique for automatic wheezing recognition in digitally recorded lungsounds. This method is based on the extraction and processing of spectral information from the respiratory cycle and the use ofthese data for user feedback and automatic recognition. The respiratory cycle is first pre-processed, in order to normalize itsspectral information, and its spectrogram is then computed. After this procedure, the spectrogram image is processed by a two-dimensional convolution filter and a half-threshold in order to increase the contrast and isolate its highest amplitude components,respectively. Thus, in order to generate more compressed data to automatic recognition, the spectral projection from theprocessed spectrogram is computed and stored as an array. The higher magnitude values of the array and its respective spectralvalues are then located and used as inputs to a multi-layer perceptron artificial neural network, which results an automaticindication about the presence of wheezes. For validation of the methodology, lung sounds recorded from three differentrepositories were used. The results show that the proposed technique achieves 84.82% accuracy in the detection of wheezingfor an isolated respiratory cycle and 92.86% accuracy for the detection of wheezes when detection is carried out using groupsof respiratory cycles obtained from the same person. Also, the system presents the original recorded sound and the post-processed spectrogram image for the user to draw his own conclusions from the data.
Key words: Wheezes; Lung sounds; Spectrogram; Digital image processing; Artificial neural networks
Research supported by CAPES.
Received April 27, 2008. Accepted May 4, 2009
Introduction
According to data from the Brazilian Health Depart-ment, death caused by respiratory diseases grew 3% from1980 to 1999, being the fifth mortality cause in Brazil in1999 (1). In many countries nearly 5% of the populationsuffers from asthma and other related chest disorders (2).
Respiratory sounds constitute a relevant source ofinformation for the investigation of the state of the lungsand of the other organs, which compose the respiratorysystem. As respiratory sounds may be acquired by theeasy and non-invasive auscultation procedure, more rel-evant information from lung sounds may be extracted andcontribute to reducing the time for diagnosis, consequentlyincreasing treatment efficiency. Thus, an automated algo-
rithm developed to recognize abnormalities in lung soundsmay be of great relevance to clinical diagnosis.
Abnormal lung sounds may be classified according totwo main categories: crackles and wheezes (2). Wheezesare musical adventitious lung sounds, also called continu-ous (3). These adventitious sounds are characterized by adominant frequency, usually over 100 Hz (3), and a dura-tion of more than 100 ms (4). Their presence is related topartial airway obstruction (3,5). Also, wheezing with un-forced breathing is correlated with the severity of airwayobstruction. Therefore, its auscultation has been used forthe detection and evaluation of diseases such as children’snocturnal asthma (6) and for the evaluation of bronchocon-striction in asthma (5). The presence of wheezing in infantshas also been used as a parameter to evaluate the predis-

675
Braz J Med Biol Res 42(7) 2009
Methodology for detecting the presence of wheezing
www.bjournal.com.br
position to asthma (7). Other investigations have usedwheezing, among other symptoms, to evaluate thephysician’s and patient’s perception of acute asthma exac-erbation, compared to objective measurements such asforced expiratory volume (8).
In contrast, crackles are short, explosive and discon-tinuous sounds, shorter than 100 ms, usually occurringduring inspiration (4). They are characterized by a rapidinitial pressure deflection followed by a short oscillation(9). These adventitious sounds are classified as fine crack-les and coarse crackles based on their duration. Thus, finecrackles are defined as those lasting less than 10 ms andcoarse crackles are defined as those lasting more than 10ms (4).
Crackles are a qualitative diagnostic tool (3) and canbe produced either by explosive openings among regionsof the lungs, deflated to residual volume (10), due tosudden equalization of gas pressure during inspiration orby change in elastic stress resulting from sudden openingof closed airways (11).
However, the instrument used for auscultation, thestethoscope, sometimes does not present an efficient re-sponse in the acquisition of lung sounds. Basically, thisinstrument is simply a sound conduit between the bodysurface and the ears (3). Its frequency responses arerarely tested, rated or compared, with the instrumentsbeing usually chosen for their appearance, reputation andinadequately supported claim of performance, instead oftheir technical characteristics (3). Usually, the frequencyresponse of the stethoscope favors the lower frequencies,amplifying those lower than 112 Hz and attenuating higherfrequencies (12). Therefore, the response of the stetho-scope is insufficient when auscultating pulmonary sounds,which may have frequency components far above 112 Hz.Since heart sounds are composed mainly of lower fre-quencies, they cause much interference when the stetho-scope is used to auscultate lung sounds, being a cause ofmisunderstanding in the auscultation of respiratory sounds.
In clinical practice, some difficulties occur during thediagnostic process, such as a difference in sensitivitybetween the ears, physicians’ practice in the task of recog-nizing lung sounds, and presence of external and internalnoises, which may cause errors in the identification of thesound as pathological or normal, impairing the precision ofthe diagnosis.
However, lung sounds have naturally non-stationarysignals. This property can be observed both in healthynormal and abnormal subjects. But this non-stationarity ismore severe in cases of abnormal lung sounds. Therefore,significant diagnostic information can be obtained from thefrequency distribution of lung sounds, with the selection of
the signal processing technique used to extract this infor-mation being very important to maximize the efficiency ofextraction (13). This task has motivated many studies onthe classification of lung sounds using frequency analysis(13-17).
The spectrograms, which are also called sonograms(4) or respirosonograms, when applied to respiratory sounds(3), have been widely used for auscultation teaching, lungsound researching and evaluation of techniques for theprocessing of respiratory sounds (3,14-19). However, theirapplications are usually restricted to the visualization ofthe spectral information of lung sounds. Since wheezesare musical or continuous abnormalities (3), their pres-ence demonstrates a typical picture in the spectrogram. Inthis image, a wheeze shows continuous horizontal lines,representing the time interval of the main frequency, andthe presence of other horizontal lines representing thefrequency spectra that compose the wheeze, being usu-ally harmonic frequencies of the main frequency.
The aim of the present study was to develop a methodfor recognizing lung sounds by applying techniques ofimage processing based on a normalized spectrogramobtained from lung sounds. The proposed method in-creases the visualization of wheezing picture characteris-tics and uses them as the input to an artificial neuralnetwork-based pattern recognition system, which classi-fies sounds as being with or without wheezes.
Material and Methods
The proposed technique consists of a dynamic struc-ture developed to extract the parameters, which define thewheezing characteristics, eliminating the redundant or in-expressive data, and applying the pattern recognition al-gorithm itself. In order to implement and test the proposedmethodology, computer software was developed. The soft-ware was implemented using the C++ language. It acceptsonly lung sounds recorded in wave files and generatesspectrograms in bitmap format. The flowchart of the soft-ware is shown in Figure 1. It may be divided into fourblocks: 1) pre-processing of the lung sounds digitally re-corded, 2) the generation of a spectrogram, 3) digitalimage processing of the generated spectrogram, and 4)pattern recognition. All of these blocks are detailed below.
Pre-processingInitially, the audio file containing the recording of a
specific lung sound is opened and read. Since the softwarewas developed with the purpose of testing the describedtechnique, the respiratory sounds were processed off-lineafter being recorded. After the file reading procedure, the

676
Braz J Med Biol Res 42(7) 2009
R.J. Riella et al.
www.bjournal.com.br
samples of the digital recording from the respiratory soundsignal are stored in an array that will serve as data sourcefor analysis.
The main procedure for information extraction fromdigitally recorded lung sounds in this study is the spectro-gram generation and processing. The spectrogram is thematrix obtained from the application of a short time Fouriertransform (STFT) (16,20) to a one-dimensional signal.This processing technique generates images from sounds,expressing graphically the sound frequency componentsand the time location where these frequency componentsoccur. However, to ensure that the same spectrogramcharacteristics will be obtained from different types ofrecordings, a normalization process is required.
Digitally recorded lung sounds are discrete signals,being processed in a discrete system. Therefore, someproperties of these signals must be normalized in order toensure that the results will not change with signals re-corded in different settings. These properties are directlyrelated to the signal’s spectral information. As described inthe Nyquist theorem (21), the spectral information con-tained in a sampled signal is limited to the frequencybandwidth from 0 to the sample frequency’s half. Thus, the
fast Fourier transform (FFT) (20), which is the algorithmused in the STFT spectral computation, will reflect thisfrequency bandwidth. Its spectral resolution is defined bythe highest spectral component divided by the FFT width,and a maximum frequency point equal to the maximumfrequency contained in this bandwidth. Therefore, digitalrecordings with different sample rates generate FFTs withdifferent spectral resolution and, consequently, spectro-grams with different figures. Thus, to ensure that the pro-posed algorithm generates equal results for signals re-corded with different sample rates, it is necessary to imple-ment a sample rate normalization routine, which may beconsidered to be the main algorithm of the pre-processingprocedure.
The original sample rate is initially detected to imple-ment the sample rate normalization. If this sample rate ishigher than 9 kHz a down-sample algorithm is applied tothe signal in order to change this property to this normal-ized value. This down-sample algorithm initially computesa low-pass filter with a cut-off frequency of 4 kHz, accord-ing to the original sampling frequency, and applies it to thesignal. This filter works as a second anti-aliasing filter, withthe objective of limiting the original signal’s frequency
Figure 1.Figure 1.Figure 1.Figure 1.Figure 1. Flowchart of the soft-ware described here to imple-ment the proposed methodologyfor automatic wheezing recogni-tion. FIR = finite impulse re-sponse digital filter; IIR = infiniteimpulse response digital filter.
677
Braz J Med Biol Res 42(7) 2009
Methodology for detecting the presence of wheezing
www.bjournal.com.br
bandwidth and allows a reduction of sample frequency.After the filtering process, the signal is down-sampled to 9kHz. As all recordings used to validate this algorithm wererecorded with a sampling frequency higher than 9 kHz,only a down-sample algorithm was implemented.
Since the purpose of the proposed method is therecognition of wheezing in lung sounds extracted from anysource, another careful procedure must be followed toeliminate other types of contaminating signals, which maybe seen in the spectrogram and may lead to misinterpreta-tions. These signals, containing low-frequency compo-nents, are located spectrally in a lower region when com-pared to the wheeze spectra, and may be generated heartsounds and other types of continuous adventitious soundssuch as rhonchus. In order to eliminate these signals, ahigh-pass filter was built. For this specific application, aButterworth filter was designed. The digital filters used inthe pre-processing procedure were a 100-tap finite im-pulse response low-pass filter with 4 kHz of cut-off fre-quency and an infinite impulse response high-pass third-order Butterworth filter with 20 Hz of cut-off frequency.Since at this point the sample frequency is already normal-ized, the filter coefficients are set to the sample frequencyof 9 kHz.
Thus, after running the pre-processing procedure, thespectrogram may be generated, and it is certain that anytype of lung sounds recorded with sample frequenciesequal to or higher than 9 kHz will generate the same
frequency range in the spectrogram.
Spectrogram generationSpectrograms are the figures generated by the appli-
cation of the STFT theorem (20). The theorem states thatthe spectrum variation of a non-stationary signal, whichmay not be seen by a single Fourier analysis, may begenerated by segmenting this signal into slices, which areconsidered stationary, and by computing the Fourier trans-formation of these slices. In this way, the STFT may bedefined by Equation 1, where x(t) is the signal in the timedomain, w(t) defines the window function, and τ is the timelocalization of the STFT.
(Equation 1)
In a discrete system, the STFT may be implemented bysegmenting the signal samples into groups and computingthe FFT of such groups. In the spectrogram computation,we used 1024-point FFTs with a Hamming window and60% overlap. The matrix resulting from the computationgenerates a three-dimensional figure, representing time,frequency and magnitude of the analyzed signal. Thisfigure is usually represented by a three-dimensional graphthat composes an image, where time is usually repre-sented on the X-axis, and the Y-axis shows the frequencyand the magnitude, which are represented by a color or
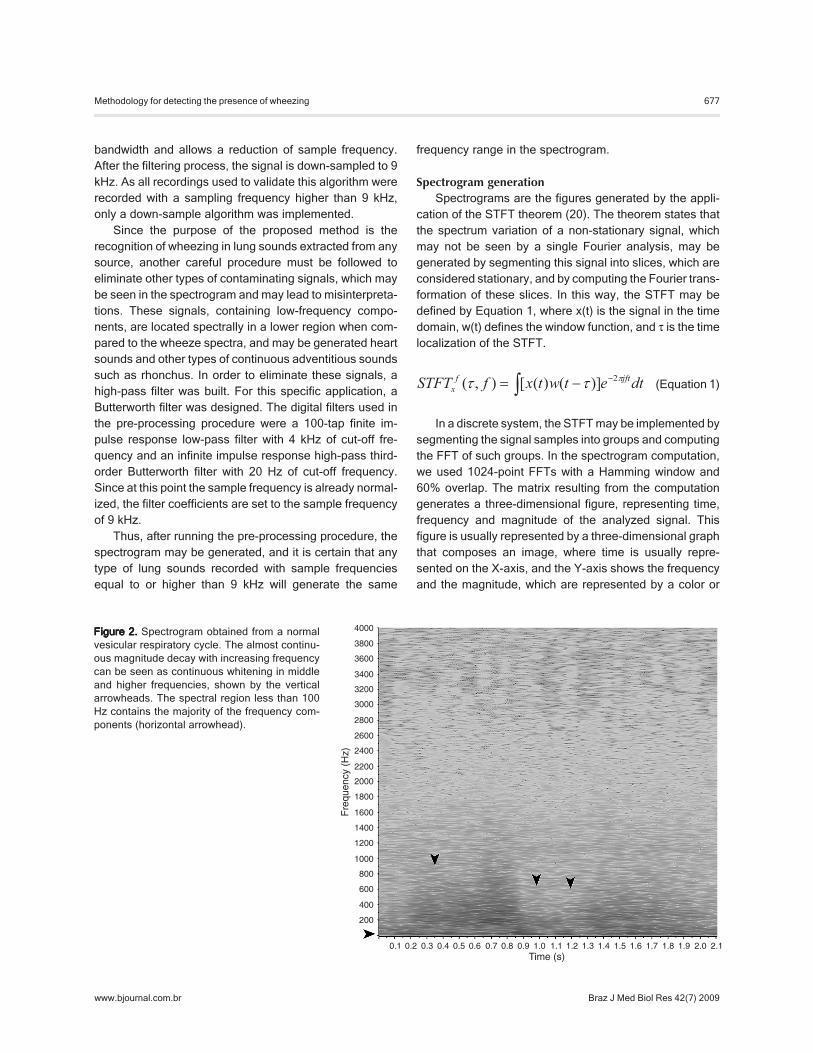
Figure 2.Figure 2.Figure 2.Figure 2.Figure 2. Spectrogram obtained from a normalvesicular respiratory cycle. The almost continu-ous magnitude decay with increasing frequencycan be seen as continuous whitening in middleand higher frequencies, shown by the verticalarrowheads. The spectral region less than 100Hz contains the majority of the frequency com-ponents (horizontal arrowhead).
678
Braz J Med Biol Res 42(7) 2009
R.J. Riella et al.
www.bjournal.com.br
grey scale. The resulting spectrogram image presentsdifferent characteristics according to the kind of adventi-tious sound contained in the respiratory cycle.
Normal lung sounds are basically formed by the sound ofthe airflow in the airways, usually contaminated by heartsounds. Thus, spectrograms of these sounds usually pres-ent a continuous magnitude decay from lower to higherfrequencies and higher spectral components in the regionlower than 100 Hz, with these components being related tothe heart sounds. These characteristics are shown in Figure2, which is a spectrogram of a normal vesicular sound.
The musical wheezing characteristics are determinedby the fundamental frequency and its harmonics, over100 Hz, and with a duration longer than 100 ms as de-
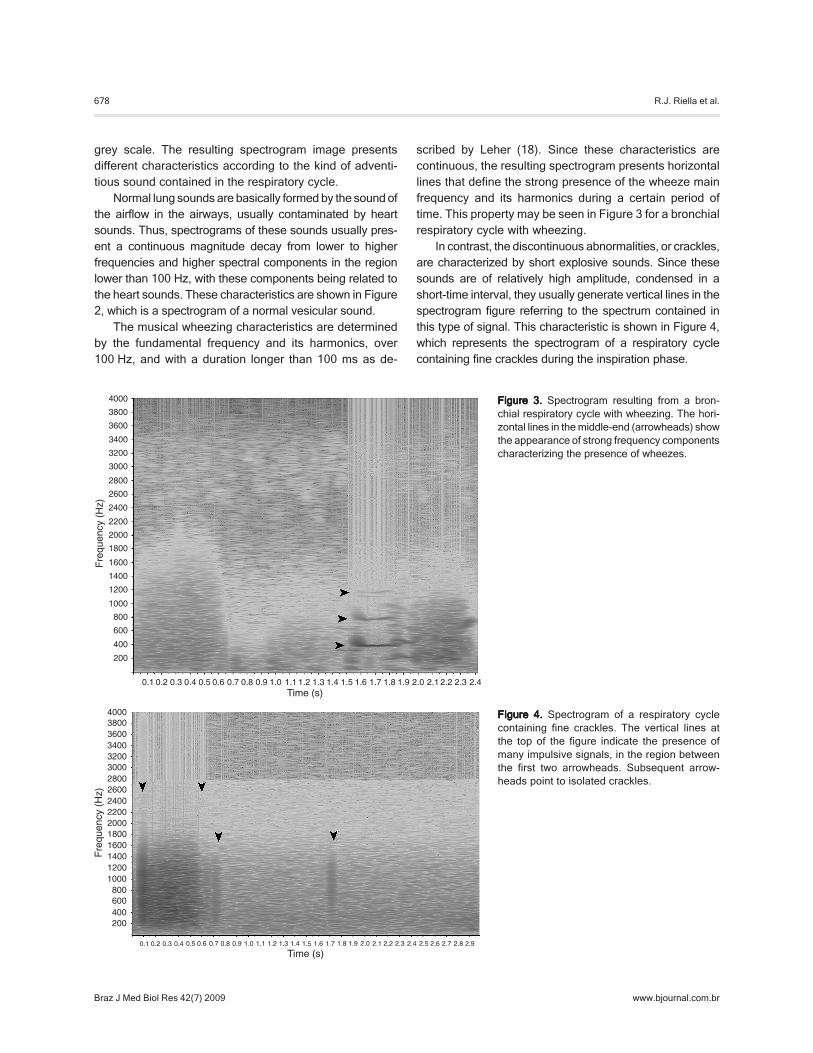
Figure 3.Figure 3.Figure 3.Figure 3.Figure 3. Spectrogram resulting from a bron-chial respiratory cycle with wheezing. The hori-zontal lines in the middle-end (arrowheads) showthe appearance of strong frequency componentscharacterizing the presence of wheezes.
Figure 4.Figure 4.Figure 4.Figure 4.Figure 4. Spectrogram of a respiratory cyclecontaining fine crackles. The vertical lines atthe top of the figure indicate the presence ofmany impulsive signals, in the region betweenthe first two arrowheads. Subsequent arrow-heads point to isolated crackles.
scribed by Leher (18). Since these characteristics arecontinuous, the resulting spectrogram presents horizontallines that define the strong presence of the wheeze mainfrequency and its harmonics during a certain period oftime. This property may be seen in Figure 3 for a bronchialrespiratory cycle with wheezing.
In contrast, the discontinuous abnormalities, or crackles,are characterized by short explosive sounds. Since thesesounds are of relatively high amplitude, condensed in ashort-time interval, they usually generate vertical lines in thespectrogram figure referring to the spectrum contained inthis type of signal. This characteristic is shown in Figure 4,which represents the spectrogram of a respiratory cyclecontaining fine crackles during the inspiration phase.
679
Braz J Med Biol Res 42(7) 2009
Methodology for detecting the presence of wheezing
www.bjournal.com.br
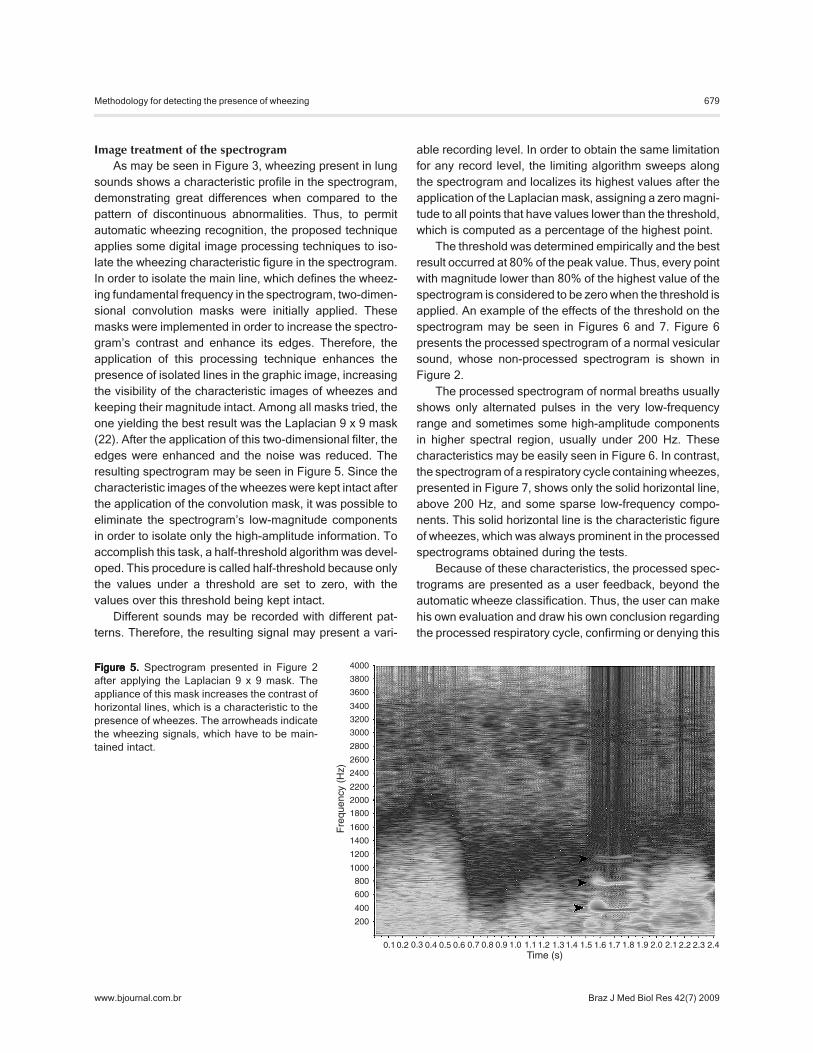
Figure 5.Figure 5.Figure 5.Figure 5.Figure 5. Spectrogram presented in Figure 2after applying the Laplacian 9 x 9 mask. Theappliance of this mask increases the contrast ofhorizontal lines, which is a characteristic to thepresence of wheezes. The arrowheads indicatethe wheezing signals, which have to be main-tained intact.
Image treatment of the spectrogramAs may be seen in Figure 3, wheezing present in lung
sounds shows a characteristic profile in the spectrogram,demonstrating great differences when compared to thepattern of discontinuous abnormalities. Thus, to permitautomatic wheezing recognition, the proposed techniqueapplies some digital image processing techniques to iso-late the wheezing characteristic figure in the spectrogram.In order to isolate the main line, which defines the wheez-ing fundamental frequency in the spectrogram, two-dimen-sional convolution masks were initially applied. Thesemasks were implemented in order to increase the spectro-gram’s contrast and enhance its edges. Therefore, theapplication of this processing technique enhances thepresence of isolated lines in the graphic image, increasingthe visibility of the characteristic images of wheezes andkeeping their magnitude intact. Among all masks tried, theone yielding the best result was the Laplacian 9 x 9 mask(22). After the application of this two-dimensional filter, theedges were enhanced and the noise was reduced. Theresulting spectrogram may be seen in Figure 5. Since thecharacteristic images of the wheezes were kept intact afterthe application of the convolution mask, it was possible toeliminate the spectrogram’s low-magnitude componentsin order to isolate only the high-amplitude information. Toaccomplish this task, a half-threshold algorithm was devel-oped. This procedure is called half-threshold because onlythe values under a threshold are set to zero, with thevalues over this threshold being kept intact.
Different sounds may be recorded with different pat-terns. Therefore, the resulting signal may present a vari-
able recording level. In order to obtain the same limitationfor any record level, the limiting algorithm sweeps alongthe spectrogram and localizes its highest values after theapplication of the Laplacian mask, assigning a zero magni-tude to all points that have values lower than the threshold,which is computed as a percentage of the highest point.
The threshold was determined empirically and the bestresult occurred at 80% of the peak value. Thus, every pointwith magnitude lower than 80% of the highest value of thespectrogram is considered to be zero when the threshold isapplied. An example of the effects of the threshold on thespectrogram may be seen in Figures 6 and 7. Figure 6presents the processed spectrogram of a normal vesicularsound, whose non-processed spectrogram is shown inFigure 2.
The processed spectrogram of normal breaths usuallyshows only alternated pulses in the very low-frequencyrange and sometimes some high-amplitude componentsin higher spectral region, usually under 200 Hz. Thesecharacteristics may be easily seen in Figure 6. In contrast,the spectrogram of a respiratory cycle containing wheezes,presented in Figure 7, shows only the solid horizontal line,above 200 Hz, and some sparse low-frequency compo-nents. This solid horizontal line is the characteristic figureof wheezes, which was always prominent in the processedspectrograms obtained during the tests.
Because of these characteristics, the processed spec-trograms are presented as a user feedback, beyond theautomatic wheeze classification. Thus, the user can makehis own evaluation and draw his own conclusion regardingthe processed respiratory cycle, confirming or denying this

680
Braz J Med Biol Res 42(7) 2009
R.J. Riella et al.
www.bjournal.com.br
automatic classification.At this point, the presence of wheezing in an analyzed
respiratory cycle may be easily seen, although a reductionof the amount of data is required in order to apply theautomatic pattern recognition module. Therefore, to per-form this data reduction, the mean spectral projection iscomputed from the processed spectrogram, and its resultis stored in an array. The graph obtained from this projec-tion is illustrated in Figure 8, which corresponds to the
processed spectrogram in Figure 7. When this array pre-sents high and isolated magnitudes, characterized as edgesover 100 Hz (3), it may be assumed that there is a highisolated frequency component and that the signal presentsa high probability of the presence of wheezes. Thus, theten largest edges of the array are located and their fre-quency and amplitude values are stored in order to beused as data source for an artificial neural network-basedpattern recognition module.
Figure 6.Figure 6.Figure 6.Figure 6.Figure 6. Spectrogram of a normal vesicularsound, presented in Figure 2, after applying theLaplacian 9 x 9 mask and threshold. After thisprocessing, only a few spectral components re-main in the figure, all of them located in the lowfrequency region (arrowheads).
Figure 7.Figure 7.Figure 7.Figure 7.Figure 7. Spectrogram presented in Figure 3 af-ter applying the Laplacian 9 x 9 mask and thresh-old. The arrowhead points to the horizontal line,which represents the wheeze’s main frequencythat was maintained intact after processing.

681
Braz J Med Biol Res 42(7) 2009
Methodology for detecting the presence of wheezing
www.bjournal.com.br
Pattern recognitionSince the lung sound patterns vary widely among dif-
ferent recording techniques and subjects, a pattern recog-nition module based on an artificial neural network wascreated to classify the analyzed input data as containingwheezing or not.
The multilayer perceptron neural network contains 20inputs. Each input corresponds to the frequency and am-plitude of the 10 largest edges of the mean frequency fromthe processed spectrogram, 41 neurons in the hiddenlayer and 2 neurons in the output layer. The number ofneurons in the hidden layer was defined as 2n + 1, wheren represents the number of inputs (23) and the number ofneurons in the output layer corresponds to the number ofclassification patterns.
The selected activation function for all neurons in theartificial neural network was the hyperbolic tangent. Thisfunction was chosen because of its sigmoid shape, havinga magnitude variation between -1 and 1. Another advan-tage of this activation function is the fact that it may bederivable, which is a requirement when using the back-propagation algorithm. However, the use of this activationfunction requires the observation of some properties. Asthe valid region of this sigmoid is restricted between ap-proximately -7 and 7, it is necessary to keep the weightsand the bias magnitudes lower enough, so that the inducedlocal field does not present a value outside this interval. Toavoid an under- and over-saturation of the activation func-tion, a data normalization technique was applied to thefrequency and magnitude values used as data source forthe artificial neural network.....
Since the frequency values may vary from 0 to 4000
Hz, limited by the new anti-aliasing filter in the pre-process-ing phase, all the frequency points were divided by 1000,reducing the interval from zero to 4. The values of theaverage amplitude of the pixel may range from zero to 255.Thus, during the normalization process, the magnitude ofthese points was divided by 100, reducing this variationinterval from 0 to 2.55.
Forty recorded respiratory cycles were used for thetraining procedure, with 20 respiratory cycles containingwheezes and 20 respiratory cycles containing normal lungsounds and respiratory cycles with other types of continu-ous and discontinuous anomalies.
The proposed method was validated using 28 differentrecordings from different individuals ranging from newbornbabies to 76-year-old subjects. The recordings were avail-able in the internet repositories (19,24,25). Generally, therepositories do not indicate the recording standards. Fromthe disposable resources, only PixSoft (19) presents thisinformation. The recordings made by them (19) used con-tact accelerometers and a sample frequency of 10 kHz.
Since the number of respiratory cycles in each record-ing may vary from one to eleven, the total respiratorycycles analyzed were 112, 40 of them with and 72 withoutwheezes.
Results
When all respiratory sounds were evaluated separately,without establishing a relation between the lung sound andthe volunteer, the algorithm presented the results shown inTable 1. Positive values were computed when the techniqueresulted in a positive value for respiratory cycles containing
Figure 8.Figure 8.Figure 8.Figure 8.Figure 8. Spectral projectionof the processed spectro-gram. The arrowhead pointsto the isolated high amplitudevalue resulted from the pres-ence of an isolated frequency,which is the wheeze’s mainfrequency.

682
Braz J Med Biol Res 42(7) 2009
R.J. Riella et al.
www.bjournal.com.br
wheezes and negative values were computed when thetechnique returned a negative value for respiratory cycleswithout wheezes. In contrast, false-positive values werecomputed when a positive value occurred for respiratorycycles without wheezes and false-negative values werecomputed when a negative value occurred for respiratorycycles containing wheezes. The total accuracy was com-puted by adding the positive and negative values.
The performance of the algorithm developed for theanalysis of isolated respiratory cycles was made in termsof sensitivity (se), specificity (sp) and performance (per) asdefined by Equations 2 to 4. These analyses resulted in asensitivity value of 0.861, a specificity value of 0.825 and atotal performance of 84.28%.
(Equation 2)
(Equation 3)
(Equation 4)
For each volunteer, the mean matching index for allrespiratory cycles was computed. When the number ofaccurate determinations and errors was equal, the resultwas computed as undefined. The resulted performance ofthe algorithm for this analysis was a total accuracy of 26(92.86%), with an error of 1 (3.57%) and one result consid-ered as undefined (3.57%).
Discussion
The main principle, which motivated the developmentof the proposed methodology, is the characteristic figuregenerated in the spectrogram from the respiratory cyclescontaining wheezes. Since this type of adventitious soundis composed basically of a fundamental frequency and its
harmonics, these frequencies appear as a horizontal linein the spectrogram. Based on this characteristic, the pro-posed methodology enhances the wheeze in a visual way,applying image processing techniques to the spectrogramand using them as a data source for an automatic patternrecognition system.
In a qualitative analysis, all processed spectrograms ofrespiratory cycles containing wheezes showed a charac-teristic figure formed by a horizontal line, which may easilydetermine the presence of wheezes in a visual analysis.
Concerning the automatic recognition module, the bestartificial neural network proved to be very robust, present-ing dispersed errors in the analyzed set. This fact indicatesthat it is not possible to assert, in the tested sound domain,which type of specific sound may generate a higher num-ber of recognition errors. This fact is confirmed by the factthat only one example of normal bronchial sound pre-sented error in the general diagnosis.
The computation time needed for the generation andprocessing of the spectrogram is an important feature ofthe viability of the proposed technique. In the proposedapplication, the spectrogram generation, filtering and limit-ing may require more than 5 s for a 2-s respiratory cycle.The computing time is acceptable for off-line analysis, butthe algorithms must be optimized to allow real-time recog-nition. However, as the purpose of the software was only totest the effectiveness of the proposed methodology, pro-cedures for time optimization were not implemented. There-fore, it would be possible to reduce this processing time byrefining the computational procedures of the proposedalgorithms, which might allow real time analysis. Thoseprocedures are out of the scope of the present study, andwill be implemented later.
The developed algorithm was conceived to return notonly an automatic diagnosis, but also the processed spec-trogram containing the wheezing figure, in order to allow theuser to draw his own conclusions about the results obtained.According to the figures and the values obtained for theautomatic recognition system, the analysis allows the con-clusion that the proposed technique is robust and trustwor-thy for use as support for the detection of wheezing in lungsounds, mainly when the analysis is performed throughseveral respiratory cycles recorded from the same patient.
The results presented here were the best score for 10neural networks that had been trained. The distinctionamong these neural networks was only the training group.To achieve these results, the “without wheezing” grouphad to present several elements from different normal andabnormal lung sounds.
The values obtained from the artificial neural networkcould not be compared to those presented by some investi-
Table 1.Table 1.Table 1.Table 1.Table 1. Results of isolated respiratory cycle analysis.
Absolute Percentage
Positive (p) 33 29.47%Negative (n) 62 55.36%False positive (fp) 10 8.92%False negative (fn) 7 6.25%Total 112 100.00%Total accuracy 95 84.82%

683
Braz J Med Biol Res 42(7) 2009
Methodology for detecting the presence of wheezing
www.bjournal.com.br
gators who had proposed to develop systems for lung soundrecognition due to different points of view adopted in theevaluation of the results obtained. Oud and Doijes (17),based on the analysis of respiratory sounds, classified theirpatients as healthy or asthmatic. The results reported byKandaswamy et al. (13) were closer to those reported here.In their investigation, the respiratory cycles were divided intosix groups: normal, wheeze, crackle, squawk, stridor, andrhonchus. The results presented in their paper, obtainedfrom an artificial neural network chosen from a set of sixartificial neural networks trained, were 94.02% accuracy forgroup validation and 91.67% mean efficiency for recogni-tion. Therefore, despite the fact that the present study re-sulted in a high recognition index, the results presented inRef. 13 have a larger number of classification categories.
The results computed here did not show differencesregarding patient age, body transducer position or recordingmethod. However, errors may occur when the recordedsounds contain specific frequency noise. Also, errors mayoccur when the signal is filtered before the recording and thefiltering process favors frequencies higher than 200 Hz.
The proposed technique was developed with the pur-pose of creating not only a recognition system, but also aneffective algorithm that could support physicians in the
diagnosis of lung diseases. The algorithm returns not onlyan indication of the diagnosis but also processed data tothe user. Thus, the user may reach conclusions by analyz-ing these data by himself. For this application, the treatedspectrogram is displayed on the computer screen beforethe automatic recognition.
The results obtained during the tests indicate that thistechnique may be useful in clinical diagnosis, mainly whenthe analysis can be performed continually using manyrespiratory cycles from the same patient. However, thealgorithm still needs to automatically detect the respiratorycycle limits, finding its beginning and end.
Finally, the novel technique presented here is a firststep in the creation of an automatic lung sound analyzerthat may be quite useful to increase the accuracy andspeed of clinical diagnosis.
Acknowledgments
We are indebted to Professor Álvaro Luiz Stelle (inmemoriam) for his knowledge that he shared with us andsupport for the development of this research program. Wethank the RALE repository for allowing us to use therecordings contained in its software.
References
1. Anuário Estatístico da Saúde no Brasil. Ministério da Saúdehttp://portal.saude.gov.br/saude/aplicacoes/anuario2001/index.cfm; 2001.
2. Murphy RLH. A simplified introduction to lung sounds.Wellesley Hills: Stethophonics; 1977.
3. Pasterkamp H, Kraman SS, Wodicka GR. Respiratorysounds. Advances beyond the stethoscope. Am J RespirCrit Care Med 1997; 156: 974-987.
4. Sovijärvi ARA, Dalmasso F, Vanderschoot J, Malmberg LP,Righini G, Stoneman SAT. Definition of terms for applicationof respiratory sounds. Eur Respir Rev 2000; 10: 597-610.
5. Kiyokawa H, Yonemaru M, Horie S, Kasuga I, Ichinose Y,Toyama K. Detection of nocturnal wheezing in bronchialasthma using intermittent sleep tracheal sounds recording.Respirology 1999; 4: 37-45.
6. Bentur L, Beck R, Shinawi M, Naveh T, Gavriely N. Wheezemonitoring in children for assessment of nocturnal asthmaand response to therapy. Eur Respir J 2003; 21: 621-626.
7. Martinez FD, Wright AL, Taussig LM, Holberg CJ, HalonenM, Morgan WJ. Asthma and wheezing in the first six yearsof life. The Group Health Medical Associates. N Engl J Med1995; 332: 133-138.
8. Atta JA, Nunes MP, Fonseca-Guedes CH, Avena LA,Borgiani MT, Fiorenza RF, et al. Patient and physician evalu-ation of the severity of acute asthma exacerbations. Braz JMed Biol Res 2004; 37: 1321-1330.
9. Alencar AM, Buldyrev SV, Majumdar A, Stanley HE, Suki B.Avalanche dynamics of crackle sound in the lung. Phys RevLett 2001; 87: 088101.
10. Forgacs P. Crackles and wheezes. Lancet 1967; 2: 203-205.
11. Sovijärvi ARA, Malmberg LP, Charbonneau G, Vander-schoot J, Dalmasso F, Sacco C, et al. Characteristics ofbreath sounds and adventitious respiratory sounds. EurRespir Rev 2000; 10: 591-596.
12. Abella M, Formolo J, Penney DG. Comparison of the acous-tic properties of six popular stethoscopes. J Acoust Soc Am1992; 91: 2224-2228.
13. Kandaswamy A, Kumar CS, Ramanathan RP, JayaramanS, Malmurugan N. Neural classification of lung sounds us-ing wavelet coefficients. Comput Biol Med 2004; 34: 523-537.
14. Taplidou SA, Hadjileontiadis LJ. Wheeze detection basedon time-frequency analysis of breath sounds. Comput BiolMed 2007; 37: 1073-1083.
15. Taplidou SA, Hadjileontiadis LJ. Nonlinear analysis ofwheezes using wavelet bicoherence. Comput Biol Med2007; 37: 563-570.
16. Charbonneau G, Ademovic E, Cheetham BMG, MalmbergLP, Vanderschoot J, Sovijärvi ARA. Basic techniques forrespiratory sound analysis. Eur Respir Rev 2000; 10: 625-635.

684
Braz J Med Biol Res 42(7) 2009
R.J. Riella et al.
www.bjournal.com.br
17. Oud M, Doijes EH. Automated breath sound analysis. Pro-ceedings of 18th Annual International Conference of IEEEEngineering in Medicine and Biology Society. Amsterdam:1996. p 990-992.
18. Leher S. Understanding lung sounds. 3rd edn. New York:Saunders; 2002.
19. PixSoft. The RALE repository. http://www.rale.ca.20. Cohen L. Time-frequency analysis. 1st edn. Englewood
Cliffs: Prentice-Hall; 1995.21. Haykin S, Van Veen B. Signals and systems. 1st edn. New
York: John Wiley & Sons; 1998.22. Myler HR, Weeks AR. Computer Imaging recipes in C.
Upper Saddle River: Prentice-Hall; 1993.23. Haykin S. Neural networks: a comprehensive foundation.
2nd edn. Englewood Cliffs: Prentice-Hall; 1999.24. Ausculta pulmonar. http://orbita.starmedia.com/medbahia/
pulmonar.htm.25. S. Louie. IMD 420-C review of lung sounds. http://medocs.
ucdavis.edu/IMD/420C/sounds/lngsound.htm.


![R.j.194 reglam.regimen.discipl.[1]](https://img.dokumen.tips/doc/110x75/58ecc0bb1a28abaa188b45c7/rj194-reglamregimendiscipl1.jpg)