Embed Size (px)
Citation preview

River Forum Building I & II Materials Assessment™
Prepared for River Forum Building I & II & Republic Services, Inc.
Moonrose Doherty Materials Assessment Manager
Ashley Donald Project Lead
March 5th, 2015
Community Environmental Services
Portland State University
PO Box 751 – CES
Portland, OR 97207


Contents Section 1: Background 1
River Forum’s Current Diversion Program 1
Section 2: Methods 3
Section 3: Observations 6
River Forum I 6
River Forum II 7
Section 4: Findings 8
River Forum I 8
River Forum II 10
Section 5: Multi-year Comparison 11
Section 6: Recommendations 13
Section 7: Materials Assessment Photos 14
River Forum I 14
River Form II 16
Section 8: Glossary of Material Categories 18
Appendix A: Shorenstein Realty, LLC Business Waste Characterization Report, River Forum, 2010 20

River Forum Building I & II : Materials Assessment 1
Section 1: Background
In December of 2014, Republic Services Inc. con-
tacted Community Environmental Services (CES),
a research and service unit at Portland State Uni-
versity (PSU), on behalf of River Forum Building I
& II (River Forum) with a request to conduct a re-
assessment of materials from River Forum I lo-
cated at 4380 SW Macadam Ave, Portland, Ore-
gon in Multnomah County. Additionally, Republic
Services requested a first assessment of River Fo-
rum II, located at 4386 SW Macadam Ave., Port-
land, Oregon.
The first assessment of River Forum I was con-
ducted by CES on December 8, 2010 (Appendix A:
Shorenstein Realty, LLC Business Waste Charac-
terization Report, River Forum, 2010). River Fo-
rum is half of John’s Landing, a 4-building office
campus, constructed between 1945 and 1985. The
four (4) buildings are operated under Shorenstein
Realty Services.
River Forum I and II were completed in 1985. River
Forum I is a five (5) story office building comprised
of 156,046 square feet. River Forum II is a four (4)
story office building comprised of 39,388 square
feet. River Forum is exclusively a business com-
plex with tenant parking available on two under-
ground levels. The building also offers tenants
two conference rooms, an exercise facility, and
on-site storage. River Forum Café and Studio One
Hair Salon are located on campus as well.
The objectives of the current materials assess-
ment are as follows:
1. Determine the composition of the landfill-bound materials stream by conducting a materials assessment. The assessment provides a snapshot of the waste material composition and daily activities of each building, and covers a time period that re-flects typical operations.
2. Assess the landfill-bound materials by hand sorting the materials into specific categories, weighing the sorted materials, recording the data, and making quantita-tive and qualitative observations.
3. Provide an objective, third party assess-ment of waste diversion practices based on examination of the landfill-bound ma-terial stream from the building.
4. Compare the results from the current ma-terial assessments to the materials assess-ments conducted in 2010.
5. Develop recommendations regarding im-proving waste materials diversion, en-hanced materials capture, and reductions in materials consumption based on the findings from the assessment.
River Forum’s Current Diversion Program
Shorenstein Properties LLC, which has publicly
stated their commitment to creating environ-
mentally conscious real estate, created a sustain-
ability committee, G.R.E.E.N. or Green Real Es-
tate Environments Now, primarily to focus on
greenhouse gas emissions via electricity expendi-
tures. The building has achieved an Energy Star
certification, which Shorenstein continues to

Community Environmental Services | March 5th, 2015 2
maintain through their “Green Tip of the Month”
program.
Republic Services collects River Forum’s three (3)
4-yard containers of landfill-bound materials
Mondays, Wednesdays, and Fridays. Additionally,
Republic Services collects the building’s one (1) 5-
yard container of commingled recycling on Mon-
day, six (6) 65-gallon commingled recycling on
Mondays and Thursdays, one (1) 95-gallon con-
tainer for glass bottles and jars for recycling once
a week on Mondays, and one (1) 95-gallon con-
tainer for E-waste recycling on Mondays.
The building’s internal materials collection sys-
tems includes desk side and centrally located re-
cycling stations in each office. Employees are re-
sponsible for emptying co-mingled recycling into
the larger recycling containers within each office
suite. Glass recycling is to be collected by each of-
fice suite and emptied by janitorial crew on an “as
needed basis”. Small desk side waste receptacles
are provided and are collected five nights a week,
Sunday through Thursday, by janitorial staff.
River Forum does not currently have compost col-
lection, however the service is available through
their current hauler, Republic Services.
The current diversion programs of River Forum
Café and Studio One Hair Salon are unclear and
information on their collection systems or diver-
sion practices was not provided.
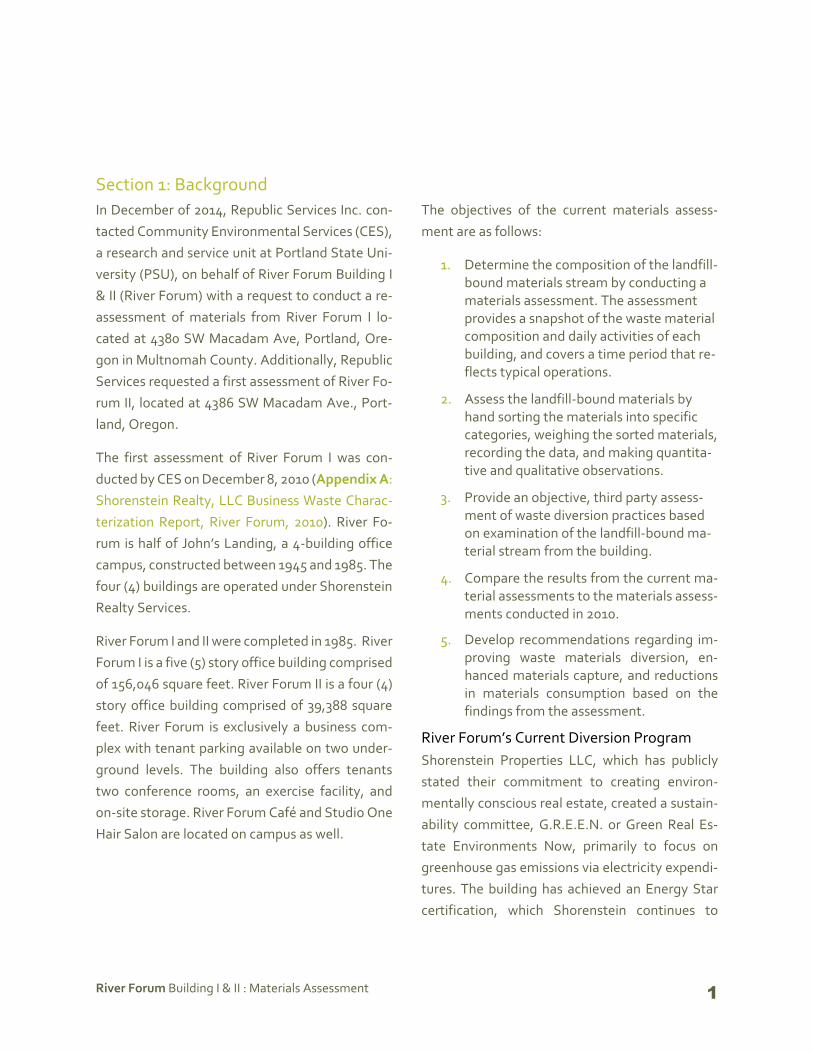
Image 1.1: River Forum I pre-sort Image 1.2: River Forum II pre-sort

River Forum Building I & II : Materials Assessment 3
Section 2: Methods
The materials assessment was conducted on
Wednesday, February 11th, 2015 by CES staff at
the Willamette Resources Inc. (WRI) transfer sta-
tion, located at 10295 SW Ridder Rd., Willsonville,
Oregon. The material load consisted of landfill-
bound materials generated during one (1) busi-
ness day at River Forum (Tuesday. February 10th)
and was delivered to the site by River Forum’s
commercial hauler, Republic Services.
The total of River Forum’s landfill-bound load,
consisting of both River Forum I and River Forum
II, weighed 0.42 tons (840 pounds), as reported by
the WRI scale house. CES sorted 144.13 pounds
which, by weight represents 17% of the total land-
fill-bound load.
The materials assessment was conducted in the
following phases:
1. Visual assessment of the load and pre-sorting and removal of anomalies or loose materials
A visual assessment of the load was done
to understand the overall composition of
the load and to look for any anomalies. All
anomalies or loose materials, such as the
paint bucket were pulled from the load and
documented. Of these extracted materials,
10% by volume were selected for the anal-
ysis.
2. Extract the 10% by volume representative sample
After anomalies and loose materials were
removed, a representative sample of the
bagged waste was randomly selected for
hand sorting.
3. Hand-sort the bagged waste
The contents of the bagged waste; were
hand-sorted into various material catego-
ries, detailed in Table 2.1 and Table 2.2 re-
spectively. Restroom waste or other mate-
rials deemed to be hazardous were not
hand-sorted and were individually
weighed only.
4. Weigh materials (bagged and loose)
CES photographed and weighed all repre-
sentative sample materials, including the
hand-sorted materials, anomalies, and
bagged materials. Each material category
was weighed individually utilizing a bench
scale independently calibrated and col-
lecting weights to the nearest hundredth
of a pound.
Each material stream was grouped into four (4)
material classifications: Readily Recyclable, Com-
postable, Other Recoverable, and Non-Recover-
able. From there each material was sorted into its
proper category that lies within one of the classi-
fications. The material categories listed in Table
2.1 and Table 2.2 were chosen according to CES
standards, the scope of the work, and in coordina-
tion with the observed presence of the materials
found in the landfill-bound waste. Some of the
categories were chosen due to the material’s po-
tential for diversion options or waste reduction

Community Environmental Services | March 5th, 2015 4
opportunities associated with the specific mate-
rial.
The fifteen (15) material categories utilized for the
assessment of River Forum I are detailed in Table
2.1 and the seventeen (17) material categories uti-
lized for the assessment of River Forum II are de-
tailed in Table 2.2. The material categories are de-
pendent upon the contents documented in the
hand sorting process of the assessment. Variation
can be attributed to the tenant makeup of each
building and potentially gaps in staff education re-
garding diversion procedures.
Material categories highlighted in red in Table 2.1
and 2.2 are not a part of the signed scope of work
but were observed in the landfill-bound stream.
Visual representation of all material categories is
provided in Section 7: Material Assessment Pho-
tos and a detailed description of each material
category is provided in Section 8: Glossary of
Material Categories.
Readily Recyclable Compostable Other Recoverable Non-Recoverable
Mixed paper
Mixed metals
Plastic bottles & tubs
Glass bottles & jars
Compostable food
Food-soiled fibers
Plastic film
Rigid plastic
Reuse
Restroom waster
Diapers
True waste
Liquid
Single-use drink cups
Single-use food service ware
Vinyl wall base
Table 2.2: Material categories for River Forum II
Readily Recyclable Compostable Other Recoverable Non-Recoverable
Corrugated card-board
Mixed paper
Mixed metals
Plastic bottles & tubs
Compostable food
Food-soiled fibers
Plastic film
Rigid plastics
Restroom waste
True waste
Liquid
Single-use drink cups
Single-use food service ware
Paint bucket
Table 2.1: Material categories for River Forum I

River Forum Building I & II : Materials Assessment 5
The four (4) general material classifications, de-
fined below, take into account the existing diver-
sion opportunities in the Portland-metro region
and at River Forum:
Readily Recyclable materials include commin-gled recycling materials (corrugated card-board, mixed paper, plastic bottles and tubs, metals) and glass bottles and jars; all of which are required to be recycled by businesses under the Metro regional gov-ernment’s business recycling require-ments. (Please note that in the Metro re-gion, glass bottles and jars are recycled separately from the other readily recycla-ble materials listed. This dual-stream method of recycling allows for better quality and viability of recyclable prod-ucts as commodities). These materials are collected by River Forum’s primary com-mercial hauler, Republic Services.
Compostable materials are those that are ac-cepted under Metro’s current composta-ble materials guidelines for businesses and accepted by Republic Services’ com-post guidelines. Food scraps fall under this category and were sorted separately by CES. Additionally, intact food was sorted separately and included under the Compostable category although it should be noted that intact food also has poten-tial for diversion through food donation programs. Additionally, in March of 2015, all materials other than food scraps and approved compostable bags will be ex-cluded from the Metro-region’s commer-cial composting programs. However, due
to Republic Services composting capabili-ties at Pacific Region Compost (PRC), fi-bers such as waxed cardboard and com-postable food and beverage service ware are still being accepted by Republic Ser-vices from their commercial customers. Therefore, food-soiled fibers continues to be included in the Compostable category for the River Forum materials assessment. For more information, visit the Metro website (http://www.oregonmetro.gov/).
Other Recoverable materials are those that have the opportunity to be recycled through an expanded diversion program or an existing non-primary hauler diver-sion system.
These materials experience fluctuations in recoverability due to the volatility of global secondary commodity markets. The materials are sometimes more read-ily recyclable than at other times, such as during times of market downturns. Some materials, like rigid plastics and plastic film, are accepted by material recovery facilities in the Metro region. Please note that all other recoverable materials are unacceptable in the commingled recy-cling stream.
Non-Recoverable materials are those that cannot be diverted from the landfill through River Forum’s existing collection systems or in the Portland-metro region due to lack of markets and/or processing facilities. For analytical purposes this was divided into the following subcategories: true waste, single-use drink cups, single-use food service ware, liquid, restroom waste, and metal/fabric filters.

Community Environmental Services | March 5th, 2015 6
Section 3: Observations
The following qualitative observations were made in addition to the quantitative data gathered during
the materials assessment. The observations give an understanding of the materials being generated,
their disposal and collection methods, and an overall diversion practices. These observations were taken
into consideration and addressed when creating the recommendations listed in Section 6: Recommen-
dations.
River Forum I 1. No glass was found within the load.
2. A bag containing only corrugated cardboard and loose office paper was found. (Image 3.1)
3. Smaller bags within larger clear bags were observed frequently. (Images 3.2 and 3.3)
4. A bag containing single-use drink cups and single-use coffee pods was found. (Image 3.4).
Image 3.1: Bag of corrugated cardboard and office paper
Image 3.2: Small bags within large bags
Image 3.3: Small bags within other larger trash bags
Image 3.4: Single-use drink cups and coffee pods

River Forum Building I & II : Materials Assessment 7
River Forum II
1. No corrugated cardboard was found in the load.
2. Two (2) bags containing diapers only were found, suggesting River Forum II’s receptacle is being used for outside waste disposal. (Image 3.5)
3. A bag containing clean tin cans only was found within the load. (Image 3.6)
4. A bag containing restaurant waste was found. (Image 3.7)
5. Loose office paper was found throughout the load. (Image 3.8)
Image 3.5: Bags of diapers
Image 3.6: Bag of tin cans
Image 3.7: Materials commonly found in restaurant waste
Image 3.8: Loose office paper

Community Environmental Services | March 5th, 2015 8
Section 4: Findings
Findings and recommendations resulting from
the materials assessment of the landfill-bound
stream are cited in terms of weight in pounds.
Lighter materials such as plastic film, plastic bot-
tles and tubs and single-use drink cups can repre-
sent a large percentage of volume in the waste
stream, yet when considered by weight alone,
these materials may not appear as a significant
component of the load. By extrapolating the
weights obtained from the representative sample,
CES can approximate the composition of the en-
tire landfill-bound load. Please refer to the photos
in Section 7: Materials Assessment Photos for
visual representation.
Table 4.1 and 4.2 with the assistance of Figure 4.1
and Figure 4.2 present the weight according to
the different material categories outlined in Sec-
tion 2: Methods for the entirety of the River Fo-
rum load as separated by building. Table 4.1 and
Figure 4.1 represent the materials found within
the River Forum I load and Table 4.2 and Figure
4.2 subsequently represent River Forum II. While
the buildings collective make up River Forum,
they were left separate for comparison purposes
to the previous assessment completed, see Sec-
tion 5: Multi-year Comparison and Appendix A:
Shorenstein Realty, LLC Business Waste Charac-
terization Report, River Forum, 2010.
River Forum I
Figure 4.1 shows that 19.3% of the landfill-bound
materials could have been diverted through River
Forum I’s existing recovery systems for commin-
gled recycling (mixed paper, corrugated card-
board, plastic bottles and tubs and metals) and
glass bottle and jar recycling. Table 4.1 demon-
strates that of these readily recyclable materials,
mixed paper comprised the largest portion at
Table 4.1: River Forum I detailed material composition (by weight in pounds)
LBS %
Mixed paper 13.68 13.7%
Metals 2.55 2.6%
Plastic bottles & tubs 1.33 1.3%
Glass bottles & jars 1.70 1.7%
Total 19.26
Compostable food 23.42 23.5%
Food-soiled fibers 6.07 6.1%
Total 29.49
Reuse 7.30 7.3%
Plastic film 1.31 1.3%
Rigid plastic 1.09 1.1%
Total 9.70
Diapers 23.12 23.2%
True waste 8.05 8.1%
Vinyl wall base 3.77 3.8%
Single-use food service
ware2.91 2.9%
Restroom waste 2.26 2.3%
Single-use drink cups 0.83 0.8%
Liquid 0.44 0.4%
Total 41.38
GRAND TOTAL 99.83 100.0%
MATERIAL
Non
-rec
over
able
Rea
dily
Rec
over
able
Com
post
able
Oth
er
Rec
over
able
s

River Forum Building I & II : Materials Assessment 9
13.7% of the weight of the entire load or 71% of
the material category and indicating room for im-
provement in paper recycling capture (see Table
4.1).
Compostable food and fibers comprised 29.5% of
the landfill-bound materials. Of the other recov-
erable materials, which represented 9.7% of the
load, reuse items was the largest material cate-
gory comprising 75% of the other recoverables.
Ultimately, these materials have the potential to
be diverted from the landfill via recovery methods
not currently in place at River Forum I.
Finally, 41.5% of the load consisted of materials
without current recovery markets. The largest
category within these non-recoverable materials
was an anomaly of diapers, comprising 23.2% of
the total load. The source of the diapers is unde-
terminable however speculation remains regard-
ing this being potentially outside River Forum I’s
waste. With this anomaly removed, non-recover-
able materials weight decreases to 18.3 pounds or
23.8% of the entire load. True waste represented
19.7% of the material category with the anomaly
included.
Figure 4.1: River Forum I general material composition by percent

Community Environmental Services | March 5th, 2015 10
River Forum II
Of the landfill-bound materials, 46.5% were di-
vertible (readily recyclable, compostable, and
other recoverable materials). Figure 4.2 shows
13.4% of the landfill-bound materials could have
been diverted through River Forum II’s existing
recovery systems for commingled recycling
(mixed paper, corrugated cardboard, plastic
bottles and tubs and metals). Of the readily re-
cyclable category, mixed paper comprised the
largest portion, with 6.3% of the entire load or
47.5% of the diversion category. No glass bottles
or jars were found within the landfill bound ma-
terials suggesting full compliance with glass re-
cycling procedures or this material is infre-
quently utilized within the building.
Compostable materials comprised 31.4% of the
landfill-bound load, making it the largest diver-
sion category with potential recovery methods.
Food scraps was the largest material of this cat-
egory representing 22.9% of the entire load.
Finally, the majority of the load, 53%, consisted
of materials without current recovery markets.
The largest category within these non-recovera-
ble materials was restroom waste, which was
25.3% of the total load. Combined, single-use
drink cups and single-use food service ware was
12.3% of the material category, suggesting an
area within the non-recoverable materials which
can be made a priority focus for diversion rates,
see Section 6: Recommendations.
Table 4.2: Detailed material composition for River Forum II (by weight in pounds)
Figure 4.2: River Forum II general material
composition by percent
LBS %
Mixed paper 2.79 6.3%
Corrugated cardboard 2.53 5.7%
Plastic bottles & tubs 0.48 1.1%
Metals 0.12 0.3%
Total 5.92
Compostable food 10.16 22.9%
Food-soiled fibers 3.44 7.8%
Total 13.60
Plastic film 0.77 1.7%
Rigid plastic 0.19 0.4%
Total 0.96
Restroom waste 11.22 25.3%
Paint bucket 6.71 15.1%
True waste 2.88 6.5%
Single-use food service
ware1.93 4.4%
Single-use drink cups 0.96 2.2%
Liquid 0.12 0.3%
Total 23.82
GRAND TOTAL 44.30 100.0%
Com
post
able
Non
-rec
over
able
MATERIAL
Rea
dily
Rec
over
able
Oth
er
Reo
vera
bles

River Forum Building I & II : Materials Assessment 11
Section 5: Multi-year Comparison
Table 5.1 and Figure 5.1 compare the material
composition of the landfill-bound waste streams
in 2010 and 2015. The 2010 data is from the land-
fill-bound materials assessment completed De-
cember 8, 2010 by CES, see Appendix A: Shoren-
stein Realty, LLC Business Waste Characteriza-
tion Report, River Forum, 2010
During the 2010 assessment compostable food
and fibers were allowed in the commercial com-
posting stream so they were not separated. As
previously mentioned, starting in March 2015
(double check that date from what you say above)
compostable fibers were no longer allowed unless
materials were being hauled to Republic’s PRC fa-
cility. Because of this change, the 2015 assess-
ment separated out fibers and food to reflect
Metro’s change.
It should be noted that in order to give an accurate
comparison between the 2010 and 2015 data CES
had to reclassify and combine some material cat-
egories from the previous years’ assessments. In
2010, within the non-recoverable material cate-
gory, all drink cups were combined to provide a
better comparison to single-use drink cups in 2015.
For original classification of categories please see
Appendix A: Shorenstein Realty, LLC Business
Waste Characterization Report, River Forum,
2010.
Table 5.1: Detailed comparison by year of landfill-bound material composition: 2010 and 2015
2010 2015
% %
Mixed paper 31.3% 13.7%
Corrugated cardboard 0.4% -
Plastic bottles & tubs 2.1% 2.6%
Mixed metals 1.3% 1.3%
Glass bottles & jars 0.9% 1.7%
Total Readily Recyclable 36.1% 19.3%
Compostable food & fibers 29.2% -
Compostable food - 23.5%
Food-soiled fibers - 6.1%
Total Compostable 29.2% 29.5%
Reuse 2% 7.3%
Plastic film - 1.3%
E-waste 0.9% -
Rigid plastic - 1.1%
Total Other Recoverable 3.0% 9.7%
Restroom waste - 2.3%
Diapers - 23.2%
True waste 27.9% 8.1%
Single-use drink cups 2.1% 0.8%
Single-use food service ware 1.7% 2.9%
Vinyl wall base - 3.8%
Liquid - 0.4%
Total Non-Recoverable 31.8% 41.5%
GRAND TOTAL 100% 100%
MATERIAL

Community Environmental Services | March 5th, 2015 12
Figure 5.1 presents a comparison across two (2)
assessment years (2010 and 2015) of the material
composition of the landfill-bound loads, based on
the four (4) material classifications discussed ear-
lier in Section 2: Methods.
The overall proportion of recoverable materials in
the landfill-bound load was larger in 2015 as com-
pared to 2010 (Figure 5.1), by 1.31%. This however
was by in large due to the presence of diapers
within the load. If these were removed, the non-
recoverable material category would have de-
creased to 23.8% of the load. True waste consist-
ently made up the largest portion of this material
category when the diaper anomaly is removed for
2015.
There was the most significant decrease in the
presence of readily recyclable materials decreas-
ing from 36.1% to 19.3%. This decrease is attribut-
able to the decline in mixed paper found in the
load. Mixed paper made up 31.3% of the materials
assessed in 2010 as compared to 13.7% in 2015.
Other materials within this diversion category re-
mained relatively steady however, with the ex-
ception of corrugated cardboard which was not
found in this current materials assessment. De-
spite the decrease, readily recyclable materials
remains a tangible area for material diversion out-
reach programs.
Other recoverable materials increased to 9.7% of
the load in 2015 as compared to 3% in 2010 (Figure
5.1). This increase indicates the potential for ad-
ditional diversion programs to be implemented,
specifically a program for re-use items as it is the
only material to appear in both 2010 and 2015. Re-
use increased from 2% to 7.3% of the total load.
Compostable materials has remained constant,
with total load percentages of 29.2% and 29.5%
from 2010 to 2015 respectively (Figure 5.1). This
material category remains a prominent area for
diversion potential.
Figure 5.1: Comparison by year of landfill-bound gen-eral material composition: 2010 and 2015

River Forum Building I & II : Materials Assessment 13
Section 6: Recommendations
After analysis of the data, CES recommends the following:
Consider implementing a compost system and offering small compost bins in all office suites and centralized collection areas at River. Compostable materials made up 30.11% of River Forum’s landfill-bound load.
» Provide clearly labeled and color-coded (green) compost bins in buddied collection sys-tems in office suites.
» Provide signage that is clear and visible. Consider using illustrated and multilingual signage.
» Train custodial staff and River Forum employees on proper composting practices upon im-plementation of composting.
Target paper for increased recycling and reduction. Mixed paper made up 11.4% of the load when both River Forum I and River Forum II are combined.
» Make sure that signage pertaining to recyclable paper is clear and visible. Consider using illustrated and multilingual signage.
» Ensure that recycling containers for paper are easily accessible in central areas and copy and printer areas.
» Ensure that all employees have desk-side recycling receptacles.
» Implement double-sided printing mandates.
» Encourage electronic communication and sharing of documents rather than printed form.
Consider implementing innovative waste reduction strategies by promoting the use of durable drink cups and food service ware. Single-use drink cups and single-use service ware consisted of 5% of the total landfill-bound load of River Forum I and II combined.
» Provide durable dishes in break-rooms for employee use to reduce the use of disposable dishes for everyday use, not just special events or large group meetings.
» Consider making reusable take-out containers available to employees. Examples of reusa-ble take-out containers include Eco-Takeouts (http://ecotakeouts.com/).

Community Environmental Services | March 5th, 2015 14
Section 7: Materials Assessment Photos
River Forum I
Image 7.1: Corrugated cardboard
Image 7.2: Mixed paper
Image 7.3: Mixed metals
Image 7.4: Plastic bottles & tubs
Image 7.5: Compostable food
Image 7.6: Food-soiled fibers
Image 7.7: Rigid plastics
Image 7.8: Plastic film

River Forum Building I & II : Materials Assessment 15
Image 7.10: Restroom waste
Image 7.11: True waste
Image 7.12: Liquid
Image 7.13: Single-use drink cups
Image 7.14: Single-use food service ware
Image 7.15: Paint bucket

Community Environmental Services | March 5th, 2015 16
River Form II
Image 7.16: Mixed paper Image 7.17: Mixed paper Image 7.18: Mixed metals
Image 7.19: Plastic bottles & tubs Image 7.20: Glass bottles & jars Image 7.21: Compostable food
Image 7.22: Food-soiled fibers Image 7.23: Vinyl wall base Image 7.24: Plastic film

River Forum Building I & II : Materials Assessment 17
Image 7.25: Rigid plastics Image 7.26: Reuse Image 7.27: Restroom waste
Image 7.28: Diapers Image 7.29: True waste Image 7.30: True waste
Image 7.31: Liquid Image 7.32: Single-use drink cups Image 7.33: Single-use food service ware

Community Environmental Services | March 5th, 2015 18
Section 8: Glossary of Material Categories
Compostable food – Vegetable, fruit, grain-based food scraps, meat, fish, fat, bones, eggshells, tea bags,
and coffee grinds.
Corrugated cardboard – Corrugated boxes or sheets used for shipping and packaging materials.
Food-soiled fibers – Fibers such as paper towels, napkins, paper plates, and paper linings, which have
come in contact with food scraps and liquids.
Glass bottles and jars – Bottles and jars made of glass. This category excludes light bulbs, flat glass,
flower vases, drinking glasses, window glass, and tempered glass such as baking dishes.
Liquid – Liquids that were in containers in the load.
Mixed Metals – Containers or scraps made of aluminum, steel or tin, including containers for beverages,
food, and other materials. Empty aerosol cans, scrap metal, and clean aluminum foil are included in this
category.
Mixed paper – Includes office paper, newspaper, magazines, phonebooks, paper board/soft cardboard,
folders, scrap paper, sticky notes, shredded paper, paper bags, egg cartons, cereal boxes, aseptic con-
tainers, and all other non-corrugated cardboards.
Paint bucket– Five (5) gallon HDPE bucket previously filled with paint.
Plastic bottles and tubs – Plastic containers with a neck, including containers for beverages, other fluids;
plastic tubs of primarily food grade plastic often used for yogurt, margarine, and other food or non-food
materials, rigid plant pots larger than four inches, and plastic buckets five gallons and smaller.
Plastic film – All clean plastic film bags including grocery, zip-top, and sandwich bags. Also includes
shrink-wrap, pallet wrap, bubble wrap, and plastic films.
Restroom waste – Bathroom paper towels and other restroom related items.
Rigid plastic – Non-bottle and non-tub shaped plastics that are not accepted through the regional com-
mingled recycling programs, but are acceptable at various plastics recycling facilities in the region. This
category includes plastic pallets and spools.
Reuse – Items that may be re-used through donation to a program or by in-house programs such as for
office supplies or furniture.

River Forum Building I & II : Materials Assessment 19
Single-use drink cups – Non-durable, non-recyclable single-use cups for either hot or cold beverages.
These cups may be made of plastic, plastic-lined paper, plastic-embedded paper, or expanded polysty-
rene foam.
Single-use food service ware – Non-durable containers, plates, dishes and flatware designed for single
use and used to serve and transport food. These may be made of plastic, plastic-lined paper, plastic-em-
bedded paper, or expanded polystyrene foam.
True waste – Materials that cannot currently be diverted. These materials are known as “true waste”
because there are currently no recycling markets for these materials, and the materials are not com-
postable at local composting facilities, or the materials are not readily reused or fit for donation. Common
materials include candy wrappers, chip bags, freezer boxes, soiled textiles unfit for donation or recycling,
polyvinyl chloride items such as gift cards, credit cards, or pipe, foil and paper wrappers, and other non-
recyclable mixed material items without current recycling markets.
Vinyl wall base – Six (6) inch wide strip of vinyl material used to cover the wall base commonly in com-
mercial buildings to assist in hiding floor and wall irregularities.

Community Environmental Services | March 5th, 2015 20
Appendix A: Shorenstein Realty, LLC Business Waste Characterization Report, River Forum, 2010

PSU Community Environmental Services
Shorenstein Properties LLC, 4380 SW Macadam Avenue Page 1
Business Waste Characterization Report
Shorenstein Properties LLC Sort Date: December 8, 2010 Riverform Building, 4380 SW Macadam Avenue
Figure 1. Landfill-bound Waste Load Figure 2. Waste Sort in Progress
Background
Shorenstein Properties LLC is the property manager of the Riverform building located
at 4380 SW Macadam Avenue in Portland, OR. The building currently provides office
space for 45 tenants. In order to obtain a baseline assessment of their waste stream,
Shorenstein properties contracted Community Environmental Services (CES) to
perform a waste sort on the landfill-bound waste generation for the building.
Shorenstein offers tenants recycling of cardboard, paper, plastic and metal containers,
glass, and e-waste.
Methodology
On December 8, 2010, the Solid Waste Assessment Team of CES sorted two business
days of landfill-bound waste from the 3-cubic yard dumpsters at Riverform; one of the
three dumpsters contained waste (Figures 1 and 2). The entire 233 pound waste load
was sorted into the following twelve categories:
Corrugated Cardboard
Mixed Paper
Tin and Aluminum Cans
Plastic Bottles and Tubs
Glass Bottles and Jars
E-Waste
Compostable Food and Fibers
To-go Food Containers
To-go Coffee Containers
In-Office Single Use Cups
Non-Recyclables
Office Reuse

PSU Community Environmental Services
Shorenstein Properties LLC, 4380 SW Macadam Avenue Page 2
Findings
To give an overview of the general waste composition, the categories of materials sorted
from Riverform can be viewed as part of four general categories:
Recyclable Fibers by weight 32%;
Recyclable Containers by weight 4%;
Other Recyclables/Compostables by weight 30%;
Non-recyclables by weight 34%.
Table 1 and Figures 3 and 4 express the weight composition and percentages in the twelve categories the load was separated into. Both the findings and recommendations are cited in terms of weight, not volume. The weight of a material is not always representative of the material’s volume. Refer to Appendix A for a glossary of material categories.
Table 1
Material Type Sub Category
RECYCLABLE FIBERS
Weight (lbs) Percent
CORRUGATED CARDBOARD 1 1%
MIXED PAPERS 73 31%
Total Fibers 74 32%
RECYCLABLE CONTAINERS
TIN & ALUMINUM CANS 3 1%
PLASTIC BOTTLES & TUBS 5 2%
GLASS BOTTLES & JARS 2 1%
Total Containers 10 4%
OTHER RECYCLABLES/COMPOSTABLES
E-WASTE 2 1%
COMPOSTABLE FOOD & FIBERS 68 29%
Total Other Recyclables 70 30%
NON-RECYCLABLES
TO-GO FOOD CONTAINERS 4 2%
TO-GO COFFEE CUPS 3 1%
IN-OFFICE SINGLE USE CONTAINERS 2 1%
NON-RECYCLABLES 65 28%
OFFICE REUSE 5 2%
Total Non-Recyclables 79 34%
TOTAL 233 100%

PSU Community Environmental Services
Shorenstein Properties LLC, 4380 SW Macadam Avenue Page 3
Figure 3. General Waste Composition of Riverform Building by Weight
Figure 4. Specific Waste Composition of Riverform Building by Weight

PSU Community Environmental Services
Shorenstein Properties LLC, 4380 SW Macadam Avenue Page 4
Recommendations While Riverform tenants exhibit positive efforts to recycle appropriate materials, the findings from this waste sort suggest there are opportunities for further waste reduction and recycling. Primary recommendations of the Solid Waste Assessment Team follow.
Encourage further capture of basic materials such as mixed papers, cardboard, plastic, tin, aluminum, and glass containers. Riverform could reduce the weight of landfill-bound waste by 36% if all recyclable materails were captured successfully (Figures 5 -10 ).
o Encourage paper recycling through a positive feedback campaign in offices and ensure that correclty labeled desk side recycling bins are supplied to all tenants.
o Consider providing a periodic recycling education in-service training to custodial staff and interested tenants to ensure that recyclable and compostable materials are recognized, collected, and diverted properly.
Consider introducing a composting program; the weight of compostable materials contributed to 30% of the landfill-bound waste load (Figure 11).
Explore options and incentives to reduce the amount of “To-Go” and single-use containers being
used in the building (Figures 12-13).
Secure dumpsters to restrict dumping of household waste (Image 14).
Consider providing a communal office reuse area in the building for barely used office supplies and equipment. Usable office supplies were found in the load and during the sort, three employees stated that they frequently noticed reusable office equipment in the garbage dumpsters.

PSU Community Environmental Services
Shorenstein Properties LLC, 4380 SW Macadam Avenue Page 5
Selected Waste Sort Photos
Figure 5: Unsorted Mixed Paper Figure 6: Unsorted Mixed Paper
Figure 7: Sorted Mixed Paper Figure 8: Sorted Cardboard
Figure 9: Sorted Tin and Aluminum Cans Figure 10: Sorted Plastic Bottles and Tubs

PSU Community Environmental Services
Shorenstein Properties LLC, 4380 SW Macadam Avenue Page 6
Selected Waste Sort Photos (continued)
Figure 11: Sorted Compostable Food and Fiber Figure 12: Sorted To-Go Food Containers
Figure 13: Sorted To-Go Coffee Containers Figure 14: Sorted In-Office Single Use Cups
Figure 15: Unsorted Household Waste Figure 16: Completed Waste Sort

PSU Community Environmental Services
Shorenstein Properties LLC, 4380 SW Macadam Avenue Page 7
Appendix A: Glossary of Material Categories Corrugated cardboard – corrugated boxes or sheets used for shipping and packaging materials.
Mixed paper – Office paper, newspaper, magazines, phonebooks, paper board/soft cardboard,
folders, scrap paper, sticky notes, shredded paper, paper bags, egg cartons, cereal boxes, and
all other non-corrugated cardboards. This category also includes asceptics such as gable-top
milk and juice cartons and square-shaped cartons often used for soups or soymilk.
Tin and aluminum cans – Containers made of aluminum, steel or tin, including containers for
beverages, food, and other materials. Empty aerosol cans are included in this category.
Plastic bottles and tubs – Plastic containers with a neck, including containers for beverages,
other fluids; plastic tubs of primarily food grade plastic often used for yogurt, margarine, and
other food or non-food materials, rigid plant pots larger than four inches, and plastic buckets
smaller than five gallons.
Glass bottles/jars – Containers made of glass. This category excludes light bulbs, flat glass,
flower vases, drinking glasses, and tempered glass such as baking dishes.
E-waste – Discarded electronics such as central processing units (CPUs), monitors, televisions,
cell phones, microwaves, radios, printers, fax machines and related office equipment.
Compostable food/fibers – Vegetable, fruit, grain-based food scraps, meat, fish, fat, bones,
eggshells, coffee grinds and paper fibers contaminated with food including coffee filters, soiled
napkins, soiled paper bags, pizza boxes, waxed corrugated cardboard, and compostable food-
service ware products that meet the guidelines set by Cedar Grove Composting
(http://www.cedar-grove.com/acceptable/AcceptedList.asp). This category excludes non-
compostable hot drink cups, gable-top or square-shape asceptic cartons, and utensils, straws,
lids, or bags made of plastic.
To-go food containers – Single use food containers not made of non-recyclable material forms.
Examples include clam shells and plastic lined paper bowls.
To-go coffee cups - Single use coffee cups provided by off-site locations.
In-office single use containers – Single use containers used by tenants in kitchens on-site.
Non-recyclables – Materials that cannot currently be recycled through most commercial haulers.
Non-recyclables include plastic utensils, lids, and straws, bathroom paper towels, plastic trays,
non-compostable food-service ware, Styrofoam, and a range of consumer durables. These
materials are also known as “true waste” because there are currently no recycling markets for
the materials or they are not readily recycled.
Office reuse - Items that may be re-used through donation to a program or by in-house
programs such as for office supplies or furniture.


© 2015 Portland State University, all rights reserved. If any portion of the information contained herein
is used, copied, displayed, distributed or referenced, attribution of such information shall be made to
Portland State University and the College of Urban & Public Affairs: Community Environmental Services.
This information may only be used, reproduced, published or re-published, or otherwise disseminated by
Republic Services and River Forum representatives in accordance with the signed Letter of Agreement
and Scope of Work effective January 9th, 2015. The use of this information is intended for informational
and educational purposes only, and selling this report, information, or any portion thereof is strictly pro-
hibited.