Embed Size (px)
Citation preview

River Basin Management in Japan-Flood Control Measures, Water Resources Management-
Hitomi GodouDirector of River Information Office, River Bureau
Ministry of Land, Infrastructure, Transport and Tourism

• Flood Control Measures– Related Laws
• River Law• Law on Measures against Inundation Damages
in Designated Urban Rivers– Examples of River Basin Management (Tsurumi River)– Non-structural measures
• Collection and Provision of River Information
• Water Resources Management – Related Laws
• Water Resources Development Law Non-structural measures– Recent trend of water resources
• Climate Change• Integrated Water Resource Management
Contents

Flood management
1896
Birth of modern river management system
1997
Establishment of integrated river management system for flood management, water utilization and environmental conservation
Flood management Water utilization
Environment
・ Improvement and conservation of river environment
・ Introduction of a system for river planning reflecting the opinions of local community
Flood management Water utilization
1964
Establishment of systems for systematic flood management and water utilization
・ Introduction of integrated management system for river systems
・ Establishment of water utilization rules and regulations
+
History of the River Act

Transition from the old system to the new system due to the River Law amendment
Riv
er w
orks
Old
sys
tem
Content: basic policy; design flood; design flood discharge, etc.; major river work items
Mas
ter p
lan
for
river
wor
ks
Drafting of master planfor river works
Adoption of master planfor river works
River Council(Class A river systems)Opinion
Riv
er w
orks
, riv
er m
aint
enan
ce
Content: goal of river improvement, river works, scope of river maintenance
Draft
Adoption and announcement of river improvement plan
Academic experts
Reflecting public opinionsby, for example,
holding public hearings
Head of local government
Opinion
Opinion
Adoption of draft riverimprovement plan
New
sys
tem Content: basic policy, design flood,
design flood discharge, etc.
Bas
ic p
olic
y fo
r riv
er
impr
ovem
ent
Drafting of basic policy for river improvement
Adoption and announcement of basic policy
for river improvement
Infrastructure Development Council
(Class A river systems)Prefectural river councils(Class B river systems)Opinion
Only if there is a prefecturalriver council
Riv
er im
prov
emen
t pl
an
Opinion

Com
prehensive Flood C
ontrol Measures
①River Measures
③Damage Reduction Measures
②Basin Measures
Water retaining area
Water retarding area
Lowland area
Preservation of urbanization control arePreservation of natural landsConstruction of food control pondsConstruction of rainwater storageConstruction of permeable pavements and rainwater infiltration inlets
Preservation of urbanization control areasRestriction on constructing mound Improvement of farm management
Development of facilities draining water into rivers
Construction of storagePromotion of flood resistant buildings
Establishment of warning and evacuation systems
Reinforcement of flood control systemAnnouncement of inundation records and flood
hazard areasPromotion of flood resistant buildingsPR to local residents
River Administrator(National Gov’t, Prefectures,
Municipalities)
Local Government(Prefectures, municipalities)
River Administrator
Local Government
Construction of dams, retarding basins, and discharge channelsRiver improvement (embanking, dredging)
System of Comprehensive Flood Control Measures
4

Outline of Law on Measures against Inundation Damages in Designated Urban Rivers
Measures
against flood from
rivers
Structural measures
River Law
(Prevention of flood)
Sewage Law City Planning Law
Flood Control Law
(Countermeasures against flood when it occurs)
Law on Measures against Inundation Damages in Designated Urban RiversBecause previous each law has limited enforcement, this law strengthens countermeasures and assures flood control in river basin.
7
○Designate urban river (basin)・Urban area covers more than 50% of river basin・Average annual damage (occurred or predicted) exceeds 1 billion yen (=$10mil)・Because of urbanization, it is difficult to control flood by constructing river
facilities or flood control dams
○Formulate river basin flood control plan・4 members (river and sewage administrators, governors, and mayors) make the
plan together
○Implementation of measures
Non-structural measures
Measures
against flood around rivers

Hayase-River
ToriyamaRiver
Onda RiverTsurumi
RiverTsurum
iR
iver
Riverbed gradient :1/1,000
Hill / tableland 70%Alluvial lowland 30%
Outline of Tsurumi River (Geography)Outline of Tsurumi River (Geography)
Tsurumi River
elevation0~20m
Tokyo Chiba Pref.
KanagawaPref. Tsurumi river basin
Riverbed gradient : 1/250
River basin area 235km2
Main stream length 42.5km

Urbanization ration has increased
by 75% in 50years
Rapid economic growth has turned natural area into urban area
1958 101958 10%% 1966 20%1966 20%
1975 60%1975 60% Present 85%Present 85%
450,000
1,200,000 1,880,000
700,000
Outline of Tsurumi RiverOutline of Tsurumi River (Urbanization and population increase)(Urbanization and population increase)
Typhoon Karinogawa in Sep 1958
Typhoon No.17 in Sep 1976
Natural Area
Urban AreaUrbanizationUrbanization Population

Function of keeping and retarding water became weakened
As a resultAs a result
・Population increased by 1.4 million in 50 years
・85% of river basin area urbanized
・Typical urban river
Before development Slight urbanization
・Discharge into river has become faster
・Peak runoff hasbecomes bigger
Outline of Tsurumi RiverOutline of Tsurumi River (Effect of urbanization) (Effect of urbanization)
1,300 m3/sPeak runoff
Volume Doubles
Difference
Runoff reachesits peak in 1/3 of time
After development Significant urbanization
770 m3/s
22~~3 hours3 hours
Present
10 hours10 hours
BeforeDevelopment

【Administrator】MLITTokyo Metropolitan Kanagawa PrefectureYokohama City
River related projects in Tsurumi River Basin inundation controlRiver related projects in Tsurumi River Basin inundation control plan plan
Future flood control
Existing retarding basin

Specifications for the Tsurumi River multi-purpose runoff retardation area-Service started: June 15, 2003-Area: 84 ha-Total reservoir capacity: 3.9 million m3-Floodwater regulation(Temporary channel) Runoff retardation area collects 200 m3/sec.(Planned river channel) Runoff retardation area and floodway collect 700 m3/sec.
Drainage gate of runoff retardation
area
Tsurumi River
Karasuyama River
International Stadium
Yokohama
:Tsurumi River multi-purpose runoff retardation area
Tsurumi River multi-purpose runoff retardation area
Tsurumi R
iver
Ove
rflow
-type
leve
e

Sewerage projects in Tsurumi River Basin inundation control plan
Natural drainage area
Pump drainage area (Name)
Rainwater storage tube (Name)

Development of facilities for target rainfallPlanned discharge in pump drainage areas
402m3/sTotal
55m3/sKaseKawasaki
189m3/sHokubu
142m3/sKouhoku
17m3/s TsuzukiYokohama
Planned discharge
Discharge area
City
Pump facilities
Planned storage of major facilities
81,000m3Egawa rainwater storage tube
144,000m3Shibukawa rainwater storage tube
Kawasaki
256,000m3Kozukue chiwaka trunk line
410,000m3Shin hasue trunk lineYokohama
Planned Storage
Storage facilityCity
Rainwater storage tube
Rainwater storage facilitiesRainwater storage facilities

Tsurumi river was designated as the first Comprehensive FloodControl River in 1979 to cape with rapid urbanization of river basin
About 3,300 facilities
Total volume 270 million m3
But more retarding ponds are necessary
● Flood retarding pondAs a ResultAs a Result
Present status and problems-Present status of River Basin Management (Present status of flood control reservoir)-

Development of rainwater storage and infiltration facilities, conservation of forested areas (Total effect by municipalities : 0.3 million m3)
InfiltrationStorage facilities in schools, parks and public houses
Storage Infiltration by permeable pavement
◆Purchase and conservation of forest in developing area
Storage, infiltration and forest conservationStorage, infiltration and forest conservation
ForestConservation
Infiltration trenchInfiltration trenchInfiltrationInfiltration
InletInlet
Infiltration trenchInfiltration trenchInfiltration InletInfiltration Inlet

Providing necessary information, quick emergency response and minimizing damages in case of flood.
▼Home Page ▼Mobile Phone ▼Information Board
Providing information to the public■Collecting Information
Providing Information
Measures against inundation damage-Improvement of collecting and providing river information -
River Management Office (MLIT)
Municipal Office
Monitoring camera
Monitoring camera
Gauging station
Gauging station
Rain-gauge station
Patrol
Evacuation call
Evacuation call
Evacuation facility
Flood Fighting Activity

Water level and Rainfall observation by Telemeter
multiplex radio transmission station
Branch office
River information provider system
Water gage station
Providing Water level and Rainfall collected of by TelemeterProviding Water level and Rainfall collected of by Telemeter
Information provided by the Internet and Mobile phone
Rain gauge station

Mt. Hako
Mt. PinshineriMt. Muri
Mt. otobe
Mt. Nishi
Mt. Monomi
Mt. Shirataka
Mt. Takasuzu
Mt. Yakushi
Mt. Akagi
Hijiri Plateau
Mt. Jyatoge
Mt. Fuka
Mt. Johgamori
Mt. Ohwa
MT. TakagiMt. Rakan
Mt. MyojinMt. Shaka
Mt. Kunimi
Mt. Happongi
Mt. Gozaisyo
Mt. Yae
Location of rainfall observation radar
▲・・・Weather radar installed by River Bureau
26 radar stations collect, analyze and provide rainfall data nationwide26 radar stations collect, analyze and provide rainfall data nationwide
Rainfall Radar (Mt. Akagi radar)
Mt. Oogusu
Mt. Mitsutoge
Mt. Houdatsu

Outline of River Information provider systemThe integrated river information system aims at sharing and standardizing river management data including river water levels and rainfall amounts.
River information systems were originally developed by each regional development bureau. They have been integrated into a national river information system. Regional development bureaus can customize the system based on their requirements.
Software are separated from hardware. Improvement cost and life-cycle cost are reduced.
The system also provides rainfall forecasts of Japan Meteorological Agency and rainfall data of the Road Bureau.

Image of cumulonimbus
glow
Image of X-band radar system
Upgrading rainfall forecast in corporation with related organizations
Observation by X-band radar system・Locate radar in a triangular shape in urban area・High resolution and real-time rainfall observation within 60km range
from radar ・Furthermore, prediction accuracy is improved by three-dimensional
observation of rainfall within the triangle area
abou
t6
0km
Aim at early flood prediction for localized heavy rainfall by establishment of Rainfall Prediction Model considering localized rainfall development and movement by corporation with institutions concern
Wind
Raindrop
aerosol
Raindrop
Hail
RaindropGenerationGeneration
Glowing cloudGlowing cloud
Initial stage of rainfallInitial stage of rainfall Heavy rain levelHeavy rain level
glow
Start raining
Rainfall observation by current C-band radar
Time
Rainfall observation byX-band radar
Location of weather radar
Strengthen observation of localized heavy rainfall and information service
glowglow
Heavy Rainfall
Area withresolution of 250m

Policies for Water Resources Development-Water Resources Development Basic Plan-
Area
Population
Industrialshipments 47.9%
51.2%
16.7%
52.1%
48.8%
83.3%
7 River Systems regions Other regions
豊川水系
筑後川水系
吉野川水系
淀川水系
木曽川水系
利根川・荒川水系
豊川水系
筑後川水系
吉野川水系
淀川水系
木曽川水系
利根川・荒川水系
豊川水系
筑後川水系
吉野川水系
淀川水系
木曽川水系
利根川・荒川水系
豊川水系
筑後川水系
吉野川水系
淀川水系
木曽川水系
利根川・荒川水系
Kiso River system
Yodo River system
Tone/Ara River system
Toyo River system
Yoshino River system
Chikugo River system
Water Resources Development Basic Plan
Japan Water Agency (JWA)
• Purpose-specific demand forecasts and supply for 7 river system
• Established in 1962 to promote water resources development

Discussion Solicitation of views
Cabinet decisionDecision by Minister of Land, Infrastructure,
Transport and Tourism (MLIT)
Preparation of cabinet decision
Deliberation by the Subcommittee on Water Resources Development,National Land Development Council
Designation of river systemsfor water resources development
Basic study(water supply prediction survey, etc.)
Relevant Stakeholders
Relevant prefectures
Procedure for Enacting Basic Plansunder the Water Resources Development Law

- Planned water supply volume: Volume of water developed by dams, etc. (not including facilities under construction and water diverted under agricultural rationalization projects in the winter.)
- Vested water volume: sum of secured water rights and provisional water rights
0
50
100
150
200
250
1965 1970 1975 1980 1985 1990 1995 2000 2005 2010 2015Year
Wat
er v
olum
e (m
3/ s
)
Planned water supply volume Vested water volume (domestic water and industrial water) Predicted demand and target value for supply
Phase 1 Full Plan(1963 - 1970)
Tone River system
Phase II Full Plan(1970 - 1975)
Tone River systemPhase III Full Plan (1976 - 1985)
Tone River system and Ara River system
Phase IV Full Plan (1988 - 2000)Tone River system and
Ara River system
Effect of Basic Plans (Tone/Ara River System)Minimizing the Gap between Demand and Supply

1,1001,2001,3001,4001,5001,6001,7001,8001,9002,0002,100
1900 1910 1920 1930 1940 1950 1960 1970 1980 1990 2000
( mm )
Annu
al Pr
ecipi
tation
Annual Precipitation
Average rainfall trend
In Japan
Variability
Variability of extreme events is increasing
due to climate change

Snowfall will dramatically decrease in the northern regions.
Source: Global warming projection vol. 6 (JMA)
Changes in annual snowfall(avg. of 2081‐2100) ‐ (avg. of 1981‐2000)
Con
verte
d eq
uiva
lent
rain
fall
(mm
)
0
50
100
150
200
250
300
10月1日 11月1日 12月1日 1月1日 2月1日 3月1日 4月1日 5月1日
積雪深
現況
将来
(cm)
(注) 1. 現在は、1992~2006年の積雪深の平均値 2. 将来は、約100年後(Model:RCM20、A2)
In a 100 years’ time, the upstream catchments of the Tone River will have considerably less snow depth.
Snow depth (cm)
Oct. Nov. Dec. Jan. Feb. Mar. Apr. May
300
250
200
150
100
50
0
Snow depth changes expected 100 years hence (Fujiwara)
Present: Avg. of 1992–2006Future: Predictions for 100 yrs. hence
Climate change prediction—Snowfall—

About 70 daysAbout 50 daysAdvanced by 0-5 daysMatsubara/Shimouke
ChikugoAbout 90-120 daysAbout 30 daysDeferred by 0-60 days
About 70-80 daysAbout 50 daysDeferred by 0-30 days
About 100-110 daysAbout 30 daysAdvanced by 0-40 days
8 damsTone
About 130-180 daysAbout 30 daysAdvanced by 0-10 days
Chubetsu
About 30-70 daysAbout 60 daysAdvanced by 0-10 days
TaisetsuIshikari
Drought periods at around 2050 (days/10yrs)
Drought periods at present state
(days/10yrs)
Irrigation period pattern
DamRiver Basin
Droughts mitigated Droughts exacerbated
Prolonged droughts are expected
due to climate change

Global warming
Water temperature rise(remaining warm)
Fixed thermoclineposition
Decreasingcirculation in lakes
Increase ofE. coli
Decrease of winter ice cover(increasing light transmission)
Temperature rise
Increase of pests
Risk of infectiousdiseases
Increasing pesticide leaks withtheir increased use
Decrease of river DO Leaking hazardoussubstances
Decrease ofbottom-layer DO
Bottom sedimentationof remains
Phytoplankton proliferation
Water safety
From urban areas← increased diffusion ofnitrogen/phosphorus↓
Flux ofhazardoussubstances
Leaking iron/manganese
Landslide inrain storm
Shifts inprecipitation patterns
Soil erosion
Increasedturbidity
Use of fossilfuel, etc.
Changingnitrogen cycle inthe atmosphere
Flux into forests/soil(nitrogen saturation)
NO3-N leaking intorivers upstream
Savory water
Products of treatment
Turbidity
Smell/taste
Color
Water safety
Impacts of Climate Change on water quality
due to climate change
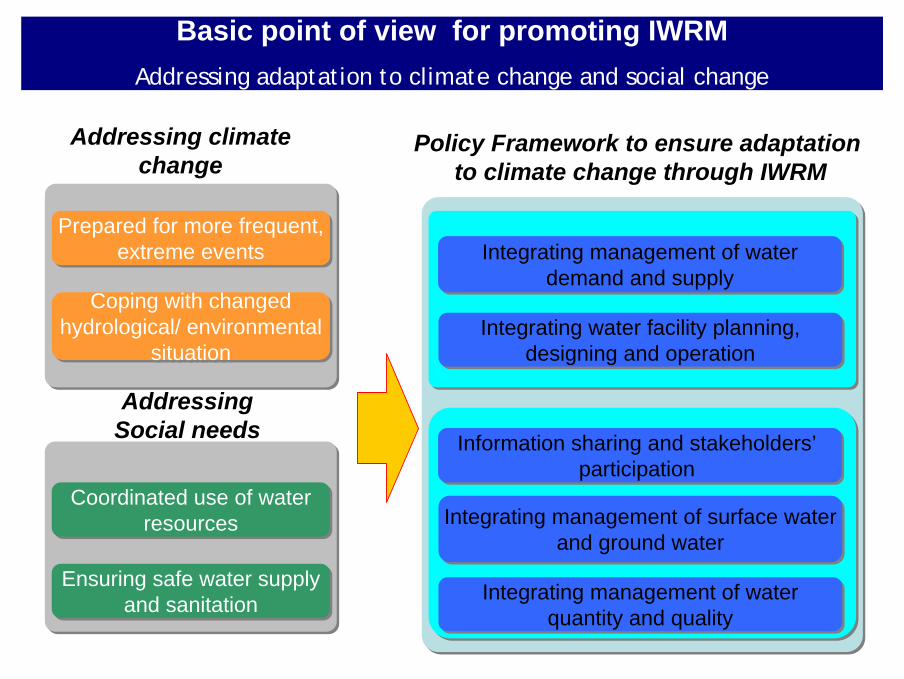
Information sharing and stakeholders’participation
Information sharing and stakeholders’participation
Integrating management of water demand and supply
Integrating management of water demand and supply
Integrating water facility planning, designing and operation
Integrating water facility planning, designing and operation
Integrating management of surface waterand ground water
Integrating management of surface waterand ground water
Prepared for more frequent, extreme events
Prepared for more frequent, extreme events
Ensuring safe water supply and sanitation
Ensuring safe water supply and sanitation
Coordinated use of water resources
Coordinated use of water resources
Policy Framework to ensure adaptationto climate change through IWRM
Addressing Social needs
Addressing climate change
Coping with changed hydrological/ environmental
situation
Coping with changed hydrological/ environmental
situation
Integrating management of water quantity and quality
Integrating management of water quantity and quality
Basic point of view for promoting IWRMAddressing adaptation to climate change and social change

Sea
groundwaterlevel observation
Water quality/ flow data
factoryuser
DB
Rainfall, climate, etc
DB
Intake amount
InternetDB
Development of a clearing house
Simulation on integrated water resources management
DBDB
city
Treatment plantDam
Dam data
Wastewater treatment plant
Information system to involve stakeholders in IWRM:In decision making, consensus building, awareness raising , etc. for adaptation action to climate change.
Information sharing and stakeholders’ participation

Required sub-actionPolicy and regulatory frameworkGroundwater Monitoring
and assessmentGroundwater levelGroundwater qualityWithdrawal amount
Coordination mechanism between managersInformation Sharing System
River
Surface water
Groundwater
Sewage treatment
Integrating monitoring, withdrawal, and recharge of surfacewater and ground water

Sea
City
Factories/Businesses
Dam
Lake
Treatmentplant
Discharge regulation
Bypass channel
Changing intake location
Effective management by many stakeholders for effective and smooth implementation.
Environmental flow
Weir
Water intake
Dam operation to keep required water quality
Conservation of forests and watersheds
Environmental control point
On-site river water
treatment plant
Sewage water recycling
Community-based water environment conservation
Integrated management of water quantity and quality