Embed Size (px)
Citation preview
RISK PROFILE MODELING FOR LARGE SCALE PROJECTS: CASE
STUDY OF A TRANSMISSION LINE PROJECT
by
Diego Orozco Mojica
B.Sc., University of Colima, 2008
A THESIS SUBMITTED IN PARTIAL FULFILLMENT OF
THE REQUIREMENTS FOR THE DEGREE OF
MASTER OF APPLIED SCIENCE
in
The Faculty of Graduate Studies
(Civil Engineering)
THE UNIVERSITY OF BRITISH COLUMBIA
(Vancouver)
April 2013
© Diego Orozco Mojica, 2013
ii
ABSTRACT
Over the next several years in North America, the power grid needs to be revitalized and extended to deal
with aging infrastructure, capacity constraints, and the pursuit of renewable energy sources. In Canada,
and particularly the province of BC, very significant complexity and risk is involved in the approval, design
and construction of such projects given highly variable terrain and weather conditions, the multiplicity of
the environmental, First Nations, and third part stakeholder issues involved, and challenging regulatory
and procurement processes. Described in this research is a holistic approach to the identification of risk
as a function of project context, the representation of which is made difficult in the context of transmission
line projects because of their large spatial scope and the vast volume of data of different types to be
distilled and analyzed. Central to the approach is the representation of a project within an integrated
environment in the form of multiple views of a project – product, process, participant, environment and
risk. Treatment of the first four views aids the identification of risk drivers for a risk event. Knowledge of
risk drivers assists with expressing likelihood of occurrence of a risk event and the magnitude of impacts
should it occur, and selecting the most appropriate risk response. Application of the approach to a 255 km
500 KV design-build transmission line project is featured and challenges involved in developing its risk
profile highlighted. How data visualization can assist development of a project’s risk profile and facilitating
insights into it is also demonstrated. The use of the holistic approach described for the development of a
project’s risk register and mining its contents using data visualization to generate useful insights has
proven to be of significant value to project personnel.
iii
PREFACE
A version of Chapter 2 will be submitted for possible publication. Shorter and less fully developed
versions of the work presented in Chapter 2 have been submitted and accepted for presentation and
inclusion in the proceedings of two conferences: Russell, A., Orozco, D. (2013). Modeling and managing
construction risk. New Developments in Structural Engineering and Construction, ISEC-7, June 18-23,
2013. Honolulu, U.S.; and Russell, A., Orozco, D. (2013). Modeling Risk for a transmission line project.
4th Construction Specialty Conference, CSCE, May 29-Jun 1, 2013. Montreal, Canada. I was responsible
for the data gathering and analysis of the case study. I conducted the development of the project model
views, and the project risk register. As well, I explored data mining through the use of data visualizations.
The use of a research tool developed at UBC (Repcon) by Russell, A. was utilized to integrate the risk
approach in a complete model and create other built-in visualizations.
A collaboration with the joint venture FLATIRON-GRAHAM© made possible the opportunity to analyze
and assess their ongoing design-build project, a 255 km, 500 KV transmission line project named Interior
to Lower Mainland (ILM) Project. In-kind contributions of the joint venture to the research effort consisted
of access to the project’s data in the project office, and meetings with project personnel to clarify project
technical documentation.
iv
TABLE OF CONTENTS
ABSTRACT .................................................................................................................................................. ii
PREFACE .................................................................................................................................................... iii
TABLE OF CONTENTS .............................................................................................................................. iv
LIST OF TABLES ....................................................................................................................................... vii
LIST OF FIGURES .................................................................................................................................... viii
ACKNOWLEDGEMENTS ............................................................................................................................ xi
DEDICATION .............................................................................................................................................. xii
CHAPTER 1. THESIS OVERVIEW .............................................................................................................. 1
1.1 INTRODUCTION ................................................................................................................................. 1
1.2 MOTIVATION & BACKGROUND ........................................................................................................ 2
1.3 OBJECTIVES ...................................................................................................................................... 4
1.3.1 RESEARCH CHALLENGES ...................................................................................................... 5
1.4 METHODOLOGY ................................................................................................................................ 5
1.5 MODELING LARGE SCALE PROJECTS ........................................................................................... 8
1.5.1 RISK MANAGEMENT IN INFRASTRUCTURE PROJECTS AND INFORMATION
TECHNOLOGY (IT) APPLICATION ......................................................................................... 8
1.5.2 PROJECT MODELING FOR RISK MANAGEMENT .............................................................. 24
1.5.3 DATA VISUALIZATION FOR INFRASTRUCTURE PROJECTS ........................................... 26
1.5.4 MULTIPLE VISUALIZATION TOOLS AVAILABLE FOR POTENTIAL USE .......................... 28
1.6 TRANSMISSION LINE PROJECTS .................................................................................................. 33
1.6.1 PROJECT CONTEXT AND COMPLEXITY ............................................................................. 36
1.6.2 PROJECT SCALE AND STRUCTURING ............................................................................... 37
1.6.3 PHYSICAL VIEW ..................................................................................................................... 37
1.6.4 PROCESS VIEW ..................................................................................................................... 37
1.6.5 PARTICIPANT VIEW ............................................................................................................... 38
1.6.6 ENVIRONMENTAL VIEW ........................................................................................................ 38
v
1.6.7 RISK VIEW .............................................................................................................................. 38
1.6.8 CONSTRAINTS ....................................................................................................................... 39
1.6.9 FLEXIBILITY ............................................................................................................................ 39
1.7 ILM TRANSMISSION LINE PROJECT PROFILE ............................................................................. 39
1.8 PROCUREMENT MODE INFLUENCE – DESIGN BUILD ............................................................... 41
1.9 MODELING PROCESS REALITY ..................................................................................................... 42
1.10 CONTRIBUTIONS OF THE WORK ................................................................................................ 43
1.11 THESIS STRUCTURE .................................................................................................................... 44
CHAPTER 2. MODELING RISK FOR TRANSMISSION LINE PROJECTS ............................................. 46
2.1 INTRODUCTION ............................................................................................................................... 46
2.2 TRANSMISSION LINE PROJECTS .................................................................................................. 48
2.3 RISK MANAGEMENT APPROACH OVERVIEW ............................................................................. 49
2.3.1 INTRODUCTION TO RISK MANAGEMENT PROCESS ........................................................ 49
2.3.2 PROJECT MODELING FOR LARGE SCALE INFRASTRUCTURE PROJECTS .................. 53
2.3.3 RISK MODEL APPROACH ..................................................................................................... 57
2.4 CASE STUDY .................................................................................................................................... 60
2.4.1 CASE STUDY INTRODUCTION ............................................................................................. 60
2.4.2 PROJECT CONTEXT MODELING.......................................................................................... 62
2.4.3 RISK PROFILE MODELING .................................................................................................... 68
2.5 EXTRACTING INSIGHTS FROM RISK DATA VISUALIZATION ..................................................... 78
2.5.1 INTRODUCTION TO DATA VISUALIZATION ........................................................................ 78
2.5.2 THE ROLES OF VISUALIZATION IN DEVELOPING THE RISK REGISTER ........................ 82
2.5.3 THE ROLES OF VISUALIZATION IN INTERPRETING THE RISK REGISTER .................... 87
2.6 CONCLUSIONS ................................................................................................................................ 96
CHAPTER 3. CONCLUSIONS ................................................................................................................... 99
3.1 CONCLUSIONS ................................................................................................................................ 99
3.2 CHALLENGES ................................................................................................................................ 101
3.3 LESSONS LEARNED...................................................................................................................... 102

vi
3.4 FUTURE WORK .............................................................................................................................. 104
REFERENCES .......................................................................................................................................... 105

vii
LIST OF TABLES
Table 1.1 – ILM Transmission Line Project Alignment - Physical locations ............................................... 40
viii
LIST OF FIGURES
Figure 1.1 – Research methodology ............................................................................................................. 6
Figure 1.2 – ICE (2005) RAMP process ..................................................................................................... 10
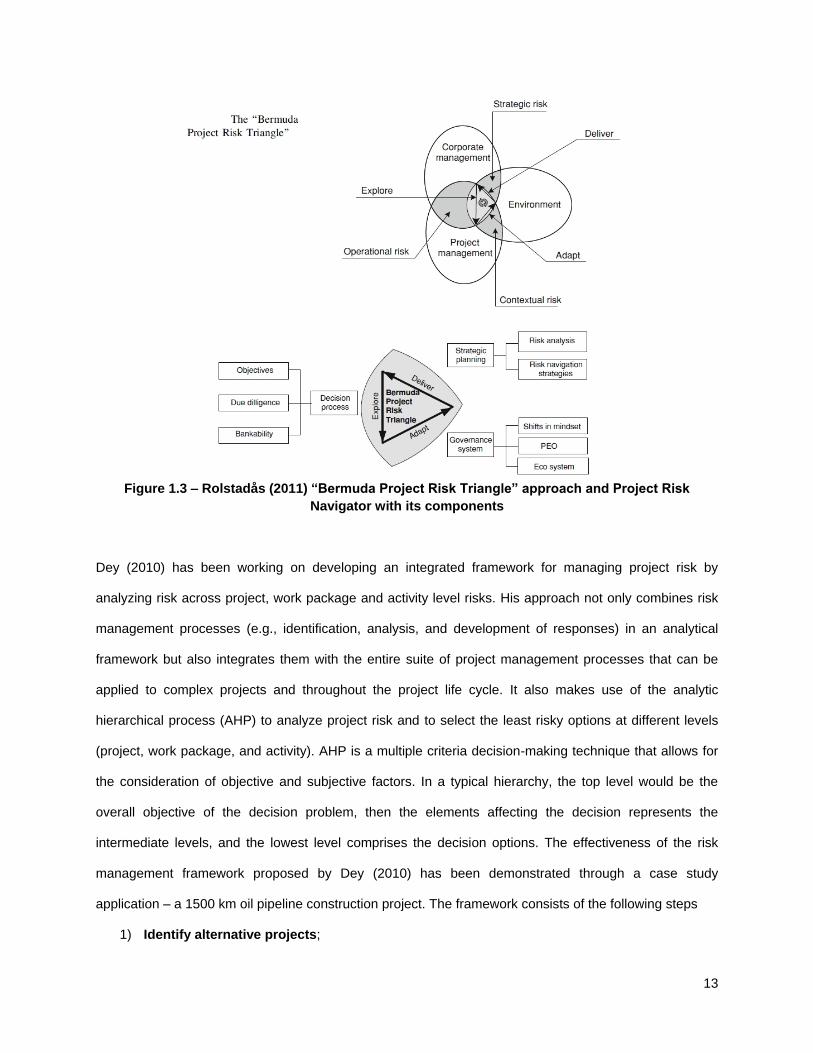
Figure 1.3 – Rolstadås (2011) “Bermuda Project Risk Triangle” approach and Project Risk Navigator
with its components.............................................................................................................. 13
Figure 1.4 – Elements of risk modeling approach ...................................................................................... 23
Figure 1.5 – Representation of a project in the form of integrated views ................................................... 25
Figure 1.6 – ILM Project General Layout & Profile. BCTC (2008) (Courtesy of Flatiron-Graham) ............. 41
Figure 2.1 – Representation of a project in the form of integrated views ................................................... 55
Figure 2.2 – Elements of risk modeling approach ...................................................................................... 60
Figure 2.3 – (a) Partial spatial (location) context for physical view for case study project (b) Spatial
component attributes that are potential risk drivers ............................................................. 65
Figure 2.4 – (a) View of project participant classes’ structure (b) Project participant role attributes
identification that could be a source of risk .......................................................................... 66
Figure 2.5 – (a) View of project participant classes’ structure (b) Project participant role attributes
identification that could be a source of risk .......................................................................... 67
Figure 2.6 – Attributes and values for section 1-B for entity Birds-Flammulated Owl ................................ 67
Figure 2.7 – Risk issue categories for project phases exclusive of the construction and
commissioning phases ......................................................................................................... 70
Figure 2.8 – Risk events for construction phase, risk issue migratory birds & level of due diligence ........ 71
Figure 2.9 – Risk drivers identified for a risk event landslides / slope stability / steep ground problems
affect work, issue geotechnical / subsurface conditions ...................................................... 73
Figure 2.10 – Risk assessment performance measure units and linguistic calibration .............................. 74
Figure 2.11 – Qualitative risk pre-assessment on risk event ...................................................................... 74
Figure 2.12 – Risk response register structure ........................................................................................... 76
ix
Figure 2.13 – Association of particular risk responses to a number of risk events/issues. Leverage in
assessing efficacy of risk responses for selection decision; possibility to assign a
relationship also with specific properties treated ................................................................. 77
Figure 2.14 – Roles of data visualization in project’s risk profile for large scale projects ........................... 79
Figure 2.15 – Access to all 5 project views and the ability to move back and forth easily; within a view
it is possible to drill down into the properties of individual components .............................. 83
Figure 2.16 – Personalized interface with direct access to visualize data from various views
simultaneously. Note the flexibility to show different details and properties of specific
view components; i.e., shown is physical data (elevation of tower locations) and
process data in the form of a bar chart indicating when work of a specific type is
scheduled for execution ....................................................................................................... 84
Figure 2.17 – Juxtaposition of selected attributes (e.g., location attributes of geotechnical conditions,
foundation type, tower elevation, and tower type) of data components (e.g., locations) ..... 85
Figure 2.18 – Aspects of environmental view; spatial mapping granularity corresponds to subsections
not individual tower locations ............................................................................................... 86
Figure 2.19 – Visualization dashboard of multiple attributes vs. locations. Section 1, physical view of
project .................................................................................................................................. 86
Figure 2.20 – Instant feedback on findings to date on project’s risk register; ability to explore in real
time what has been done so far to improve understanding ................................................. 88
Figure 2.21 – Examining pre-response estimates of risk expected value, likelihood and impact for
selected risk issues/events, (a) in same order as original risk register, (b) sorted in
descending order with respect to expected value ................................................................ 88
Figure 2.22 – Rolling-up information to higher levels to determine relative importance of issues
(purple color bars), showing numeric equivalent of linguistic expected values ................... 90
Figure 2.23 – Navigating at different levels of risk register and properties; identification of risk drivers
in the four views for a risk event .......................................................................................... 92
Figure 2.24 – Comprehending the relationship between risk events and drivers ....................................... 93
Figure 2.25 – Exploration of relationships at different aggregation levels (All views) ................................. 94

x
Figure 2.26 – Building the risk response register; visualizing relationships of risk response actions
and risk events to assess efficacy of responses .................................................................. 95
Figure 2.27 – Visualization of association of risk responses to risk events; ability to treat multiple
risks ...................................................................................................................................... 96
xi
ACKNOWLEDGEMENTS
I would like to express my immense gratitude to Dr. Alan D. Russell who has trusted and supported me
providing many hours of his time from the early stages of the thesis, to the very end of my masters
program. His constant and careful guidance were invaluable during my life as a graduate student and as
a professional advisor. There is no way that this great work would have been accomplished without his
support. I would also like to thank Dr. Sheryl Staub-French for her sincere advice and for reading this
work.
For their efforts and assistance, a special thanks to Flatiron project personnel: they have been very
cooperative and attentive during my research. Thank you for your interest in my research, especially to
Bernie Rokstad, Derek Lopresti, Adam Kuyt, Nestor Martinez, Rega Hajiadem, Alborz, Cheryl Brooks, Bill
Robertson and Cameron Duffy.
I am also grateful to all my friends in Canada and in Mexico who were always caring of me, sharing and
accompanying me through this process.
Finally, I am sincerely grateful to my family for their love, understanding and support. They have always
supported me and shared with me all my concerns, challenges, dreams, and accomplishments. And my
immense gratitude to Mayra for accompanying and loving me, giving me support to continue and finish
this process. Thank you for your time and patience with me.

xii
DEDICATION
To my dear family, my parents Pascual and Marcela, and siblings Christian and Monse, as well as to my
beloved Mayra, for their constant love, motivation, support, and patience.
1
CHAPTER 1. THESIS OVERVIEW
1.1 INTRODUCTION
This research thesis is a manuscript-based document describing a holistic, integrated approach to risk
management and its application to large scale infrastructure projects, specifically transmission line
projects. The work described builds on previous research about risk management, project modeling, data
visualization, and knowledge transfer. It seeks to identify and address the challenges involved in risk
profiling large scale geographically distributed projects and interpreting the risk profile in order to manage
the risks involved.
The specific goals of the thesis are several. First, a description of selected features of a highly structured,
integrated approach to risk management for large scale projects, with emphasis on linear projects is
provided. Second, application of the approach is demonstrated by way of a case study on a 255 km 500
KV transmission line design-build project currently in progress in British Columbia. Third, an overview of
how data visualization can assist in extracting valuable insights from the large scale data sets that
accompany such projects is given. Fourth, an approach for structuring potential responses to risks is
presented in aid of assisting with selection of a risk response strategy. The thesis concludes with
commentaries and discussion on the practical challenges involved in risk management for large scale,
geographically dispersed projects and how the use of a structured risk model approach results in
significant value for the construction industry.
The topic of risk management for capital projects has been treated by many academics as well as
practitioners (e.g., ICE, 2005; WSDOT, 2010; Wideman, 1992; Rolstadås, 2011; and Leung et al., 1998).
In most cases, it is treated as a standalone, spreadsheet-based function, which seldom capitalizes on the
formal representations of a project used in support of other project management functions. As a result, an
opportunity is lost in terms of linking risk events and attendant properties to specific project features
expressed in terms of a consistent vocabulary. Also lost is the opportunity to gain insights on how best to
respond to individual risk events as well as categories of risks. These observations along with the
2
complexity of modern large scale infrastructure projects have provided motivation for the work described
herein. Introduced in the sections that follow is an analysis on the state-of-art of risk management.
1.2 MOTIVATION & BACKGROUND
The importance of transmission line projects around the globe is noteworthy due to the increasing
demand for power (e.g., Europe, Asia and North America are significant energy consumers) (Blanco et
al., 2010). For example, over the next several years in North America the power grid will be revitalized
and extended to deal with aging infrastructure, new technologies, capacity constraints, forecasted load
demands and the pursuit of renewable energy sources such as wind and solar. In the US alone, more
than 65,000 miles of transmission line work will be required by 2020. According to the Western Electricity
Coordinating Council (WECC) 10-Year Regional Transmission Plan (WECC, 2011), the need to build
future transmission and generation projects in Western North America is influenced by recognizing the
potential economic benefits of transmission expansion to the grid. Delay in building could result in
diminished opportunities to realize these economic benefits, inadequate power supply, and high
operational and maintenance costs. WECC has presented a list of 44 major transmission projects to be
constructed by 2020, adding at least 5,500 line miles of 200kV and above lines. The estimated capital
cost of the projects envisaged totals some $20 billion (WECC, 2011).
In Canada, the increase in demand for electricity is growing quickly leading to the need to rapidly develop
generation and transmission capacity. For example, in Alberta the Alberta Electric System Operator
(AESO) highlighted in their Long-term Transmission Plan a cost estimate for the projects anticipated to be
in service by 2020 of some $13.5 billion (AESO, 2012). In British Columbia, the utility provider BC Hydro
is expecting that over the next 20 years the demand for energy could grow by as much as 50% before
accounting for savings that could be achieved by current conservation and efficiency or demand-side
measures (BC Hydro, 2012).
Other references to upcoming projects in North America include: “$10 billion in transmission lines for wind
power proposed in Michigan to bring green power to Wisconsin and several other states from windier
3
areas, including Minnesota, Iowa and the Dakotas” (Content, 2009), “New Transmission Lines to Link
Texas Cities with Future Wind Farm Development” (Russell, 2012), a “company plans to unveil Wyoming-
Nevada transmission line plan in March 2013, $3.5 billion 900-mile project capable of transporting
3000MW of wind power)” (Voge, 2013) and, “$2.2 billion CapX2020 project to modernize Minnesota’s
electrical grid and capture wind energy” (Neal, 2013).
Particularly for the province of BC, very significant complexity and risk is involved in the approval, design
and construction of such projects given highly variable terrain and weather conditions, great sensitivity to
environmental issues, First Nations issues, third party stakeholder issues, challenging regulatory
processes and offshore procurement of components. Interestingly, the academic and practitioner
literature directly relevant to risk management for transmission line projects is small (e.g., Beehler, 2009;
Burchett et al., 1999; and Tummala & Burchett, 1999).
Other literature directed at risk identification, mitigation and environmental issues as it relates to
transmission line projects includes: Kalkani & Boussiakou (1996), Marshall & Baxter (2002), Yamatani &
Jahangir (2011), Blanco et al. (2010), and Public Service Commission of Wisconsin (2011). Also reviewed
was literature focused on design and construction challenges dealing with variable geotechnical
conditions, environmental permits, temperature conditions in different geographical locations and design
flexibility (e.g., McCall et al., 2009; Lakhapati, 2009; and Wyman, 2009).
A risk management approach for large capital construction projects that includes a formal model
representation of project context and corresponding components and attributes can be exploited so as to
gain value in terms of insights into a project’s risk profile and risk responses. An additional benefit is that
expressing the structure of the model in a consistent structure and vocabulary allows the approach to be
applied to future projects by benefitting from the capture of lessons learned from current and past
projects. Considering the work documented in part by De Zoysa (2006), Russell & Nelms (2007), and
Nelms (2012) which in turn builds on previous work by Russell & Udaipurwala (2004), validation and
4
enrichment of the approach could benefit from its application to a full-scale case study, in this case, a
transmission line project.
Treated in the following sections of this chapter are the challenges and detailed contributions of the work.
Special attention is focused on identifying key risk issues for each of the project phases, and how the
project views with relevant attributes can act as a risk driver for specific risk events. Also important is the
documentation of lessons learned about project modeling and the introduction of a risk response register
together with exploration of data visualization to generate insights into a project’s risk profile.
1.3 OBJECTIVES
Objectives guiding the research work and the findings related to these objectives, the realization of which
in turn corresponds to the thesis contributions, are:
1) Examine challenges involved in modeling large scale linear projects for purposes of risk
management as well as other construction management functions;
2) Observe current industry risk management practices;
3) Explore the benefits of a specific way of thinking about Risk Management in which project
context is formally treated;
4) Identify challenges involved in:
a. Articulating potential risk events, and identifying factors or drivers that create risk events;
b. Quantifying likelihood of occurrence and impact;
c. Identifying appropriate risk responses;
d. Modifying likelihood and impact estimates given specific risk responses;
5) Explore data visualization approaches to extract insights from a project’s risk register in order to
determine where to focus management resources and to assist in selecting the most appropriate
risk response;
6) Examine how best to transfer knowledge gained on one project to future ones – i.e., explore the
role of knowledge management to assist with future projects and training of personnel;
5
7) Provide an assessment of the strengths and weaknesses of the way of thinking about risk
management adopted and how it assists management personnel; and,
8) Although not a primary objective, comment on user interface issues in a multi-view project model
that should be addressed in future work.
1.3.1 RESEARCH CHALLENGES
The most important challenges for risk management for large scale projects relate to: modeling issues
such as how best to structure the model, how to represent variable geographical location conditions, and
the lack of homogeneity and significant size of data and information. Related challenges deal with project
context complexity (e.g., environmental, regulatory processes, third party stakeholders) and how best to
identify and represent this complexity within the model in order to capture the essence of reality. Another
challenge is the difficulty in modeling long-linear projects when contractor personnel need to pursue an
opportunistic strategy in order to perform the work due to restrictions imposed by environmental windows,
third party stakeholder difficulties, permitting difficulties, etc. And finally, there is a considerable challenge
in identifying key risk issues, risk drivers, risk events, and relevant explicit attributes of drivers contributing
to the existence of a potential risk, as well as quantifying risks and structuring a risk response register.
1.4 METHODOLOGY
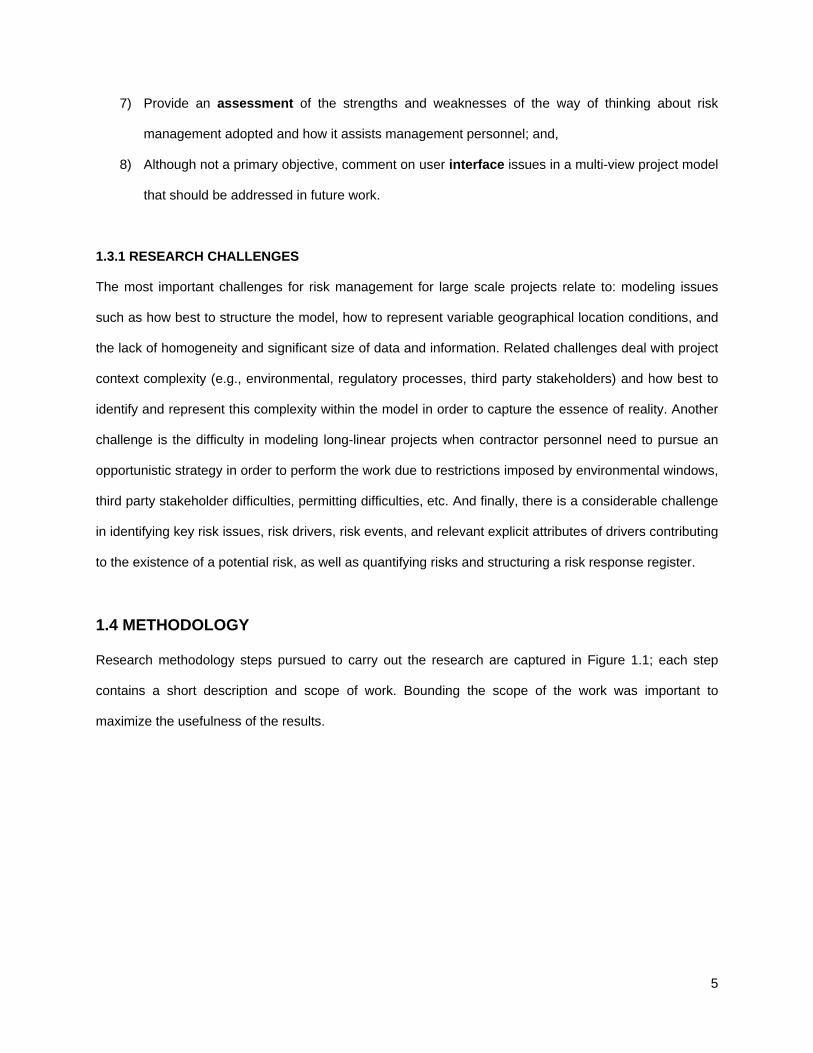
Research methodology steps pursued to carry out the research are captured in Figure 1.1; each step
contains a short description and scope of work. Bounding the scope of the work was important to
maximize the usefulness of the results.
6
Figure 1.1 – Research methodology
For the literature review, the following sources of literature were examined: academic and practitioner
literature on the topics of risk management, the anatomy of transmission line projects, risk management
approaches for transmission line projects, knowledge management in construction, project modeling, and
visualization. The review and analysis of the literature is presented in sections 1.5 Modeling large scale
projects, 1.6 Transmission line projects, and 1.8 Procurement mode influence – design build.
The idea to select a case study to apply the risk modeling approach outlined in this research is the best
way to test out the approach by working with a representative real scale example of a transmission line
project. The case study – Interior to Lower Mainland (ILM) transmission line project– done by the Flatiron-
Graham joint venture (JV) was partitioned into 5 sections and each section was partitioned further into a
number of subsections by the JV for the practical reasons explained in Chapter 2. In order to facilitate an
in-depth understanding, section 1 was selected to be modeled extensively. General components from the
other sections were also modeled and analyzed, but a special focus on project and risk modeling work
was made only for the first section of the ILM project. Involvement with the project started by way of e-
7
mail communication with the VP of Engineering of Flatiron. After receiving and reviewing the proposal,
Flatiron expressed interest in participating in the research, from which followed a meeting at the ILM site
office in March 2012 to discuss the possibility of associating with their project in order to develop a risk
profile of the ILM project. The interest of the JV to participate in the research was driven in part by their
desire to seek a competitive advantage in the short-term by documenting their experience on this their
first transmission line project.
As an in-kind contribution, the JV provided access to project data, involvement in the project office and
meetings with project personnel to clarify project documentation. During the following months, relevant
project documentation was reviewed including, but not limited to: Environmental Assessment Certificate
(EAC), Certificate of Public Convenience and Necessity (CPCN) Application, Environmental management
plans, Access management plans, project schedules, contracts, engineering documents (e.g., alignment,
clearing, Right-of-Way, environmental protection plans, geotechnical assessment and hazard reports,
avalanche assessment reports, foundation and transmission tower drawings), quality control plan, safety
plan, and site construction management plan.
During the document review phase, several meetings were held with JV staff members (project controls
manager, project engineer and scheduler) in the project site office. Communication continued on an
ongoing basis by phone and e-mail to ask questions about ILM project technical information. Parallel to
this process, work started on developing the project model context and risk register using the proposed
risk management approach. Significant progress in the research was achieved by September 2012. This
progress provided an opportunity to get involved in the project site office during 6 weeks on a daily basis
with the purpose of refining and expanding the risk modeling work by asking clarifying questions to project
personnel (e.g., environmental, safety, construction, controls, and administration managers, First Nations
consultants, procurement engineers, project manager, transmission line experts JV staff and project
manager of the transmission line work subcontractor), participating in clarification meetings, reviewing
further details in project documentation, and seeking feedback on an ongoing basis with respect to risk
register contents and project context in order to capture the reality of project conditions.
8
After gathering all the necessary information, discussing the contents of the risk register for completeness
and clarity of information, and presenting preliminary results of the project’s risk profile to project
personnel, the research focus was to complete the risk register and project model in order to explore the
use of data visualization to: (i) provide insight on the project risk profile during risk identification and
assessment, (ii) understand the contents of a risk register, and (iii) assist the process of decision making
for the project risk response strategy. The use of a research system tool from UBC (called ‘Repcon’) was
used to model the project context views, risk register and data visualization. Additionally, other data
mining tools were explored to develop relevant visualizations. Finally, the risk response strategy was
developed and represented with the aid of data visualization tools. Documentation of the foregoing
facilitates the capture of lessons learned and transfer of knowledge gained for use on future infrastructure
projects. Further detail about each of these processes is presented in Chapter 2. The results were shown
to the JV personnel by way of a formal presentation. Present were the project director, corporate risk
manager, project controls manager, and controls engineer. Goals of the presentation were to
communicate the research findings and receive feedback from industry personnel. JV staff members
were very satisfied with the results; they found very useful the risk management approach used,
especially the risk register structuring content as well as the proposed visualizations in order to provide
understanding of project’s risk profile.
1.5 MODELING LARGE SCALE PROJECTS
1.5.1 RISK MANAGEMENT IN INFRASTRUCTURE PROJECTS AND INFORMATION TECHNOLOGY
(IT) APPLICATION
Provided in this section of the thesis is an overview of the state-of-art of risk management processes with
emphasis on their application to infrastructure projects. The discussion that follows it treats the application
of Information Technology (IT) in support of knowledge management, directed at how best to capture
lessons learned in a structured way for future use in risk management. Then discussed are the strengths
and weaknesses of the state-of-art of risk management processes analyzed. This is followed by the
introduction of the holistic risk management approach adopted for the identification of risk as a function of
9
project context in large scale infrastructure projects. This section concludes with comments on the
specific contributions derived from applying the integrated multiple view risk management approach to a
sizeable transmission line project case study.
Risk is present in all projects, and can be defined as an uncertain outcome or event that could occur
inflicting a favorable or unfavorable effect if it occurs. If the outcome is favorable it is considered an
opportunity, and if the event occurrence has an unfavorable outcome then it is considered as a risk
(Wideman, 1992). Complementing these definitions, ICE (2005) defines risk as the potential impact of all
the threats (and opportunities) which can affect the achievement of the objectives for an investment. A
number of frameworks that aim to structure a risk management process have been reviewed in the
academic and practitioner literature (e.g., ICE, 2005; Wideman, 1992; PMI, 2008; WSDOT, 2010;
Chapman & Ward, 2003; Leung et al., 1998; Rolstadås, 2011; Al-Bahar & Crandall, 1990; Hillson, 1999;
and Dey, 2010). The focus of the research is not to describe in detail each of the risk frameworks
available in the state-of-art. Nevertheless, it is important to comment on the similarities and differences in
approaches proposed, and assess the contribution of these approaches to the field of risk management
along with the corresponding limitations.
The Institution of Civil Engineers and the Faculty and Institute of Actuaries (ICE), have developed a
comprehensive and systematic process for identifying, evaluating and managing risks in capital
investment projects. The process is named RAMP, an acronym for Risk Analysis and Management for
Projects; it covers the entire project life cycle (ICE, 2005). The RAMP process includes four activities that
subdivide into the specific processes shown in Figure 1.2. Of particular interest are Risk review activity
processes which include risk identification to be entered into a risk register, risk assessment by
determining the likelihood and impact of a specific risk, identification of potential risk mitigation measures,
re-assessment of identified risks, implementation of risk management and risk response plans, and
communication which also forms part of knowledge management practices.

10
Figure 1.2 – ICE (2005) RAMP process
The integration of risk management with other project management functions is elaborated upon by
Wideman (1992) in his risk management guide book for projects. Poor performance in other project
management functions (e.g., cost, quality, scope, and time) is related to the risk of unforeseen and
foreseen events not being treated properly. Wideman (1992) breaks down project risk management into
four process phases:
1) Risk Identification – Identify and classify by category as: external but unpredictable, external
predictable but uncertain, internal-non-technical, technical, and legal.
2) Risk Assessment – Screening, Probability of occurrence vs. severity of consequences,
quantification of risk, modeling, and reports.
3) Risk Response – Define system standards, insurance, and planning alternatives.
4) Risk Documentation – Collect historical database, current project database, and post-project
assessment and archive.
Activity A: PROCESS LAUNCH
• 1. Plan, organize and launch RAMP process
• 2. Establish baseline
Activity B: RISK REVIEW
• 1. Plan and initiate risk review
• 2. Identify risks
• 3. Evaluate risks
• 4. Devise measures for mitigating risks
• 5. Assess residual risk, and decision to continue
• 6. Plan responses to residual risks
• 7. Communicate mitigation strategy and response plan
Activity C: RISK MANAGEMENT
• 1. Implement strategy and plans
• 2. Control risks
Activity D: PROCESS CLOSE-DOWN
• 1. Assess investment outturn
• 2. Review RAMP process
11
Wideman’s (1992) guide book is based on Project Management Institute (PMI) standards. And in a similar
way, the PMI objectives regarding project risk management are to increase the probability and impact of
positive events, and decrease the probability and impact of negative events in a project (PMI, 2008). The
PMI provides their framework for project risk management processes, which is as follows:
1) Plan risk management – Define how to conduct risk management activities.
2) Identify risks – Determine which risks may affect the project and document their characteristics.
3) Perform qualitative risk analysis – Prioritize for further analysis or action by assessing and
combining their probability of occurrence and impact.
4) Perform quantitative risk analysis – Numerically analyze the effect of identified risks on overall
project objectives.
5) Plan risk responses – Develop options and actions to enhance opportunities and reduce threats
to project objectives.
6) Monitor and control risks – Implement risk response plans, track identified risks, monitor
residual risk, identify new risks, and evaluate risk process effectiveness.
A number of practitioners and researchers have adopted or developed similar structured frameworks. For
example, the Washington State Department of Transportation (WSDOT, 2010), has developed its own
project risk management guide – a framework based on PMI (2008). The goal is to provide a consistent
methodology, techniques and tools, and guidance on how to proactively respond to risks, all while fitting
in with the overall project management processes at WSDOT.
Certain risk management tools tend to be very general, making it somewhat difficult to extract meaningful
insights from modeling the risk profile of a project. Al-Bahar & Crandall (1990) proposed a risk model
providing a formal, logical, and systematic tool entitled Construction Risk Management System (CRMS)
with the purpose being to assist contractors in identifying, analyzing, and managing risks in a construction
project. Their systematic analytical approach starts with risk identification and its mapping, probabilistic
risk analysis and evaluation of significant risks, the development of alternative risk response
management strategies, finishing with system administration which considers the formulation of
12
corporate risk policies, and review and monitoring the CRMS model in order to complete the system. The
linkage between the processes provides a closed-loop feedback to update information in the system.
There exist newer non-traditional approaches in the project management field that have led to a different
concept about project risk. The work by Rolstadås (2011) is a good example of this. He introduces a risk
management approach in which three different types of risks exist. Each of them is a function of the
interaction within three domains: corporate management, project management, and the project’s
environment. The overlapping of the three domains creates what Rolstadås called an “ocean” containing
the project risks (Operational, Strategic, and Contextual risks). The project risk approach is referred to
as “Bermuda Project Risk Triangle”. Its framework contains three major components: the governance
system, the decision process, and strategic planning. This framework proposes a modification of and
extension to project management practices in order to implement new risk navigation strategies – how to
treat risk throughout the duration of the project. These changes in the process seek to change the
mindset of the management team in order to be adaptable, flexible and dynamic. Figure 1.3 illustrates the
extended version of the “Bermuda Project Risk Triangle” approach with the representation of the risk
navigator framework components and its attributes.
13
Figure 1.3 – Rolstadås (2011) “Bermuda Project Risk Triangle” approach and Project Risk
Navigator with its components
Dey (2010) has been working on developing an integrated framework for managing project risk by
analyzing risk across project, work package and activity level risks. His approach not only combines risk
management processes (e.g., identification, analysis, and development of responses) in an analytical
framework but also integrates them with the entire suite of project management processes that can be
applied to complex projects and throughout the project life cycle. It also makes use of the analytic
hierarchical process (AHP) to analyze project risk and to select the least risky options at different levels
(project, work package, and activity). AHP is a multiple criteria decision-making technique that allows for
the consideration of objective and subjective factors. In a typical hierarchy, the top level would be the
overall objective of the decision problem, then the elements affecting the decision represents the
intermediate levels, and the lowest level comprises the decision options. The effectiveness of the risk
management framework proposed by Dey (2010) has been demonstrated through a case study
application – a 1500 km oil pipeline construction project. The framework consists of the following steps
1) Identify alternative projects;
14
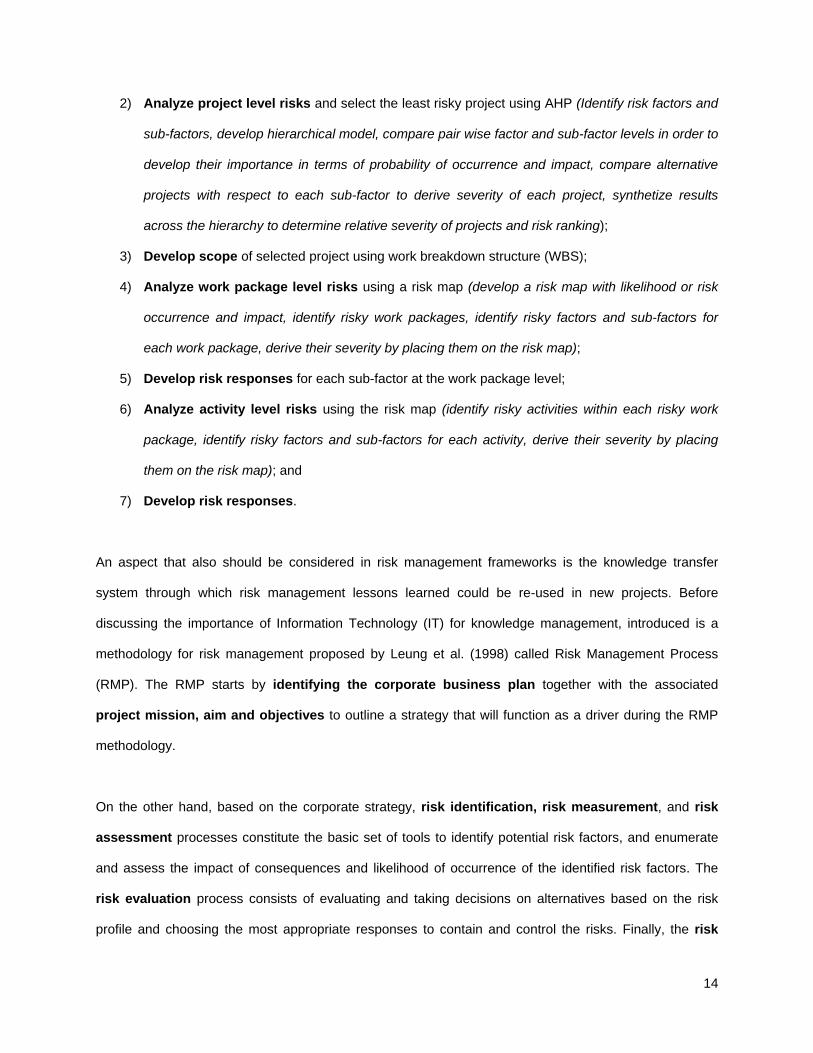
2) Analyze project level risks and select the least risky project using AHP (Identify risk factors and
sub-factors, develop hierarchical model, compare pair wise factor and sub-factor levels in order to
develop their importance in terms of probability of occurrence and impact, compare alternative
projects with respect to each sub-factor to derive severity of each project, synthetize results
across the hierarchy to determine relative severity of projects and risk ranking);
3) Develop scope of selected project using work breakdown structure (WBS);
4) Analyze work package level risks using a risk map (develop a risk map with likelihood or risk
occurrence and impact, identify risky work packages, identify risky factors and sub-factors for
each work package, derive their severity by placing them on the risk map);
5) Develop risk responses for each sub-factor at the work package level;
6) Analyze activity level risks using the risk map (identify risky activities within each risky work
package, identify risky factors and sub-factors for each activity, derive their severity by placing
them on the risk map); and
7) Develop risk responses.
An aspect that also should be considered in risk management frameworks is the knowledge transfer
system through which risk management lessons learned could be re-used in new projects. Before
discussing the importance of Information Technology (IT) for knowledge management, introduced is a
methodology for risk management proposed by Leung et al. (1998) called Risk Management Process
(RMP). The RMP starts by identifying the corporate business plan together with the associated
project mission, aim and objectives to outline a strategy that will function as a driver during the RMP
methodology.
On the other hand, based on the corporate strategy, risk identification, risk measurement, and risk
assessment processes constitute the basic set of tools to identify potential risk factors, and enumerate
and assess the impact of consequences and likelihood of occurrence of the identified risk factors. The
risk evaluation process consists of evaluating and taking decisions on alternatives based on the risk
profile and choosing the most appropriate responses to contain and control the risks. Finally, the risk
15
control and monitoring process serves to communicate and enhance a periodic review of project
progress and status within the project management team.
Information Technology is used to support risk management practices and knowledge transfer. The
purpose is to assist the thought process during the project risk and project context modeling process in
order to structure a complete project risk profile. IT also has the advantage of capturing risk information in
a project-neutral format in order to facilitate re-use on future projects. Leung et al. (1998) introduced the
concept of a knowledge-based system (KBS) as a computer program enriched with certain proven human
knowledge and expertise to model the problem solving ability of human experts. Leung et al. (1998)
explain how KBS is applicable to other areas of study such as construction project management (e.g.,
cost estimating, claim management, management decision making, and scheduling). The KBS logic
stored in a computer system can be used to link and identify relationships between risk factors,
corresponding project risks and related work packages. For example, Leung et al. (1998) applied a KBS
to develop a structured and comprehensive prototype software tool using the RMP methodology that
could be used at any stage of the project life-cycle. Benefits include the lessened time and effort required
to identify and assess risks and to develop risk response actions. Modeling the knowledge-based system
consisted of three basic steps: (i) cause analysis (input work activities and risk factors based on the
current project environment); (ii) project risk identification (searching the knowledge database to identify
all potential project risks); and, (iii) identification of risk-related work packages (in relation to the
corresponding identified project risks).
The prototype was constructed using as its base project an extra-high voltage (EHV) overheard
transmission line construction project. The system provides a way to perform risk management in a more
efficient and structured way, assists in reporting to managers the existence of project risks and their
relationship with risk factors, and shows the risk-related work packages that correspond to the project
risks identified. A system like this one provides an effective and systematic way to transfer knowledge,
and collect and update the expertise of users continuously for reuse on future works. Although a system
like this requires continuous development and updates according to user needs and technology progress,
16
it serves to demonstrate the importance of IT in support of the risk management function for large scale
projects.
In order to incorporate a knowledge management approach in an IT based risk management framework,
it is important to consider not only the technology factor, but also other dimensions of knowledge
management. Jashpara (2004) cited the following dimensions of knowledge management: (i) systems &
technology; (ii) strategy; (iii) culture; and, (iv) organizational learning. When systems & technology are
directly linked to organizational learning (exploration, exploitation, and knowledge sharing) and to strategy
(intellectual capital, and organizational performance), and indirectly to culture (change management, and
implementation), if the IT system is not developed considering all of the factors involved in the transfer of
knowledge within a company, it will encounter barriers for its successful implementation. According to
Carrillo & Chinowsky (2006) the main challenges faced in implementing knowledge management in
construction companies are:
Not enough time;
Organizational culture;
Lack of standard work processes; and
Insufficient funding.
Other barriers highlighted are: lack of management support, employee resistance to sharing, poor IT
infrastructure, a “Not invented here” culture, accessing/developing knowledge management not being
mandatory, and lack of a real-time integrated database. Carrillo & Chinowsky (2006) explored knowledge
management practices from an engineering and construction perspective and detected that there is
growing recognition of the benefits of knowledge management for construction firms. Some of the
assessed firms were able to demonstrate how its knowledge management initiatives had clearly impacted
on winning new projects and business growth. However, these results were seen as being attributable to
their existing business development processes, rather than to specific knowledge management activities.
17
The risk management literature is vast and a significant number of tools / procedures are available that
range from quite simple to very complex. Although the risk management processes described by various
authors vary from each other in terms of different scopes and description of processes and terminology,
one can identify certain core elements which are common to all these approaches. These core elements
include (i) Risk identification, (ii) Risk assessment, (iii) Risk response, and (iv) Risk control and
monitoring. But there are a number of shortcomings in current processes with respect to treating risk
within an integrated framework including knowledge management. Amongst these shortcomings is the
poor embedment of project risk with project context. This leads to another important issue related to the
question, “How best to represent project context?”
Some authors have not attempted to develop a comprehensive risk management approach. Rather, they
have focused on treating specific processes that form part of a risk management framework (Leung et al.,
1998; Hillson, 1999; Dey, 2010). On the other hand, other authors have proposed extensive risk
management frameworks that cover all of the core elements of risk management and include as well
additional processes with a series of steps to carefully follow. However, these additional steps may make
implementation of the associated framework too difficult to achieve, or if implemented, provide a process
that is very tedious and time consuming to use, and without the benefits promised (ICE, 2005; PMI, 2008;
Wideman, 1992; Al-Bahar & Crandall, 1990). Non-traditional approaches that involve a significant change
in the way to develop a framework for risk management work has some appeal; nevertheless the level of
effort to implement such a framework has not yet been tested on actual projects, making it difficult to
judge the merits of such a framework (Rolstadås, 2011).
The inability to integrate project risk information with explicit representations of project context also
interferes with the attempt to re-use the contents of risk registers for future projects. Even though various
authors have proposed frameworks, tools or methodologies for risk identification, analysis, and response
development, seemingly little work has been done on developing an integrated risk management
approach (e.g., Dey, 2010; De Zoysa, 2006; Leung et al., 1998; and Rolstadås, 2011). Further, there are
very few frameworks and accompanying studies that link risk analysis outcomes with risk response
18
strategies (e.g., Hillson, 1999; Dey, 2010; Al-Bahar & Crandall, 1990). An integrated approach to project
risk management not only combines the risk management processes of identification, analysis and
development of responses in an analytical framework, but also integrates risk management processes
with the entire project management process (Dey, 2010). For example, Leung et al. (1998) developed the
RMP methodology (including risk identification, measurement, assessment, evaluation and risk control
and monitoring processes) that was applied to a framework for managing cost risk for an EHV
transmission line project, but did not integrate cost risk with schedule and project quality related risks.
Dey (2010) proposed an integrated framework for project risk management that includes an analytical
hierarchical process, which quantifies risk, deals with project time and cost parameters, and considers a
few aspects of environment and construction process but doesn’t treat risk by specific locations. As
proposed, the framework could be difficult to navigate in pursuit of insights once the risk profile is
developed, given the complex structure used to represent each of the project work package and activity
levels across each project phase (feasibility, planning, implementation, etc.).
Another shortcoming of current approaches is the structure of risk registers and how to manage them,
which makes difficult the task of making modifications to the risk register caused by a dynamic changing
project context, a situation particularly relevant to large scale linear projects. Also when a large number of
risks are present along with the significant information that accompanies each risk, it becomes difficult to
navigate through the risk register, hampering the risk management process and the opportunity to gain
insights from the risk register. The lack of use of consistent terminology in defining the risk register and
project context during the risk management process and after it when preparing the information for re-use
in future projects, could lessen the opportunity to transfer knowledge effectively. Another disadvantage of
current approaches is that knowledge is mostly captured as a static instance, also lessening the ability to
add lessons learned. This is because large scale project context component modeling including the risk
register structure requires an extended period of time to develop due to the sizeable scope of such
projects and attendant documentation and number of participants involved and uncertain and changing
project conditions.
19
The support for risk management frameworks through the use of knowledge-based approaches has some
limitations. For example, an attempt to develop a rule-based system would likely result in a very large set
of rules that would not be readily understood by users and would require experts to maintain it. Typically,
knowledge-based systems have been limited by their authors to supporting a subset of project types,
such as oil pipelines or transmission lines (Dey, 2010; and Leung et al., 1998). Also, the treatment of
project context in knowledge-based systems as described in the literature is thin. The approaches
proposed by Leung et al. (1998) and Rolstadås (2011) treat aspects of environmental and organizational
components as risk factors, but the components modeled within these systems are few in number
compared to the ones that a large scale project would need in order to properly represent project context.
In terms of execution of a risk management method, some risk management frameworks focus only on
certain processes and little attention is given to other stages in the overall risk management process. For
example, ICE (2005) identifies risk management process limitations as including: concentration of the
treatment of risks in the asset creation phase rather than on potentially higher risks in other project stages
(e.g., construction, and procurement); lack of a satisfactory method for combining risks when in many
cases the risks treated separately are interdependent; little attention to changing risk exposure during the
investment life cycle; the tendency to focus on risks which can be most easily quantified without the
exercise of proper judgment to get a good feel for other risks involved; and, an inadequate follow through
from project risk analysis to the control of risks once project implementation starts.
Despite many useful contributions by others with respect to managing risk and related knowledge,
including a number of best practices and lessons learned, a considerable amount of work remains to be
done in order to develop an approach that meets most if not all of the challenges encountered in risk
management, especially as applied to large scale construction projects. A more detailed literature review
and analysis as it relates to the topic of the state-of-art for risk management and knowledge-based
methodologies can be found in the work made by De Zoysa (2006).
20
Before introducing the risk management approach adopted for the research work described herein, it is
important to define the terminology for the key concepts used recursively in this thesis. The definitions
used have been elaborated from a synthesis of literature references presented in De Zoysa (2006). The
term ‘Risk issue’ is used to refer to keywords that represent topic areas of direct relevance to a project,
around which uncertainty or lack of predictability may exist. A risk issue may result in multiple risk events,
and consequent uncertainty in one or more project performance measures. The term ‘Risk event’
corresponds to the potential variability in a project parameter from its anticipated value, or one or more
discrete scenarios in which the possible states of nature that can be realized can be identified, but the
one which will actually occur as well as its outcome is not known with certainty. A risk event can apply to
the project as a whole, i.e., its sphere of influence is global, or it can be local in terms of its immediate
influence and hence treatment. The term ‘Risk Driver’ relates to the components of the physical,
process, participant, and environmental domains, the presence of which or characteristics of which make
a risk issue relevant to a particular project phase and context component. A risk driver represents the
relationship between the project context and the risks of a project.
A brief overview of the holistic risk management approach utilized in support of the research described in
this thesis is presented here. This approach has been developed over an extended time period, and its
evolution has been documented in part in the work by De Zoysa (2006), Russell & Nelms (2007), and
Nelms (2012) which in turn builds on previous work by Russell & Udaipurwala (2004), focused on the
multi-view representation of a project in support of key project/construction management functions,
inclusive of risk management.
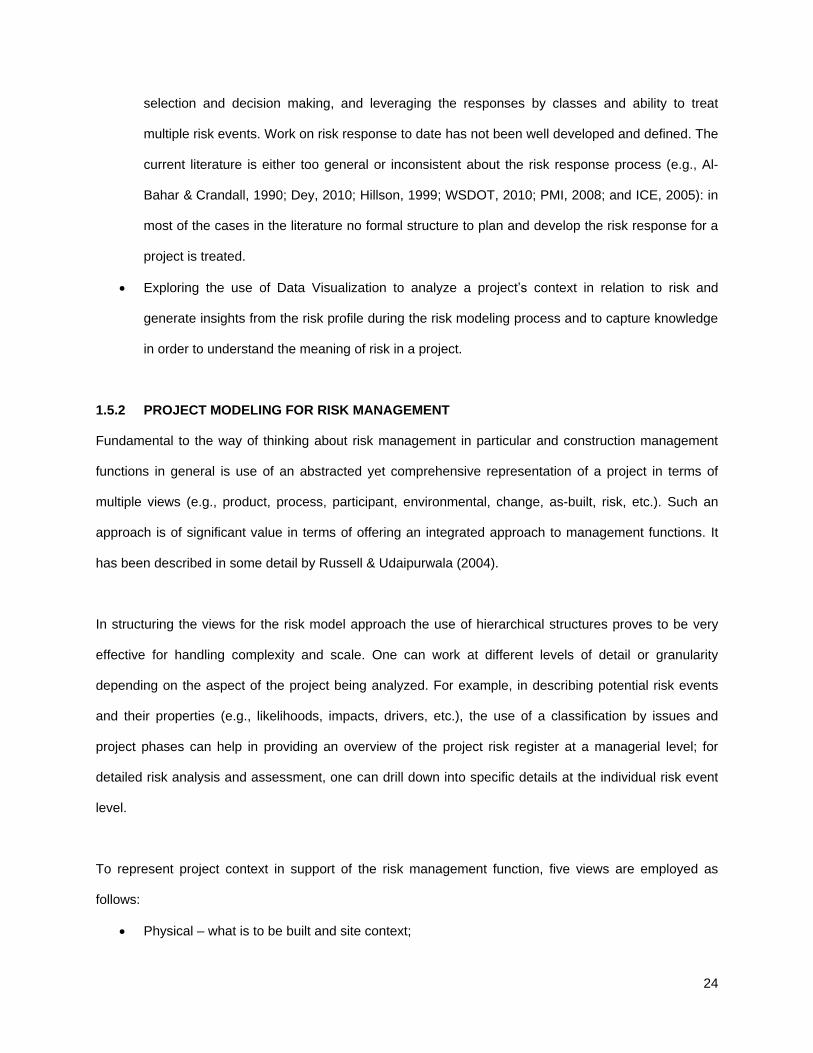
In terms of application of the risk management approach adopted, while multiple pathways of use are
supported because practitioners demand flexibility, the following front-end steps provide insights on how
the approach can be applied. These steps are also depicted in Figure 1.4:
1) Define the four project context views of product, process, participant and environment (see Figure
1.5): This is an iterative process which can benefit from lessons learned on past projects. It is
useful to define the context views prior to holding a risk identification session. Additional important
21
information often gets teased out in a risk identification session which further assists in
characterizing a project’s context.
2) Set up the structure of the project risk register and define risk issues deemed relevant to the
applicable project life cycle phases (e.g., macro-economic risks, political risks, contract
interpretation risks, etc.). Again this can benefit from documentation of past experience,
especially with respect to risk issue headings.
3) Identify risk events that apply to the overall project under the relevant risk issue (e.g., risk event:
bearing conditions significantly different than anticipated under risk issue: geotechnical along with
relevant drivers. Risk events are associated with a location, whether a specific location instance
(e.g., Tower Location T1001_A), or a location defined to represent a collection of locations (e.g.,
S1_A for section 1 A of a transmission line project or GLOBAL to reflect the entire project).
Assigning risks to a spatial location facilitates the development of a spatial distribution of risks
which assist with the overall risk management process.
4) Identify other risk events that directly impact one or more specific project components by walking
through one or both of a summary level schedule of the project and the spatial context for the
project phase at hand, and ask the question: “Does this risk issue apply?” It is observed that for
projects that have a large, complex spatial dimension (e.g., a transmission line project), much of
the project’s risk profile is derived from consideration of the spatial context in concert with the
environmental view. If the risk issue applies, seek to identify individual risk events; if no, move on
to the next risk issue until all risk issues have been examined, including the need to define new
ones. Then repeat for other summary activities and/or spatial elements. As part of steps 3 and 4,
it can also be helpful to identify which components of the four project views might be impacted
should the risk event occur (e.g., activities whose duration could be lengthened, environmental
components that could suffer damage, etc.).
5) Once the risk register has been populated, assess likelihood and impacts in a qualitative way,
after calibrating risk identification participants in terms of likelihood of occurrence and impact
scales. Maintaining velocity in a risk identification session is essential – trying to definitively
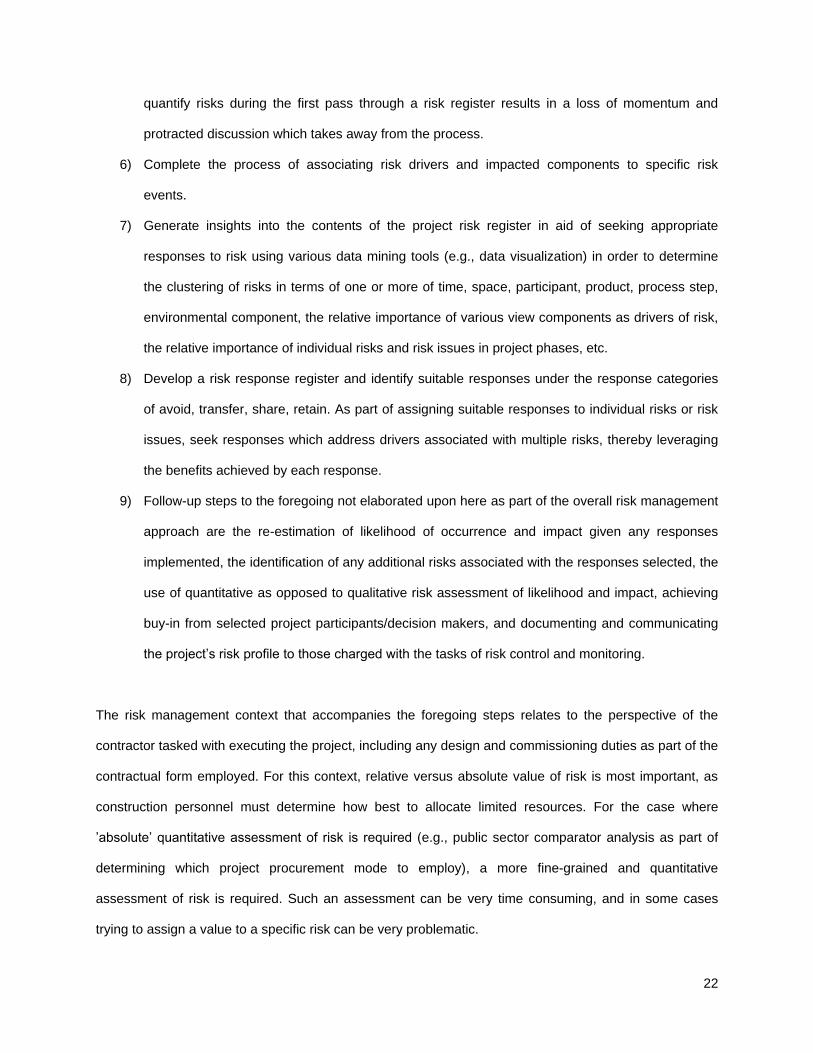
22
quantify risks during the first pass through a risk register results in a loss of momentum and
protracted discussion which takes away from the process.
6) Complete the process of associating risk drivers and impacted components to specific risk
events.
7) Generate insights into the contents of the project risk register in aid of seeking appropriate
responses to risk using various data mining tools (e.g., data visualization) in order to determine
the clustering of risks in terms of one or more of time, space, participant, product, process step,
environmental component, the relative importance of various view components as drivers of risk,
the relative importance of individual risks and risk issues in project phases, etc.
8) Develop a risk response register and identify suitable responses under the response categories
of avoid, transfer, share, retain. As part of assigning suitable responses to individual risks or risk
issues, seek responses which address drivers associated with multiple risks, thereby leveraging
the benefits achieved by each response.
9) Follow-up steps to the foregoing not elaborated upon here as part of the overall risk management
approach are the re-estimation of likelihood of occurrence and impact given any responses
implemented, the identification of any additional risks associated with the responses selected, the
use of quantitative as opposed to qualitative risk assessment of likelihood and impact, achieving
buy-in from selected project participants/decision makers, and documenting and communicating
the project’s risk profile to those charged with the tasks of risk control and monitoring.
The risk management context that accompanies the foregoing steps relates to the perspective of the
contractor tasked with executing the project, including any design and commissioning duties as part of the
contractual form employed. For this context, relative versus absolute value of risk is most important, as
construction personnel must determine how best to allocate limited resources. For the case where
’absolute’ quantitative assessment of risk is required (e.g., public sector comparator analysis as part of
determining which project procurement mode to employ), a more fine-grained and quantitative
assessment of risk is required. Such an assessment can be very time consuming, and in some cases
trying to assign a value to a specific risk can be very problematic.
23
Knowledge Management
Draw on the best of past Lessons and Practices
represented in a structured form.
Project and Risk Modeling process
Generation of Insights
Data Mining: Interface design, Tabular reporting, Data Visualization
PROJECT CONTEXT
Define:
Enviro
nmenta
l
Participant
Physical
Proce
ss
Project Context
Components Attributes Mapping
RISK VIEW
RISK REGISTER
Categories
Issues
Events
Drivers
Components Impacted
RISK ASSESSMENT
Participant Calibration Likelihood,
Performance metrics:
RISK RESPONSE REGISTER
Knowledge Management
Capture Lessons Learned in a
structured way for future use
Response Categories
Sub-category Actions
Specific Class
Mapping Responses with multiple Events/
IssuesAssessment of
Events
Severity Index of Impact
Event Likelihood
Level of confidence in estimates
Figure 1.4 – Elements of risk modeling approach
As presented in the objectives of the research and correlating them with the research contributions
described later in this chapter, explored is the use of a risk management approach for large scale
projects, specifically a transmission line project, for the purpose of :
Having the opportunity to test and refine the approach by way of a case study on a full scale
project.
Discerning lessons learned about how best to model a risk profile and how to organize risk
management knowledge. This includes the definition of the hierarchical classification structure of
a risk register (i.e., category, issues, events) and the use of structured templates for project
context views (physical, process, environmental and participant).
Determining how best to treat complexity when assessing a large scale project, given the very
large data sets involved – it becomes important to define and identify what really is relevant for
the risk profile of the project in terms of the project context components and their attributes.
Making a first attempt to define a comprehensive risk response hierarchical classified structure
that is useful for affecting knowledge transfer, gaining insights during the risk response strategy
24
selection and decision making, and leveraging the responses by classes and ability to treat
multiple risk events. Work on risk response to date has not been well developed and defined. The
current literature is either too general or inconsistent about the risk response process (e.g., Al-
Bahar & Crandall, 1990; Dey, 2010; Hillson, 1999; WSDOT, 2010; PMI, 2008; and ICE, 2005): in
most of the cases in the literature no formal structure to plan and develop the risk response for a
project is treated.
Exploring the use of Data Visualization to analyze a project’s context in relation to risk and
generate insights from the risk profile during the risk modeling process and to capture knowledge
in order to understand the meaning of risk in a project.
1.5.2 PROJECT MODELING FOR RISK MANAGEMENT
Fundamental to the way of thinking about risk management in particular and construction management
functions in general is use of an abstracted yet comprehensive representation of a project in terms of
multiple views (e.g., product, process, participant, environmental, change, as-built, risk, etc.). Such an
approach is of significant value in terms of offering an integrated approach to management functions. It
has been described in some detail by Russell & Udaipurwala (2004).
In structuring the views for the risk model approach the use of hierarchical structures proves to be very
effective for handling complexity and scale. One can work at different levels of detail or granularity
depending on the aspect of the project being analyzed. For example, in describing potential risk events
and their properties (e.g., likelihoods, impacts, drivers, etc.), the use of a classification by issues and
project phases can help in providing an overview of the project risk register at a managerial level; for
detailed risk analysis and assessment, one can drill down into specific details at the individual risk event
level.
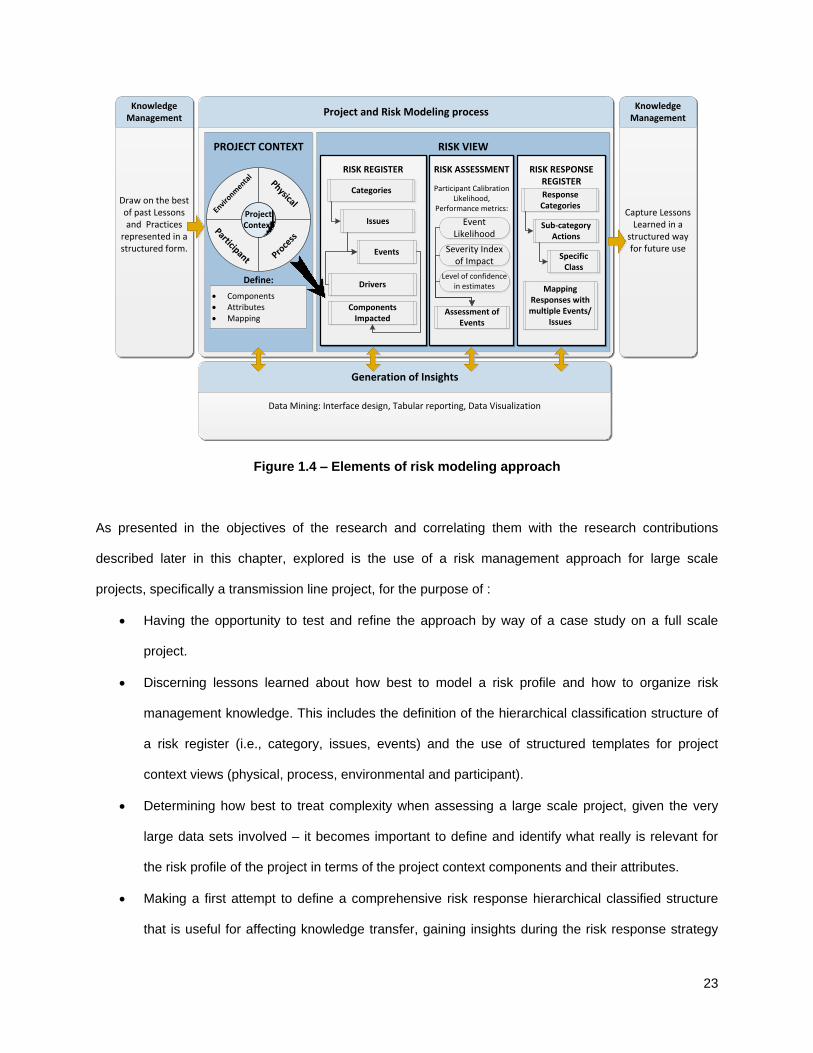
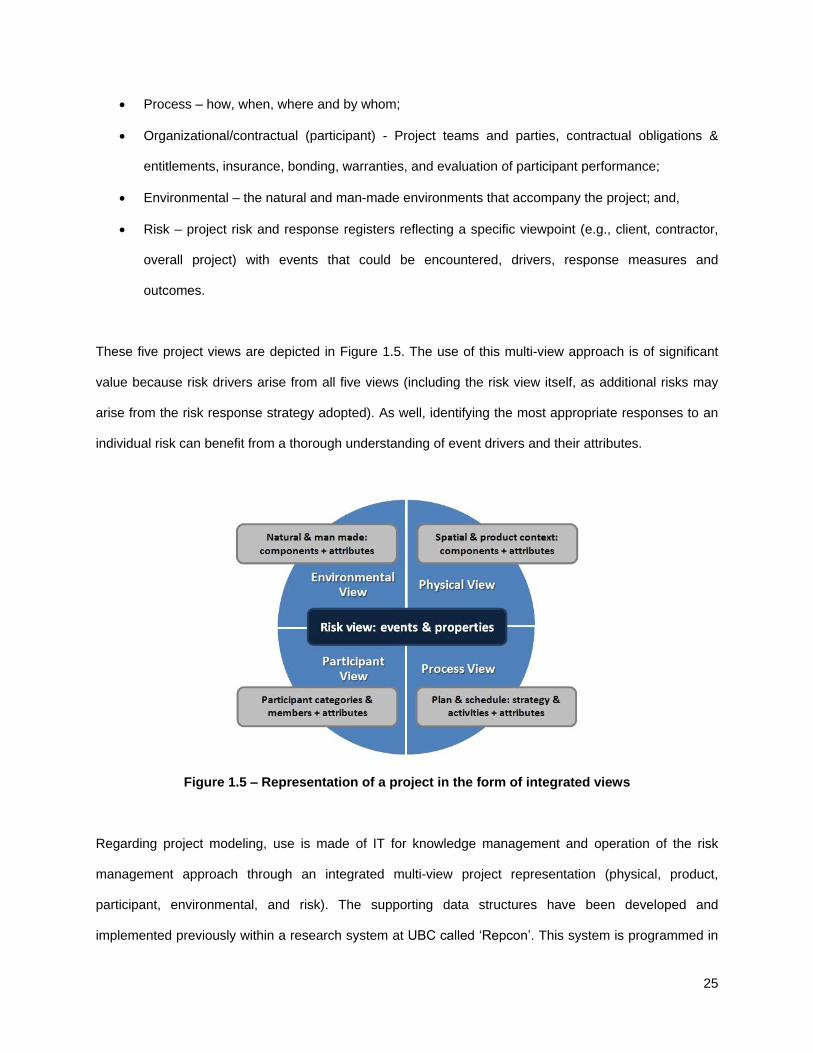
To represent project context in support of the risk management function, five views are employed as
follows:
Physical – what is to be built and site context;
25
Process – how, when, where and by whom;
Organizational/contractual (participant) - Project teams and parties, contractual obligations &
entitlements, insurance, bonding, warranties, and evaluation of participant performance;
Environmental – the natural and man-made environments that accompany the project; and,
Risk – project risk and response registers reflecting a specific viewpoint (e.g., client, contractor,
overall project) with events that could be encountered, drivers, response measures and
outcomes.
These five project views are depicted in Figure 1.5. The use of this multi-view approach is of significant
value because risk drivers arise from all five views (including the risk view itself, as additional risks may
arise from the risk response strategy adopted). As well, identifying the most appropriate responses to an
individual risk can benefit from a thorough understanding of event drivers and their attributes.
Figure 1.5 – Representation of a project in the form of integrated views
Regarding project modeling, use is made of IT for knowledge management and operation of the risk
management approach through an integrated multi-view project representation (physical, product,
participant, environmental, and risk). The supporting data structures have been developed and
implemented previously within a research system at UBC called ‘Repcon’. This system is programmed in
26
C++ and makes use of a Pervasive relational database for data storage, and the API ChartFX tool
(Software FX Inc., 2012) to create built-in data visualizations. Further detail on this system tool has been
explained and documented by De Zoysa (2006).
Russell & Nelms (2007) analyzed other commercial software tools (e.g., RiskEasy, Risk Radar,
PertMaster Project Risk, and RiskCom) to support risk management functions. While these tools are
useful for the purpose for which they were designed, a number of shortcomings exist. For example, the
disconnection between risk management and other project management functions leads to the inability to
integrate a project risk register with project context. This limits the exploitation of knowledge management
concepts, and the ability to use visualizations or other cognitive tools to support the identification,
assessment and response processes of risk management.
An advantage of the adoption of the Repcon system as an integral part of the research methodology for
the work described herein is that it facilitates an integrated approach to the tasks of risk identification and
elicitation, and provides a standardized platform in which risk terminology is made explicit by the use of
the multi-view representation of a project with hierarchical structures of components, combined with the
ability to profile component attributes and the possibility to forge associations amongst view components.
1.5.3 DATA VISUALIZATION FOR INFRASTRUCTURE PROJECTS
Data visualization can play an important role in generating insights into a project’s risk profile both during
and post development of a project risk register. This assists with the challenge of interpreting register to
facilitate the ongoing management of risks. A virtue of data visualization is its ability to portray large
amounts of data in very compact form.
Building on the work of De Zoysa (2006) and Nezafatkhah (2011), one of the themes to develop further is
the identification and implementation of advanced data visualization strategies to assist with viewing,
navigating and understanding the hierarchical representations of the project context and risk views.
27
The exploration of the representation of a project by the use of data mining tools (e.g., interactive
visualizations) offers the advantage of providing a mechanism to intelligently and visually extract what is
relevant to a particular management function such as risk management. If a large amount of information
is presented in a tabular or text format, important messages could be concealed or difficult to
comprehend by upper levels of management. Goals for the data visualization mining process are to:
Be able to find patterns and insights;
Fit required information on a single screen; and
Effectively show deep and broad data sets on a single screen.
Data visualization techniques can be also used as a risk-based approach to assist in detecting project
potential risks and mitigation technique options during the early-lifecycle decision making of a project. For
example, Feather et al. (2006) illustrate the use of software visualizations to capture dependencies
between a three-layer model –project requirements, risks and mitigation– with examples from spacecraft
technologies and systems. Correlating the foregoing approach with the work performed by Nezafatkhah
(2011) on visualizing risk management data associated with capital expenditure projects, a number of
visualizations were explored for this research in order to select and develop images that could be of high
value for extracting information and relevant insights for management teams.
Several visualization techniques exist such as 2D-3D bar and pie charts, scatter plots, heat maps, tree
visualization techniques – rooted tree, radial tree, balloon tree, and tree-map layout, tree net analysis,
parallel coordinates, force-directed graph, node-link diagram, and hierarchical edge bundling exist to help
with visual data mining. The real challenge is not one of finding visualization techniques but of
determining which of the images available are relevant to support the analytical processes involved in risk
management of large scale projects. The question becomes: “What do I want to visualize in order to
generate the insights sought and how?” One has to consider the challenges present within the context of
a large scale project, including: large scale data sets, complexity and inconsistency of information,
incompleteness and constantly changing data, and management team requirements in order to be useful
at that moment and for future use.
28
For large scale projects, the size of the data sets involved can result in visual images that are cluttered
and complex to understand and read. To overcome this, the use of interactive visualizations that enable
working at different levels of detail or with subsets of information while looking for specific insights is
essential. Techniques such as force edge bundling explained by Holten (2006) to improve data cluttering
in hierarchical tree visualization techniques, allow patterns to be shown, making it easier to detect
connections between the components used to represent a project (e.g., between physical, participant,
process, environmental and risk view components).
Current construction industry practice in data visualization is limited to traditional business graphics tools,
restricted mainly by the amount of time and resources that management teams are willing to spend on
learning and implementing state-of-the-art technologies. However, the adoption of a new project modeling
process that includes these visualization technologies can enable the use of more dynamic and
interactive graphics such as real-time charts and dashboards that automatically update as project data
changes, as compared to traditional static graphic tools. These technologies also enable the possibility to
visualize complex and large amount of data sets. Evelson & Yuhanna (2012) differentiate the use of
modern data visualization capabilities from those of static graphics, citing the following advantages for the
former as follows:
Dynamic data content;
Visual querying;
Multiple-dimension, linked visualization;
Animated visualization;
Personalization; and
Business-actionable alerts.
1.5.4 MULTIPLE VISUALIZATION TOOLS AVAILABLE FOR POTENTIAL USE
The adoption of the Repcon research system for project modeling as a tool to integrate the risk
management approach to other project management functions and knowledge management techniques
29
as explained in section 1.5.2, allows the creation of system built-in visualizations of different project view
component profiles (e.g., physical attribute values at different locations) and risk register visualization
reports (e.g., risk assessment (pre-, post-, and actual) linear heat maps at a risk event or issue level, risk
expected value graph, and event scenario probability). Several of the features desired of an IT system
were identified by Russell & Nelms (2007) include the necessity to give careful attention to interface
design when designing a system to facilitate group interaction and understanding of project context
amongst users, speedy navigation of project context and project risk register, and ready feedback of
available project information in a number of formats. Visualization formats deserve special attention when
designing a user interface. Effectively done they can assist with creating a shared image of the project
context amongst those charged with developing the project’s risk profile, including the simultaneous
access to data from all project views and the ability to understand the linkage of risk drivers with risk
events/issues, thus providing insights into a project’s risk profile in aid of decision making.
With respect to data visualization software, the market is characterized by multiple software developers
and visualization tools. Choice of which tool to use depends on the functionality desired, technical
requirements of the software, practical issues regarding system implementation, and extent of learning
required to use effectively. These tools can be very useful to visualize aspects of interest of the different
project views (e.g., during risk identification sessions or analyzing relationships amongst risk drivers for a
specific risk). Nevertheless it should be clear that by using graphic tools that are not integrated within the
system being used to model risk, the opportunity to represent all possible image types within an
integrated model will not exist: at best what can be done is export data from the risk management system
for use by one of the specialty data visualization tools available on the market. This option is particularly
appropriate when relatively static data is involved or when the data results are not likely to change
anymore, thus requiring only a one-time visualization of the data. The difference between a static
instance of data sets and interaction with data is that even if the data visualization tool can create
interactive images; the data sets are not being updated automatically if the project model is modified.
30
The increasing pace of technological development has a strong influence on the changing availability of
data visualization tools. As data visualization technology evolves, industry at large finds data visualization
platforms to be essential tools that enable them to monitor business and projects, find patterns, and take
action to avoid threats and seize opportunities. According to an assessment presented by Evelson &
Yuhanna (2012) of a number of advanced data visualization vendors, it was found that the company
leaders in the industry as of fall of 2012 were: Tableau Software, IBM, Information Builders, SAS, SAP,
Tibco Software, and Oracle due to the breadth of their data visualization business intelligence (BI)
functionality offerings. The next tier of vendors included Microsoft, MicroStrategy, Actuate, QlikTech,
Panorama Software, SpagoBI, Jaspersoft, and Pentaho, all of which offer solid functionality to enable
users to effectively visualize and analyze data. In addition, a number of open source visualization tools
are freely available for anyone that wants to develop personalized data visualizations such as Data-
Driven Documents (D3) java scripts (Bostock, 2012), Gephi (Gephi, 2012), InfoVis java scripts (Garcia,
2012), sigma java scripts (Jacomy, 2012), Circos (Krzywinski et al., 2009), Sparklines for Microsoft excel
(Rimlinger, 2012), NodeXL networks for Excel (Smith et al., 2010), Orange – data mining (Curk et al.,
2005), Google chart tools (Google Developers, 2012), and others.
Research and development in data visualization has received a great deal of attention in the last few
years. Educational institutions and large corporations are investing significant resources in this area;
academic and independent developers are working together on the development of data visualization
tools offering different kinds of advanced applications to facilitate complex systems. For example, the
work of General Electric Data visualization laboratories (General Electric, 2012) is focused on deriving
insights, innovations and discoveries from large amounts of data in multiple topics through the use of data
visualization; the MIT SENSEable City Lab (MIT, 2012) is studying and understanding how cities are
being radically transformed along with the impacts on their physical structure.
Other relevant research in different fields of data visualization as it relates to the work described in this
thesis includes that of Holten (2006) from the “Technische Universiteit Eindhoven” in the Netherlands
(hierarchical edge bundles and visualization of adjacency relations in hierarchical data), Ben
31
Shneiderman (Smith et al., 2009) from the University of Maryland (network visualization by semantic
substrates, human-computer interaction, applications of Node XL), Gou & Zhang (2011) (TreeNetViz:
patterns of networks over tree structures), Telea & Voinea (2008) (developers of Solid Source IT
software), and Boyd (2012) (InProv, algorithm for provenance data and radial layout visualization).
In the search for data visualizations that could assist with extracting insights from a project’s risk register
in terms of detecting relationships between risk events and risk drivers, assisting in decision making for
determining where to focus resources, and selecting the most appropriate risk response actions; it was
found that hierarchical tree structures could be used to represent the different project views in a radial or
circular layout. Mappings supported between view components (nodes) can be represented by a series of
linking edges. In the context of this research, the interactions shown in the radial view represent a
relationship between a risk event in the risk view structure with risk drivers from the other project views.
Note that a single risk event could be linked to a significant number of drivers. Of particular interest to
construction personnel are risk drivers that are connected to multiple risk events. Such information assists
greatly in identifying the most effective risk responses – i.e., select those responses that target risk drivers
associated with multiple risks, thereby achieving significant leverage.
The reason for selecting a radial layout for the hierarchical tree structure of the risk management model is
because the associated visualizations are capable of clearly showing patterns for the large data sets
involved, as well as showing different levels of node detail. As described by Boyd (2012), visualization
attempts for large graphs commonly fall within three categories: node-link diagrams, tree maps and radial
layouts. A detailed description and presentation of graph and tree visualizations is beyond the scope of
the research. The radial layouts used are explained in more detail in this thesis, but further information
and comparison of graphs and visualizations for all three graph categories is discussed by Boyd (2012).
The radial layout displays the nodes (components) in a hierarchical outer ring and the edges (links) as
curve connectors in the center of the ring. Benefits of the representation are two-fold: first is that it
focuses on specific relationships between nodes by cross-scale exploration, rather than the relative
32
spatial location of nodes (useful in smaller graphs); and second, when using large data sets, the
relationship represented by the edges is consistently encoded and bundled allowing the image to convey
higher-level meaning – e.g., patterns.
One of the advantages of the radial layout visualization technique is that the aggregation level of detail
can be adjusted as desired in order to focus on important or specific project issues. However, this visual
representation can lead to a visual cluttering if a large number of edges are represented. Utilizing an edge
bundling technique (Holten, 2006; Holten & Wijk, 2009; Gou & Zhang 2011) is an effective way to reduce
the visual cluttering and complexity when communicating relationships in dense networks. This technique
groups parallel edges or connectors with nearby origin destination as if they were tied, allowing the
reading of a large number of similar relationships as a single line thereby assisting with the
comprehension of a large data set in order to extract insights. Groupings are of two types: Force-directed
edge bundling (Holten & Wijk, 2009) or hierarchical edge bundling when visualizing graphs with a
hierarchical structure (Holten, 2006).
Relevant software was evaluated to determine which would be more suitable to use as an external tool to
complement the use of the integrated risk management approach within the Repcon system. System data
of interest would be exported from Repcon, manipulated or transformed as required, and then accessed
by the visualization tool. Besides the functionality features of the visualization tool, other factors such as
limitations on the amount of time and resources available to develop the external visualizations had to be
considered. In terms of the visualization of interactive graphs and dashboards to represent project context
view properties and profiles as well as heat maps and other useful charts, TIBCO Software Inc. (2012)
and Tableau Software (2012) were the Business Intelligence tools that fit well for that purpose. In regards
to an external tool that could assist in understanding dependencies and the interaction between project
components at different levels of hierarchy and across the multiple project views, the use of SolidSX
software (Solid Source IT, 2010) provided an excellent solution. Similar tools like NetTreeViz from
Pennsylvania State University (Gou & Zhang, 2011) or InProv from Harvard College (Boyd, 2012) were
also evaluated. However, SolidSX provided an efficient radial layout with the possibility to adapt easily the
33
exported data from the project model. SolidSX external tool integration analytics are explained by Telea &
Voinea (2008).
In summary, the data visualization tools selected for use as part of the risk modeling and exploration
process to fulfill the research objectives are:
Repcon (UBC research tool) integrated built-in visualizations of project model views;
SolidSX (Solid Source IT, 2010); and,
Tibco Spotfire 4.5 (TIBCO Software Inc., 2012).
1.6 TRANSMISSION LINE PROJECTS
Provision of electrical power to any industry, domestic user or any other final users requires a fully
developed electrical system, which consists of three main parts: generation, transmission and distribution.
Together, they combine to create, transport and distribute the electricity. This research is focused on
electrical transmission infrastructure projects. An overhead power line is an electric power transmission
line suspended by towers, referenced in this research as “transmission line”. The main purpose of these
infrastructure projects is to transport electrical power from one location to another through a transmission
grid. Nevertheless, the electrical transmission system is more complex and dynamic than other utilities,
such as water or natural gas (Public Service Commission of Wisconsin, 2011; WECC, 2011).
Electricity flows from power plants, through transformers, transmission lines to substations, distribution
lines and then to the consumer. The transmission system is highly interconnected, not just transmission
lines to load centers but also to other transmission lines to assure the smooth flow of power in the grid.
The power entering the system flows along all available paths, not just from point A to point B. This
means that the system doesn’t recognize divisions between service areas, estates or countries.
Transmission line power source include a diversity of sources, for example, coal, nuclear, natural gas, oil,
or renewable energy sources such as hydropower, biomass, wind, or solar power. Considering that each
generation source provides a fraction of the power being delivered to the grid, the reason to develop a
34
network is to achieve high reliability for power delivery to meet instantaneous demand requirements. And
the main reasons to construct a new transmission line are to fulfill the actual and future demand of
electricity for a particular distribution area, to revitalize aging infrastructure, to optimize transmission
energy efficiency with new technology, and to pursue renewable energy sources.
In order to understand the scope of transmission line projects, introduced here are the components
involved and how best to model or represent such a project. Project context and transmission line specific
components are described in different references with different scopes and levels of detail (e.g., BCTC,
2007; BCTC, 2008; Blanco et al., 2010; and ESKOM, 2004). The anatomy of a transmission line project,
after analyzing the references and industry practices, can be represented by the following components:
Project alignment land;
Right-of-way (ROW);
Access roads;
Clearing areas;
Fly-staging yards;
Batch plants;
Storage, temporary facilities, and tower assembly areas;
Foundations;
Transmission towers and line (specific components);
Capacitor stations; and
Substation terminations.
Specific components of a transmission tower and line (Blanco et al., 2010) are:
Transmission towers;
Conductors;
Earth wires;
Insulators; and
Wave traps and other hardware.
35
Conductors consist of a wire or group of wires not insulated from each other, suitable for carrying an
electrical current. For High Voltage (HV) transmission lines the common conductor material types are:
ACSR (Aluminium Conductor Steel Reinforced) and AACSR (Aluminium Alloy Conductor Steel
Reinforced). Transmission towers provide support for the overhead conductors. Towers are commonly
made of steel lattice structures. Two structural configurations are typically used: Delta configuration (three
phases arranged in triangular configuration) and Flat configuration (three phases arranged in a horizontal
or flat configuration). Both structural configurations can be designed as guyed and self-supporting
depending on terrain and weather loading conditions. Delta configuration can be used when taller
structures are required in order to reduce the right-of-way (ROW) and clearing widths, to increase power
transfer capability and to reduce electric and magnetic fields. The flat configuration is commonly used in
heavy ice-loading condition areas because of strength, or if shorter structures are required to reduce
visual impact (BCTC, 2008).
Knowing the components that are involved in a transmission line project, two questions need to be
addressed: first, how best to model such a project in terms of the relevant project views; and, second,
how to relate transmission line project context to risk management practices. Blanco et al. (2010) explain
how transmission and distribution industry major risks encountered during the design and construction of
transmission lines can affect the insurer party under a Construction-All-Risk/Erection-All-Risk (CAR/EAR)
policy. But this reference as well as other publications (e.g., Daoulas, 2011; Leung et al., 1998; McCall,
2009; Marshall & Baxter, 2002; and Tummala & Burchett, 1999) do not treat the integration of project
components and attributes with a risk management approach in a way that allows management to
overview the entire project and gain insights during the development of the project risk register.
Transmission line components are located along highly variable and complex geographical locations that
include different types of terrain and climate conditions, and ownership by private individuals or firms and
where the utility provider maintains specific rights governing transmission line ROW. Agreement to own
these lands allows utilities to construct, maintain and replace facilities, as well as preserve space for

36
future developments (BC Hydro, 2010). Physical systems then, should be defined properly in order to
address the scope of how, and what kind of work will relate to each of the physical locations. The
following systems are considered to be present in a transmission line project:
Contract;
Submittals – plans, drawings, other documents;
Clearing;
Access;
Foundations;
Tower assembly;
Tower erection;
Line work; and
Site restoration.
It is important to model the system structure depending on factors related not only to its physical
attributes but also considering project context (e.g., environmental context, permit and regulatory
processes, community and First Nations consultation, project participants and third party stakeholders,
procurement processes, work execution strategy). The project context model as depicted in Figure 1.5
(Integrated multiple-views form) is directly applicable to transmission line projects.
1.6.1 PROJECT CONTEXT AND COMPLEXITY
High voltage transmission line projects are large scale, geographically dispersed ones, which entail the
presence of highly variable conditions and participation of multiple stakeholders involved in their approval,
design, procurement and construction. Consideration of the geotechnical conditions, weather conditions,
sensitivity to environmental issues, First Nations and third party stakeholder issues, regulatory processes,
offshore procurement, a new relationship with the client, communication and coordination issues, and
lack of experience of project personnel with project type, provides a big picture overview of the complexity
of project content that must be treated. The complexity comes from the combination of these factors
along the project alignment together with the strategy pursued to coordinate and execute the work
37
involved. General contractor teams required to manage high voltage transmission line projects can vary
from 10 to 50 in staff and more, depending on specific project properties.
1.6.2 PROJECT SCALE AND STRUCTURING
Scale becomes an important issue in transmission line projects because of the need to analyze in detail
all aspects of the project components and context along the transmission line corridor. The result of this is
reflected in the production of a significant amount of information (e.g., correspondence, permits,
consultation agreements, assessment reports, engineering reports, drawings, plans, and spreadsheets);
considerable inconsistency can exist in terms of level of detail in this information, level of completeness,
usage of language, etc.
The need to structure hierarchically the project context and the risk view allows management staff to work
at different levels of detail, from bundled information at the highest level down to information at the
individual component/location level, thereby assisting with obtaining insights from the large scale of
information involved.
1.6.3 PHYSICAL VIEW
The physical (product) view treats the spatial context of a project (e.g., physical work locations and
procedural steps in processes such as procurement, permits, and drawings) as well as the products to be
produced both on and off site and in different phases of a project’s life cycle. A mapping exists between
the spatial context and products (e.g., at what locations is a specific product to be installed, such as a
particular foundation type for a transmission tower). For large scale linear projects, the need exists to
define locations at different levels of granularity (e.g., overall project, project section, individual work
location).
1.6.4 PROCESS VIEW
The process (planning and scheduling) view identifies the processes to be used to realize the project
(e.g., regulatory, review, design, procurement, construction, commissioning, restoration processes). A
38
mapping exists between the physical and product views to answer the question: what gets produced,
where, when and by whom.
1.6.5 PARTICIPANT VIEW
The participant view (organizational/contractual) details the categories of parties involved, and within
each category, specific organizations, groups or individuals that have a direct or indirect relationship with
the project. Often overlooked in risk identification sessions are project participants who can be a
significant source of risk for reasons such as lack of experience, insufficient capacity, or outright
opposition to the project. A mapping exists between project participants and activities that comprise the
process view.
1.6.6 ENVIRONMENTAL VIEW
The environmental view reflects both the natural and man-made environments in which a project is
immersed. The former relates to the weather, geotechnical, flora, fauna, and other conditions that
characterize the site and surrounds. The latter relates to the project’s social / economic / regulatory /
political environments. Environmental components can be mapped onto the project’s spatial context.
1.6.7 RISK VIEW
The risk view contains the project risk register as well as a risk response register, with a mapping
between the two. The risk register can be structured in a hierarchical manner, thus assisting with the task
of navigating a large register. It has been found that a three level hierarchy of phase, issue and event to
be particularly useful and one that aids knowledge transfer between projects. Many of the issues or
categories of risk tend to repeat from one project to the next, although individual risk events can be very
different. At the individual event level, a number of properties can be associated with each event, ranging
from risk drivers, qualitative and/or quantitative assessment of the likelihood of the risk event and
performance measures impacted if the risk occurs (e.g., time, capital cost, O&M cost, severity index, etc.),
measured on a pre-risk response, post-risk response or actual basis, and the risk responses adopted.
39
Similar to the project risk register, a risk response register in the form of a hierarchical structure
comprised of category, subcategory, class and response can be defined. At the individual response level,
is possible to associate particular risk responses to individual risk events as well as risk issues.
1.6.8 CONSTRAINTS
Many constraints accompany transmission line projects. Many of them relate to the environmental view,
since the natural and man-made environments address several issues to be considered while the project
is planned and executed (e.g., environmental work time windows, endangered species areas,
environmental work avoidance zones, geotechnical and topographical restrictions, weather conditions,
black-out times due to temperature, bog or golf areas, and regulatory specifications). Other constraints
relate to contract provisions, such as intermediate milestone dates as well as overall project completion,
restoration requirements, etc.
1.6.9 FLEXIBILITY
Transmission line projects are required to have flexibility in terms of design, permits, construction
processes and strategy during execution of the work because conditions in these projects are not always
as anticipated. As the project unfolds, there might be a need to re-design components (foundations,
towers), re-sequence the execution of work, re-structure component breakdown structures, adapt
construction methods and cope with changed accessibility to work areas. Lessons learned from other
transmission line projects (McCall, 2009) suggest that the best way to overcome project context
challenges such as geotechnical, environmental and schedule coordination issues is to be prepared for
all foreseeable situations in design, so that construction can proceed as scheduled. In practice, project
context constraints could trigger a major impact for both cost and schedule if there is not a proper risk
response action plan.
1.7 ILM TRANSMISSION LINE PROJECT PROFILE
The project is a 500 KV, 255 km long transmission line, located in British Columbia, Canada, connecting
the Merritt and Coquitlam Substations, and involves some 680 towers (the number of locations involved in
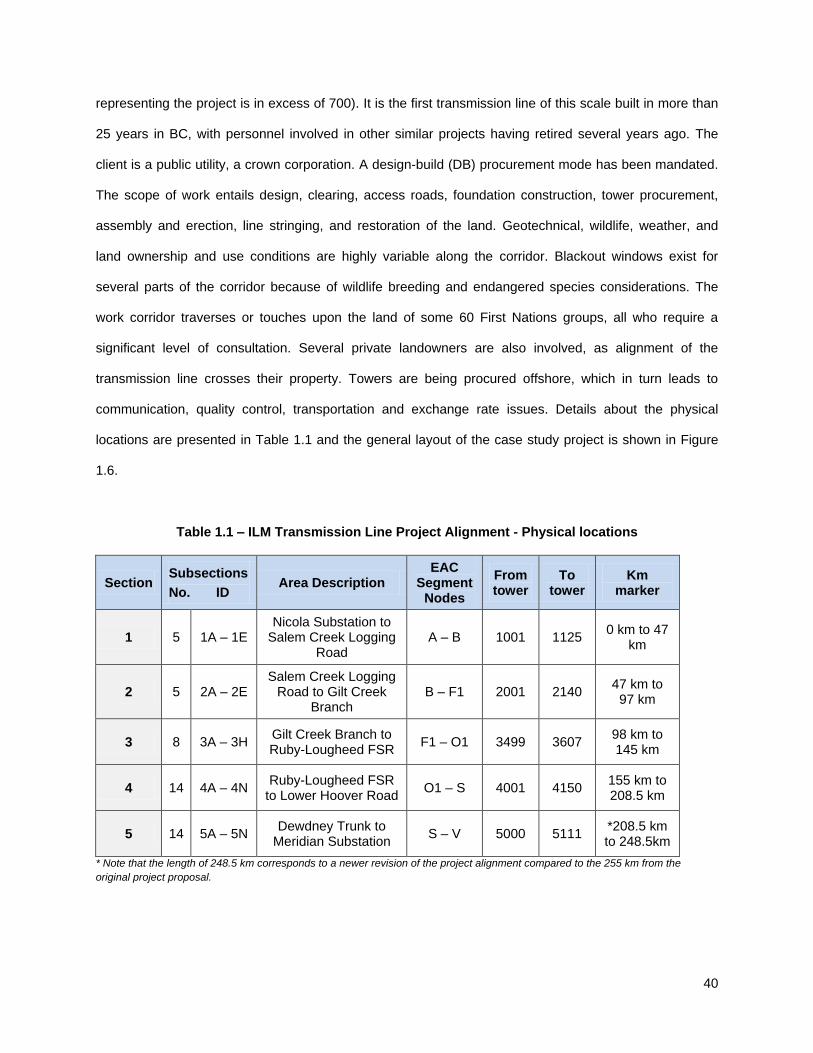
40
representing the project is in excess of 700). It is the first transmission line of this scale built in more than
25 years in BC, with personnel involved in other similar projects having retired several years ago. The
client is a public utility, a crown corporation. A design-build (DB) procurement mode has been mandated.
The scope of work entails design, clearing, access roads, foundation construction, tower procurement,
assembly and erection, line stringing, and restoration of the land. Geotechnical, wildlife, weather, and
land ownership and use conditions are highly variable along the corridor. Blackout windows exist for
several parts of the corridor because of wildlife breeding and endangered species considerations. The
work corridor traverses or touches upon the land of some 60 First Nations groups, all who require a
significant level of consultation. Several private landowners are also involved, as alignment of the
transmission line crosses their property. Towers are being procured offshore, which in turn leads to
communication, quality control, transportation and exchange rate issues. Details about the physical
locations are presented in Table 1.1 and the general layout of the case study project is shown in Figure
1.6.
Table 1.1 – ILM Transmission Line Project Alignment - Physical locations
Section Subsections
No. ID Area Description
EAC Segment
Nodes
From tower
To tower
Km marker
1 5 1A – 1E Nicola Substation to
Salem Creek Logging Road
A – B 1001 1125 0 km to 47
km
2 5 2A – 2E Salem Creek Logging
Road to Gilt Creek Branch
B – F1 2001 2140 47 km to
97 km
3 8 3A – 3H Gilt Creek Branch to Ruby-Lougheed FSR
F1 – O1 3499 3607 98 km to 145 km
4 14 4A – 4N Ruby-Lougheed FSR
to Lower Hoover Road O1 – S 4001 4150
155 km to 208.5 km
5 14 5A – 5N Dewdney Trunk to
Meridian Substation S – V 5000 5111
*208.5 km to 248.5km
* Note that the length of 248.5 km corresponds to a newer revision of the project alignment compared to the 255 km from the
original project proposal.
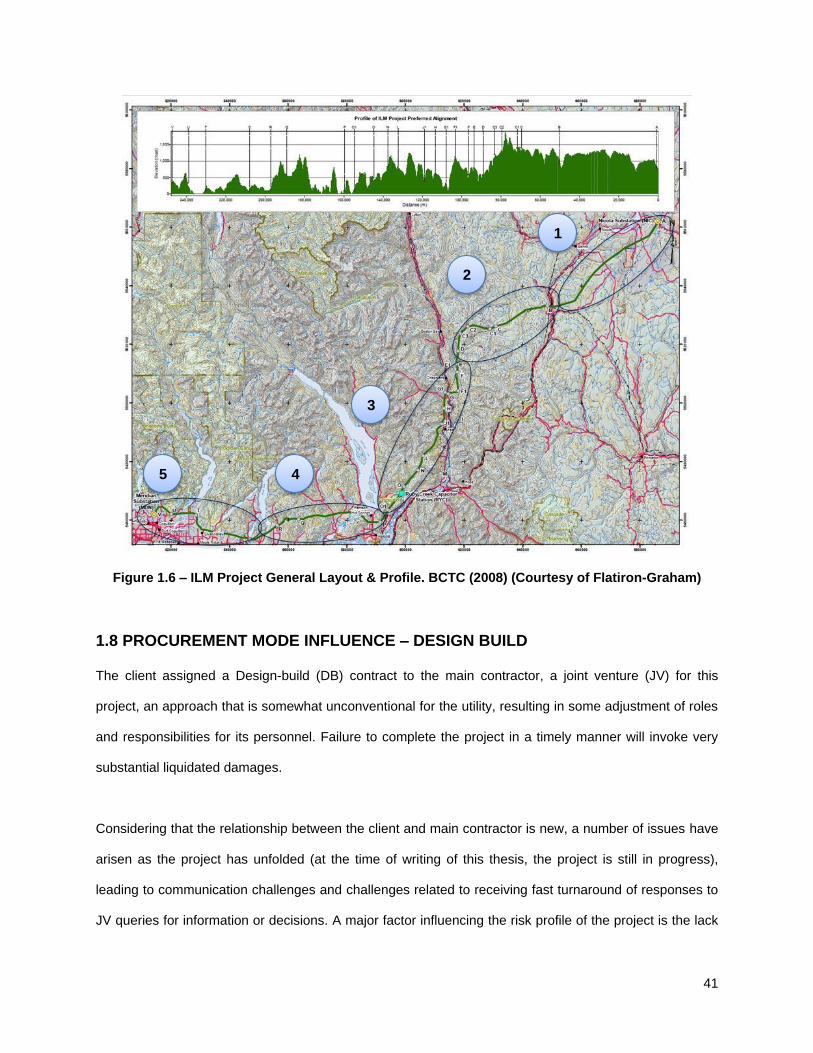
41
Figure 1.6 – ILM Project General Layout & Profile. BCTC (2008) (Courtesy of Flatiron-Graham)
1.8 PROCUREMENT MODE INFLUENCE – DESIGN BUILD
The client assigned a Design-build (DB) contract to the main contractor, a joint venture (JV) for this
project, an approach that is somewhat unconventional for the utility, resulting in some adjustment of roles
and responsibilities for its personnel. Failure to complete the project in a timely manner will invoke very
substantial liquidated damages.
Considering that the relationship between the client and main contractor is new, a number of issues have
arisen as the project has unfolded (at the time of writing of this thesis, the project is still in progress),
leading to communication challenges and challenges related to receiving fast turnaround of responses to
JV queries for information or decisions. A major factor influencing the risk profile of the project is the lack
1
2
3
4 5
42
of experience of the client with a design-build delivery mode for this type of project (their preferred mode
being design-bid-build (DBB)), and this being the first transmission line project for the JV. A DB contract
can present a series of advantages and disadvantages depending on how the division of responsibilities
and scopes are assigned and if this division of responsibilities is respected (Daoulas, 2011; Beehler,
2009).
The major impact for the contractor of a DB procurement mode is the risk allocation, particularly, if the
project involves highly variable site conditions which could result in actual subsurface conditions being
significantly different from those considered during the bid or proposal phase of the project. In addition,
far more consultation than envisaged at the outset of the project might be required with land owners or
First Nations groups, affecting work sequences, resources required, and challenges with meeting
timelines. Further, complex regulatory processes could impact the work schedule and plan of works.
Under a DBB contract most of these risks are allocated to the client/consultant; in a DB contract, these
risks are allocated between the contractor and the client as a shared risk in terms of cost and/or time as
defined by specific contract language.
Geotechnical risks as well as the risks mentioned above play a very important role in assessing the
feasibility, cost, schedule, and successful long term performance of a DB project (Daoulas, 2011). Such
risks concern both the client and the DB contractor since they can have a significant impact on cost and
schedule contingencies included in bid proposals; their realization could increase the potential for
unforeseen costs and time delays in a project.
1.9 MODELING PROCESS REALITY
A very significant challenge is reflecting the reality and complexity of the project in a process model view
of the project. The reality for transmission line projects as it is for other linear projects such as pipelines is
that, except for certain activities like line stringing works, the spatial sequence of work can cause
problems during the modeling process. Due to the varying specific situation of each spatial location or set
of locations and the presence of other constraints (e.g., permits, regulatory and natural constraints to
43
access the site locations and perform clearing works), is nearly impossible to perform the works in an
easily predicted ordered location sequence. This complicates the preparation of a strategic plan and
schedule of works projected in terms of ordered linear sequences. Because of this reality, the optimal
strategy to perform the works involves adopting an opportunistic process strategy – i.e., determine the
rate at which work needs to be conducted for the various physical components, but execute the work in a
spatial sequence that reflects availability of access in terms of environmental windows, negotiations with
owners for site access, etc.
1.10 CONTRIBUTIONS OF THE WORK
A summary of research contributions claimed for the work described in this thesis is as follows:
1) Conducting a detailed case study that provides insights into:
a. The complexities of transmission line projects because of environmental, geographical
(physical), participant and process dimensions (the 4 views and their attributes).
b. How to model the 4 project context views and attributes of direct relevance to risk
identification.
c. Identifying risk issues relevant to the different phases of a transmission line project.
d. Identifying risk events relevant to the various risk issues in each phase.
e. Challenges in expressing likelihood and impact of a risk event.
f. Risk management in practice – what a contractor does – the formality vs. informality of their
approaches and why.
2) Lessons learned about modeling
a. The need to work at different levels of granularity – e.g., both fine-grained (towers) and
coarse grained (environmental) locations.
b. Model at different levels of detail as a function of the project dimension being examined.
c. ‘Quantifying’ risks is a real challenge – very difficult to estimate time and cost for individual
risks – use of a surrogate measure can be helpful – e.g., severity index.
d. Capacity to present a flexible but structured model that could be used in future projects
capturing relevant lessons learned.
44
3) Risk response and data mining
a. A first step has been taken toward developing a risk response register. A thin literature exists
that treats the topic in generalities (e.g., Hillson, 1999; Dey, 2010; Al-Bahar & Crandall,
1990; PMI, 2008; WSDOT, 2010; ICE, 2005). Structuring and compiling a risk response
register is a challenge – an initial contribution to organizing knowledge for this risk dimension
has been made.
b. The role that data visualization can play in generating insights into a project’s risk profile has
been explored.
1.11 THESIS STRUCTURE
This thesis has been written as a manuscript based thesis, with an ‘extended draft-paper’ manuscript
corresponding to Chapter 2 of the thesis. The thesis is structured as follows.
Chapter 1 Thesis overview: Presented in this chapter is motivation for the thesis focus, research
objectives and methodology, literature review about risk management, project modeling for construction
management, data visualization, and general features of transmission line projects. The chapter closes
with the introduction to the case study and the contributions to the research work.
Chapter 2 Modeling risk for transmission line projects: This chapter contains an extended draft
manuscript-based paper on the topic of risk management for construction, adopting a risk modeling
approach for large scale, long linear projects, and application of the approach to a case study of a 255km,
500 KV transmission line project. It also focuses on the search of meaningful insights into a project’s
context and risk register using data visualization. As well, a structured approach to project risk response
is described. Chapter 2 is the core of the thesis and describes in detail the research work. A version of
Chapter 2 will be submitted for possible publication. The authorship of this chapter is Diego Orozco
Mojica – Graduate student at the Department of Civil Engineering – UBC, and Alan David Russell –
Professor, Department of Civil Engineering, UBC, and Chair, Computer Integrated Design and

45
Construction – UBC. There is a considerable overlap between Chapters 1 and 2, as Chapter 2 is meant
to stand alone, but without as extensive a treatment of the relevant literature as presented in Chapter 1.
Chapter 3 Conclusions: This chapter describes lessons learned and contributions of the research, along
with suggestions for future work related to this research area.

46
CHAPTER 2. MODELING RISK FOR TRANSMISSION LINE PROJECTS
2.1 INTRODUCTION
Large scale geographically distributed infrastructure projects consists of substantial complexity, scope,
and vast volume of data of different types to be distilled and analyzed. Significant risk is involved during
the approval, design and construction of such projects given highly variable terrain and weather
conditions, restricting working time lines, the multiplicity of the environmental, First Nations, land
ownership, and third part stakeholder issues involved, and challenging regulatory and procurement
processes. These infrastructure projects embrace transmission lines, pipelines, water diversion projects,
high speed transit projects, etc. The association of the project context, scale, and constraints with the
specific project components is essential for effective analysis and understanding of these. The
dimensionality of the risks involved, identifying them along with their corresponding properties (i.e.,
likelihood, impact, drivers, components impacted, etc.) can be a very significant challenge, and the stakes
can be extraordinarily high for project participants, specially client, contractor, users, and third party
stakeholders. Improvements in risk management practices can result in significant benefits for the parties
involved. The question: “How to achieve such improvements?” is addressed in this paper.
The topic of risk management for capital projects has been treated by many academics as well as
practitioners (e.g., ICE, 2005; WSDOT, 2010; Wideman, 1992; Rolstadås, 2011; and Leung et al., 1998).
In most cases, it is treated as a standalone, spreadsheet-based function, which seldom capitalizes on the
formal representations of a project used in support of other project management functions. As a result, an
opportunity is lost in terms of linking risk events and attendant properties to specific project features
expressed in terms of a consistent vocabulary. Also lost is the opportunity to gain insights on how best to
respond to individual risk events as well as categories of risks. These observations along with the
complexity of modern large scale infrastructure projects have provided motivation for the work described
herein.
47
Examined is a holistic, integrated approach to risk management which seeks to address the question
posed previously. From the perspective of this paper, features sought in an integrated approach include a
rich characterization of project context, direct connectivity with other project management functions, a
comprehensive risk modeling capability, data mining, and knowledge transfer.
Use of the approach is illustrated through its application to a large scale linear infrastructure project,
specifically a transmission line project. Topics treated are ordered as follows. First, motivation for the work
described in terms of its application to large scale infrastructure projects is provided by way of a short
overview of the demand for transmission line projects in North America for the next several years. Then,
given is a description of key features of a highly structured, integrated approach to risk management.
Emphasis is placed on the explicit treatment of project context, given its very important role both in
helping to identify risk drivers as well as how best to respond to risks. Third, demonstrated is the
application of the approach by way of a case study on a 255 km 500 KV transmission line design-build
project currently in progress in British Columbia. Teased out are important lessons with respect to
modeling risk for large, geographically dispersed projects. Fourth, how data visualization can assist in
extracting valuable insights from the large scale data sets that accompany such projects is examined.
Fifth, an approach for structuring potential responses to risks is overviewed in aid of assisting with
selection of a risk response strategy. The paper concludes with some observations on the practical
challenges involved in risk management for large scale, geographically dispersed projects and how the
use of a structured risk model approach results in significant value for the construction industry.
In terms of the research methodology employed, it consisted of: (i) extensive review and use of the
academic and practitioner literature as it relates to risk management in general and transmission line
construction in particular; (ii) use of a risk management approach previously developed by De Zoysa
(2006), Russell & Nelms (2007), and Nelms (2012), and enhanced further as part of the work described
herein; (iii) application of the approach to a transmission line project currently in progress, including
embedment of one of the authors in the project office for a period of six weeks; and, (iv) extensive review
of the data visualization literature, and the use of state-of-the-art visualization tools to help develop and
48
explore the contents of the project risk register, including risk event properties. Validation of the work was
pursued through a detailed review of the approach and findings in the context of the study project with
senior project personnel. Literature examined is cited as appropriate in the relevant sections of the paper.
An important challenge involved in carrying out the research was working with a case study project that
was in progress, especially a fast-tracked design-build project. This required one to deal with a lack of
available information and constant updates of documents, which was compounded by the significant size
of the data sets involved, given the scale of the project. At the same time, project modeling was a task
that took a long time to develop, and made more difficult by the need to continuously update and modify it
to reflect changing conditions of the project, all of which was necessary to capture the essence of the
project in a comprehensive model. The approach for modeling long-linear projects is intensive when
contractor personnel need to pursue an opportunistic strategy in order to perform the work due to
imposed project restrictions (e.g., environmental windows, third party stakeholder difficulties, permitting
difficulties, and off-shore procurement).
2.2 TRANSMISSION LINE PROJECTS
The importance of transmission line projects around the globe is noteworthy due to the increasing
demand for power (e.g., Europe, Asia and North America are significant energy consumers) (Blanco et
al., 2010). For example, over the next several years in North America the power grid will be revitalized
and extended to deal with aging infrastructure, new technologies, capacity constraints, forecasted load
demands and the pursuit of renewable energy sources such as wind and solar. In the US alone, more
than 65,000 miles of transmission line work will be required by 2020. According to the Western Electricity
Coordinating Council (WECC) 10-Year Regional Transmission Plan (WECC, 2011), the need to build
future transmission and generation projects in Western North America is influenced by recognizing the
potential economic benefits of transmission expansion to the grid. Delay in building could result in
diminished opportunities to realize these economic benefits, inadequate power supply, and high
operational and maintenance costs. WECC has presented a list of 44 major transmission projects to be
49
constructed by 2020, adding at least 5,500 line miles of 200kV and above lines. The estimated capital
cost of the projects envisaged totals some $20 billion (WECC, 2011).
In Canada, the increase in demand for electricity is growing quickly leading to the need to rapidly develop
generation and transmission capacity. For example, in Alberta the Alberta Electric System Operator
(AESO) highlighted in their Long-term Transmission Plan a cost estimate for the projects anticipated to be
in service by 2020 of some $13.5 billion (AESO, 2012). In British Columbia, the utility provider BC Hydro
is expecting that over the next 20 years the demand for energy could grow by as much as 50% before
accounting for savings that could be achieved by current conservation and efficiency or demand-side
measures (BC Hydro, 2012).
Transmission line projects are located along highly variable and complex geographical locations that
include different types of terrain, climate conditions, and land ownership. There are a number of risks
associated with transmission line projects regarding: (i) project context and complexity (e.g., geotechnical
conditions, sensitivity to environmental issues, regulatory processes), (ii) project scale and structuring
(e.g., significant amount of information, lack of data consistency), and (iii) project constraints (e.g., natural
and man-made environment, contractual terms, and time lines). Similar profiles can be made for other
large scale, geographically distributed infrastructure projects such as pipelines, water diversion projects,
high speed transit projects, etc. Many of the issues addressed in this paper apply to these projects as
well.
2.3 RISK MANAGEMENT APPROACH OVERVIEW
2.3.1 INTRODUCTION TO RISK MANAGEMENT PROCESS
Provided in this section is an overview of the state-of-the-art of risk management processes with
emphasis on their application to infrastructure projects along with a discussion of the strengths and
weaknesses of the state-of-the-art. This is followed by comments on the specific contributions derived
from applying the integrated multiple view risk management approach described and espoused herein to
50
model a project’s profile. The section concludes with the introduction of the holistic risk management
modeling approach adopted for the identification of risk as a function of project context.
Risk is present in all projects, and can be defined as an uncertain outcome or event that could occur
inflicting a favorable or unfavorable effect if it occurs. If the outcome is favorable it is considered an
opportunity, and if the event occurrence has an unfavorable outcome then it is considered as a risk
(Wideman, 1992). Complementing these definitions, ICE (2005) defines risk as the potential impact of all
the threats (and opportunities) which can affect the achievement of the objectives for an investment. A
number of frameworks that aim to structure a risk management process have been reviewed in the
academic and practitioner literature (e.g., ICE, 2005; Wideman, 1992; PMI, 2008; WSDOT, 2010;
Chapman & Ward, 2003; Leung et al., 1998; Rolstadås, 2011; Al-Bahar & Crandall, 1990; Hillson, 1999;
and Dey, 2010). It is beyond the scope of this paper to describe in detail each of the risk frameworks
available in the state-of-art. Nevertheless, it is important to comment on the similarities and differences in
approaches, and assess the contributions to the field of risk management along with corresponding
limitations of the risk model approaches presented.
The risk management literature is vast and a significant number of tools / procedures are available that
range from quite simple to very complex. Although the risk management processes described by various
authors vary from each other in terms of different scopes and description of processes and terminology,
one can identify certain core elements which are common to all these approaches. These core elements
include (i) Risk identification, (ii) Risk assessment, (iii) Risk response, and (iv) Risk control and
monitoring. However, there are a number of shortcomings in current processes with respect to treating
risk within an integrated framework including knowledge management. Amongst these shortcomings is
the poor embedment of project risk with project context. Framed another way, an important question is:
“How best to represent project context to support risk management?”
To date, several researchers have focused on treating specific processes that form part of a risk
management framework (Leung et al., 1998; Hillson, 1999; Dey, 2010) while have proposed extensive
51
risk management frameworks that cover all of the core elements of risk management and include as well
additional processes with a series of steps to carefully follow. However, these additional steps may make
implementation of the associated framework too difficult to achieve, or if implemented, provide a process
that is very tedious and time consuming to use, and without the benefits promised (ICE, 2005; PMI, 2008;
Wideman, 1992; Al-Bahar & Crandall, 1990). Non-traditional approaches that involve a significant change
in the way to develop a framework for risk management work has some appeal; nevertheless the level of
effort to implement such a framework has not yet been tested on actual projects, making it difficult to
judge the merits of such a framework (Rolstadås, 2011).
The inability to integrate project risk information with explicit representations of project context also
interferes with the attempt to re-use the contents of risk registers for future projects. Even though various
authors have proposed frameworks, tools or methodologies for risk identification, analysis, and response
development, seemingly little work has been done on developing an integrated risk management
approach (e.g., Dey, 2010; De Zoysa, 2006; Leung et al., 1998; and Rolstadås, 2011) that embraces the
core elements identified previously plus direct connectivity with project context and other project
management functions (e.g., planning and scheduling), knowledge management and data mining.
Further, there are very few frameworks and accompanying studies that link risk analysis outcomes with
risk response strategies (e.g., Hillson, 1999; Dey, 2010; Al-Bahar & Crandall, 1990). An integrated
approach to project risk management not only combines the risk management processes of identification,
analysis and development of responses in an analytical framework, but also integrates risk management
processes with the entire project management process (Dey, 2010). For example, Leung et al. (1998)
developed the RMP methodology (including risk identification, measurement, assessment, evaluation and
risk control and monitoring processes) that was applied to a framework for managing cost risk for an EHV
transmission line project, but did not integrate cost risk with schedule and project quality related risks.
Dey (2010) proposed an integrated framework for project risk management that includes an analytical
hierarchical process, which quantifies risk, deals with project time and cost parameters, and considers a
few aspects of environment and process but doesn’t treat risk by specific locations. As proposed, the
framework could be difficult to navigate in pursuit of insights once the risk profile is developed, given the
52
complex structure used to represent each of the project work package and activity levels across each
project phase (feasibility, planning, implementation, etc.).
Another shortcoming of current approaches is the structure of risk registers and how to manage them,
which makes difficult the task of making modifications to the risk register caused by a dynamic changing
project context, a situation particularly relevant to large scale linear projects. Also when a large number of
risks are present along with the significant information that accompanies each risk, it becomes difficult to
navigate through the risk register, hampering the risk management process and the opportunity to gain
insights from the risk register. The lack of use of consistent terminology in defining the risk register and
project context during the risk management process and after when preparing the information for re-use
in future projects, could lessen the opportunity to transfer knowledge effectively. Another disadvantage of
current approaches is that knowledge is mostly captured as a static instance, also lessening the ability to
add lessons learned. This is because large scale project context component modeling including the risk
register structure requires an extended period of time to develop due to the sizeable scope of such
projects and attendant documentation, number of participants involved, and uncertain and changing
project conditions.
The support for risk management frameworks through the use of knowledge-based approaches has some
limitations. For example, an attempt to develop a rule-based system would likely result in a very large set
of rules that would not be readily understood by users and would require experts to maintain it. Typically,
knowledge-based systems have been limited by their authors to supporting a subset of project types,
such as oil pipelines or transmission lines (Dey, 2010; and Leung et al., 1998). Also, the treatment of
project context in knowledge-based systems as described in the literature is thin. The approaches
proposed by Leung et al. (1998) and Rolstadås (2011) treat aspects of environmental and organizational
components as risk factors, but the components modeled within these systems are few in number
compared to the ones that a large scale project would need in order to properly represent project context.
53
In terms of execution of a risk management method, some risk management frameworks focus only on
certain processes and little attention is given to other stages in the overall risk management process. For
example, ICE (2005) identifies risk management process limitations as including: concentration of the
treatment of risks in the asset creation phase rather than on potentially higher risks in other project stages
(e.g., construction, and procurement); lack of a satisfactory method for combining risks when in many
cases the risks treated separately are interdependent; little attention to changing risk exposure during the
investment life cycle; the tendency to focus on risks which can be most easily quantified without the
exercise of proper judgment to get a good feel for other risks involved; and, an inadequate follow through
from project risk analysis to the control of risks once project implementation starts.
Despite many useful contributions by others with respect to managing risk and related knowledge,
including a number of best practices and lessons learned, a considerable amount of work remains to be
done in order to develop an approach that meets most if not all of the challenges encountered in risk
management, especially as applied to large scale construction projects. A key issue is the ability of the
approaches described by various researchers to cope with full-scale projects – what appears to work on
small scale model projects might not translate well to large scale ones. A more detailed literature review
and analysis as it relates to the topic of the state-of-art for risk management and knowledge-based
methodologies can be found in the work made by De Zoysa (2006).
2.3.2 PROJECT MODELING FOR LARGE SCALE INFRASTRUCTURE PROJECTS
Fundamental to the way of thinking about risk management in particular and construction management
functions in general is use of an abstracted yet comprehensive representation of a project in terms of
multiple views (e.g., product, process, participant, environmental, change, quality, as-built, risk, etc.).
Such an approach is of significant value in terms of offering an integrated approach to management
functions. It has been described in some detail by Russell & Udaipurwala (2004).
In structuring the views for the risk model approach the use of hierarchical structures proves to be very
effective for handling complexity and scale. One can work at different levels of detail or granularity
54
depending on the aspect of the project being analyzed. For example, in describing potential risk events
and their properties (e.g., likelihoods, impacts, drivers, etc.), the use of a classification by issues and
project phases can help in providing an overview of the project risk register at a managerial level; for
detailed risk analysis and assessment, one can drill down into specific details at the individual risk event
level.
To represent project context in support of the risk management function, five views are employed as
follows:
Physical – what is to be built and site context;
Process – how, when, where and by whom;
Organizational/contractual (participant) - Project teams and parties, contractual obligations &
entitlements, insurance, bonding, warranties, and evaluation of participant performance;
Environmental – the natural and man-made environments that accompany the project; and,
Risk – project risk and response registers reflecting a specific viewpoint (e.g., client, contractor,
overall project) with events that could be encountered in the project phases of interest, drivers,
response measures and outcomes.
Important to the foregoing views is the ability to define attributes and corresponding values for the
components that make up project views. The fundamental question to be addressed is: “What do I really
need to know in order to carry out the functions of interest?” Making those attributes explicit and how best
to define them in as parsimonious a manner as possible is a non-trivial yet very important task, especially
with respect to meaningful knowledge transfer from one project to the next. Often they are considered on
an implicit or intuitive basis when judgments are offered, especially in the realm of risk management. Real
value accrues from making them explicit. Compounding the challenge of capturing component attribute
values is that they are often dynamic as opposed to static as a project unfolds. Thus, versioning becomes
important during the life of a project, both in terms of the composition of the various project views as well
as for attribute values.

55
The five project views are depicted in Figure 2.1. The use of this multi-view approach is of significant
value because risk drivers arise from all five views (including the risk view itself, as additional risks may
arise from the risk response strategy adopted). As well, identifying the most appropriate responses to an
individual risk can benefit from a thorough understanding of event drivers and their attributes.
Figure 2.1 – Representation of a project in the form of integrated views
2.3.2.1 PHYSICAL VIEW
The physical (product) view treats the spatial context of a project (e.g., physical work locations and
procedural steps in processes such as procurement, permits, and drawings) as well as the products to be
produced both on and off site and in different phases of a project’s life cycle. A mapping exists between
the spatial context and products (e.g., at what locations is a specific product to be installed, such as a
particular foundation type for a transmission tower). For large scale linear projects, the need exists to
define locations at different levels of granularity (e.g., overall project, project section, project subsection,
or individual work location) in order to model effectively the project views of interest.
2.3.2.2 PROCESS VIEW
The process (planning and scheduling) view identifies the processes to be used to realize the project
(e.g., regulatory, review, design, procurement, construction, commissioning, and restoration processes).
56
A mapping exists between the physical and product views to answer the question: what gets produced,
where, when and by whom.
2.3.2.3 PARTICIPANT VIEW
The participant (organizational/contractual) view details the categories of participants involved (e.g.,
suppliers, First Nations, regulatory agencies, etc.), and within each category, specific organizations,
groups or individuals that have a direct or indirect relationship with the project. Often overlooked in risk
identification sessions are project participants who can be a significant source of risk for reasons such as
lack of experience, insufficient capacity, or outright opposition to the project. A mapping exists between
project participants and activities that comprise the process view.
2.3.2.4 ENVIRONMENTAL VIEW
The environmental view reflects both the natural and man-made environments in which a project is
immersed. The former relates to the weather, geotechnical, flora, fauna, and other conditions that
characterize the site and surrounds. The latter relates to the project’s social / economic / regulatory /
political environments. Environmental components can be mapped onto the project’s spatial context.
2.3.2.5 RISK VIEW
The risk view contains the project risk register as well as a risk response register, with a mapping
between the two. The risk register can be structured in a hierarchical manner, thus assisting with the task
of navigating a large register. Based on past experience with projects, it is not recommended to use a
deep hierarchy. It has been found a three level hierarchy of phase, issue and event to be particularly
useful, and one that aids knowledge transfer between projects. Many of the issues or categories of risk
tend to repeat from one project to the next, although individual risk events can be very different. At the
individual event level, a number of properties can be associated with each event, ranging from risk
drivers, components from one or more project views along with attributes that constitute the specific
source of the risk (if the user chooses to work at this level of granularity), view components impacted by
the risk should it occur, qualitative and/or quantitative assessment of the likelihood of the risk event and
57
performance measures impacted if the risk occurs (e.g., time, capital cost, O&M cost, severity index, etc.),
measured on a pre-risk response, post-risk response or actual basis, and risk responses adopted.
Similar to the project risk register, a risk response register in the form of a hierarchical structure
comprised of category, subcategory, class and response can be defined. At the individual response level,
it is possible to associate particular risk responses to individual risk events as well as to risk issues.
2.3.2.6 RISK KEY CONCEPTS
Before introducing the risk management approach adopted, it is important to define the terminology for
the key concepts used. The definitions used have been elaborated from a synthesis of literature
references presented in De Zoysa (2006). The term ‘Risk issue’ is used to refer to keywords that
represent topic areas of direct relevance to a project, around which uncertainty or lack of predictability
may exist. A risk issue may result in multiple risk events, and consequent uncertainty in one or more
project performance measures. The term ‘Risk event’ corresponds to the potential variability in a project
parameter from its anticipated value, or one or more discrete scenarios in which the possible states of
nature that can be realized can be identified, but the one which will actually occur as well as its outcome
is not known with certainty. A risk event can apply to the project as a whole, i.e., its sphere of influence is
global, or it can be local in terms of its immediate influence and hence treatment. The term ‘Risk Driver’
relates to the components of the physical, process, participant, and environmental domains, the presence
of which or characteristics of which make a risk issue relevant to a particular project phase and context
component. A risk driver represents the relationship between the project context and the risks of a
project.
2.3.3 RISK MODEL APPROACH
Described here is a brief overview of the holistic risk management approach utilized in support of the
research. This approach has been developed over an extended time period, and its evolution has been
documented in part in the work by De Zoysa (2006), Russell & Nelms (2007), and Nelms (2012) which in
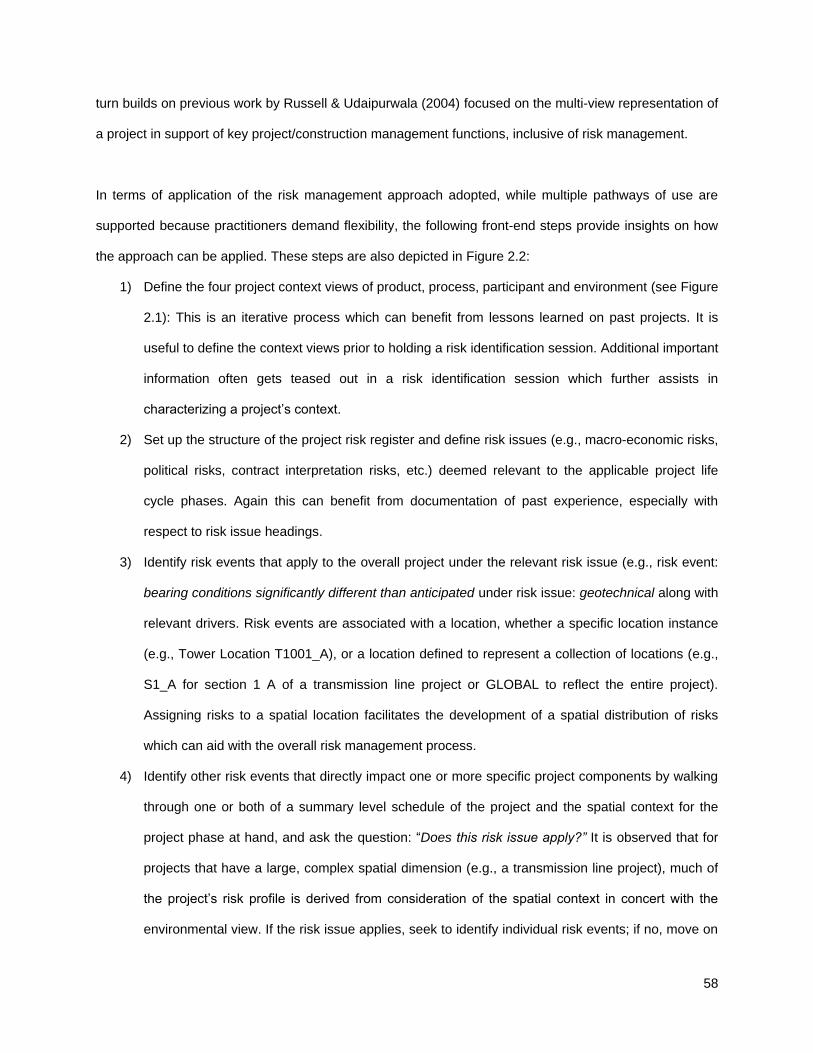
58
turn builds on previous work by Russell & Udaipurwala (2004) focused on the multi-view representation of
a project in support of key project/construction management functions, inclusive of risk management.
In terms of application of the risk management approach adopted, while multiple pathways of use are
supported because practitioners demand flexibility, the following front-end steps provide insights on how
the approach can be applied. These steps are also depicted in Figure 2.2:
1) Define the four project context views of product, process, participant and environment (see Figure
2.1): This is an iterative process which can benefit from lessons learned on past projects. It is
useful to define the context views prior to holding a risk identification session. Additional important
information often gets teased out in a risk identification session which further assists in
characterizing a project’s context.
2) Set up the structure of the project risk register and define risk issues (e.g., macro-economic risks,
political risks, contract interpretation risks, etc.) deemed relevant to the applicable project life
cycle phases. Again this can benefit from documentation of past experience, especially with
respect to risk issue headings.
3) Identify risk events that apply to the overall project under the relevant risk issue (e.g., risk event:
bearing conditions significantly different than anticipated under risk issue: geotechnical along with
relevant drivers. Risk events are associated with a location, whether a specific location instance
(e.g., Tower Location T1001_A), or a location defined to represent a collection of locations (e.g.,
S1_A for section 1 A of a transmission line project or GLOBAL to reflect the entire project).
Assigning risks to a spatial location facilitates the development of a spatial distribution of risks
which can aid with the overall risk management process.
4) Identify other risk events that directly impact one or more specific project components by walking
through one or both of a summary level schedule of the project and the spatial context for the
project phase at hand, and ask the question: “Does this risk issue apply?” It is observed that for
projects that have a large, complex spatial dimension (e.g., a transmission line project), much of
the project’s risk profile is derived from consideration of the spatial context in concert with the
environmental view. If the risk issue applies, seek to identify individual risk events; if no, move on
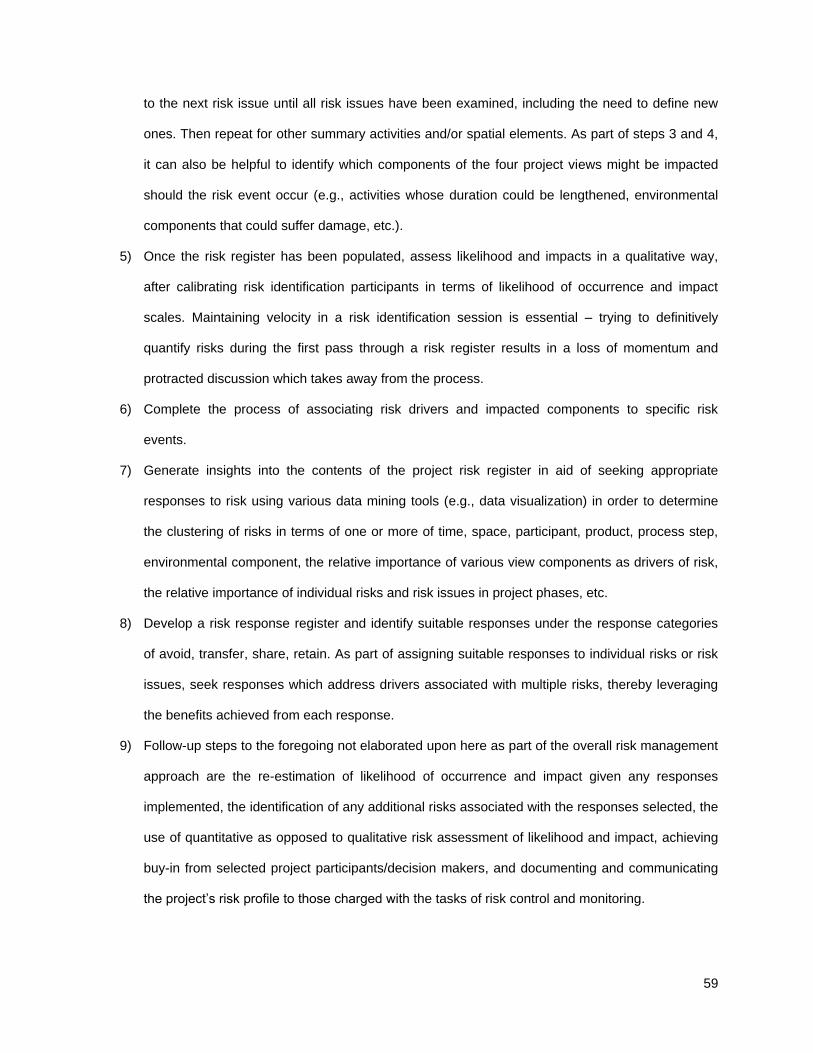
59
to the next risk issue until all risk issues have been examined, including the need to define new
ones. Then repeat for other summary activities and/or spatial elements. As part of steps 3 and 4,
it can also be helpful to identify which components of the four project views might be impacted
should the risk event occur (e.g., activities whose duration could be lengthened, environmental
components that could suffer damage, etc.).
5) Once the risk register has been populated, assess likelihood and impacts in a qualitative way,
after calibrating risk identification participants in terms of likelihood of occurrence and impact
scales. Maintaining velocity in a risk identification session is essential – trying to definitively
quantify risks during the first pass through a risk register results in a loss of momentum and
protracted discussion which takes away from the process.
6) Complete the process of associating risk drivers and impacted components to specific risk
events.
7) Generate insights into the contents of the project risk register in aid of seeking appropriate
responses to risk using various data mining tools (e.g., data visualization) in order to determine
the clustering of risks in terms of one or more of time, space, participant, product, process step,
environmental component, the relative importance of various view components as drivers of risk,
the relative importance of individual risks and risk issues in project phases, etc.
8) Develop a risk response register and identify suitable responses under the response categories
of avoid, transfer, share, retain. As part of assigning suitable responses to individual risks or risk
issues, seek responses which address drivers associated with multiple risks, thereby leveraging
the benefits achieved from each response.
9) Follow-up steps to the foregoing not elaborated upon here as part of the overall risk management
approach are the re-estimation of likelihood of occurrence and impact given any responses
implemented, the identification of any additional risks associated with the responses selected, the
use of quantitative as opposed to qualitative risk assessment of likelihood and impact, achieving
buy-in from selected project participants/decision makers, and documenting and communicating
the project’s risk profile to those charged with the tasks of risk control and monitoring.
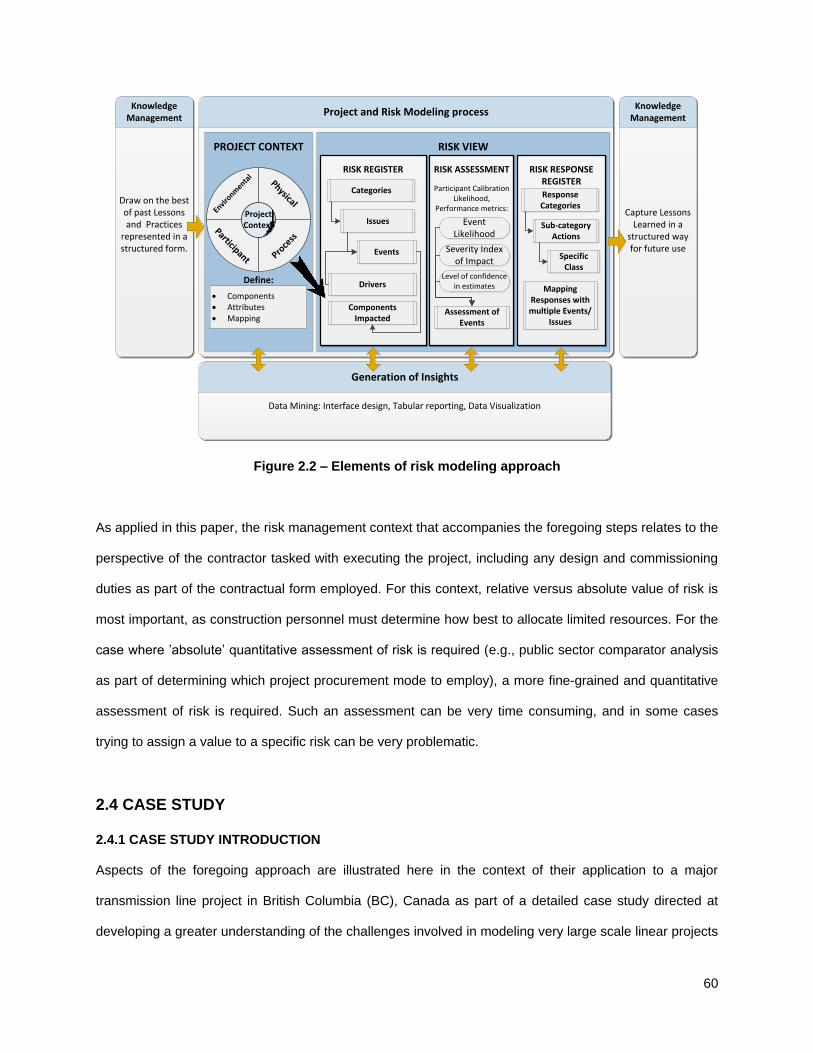
60
Knowledge Management
Draw on the best of past Lessons and Practices
represented in a structured form.
Project and Risk Modeling process
Generation of Insights
Data Mining: Interface design, Tabular reporting, Data Visualization
PROJECT CONTEXT
Define:
Enviro
nmenta
l
Participant
Physical
Proce
ss
Project Context
Components Attributes Mapping
RISK VIEW
RISK REGISTER
Categories
Issues
Events
Drivers
Components Impacted
RISK ASSESSMENT
Participant Calibration Likelihood,
Performance metrics:
RISK RESPONSE REGISTER
Knowledge Management
Capture Lessons Learned in a
structured way for future use
Response Categories
Sub-category Actions
Specific Class
Mapping Responses with multiple Events/
IssuesAssessment of
Events
Severity Index of Impact
Event Likelihood
Level of confidence in estimates
Figure 2.2 – Elements of risk modeling approach
As applied in this paper, the risk management context that accompanies the foregoing steps relates to the
perspective of the contractor tasked with executing the project, including any design and commissioning
duties as part of the contractual form employed. For this context, relative versus absolute value of risk is
most important, as construction personnel must determine how best to allocate limited resources. For the
case where ’absolute’ quantitative assessment of risk is required (e.g., public sector comparator analysis
as part of determining which project procurement mode to employ), a more fine-grained and quantitative
assessment of risk is required. Such an assessment can be very time consuming, and in some cases
trying to assign a value to a specific risk can be very problematic.
2.4 CASE STUDY
2.4.1 CASE STUDY INTRODUCTION
Aspects of the foregoing approach are illustrated here in the context of their application to a major
transmission line project in British Columbia (BC), Canada as part of a detailed case study directed at
developing a greater understanding of the challenges involved in modeling very large scale linear projects
61
including the risk dimension, and for validating the usefulness of the approach to risk management. The
motivation for the lead contractor in the joint venture firm (JV) to participate is two-fold: they are interested
in enhancing their processes, and more fundamentally as described previously, a very large market in
transmission line construction is unfolding in North America. Because of the latter, they seek a
competitive advantage by documenting their experience on this their first transmission line project.
Interestingly, the academic and practitioner literature directly relevant to risk management for
transmission line projects is small (e.g., Beehler, 2009; Burchett et al., 1999; and Tummala & Burchett,
1999). Other literature directed at risk identification, mitigation and environmental issues as it relates to
transmission line projects includes: Kalkani & Boussiakou (1996), Marshall & Baxter (2002), Yamatani &
Jahangir (2011), Blanco et al. (2010), and Public Service Commission of Wisconsin (2011). Also reviewed
was literature focused on design and construction challenges dealing with variable geotechnical
conditions, environmental permits, temperature conditions in different geographical locations and design
flexibility (e.g., McCall et al., 2009; Lakhapati, 2009; and Wyman, 2009). Nevertheless, from a practitioner
perspective, the available literature is thin, especially for firms wishing to enter this market segment and
who have no prior experience with transmission line projects.
The case study project is a 500 KV, 255 km long transmission line, and involves some 680 towers (the
number of locations involved in representing the project is in excess of 700). It is the first transmission line
of this scale built in many years in BC, with personnel involved in other similar projects having retired
several years ago. The client is a public utility, a crown corporation. A design-build (DB) procurement
mode has been mandated, an approach that is somewhat unconventional for the utility, resulting in some
adjustment of roles and responsibilities for its personnel. Failure to complete the project in a timely
manner will invoke very substantial liquidated damages. The scope of work entails design, clearing,
access roads, foundation construction, tower procurement, assembly and erection, line stringing, and
restoration of the land. Geotechnical, wildlife, weather, and land ownership and use conditions are highly
variable along the corridor. Blackout windows exist for several parts of the corridor because of wildlife
breeding and endangered species considerations. The work corridor traverses or touches upon the land
62
of some 60 First Nations groups, some of whom wish to achieve training/employment opportunities,
others with concerns on archeological and other cultural issues, all who require a significant level of
consultation. Several private landowners are also involved, as alignment of the transmission line crosses
their property. Towers are being procured offshore, which in turn leads to communication, quality control,
transportation and exchange rate issues.
2.4.2 PROJECT CONTEXT MODELING
Before describing how project context is modeled for the risk management approach used, it is insightful
to discuss the approach used by the contractor of the case study. From the project documentation,
correspondence and other files available at the project office, the use of structured construction
management practices can be inferred (i.e., use of a number of large spreadsheets to address different
issues and keep records, assignment of multiple individuals to specific dimensions of the project in order
to become knowledgeable in certain areas, and treatment of issues and agreements pooled through
multiple meetings). These practices worked sufficiently well for the contractor, but a number of
opportunities are lost, one of them being the ability to oversee and communicate the project status in a
structured consistent way, another being to reflect on project context through multiple integrated views.
With respect to the latter the ability to do this was a contribution of the research to the project.
2.4.2.1 PROJECT CONTEXT AND COMPLEXITY
High voltage transmission lines are large scale geographically dispersed projects, which entail the
presence of highly variable conditions and participation of many stakeholders involved in their approval,
design, procurement and construction. Consideration of geotechnical conditions, weather conditions,
sensitivity to environmental issues, First Nations and third party stakeholder issues, regulatory processes,
offshore procurement, a new relationship with the client, communication and coordination issues, lack of
experience of project personnel with this project type, provides some appreciation of the dimensions of
project context. Complexity comes from the combination of these factors along the project alignment
together with the strategy to coordinate and execute the work.
63
2.4.2.2 PROJECT SCALE AND STRUCTURING
Scale becomes an important issue in transmission line projects because of the need to analyze in detail
all aspects of the project components along the transmission line corridor as reflected in the
representation of the project’s spatial context. The result of this is reflected in the production of a
significant amount of information (e.g., correspondence, permits, consultation agreements, assessment
reports, engineering reports, drawings, plans, and spreadsheets) which lacks consistency in terms of
granularity and depth of treatment with how project components of different types are represented. The
ability to structure project context hierarchically including the risk view allows one to work at different
levels of information as required for the task at hand, making possible the ability to obtain insights from
the large volumes of information involved both in terms of input information and information generated.
2.4.2.3 CONSTRAINTS
Significant sources of the challenges involved in a transmission line project are constraints that affect the
execution of the work. Many of these constraints relate to the environmental view, since the natural and
man-made environments address several issues to be considered while the project is planned and
executed (e.g., environmental work time windows, endangered species areas, environmental work
avoidance zones, geotechnical and topographical restrictions, weather conditions, black-out times due to
temperature, bog or golf areas, and regulatory specifications). Others relate to contractual issues in terms
of time lines (intermediate and overall completion milestones), regulatory approvals, client approvals, and
protocols dealing with communication with third parties.
2.4.2.4 FLEXIBILITY
Flexibility in the formulation of execution strategy for transmission line projects is in terms of design,
permits, procurement, logistics and construction processes because project conditions do not always
unfold as anticipated. This results in the need to re-design selected physical components (e.g., footings),
re-structure component breakdowns (e.g., substitute one tower type for another), and adapt construction
methods and accessibility to working areas. Lessons learned from other transmission line projects
(McCall, 2009) indicate that the best way to overcome challenges associated with project context such as
64
geotechnical, environmental, and schedule coordination issues is to be prepared for all foreseeable
situations as part of the design process, so that construction can proceed as scheduled. In practice,
project context constraints could trigger a major cost and schedule impact if there is not a proper risk
response action plan.
2.4.2.5 PROJECT CONTEXT VIEWS MODELING PROCESS
The process to model the physical, participant, process, and environmental views could require an
intensive level of effort depending on the level of detail at which the project is modeled. One has to ask
the question: ‘What components in each view are relevant to risk management functions, how to structure
each of the views, and what do I need to know about these components?’ Depicted in Figure 2.3 (a) is
part of the spatial context (section 1A) of the project’s physical view. Noteworthy is the need to define
different levels of granularity – sections (there are 5), subsections within a section (5 – 8) and individual
locations within a subsection. Different levels of aggregation are used for different monitoring and
reporting needs by the JV. For example, it is sufficient to model clearing work in terms of subsections,
while foundation and tower work requires treatment on a location by location basis. Of concern for both
overall management of the project and specifically for risk management are the attributes for each
individual location. Depending on their value, singly or in combination with other attributes and possibly
the properties of components from other project views, they could suggest the potential for a risk event.
Shown in Figure 2.3 (b) are the location attributes determined to be of importance for the case study
project. Values can be expressed in one of Boolean, Quantitative, Linguistic, or Date terms. As a side
benefit, attribute values vs. location can be displayed in visual terms, providing additional insights quickly
on potential problem areas, especially the confluence of undesirable values for a number of attributes
(e.g., location attributes of geotechnical conditions, foundation type, tower elevation, and tower type). A
partial view of location attributes for section 1A is presented in Figure 2.17 in the section of the paper that
treats the topic of data visualization. Having this kind of data readily accessible in a risk identification
session can greatly assist in the identification of potential risks.
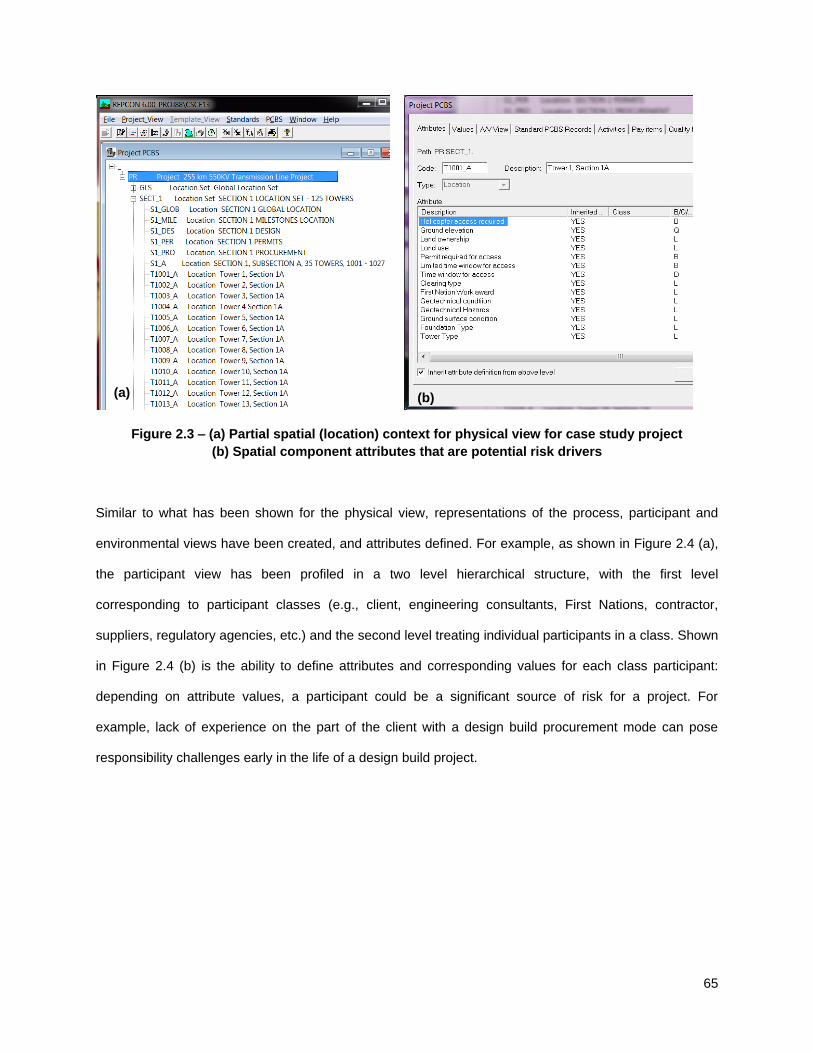
65
Figure 2.3 – (a) Partial spatial (location) context for physical view for case study project
(b) Spatial component attributes that are potential risk drivers
Similar to what has been shown for the physical view, representations of the process, participant and
environmental views have been created, and attributes defined. For example, as shown in Figure 2.4 (a),
the participant view has been profiled in a two level hierarchical structure, with the first level
corresponding to participant classes (e.g., client, engineering consultants, First Nations, contractor,
suppliers, regulatory agencies, etc.) and the second level treating individual participants in a class. Shown
in Figure 2.4 (b) is the ability to define attributes and corresponding values for each class participant:
depending on attribute values, a participant could be a significant source of risk for a project. For
example, lack of experience on the part of the client with a design build procurement mode can pose
responsibility challenges early in the life of a design build project.
(a) (b)
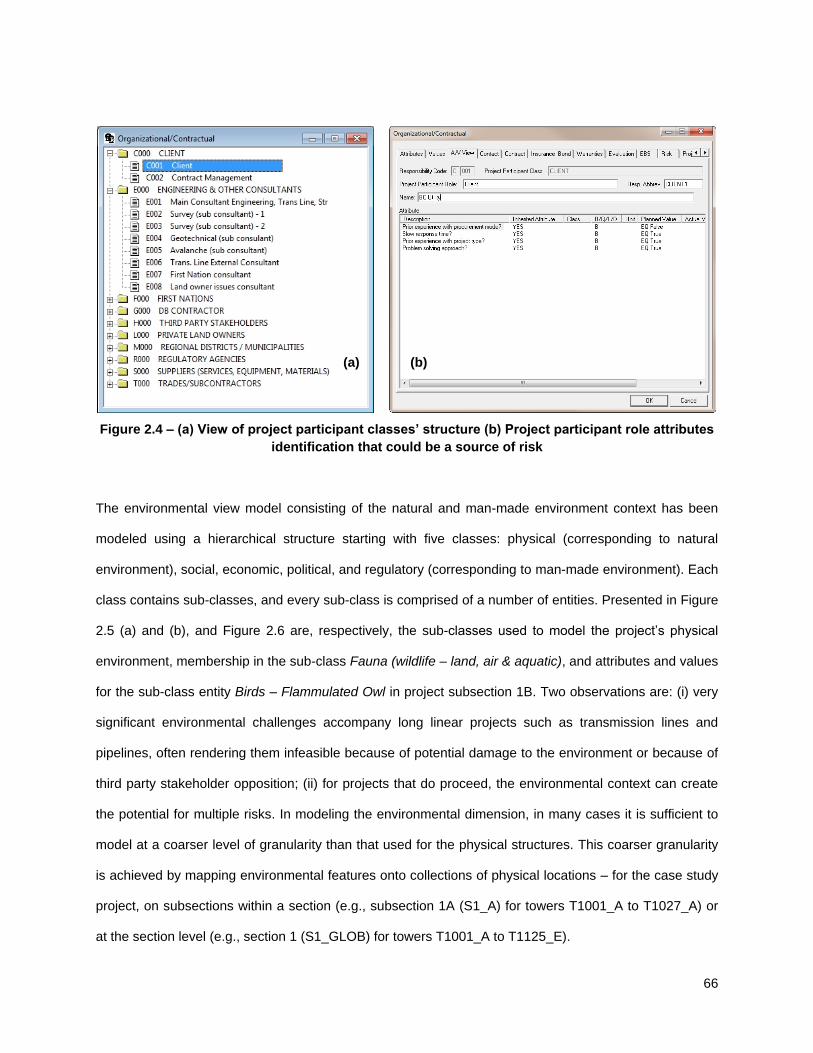
66
Figure 2.4 – (a) View of project participant classes’ structure (b) Project participant role attributes
identification that could be a source of risk
The environmental view model consisting of the natural and man-made environment context has been
modeled using a hierarchical structure starting with five classes: physical (corresponding to natural
environment), social, economic, political, and regulatory (corresponding to man-made environment). Each
class contains sub-classes, and every sub-class is comprised of a number of entities. Presented in Figure
2.5 (a) and (b), and Figure 2.6 are, respectively, the sub-classes used to model the project’s physical
environment, membership in the sub-class Fauna (wildlife – land, air & aquatic), and attributes and values
for the sub-class entity Birds – Flammulated Owl in project subsection 1B. Two observations are: (i) very
significant environmental challenges accompany long linear projects such as transmission lines and
pipelines, often rendering them infeasible because of potential damage to the environment or because of
third party stakeholder opposition; (ii) for projects that do proceed, the environmental context can create
the potential for multiple risks. In modeling the environmental dimension, in many cases it is sufficient to
model at a coarser level of granularity than that used for the physical structures. This coarser granularity
is achieved by mapping environmental features onto collections of physical locations – for the case study
project, on subsections within a section (e.g., subsection 1A (S1_A) for towers T1001_A to T1027_A) or
at the section level (e.g., section 1 (S1_GLOB) for towers T1001_A to T1125_E).
(a) (b)
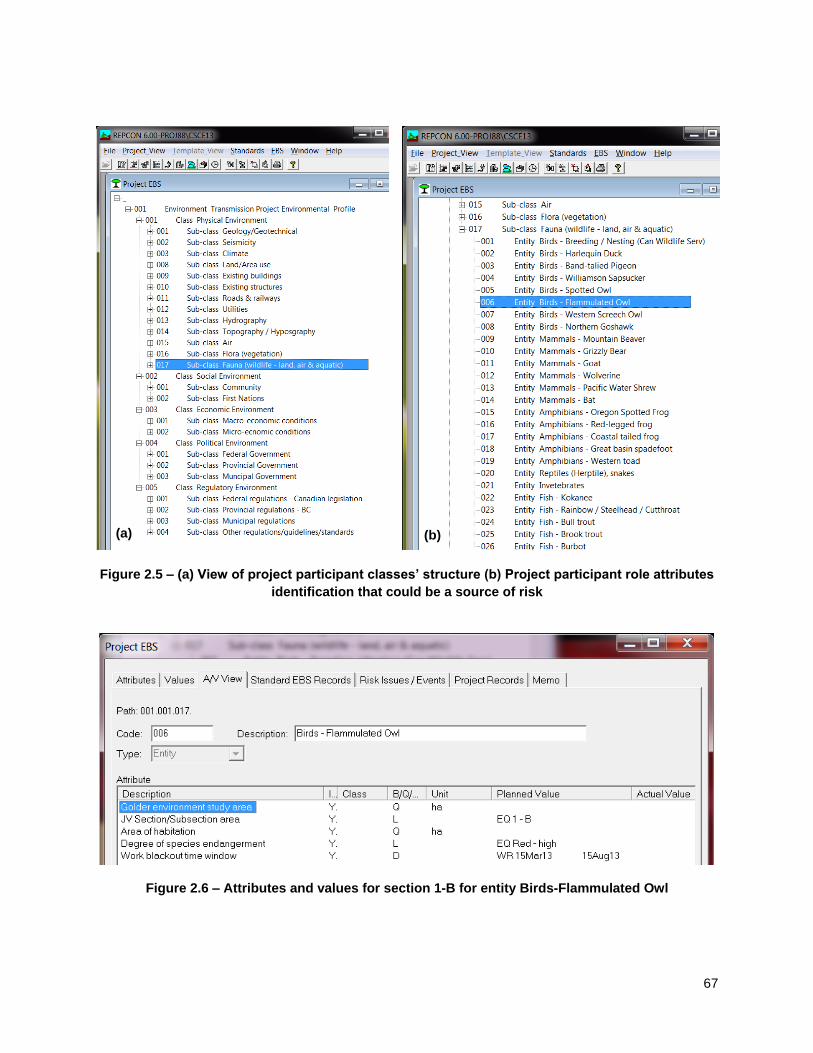
67
Figure 2.5 – (a) View of project participant classes’ structure (b) Project participant role attributes
identification that could be a source of risk
Figure 2.6 – Attributes and values for section 1-B for entity Birds-Flammulated Owl
(a) (b)
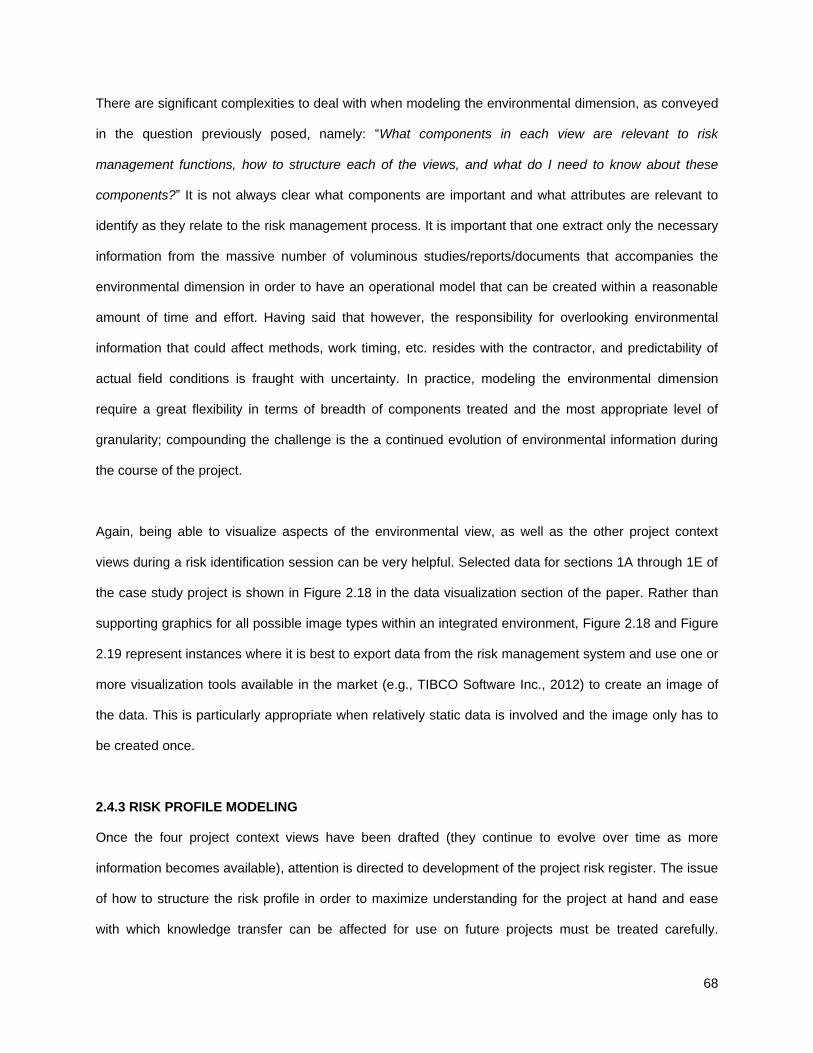
68
There are significant complexities to deal with when modeling the environmental dimension, as conveyed
in the question previously posed, namely: “What components in each view are relevant to risk
management functions, how to structure each of the views, and what do I need to know about these
components?” It is not always clear what components are important and what attributes are relevant to
identify as they relate to the risk management process. It is important that one extract only the necessary
information from the massive number of voluminous studies/reports/documents that accompanies the
environmental dimension in order to have an operational model that can be created within a reasonable
amount of time and effort. Having said that however, the responsibility for overlooking environmental
information that could affect methods, work timing, etc. resides with the contractor, and predictability of
actual field conditions is fraught with uncertainty. In practice, modeling the environmental dimension
require a great flexibility in terms of breadth of components treated and the most appropriate level of
granularity; compounding the challenge is the a continued evolution of environmental information during
the course of the project.
Again, being able to visualize aspects of the environmental view, as well as the other project context
views during a risk identification session can be very helpful. Selected data for sections 1A through 1E of
the case study project is shown in Figure 2.18 in the data visualization section of the paper. Rather than
supporting graphics for all possible image types within an integrated environment, Figure 2.18 and Figure
2.19 represent instances where it is best to export data from the risk management system and use one or
more visualization tools available in the market (e.g., TIBCO Software Inc., 2012) to create an image of
the data. This is particularly appropriate when relatively static data is involved and the image only has to
be created once.
2.4.3 RISK PROFILE MODELING
Once the four project context views have been drafted (they continue to evolve over time as more
information becomes available), attention is directed to development of the project risk register. The issue
of how to structure the risk profile in order to maximize understanding for the project at hand and ease
with which knowledge transfer can be affected for use on future projects must be treated carefully.
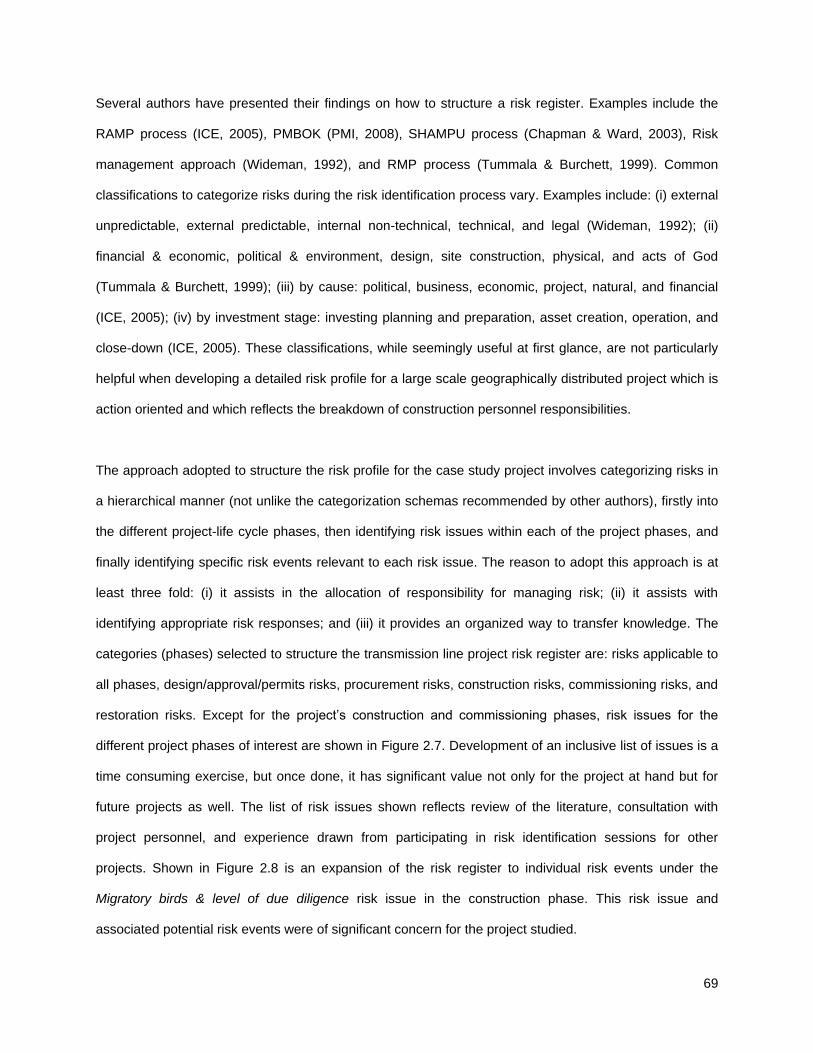
69
Several authors have presented their findings on how to structure a risk register. Examples include the
RAMP process (ICE, 2005), PMBOK (PMI, 2008), SHAMPU process (Chapman & Ward, 2003), Risk
management approach (Wideman, 1992), and RMP process (Tummala & Burchett, 1999). Common
classifications to categorize risks during the risk identification process vary. Examples include: (i) external
unpredictable, external predictable, internal non-technical, technical, and legal (Wideman, 1992); (ii)
financial & economic, political & environment, design, site construction, physical, and acts of God
(Tummala & Burchett, 1999); (iii) by cause: political, business, economic, project, natural, and financial
(ICE, 2005); (iv) by investment stage: investing planning and preparation, asset creation, operation, and
close-down (ICE, 2005). These classifications, while seemingly useful at first glance, are not particularly
helpful when developing a detailed risk profile for a large scale geographically distributed project which is
action oriented and which reflects the breakdown of construction personnel responsibilities.
The approach adopted to structure the risk profile for the case study project involves categorizing risks in
a hierarchical manner (not unlike the categorization schemas recommended by other authors), firstly into
the different project-life cycle phases, then identifying risk issues within each of the project phases, and
finally identifying specific risk events relevant to each risk issue. The reason to adopt this approach is at
least three fold: (i) it assists in the allocation of responsibility for managing risk; (ii) it assists with
identifying appropriate risk responses; and (iii) it provides an organized way to transfer knowledge. The
categories (phases) selected to structure the transmission line project risk register are: risks applicable to
all phases, design/approval/permits risks, procurement risks, construction risks, commissioning risks, and
restoration risks. Except for the project’s construction and commissioning phases, risk issues for the
different project phases of interest are shown in Figure 2.7. Development of an inclusive list of issues is a
time consuming exercise, but once done, it has significant value not only for the project at hand but for
future projects as well. The list of risk issues shown reflects review of the literature, consultation with
project personnel, and experience drawn from participating in risk identification sessions for other
projects. Shown in Figure 2.8 is an expansion of the risk register to individual risk events under the
Migratory birds & level of due diligence risk issue in the construction phase. This risk issue and
associated potential risk events were of significant concern for the project studied.
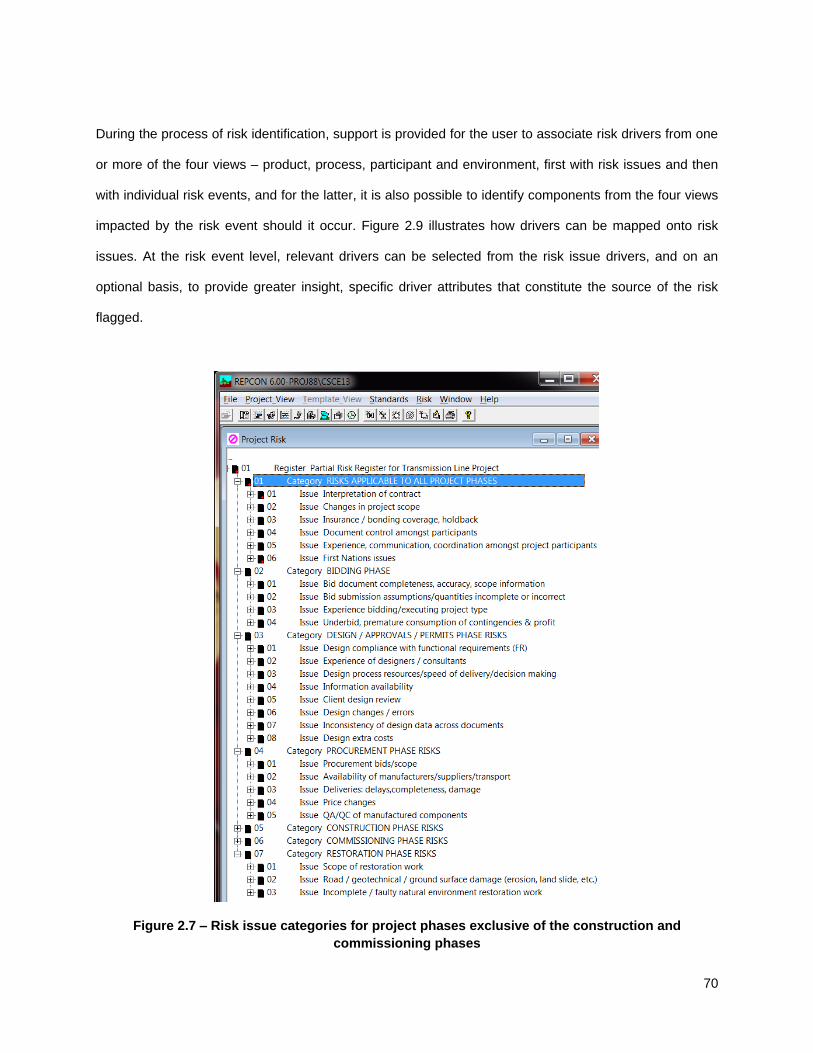
70
During the process of risk identification, support is provided for the user to associate risk drivers from one
or more of the four views – product, process, participant and environment, first with risk issues and then
with individual risk events, and for the latter, it is also possible to identify components from the four views
impacted by the risk event should it occur. Figure 2.9 illustrates how drivers can be mapped onto risk
issues. At the risk event level, relevant drivers can be selected from the risk issue drivers, and on an
optional basis, to provide greater insight, specific driver attributes that constitute the source of the risk
flagged.
Figure 2.7 – Risk issue categories for project phases exclusive of the construction and
commissioning phases
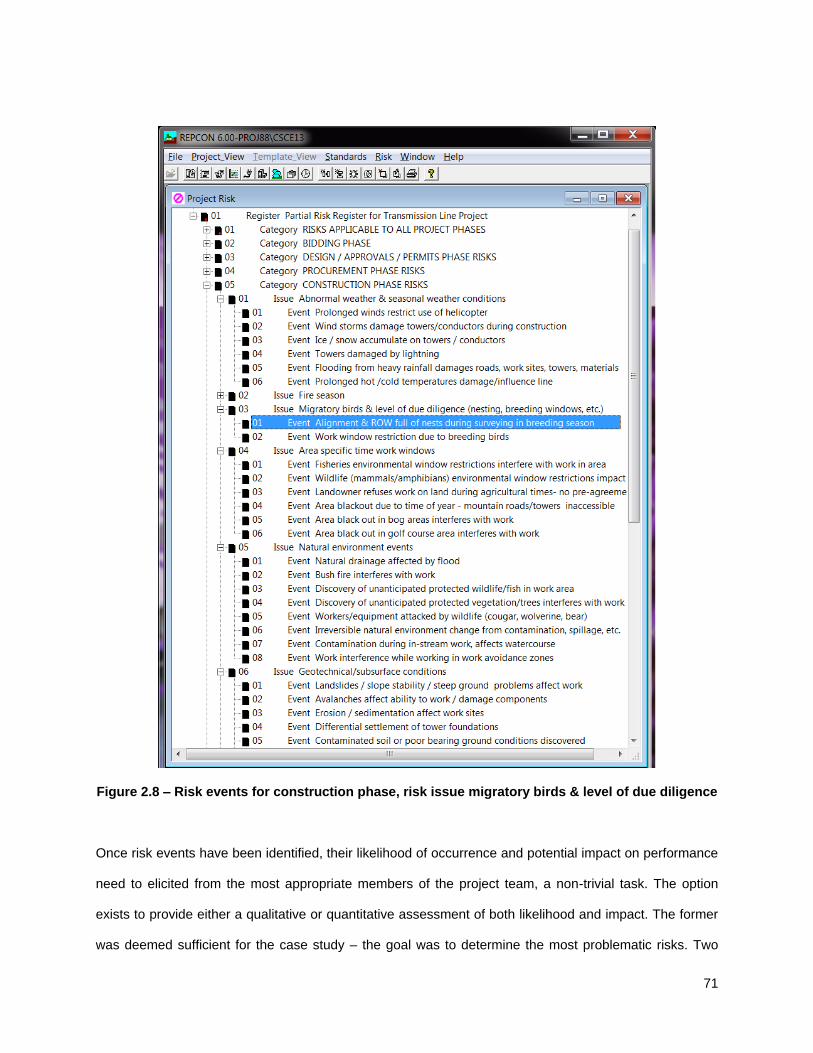
71
Figure 2.8 – Risk events for construction phase, risk issue migratory birds & level of due diligence
Once risk events have been identified, their likelihood of occurrence and potential impact on performance
need to elicited from the most appropriate members of the project team, a non-trivial task. The option
exists to provide either a qualitative or quantitative assessment of both likelihood and impact. The former
was deemed sufficient for the case study – the goal was to determine the most problematic risks. Two
72
observations are that project personnel were comfortable with estimating likelihood, but in terms of
impact, it was expressed in terms of a severity of impact scale as opposed to cost, time or safety
consequences, even though qualitative assessments were used. Personnel were comfortable expressing
judgment as to the relative severity of the impact of a risk, which was sufficient to determine where to
focus extra management attention. This reflected the reality that trying to quantify the consequences of a
risk event in terms of the latter three metrics was an almost impossible task without an overwhelming
level of effort. Another reason to adopt a qualitative assessment process is that the project context is
subject to continued significant changes – time spent re-estimating quantitative impacts in terms of time
and cost impacts, even if done qualitatively, was not viewed as being a good use of precious
management resources. Given the assessment of the relative severity of risks, attention could then be
focused on selecting appropriate risk response measures. In special cases, decisions could also be made
as to the value of conducting further analysis, specifically whether or not an effort should be made to
quantify cost, time or safety consequences for the most severe risks. The important topic of how best to
perform the risk assessments (e.g., qualitative, or quantitative) during the risk management process for
construction projects has been addressed by others (e.g., Chapman & Ward, 2003; ICE, 2005; and
Wideman, 1992); there is no consensus on how best to make assessments. The authors do venture the
opinion, however, that some of the literature is overly optimistic about the ability of personnel to make
estimates with great precision, and or their willingness to engage in elaborate processes to make
assessments. The scale of large projects and constantly changing project conditions renders impractical
complex assessment processes.
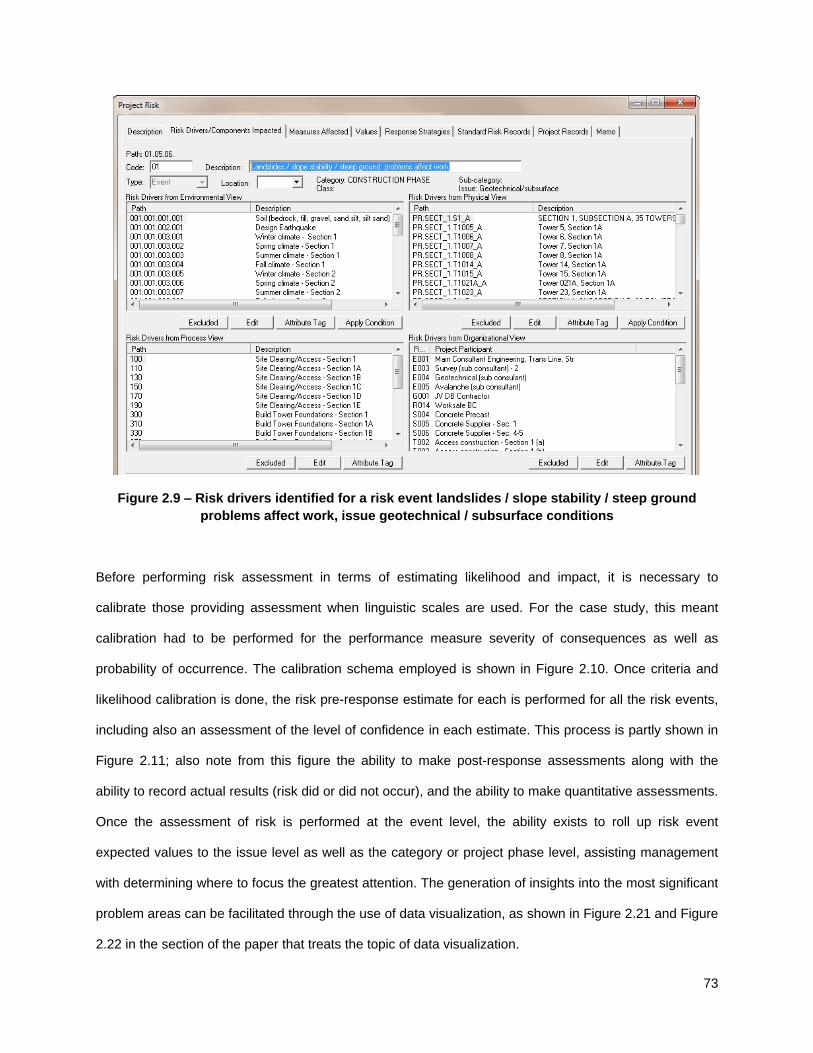
73
Figure 2.9 – Risk drivers identified for a risk event landslides / slope stability / steep ground
problems affect work, issue geotechnical / subsurface conditions
Before performing risk assessment in terms of estimating likelihood and impact, it is necessary to
calibrate those providing assessment when linguistic scales are used. For the case study, this meant
calibration had to be performed for the performance measure severity of consequences as well as
probability of occurrence. The calibration schema employed is shown in Figure 2.10. Once criteria and
likelihood calibration is done, the risk pre-response estimate for each is performed for all the risk events,
including also an assessment of the level of confidence in each estimate. This process is partly shown in
Figure 2.11; also note from this figure the ability to make post-response assessments along with the
ability to record actual results (risk did or did not occur), and the ability to make quantitative assessments.
Once the assessment of risk is performed at the event level, the ability exists to roll up risk event
expected values to the issue level as well as the category or project phase level, assisting management
with determining where to focus the greatest attention. The generation of insights into the most significant
problem areas can be facilitated through the use of data visualization, as shown in Figure 2.21 and Figure
2.22 in the section of the paper that treats the topic of data visualization.
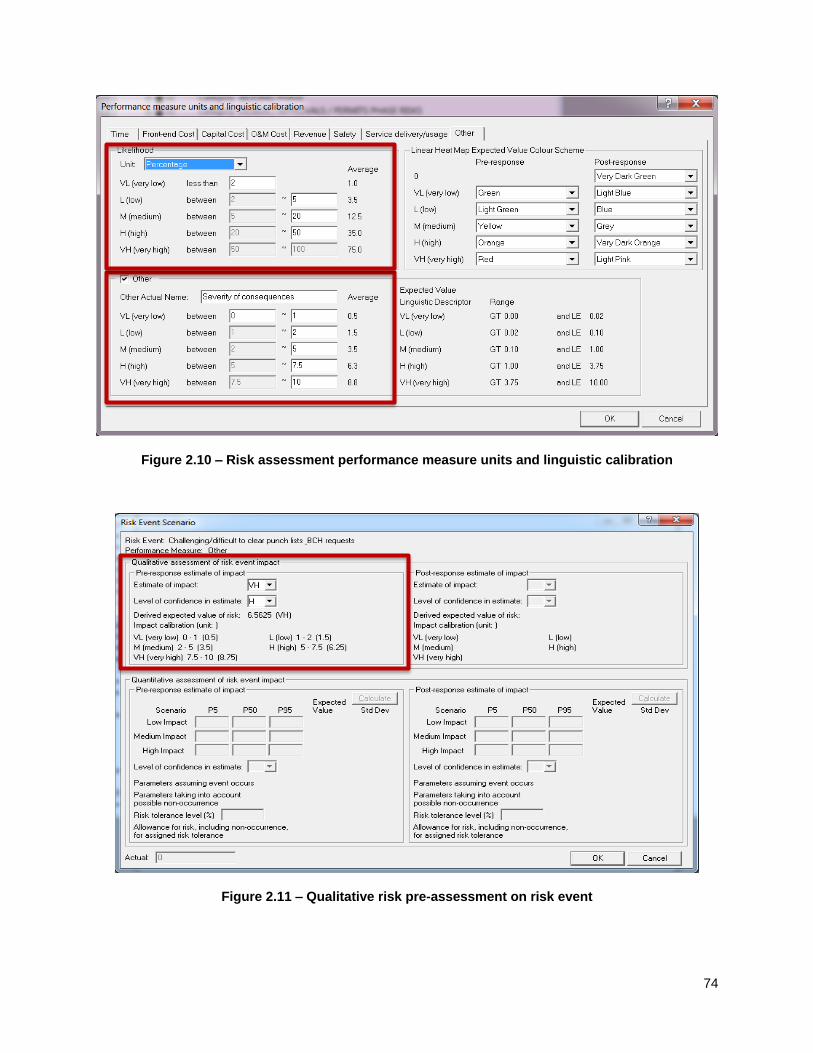
74
Figure 2.10 – Risk assessment performance measure units and linguistic calibration
Figure 2.11 – Qualitative risk pre-assessment on risk event

75
After the pre-response assessment of risk and the exploration of the results to determine areas of
greatest interest, strategies to mitigate or respond to project risks, either in terms of individual risk events
or risk issue categories need to be determined. This process is aided by the development of a
comprehensive hierarchically structured risk response register that uses consistent terminology, which
aids knowledge transfer from one project to the next. Research in this area of risk (e.g., Al-Bahar
& Crandall, 1990; Dey, 2010; Hillson, 1999; WSDOT, 2010; PMI, 2008; and ICE, 2005) has not been well
developed and defined; the current literature is sparse and lacks depth. Where it is described, no formal
structure to plan and develop the risk response for a project is given. Presented in Figure 2.12 is the risk
response register developed for the case study – it represents a work in progress and is based on the
literature reviewed and consideration of lessons learned from past experiences of the authors. The
implementation of the risk response categories represent project phases, subcategories are risk response
strategies (avoid, transfer, mitigate, accept or retain, and share), classes represent specific types of
actions that can be taken, and within a class, individual responses reflect specific actions that might be
taken. The authors are not convinced of the need to break responses down by categories or project
phases, as it might lead to extensive duplication of responses between phases. Ongoing work is directed
at exploring how best to structure the response register, and at identifying a comprehensive list of classes
for each response sub-category.
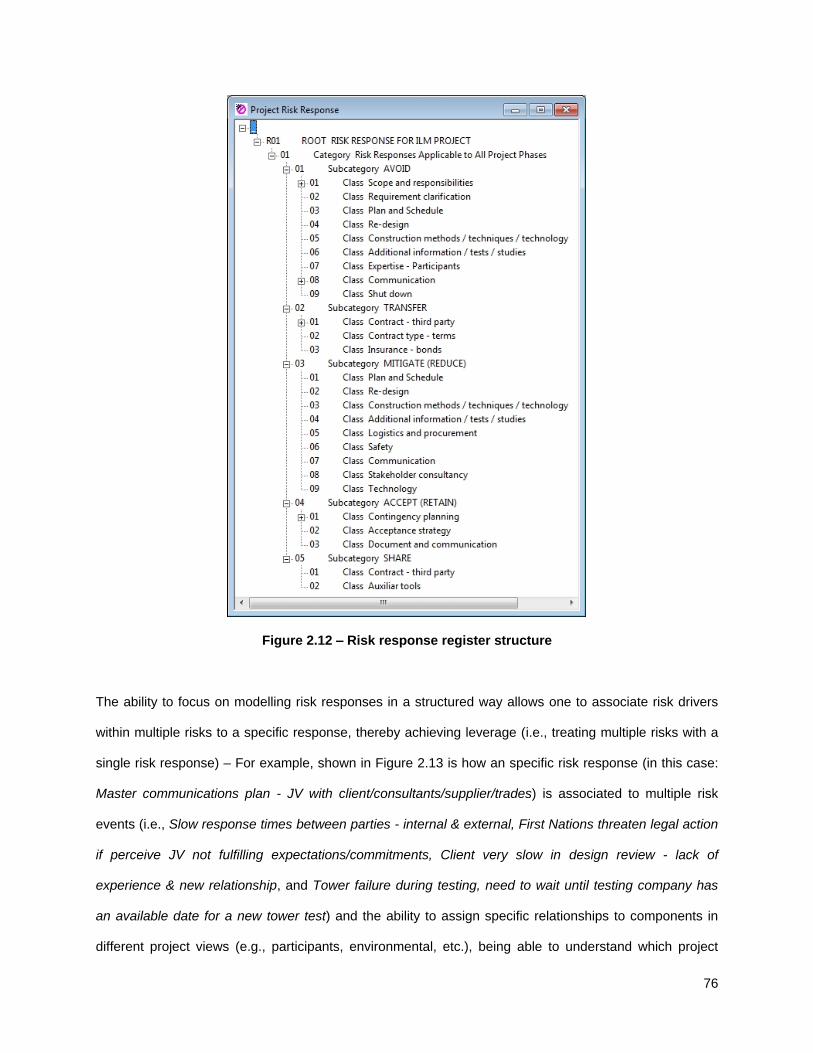
76
Figure 2.12 – Risk response register structure
The ability to focus on modelling risk responses in a structured way allows one to associate risk drivers
within multiple risks to a specific response, thereby achieving leverage (i.e., treating multiple risks with a
single risk response) – For example, shown in Figure 2.13 is how an specific risk response (in this case:
Master communications plan - JV with client/consultants/supplier/trades) is associated to multiple risk
events (i.e., Slow response times between parties - internal & external, First Nations threaten legal action
if perceive JV not fulfilling expectations/commitments, Client very slow in design review - lack of
experience & new relationship, and Tower failure during testing, need to wait until testing company has
an available date for a new tower test) and the ability to assign specific relationships to components in
different project views (e.g., participants, environmental, etc.), being able to understand which project
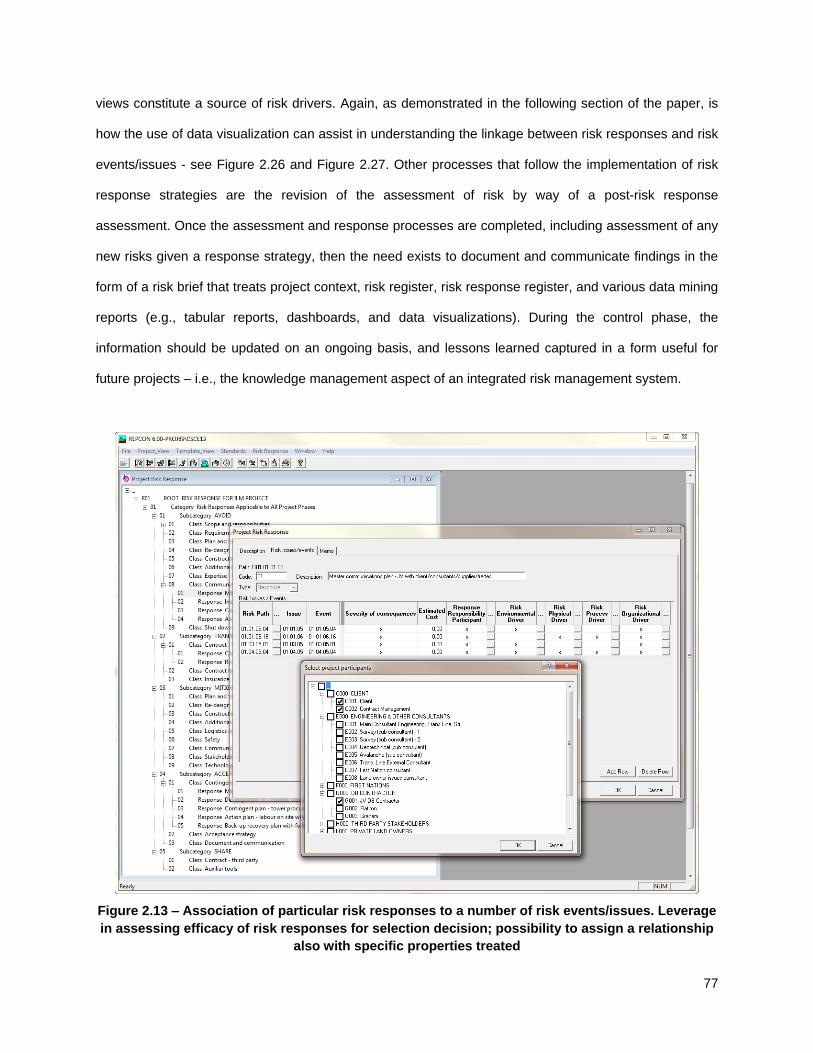
77
views constitute a source of risk drivers. Again, as demonstrated in the following section of the paper, is
how the use of data visualization can assist in understanding the linkage between risk responses and risk
events/issues - see Figure 2.26 and Figure 2.27. Other processes that follow the implementation of risk
response strategies are the revision of the assessment of risk by way of a post-risk response
assessment. Once the assessment and response processes are completed, including assessment of any
new risks given a response strategy, then the need exists to document and communicate findings in the
form of a risk brief that treats project context, risk register, risk response register, and various data mining
reports (e.g., tabular reports, dashboards, and data visualizations). During the control phase, the
information should be updated on an ongoing basis, and lessons learned captured in a form useful for
future projects – i.e., the knowledge management aspect of an integrated risk management system.
Figure 2.13 – Association of particular risk responses to a number of risk events/issues. Leverage
in assessing efficacy of risk responses for selection decision; possibility to assign a relationship
also with specific properties treated
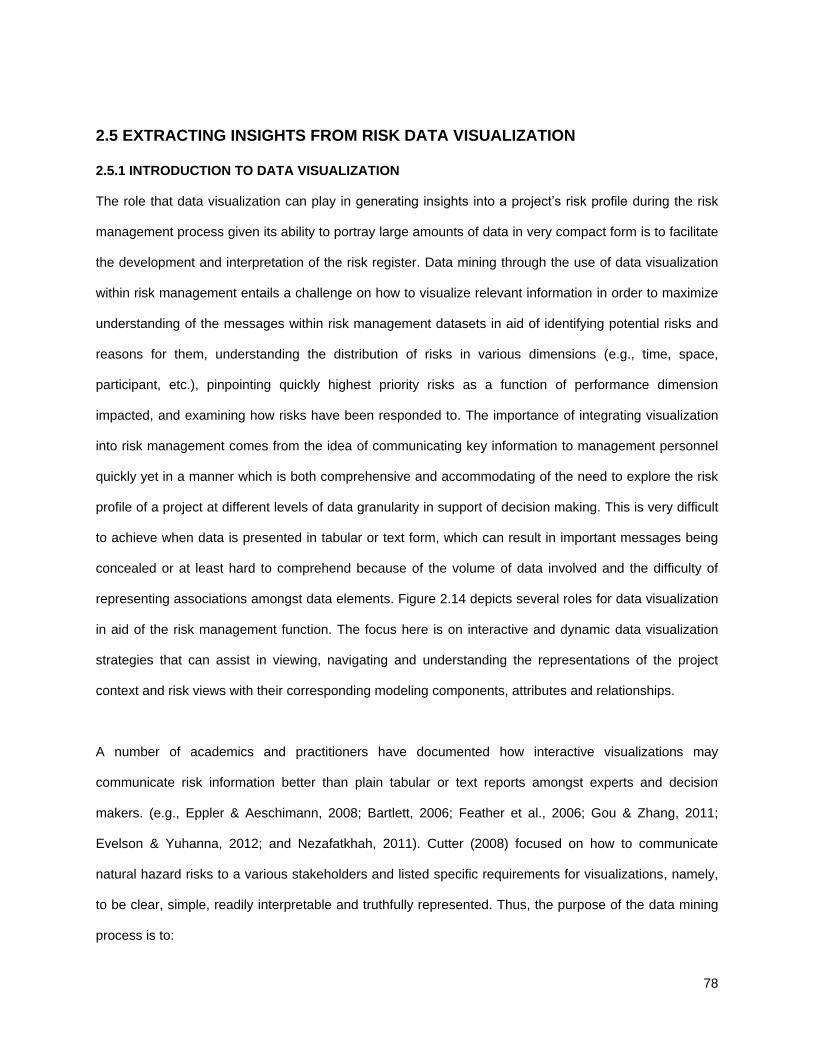
78
2.5 EXTRACTING INSIGHTS FROM RISK DATA VISUALIZATION
2.5.1 INTRODUCTION TO DATA VISUALIZATION
The role that data visualization can play in generating insights into a project’s risk profile during the risk
management process given its ability to portray large amounts of data in very compact form is to facilitate
the development and interpretation of the risk register. Data mining through the use of data visualization
within risk management entails a challenge on how to visualize relevant information in order to maximize
understanding of the messages within risk management datasets in aid of identifying potential risks and
reasons for them, understanding the distribution of risks in various dimensions (e.g., time, space,
participant, etc.), pinpointing quickly highest priority risks as a function of performance dimension
impacted, and examining how risks have been responded to. The importance of integrating visualization
into risk management comes from the idea of communicating key information to management personnel
quickly yet in a manner which is both comprehensive and accommodating of the need to explore the risk
profile of a project at different levels of data granularity in support of decision making. This is very difficult
to achieve when data is presented in tabular or text form, which can result in important messages being
concealed or at least hard to comprehend because of the volume of data involved and the difficulty of
representing associations amongst data elements. Figure 2.14 depicts several roles for data visualization
in aid of the risk management function. The focus here is on interactive and dynamic data visualization
strategies that can assist in viewing, navigating and understanding the representations of the project
context and risk views with their corresponding modeling components, attributes and relationships.
A number of academics and practitioners have documented how interactive visualizations may
communicate risk information better than plain tabular or text reports amongst experts and decision
makers. (e.g., Eppler & Aeschimann, 2008; Bartlett, 2006; Feather et al., 2006; Gou & Zhang, 2011;
Evelson & Yuhanna, 2012; and Nezafatkhah, 2011). Cutter (2008) focused on how to communicate
natural hazard risks to a various stakeholders and listed specific requirements for visualizations, namely,
to be clear, simple, readily interpretable and truthfully represented. Thus, the purpose of the data mining
process is to:
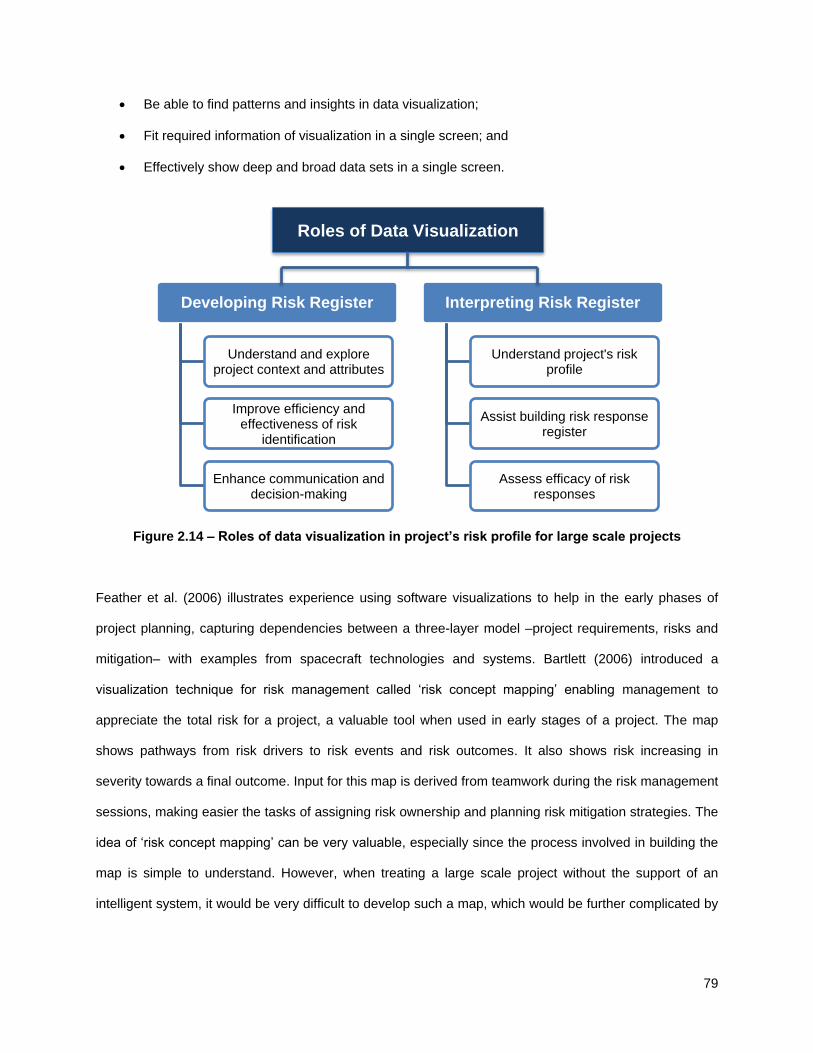
79
Be able to find patterns and insights in data visualization;
Fit required information of visualization in a single screen; and
Effectively show deep and broad data sets in a single screen.
Figure 2.14 – Roles of data visualization in project’s risk profile for large scale projects
Feather et al. (2006) illustrates experience using software visualizations to help in the early phases of
project planning, capturing dependencies between a three-layer model –project requirements, risks and
mitigation– with examples from spacecraft technologies and systems. Bartlett (2006) introduced a
visualization technique for risk management called ‘risk concept mapping’ enabling management to
appreciate the total risk for a project, a valuable tool when used in early stages of a project. The map
shows pathways from risk drivers to risk events and risk outcomes. It also shows risk increasing in
severity towards a final outcome. Input for this map is derived from teamwork during the risk management
sessions, making easier the tasks of assigning risk ownership and planning risk mitigation strategies. The
idea of ‘risk concept mapping’ can be very valuable, especially since the process involved in building the
map is simple to understand. However, when treating a large scale project without the support of an
intelligent system, it would be very difficult to develop such a map, which would be further complicated by
Developing Risk Register
Understand and explore project context and attributes
Improve efficiency and effectiveness of risk
identification
Enhance communication and decision-making
Interpreting Risk Register
Understand project's risk profile
Assist building risk response register
Assess efficacy of risk responses
Roles of Data Visualization
80
data cluttering due to the large amount of data involved in large scale projects, a topic treated later in this
section.
One feature important to the use of data visualization within the risk management function is that of
interactivity, in order to maximize the assistance offered to analysts and decision makers. Evelson &
Yuhanna (2012) differentiate the use of interactive data visualization tools compared to the use of static
graphs in terms of the following increased capabilities:
Dynamic data content;
Visual querying;
Multiple-dimension, linked visualizations;
Animated visualization; and
Personalization of user interface.
Risk management sessions conducted to identify risks or determine responses can be an individual
activity or involve several people in different ways: interviewing individuals, groups, or using group
processes such as brainstorming and decision-conferencing processes (Chapman & Ward, 2003). Smith
et al., (2006) also suggested three differing methodologies for risk identification processes: brainstorming
sessions along lines similar to value management workshops, analysis of historical data for similar
projects, and use of industrial checklists. These processes can be enhanced through the use of data
visualization. During a creative brainstorming session with individuals of different backgrounds and
experience, too many potential issues might be identified, overwhelming the project team and causing it
to lose focus. Chapman & Ward (2003) explain how decision-conferencing techniques are designed to
improve the efficiency and effectiveness of group processes involving the exploration of problems and
decision-making situations. This technique usually involves a facilitator and a real-time IT computer
support system operated by one or more analysts. The facilitator manages the group’s deliberations,
guiding discussion in appropriate directions as necessary. Hence the importance of developing an
interactive, simple and intuitive interface aided by dynamic and flexible project views, with the possibility
81
of navigating various visualizations of project context and risk and response registers during the risk
modeling process.
In developing a user interface to support risk management processes, a number of properties should be
addressed in order to fully capitalize on the strengths offered by data visualization. Using the risk
modeling approach described previously, the following are relevant properties that a user interface should
possess in order to assist risk management sessions effectively:
Ability to seamlessly move from one project view to another (physical, process, environmental,
participant, and risk) – see Figure 2.15;
Ability to personalize dashboards according to the needs of the risk management discussion
during the session – see Figure 2.16;
Ability to filter view data – drill down to specific areas of interest (use of hierarchical structures,
project components, attributes and their mapping) – see Figure 2.23;
Ability to roll-up or aggregate view data – i.e., roll-up to issue level in the risk register and capture
a global idea of risk in a category – see Figure 2.22 and Figure 2.23;
Ability to order – e.g., for a user specified risk profile (e.g., a subset of risk issues within a project
phase), display risks in ascending or descending order of one of expected value, impact if the risk
occurs and likelihood of occurrence – see Figure 2.21;
Ability to superimpose various properties of data components using a common data dimension
– see Figure 2.17;
Ability to support data visualization for all project views in one system, (e.g., support different
formats, support various data transformation, and aggregation functions) – see Figure 2.18 and
Figure 2.19;
Support the ability to export information out to other tools in order to explore data – see Figure
2.24; and
Provide access to rich data representations at any point in time in a risk management session,
which in some cases may be best done by exporting data and then representing it directly or
adapting it using other visualization environments.
82
In developing a support tool for risk management that integrates project context as represented through
multiple views with data visualization, two observations merit consideration:
1) It is not practical to support the full spectrum of data visualizations possible for all project views in
one system. As part of the work described herein developing several of the visualizations
presented later, the authors have examined what is readily achievable within the context of an
integrated system and what is best done outside the confines of a single system. Guiding this
thought process is the need to be aware of developments in the area of data visualization, given
the recent proliferation of very useful commercial tools (e.g., Evelson & Yuhanna, 2012; and
Nezafatkhah, 2011) and open source tools (e.g., Data-driven-document java scripts libraries). In
order to capitalize on their features it is best to be able to export data to them. It is not feasible or
cost effective to recreate and integrate them within an integrated system, especially a research
system designed for the exploration of concepts.
2) Exporting data out of the integrated system to other visualization tools in order to explore further
messages within the data leads to loss of some interactive abilities in that the data is no longer
dynamic but just represents an instance in time. Thus, to the extent possible, visualizations
directed at data which is in a constant state of flux should be incorporated within the integrated
system. Where data is relatively static, enhanced data visualizations are best achieved by
exporting to the latest state-of-the-art data visualization tools.
2.5.2 THE ROLES OF VISUALIZATION IN DEVELOPING THE RISK REGISTER
One of the most important benefits of using data visualization is the possibility to explore and identify
potential scenarios that could lead to risks – e.g., the presence of undesirable conditions within a single
view or the confluence of conditions from 2 or more views that could contribute to the potential for a risk
event. Visualization tools are helpful for exploring the entire project context and its corresponding
properties by navigating across the entire project model (see Figure 2.15), through to the exploration of
individual project components in order to detect if one or a combination of factors may cause a risk event.
For example, see Figure 2.16 in which the risk is identified as a function of context, in this case, the
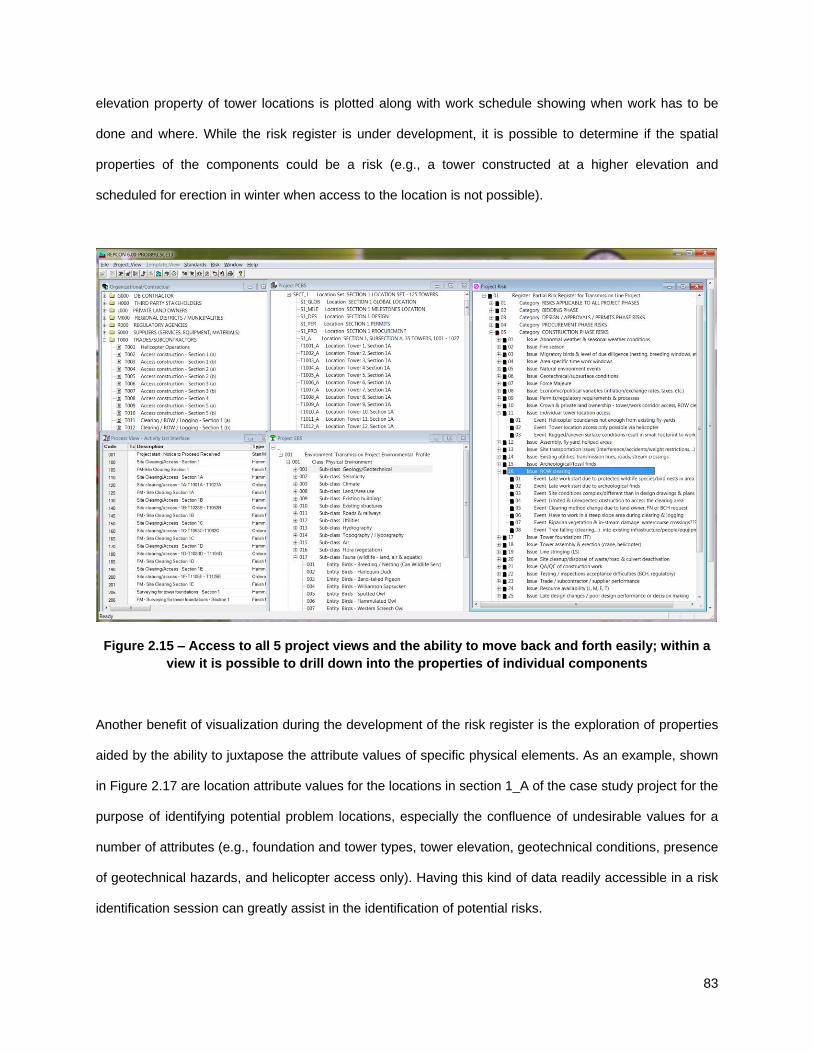
83
elevation property of tower locations is plotted along with work schedule showing when work has to be
done and where. While the risk register is under development, it is possible to determine if the spatial
properties of the components could be a risk (e.g., a tower constructed at a higher elevation and
scheduled for erection in winter when access to the location is not possible).
Figure 2.15 – Access to all 5 project views and the ability to move back and forth easily; within a
view it is possible to drill down into the properties of individual components
Another benefit of visualization during the development of the risk register is the exploration of properties
aided by the ability to juxtapose the attribute values of specific physical elements. As an example, shown
in Figure 2.17 are location attribute values for the locations in section 1_A of the case study project for the
purpose of identifying potential problem locations, especially the confluence of undesirable values for a
number of attributes (e.g., foundation and tower types, tower elevation, geotechnical conditions, presence
of geotechnical hazards, and helicopter access only). Having this kind of data readily accessible in a risk
identification session can greatly assist in the identification of potential risks.
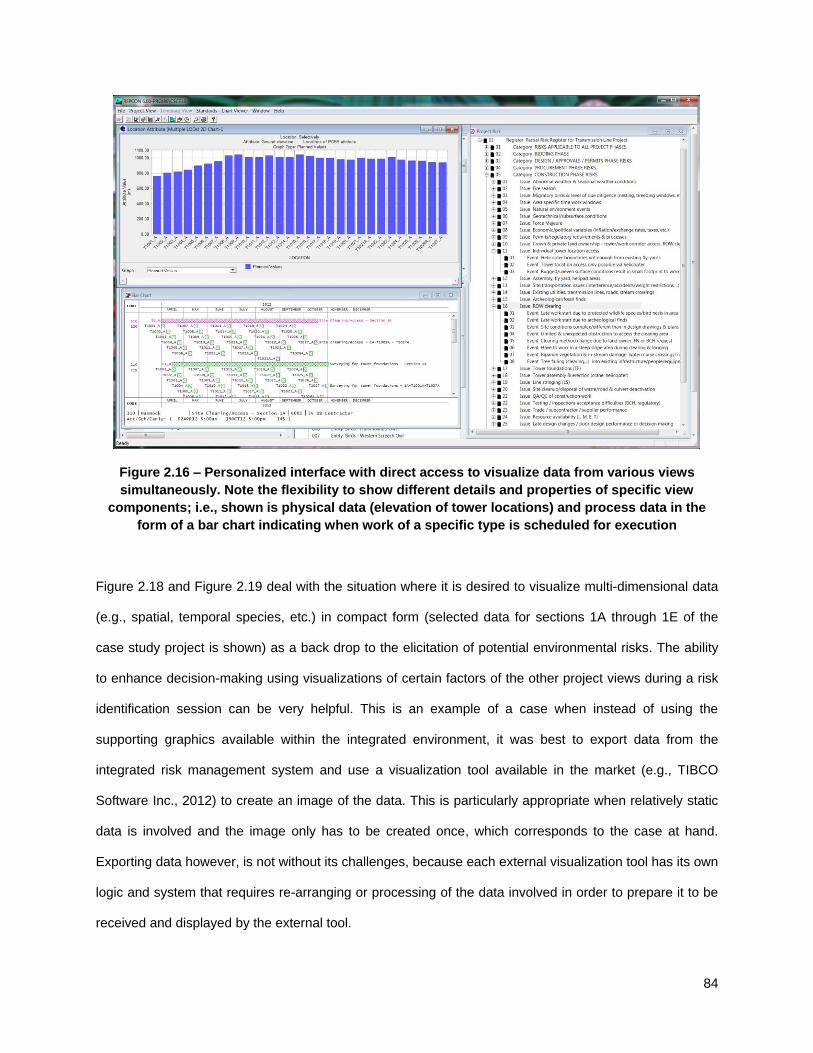
84
Figure 2.16 – Personalized interface with direct access to visualize data from various views
simultaneously. Note the flexibility to show different details and properties of specific view
components; i.e., shown is physical data (elevation of tower locations) and process data in the
form of a bar chart indicating when work of a specific type is scheduled for execution
Figure 2.18 and Figure 2.19 deal with the situation where it is desired to visualize multi-dimensional data
(e.g., spatial, temporal species, etc.) in compact form (selected data for sections 1A through 1E of the
case study project is shown) as a back drop to the elicitation of potential environmental risks. The ability
to enhance decision-making using visualizations of certain factors of the other project views during a risk
identification session can be very helpful. This is an example of a case when instead of using the
supporting graphics available within the integrated environment, it was best to export data from the
integrated risk management system and use a visualization tool available in the market (e.g., TIBCO
Software Inc., 2012) to create an image of the data. This is particularly appropriate when relatively static
data is involved and the image only has to be created once, which corresponds to the case at hand.
Exporting data however, is not without its challenges, because each external visualization tool has its own
logic and system that requires re-arranging or processing of the data involved in order to prepare it to be
received and displayed by the external tool.
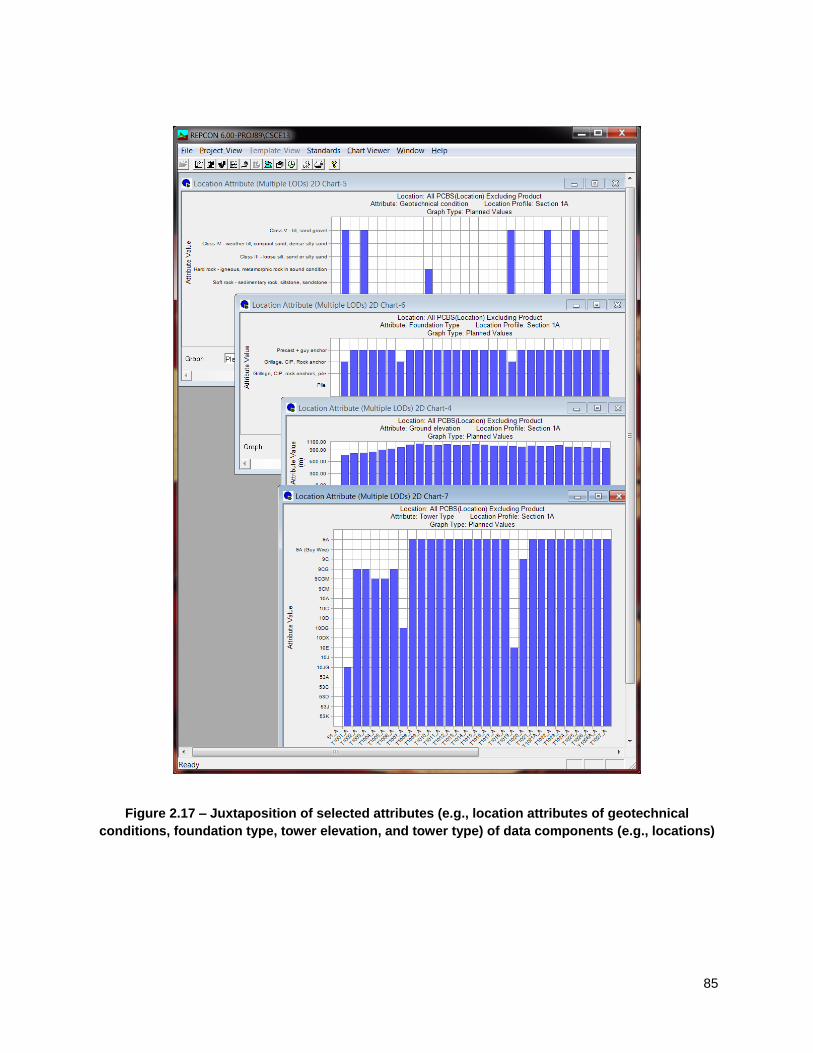
85
Figure 2.17 – Juxtaposition of selected attributes (e.g., location attributes of geotechnical
conditions, foundation type, tower elevation, and tower type) of data components (e.g., locations)
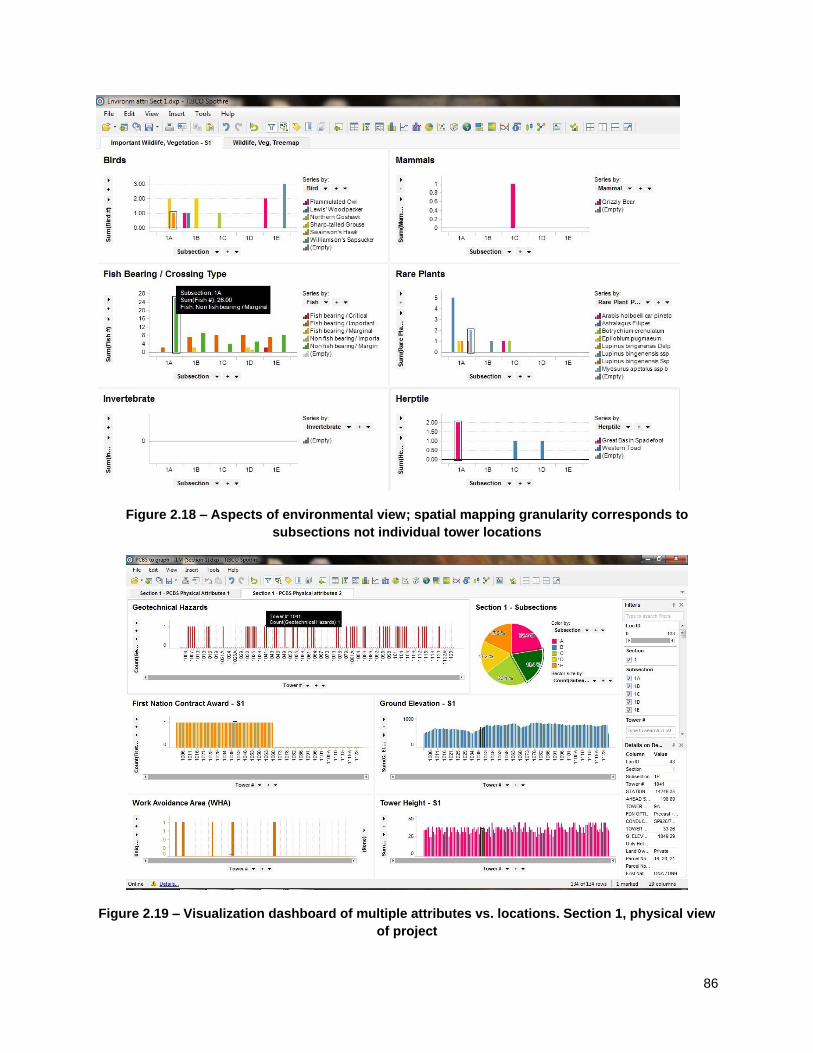
86
Figure 2.18 – Aspects of environmental view; spatial mapping granularity corresponds to
subsections not individual tower locations
Figure 2.19 – Visualization dashboard of multiple attributes vs. locations. Section 1, physical view
of project
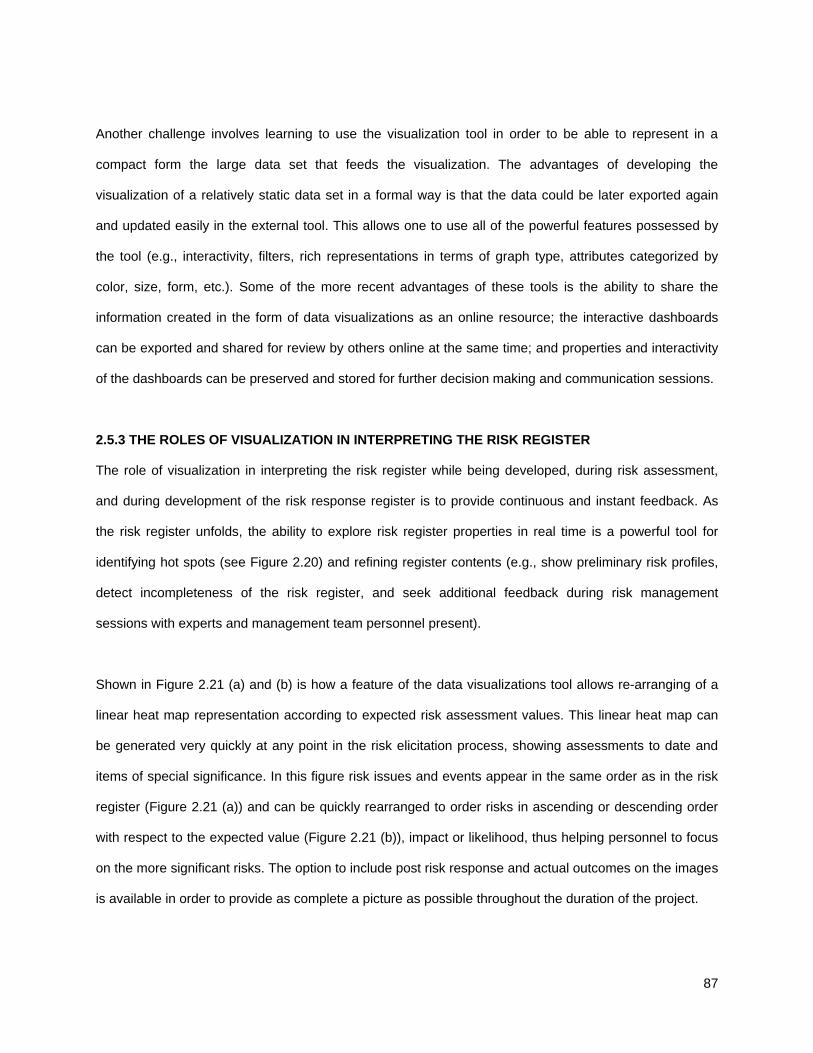
87
Another challenge involves learning to use the visualization tool in order to be able to represent in a
compact form the large data set that feeds the visualization. The advantages of developing the
visualization of a relatively static data set in a formal way is that the data could be later exported again
and updated easily in the external tool. This allows one to use all of the powerful features possessed by
the tool (e.g., interactivity, filters, rich representations in terms of graph type, attributes categorized by
color, size, form, etc.). Some of the more recent advantages of these tools is the ability to share the
information created in the form of data visualizations as an online resource; the interactive dashboards
can be exported and shared for review by others online at the same time; and properties and interactivity
of the dashboards can be preserved and stored for further decision making and communication sessions.
2.5.3 THE ROLES OF VISUALIZATION IN INTERPRETING THE RISK REGISTER
The role of visualization in interpreting the risk register while being developed, during risk assessment,
and during development of the risk response register is to provide continuous and instant feedback. As
the risk register unfolds, the ability to explore risk register properties in real time is a powerful tool for
identifying hot spots (see Figure 2.20) and refining register contents (e.g., show preliminary risk profiles,
detect incompleteness of the risk register, and seek additional feedback during risk management
sessions with experts and management team personnel present).
Shown in Figure 2.21 (a) and (b) is how a feature of the data visualizations tool allows re-arranging of a
linear heat map representation according to expected risk assessment values. This linear heat map can
be generated very quickly at any point in the risk elicitation process, showing assessments to date and
items of special significance. In this figure risk issues and events appear in the same order as in the risk
register (Figure 2.21 (a)) and can be quickly rearranged to order risks in ascending or descending order
with respect to the expected value (Figure 2.21 (b)), impact or likelihood, thus helping personnel to focus
on the more significant risks. The option to include post risk response and actual outcomes on the images
is available in order to provide as complete a picture as possible throughout the duration of the project.
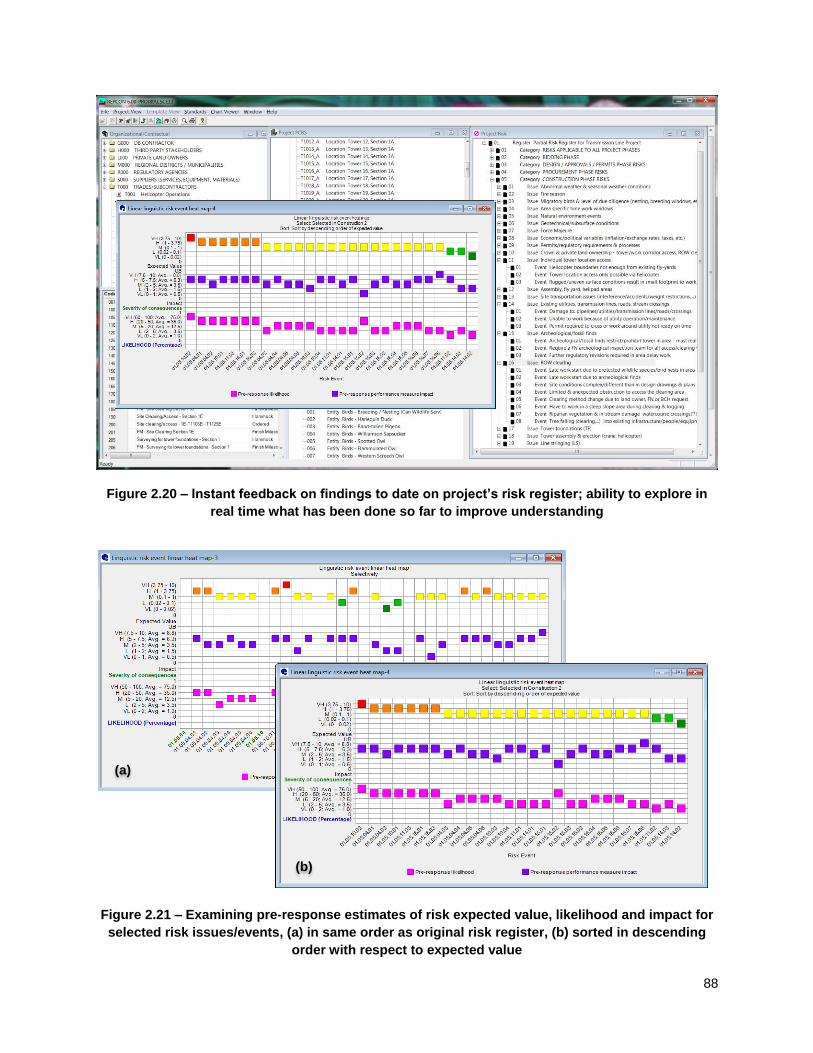
88
Figure 2.20 – Instant feedback on findings to date on project’s risk register; ability to explore in
real time what has been done so far to improve understanding
Figure 2.21 – Examining pre-response estimates of risk expected value, likelihood and impact for
selected risk issues/events, (a) in same order as original risk register, (b) sorted in descending
order with respect to expected value
(a)
(b)
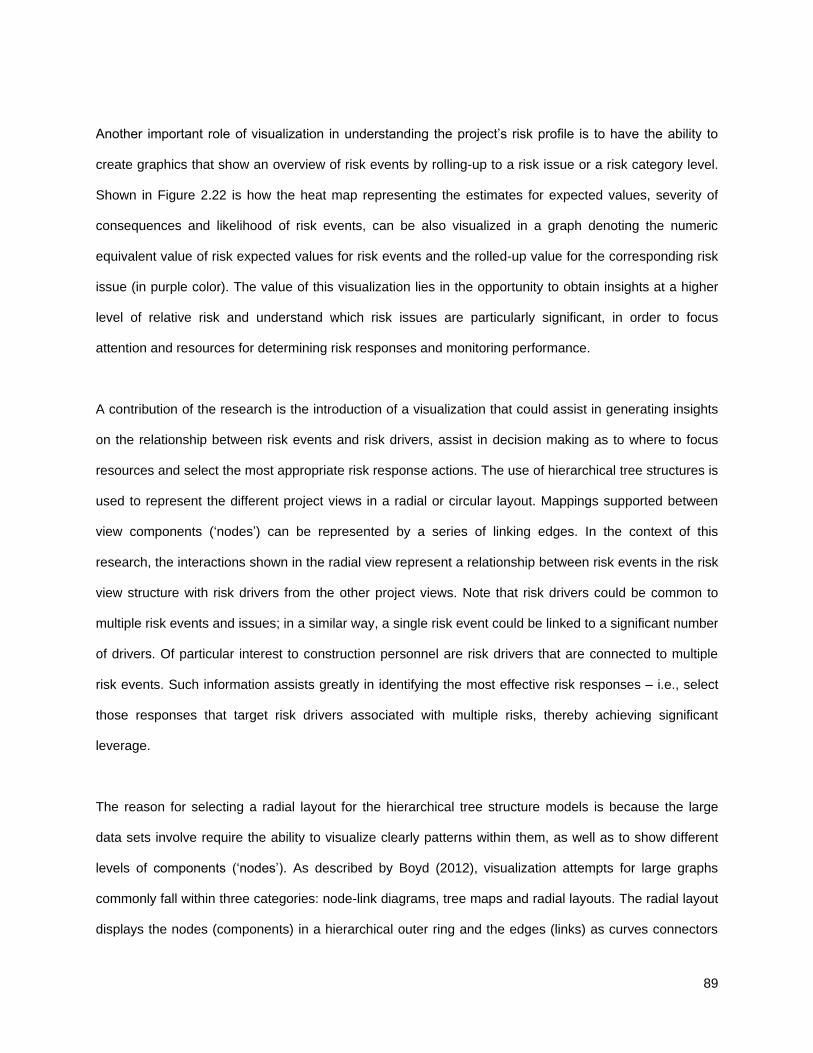
89
Another important role of visualization in understanding the project’s risk profile is to have the ability to
create graphics that show an overview of risk events by rolling-up to a risk issue or a risk category level.
Shown in Figure 2.22 is how the heat map representing the estimates for expected values, severity of
consequences and likelihood of risk events, can be also visualized in a graph denoting the numeric
equivalent value of risk expected values for risk events and the rolled-up value for the corresponding risk
issue (in purple color). The value of this visualization lies in the opportunity to obtain insights at a higher
level of relative risk and understand which risk issues are particularly significant, in order to focus
attention and resources for determining risk responses and monitoring performance.
A contribution of the research is the introduction of a visualization that could assist in generating insights
on the relationship between risk events and risk drivers, assist in decision making as to where to focus
resources and select the most appropriate risk response actions. The use of hierarchical tree structures is
used to represent the different project views in a radial or circular layout. Mappings supported between
view components (‘nodes’) can be represented by a series of linking edges. In the context of this
research, the interactions shown in the radial view represent a relationship between risk events in the risk
view structure with risk drivers from the other project views. Note that risk drivers could be common to
multiple risk events and issues; in a similar way, a single risk event could be linked to a significant number
of drivers. Of particular interest to construction personnel are risk drivers that are connected to multiple
risk events. Such information assists greatly in identifying the most effective risk responses – i.e., select
those responses that target risk drivers associated with multiple risks, thereby achieving significant
leverage.
The reason for selecting a radial layout for the hierarchical tree structure models is because the large
data sets involve require the ability to visualize clearly patterns within them, as well as to show different
levels of components (‘nodes’). As described by Boyd (2012), visualization attempts for large graphs
commonly fall within three categories: node-link diagrams, tree maps and radial layouts. The radial layout
displays the nodes (components) in a hierarchical outer ring and the edges (links) as curves connectors
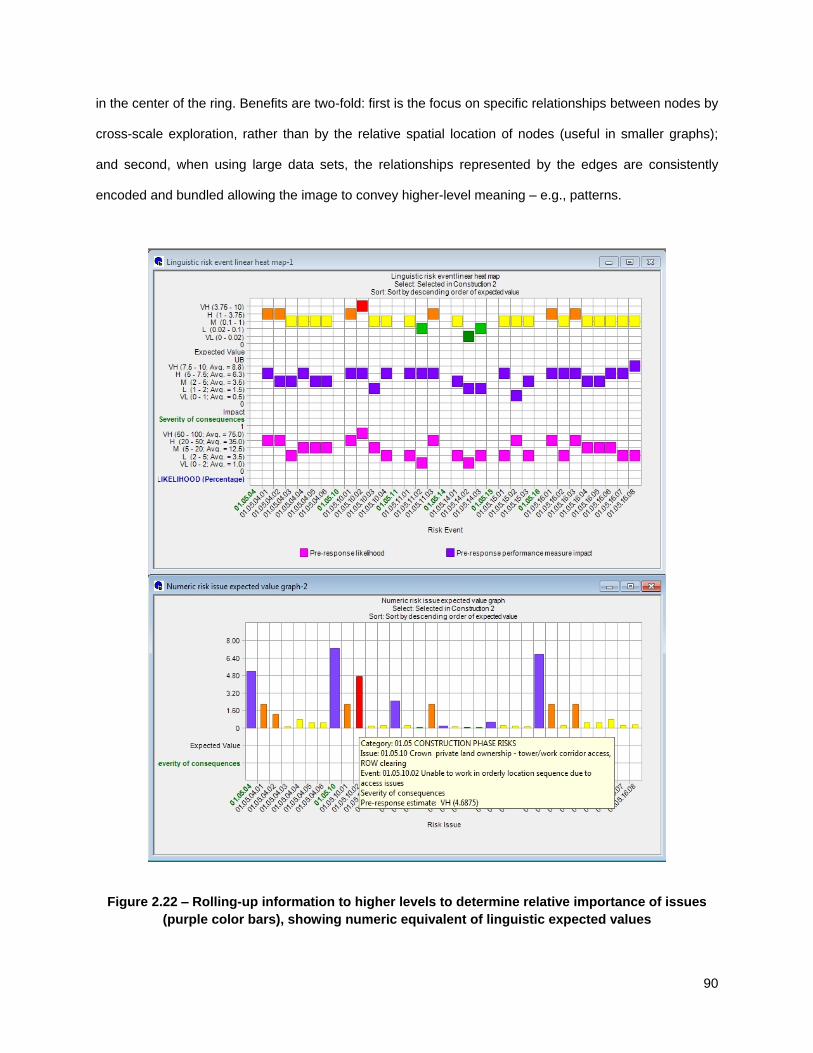
90
in the center of the ring. Benefits are two-fold: first is the focus on specific relationships between nodes by
cross-scale exploration, rather than by the relative spatial location of nodes (useful in smaller graphs);
and second, when using large data sets, the relationships represented by the edges are consistently
encoded and bundled allowing the image to convey higher-level meaning – e.g., patterns.
Figure 2.22 – Rolling-up information to higher levels to determine relative importance of issues
(purple color bars), showing numeric equivalent of linguistic expected values
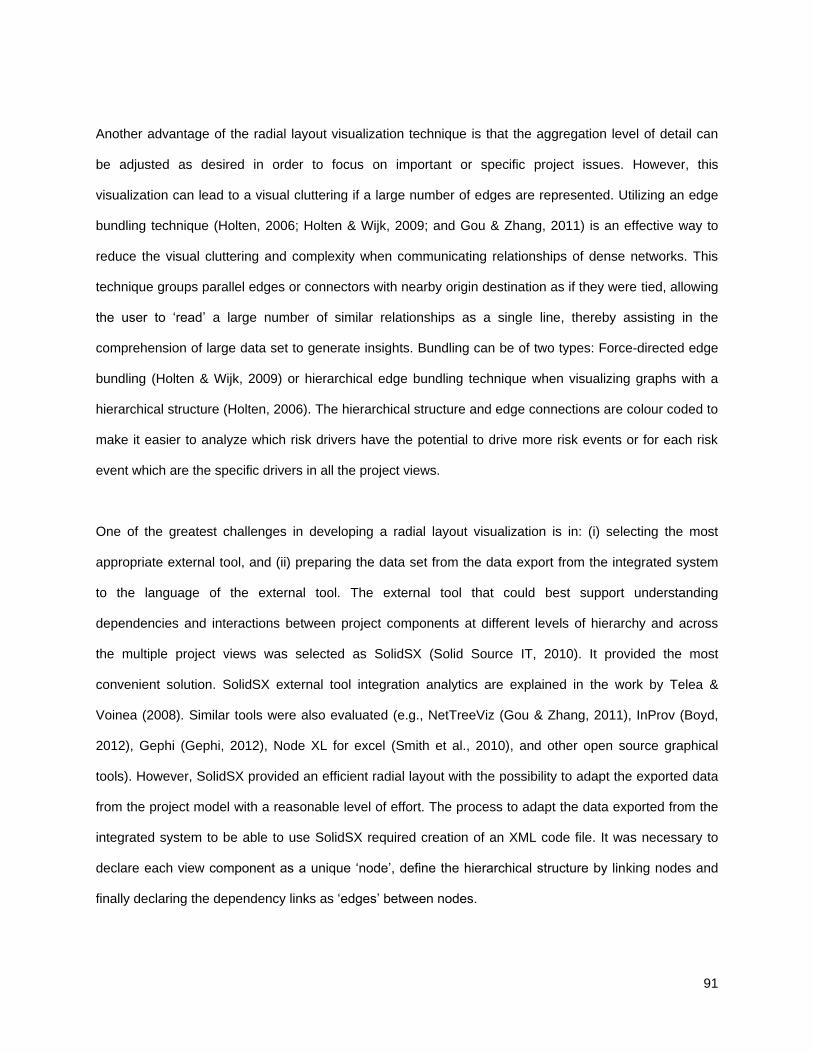
91
Another advantage of the radial layout visualization technique is that the aggregation level of detail can
be adjusted as desired in order to focus on important or specific project issues. However, this
visualization can lead to a visual cluttering if a large number of edges are represented. Utilizing an edge
bundling technique (Holten, 2006; Holten & Wijk, 2009; and Gou & Zhang, 2011) is an effective way to
reduce the visual cluttering and complexity when communicating relationships of dense networks. This
technique groups parallel edges or connectors with nearby origin destination as if they were tied, allowing
the user to ‘read’ a large number of similar relationships as a single line, thereby assisting in the
comprehension of large data set to generate insights. Bundling can be of two types: Force-directed edge
bundling (Holten & Wijk, 2009) or hierarchical edge bundling technique when visualizing graphs with a
hierarchical structure (Holten, 2006). The hierarchical structure and edge connections are colour coded to
make it easier to analyze which risk drivers have the potential to drive more risk events or for each risk
event which are the specific drivers in all the project views.
One of the greatest challenges in developing a radial layout visualization is in: (i) selecting the most
appropriate external tool, and (ii) preparing the data set from the data export from the integrated system
to the language of the external tool. The external tool that could best support understanding
dependencies and interactions between project components at different levels of hierarchy and across
the multiple project views was selected as SolidSX (Solid Source IT, 2010). It provided the most
convenient solution. SolidSX external tool integration analytics are explained in the work by Telea &
Voinea (2008). Similar tools were also evaluated (e.g., NetTreeViz (Gou & Zhang, 2011), InProv (Boyd,
2012), Gephi (Gephi, 2012), Node XL for excel (Smith et al., 2010), and other open source graphical
tools). However, SolidSX provided an efficient radial layout with the possibility to adapt the exported data
from the project model with a reasonable level of effort. The process to adapt the data exported from the
integrated system to be able to use SolidSX required creation of an XML code file. It was necessary to
declare each view component as a unique ‘node’, define the hierarchical structure by linking nodes and
finally declaring the dependency links as ‘edges’ between nodes.
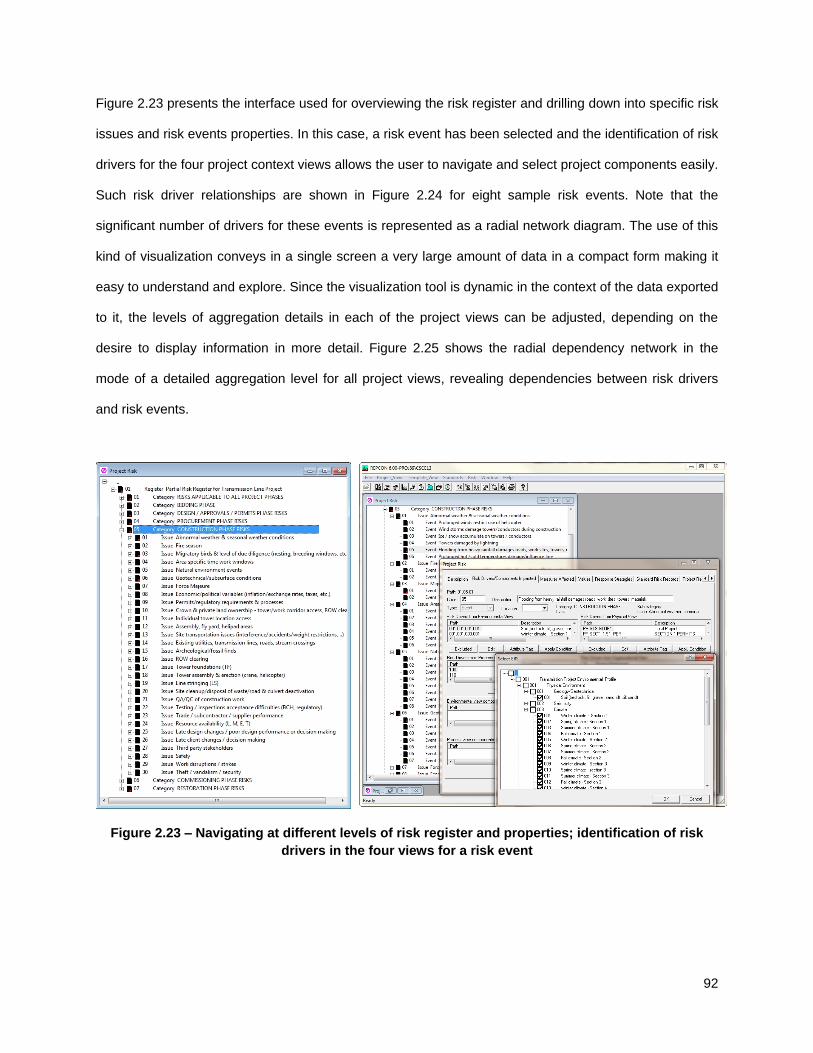
92
Figure 2.23 presents the interface used for overviewing the risk register and drilling down into specific risk
issues and risk events properties. In this case, a risk event has been selected and the identification of risk
drivers for the four project context views allows the user to navigate and select project components easily.
Such risk driver relationships are shown in Figure 2.24 for eight sample risk events. Note that the
significant number of drivers for these events is represented as a radial network diagram. The use of this
kind of visualization conveys in a single screen a very large amount of data in a compact form making it
easy to understand and explore. Since the visualization tool is dynamic in the context of the data exported
to it, the levels of aggregation details in each of the project views can be adjusted, depending on the
desire to display information in more detail. Figure 2.25 shows the radial dependency network in the
mode of a detailed aggregation level for all project views, revealing dependencies between risk drivers
and risk events.
Figure 2.23 – Navigating at different levels of risk register and properties; identification of risk
drivers in the four views for a risk event

93
Figure 2.24 – Comprehending the relationship between risk events and drivers
As mentioned before, understanding the relationship between risk drivers and events could provide
information to assist in identifying the most effective risk responses – data visualization can help with
understanding this relationship. By understanding the project’s risk profile, the risk management team can
develop the risk response register structure (see Figure 2.26). An important role that data visualization
can play in understanding the risk register is to assess the efficacy of risk responses. As stated
previously, one seeks to select those risk responses that target risk drivers associated with multiple risks,
thereby achieving leverage (see Figure 2.13). Thus, use of a radial layout visualization that incorporates
risk responses and associations with risks helps with: (i) understanding the relationship of a particular risk
response with associated risk events/issues, and (ii) providing support to determine how to gain leverage
from risk responses (i.e., treating multiple risks) – see Figure 2.27.
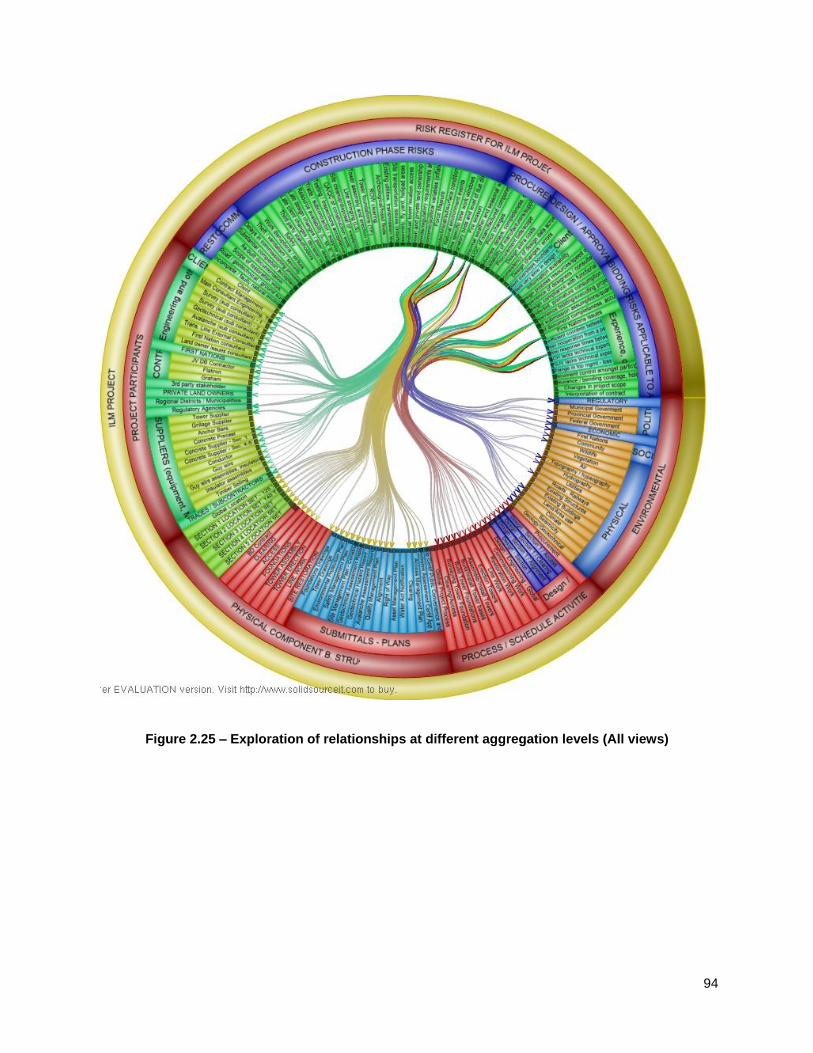
94
Figure 2.25 – Exploration of relationships at different aggregation levels (All views)
95
Figure 2.26 – Building the risk response register; visualizing relationships of risk response
actions and risk events to assess efficacy of responses

96
Figure 2.27 – Visualization of association of risk responses to risk events; ability to treat multiple
risks
2.6 CONCLUSIONS
Conclusions are summarized as follows:
1) The risk management approach adopted to develop a risk register and mine its contents using
data visualization in order to generate insights into a project’s risk profile has proven to be of
97
significant value, as measured by feedback received from the contractor for the transmission
project and the increased understanding of the project’s risk profile by management.
2) Substantial challenges exist in modeling large scale projects dispersed over variable
geographical locations. One must deal with complexities related to specific project components
and attributes as they pertain to the various views/dimensions of a project (product, process,
participant and environmental), and work at different levels of granularity, depending on the
project dimension being treated.
3) Considerable thought is required to identify relevant component attributes that may signify the
presence of one or more risks. In order to assimilate project information in an efficient way, one
has to differentiate between what is really important to know about the project and what would be
nice to have but can’t readily be modeled because collecting and processing the information
would be a very resource consuming task without a commensurate level of benefits.
4) The use of a surrogate impact measure such as severity of consequences can assist in:
a. Addressing the reluctance of personnel to express potential time and cost consequences
without the aid of detailed time and cost models because of the significant time and resource
commitment required;
b. Helping to maintain momentum in a risk identification session; and,
c. Serving as a fast way to conduct preliminary screening of risks in order to determine which
risk issues and related risk events require more-in depth assessment with respect to their
cost, time, safety, etc. consequences.
5) The role that data visualization serves in generating insights into a project’s risk profile during
the risk management process through interpretation of the risk register has proven to be of
significant value. Data visualization provides the ability to portray large amounts of data in very
compact form.
6) Data visualization is of greatest value when accompanied by interactive, dynamic, simple
and intuitive interfaces for viewing project context views, including the risk view. Achievement
of this value requires that a number of challenges be overcome related to knowledge
management and consistent use of terminology (see items 7 and 8 below) along with the ability to
98
make use of leading edge data visualization software tools that are too costly to recreate within
the confines of an integrated risk management system.
7) Knowledge management should be an integral component of the risk management approach in
order in a highly structured way to build on past lessons learned and to capture lessons gained
during application of the risk management process on future projects. The assistance of IT in
knowledge transfer can assist greatly the risk management process, improving exploration,
development, and recording (e.g., model structure interface, tabular reporting, and data
visualization) of a project’s risk profile.
8) The lack of consistent terminology when defining a project’s risk register and context directly
affects the opportunity to transfer knowledge effectively. A disadvantage of current approaches is
that knowledge is mostly captured as a static instance, lessening the ability to add lessons
learned. For the case of large scale projects in particular, their context and risk register (and also
the response register) require an extended period of time to develop, and they undergo continued
change as more knowledge becomes available, conditions change, etc.
99
CHAPTER 3. CONCLUSIONS
3.1 CONCLUSIONS
The research concludes with a number of observations in relation to its objectives, followed by comments
on challenges encountered, lessons learned, and recommendations for future work. Conclusions are
summarized as follows:
1) The risk management approach adopted to develop a risk register and mine its contents using
data visualization in order to generate insights into a project’s risk profile has proven to be of
significant value, as measured by feedback received from the contractor for the transmission
project and the increased understanding of the project’s risk profile by management.
2) Substantial challenges exist in modeling large scale projects dispersed over variable
geographical locations. One must deal with complexities related to specific project components
and attributes as they pertain to the various views/dimensions of a project (product, process,
participant and environmental), and work at different levels of granularity, depending on the
project dimension being treated.
3) Considerable thought is required to identify relevant component attributes that may signify the
presence of one or more risks. In order to assimilate project information in an efficient way one
has to differentiate between what is really important to know about the project and what would be
nice to have but can’t readily be modeled because collecting and processing the information
would be a very resource consuming task without a commensurate level of benefits.
4) The use of a surrogate impact measure such as severity of consequences can assist in:
a. Addressing the reluctance of personnel to express potential time and cost consequences
without the aid of detailed time and cost models because of the significant time and resource
commitment required;
b. Helping to maintain momentum in a risk identification session; and,

100
c. Serving as a fast way to conduct preliminary screening of risks in order to determine which
risk issues and related risk events require more-in depth assessment with respect to their
cost, time, safety, etc. consequences.
5) The role that data visualization serves in generating insights into a project’s risk profile during
the risk management process through interpretation of the risk register has proven to be of
significant value. Data visualization provides the ability to portray large amounts of data in very
compact form.
6) Data visualization is of greatest value when accompanied by interactive, dynamic, simple
and intuitive interfaces for viewing project context views, including the risk view. Achievement
of this value requires that a number of challenges be overcome related to knowledge
management and consistent use of terminology (see items 7 and 8 below) along with the ability to
make use of leading edge data visualization software tools that are too costly to recreate within
the confines of an integrated risk management system (see section 3.2).
7) Knowledge management should be an integral component of the risk management approach in
order in a highly structured way to build on past lessons learned and to capture lessons gained
during application of the risk management process on future projects. The assistance of IT in
knowledge transfer can assist greatly the risk management process, improving exploration,
development, and recording (e.g., model structure interface, tabular reporting, and data
visualization) of a project’s risk profile.
8) The lack of consistent terminology when defining a project’s risk register and context directly
affects the opportunity to transfer knowledge effectively. A disadvantage of current approaches is
that knowledge is mostly captured as a static instance, lessening the ability to add lessons
learned. For the case of large scale projects in particular, their context and risk register (and also
the response register) require an extended period of time to develop, and they undergo continued
change as more knowledge becomes available, conditions change, etc.
101
3.2 CHALLENGES
One of the main challenges involved in carrying out the research was working with a case study project
that was in progress, especially a fast-tracked design-build project. This required one to deal with a lack
of available information and constant updates of documents, which was compounded by the significant
size of the data sets involved, given the scale of the project. At the same time, project modeling was a
task that took a long time to develop, and made more difficult be the need to continuously update and
modify it to reflect changing conditions of the project, all of which was necessary to capture the essence
of reality as much as possible in a comprehensive model. The approach for modeling long-linear projects
is intensive when contractor personnel need to pursue an opportunistic strategy in order to perform the
work due to imposed project restrictions (e.g., environmental windows, third party stakeholder difficulties,
permitting difficulties, and off-shore procurement). Regarding the development of the risk register,
significant challenges exist in identifying and structuring key risk issues, risk drivers, risk events, and
relevant explicit attributes of drivers contributing to the existence of a potential risk, as well as quantifying
risks and structuring a risk response register.
Challenges related to data mining of risk and response registers require considerable thinking effort as to
the best way to visualize and understand relevant information of risk in order to maximize the benefits that
can be derived from data visualization. The approach pursued in developing visualizations was to think
about what images would be useful in interactive risk management sessions when a number of experts
are in attendance. Specifically, what advanced visualizations could aid risk identification brainstorming
and decision making processes as well as determining effective risk response measures. Issues that
need to be addressed include: (i) determining what is readily achievable within the context of an
integrated system and what is best done outside the confines of a single system for risk management, (ii)
selecting the most appropriate external data visualization tools, and, (iii) assessing the level of effort and
time involved with processes needed to export data and transform a data set to fit with data formats
compatible for use with external visualization tools, thereby allowing richer representations of project
context and risk data.
102
3.3 LESSONS LEARNED
Lessons learned which relate directly to the research contributions are summarized as follows:
1) Lessons learned from using a detailed case study (transmission line project) to implement
and evaluate the risk management approach.
a. Large scale infrastructure projects, especially long linear ones such as a transmission line
project need special understanding to appreciate fully their complexity (e.g., large scale data
sets associated with their environmental, geographical (spatial), participant, product and
process dimensions as well as relationships amongst these dimensions);
b. In order to model project context and a project’s risk register, and to cope effectively with
project scale, it is necessary to structure the models in a comprehensive hierarchical manner
in order to be able overview each project view and make possible effective model revision;
c. The use of calibrated likelihood and the use of a surrogate performance measure such as
severity of consequences for the risk assessment of events, made it possible to provide a
quick pre-assessment process with project personnel engineers and managers when
analyzing a very large number of risk events – the notion espoused in the literature that the
impact of risk events should they occur be measured in terms of performance dimensions
such as time, cost, safety, environmental impact, etc. can be readily estimated is simply not
accurate – what can be estimated with reasonable confidence is the relative importance of
different risks; and,
d. The ability to roll-up information (e.g., risk expected values from risk events to a risk level
issue) is of great value for understanding a project’s risk profile, especially to improve
communication of information to higher management levels and to other parties (e.g., client).
2) Lessons learned regarding modeling – project context and project risk profile.
a. Project context views were modeled in a way that made it possible to work at different levels
of granularity depending on the project dimension to be examined and the type of risk
involved (e.g., a risk that is applicable to a specific location instance of a project component
versus a risk that is applicable to an entire subsection of a project); and,
103
b. The surrogate performance measure of severity of impact provided a practical work around
of the challenge of doing complex estimating of risk quantification (e.g., time and cost) for the
entire project risk profile, a work around that was very acceptable to project personnel.
3) Lessons learned using data visualization and structuring risk responses.
a. The development of useful data visualizations is a process that requires a long time and
considerable effort (e.g., exploration of alternative images) especially if an individual
visualization needs a number of features to be available in order to be truly insightful – this is
especially the case if the image is implemented within the integrated risk management
system, thereby allowing the user to obtain feedback on an ongoing basis based on the most
current state of the data set;
b. It is essential that one be aware of the accelerated developments in the area of data
visualization in the form of useful commercial software and open source tools that are
applicable to a many disciplines (engineering, medicine, security, business, etc.). In order to
capitalize on the features of these tools it is best to be able to export data to them. It is not
feasible to recreate them and integrate them into the system unless an Application
Programming Interface (API) exists. In some cases, writing an interface so that they can be
called from within the parent risk modeling system is either very difficult to do or simply
impossible; and,
c. Exporting information out of the risk management system to other tools in order to explore
data in greater depth leads to the loss of some interactive abilities in that project data is no
longer dynamic (i.e., changes in risk modeling system will not be updated automatically). On
the other hand, when relatively static data is involved or when the data results are not likely
to change anymore, it is best to export data from the risk management system for
exploration with other tools, especially when different data aggregations and superpositions
are desired.
104
3.4 FUTURE WORK
The approach pursued as part of the research on risk management modeling for large scale construction
projects still requires further work in order to address challenges encountered. Within the scope of this
research, the recommendations for future work are:
1) Examine user interface issues in the multi-view project model that could assist with the creation of
flexible, dynamic and comprehensive dashboards to aid users to view and navigate in real time
the hierarchical structures for project context and risk register components;
2) Adapt, adopt and integrate interactive visualization tools and strategies available in external tools
and used in other disciplines. The challenge is one of selecting the right visualization tools, and
then deciding how is best to implement them into the system so that they are as dynamic as
possible;
3) Conduct further work on the notion of a project risk response register in terms of contents,
structure, re-estimation of likelihood and impact at the risk event level, and visual evaluation of
response register contents;
4) Show how post-response risk assessment can provide a better understanding on how to plan
response strategies, and how to implement and monitor them adequately;
5) Enhance further the constructs and accompanying interfaces to capture and manage knowledge
pertaining to modeling project context, formulating a project’s risk and response registers, and
assessing the likelihood and impacts of individual risk events; and
6) Conduct additional case studies on full-scale projects in order to enhance further the practicality
of the risk modeling approach and its responsiveness to the realities of the construction industry.
105
REFERENCES
AESO. (2012). Long-term Transmission Plan, Alberta, Canada.
Al-Bahar, J., & Crandall, K. (1990). Systematic Risk Management Approach for Construction Projects. J.
of Construction Engineering and Management, 116(3), 533–546.
Bartlett, J. (2002). Using risk concept maps in a project or programme, Fifth European project
management conference, PMI Europe 2002. Cannes, France.
BC Hydro. (2010). Guidelines for Development near overhead transmission lines in BC. BC Hydro
properties division, British Columbia, Canada.
BC Hydro. (2012). Integrated Resource Plan Transmission Analysis, British Columbia, Canada.
BCTC. (2007). Certificate of Public Convenience and Necessity (CPCN) Application. BCTC Interior to
Lower Mainland Transmission Project, British Columbia, Canada.
BCTC. (2008). Environmental Assessment Certificate (EAC) Application. BCTC Interior to Lower
Mainland Transmission Project, British Columbia, Canada.
Beehler, M.E. (2009). Lessons Learned on Mega Projects (transmission Lines). Electrical Transmission
and Substation Structures Conference 2009 © ASCE, 71-82.
Blanco, I., et al. (2010). Construction of Transmission and Distribution Lines. IMIA, Working Group Paper
69(10), Berlin, Germany.
Bostock, M. (2012). Data-Driven Documents: JavaScript library. Retrieved from: http://d3js.org [cited
October 2012].
Boyd, M.D. (2012). InProv: visualizing provenance graphs with radial layouts and time-based hierarchical
grouping, B.A. thesis. Harvard College Cambridge, Massachusetts, U.S.
Burchett, J. F., Tummala, M. R., & Leung, M. A. (1999). A world-wide survey of current practices in the
management of risk within electrical supply projects. J. Construction Management and Economics,
17(1), 77-90.
Carrillo, P., & Chinowsky, P. (2006). Exploiting Knowledge Management: The Engineering and
Construction Perspective. J. of Management in Engineering, ASCE, 22(1), 2-10.
106
Chapman, C.B., & Ward, S. (2003). Project Risk Management: Processes, Techniques and Insights (2nd
ed.). Chichester, U.K.: John Wiley & Sons.
Content, T. (2009, February 10). $10 billion transmission lines for wind power proposed. Journal Sentinel
Online. Retrieved from: http://www.jsonline.com [cited November 2012].
Curk, T., Demšar, J., et al. (2005). Orange: microarray data mining tool. Retrieved from:
http://orange.biolab.si [cited October 2012].
Cutter, S., Peters, E., & Bostrom, A. (2008). Perspectives on Visualizing Uncertainty in Natural Hazards.
In Mumpower, J., Renn, Ortwin. (Eds.), Risk Assessment, Modeling and Decision Support, Risk,
Governance and Society, (14), 295 – 318, U.S.: Springer.
Daoulas, J.C. (2011). GeoRisk in the Design-Build Procurement Process. GeoRisk 2011: Geotechnical
Risk Assessment and Management 2011 © ASCE, 224, 1090-1097.
De Zoysa, G.N.S. (2006). Application and Re-use of Information and Knowledge in Managing Risks of
Infrastructure Projects, PhD thesis. University of British Columbia, Canada.
Dey, P.K. (2010). Managing project risk using combined analytic hierarchy process and risk map. Applied
Soft Computing, 10(4), 990–1000.
Eppler, M., & Aeschimann, M. (2008). Envisioning Risk. Institute for corporate communication. Retrieved
from: www.knowledgecommunication.org/pdf/envisioning-risk.pdf, [cited February 2013].
ESKOM. (2004). Transmission line towers and line construction, Transmission specification
(TRMSCAAC1, Rev.3), South Africa.
Evelson, B., & Yuhanna, N. (2012). The Forrester Wave: Advanced Data Visualization (ADV) Platforms,
Q3 2012. Forrester Research Inc. Retrieved from:
http://www.sas.com/news/analysts/Forrester_Wave_Advanced_Data_Visualization_Platforms_Q3_2
012.pdf [cited November 2012].
Feather, M.S. (2006). Experiences using Visualization Techniques to Present Requirements, Risks to
Them, and Options for Risk Mitigation. IEEE Proceedings of the International Workshop on
Requirements Engineering Visualization (Rev 06), U.S.
Garcia, N. (2012), Javascript Infovis Toolkit. Retrieved from: http://philogb.github.com/jit/index.html [cited
October 2012].
107
General Electric (2012). General Electric data visualization program. Retrieved from:
http://visualization.geblogs.com [cited October 2012].
Gephi (2012). Gephi: open graph visualization platform. Retrieved from: http://gephi.org [cited October
2012].
Google Developers (2012). Google chart tools. Retrieved from: https://developers.google.com/chart [cited
October 2012].
Gou, L., & Zhang, X.L. (2011). TreeNetViz: revealing patterns of networks over tree structures. IEEE
transactions on visualization and computer graphics, 17(12), 2449-2458.
Hillson, D. (1999). Developing Effective Risk Responses. Proceedings of the 30th Annual Project
Management Institute 1999 Seminars and Symposium, U.S.
Holten, D. (2006). Hierarchical edge bundles: Visualization of adjacency relations in hierarchical data.
IEEE Transactions on Visualization and Computer Graphics, 12(5), 741-748.
Holten, D., & Wijk, J.J.V. (2009). Force-directed edge bundling for graph visualization. Computer graphics
forum, 28(3), 983-990.
ICE. (2005). RAMP: Risk Analysis and Management for Projects, Institution of Civil Engineers and the
Faculty and Institute of Actuaries (2nd ed.). U.K.: Thomas Telford Ltd.
Jacomy, A. (2012). Sigma.js: JavaScript graph library. Retrieved from: http://sigmajs.org [cited October
2012].
Jashapara, A. (2004). Knowledge management: an integrated approach, financial times. Harlow, U.K.:
Prentice-Hall.
Kalkani, E.C., & Boussiakou, L.G. (1996). Environmental Concerns for High-Voltage Transmission Lines
In Unipede Countries. J. of Environmental Engineering, 122, 1042-1045.
Krzywinski, M., et al. (2009). Circos software. Retrieved from: http://circos.ca [cited October 2012].
Lakhapati, D. (2009). Construction Challenges of Extra High Voltage Transmission Lines: Building in the
Most Difficult Terrain in the World. Electrical Transmission and Substation Structures Conference
2009 © ASCE, 367-378.
Leung, H.M., Chuah, K.B., & Tummala, V.M.R. (1998). A Knowledge-based System for Identifying
Potential Project Risks. Omega, Int. J. Mgmt. Sci., 26(5), 623-638.
108
Marshall, R., & Baxter, R. (2002). Strategic Routeing and Environmental Impact Assessment for
Overhead Electrical Transmission Lines. Journal of Environmental Planning and Management, 45(5),
747-764.
McCall, C., Hogan, J.M., & Retz, D. (2009). Design and Construction Challenges of Overhead
Transmission Line Foundations (NU’s Middletown Norwalk Project). Electrical Transmission and
Substation Structures Conference 2009 © ASCE, 319-328.
MIT (2012). MIT SENSEable City Laboratory program. Retrieved from: http://senseable.mit.edu [cited
October 2012].
Neal, A. (2013, February 24). $2.2 billion project will overhaul Minnesota's electrical grid. Star tribune.
Retrieved from: http://www.startribune.com [cited March 2013].
Nelms, C. (2012). A risk identification framework and tool for large infrastructure public private partnership
delivery, PhD thesis. University of British Columbia, Canada.
Nezafatkhah, S. (2011). Visualizing risk management data associated with capital expenditure projects,
MASc thesis. University of British Columbia, Canada.
PMI. (2008). A Guide to the Project Management Body of Knowledge: PMBOK Guide (4th ed.). Newton
Square, PA, U.S.: Project Management Institute.
Public Service Commission of Wisconsin. (2011). Environmental Impacts of Transmission Lines,
Publication Electric10, Wisconsin, US.
Rimlinger, F. (2012). Sparklines for Excel: graphic functions. Retrieved from: http://sparklines-
excel.blogspot.ca [cited October 2012].
Rolstadås, A., et al. (2011). Risk Navigation Strategies for Major Capital Projects: Beyond the Myth of
Predictability, Springer Series in Reliability Engineering. U.K.: Springer-Verlag London Limited.
Russell, A.D., & Nelms, C.E. (2007). The application of information technology to support the elicitation of
expert judgment in project risk management, Proc. Construction Management and Economics, CME
25 Conference (11 pp.). University of Reading, U.K.
Russell, A.D. & Udaipurwala, A. (2004). Using Multiple Views to Model Construction. Proc. CIB World
Building Congress (12 pp.). Toronto, Canada.
109
Russell, P.R. (2012, April 16). New transmission lines to link Texas cities with future wind farm
development. ENR Texas & Louisiana. Retrieved from: http://texas.construction.com [cited
November 2012].
Smith, M.A., Shneiderman, B., et al. (2009). Analyzing (social media) networks with NodeXL. Proceedings
of the 4th International Conference on Communities and Technologies, ACM, 255-264. U.S.
Smith, M.A., Shneiderman, B., et al. (2010). NodeXL: a free and open network overview, discovery and
exploration add-in for Excel 2007/2010. Retrieved from: http://nodexl.codeplex.com [cited October
2012].
Smith, N.J., Merna, T. & Jobling, P. (2006). Managing risk: in construction projects (2nd ed.). Oxford,
U.K.: Blackwell
Software FX Inc. (2012). jChart FX: API JavaScript libraries. Retrieved from: http://www.jchartfx.com
[cited December 2012].
Solid Source IT. (2010). Solid Software Explorer (Solid SX). URL http://www.solidsourceit.com/ [cited
October 2012].
Tableau Software. (2012). Tableau 7.0. URL http://www.tableausoftware.com/ [cited October 2012].
Telea, A., & Voinea, L. (2008). An interactive reverse engineering environment for large-scale C++ code,
SoftVis '08 Proceedings of the 4th ACM symposium on Software visualization, pp.67-76, U.S.
TIBCO Software Inc. (2012). TIBCO Spotfire 4.5. URL http://spotfire.tibco.com/ [cited October 2012].
Tummala, V.M.R., & Burchett J.F. (1999). Applying a Risk Management Process (RMP) to manage cost
risk for an EHV transmission line project., International Journal of Project Management, 17(4), 223-
235.
Voge, A. (2013, February 12). Company plans to unveil Wyoming-Nevada transmission line plan in
March. Casper Star Tribune. Retrieved from: http://trib.com [cited February 2013].
WSDOT. (2010). Project Risk Management Guidance for WSDOT Projects. WSDOT Administrative and
Engineering Publications, Washington, U.S.
WECC. (2011). 10-Year Regional Transmission Plan Summary, U.S.
Wideman, R.M. (1992). Project and program risk management a guide to managing project risk and
opportunities. Newton Square, PA, U.S.: Project Management Institute.
110
Wyman, G.E. (2009). Transmission Line Construction in Sub-Arctic Alaska Case Study: “Golden Valley
Electric Association’s 230kV Northern Intertie”. Electrical Transmission and Substation Structures
Conference 2009 © ASCE, 329-341.
Yamatani, K., & Jahangir, A. (2011). Mitigating Risk and Managing Foundation Cost & Schedule on Mega
Transmission Line Projects: Beginning with the End in Mind. GeoRisk 2011: Geotechnical Risk
Assessment and Management 2011 © ASCE, 224, 1117-1124.