Embed Size (px)
Citation preview

274 Int. J. Service and Computing Oriented Manufacturing, Vol. 3, No. 4, 2018
Copyright © 2018 Inderscience Enterprises Ltd.
Risk management and design of mitigation plans through discrete events simulation and genetic algorithms in offshore wind processes
David Chas Álvarez*, Adolfo Lamas Rodríguez and José Antonio Muiña Dono UMI Navantia-UDC, University of A Coruña, A Coruña, Spain Email: [email protected] Email: [email protected] Email: [email protected] *Corresponding author
Abstract: This paper tackles the difficult task of identifying risk and opportunities quantify them and propose mitigation plans that minimise the impact of the risk in manufacturing projects. For this reason, a discrete events simulation model representative of a manufacturing plant and manufacturing strategy has been developed. This simulation model will be able to identify and assess the risks of the project with regard to risk effect in the schedule or in the manufacturing cost and, on the other hand, simulation model will be used in combination with an optimiser based on genetic algorithms (GAs), allowing the design of new manufacturing strategies or new plant layouts. Finally, the experimental results were obtained customising the simulation model for a real project of manufacturing wind turbine foundations, in particular to the piles that hold the lattice structure (jacket) to the bottom of the sea.
Keywords: genetic algorithms; risk management; mitigation plans; discrete events simulation; offshore wind processes; jacket.
Reference to this paper should be made as follows: Chas Álvarez, D., Lamas Rodríguez, A. and Dono, J.A.M. (2018) ‘Risk management and design of mitigation plans through discrete events simulation and genetic algorithms in offshore wind processes’, Int. J. Service and Computing Oriented Manufacturing, Vol. 3, No. 4, pp.274–292.
Biographical notes: David Chas Álvarez holds an MSc in Industrial Engineering since 2015 and PhD student since 2016. He works as a research engineer in the joint venture Navantia-University of Coruña (UMI) and he is mainly involved in the development of simulation and optimisation models of industrial processes. Especially, in simulation models of wind turbine foundations manufacturing.
Adolfo Lamas Rodríguez graduated from the University of Vigo in 1998. He holds an MSc and PhD in Industrial Engineering. He combines his research activities in the researching group Grupo Integrado de Ingeniería and his position as a senior engineer and Project Manager in the Spanish leading shipbuilding company Navantia. He is also an Associate Professor at the

Risk management and design of mitigation plans 275
University of A Coruna since 2004 teaching in subjects related to manufacturing, simulation and lean manufacturing techniques. He is the coordinator of one of the researching lines in the joint venture Navantia-University of Coruña (UMI) related to simulation and optimisation models of industrial processes.
José Antonio Muiña Dono holds a university degree in Industrial Technology since 2015 and an MSc in Industrial Engineering since 2017 from the University of Coruña. He is a PhD student since 2017 and his research interests include simulation, optimisation and development of new technologies for the Industry. He works as a research engineer in the joint venture Navantia-University of Coruña (UMI), focusing his activity on the modelling and simulation (M&S) of industrial processes.
This paper is a revised and expanded version of a paper entitled ‘Risk management in jackets manufacturing projects using discrete events simulation’ presented at i3M 2017, Barcelona, 18–20 September 2017.
1 Introduction
With the aim of joining to the fourth industrial revolution ‘Industry 4.0’, Navantia, as the main naval technological company in Spain and with more than three hundred years of experience has established a collaboration with the University of A Coruña in the field of R&D+i creating the joint venture Navantia-UDC ‘UMI’.
The aim of the joint venture is the development of new techniques and technologies to increase the competitiveness of the shipyard trough the improvement of the existing manufacturing processes and the development of new ones, in order to reduce the makespan and the cost of the projects.
To achieve this goal, the UMI has established the following research areas:
• Transformation of the manufacturing methods to improve their efficiency.
• Development of new logistic schemes of the shipyard.
• Automation of manufacturing processes.
• Development of specific TIC tools and devices for manufacturing engineering and knowledge management.
• Transference of the new developments to the supply chain.
To work in these areas, the UMI has established four research lines with sixteen performances cited in Table 1 and with more than sixty researchers.
Due to the evolution of the offshore wind market, the performance of modelling and simulation of offshore wind processes is one of the lines with more interest at present. Currently this market is expanding rapidly, especially in Europe, where it doubled its installed capacity in the last three years, reaching a total installed capacity of 12.631 MW and with a forecasted for 2020 of achieve an installed capacity of 24.6 MW (Ewea, 2017b). Offshore wind energy is one of the most dynamic renewable energies, in terms of installed capacity and technological development since 2010 (Varela-Vázquez and del Carmen Sánchez-Carreira, 2017).

276 D. Chas Álvarez et al.
Table 1 Research lines and actions of the UMI
Process optimisation
Modelling and simulation of offshore wind processes. Modelling and simulation of shipbuilding processes. Process optimisation. Robotic and automation. Project ‘Closed pipes’. Statistical control.
TIC’s Workplace information and augmented reality. Industrial internet of things. Auto ID pipes.
Disruptive technologies
Project ‘Wireless’. Electrical system optimisation. Project ‘Wireless’. Optimisation of the data transmission system. Auto-reconfigurable systems. Study about the use of additives.
Other technologies UAV’s use: outside and inside. Cybersecurity.
On the other hand, at the same time that the market grows the complexity of the installations also grows, with offshore wind farms increasingly farther from the coast, in deeper areas and with higher capacity turbines (Ewea, 2017a).
Figure 1 Shipyard’s 3D simulation model (see online version for colours)
Simultaneously, the wind industry is continuously reducing costs to become a competitive energy resource, turning the onshore wind energy into the cheapest new power generation in Europe. But, in 2016, offshore wind energy has proven it can be in the same cost range (Ewea, 2017b). Offshore wind is also undergoing an increasing cost reduction and technology improvements (Varela-Vázquez and del Carmen Sánchez-Carreira, 2017).

Risk management and design of mitigation plans 277
With this scenario, the performance of the aforementioned research line has as its main aim the design of a simulation model that represents the present and the future of the shipyard in a virtual environment, using the virtual environment as a tool to help the project management.
The use of the virtual environment of the project team will depend on the stage of the project, because the tool will be useful from the first commercial stages until the project follow up.
The simulation tools allow the project team to study the current manufacturing process, allowing then predict the behaviour of the plant experimenting in a virtual environment, with the possibility to realise many changes in the system without the need to change the real system.
Lasi et al. (2014) talks about the term Industry 4.0 as a wide range of current concepts, being one of the concepts the Cyber-physical Systems, where the physical and digital level are merged, arising systems which physical and digital representation can’t be differentiated in a reasonable way.
On the other hand, the risk management is becoming to be more frequently and necessary for the companies in order to avoid risk and achieve their objectives. The use of simulation techniques is advised as an effective instrument for supply chain risk evaluation (Klimov and Merkuryev, 2008).
Therefore, through the Simulation tool used, it is possible to characterise the risk based on quantitative data and determine the appropriate level of detail of the mitigation plans depending on the probability of using them. Process risks should be modelled and assessed to account for the uncertainties and their consequences (Shah et al., 2017). In addition, the combination of the simulation model with genetic algorithm optimisation lets search the best combination of simulation model parameters that meets the objectives. Genetic algorithms (GAs) can be used as a standard optimisation technique with any simulation modelling tool (Paul and Chanev, 1997).
In this sense, the need to assess risk quantitatively in the offshore projects developed in the shipyard, as well as the design of mitigation plans that have the minimum impact on the project, is the main reason for carrying out the work presented in the following sections.
2 State of the art
The risk management process is a complex and systematic action, in which the entire project team must participate. Despite the fact that today is possible to access at big quantity information, it is also true that the risk increasing, and the influence that they have on the system is increasing, for this reason, the need of an adequate risk management it is vital to maintain the investment made in the project.
Therefore, to quantify risk through the simulation, it is not enough simulating our manufacturing process, if it is not necessary to know the response of the system due to the dependence on external factors. For example, the possibility of strikes, times of work, special permissions, etc. This factor allows do a better risk assessment and a more efficient design of mitigation plans.
In this sense, it is usual to find in recent years a large number of publications about the risk management, where the authors propose as main tools the Monte Carlo

278 D. Chas Álvarez et al.
simulation (MCS) and the discrete event simulation (DES). These tools are very useful to represent stochastic models, having as main difference the use of the time to simulate the system, because the MCS is a static simulation, and the DES is a dynamic simulation. It is also usual to find publications about the combination of DES with genetic algorithms optimisers, frequently used to optimise the production plan.
For its widespread use and its greater applicability in this case, the following paragraphs present a brief summary of the most relevant studies related to the problem considered:
Regarding risk assessment, the article of Kayis et al. (2008) is very interesting. In this paper, the authors define the process of risk assessment as an iterative process, basing their risk management methodology on the following steps.
• establishing the context
• risk identification
• risk analysis
• risk assessment
• risk treatment
• communication and consultation
• monitoring and reviewing.
In this work, the authors developed a risk assessment and mitigation model using metaheuristic rules and genetic algorithms. Obtaining the best mitigation plans based on the cost of the mitigation plan and the objectives of the project.
Proskovics et al. (2016) the objective of the manufacturing risk assessment is to identify any manufacturing related hazards, such as cost, schedule and quality, and to perform a risk assessment of these.
Klimov and Merkuryev (2008) discussed the simulation-based risk evaluation in supply chain, and presented in their work a risk evaluation example with a simplified supply chain system.
In turn, as mentioned above, the MCS is one of the main tools in risk assessment, this methodology being adopted by various authors and with which “many ‘what if’ type cases can be examined – as concerns architecture, probability distributions, and perhaps most importantly – strategies” (Miller and Engemann, 2008).
Singh and Schmitt (2009) studied the impact on the customer service of disruptions in a customer’s products service using Monte Carlo and DES. They used their tool in order to assess the level of supply chain disruption risk, test different mitigation plans, can use the tool in case of a disruption in order to validate recovery steps before putting them into action and Identify redundancy in the system.
It is very interesting the paper of Rezaie (2007) because in it talks about the importance of the dependence between the different risks evaluated. The authors highlighted that in a normal MCS those dependencies are not evaluated, generating confusing results. For this reason, the authors propose an alternative methodology based on the declaration in each iteration of a free variable and the definition of the other variables as dependent on the first.

Risk management and design of mitigation plans 279
Cube et al. (2016) proposed a process-oriented quantitative risk assessment methodology in order to evaluate risk associated with processes using modelling, simulation and decision-making approaches.
Kim and Kim (2017) designed a tool based on DES for monetarily quantify risks independent of the depth of information and thus allow adjusting the model dependent on the use-case.
Longo et al. (2014) the authors focused their work on the development of an integrated simulation model with optimiser of genetic algorithms for the manufacture of vehicles for schools, achieving two main objectives
1 Evaluate the economic feasibility of buying new automatic painting machines.
2 Investigate order scheduling using genetic algorithms.
Kljajic et al. (2014) used the DES to that the computer calculation of the genetic algorithm be faster, and to represent and check the results of the genetic algorithm. The authors describe his work as a help tool for the production planning and management staff.
Paul and Chanev (1997) used a steelwork simulation model with diverse input parameters in order to get through genetic algorithms the best combination of parameters that meets the objectives of the project.
Longo (2013) develops a simulation model for the calculation of planning in a high pressure hose factory, allowing comparing the results of the different scenarios obtained through the application of dispatch rules, genetic algorithms and ant hive optimisation algorithms (ACO).
This brief on the state of the art led us to propose a tool based on DES in order to identify risks, assessing them and propose mitigation plans.
3 Problem description
The risk and opportunities identification and quantification is a task that should be done along all stages in the manufacturing project, including the offer phase and the work follow-up. Risk management tasks are frequently tedious and they spend a lot of time on the project team. At the same time, in many projects, the risk quantification is taken as a subjective task, because is elaborated from the combination of deterministic schedules and the experience of the team project.
On the other hand, the need to design risk mitigation plans that involve minimal impact both in terms of time and cost of the project, highlights the need to use a risk management tool that allows the identification and assessment of risks in a quantitative way. As well as, the automatic design of risk mitigation plans that impact as little as possible in the term and cost of the project.
Consideration of several possible mitigation actions and cost estimations for each risk factor in every manufacturing task would help project managers to stay pro-active and thus provide mitigation actions within the project objectives (Kayiset al., 2008).
Initially, the strategy for developing mitigation plans that provide a basis for this work is represented in Figure 2, in which the qualitative evaluation of the risks is shown, as well as a design of mitigation plans based on the work team experience.

280 D. Chas Álvarez et al.
Figure 2 Current strategy to develop mitigation plans (see online version for colours)
For these reasons, this work focuses on highlighting the benefits of simulation with respect the deterministic schedules. Noting as the main advantage of the simulation the availability of applying randomness at the task times, the availability of resources and also insertion of operations conditioned to the evolution of the simulation.
Figure 3 Applications of the simulation model (see online version for colours)
+

Risk management and design of mitigation plans 281
Moreover, the simulation model has been designed to be used in different stages of the planning chain, activating or deactivating the model randomness as is presented in the process flow of Figure 3. Thus, simulation model can act as simulation based-solver when it works in combination with genetic algorithm optimiser and without randomness or as risks quantifier, when it works applying randomness.
Choosing for this work the optimisation by means of genetic algorithms mainly for its extensive use in different research works related to the optimisation of processes.
As mentioned by Longo (2013), among the different optimisation algorithms, GAs have been extensively used to solve large-scale combinatorial optimisation problems.
Among the meta-heuristic algorithms, GAs have been recognised as a general search strategy and an optimisation method that is easily implemented and is able to guarantee better solutions independently of the type of the solution space; for these reasons, GAs have been increasingly used to address scheduling problems (Jeong et al., 2006)
4 Risk management methodology
The risk management methodology used to develop the simulation model is based mainly on the process flow presented in Figure 4, in which it is possible to identify three key points of the use of the simulation model.
Figure 4 Process flow of the risk management methodology (see online version for colours)
Points two and three correspond to the use of the simulation model as risks quantifier. In contrast, point four is solved by using the simulation model as an optimiser in combination with the use of GAs
4.1 Risks assessment
The risk management methodology used to solve the points two and three of the process flow presented in Figure 4, focus the risk assessment in two main points
• the probability that the analysed risk will happen
• the impact of risk on the project.

282 D. Chas Álvarez et al.
The first point is evaluated through Table 2, which defines a level of probability index (PI) based on the probability of occurrence of the risk studied. The probability of occurrence of the risk is calculated in the simulation model based on the randomness of the input parameters of the model and possible disturbances that may occur in the master schedule. Table 2 Probability index
Probability index (PI) Denomination Probability 1 Very low 0% < P ≤ 10% 2 Low 10% < P ≤ 30% 3 Medium 30% < P ≤ 60% 4 High 60% < P ≤ 90% 5 Very high 90% < P ≤ 100%
Second point refers to the impact of the risk on the project (II), and it is evaluated according to Table 3. Table 3 Impact index
Impact index (II) Denomination 1 Very low 2 Low 3 Medium 4 High 5 Very high
This risk management methodology divides the impact of the risks under two criteria:
• impact on delivery milestones
• impact on manufacturing costs.
The thresholds that establish the II can change from one project to another, for this reason, to be used in the case study section; threshold tables have been developed. Therefore, to calculate the impact on the delivery milestones Table 4 is used, in which the II is established by the total delay in the delivery of the final product. Table 4 Schedule thresholds
Schedule impact [days] Very low Low Medium High Very high < 5 < 15 < 30 < 50 ≥ 50
Table 5 Cost thresholds
Cost impact [€] Very low Low Medium High Very high < 50,000 < 75,000 < 150,000 < 300,000 ≥ 300,000

Risk management and design of mitigation plans 283
Likewise, the impact on manufacturing costs is calculated from Table 5, in which it is necessary to estimate the expense incurred by the project as a result of the risk to determine the II.
4.2 Risks criteria
Once the probability and Impact Indices have been defined, the Criticality Index shall be defined as the product of both using equation (1).
CRITICAL INDEX(CI) PI II= ⋅ (1)
Table 6 represents all possible values of the criticality index. At the same time, a colour code has been used to separate the thresholds in terms of design detail of the mitigation plans. Thus, if the risk level is green, specific actions are usually not necessary, if the risk level is yellow, it is necessary to elaborate a risk response strategy, but the response strategy will not be applied until the risk level is reached. By last, if the risk level is orange or red, it is necessary to design and apply mitigation plans as soon as possible in order to avoid the risk. Table 6 Critical index matrix (see online version for colours)
Critical index (CI) Impact
Very low Low Medium High Very high Probability Very high 5 10 15 20 25
High 4 8 12 16 20 Medium 3 6 9 12 15 Low 2 4 6 8 10 Very low 1 2 3 4 5
Notes: Risk level (LOW): CI = 1, 2, 3, 4, 5, 6
Risk level (MEDIUM-LOW): CI = 8, 9, 10, 12 Risk level (MEDIUM-HIGH): CI = 15, 16, 20 Risk level (HIGH): CI = 25
The assessment of the CI for each risk shall be whichever is the higher of the values estimated for both criteria.
5 Discrete events simulation model
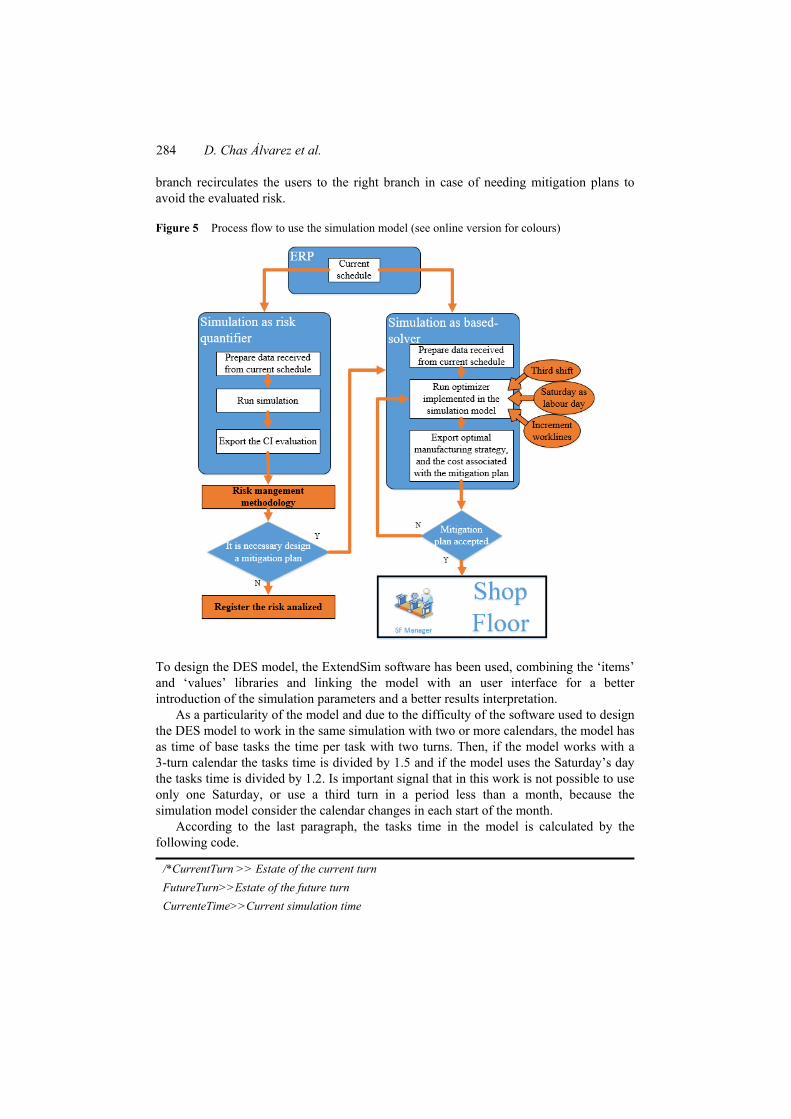
In order to represent the structure of the simulation model the process flow presented in Figure 5 is developed.
The simulation model is always fed by the master schedule, so the task times, deadlines and manufacturing units are independent of the use of the model.
If the simulation model is used as risk quantifier, it will be necessary to follow the steps described in the left branch; conversely, if the model is used as simulation based-solver, the right branch shows the steps to use the designed tool. Moreover, the left
284 D. Chas Álvarez et al.
branch recirculates the users to the right branch in case of needing mitigation plans to avoid the evaluated risk.
Figure 5 Process flow to use the simulation model (see online version for colours)
To design the DES model, the ExtendSim software has been used, combining the ‘items’ and ‘values’ libraries and linking the model with an user interface for a better introduction of the simulation parameters and a better results interpretation.
As a particularity of the model and due to the difficulty of the software used to design the DES model to work in the same simulation with two or more calendars, the model has as time of base tasks the time per task with two turns. Then, if the model works with a 3-turn calendar the tasks time is divided by 1.5 and if the model uses the Saturday’s day the tasks time is divided by 1.2. Is important signal that in this work is not possible to use only one Saturday, or use a third turn in a period less than a month, because the simulation model consider the calendar changes in each start of the month.
According to the last paragraph, the tasks time in the model is calculated by the following code.
/*CurrentTurn >> Estate of the current turn FutureTurn>>Estate of the future turn CurrenteTime>>Current simulation time

Risk management and design of mitigation plans 285
WorkTime>> Tasks time with 2 labour turn per day ChangeTurn>>First day for each month*/ double WorkThisMonth; if(CurrentTurn==FutureTurn || (currentTime+WorkTime)<ChangeTurn) { ProcTime=ceil(WorkTime / CurrentTurn); } Else { WorkThisMonth=( ChangeTurn -currentTime)/ CurrentTurn; ProcTime=ceil(WorkThisMonth +( WorkTime - WorkThisMonth * CurrentTurn)/ FutureTurn); }
Regarding the cost defined in the discrete events simulation model, it is interesting to highlight the costs in Table 7, where daily costs are calculated using equations (2)–(4).
CMD3T (CMD2T / 2) 1.3 CMD2T= ∗ + (2)
CMD2T CMD2T 1.3= ∗ (3)
CMD3T CMD3T 1.3= ∗ (4)
Therefore, the benefit of the project is defined in the simulation model by means of equation (5)
o oB ProfitPerPile N Piles (D2T CMD2T D3T CMD3T S2TCMS2T S3T CMS3T DSA CDA DA CDD)
= ∗ − ∗ + ∗ +∗ + ∗ + ∗ + ∗
(5)
Where:
D2T work days to two shifts.
D3T work days to three shifts.
S2T Saturday labour days with two shifts.
S3T Saturday labour days with three shifts.
DSA days with the production stopped due to lack of steel.
DA days that ends with advance regarding the basic planning.
At the same time, the DES model has been combined with a GA optimiser. The optimiser plays with 45 Boolean variables, which means a total of 3.51844 * 1012 possible scenarios. As it is a planning optimisation based on the planning costs, has been necessary to use a series of restrictions to avoid incoherent schedules, such as the schedules of Figure 6 for the workstations used.

286 D. Chas Álvarez et al.
Table 7 Cost defined in the simulation model
Description Cost [€] Acronym Cost of manufacturing day with two labour turns and per active workstation
5.370 CMD2T
Cost of manufacturing day with three labour turns and per active workstation
8.879 CMD3T
Cost of Saturday’s day with two labour turns and per active workstation
6.995 CMS2T
Cost of Saturday’s day with three labour turns and per active workstation
11.541 CMS3T
Cost per month of an additional line with two labour turns 103.500 CL2T Cost per month of an additional line with three labour turns 170.820 CL3T Cost per day without work (delay in the delivery of raw material) 26.895 CDA Cost of day due to ending the project before the planned 75.000 CDD
Figure 6 Inefficient use of workstations (see online version for colours)
Similarly, the designed tool avoids inefficient schedules as the Figure 7, for the combination between the use of the Saturday’s day and the third turn.
Regarding the constrain equation the simulation model uses the following code.
For (i = 5; i < 20; i++) { If(Month[i])! = Month[i + 1] && Month[i + 1])! = Month[i + 2]) Reject = TRUE; If(SaturdayMonth[i]! = SaturdayMonth[i + 1] && SaturdayMonth[i + 1]! =
SaturdayMonth[i + 2] && SaturdayMonth[i + 2]! = SaturdayMonth[i + 3]) Reject = TRUE;
If(3TurnMonth[i]! = 3TurnMonth[i + 1] && 3TurnMonth[i + 1]! = 3TurnMonth[i + 2] && 3TurnMonth[i + 2]! = 3TurnMonth[i + 3]) Reject = TRUE;
}

Risk management and design of mitigation plans 287
Figure 7 Inefficient use of third shift and Saturday as labour day (see online version for colours)
6 Case study
This case study has been designed to a jackets manufacturing project, particularly to the piles that hold the jacket to the bottom of the sea. Piles manufacturing consists of nine stages according to Table 8, which are trustworthy represented in the simulation model. To demonstrate the capacity of the designed tool, first a risk assessment is presented and then the procedure for designing mitigation plans is described. Table 8 Stages in the piles manufacturing
Task number Task description 1 Plates cut and bevelling 2 Bending of plates 3 Longitudinal Welding 4 Section assembly 5 Circular welding 6 Welding of beds 7 Non-destructive testing 8 Marking of section 9 Final inspection
6.1 Risk assessment
To explain this case study, the follow up at the date 31/10/2017 is used. On this date, the project had a progress according Figure 8, where the red line represents the work progress planned in the master schedule, and the green bar represents the progress on the date used to elaborate this case study.

288 D. Chas Álvarez et al.
Due to the delay presented in previous figure, the simulation model is used to evaluate how the project will end, obtaining Table 9, in which the probability of delay for each customer milestone is presented. In order to develop the Table 9, a confidence interval of 95% has been considered.
According to Table 9 and the risk management methodology used the milestones four and five have a CI equal to twelve and the milestones six and seven have a CI equal to nine. Thus, both have medium-low risk level. But, applying the risk management methodology at the global project the CI is equal to twenty (medium-high risk level).
Figure 8 Real progress at day 31/10/2017 (see online version for colours)
31/10/2017 % Real
progress
% Theoritical
progress 0 0 0 0 0 0 0 0 0 0 1 1 1 1 1 1 1 1 1 1 1Construction 18 piles 99% 100% -- -- -- -- -- -- -- -- -- -- -- -- -- -- -- -- -- -- -- --
Construction 18 piles (nº 19 - nº 36) 71% 92% -- -- -- -- -- -- -- -- -- -- -- -- -- -- -- -- -- -- --Construction 18 piles (nº 37 - nº 54) 13% 41% -- -- -- -- -- -- -- -- --Construction 18 piles (nº 55 - nº 72) 0% 2% --Construction 18 piles (nº 73 - nº 90) 0% 0%
Construction 18 piles (nº 91 - nº 108) 0% 0%Construction 18 piles (nº 109 - nº 126) 0% 0%
Table 9 Simulation model results
Milestones of LoadOut
Probability of delay [days] < 5 < 15 < 30 < 50 ≥ 50
Milestone 1 0% 0% 0% 0% 0% Milestone 2 0% 0% 0% 0% 0% Milestone 3 0% 0% 0% 0% 0% Milestone 4 0% 23% 63% 14% 0% Milestone 5 1% 27% 68% 4% 0% Milestone 6 0% 15% 56% 29% 0% Milestone 7 0% 18% 57% 25% 0%
Figure 9 Manufacturing costs (see online version for colours)

Risk management and design of mitigation plans 289
Moreover, if this scenario is analysed for its impact on manufacturing costs, the simulation model obtains as a result the Figure 9. But, the results offered in terms of cost by the simulation model must be interpreted by the project team, because the simulation model represents the cost if the project team does carry out any action to mitigate the delay, and this assumption is not realistic. For this reason, with the tool designed it is more efficient to calculate the CI for its impact in the customer’s milestones, and then use the cost function to calculate the cost derived of the mitigation plan designed.
6.2 Design of mitigation plan
Second case study is the continuation of the first, but now the simulation model is used in combination with an optimiser based on GA. With the real progress presented in Figure 8, the simulation model obtained as a result the S curve of the Figure 10, in which blue line represented the progress according to the master schedule, and the orange line represents the progress calculated by the simulation model taking as input data the manufacturing situation at day 31/10/2017.
Figure 10 Theoretical S curve vs. real S curve (see online version for colours)
In order to obtain the mitigation plan based on minimum cost, the GA optimiser has been used to minimise the equation (5). The GA optimiser has as input parameters the possibility of increment the workstations, adding a third labour turn or include Saturday as a labour day and each change in this parameter with respect the master schedule represents a cost associated with the mitigation plan design.
Once the optimiser is executed, the results are presented in the Figure 11, in which five lines with different colour show the status of the project in the timeline:
• Blue line represents the use of third work shift.
• Orange line represents the use of Saturday as a labour day.
• Grey line shows the use of workstations according to the simulation model.
• Yellow line refers to the workstations in the master schedule.
• Green line represents the maximum number of workstations available.

290 D. Chas Álvarez et al.
According to Figure 11, the use of two months with three labour turns is enough to avoid the delays presented at day 31/10/2017. This solution represents a big change in the S curve, because, as can be seen in Figure 12, it means a total recovery of the delays.
Figure 11 Optimiser results (see online version for colours)
Figure 12 Theoretical S curve vs. real S curve (see online version for colours)
On the other hand, to understand the solution proposed by the optimiser and therefore, verify the results offered by it. Figure 13 presents the comparison between model results before and after applying the solution achieved by the optimiser. In this figure, the strategic point in the solution has been signalled, because the optimiser use a third labour turn before the workstations be reduced to four, allowing the manufacture of one piles batch before that reduction of workstations, decreasing the time without work in the two workstations before their occupation for other projects.
In addition, it is interesting stand out the use of the second third labour turn in the stage of the project with only four workstations, because at this stage the use of the third turn has a lower impact in the mitigation plan costs, and it is enough to avoid the assessed risk.

Risk management and design of mitigation plans 291
Figure 13 Comparison between model results (see online version for colours)
7 Conclusions
The authors studied the application of DES at the problem of risk assessment and the design of efficient mitigation plans that avoid the risks identified in offshore wind processes. To this end, a risk management tool based on DES and the GA optimisation has been designed. The tool designed allows the assessment of risk and the design of mitigation plans.
Overall, this work allowed analysing the risk management methodology of a real company and evaluating the influence of real risks in diverse stages of a real project and under different aspects into the project, justifying the use of this tool based on DES due to the statistical variability that affects the time tasks. At the same time, this work demonstrates the advantages of combining the risk management methodology with DES models, as well as the use of deterministic and random simulation models.
Moreover, DES allows the users a better interpretation of the result, either through the representation of the results in own tools of the simulation software, or through the exportation of data at another software, such as Excel spreadsheets or Project Gantt charts.
On the other hand, it is interesting to highlighting the possibility of combining the DES model with an optimisation process based on genetic algorithms, due to the capacity that this methodology provides to find optimal solutions. For this work, a genetic algorithm already implemented in the simulation software has been used, but it has some limitations in order to work with scenarios of many variables. For this reason, it is interesting to consider the integration of the risk management tool designed with an external optimiser as future work to this article.
References Cube, P., Von Härtel, L., Schmitt, R., Ponsard, C., Massonet, P., Landtsheer, R. De Ospina, G.,
Printz, S. and Jeschke, S. (2016) ‘Monetary quantification of supply risks of manufacturing enterprises – discrete event simulation based approach’, Procedia CIRP, Factories of the Future in the Digital Environment – Proceedings of the 49th CIRP Conference on Manufacturing Systems, Vol. 57, pp.164–170.

292 D. Chas Álvarez et al.
Ewea (2017a) Reviving Wind Markets and Delivering on Our 2030 Objectives, The European Wind Industry’s to the European Commision’s Proposals on a Governance Regulation and a Renewable Energy Directive.
Ewea (2017b) Key Trends and Statistics 2016, The European Offshore Wind Industry. Jeong, S.J., Lim, S.J. and Kim, K.S. (2006) ‘Hybrid approach to production scheduling using
genetic algorithm and simulation’, The International Journal of Advanced Manufacturing Technology, Vol. 28, Nos. 1–2, pp.129–136.
Kayis, B., Ahmed, A. and Amornsawadwatana, S. (2008) ‘A risk mitigation approach for concurrent engineering projects’, International Journal of Risk Assessment and Management, Vol. 9, Nos. 1/2, p.178.
Kim, B. and Kim, T.W. (2017) ‘Scheduling and cost estimation simulation for transport and installation of floating hybrid generator platform’, Renewable Energy, Elsevier Ltd., Vol. 111, pp.131–146.
Klimov, R. and Merkuryev, Y. (2008) ‘Simulation model for supply chain reliability evaluation’, Ukio Technologinis ir Ekonominis Vystymas, Vol. 14, No. 3, pp.300–311.
Kljajic, M., Bernik, I. and Breskvar, U. (2014) ‘Production planning using simulation and genetic algorithms in multi-criteria scheduling optimization’, in Florjančič, J. and Paape, B. (Eds.): Organisation and Management: Selected Topics, Frankfurt am Main P. Lang, pp.193–208.
Lasi, H., Fettke, P., Kemper, H.G., Feld, T. and Hoffmann, M. (2014) ‘Industry 4.0’, Business and Information Systems Engineering, Vol. 6, No. 4, pp.239–242.
Longo, F. (2013) ‘On the short period production planning in industrial plants: a real case study’, International Journal of Simulation and Process Modelling, Vol. 8, No. 1, p.17.
Longo, F., Nicoletti, L. and Solis, A.O. (2014) ‘Using simulation to investigate the performance of a batch order manufacturing system’, International Journal of Service and Computing Oriented Manufacturing, Vol. 1, No. 4, pp.344–367.
Miller, H.E. and Engemann, K.J. (2008) ‘A Monte Carlo simulation model of supply chain risk due to natural disasters’, International Journal of Technology Policy Management, Vol. 8, No. 4, pp.460–480.
Paul, R.J. and Chanev, T.S. (1997) ‘Optimising a complex discrete event simulation model using a genetic algorithm’, Neural Comput and Applic., Vol. 6, No. 4, pp.229–237.
Proskovics, R., Hutton, G., Torr, R. and Scheu, M.N. (2016) ‘Methodology for risk assessment of substructures for floating wind turbines’, Energy Procedia, 13th Deep Sea Offshore Wind R&D Conference, EERA DeepWind'2016, January, Vol. 94, pp.45–52.
Rezaie, K. (2007) ‘Using extended Monte Carlo simulation method for the improvement of risk management: consideration of relationships between uncertainties’, Applied Mathematics and Computation, Vol. 190, No. 2, pp.1492–1501.
Shah, L.A., Etienne, A., Siadat, A. and Vernadat, F. (2017) ‘Process-oriented risk assessment methodology for manufacturing process evaluation’, International Journal of Production Research, June, Vol. 55, No. 15, pp.4516–4529.
Singh, M. and Schmitt, A.J. (2009) ‘Quantifying supply chain disruption risk using Monte Carlo and discrete-event simulation’, in Proceedings of the 2009 Winter Simulation Conference, Hilton Austin Hotel Austin, TX, USA, pp.1237–1248.
Varela-Vázquez, P. and del Carmen Sánchez-Carreira, M. (2017) ‘Estimation of the potential effects of offshore wind on the Spanish economy’, Renewable Energy, Vol. 111, pp.815–824.


