Embed Size (px)
Citation preview
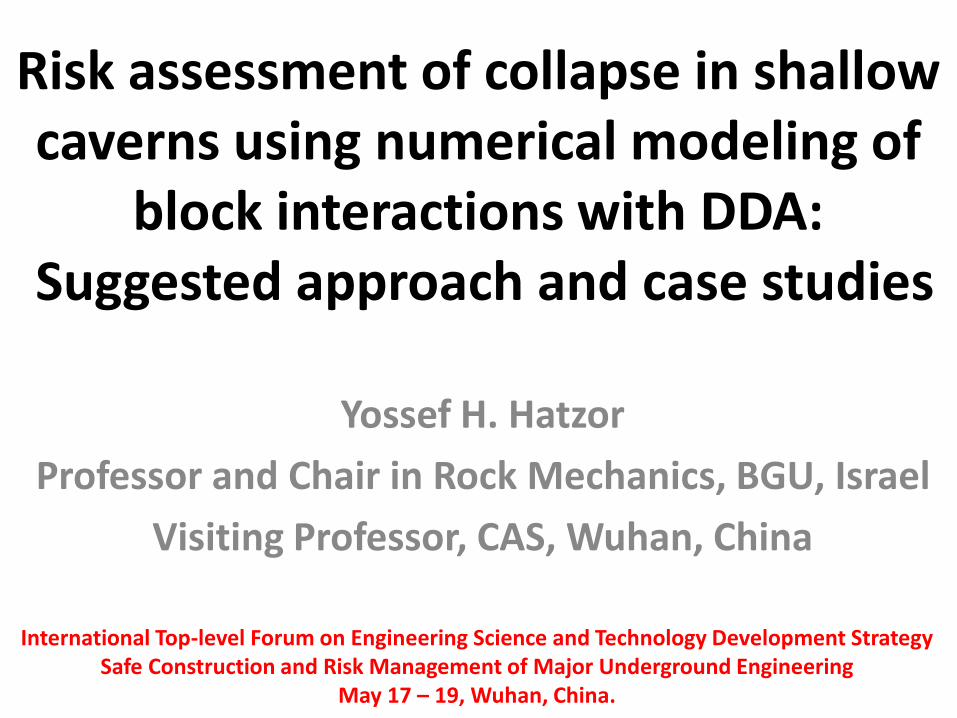
Risk assessment of collapse in shallow caverns using numerical modeling of
block interactions with DDA:Suggested approach and case studies
Yossef H. Hatzor
Professor and Chair in Rock Mechanics, BGU, Israel
Visiting Professor, CAS, Wuhan, China
International Top-level Forum on Engineering Science and Technology Development Strategy Safe Construction and Risk Management of Major Underground Engineering
May 17 – 19, Wuhan, China.
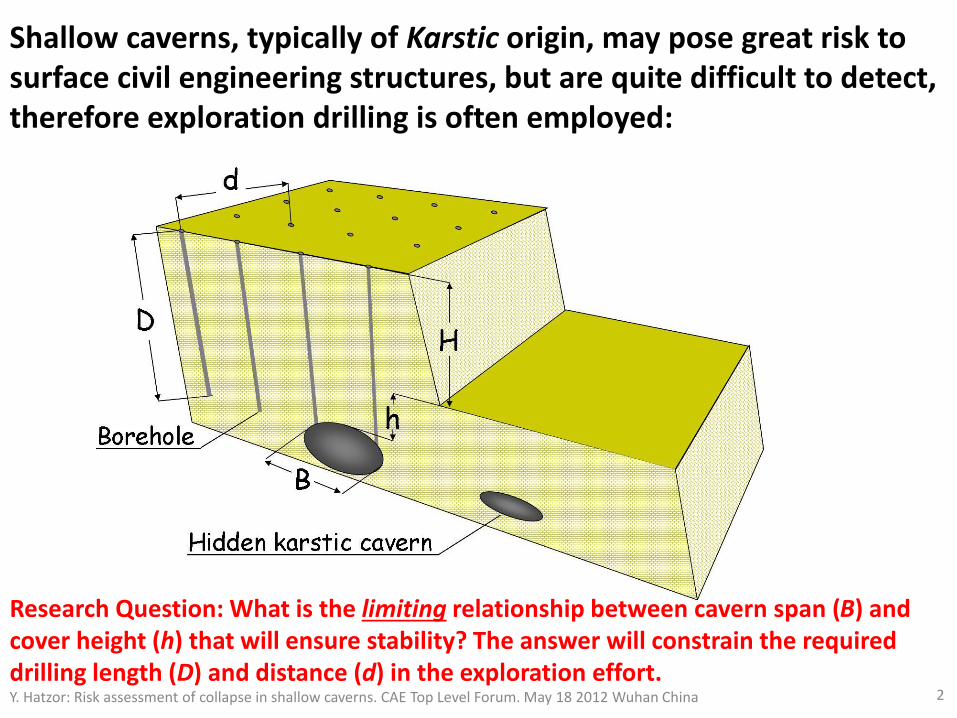
Shallow caverns, typically of Karstic origin, may pose great risk to surface civil engineering structures, but are quite difficult to detect, therefore exploration drilling is often employed:
Research Question: What is the limiting relationship between cavern span (B) and cover height (h) that will ensure stability? The answer will constrain the required drilling length (D) and distance (d) in the exploration effort.Y. Hatzor: Risk assessment of collapse in shallow caverns. CAE Top Level Forum. May 18 2012 Wuhan China 2

One way to answer this question is to study it numerically with discrete element methods, by generating, synthetically, Blocky rock masses and then running forward modeling. Here we keep the rock mass structure constant and change in each simulation the span width (B) and cover height (h) to obtain the structural response with DDA:
An example of a blocky rock mass structure with a synthetic jointing pattern as generated with DDA
Y. Hatzor: Risk assessment of collapse in shallow caverns. CAE Top Level Forum. May 18 2012 Wuhan China 3
h
B

The modeled rock mass in our simulations is a typicalblocky rock mass as found in central Israel, with a horizontal bedding planes set and two sub-vertical and sub-orthogonal joint sets:
Joint Set Dip/Direction Trace
Length
Mean
Spacing
Degree of
Randomness
Rock Bridge
Length
1 0/0 0.70 m 1.0 0 m
2 88/182 5 m 0.96 m 0.5 2.5 m
3 88/102 5 m 0.78 m 0.5 2.5 m
• These structural parameters represent mean values obtained from a number of joint surveys in central Israel where the problem of karstic cavern collapse exists
• The large value of assigned rock bridge length (2.5m) is used to simulate the phenomena of “mechanical layering”, where the extent of joint trace length is conditioned by bed thickness
• The same effect is obtained by using a relatively small value of trace length (5m) with respect to bed thickness (0.7m).
Y. Hatzor: Risk assessment of collapse in shallow caverns. CAE Top Level Forum. May 18 2012 Wuhan China 4

To estimate the mechanical stability of each structural configuration, we measure the vertical displacement (v) and the horizontal stress (sx) components as obtained with forward DDA at four measurement points evenly distributed at the roof of the modeled excavation:
The lateral boundaries are set at a distance of b = 3B to ensure the decay of stress concentrations near the boundaries of the modeled domain.
Y. Hatzor: Risk assessment of collapse in shallow caverns. CAE Top Level Forum. May 18 2012 Wuhan China 5
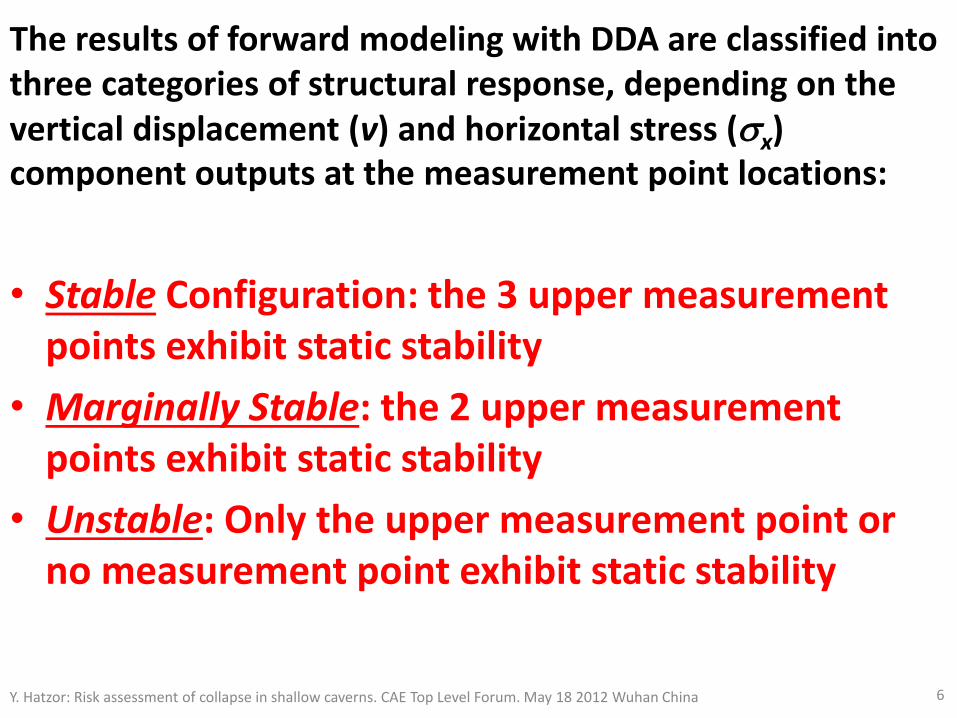
The results of forward modeling with DDA are classified into three categories of structural response, depending on the vertical displacement (v) and horizontal stress (sx) component outputs at the measurement point locations:
• Stable Configuration: the 3 upper measurement points exhibit static stability
• Marginally Stable: the 2 upper measurement points exhibit static stability
• Unstable: Only the upper measurement point or no measurement point exhibit static stability
Y. Hatzor: Risk assessment of collapse in shallow caverns. CAE Top Level Forum. May 18 2012 Wuhan China 6

-0.06
-0.05
-0.04
-0.03
-0.02
-0.01
0
0 2 4 6 8 10 12
Time, sec.
v,m
Measurement Point 1
Measurement Point 2
Measurement Point 3
Measurement Point 4
-450
-400
-350
-300
-250
-200
-150
-100
-50
0
0 2 4 6 8 10 12
Time, sec.
sx ,kN/m2
Measurement Point 1
Measurement Point 2
Measurement Point 3
Measurement Point 4
10 m.
h/B = 0.78
Y. Hatzor: Risk assessment of collapse in shallow caverns. CAE Top Level Forum. May 18 2012 Wuhan China 7
Example of Stable configuration

10 m.
h/B = 1.0
-6
-5
-4
-3
-2
-1
0
0 5 10 15 20
Time, sec.
v,mMeasurement Point 1 Measurement Point 2
Measurement Point 3 Measurement Point 4 -1400
-1200
-1000
-800
-600
-400
-200
0
0 5 10 15 20
Time, sec.
sx ,kN/m2
Measurement Point 1
Measurement Point 2
Measurement Point 3
Measurement Point 4
Y. Hatzor: Risk assessment of collapse in shallow caverns. CAE Top Level Forum. May 18 2012 Wuhan China 8
Extension of Stable definition

10 m
h/B = 0.76
-6
-5
-4
-3
-2
-1
0
0 5 10 15
Time, sec.
v,mMeasurement Point 1 Measurement Point 2
Measurement Point 3 Measurement Point 4
B
-1800
-1600
-1400
-1200
-1000
-800
-600
-400
-200
0
0 5 10 15
Time, sec.
sx ,kN/m2
Measurement Point 1
Measurement Point 2
Measurement Point 3
Measurement Point 4
Y. Hatzor: Risk assessment of collapse in shallow caverns. CAE Top Level Forum. May 18 2012 Wuhan China 9
Marginally stable configuration

-6
-5
-4
-3
-2
-1
0
0 5 10 15 20
Time, sec.
v,mMeasurement Point 1 Measurement Point 2
Measurement Point 3 Measurement Point 4-1400
-1200
-1000
-800
-600
-400
-200
0
0 5 10 15 20
Time, sec.
sx ,kN/m2
Measurement Point 1
Measurement Point 2
Measurement Point 3
Measurement Point 4
10 m.
h/B = 0.5
Y. Hatzor: Risk assessment of collapse in shallow caverns. CAE Top Level Forum. May 18 2012 Wuhan China 10
Unstable configuration

As we know, per a given cover height (here h ~ 20 m) the span width adversely affects stability:
h/B = 0.76
10 m. B = 25 m
10 m.
h/B = 0.73
B = 30 m
10 m.
h/B = 0.5
B = 40 m
Y. Hatzor: Risk assessment of collapse in shallow caverns. CAE Top Level Forum. May 18 2012 Wuhan China 11

Similarly, per given cavern span ( here B = 25 m) the cover height positively affects stability:
10 m.
h/B = 1.2 h = 30 m
10 m.
h/B = 1.0h = 25 m
10 m.
h/B = 0.5h = 12.5 m
Y. Hatzor: Risk assessment of collapse in shallow caverns. CAE Top Level Forum. May 18 2012 Wuhan China 12
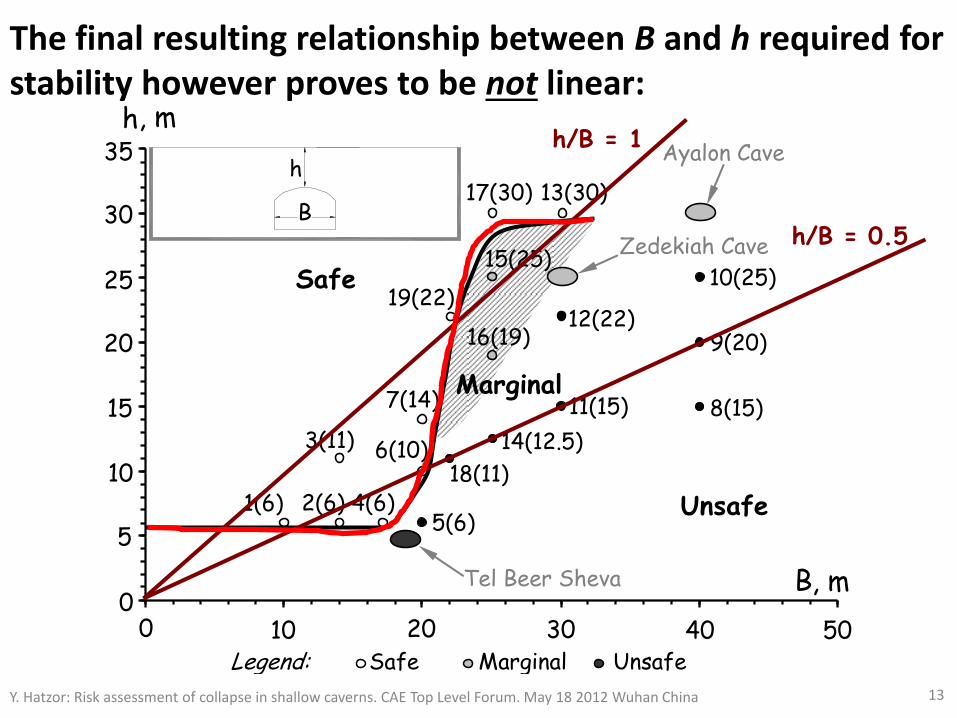
The final resulting relationship between B and h required for stability however proves to be not linear:
0
5
10
15
20
25
30
35
0 10 20 30 40 50
h , m
B , m
1(6) 2(6)
3(11)
4(6) 5(6)
6(10)
7(14) 8(15)
9(20)
10(25)
13(30) 17(30)
19(22)
18(11)
Legend: Safe Marginal Unsafe
Safe
Marginal
Unsafe
11(15)
12(22)
14(12.5)
16(19)
15(25)
h
B
Ayalon Cave
Zedekiah Cave
Tel Beer Sheva
h/B = 1
h/B = 0.5
Y. Hatzor: Risk assessment of collapse in shallow caverns. CAE Top Level Forum. May 18 2012 Wuhan China 13

The above was shown for the same, synthetically generated, rock mass structure. Results from three different case studies in different rock masses support our concluding chart:
1. The Ayalon cave underneath Ramle open pit mine – central Israel
2. The 2000 year old Zedekiah quarry -underneath the old city of Jerusalem
3. The Tel Beer Sheva 3000 year old underground water storage system –southern Israel.
Y. Hatzor: Risk assessment of collapse in shallow caverns. CAE Top Level Forum. May 18 2012 Wuhan China 14

Case 1: Ayalon Cave – a present day 40 meter span karstic cavern underneath an active open pit mine with 30 meters of rock cover:
Y. Hatzor: Risk assessment of collapse in shallow caverns. CAE Top Level Forum. May 18 2012 Wuhan China 15
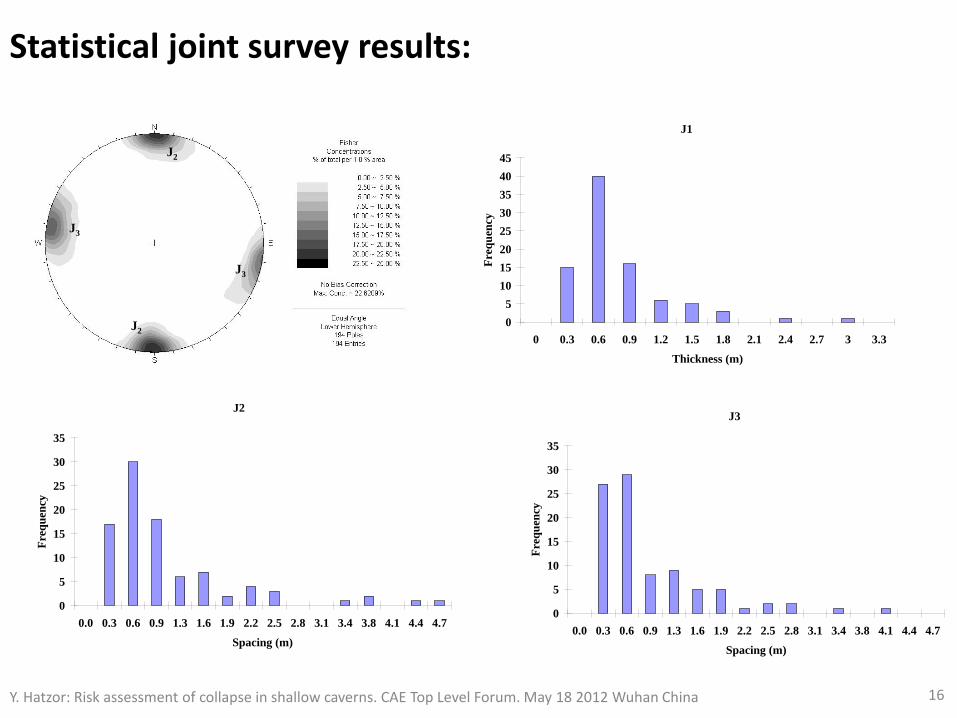
Statistical joint survey results:
J2
J2
J3
J3
J2
J2
J3
J3
J1
0
5
10
15
20
25
30
35
40
45
0 0.3 0.6 0.9 1.2 1.5 1.8 2.1 2.4 2.7 3 3.3
Thickness (m)
Fre
qu
ency
J2
0
5
10
15
20
25
30
35
0.0 0.3 0.6 0.9 1.3 1.6 1.9 2.2 2.5 2.8 3.1 3.4 3.8 4.1 4.4 4.7
Spacing (m)
Fre
qu
ency
J3
0
5
10
15
20
25
30
35
0.0 0.3 0.6 0.9 1.3 1.6 1.9 2.2 2.5 2.8 3.1 3.4 3.8 4.1 4.4 4.7
Spacing (m)
Fre
qu
ency
Y. Hatzor: Risk assessment of collapse in shallow caverns. CAE Top Level Forum. May 18 2012 Wuhan China 16

Current configuration of explored cavern underneath the mine:
No. of Blocks A mean
15,011 1.07 m2
Y. Hatzor: Risk assessment of collapse in shallow caverns. CAE Top Level Forum. May 18 2012 Wuhan China 17

Results of forward analysis with DDA:
-7
-6
-5
-4
-3
-2
-1
0
0 10 20 30 40
Point 1
Point 2
Point 3
Point 4
t, sec
v, m-600
-500
-400
-300
-200
-100
0
0 10 20 30 40
Point 1
Point 2
Point 3
Point 4
t, sec
s x , kPa
No. time
steps
90,000
Real Time 35.04 s
Mean no.
it. pts.
5.26
CPU time 361 hr.
Marginally stable configuration
Y. Hatzor: Risk assessment of collapse in shallow caverns. CAE Top Level Forum. May 18 2012 Wuhan China 18

Case 2: Zedekiah cave – a 2000 years old 30 meter span cavern with 25 meter cover under the old city of Jerusalem:
Maximum Length – 230 m
Maximum Width – 100 m
Average Height – 15m
Estimated Area - 9000 m2
Y. Hatzor: Risk assessment of collapse in shallow caverns. CAE Top Level Forum. May 18 2012 Wuhan China 19

Cross section through main chamber
0 5m 10m 15m
A’ A
Y. Hatzor: Risk assessment of collapse in shallow caverns. CAE Top Level Forum. May 18 2012 Wuhan China 20

Rock Mass Structures
Bedding planes Vertical Joints
Set Type Dip Spacing
1 Bedding 08/091 0.85
2 Shears 71/061 0.79
3 Shears 67/231 1.48
4 Joints 75/155 1.39
Y. Hatzor: Risk assessment of collapse in shallow caverns. CAE Top Level Forum. May 18 2012 Wuhan China 21

Roof stability assuming bedding planes only
Free span (L) 30 m
Beam thickness (t) 0.85 m
Unit weight (g ) 19.8 kN/m3
Elastic modulus (E') 8*103 MPa
Uniaxial compressive strength (sc) 16.4 MPa (bedding parallel)
Tensile strength (st) 2.8 MPa
Maximum deflection at
centerline (η)
8.67 cm
Maximum shear stress
at abutments (tmax)
0.445 MPa
Maximum axial stress
(s)
10.5 MPa
The roof should have failed in tension…
Y. Hatzor: Risk assessment of collapse in shallow caverns. CAE Top Level Forum. May 18 2012 Wuhan China 22

Roof stability assuming the Voussoir analogue
S
tT
T
Mid-Span Crackfc
n
fc
Z
S
tT
T
Mid-Span Crackfc
n
fc
Z
With the given dimensions the roof should undergo buckling
culminating in a “snap – through” mechanics (Z < 0).
Since the tensile strength of the material is exceeded in at the
lowermost layers of the roof a vertical crack may propagate and
decompose the continuous roof slab into two blocks, thus forming
the so called “Voussoir Bean” (See Ray Sterling PhD thesis and
Brady and Brown, 2004):
So, what is keeping the roof stable?...
Y. Hatzor: Risk assessment of collapse in shallow caverns. CAE Top Level Forum. May 18 2012 Wuhan China 23
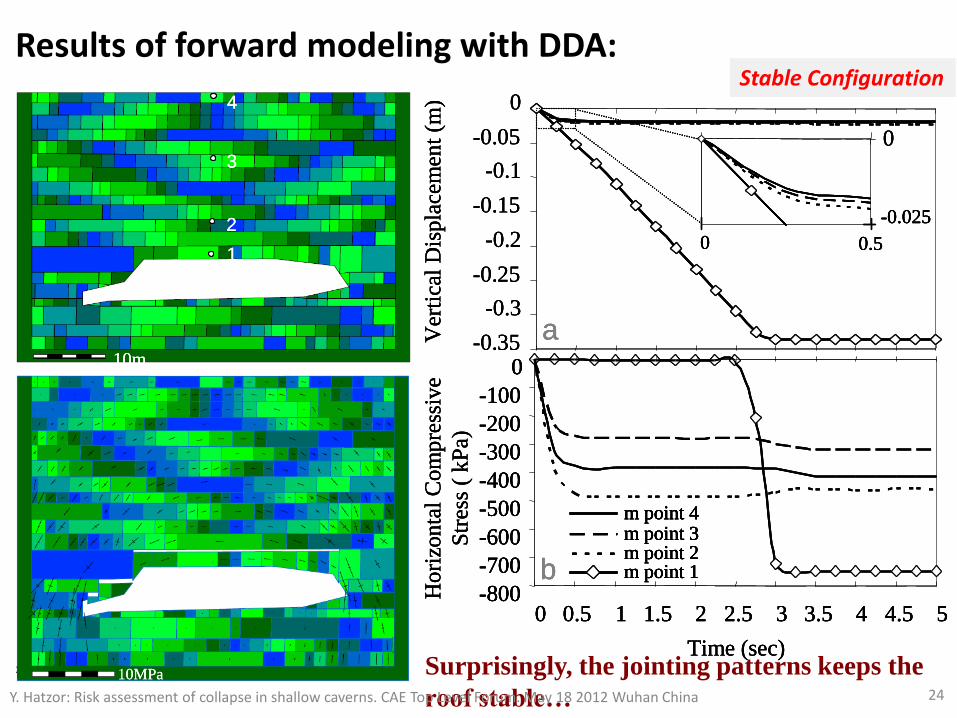
Results of forward modeling with DDA:
-0.35
-0.3
-0.25
-0.2
-0.15
-0.1
-0.05
0
Ver
tica
l D
ispla
cem
ent
(m)
0
0 0.5
-0.025
a
m point 1m point 2m point 3m point 4
Time (sec)
-800
-700
-600
-500
-400
-300
-200
-100
0
0 0.5 1 1.5 2 2.5 3 3.5 4 4.5 5
Ho
rizo
nta
l C
om
pre
ssiv
e
Str
ess
( k
Pa)
b
-0.35
-0.3
-0.25
-0.2
-0.15
-0.1
-0.05
0
-0.35
-0.3
-0.25
-0.2
-0.15
-0.1
-0.05
0
Ver
tica
l D
ispla
cem
ent
(m)
0
0 0.5
-0.025
aVer
tica
l D
ispla
cem
ent
(m)
0
0 0.5
-0.025
0 0.5
-0.025
a
m point 1m point 2m point 3m point 4
Time (sec)
-800
-700
-600
-500
-400
-300
-200
-100
0
0 0.5 1 1.5 2 2.5 3 3.5 4 4.5 5
Ho
rizo
nta
l C
om
pre
ssiv
e
Str
ess
( k
Pa)
b m point 1m point 2m point 3m point 4
m point 1m point 1m point 2m point 2m point 3m point 3m point 4m point 4
Time (sec)
-800
-700
-600
-500
-400
-300
-200
-100
0
-800
-700
-600
-500
-400
-300
-200
-100
0
0 0.5 1 1.5 2 2.5 3 3.5 4 4.5 50 0.5 1 1.5 2 2.5 3 3.5 4 4.5 5
Ho
rizo
nta
l C
om
pre
ssiv
e
Str
ess
( k
Pa)
b
10MPa10MPa10MPa
1
2
3
4
10m
1
2
3
4
1
2
3
4
10m10m
Stable Configuration
24
Surprisingly, the jointing patterns keeps the
roof stable…Y. Hatzor: Risk assessment of collapse in shallow caverns. CAE Top Level Forum. May 18 2012 Wuhan China

Case 3: Tel Beer-Sheva – a 3000 years old underground water storage system
Y. Hatzor: Risk assessment of collapse in shallow caverns. CAE Top Level Forum. May 18 2012 Wuhan China 25

Underground System Layout: a a
b b
Y. Hatzor: Risk assessment of collapse in shallow caverns. CAE Top Level Forum. May 18 2012 Wuhan China26
The collapse which occurred during time of construction was supported by the
ancient engineers with a massive stone pillar.

Joint spacing, orientation, and friction angle:
0 2000 4000 6000 8000
Normal Stress (kPa)
0
10
20
30
40
50
(
de
g.)
27For the estimated level of normal stress the friction angle is assumed to be 35o
Y. Hatzor: Risk assessment of collapse in shallow caverns. CAE Top Level Forum. May 18 2012 Wuhan China

Kinematics of a Jointed Beam (Voussoir)
=30o=45o=75o=80o
Initial Geometry
Deformed state
S = 8m, t = 0.5m, Sj = 0.25m
Y. Hatzor: Risk assessment of collapse in shallow caverns. CAE Top Level Forum. May 18 2012 Wuhan China 28

Forward DDA modeling results proves to be a function of vertical joint spacing and friction angle:
0
10
20
30
40
50
60
70
80
90
100
0 100 200 300 400 500 600 700 800
Vertical joint spacing (cm)
Fri
ctio
n a
ngle
req
uir
ed f
or
stab
ilit
y
For the attempted opening span the existing spacing between vertical joints dictates an Unstable configuration
Y. Hatzor: Risk assessment of collapse in shallow caverns. CAE Top Level Forum. May 18 2012 Wuhan China 29

DDA vs. UDEC
0
10
20
30
40
50
60
70
80
90
0 100 200 300 400 500 600 700
Mean joint spacing [cm]
Req
uir
ed
fri
cti
on
an
gle
fo
r sta
bil
ity
[Deg
ree]
DDA Element size 0.1 m Element size 10 m
Beam span = 7m Beam thickness = 2.5m Layer thickness = 0.5m
Barla, Monacis, Perino, and Hatzor (2010), Rock Mechanics & Rock Engineering.
Y. Hatzor: Risk assessment of collapse in shallow caverns. CAE Top Level Forum. May 18 2012 Wuhan China 30

The numerically obtained relationship between B and h with the case studies shown:
0
5
10
15
20
25
30
35
0 10 20 30 40 50
h , m
B , m
1(6) 2(6)
3(11)
4(6) 5(6)
6(10)
7(14) 8(15)
9(20)
10(25)
13(30) 17(30)
19(22)
18(11)
Legend: Safe Marginal Unsafe
Safe
Marginal
Unsafe
11(15)
12(22)
14(12.5)
16(19)
15(25)
h
B
Ayalon Cave
Zedekiah Cave
Tel Beer Sheva
Bakun-Mazor, Hatzor and Dershowitz (2009), IJRMMS.
Hatzor and Benari (1998), IJRMMS.
Hatzor, Wainshtein, and Bakun-Mazor (2010), IJRMMS.
Y. Hatzor: Risk assessment of collapse in shallow caverns. CAE Top Level Forum. May 18 2012 Wuhan China 31

Summary
• Sinkhole collapse can pose a significant risk for people and surface civil engineering operations.
• We develop here, using the numerical DDA method, a function that marks the boundary between Stableand Unstable shallow cavern geometries, for blocky rock masses consisting of horizontal bedding planes and vertical joints.
• Our results are confirmed by three independent stability analyses of underground openings in blocky rock masses possessing different mechanical properties for intact rock elements as well as different joint friction and spacing.
Y. Hatzor: Risk assessment of collapse in shallow caverns. CAE Top Level Forum. May 18 2012 Wuhan China 32


![Alabaster Caverns[1]](https://img.dokumen.tips/doc/110x75/577cc1eb1a28aba7119403cd/alabaster-caverns1.jpg)