Embed Size (px)
Citation preview

Risk Arbitrage in Emerging Markets
by
Mengkiat Goh
B.S., Electrical Engineering and Computer Science
Massachusetts Institute of Technology, 2000
Submitted to the Department of Electrical Engineering and Computer Science
in Partial Fulfillment of the Requirements for the Degree of
Master of Engineering in Electrical Engineering and Computer Science
at the Massachusetts Institute of Technology
June, 2008
©2008 Massachusetts Institute of Technology
All rights reserved.
MASSACHUSETTS INSTITUTEOF TECHNOLOGY
NOV 13 2008
A I..Author
Department of Electrical Engineerin
Certified by
Accepted by
and Computer ScienceMay 12, 2008
Roy E. WelschProfessor of Statistidsand Man geme ice and Engineering Systems
./// esis Supervisor
Arthur C. SmithProfessor of Electrical Engineering
Chairman, Department Committee on Graduate Theses
ARCHIVES
I


Risk Arbitrage in Emerging Markets
by
Mengkiat Goh
Submitted to theDepartment of Electrical Engineering and Computer Science
May 12, 2008
In Partial Fulfillment of the Requirements for the Degree of Master of Engineering inElectrical Engineering and Computer Science
Abstract
Risk arbitrage is one of the investment strategies commonly employed by hedge fundsand financial investment firms. In essence, it constitutes a bet on whether a merger deal isconsummated. Several academic studies have found that risk arbitrage trading strategiesare able to generate sustainable positive returns. However, these studies have been largelyconfined to risk arbitrage investments in developed markets. In this thesis, we quantifythe risk arbitrage investment process and create trading strategies that generate positiverisk-adjusted returns in emerging markets. We use a sample of 810 stock and cashmergers and acquisitions in emerging markets from 2001 to 2007. We find that returns inexcess of 7.9% can be obtained using the prediction model formulated in this thesis. Ouranalysis suggests that the probability of success of a merger depends on a deal'scharacteristics. Further, it implies that one can improve on the market-implied estimatesthereby creating trading opportunities. The analytical results achieved in this thesis can beused as the foundation for building an effective risk arbitrage trading platform inemerging markets.
Thesis Supervisor: Roy E. WelschTitle: Professor of Statistics and Management Science and Engineering Systems


Acknowledgments
I would like to thank my advisor Roy Welsch for his guidance. Without his time,
supervision and insights, this thesis would not have been possible. In addition, I would
like to thank Arthur Smith and Anne Hunter from the Course VI Undergraduate Office
for their assistance. Finally, I thank my spouse Sharon for her unwavering love and
support.


Table of Contents
Chapter 1: Introduction ................................................................ ........................... 13
1.1 Background and Previous Work ..................................... ... ............. 14
1.2 Risk Arbitrage in general ..................................... ...... ................. 16
1.3 Characteristics of Emerging Markets................................. ............ 19
1.4 Thesis Contributions ...................................... 23
Chapter 2: Company Share Price Reaction ........................................ ......... 27
2.1 Overall Price Reaction ...................................... 28
2.2 Reaction by Consideration Type................................ .... .............. 31
2.3 Reaction by Premium Range ................................................... 33
2.4 Reaction by Deal Consummation Time ............................................................ 35
2.5 Reaction by Relative Size ..................................... ..... ................. 36
2.6 Reaction by Stake Held by Acquirer ...................................... .......... 38
2.7 Analysis Sum m ary ......................................................................................... 39
Chapter 3: Risk Arbitrage Investment Process ..................................... ....... 43
3.1 Typical Risk Arbitrage Investments ....................................... .......... 43
3.2 R isk s.................................................................................................................. 45
3.3 Equally Weighted Portfolio ..................................... ..... ............... 46
3.4 Prediction M odel......................................... ................................................ 51
3.5 Prediction M odel Portfolio ..................................... ...... ............... 53
3.6 Cross-Validation Analysis ..................................... ..... ................ 55
3.7 Possible Explanations for Risk Arbitrage Returns................................. 57
Chapter 4: Summary and Future Work .................................. ............................... 59

4.1 Sum m ary ........................................................................................................... 59
4.2 Future W ork ...................................................................................................... 59
Appendix A : List of countries ........................................................................................ 61
Bibliography .................................................................................................................... 63

List of Figures
Figure 1: Equally Weighted Portfolio Returns .................................... ......... 51


List of Tables
Table 1: Risk Arbitrage Risk and Return Characteristics ....................................... 15
Table 2: Classification of countries by Gross National Income per capita................... 19
Table 3: Data set used for analysis. .......................................................... ................. 24
Table 4: Share Price Reaction for Acquirer and Target after deal announcement. .......... 28
Table 5: Acquirer Share Price Reaction by Consideration Type .................................. 31
Table 6: Target Share Price Reaction by Consideration Type....................................... 33
Table 7: Share Price Reaction by Premium Offered ....................................... ..... 33
Table 8: Share Price Reaction by Deal Consummation Time. .................................... 35
Table 9: Share Price Reaction by Acquirer Relative Size. .................................... . 37
Table 10: Share Price Reaction by Target Relative Size ....................................... 38
Table 11: Share Price Reaction by Stake Held by Acquirer .................................... . 39
Table 12: Yearly breakdown between cash and stock deals ..................................... 48
Table 13: Equally Weighted Portfolio returns by year ...................................... 48
Table 14: Intercept and coefficient of merger variables ................................................ 53
Table 15: Comparison between EWP and PMP returns. ...................................... 54
Table 16: Comparison between PMP and Cross-Validation Portfolio returns ...... . 56
Table 17: T-statistics for PMP versus Cross-Validation Portfolio returns. ................... 57


Chapter 1: Introduction
"Arbitrageurs keep the markets honest. Theybring perfection to imperfect markets as theirhunger for free lunches prompts them to bid awaythe discrepancies that attract them to the lunchcounter. In the process, they make certain thatprices for the same assets in different markets willbe identical."
- Peter L. Bernstein [1]
In realm of finance, arbitrage is the practice of taking advantage of a price
differential between two or more markets: a combination of matching deals is struck that
capitalizes upon the imbalance, the profit being the difference between the market prices.
When used by academics, an arbitrage is a transaction that involves no negative cash flow
at any probabilistic or temporal state and a positive cash flow in at least one state; in
simple terms, a risk-free profit. A person who engages in arbitrage is called an
arbitrageur. The term is mainly applied to trading in financial instruments, such as bonds,
stocks, derivatives, commodities and currencies.
If the market prices do not allow for profitable arbitrage, the prices are said to
constitute an arbitrage equilibrium or arbitrage-free market. Arbitrage equilibrium is a
precondition for a general economic equilibrium. The assumption that there is no
arbitrage is used in quantitative finance to calculate a unique risk neutral price for
derivatives. Arbitrage is possible when one of three conditions is met. First, the same
asset does not trade at the same price on all markets. Second, two assets with identical

cash flows do not trade at the same price. Third, an asset with a known price in the future
does not today trade at its future price discounted at the theoretical' risk-free interest rate.
1.1 Background and Previous Work
The rise in the number of hedge funds seeking excess market returns in recent
years has led to the prominence of risk arbitrage trading techniques, amongst a host of
other hedge fund trading strategies such as investing in distressed securities and short-
selling. Based on estimates from Hedge Fund Research, the risk arbitrage allocations at
the end of 2007 were 4.0%, compared to 0.6% in 1990 [2]. Substantive studies have been
performed to examine the amount of return generated by risk arbitrage. Among the
studies were two conducted by Dukes, Frohlich, and Ma [3] in 1992 and Jindra and
Walkling [4] in 2002. Dukes, Frohlich, and Ma examined arbitrage activity around 761
cash tender offers filed between 1971 and 1985 and reported returns of approximately
25% for a 50-day period. Jindra and Walkling found that arbitrage strategies involving
362 cash tender offers over the same period would generate annualized returns exceeding
100%. A more comprehensive study of risk arbitrage was done by Mitchell and Pulvino
[5] in 2001. Based on a sample of 4,750 mergers from 1963 to 1998, they found risk
arbitrage to generate annual returns of 4% per year after taking into account transaction
costs. On a risk-adjusted basis, risk arbitrage has been shown to perform far better than
the established equity indexes. From 2002 to 2006, hedge funds employing risk arbitrage
have outperformed the S&P 500, achieving absolute returns of close to 7.5%. More
1 In practice, however, the risk-free rate does not exist because even the safest investments carry a verysmall amount of risk. Thus, the interest rate on a three-month U.S. Treasury bill is often used as the risk-free rate.

importantly, these returns have been achieved with a low volatility of 4%, resulting in a
relatively high Sharpe ratio of around 1.21, see Table 1.
Table 1: Risk Arbitrage Risk and Return Characteristics.
S&P 500 6.2% 12.4% 0.28HFRI Merger Arbitrage Index 7.5% 4.0% 1.21
Source: Hedge Fund Research, Bloomberg.
While these prior studies have demonstrated that risk arbitrage to be a sustainable
profit generating strategy, much of the research is centered on US and developed market
and little research has been done on risk arbitrage in emerging markets. The biggest,
fastest-growing economies today belong to Brazil, Russia, India, and China. While the
Big Four, also known as BRICs, has attracted the most investor attention in recent years,
there are also opportunities in less prominent but more promising emerging markets such
as Egypt, Mexico, Poland, South Africa, South Korea, and Turkey. Accompanying the
growth of the emerging market economies is the dramatic rise in mergers and acquisitions
activities in those markets. Mergers and acquisitions in emerging markets reached a
record value of $635.4 billion in 2006 over 10,995 deals, an increase of 53 percent from
on the previous high in 2005. China was the busiest emerging market for deals,
accounting for 2,289 deals worth $104.3 billion, an increase of 69 percent on 2005.
Russia and South Korea followed with $98.5 billion and $42.3 billion worth of deals
respectively. This dramatic increase in the volume of merger and acquisitions, the
primary source of risk arbitrage profits, leads to the question of whether strategies used

for risk arbitrage in developed markets can be similarly profitably applied in emerging
markets.
1.2 Risk Arbitrage in general
There are many different examples of finance arbitrage [6]. Tax arbitrage involves
shifting income from one investment tax category to another to take advantage of
different tax rates across income categories. Convertible arbitrage involves the purchase
of convertible bonds while shorting the underlying equity as a hedge. Index arbitrage
establishes offsetting long and short positions in a stock index futures contract and a
replicating cash market portfolio when the futures prices differs significantly from its
theoretical value.
The focus of this thesis is on risk arbitrage, which is an event driven process,
centered on actual events that take place. It involves betting on the outcome of corporate
events, the majority of which are mergers and acquisitions. A corporate merger is defined
as a combination of the assets and liabilities of two firms to form a single business entity.
The main difference between a merger and an acquisition is that "acquisition" is defined
as when a larger firm absorbs a smaller firm while "merger" refers to a combination
between firms of relatively equal size. There is also the issue of which firm is the
acquiring firm and which firm is the target firm. In a hostile takeover or acquisition these
are easy to identify, as it is usually the larger firm or the one taking the initiative that is
deemed the acquirer. However, in a merger of firms that are approximate equal in market
value, the acquiring company is usually defined as the one whose shares continue to exist
while the target firm is the one whose shares are being replaced by the acquiring firm.

Two principal types of merger are possible. In a cash merger, an acquirer
proposes to purchase the shares of the target for a certain price in cash. Until the
acquisition is completed, the stock of the target typically trades below the purchase price.
An arbitrageur buys the stock of the target and makes a gain if the acquirer ultimately
buys the stock. In a stock for stock merger, the acquirer proposes to buy the target by
exchanging its own stock for the stock of the target. An arbitrageur may then short sell
the acquirer and buy the stock of the target. This process is called "setting a spread".
After the merger is completed, the target's stock will be converted into stock of the
acquirer based on the exchange ratio determined by the merger agreement. The
arbitrageur delivers the converted stock into his short position to complete the arbitrage.
Theoretically, the post-merger value of the two firms should be equal to the pre-
merger value. However, the post-merger value of each individual firm will likely be
different. Usually the target firm's value will increase because of the premium that the
acquiring company usually pays. The reason why companies merge in the first place is to
take advantage of synergies, which take the form of revenue enhancement and cost
savings. However, empirical evidence suggests that when two companies in the same
industry merge, combined revenue tends to decline initially due to the integration
challenges, alienation of customers and decline in employee morale. However, in some
cases, the amount of cost savings that occurs is able to offset the decline in revenue. In
risk arbitrage, there is always a risk that the deal will not go through or the closing will be
delayed. Obstacles may include either party's inability to satisfy conditions of the merger,
a failure to obtain the requisite shareholder approval, failure to receive antitrust and other
regulatory clearances, or some other event which may change the target's or the acquirer's

willingness to consummate the transaction. The spread between these two prices depends
mainly on the probability and the timing of the takeover being completed as well as the
prevailing level of interest rates. The bet in a risk arbitrage is that such a spread will
eventually be zero, if and when the takeover is completed. The risk is that the deal
"breaks" and the spread massively widens.
Risk arbitrage used to be a very inconspicuous activity but in the mid-70s, with
the emergence of Ivan Boesky and the increasing volume of corporate takeover deals, it
became more visible. Attracted by the high rewards, many investment banks started new
arbitrage departments and more people became involved in this activity. In more recent
years, as the volume of new arbitrage capital increased, spreads have narrowed and after
a takeover announcement the share price of the target now rises much more rapidly.
Given the recent bull market from 2003-2008, and the accompanying frenzy in mergers
and acquisitions activity, risk arbitrage has regained its prominence in the financial
landscape.
There are many advantages to investing in risk arbitrage [7]. Risk arbitrage
returns are not closely correlated with those of the stock market; they are less volatile
than returns on the S&P 500; and longer term they are higher than those returns offered
by traditional investing. The process of risk arbitrage and the related short-selling in the
shares of the acquiring company has also been shown in a study by Moore, Lai and Song
[8] to improve the efficiency of the market in the bidder's share.

1.3 Characteristics of Emerging Markets
In general, countries are classified as 'emerging' when they profit from a
substantial economic growth based on significant productivity gains, technological
change and a change in their economic philosophy. Frequently these economies are
characterized by political instability, strong currency turbulence and a high foreign debt.
This includes countries in the regions of Southeast Asia, Latin America, Africa, Middle
East and the former socialist countries in Central and East Europe. The World Bank
classifies economies in developing countries and industrial nations by its Gross National
Income (GNI) per capita. The World Bank further defines countries with 'low' or 'middle
income' as developing countries, as shown in Table 2. By the end of 2006, all economies
with an annual income per capita of less than US$11,115 were classified as developing
countries. At this point, from all countries worldwide with a population of more than
30,000 people, 149 nations belonged to less developed countries and 60 to industrial
nations.
Table 2: Classification of countries by Gross National Income per capita.
Ion goyGsNtolIonP
Low Income Countries (LIC)Middle Income Countries (MIC)- Low Middle Income- High Middle Income
High Income Countries (HIC)
905 or less
906 - 3,5953,596 - 11,11511,116 or more
Source: World Bank (2006).

The term 'emerging markets' describes capital markets in general, and
specifically equity markets, which are in relation to their market size, activity and
development in process. According to the International Finance Corporation (IFC), a
subsidiary of the World Bank, an equity market is characterized as 'emerging' if the
equity market is located in a country which is classified as a 'low' or 'middle income'
economy by the World Bank. Since 1995, the IFC has expanded its definition due to the
fact that the dollar-based definition of GNI per capita is extremely influenced by
exchange rate fluctuations and time-lag of GNI figures. A country is only upgraded to a
'developed' country when the 'high income' has been attained over three consecutive
years. Further classification criteria for emerging markets are investment restrictions such
as capital control, restrictions on foreign acquisition capital, extensive government
acquisitions of listed companies, and other regulatory trade restrictions, especially those
that are not present in developed markets. Beside these criteria a number of qualitative
factors are important for investment decisions. In general the latter are the quality of the
market regulation, settlement and supervision as well as market transparency, company
leadership abilities, application of international accounting standards, and stock holder
protection. The problem of the GNI criterion becomes clear when it is applied to
petroleum exporting countries [9]. The income per capita in these countries is
significantly higher in comparison to less developed countries with low and middle high
income, but nevertheless the living standard is lower than that of industrial nations due to
the income distribution. These countries are also often not fully developed in respect that
their economy lacks a great degree of industrialization, infrastructure or capital market
system.

Emerging markets distinguish themselves from developed markets in the areas of
degree of information efficiency and institutional infrastructure [10]. A stock market's
institutional infrastructure is generally characterized by the taxation of dividends and
capital gains, the restriction of capital flow and the quality of market information
provided. The taxation of capital gains may lead to a misallocation of resources, because
investors will try to avoid realizing profits in order to reduce the effective tax burden. A
discriminatory taxation deters foreign investors and thus affects the capital allocation in a
negative way. Consequently, necessary capital inflows for real growth are missing and
portfolio selection may be inefficient. The impact of the withholding tax on market
liquidity and the traded volume of individual markets depend on the tax treatment of such
capital incomes. Local investors are typically only charged temporarily with the
withholding tax, whereas foreign investors have to pay the tax, if the tax credit is not
accepted by the state of residence. According to IFC, the withholding tax in emerging
markets for dividends vary between 0% (e.g. in Argentina, Brazil, Columbia, Egypt,
Malaysia, and Venezuela) and 35% (in Chile and Greece), and for long-term capital gains
between 0% and 30% (e.g. in India 10%, Zimbabwe 10%, Chile 15%, Korea 27,5% and
Slovakia 29%).
Regulatory issues that prohibit the free market entry and exit restrict capital
mobility because foreign investors are only allowed to transact investments in a certain
kind or extent in the domestic market. Vice versa, the amount of foreign securities in the
portfolio of domestic investors can be limited through regulatory actions. Furthermore, in
many less developed countries, acquisitions of domestic companies are limited to a
maximum percentage of the shareholder's equity. In Brazil, 100% of stockholder's equity
can be bought as preferred and common stock. The acquisition though is restricted in
various sectors to 0% for banks, 20% for air transportation companies, 49% for cable
television companies and 20% for shipping companies. Similar restrictions for sectors
and companies can be found in South Korea.
In addition, differences in economic culture and language barriers generate
asymmetric information between domestic and foreign investors. The resulting
information disadvantages for foreign investors make international investments seem
more risky and can only be overcome with additional information costs. A major
contribution to overcome asymmetric information is the public dissemination of stock
exchange and company information, especially for foreign investors. The free access of
all market participants to information is a necessary condition for market efficiency. A
stock market is inefficient, if all the available information is directly reflected in current
stock prices. An unlimited availability of market information and distribution as well as
the immediate stock price reactions related with a change in these two are typical for
efficient markets. Market transparency, which means the possibility of market
participants to monitor relevant information for trading, is an essential criterion for the
market microstructure of emerging markets. Order information of other market
participants like order volume, kind of order, price and time limits belong to this kind of
information. Changes in trading strategies of the market participants affect the market
equilibrium and the corresponding stock prices. If the amount of market information
which investors possess increases, market transparency also increases. The valuation of
the market organization is dependent not only on information efficiency, but also on the
market liquidity and market risk. In some emerging markets the trading volume is so

small that institutional investors are neither willing to invest in these relatively less liquid,
respectively low capitalized markets, nor willing to keep their portfolio shares of these
companies on a low basis. If buy or sell orders are not immediately executed due to a lack
of share liquidity, disadvantageous stock price effects and holding costs are created. The
latter effect exists when investors cannot identify when or under what circumstances their
order has been executed. The problem of market liquidity is especially present when an
investor tries to make a profit by selling portfolio shares in a thin market and when by the
time the order has been executed the stock price has decreased. Due to the increasing
market capitalization in the last years, the liquidity of emerging markets has increased
significantly. In 1999, the worldwide trading volume reached up to US$31,000 billion of
which the emerging markets universe made up US$2,867 billion, an increase of 1,590%
in comparison to 1987.
1.4 Thesis Contributions
In this thesis, we quantify the risk arbitrage investment process and develop risk
arbitrage models for emerging equity markets. We use a sample of 810 merger
transactions in emerging markets from January 1, 2001 through December 31, 2007.
Cross-border mergers between companies in emerging and developed markets are
excluded in order to restrict the study findings to only emerging markets. Table 3 below
provides a summary of the data set used for our analysis. Of the 810 deals analyzed, 751
or 92.7% of them were completed and 59 or 7.3% of them were uncompleted. The
aggregate value of the deals was US$224.18 billion with completed deals constituting

US$194.96 billion or 87% of the total deal value and uncompleted deals constituting
$29.21 billion or 13% of the total deal value.
Table 3: Data set used for analysis.
CormpletedUncompleted
Total
75159810
92.7%7.3%100%
US$ 194.96 billionUS$ 29.21 billion
US$ 224.18 billionSource: Thomson Financial.
Initial shareholder reaction is critical to any successful merger deal, as a declining
acquirer share price may spark opposition to the transaction and attract hostile bidders
towards the target company. The stock market is a natural place to investigate this
reaction. Prior to a merger announcement, acquirer and target firm stock prices contain
information about the stand-alone values of the two firms. When a merger or acquisition
is announced, changes in acquirer and target firm stock prices reveal information about
the potential wealth creation from the transaction and the distribution of the gains and
losses from the transaction to the acquirer and target firms. In other words, the stock
market's reaction to the information contained in the acquisition announcement reveals
the market's view of the transaction. To analyze this reaction, we conducted an event
study to determine which merger-related attributes lead to an adverse initial reaction in
the acquirer share prices in the event of the announcement of a merger or acquisition. The
attributes that we looked at were the type of transaction (all-cash, all-stock or cash-stock
combination), the premium paid by the acquirer for the target, the relative acquirer and
a-

target sizes to the deal value, the deal consummation time, and the stake of the acquirer in
the target prior to deal announcement.
Using the insights obtained from the analysis of the shareholder reaction on the
acquirer and target companies, we proceed to develop risk arbitrage trading strategies for
emerging markets. At the initial stage, we create an equally weighted portfolio by
investing equally across all announced deals and found annual returns in excess of 7.1%.
This is better than the 4% annual returns obtained by Mitchell and Pulvino using US
mergers and acquisitions. However, the returns obtained with the equally weighted
portfolio do not take into account transaction costs. Using the equally weighted portfolio
as a benchmark, we proceed to develop a more realistic trading strategy by performing a
multivariate regression to obtain a prediction model. Using the coefficients from this
model, we then construct a portfolio whereby we only invest in deals that have predicted
returns exceeding a pre-determined hurdle rate (pegged to twice the 3-month US
Treasury Bill rates). We found that such a trading strategy generate annual returns in
excess of 8.2%. This strategy was also found to be robust using cross-validation
techniques. Our analysis shows that the expected return of a deal depends highly on the
deal's characteristics. This implies that one can utilize publicly available information at
the time of deal announcement in formulating a decision of whether or not to invest in the
deal. The profitable strategies developed in this study also show that risk arbitrage can be
employed in emerging markets.


Chapter 2: Company Share Price Reaction
We conducted an analysis of acquirer and target share price reactions to
announced transactions to develop insights into the merger and acquisition process in
emerging markets. We used data from the Securities Data Corporation (SDC) Thomson
Financial's International Mergers and Acquisitions Database. The data sample included
all mergers and acquisitions involving public targets and public acquirers in emerging
markets from January 1, 2001 through December 31, 2007. In order to best interpret the
share price reaction of acquirers, we first provide a brief statistical review of 810
announced mergers and acquisitions during the past seven years. We then use these
results to build applicable models in the risk arbitrage investment process.
One of the main challenges encountered in this thesis was in obtaining mergers
and acquisitions data for emerging markets. Although there are over 10,000 mergers and
acquisitions transactions in emerging markets from the Thomson Financial database from
the last seven years, a large proportion of the transactions had to be omitted due to the
incompleteness of the data. In particular, many of the transactions lacked share price
information of the target and acquirer before and after the deal announcement. Cross-
border deals involving companies in developed and emerging markets, which are outside
the scope of this thesis, were also omitted. The countries to which the companies
included in the data sample belonged are listed in Appendix A. In total, only 810
transactions met the stringent data requirements of this thesis. The aggregate value of
these announced transactions is $224.16 billion with completed deals constituting
$194.96 billion or 87% of the total deal value and uncompleted deals constituting $29.21
billion or 13% of the total deal value.

2.1 Overall Price Reaction
An acquirer's share price moves up 1.1%, on average, on the day of an announced
merger or acquisition. Correspondingly, the target's share price moves up 3.5%. The
share price movements are more pronounced one full day after an announced merger or
acquisition; an acquirer's and target's share price, on average, trade up 1.4% and 5.6%
respectively. On average, we determined that acquirer's share prices move up 1.6% and
1.8% in the subsequent one week and four weeks after announcement while target's share
prices move up 6.3% and 6.1% in the subsequent one week and four weeks after
announcement. The share price reaction for the acquirer and target for varying periods
after the announcement is summarized in Table 4.
Table 4: Share Price Reaction for Acquirer and Target after deal announcement.
Actual Day 810 1.1%One Day 810 1.4%
One Week 810 1.6%4 Weeks 1lU 1.7"/o
3.5%5.6%6.3%6.1%
The results for the acquirer share price reaction run counter to our intuition, as
one would expect investors to generally react cautiously to the announcement of a merger
or acquisition and to sell the acquirer's stock due to a perceived elevation in execution
risks. Furthermore, one would expect risk arbitrageurs to short sell the acquirer and buy
the target company to set up a hedged arbitrage position, thus placing downward pressure
on the acquire share price.

The existing literature on mergers and acquisitions in the developed markets
suggests that while these transactions typically result in value creation, this value creation
is generally realized almost entirely by the target's existing shareholders, leaving little to
no gains for the acquirer. Using the stock price movements for 895 US and Canadian
mergers and acquisitions transactions as a gauge of the value creation for the
shareholders, Naheta [11 ] found acquirer share price typically trades down 3.2% after 15
trading days. In emerging markets, however, the acquirer may be expected to retain a
portion of the joint returns from the acquisition, as indicated by the positive acquirer
share price movement after each deal announcement. Contributing to this result is the
greater bargaining power the acquiring firm may relative to the target in emerging
markets acquisition. Acquirers may have greater bargaining power in emerging markets
because fewer bidders compete for the target, cash-strapped targets have liquidity needs
or changes in government policies facilitate mergers and acquisitions transactions. If the
bargaining power of the acquirer increases in times of crisis when faced with a financially
distressed target, then the gains to the acquirer should increase further during crises.
Another factor that may contribute to this surprising result is that target firms in
emerging markets may not be in a position to form an accurate estimate of its
fundamental value. If the target is uncertain about its true stand-alone value, the firm may
undervalue its assets. On the other hand, if acquirers are better able to assess the
synergies from the merger, acquirers may be able to select and execute only those
transactions that result in significant gains for them. The ability of acquirer firms to form
a better estimate of the target's true value has particular significance in emerging markets
where the stock price is often viewed as an estimate of true firm values. Furthermore,

crisis periods result in a collapse about beliefs about future payoffs in the emerging stock
markets. If these beliefs are irrational and acquirers have greater confidence in the
fundamentals, acquirers may realize further gains during times of crisis.
Finally, the positive acquirer share price movement could be attributed to the lack
of risk arbitrage activities in the emerging markets. Mitchell, Pulvino and Stafford [12]
conducted a U.S.-based study on the effect of short-selling on the acquiring company
shares once mergers and acquisitions are announced. They found that short-selling by
risk arbitrageurs accounted for more than one-half the negative price pressure on the
acquiring company's shares. This suggests that in the absence of risk arbitrageurs, one
can expect minimal negative movements for the acquirer share prices.
Again, from existing literature for developed markets, target share prices tend to
react positively to a deal announcement. In a study of mergers and acquisitions in
developed markets by Wang [13], target share prices trade up 4.3% after a full day of
trading after deal announcement. The empirical data in this analysis shows that target
share prices in emerging markets trade up, on average, 3.5% after deal announcement.
The reason for the movement in target share prices could be two-fold. First, there are
investors who react positively to such an announcement due to the premium usually
associated with such deals. Second, there could be risk arbitrageurs who take long
positions on the target shares after deal announcement. Both of these factors could
account for the increase in the target's share price. As risk arbitrage investors are
probably less active in emerging markets, the second factor is assumed to be more likely.
The target share price movements also increase from their initial reaction in the days
following deal announcement. This could be due to the continued positive reaction from

investors to the premium offered for the target shares as well as continued buying by risk
arbitrageurs building their positions.
2.2 Reaction by Consideration Type
To test whether the consideration offered by the acquirer affects share price
reaction, we divided our data set into three categories: all stock, all cash, and mixed (cash
and/or stock) mergers and acquisitions, see Table 5. A majority of the transactions were
all-cash offers, accounting for 89% of the data sample. All-stock offers and mixed offers
accounted for the remaining 7% and 4% respectively. The proportion of all-cash offers in
the data sample is far higher than that observed for developed markets. This could be due
to the relatively low cost of debt financing in the capital markets during the last few
years. Another reason for the large proportion of all-cash offers could be the regulatory
hurdles in emerging markets that prevent acquirers from making stock offers in mergers
and acquisitions deals.
Table 5: Acquirer Share Price Reaction by Consideration Type.
Cash 723 1.2% 1.5% 1.9% 1.7%Stock 53 -0.6% 0.5% -2.7% -0.8%Mixed 34 0.7% 2.7% 3.6% 6.2%
Having established earlier that acquirer share prices, on average, trade up 1.1-
1.8% after deal announcement, the results for all-cash offers were not unexpected. The
acquirer share reaction ranges from 1.2-1.9% on the average. Investors appear to react

more positively to cash-stock combination offers; the acquirer share reaction for such
offers trades up 6.2% four weeks after deal announcement. The announcement of an all-
stock offer experiences a negative reception, and the acquirer's share price, on average,
trades down 0.6% on the day of the announcement. The performance remains poor four
weeks after the deal announcement, trading down marginally by 0.8%. The divergence in
performance may be attributed to a number of factors. All-cash deals generally are
smaller than all-stock deals, and investors can react more adversely to larger deals that
carry greater execution risks and potential financial impact. All-cash acquisitions also do
not require risk arbitrageurs to short sell the shares of the acquirer, and the lack of selling
pressure can also help performance.
A similar analysis is done for target share price versus consideration type, see
Table 6. The target share prices trade up 3.1%-6.4% on the average following an all-cash
offer, while the target share prices trade up 4.8%-8.6% following an all-stock offer.
While both consideration types offer a significant increase, the all-cash offer reaction is
not as positive as the reaction following an all-stock deal announcement. This difference
could be attributed to the fact that usually all-cash deals do not involve as high premiums
as all-stock deals and thus investor could be somewhat subdued. Similar to all-stock
deals, mixed deals experience significant price reaction, with the target share price
trading up 7.9% four weeks after deal announcement. This could be due to the high
premiums that are commonly associated with such deals.

Table 6: Target Share Price Reaction by Consideration Type.
Cash 723 3.1% 5.1% 6.4% 6.2%Stock 53 5.7% 8.6% 4.8% 7.6%Mixed 34 7.8% 8.0% 8.5% 7.9%
2.3 Reaction by Premium Range
The average announced premium across our entire data set is 27%. Our intuition
tells us that the larger the premium, the more positive the target share price reaction.
Correspondingly, we expect a larger premium to be associated with more negative
acquirer share price reaction. To test this observation, we examined the relationship
between acquirer and target share price reaction on the day of announcement, and
premium paid for the target company. We divided our data set into quintiles representing
premium ranges, see Table 7.
Table 7: Share Price Reaction by Premium Offered.
Less than 20% 443 54.7% 1.9% 1.8%20-39% 220 27.2% 4.5% 5.2%40-59% 91 11.2% 0.3% 7.4%60-79% 36 4.4% 1.5% 9.9%
More than 20 2.5% -2.4% 11.0%80%
As expected, acquirer share prices tend to do less well when high premiums are
offered for the target. In deals where the premium is less than 20%, the acquirer share
price trades up an average of 1.9%. In contrast, when premiums of over 80% are offered,
I

the acquirer share price trades down 2.4%. The relative underperformance persists from
the day of deal announcement through the four-week post-announcement trading period.
The results for the acquirer reaction for deals with premium less than 20%
(+1.9%) and deals with 20-39% premium (+4.5%) are a little surprising as one would
expect the acquirer reaction to be more positive for deals with lower premium. When the
share price reactions are examined across a longer period, however, this anomaly
disappears. After four weeks of trading, the average acquirer share price reaction for
deals with premium less than 20% is 4.3%, while the average price reaction for deals
with 20-39% premium is 3.5%.
As a whole, the results of our analysis match our general intuition, as high-
premium deals predominantly attract higher levels of investor scrutiny for various
reasons. High premium mergers and acquisitions are usually associated with strategic
rationales focused on future growth potential and are usually dilutive in the near term.
Realizing the future growth potential of a dilutive transaction can be perceived as having
a high degree of execution risks. Investors are also typically more cautious of a deal's
execution risks in high premium deals because of the perceived notion that the acquirer is
paying excessive amounts for the target. A company's stock price is usually a reflection
of its future expected returns and investors tend to be skeptical of such returns when a
company is paying a high premium for another company. Investors could view the
additional premium as money that could be spent on improving other proven profit
generating areas of the business rather than on the acquisition of another company.
We observed that the target share prices react in an opposite way of the acquirer
share prices. Higher premiums are associated with more positive target shares price

reaction. This makes intuitive sense because higher premiums will generally be perceived
in a positive light by investors because it is a sign that their company is viewed favorably.
High premium deals could also attract more buying from risk arbitrageurs as the higher
premiums usually mean greater returns in the risk arbitrage investment process.
2.4 Reaction by Deal Consummation Time
In theory, deals that take longer time to complete correlate to greater risks. One of
the key drivers for deal consummation time is the duration of the regulatory review
process, and a lengthy review by regulators generally indicates an increased likelihood of
an in-depth investigation and possible structural remedies which are required to receive
necessary approvals. Longer deal consummation will also have the effect of eroding the
effective returns (e.g. on an annualized basis) for risk arbitrage. To test whether a
relationship exists between deal consummation time and company share price reaction,
we divided our data set into three-month increments of time to completion, see Table 8.
Table 8: Share Price Reaction by Deal Consummation Time.
U-0 IIIUIALUI J_7J Ut/I.Uo70 I .7t. /o3-6 months 155 19.1% 0.3% 2.4%6-9 months 50 6.2% 4.8% -0.4%
9-12 months 29 3.6% -1.9% 2.4%More than 1 year 33 4.1% -3.3% 0.5%

Slightly more than 86% of the deals took less than six months to complete and
about 4% of the deals took longer than 12 months to complete. The results of our analysis
on deal consummation duration remain generally inconclusive. As the time to completion
advances, we would expect the average acquirer share price reaction to decline.
Surprisingly, the acquirer share price reaction for transactions that took six to nine
months were more positive than those for transactions that took less than three months
and three to six months to complete. This could be because investors have no way of
knowing how long a deal will take to complete. We found that transactions that took nine
to twelve months to consummate and more than twelve months to complete exhibited
below-average acquirer share price reactions. This matched our intuition for the impact of
deal consummation time on acquirer share price reaction. However, the small number of
samples that fall within this two deal consummation duration categories may render the
observation invalid. We also observed no discernable trend in target reaction as deal
consummation time increases. This once again could be attributed to investors having
little knowledge regarding how long a deal with take to complete.
2.5 Reaction by Relative Size
Our hypothesis is that investors would associate transactions where the deal value
represents a large portion of the acquirer's market capitalization with a greater degree of
execution risk. To test this, we segregated our data set of acquirer share price reaction
into quintiles of deal equity value divided by acquirer market capitalization, see Table 9.
Close to 60% of the transactions had deal equity values less than 20% of the market

capitalization of the acquirer. A fairly sizable proportion or 18.5% of the transactions had
deal equity values more than 80% of the market capitalization of the acquirer.
Generally, the observations fall in line with our hypothesis. Larger deals relative
to the size of the acquirer correlate with more negative acquirer share price reaction. In
deals where the equity value is at least 80% of the acquirer market capitalization, the
acquirer share price reaction falls 4.3% on the day of announcement. In contrast, in deals
where the equity value is less than 20% of the acquirer market capitalization, the acquirer
share price reaction rises 3.6% on the day of announcement. The reason for this could be
greater financial impact and greater execution risks larger deals have on the acquirer.
Table 9: Share Price Reaction by Acquirer Relative Size.
Dea Eqit) Iale ftlals(IIdeas Iequre
Less than 20%20-39%40-59%60-79%More than 80%
479954937150
59.1%11.7%6.0%4.6%18.5%
3.6%2.3%1.8%
-2.9%-4.3%
We also analyzed the impact of deal size on the target share price reaction, using
the similar methodology, see Table 10. Slightly over half of the deals were between
100%-120% the target size while nearly 24% of all deals had values less than the size of
the target company. The impact of deal size on target share prices is opposite that on
acquirer share price. As the relative size of a deal increases, the more positive the target
shares react. One reason for this could be that as the deal size increases relative to the
target size, there is a much greater impact on the target in the days following deal

announcement. It could also be due to the fact that larger deals are associated with higher
premiums and so the increase in target share price reaction is partly due to the premium
factor.
Table 10: Share Price Reaction by Target Relative Size.
DealEquii, alue lReals"o otlels Tiwe
Less than 100% 198 24.4% 2.6%100-119% 220 27.2% 3.5%120-139% 179 22.1% 3.8%140-159% 75 9.3% 4.3%160-179% 33 4.1% 5.1%
More than 180% 105 13.0% 6.0%
2.6 Reaction by Stake Held by Acquirer
Companies typically would acquire a stake, up to the regulatory limit (usually
30% or less in emerging markets), in the target companies through the open market
before deal announcement. The reason for this is two-fold. First, having a stake in the
target would ensure a higher chance of shareholder approval for the deal, since the
acquirer already would have a controlling stake in the company. Second, in the event that
a higher bidder comes along, the company would benefit from the higher market value of
its original stake in the target company. Correspondingly, by having a sizeable stake in
the target company, an acquirer could deter prospective bidders. It therefore follows that
the larger the stake an acquirer in a target company prior to deal announcement, the
higher the chance of deal consummation. In an efficient market, market participants
would bid up the target stock price in anticipation of the deal completion.

To test this, we segregated our data set of acquirer share price reaction by the
stakes held by acquirer four weeks prior to deal announcement, see Table 11. In slightly
less than half of the deals, the acquirers had stakes of less than 10% in the target
companies. We observe that the larger the stakes the acquirer have in the target
companies, the more positive the target share price reaction. This is in line with our
hypothesis as the chances of the deal falling through become slimmer when the acquirer
has a larger stake in the target.
Table 11: Share Price Reaction by Stake Held by Acquirer.
Less than 10%10-19%20-29%30-39%40-49%
More than 50%
39518993624130
48.8%23.3%11.5%7.7%5.1%3.7%
2.4%2.6%3.2%3.3%5.1%7.2%
2.7 Analysis Summary
Based on our analysis of 810 mergers and acquisitions in emerging markets that
were announced from January 1, 2001 through December 31, 2007, we arrived at the
following conclusions:
On average, acquirer shares trade up 1.1% while target shares trade up 3.5% on
the day of an announcement of a merger or acquisition. The average acquirer and
target share price reactions remain positive in the weeks following deal
announcement.

* The announcement of an all-stock merger or acquisition experiences a worse
investor response, with the acquirer share price, on average, trading down 0.6%
on the day of the announcement. As expected, the announcement of an all-cash
acquisition, on average, has positive impact, with the acquirer share price trading
up 1.2% on the day of the announcement.
* The announcement of an all-stock merger or acquisition is received more
positively by investors than all-cash offer in terms of target share price. On
average, target share price moves up 5.7% and 3.1% following all-stock and all-
cash offers respectively.
* Mergers and acquisitions with premiums below 20% exhibit an average acquirer
price reaction of 1.9% on the day of announcement. Transactions that feature a
premium of 80% or more exhibit an above-average acquirer price reaction of
negative 2.4%. As expected, the average target share price reaction is proportional
to the size of the premium offered.
* Increase in deal consummation time has no measurable effect on acquirer and
target share prices, probably due to the fact that investors have no way of
knowing how long the deal will last.

* As the relative size of the merger or acquisition deals increases, acquirer shares
react more negatively. On average, acquirer share price trades down 4.3% on the
day of announcement in deals where equity value is at least 80% of acquirer
market capitalization. Conversely, as the relative size of the merger or acquisition
deals increases, target shares react more positively. On average, target share price
trades up 6.0% on the day of announcement in deals where the deal equity value
exceeds 180% of the target market capitalization.
* As the stake held by acquirer in target companies increases prior to deal
announcement, the more positive the target share price reaction. In deals where
the acquirer holds prior stake that exceeds 50%, the target share price trades up
7.2% on the average.


Chapter 3: Risk Arbitrage Investment Process
The risk arbitrage investment process is characterized by high risks and high
returns. The stock activity for the companies involved in mergers and acquisitions
transactions typically become volatile in the days following the announcement. If the deal
is consummated, the arbitrageur involved in the transaction may realize a large gain. On
the other hand, if the transaction is terminated, the share price may drop precipitously,
thereby leading to large losses for the arbitrageur. In order to minimize the variance in
investment returns and to maximize the success of a transaction, the arbitrageur tries to
determine the probability of a deal's occurrence. A study by Larcker and Lys [14]
suggests that arbitrageurs have the superior ability to predict takeover outcomes. They
hypothesize that arbitrageurs are better informed than the market about the probability of
deal success. In this chapter, we will quantify and characterize the risk and return for risk
arbitrage investments in emerging markets. We will also examine certain qualitative
factors are essential to the quantification process and the success of investments in risk
arbitrage. The results of this chapter can be used as the foundations for a viable trading
model for these types of investments.
3.1 Typical Risk Arbitrage Investments
There are two primary types of mergers and acquisitions activities that define the
risk arbitrage investment process; namely, cash mergers and stock mergers. In a cash
merger, the acquiring company offers to exchange cash for the target company's equity or
assets. In a stock merger, the acquirer offers its common stock to the target's shareholders
in lieu of cash. The arbitrageur's investment depends on the form of payment to the target
shareholders.
In a cash merger, the arbitrageur simply buys the target company's stock. Because
the target's stock typically sells at a discount to the payment promised by the acquirer,
profits can be made by buying the target's stock and holding it until merger
consummation. At that time, the arbitrageur sells the target's common stock to the
acquiring firm for the offer price. There are two sources for the return from this
investment. The primary source of profit is the difference between the purchase price of
the targets stock and the ultimate offer price. The secondary source of profit is the
dividend paid by the target company.
In a stock merger, the arbitrageur sells short the acquiring firm's stock in addition
to buying the target's stock. In such cases, there are three sources of the arbitrageur's
profit. Like cash deals, the primary source of profit is the difference between the price
obtained from the short sale of the acquirer's stock and the price paid for the target's
stock. The second source of profit is the dividend paid on the investment in the target's
stock. However, this is offset by dividends that must be paid on the acquirer's stock, as it
was borrowed and sold short. The third source of profits in a stock deal comes from
interest paid by the arbitrageur's broker on the proceeds from the short sale of the
acquirer's stock. For individual investors, the interest rate typically equals zero. However,
for institutions and hedge funds, short proceeds earn interest at a rate close to the risk-free
rate.

3.2 Risks
The main risk associated with risk arbitrage is that of deal failure, otherwise
called the completion risk. If at some stage the management of either company decides
not to go through with the deal, then the benefits of arbitrage accruing to the transaction
of shares may not materialize. Some shareholders may wish to insure this risk by selling
of their shares. As a result of this selling pressure, the price of the target firm can fall
below its efficient market price and lead to a market inefficiency. This is the primary
source of the profits for risk arbitrageurs. A risk associated with deal failure arises from
the possibility of revision in the terms of the deal. Since the arbitrageur is entering a
position based on the exchange ratio, any adverse changes in the ratio could affect his
profitability.
Risk arbitrage is also prone to risks arising from the availability of investment
capital as the lender typically requires slightly more than 100% of the short position as
collateral. In a tight credit situation, risk arbitrageurs may have difficulty raising the
capital required to pursue the risk arbitrage investments. Some of the other risk factors
that could prevent a deal from going through are antitrust issues, management difficulties,
shareholder dissent, and liquidity. These risk factors are typically more pronounced for
investments in emerging markets. Some deals are blocked on the grounds of antitrust
issues. Management difficulties could also lead to a deal not going through. This is more
of an integration problem in which both sides of management are unable to work together
smoothly to ensure a deal goes through. Shareholder dissent can also be a big impediment
to deal completion. If enough shareholders object to a deal then they can take legal

measures to block it. Liquidity in emerging markets is relatively low due to their smaller
market capitalization. This may prevent investors from unwinding unprofitable positions
quickly to minimize losses.
3.3 Equally Weighted Portfolio
The equally weighted portfolio (EWP) was constructed by investing an equal
amount into each announced deal. The return for each deal is calculated in the following
way. For a cash merger, we invest $1 in the target. When the deal is completed, we sell
the target share to the acquirer for the offer price. The gain realized from this is mainly
due to the premium paid for the target shares by the acquirer. For a stock merger, we
invest $1 in the target and short Nacquirer shares of the acquirer. Nacquirer refers to thePtarget
number of acquirer shares that are being exchanged for each target share and Ptarget is the
price of the target company's stock price after one full day of trading after deal
announcement. As an example, let us suppose that Company Acquirer is acquiring
Company Target, and the current prices at which their stocks are trading are $1 and $0.40
respectively. The proposed exchange ratio is 1:2, which means each share in Company
Acquirer will be issued for every two shares held in Company Target. In this case,
Nacquirer = 0.50 and Ptarget = 0.40. We will invest in 2.5 shares of the Company Target,
Nacquirerwhich has an equivalent value of $1. We will hedge our position by shorting Nacquirer
Ptarget
shares or 1.25 shares of Company Acquirer. In this example, a gain of $0.25 is locked in
and the 2.5 target shares will be exchanged for 1.25 acquirer shares at deal consummation
to fulfill the short commitment.

The gain realized from this is due to the premium paid for the target shares as well
as the interest earned at the risk-free rate from investing our short-sale proceeds. In both
cases, we begin calculating the returns at the close of market on the day after deal
announcement. For successful deals, the resolution day is defined to be the day on which
the deal is completed. For failed deals, the resolution day is the day after deal failure is
publicly announced. Using the day after the announcement as the beginning date ensures
that arbitrage returns are not inadvertently biased upward by the takeover premium. This
is also a realistic starting point as risk arbitrageurs would typically require at least one
full trading day to assess whether to make an investment. Similarly, using the day after
deal failure is announced as the resolution date for failed transaction ensures that the
arbitrage returns are not biased upward by inadvertently exiting failed deals before the
failure is announced. Mixed mergers are not considered for the portfolio as the terms of
the deal can be complex and it would be difficult to set up a hedged arbitrage position.
We analyze the return for each calendar year in our data set. We notice that cash
deals generated much higher returns than non-cash deals. To further investigate this, we
divide our data set into cash and non-cash deals. Table 12 shows the yearly breakdown
between cash and non-cash deals. Table 13 shows the returns for the Equally Weighted
Portfolio across all deals as well as divided into cash and non-cash deals.

Table 12: Yearly breakdown between cash and stock deals.
2001 53 50 94.3% 3 5.7%2002 78 71 91.0% 7 9.0%2003 93 88 94.6% 5 5.4%2004 132 124 93.9% 8 6.1%2005 125 115 92.0% 10 8.0%2006 159 145 91.2% 14 8.8%2007 136 130 95.6% 6 4.4%Total 776 723 93.2% 53 6.8%
Table 13: Equally Weighted Portfolio returns by year
2001 -3.9%2002 -0.7%2003 2.0%2004 9.4%2005 14.0%2006 17.4%2007 13.1%
Compounded Return 7.1%Standard Deviation 8.2%
Sharpe Ratio 0.87
-3.5%-0.5%2.3%9.7%14.5%18.1%13.4%7.4%8.3%0.90
-9.8%-2.6%-2.8%5.4%8.8%
10.5%6.7%2.1%7.5%0.28
We observe from Table 12 that on a year-to-year basis, a large proportion of the
transactions are all-cash deals. This is reflective of the overall breakdown of the nature of
the deal. Given the strength of the emerging equity markets from 2003 to 2007, we would
have expected more acquirers to use company stock to make acquisitions, thus increasing
the proportion of all-stock deals from the earlier period of 2001 to 2002. However, this
was not observed conclusively from the data sample.
From Table 13, we see that the yearly returns are also lower in the period of 2001
to 2003. This could be due to the overall negative market conditions and investor
Year LIff'Returns L- I I P Cash ElITStockReturns Returns

sentiment during the period. See Figure 1 for the yearly trend of the EWP returns,
compared with the performance of the MSCI Emerging Markets Stock Index. Although
the emerging markets improved dramatically in 2003, the EWP return for 2003 was a
relatively subdued 2.0%. One possible explanation is that companies remained cautious
in making acquisitions right after the downturn prior to 2003. These findings are
consistent with the study by Shleifer and Vishny [15], who have shown that risk arbitrage
returns may be positively correlated with market returns during severe market downturns.
Shleifer and Vishny argue that although the hedge fund managers who typically invest in
merger situations may comprehend the risk/return profile associated with risk arbitrage,
their investors may not. Consequently, investors may redeem their capital at precisely the
wrong time, forcing risk arbitrage hedge fund managers to bail out of the market when
their participation is most needed. The EWP yearly returns appear to move upwards in
tandem with the equity markets from the period of 2003-2007.
We also see that cash deals offer better yearly turns that stock deals on a
consistent basis. Due to the large proportion of cash deals, the overall EWP returns are
dominated by the EWP cash returns. Over all the deals, we were able to generate a
compounded annual return of 7.1% with a standard deviation of 8.2% and a
corresponding Sharpe Ratio of 0.87. The Sharpe Ratio achieved using EWP is
significantly better than the Sharpe Ratio of 0.28 for the S&P 500, as highlighted earlier
in Table 1. The cash deal portfolio generated a compounded annual return of 7.4% with a
standard deviation of 8.3% and a Sharpe Ratio of 0.90 while the stock deal portfolio
generated a return of 2.1% with a standard deviation of 7.5% and a Sharpe Ratio of 0.28.

There are two factors that are worth pointing out for the equally weighted
portfolio method. First, it assumes that we invest in every announced deal in an equal
amount. Because of the fixed costs associated with investing in a transaction, this is a
feature that large risk arbitrage hedge funds are unable to implement. Second, it assumes
that there are no transactions costs associated with investing in a transaction. Both of
these assumptions are clearly unrealistic. However, yearly returns generated from this
approach provide a benchmark that is useful for comparing results from this study to
those documented in other papers.
We could improve on this oversimplified trading strategy if we were somehow
able to determine which deals would be most profitable and then invest only in those. The
method by which we did this was to develop a prediction model with inputs being various
merger characteristics motivated by our initial findings and the output being the expected
return.

Figure 1: Equally Weighted Portfolio Returns
3.4 Prediction Model
The merger characteristics that we use to predict a deal's return are whether the
merger was a cash deal or not, premium offered, the relative size of the acquirer and
target to the deal value, and the stake held by acquirer prior to deal announcement. The
predicted return for each deal is then calculated using the following equation:
Deal ValuePr edicted_ Re turn = fl Cash + f2 Pr emium + P31n ( - )+
Acquirer S ize
Deal Valuef41n ( - ) + fl(Acquirer_ Stake) + Intercept
T arg et_Size

Where:
Cash is a dummy variable (equal to 1 deal for an all-cash deal and 0 for an all-
stock deal).
Premium is the percentage of the offer price in excess of the target share price one
week before the deal announcement.
Deal_Value is the total transaction value (US$) of the deal.
AcquireSize and Target_Size are the market capitalization (US$) of the acquirer
and target companies one day before the deal announcement.
Acquirer_Stake is the percentage of the target shares that the acquirer holds one
month before deal announcement.
By running a regression on the return of a deal against these deal characteristics,
we are able to obtain the values for the coefficients pI through ps as well as the intercept.
The variable coefficients are found to be significant at 1% level while the intercept is
found to be significant at 5% level, as shown in Table 14 below. To test the goodness of
fit of the model, we compute R2 and adjusted R2, which work out to 0.2018 and 0.1973
respectively. The F-statistic is 44.6, which is significant at 1% level.
We observe that whether a merger is a cash deal or not has the greatest impact on
its expected return with a coefficient of 0.1436. This is expected as we found out earlier
in Chapter 2.1 that the acquirer share price actually rises, on average, following a deal
announcement. This means that the risk arbitrage investment process for an all-stock
deal, which requires the risk arbitrageur to short-sell the acquirer share, would lead to a

loss. The variables of deal premium and deal value to target size, with coefficients of
0.0165 and 0.0262, have significant impact on the expected return. The acquirer stake
also plays a positive, albeit small role, with a coefficient of 0.0059. On the other hand,
the deal value to acquirer size, with coefficient of -0.0103, impacts the expected return
negatively.
Table 14: Intercept and coefficient of merger variables.
Cash 0.1436 0.0293 4.90*Premium 0.0165 0.0059 2.79*
Deal Value/Acquirer Size -0.0103 0.0035 -2.94*Deal Value/Target Size 0.0262 0.0048 5.46*
Acquirer Stake 0.0059 0.0017 3.47*Intercept -0.0429 0.0192 2.23**
Significance levels: * = 0.01, **=0.05
3.5 Prediction Model Portfolio
Using these coefficients in our predicted return model, we are able to calculate
predicted returns for each deal in our dataset. We develop a prediction model portfolio
(PMP) that invests only in deals in which the expected return was greater than a hurdle
rate, which is pegged to two times the 3-month U.S. Treasury Bills rate2. The choice of
the 3-month U.S. Treasury Bills rate can be rationalized as a majority of the deals
(67.0%) in the data sample have a deal consummation time of 3 months or less. Table 15
shows the results of both the equally weighted portfolio and predicted model portfolio
returns.
2 1.12% as of 17 Apr 08.
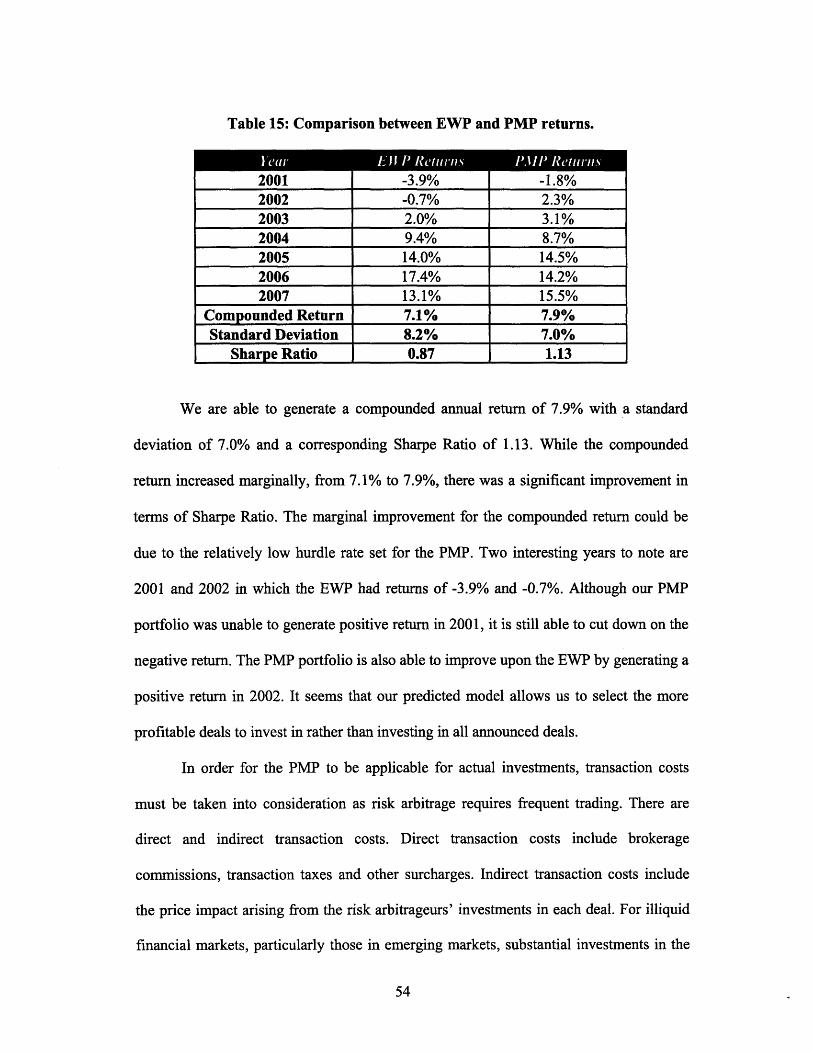
Table 15: Comparison between EWP and PMP returns.
2001200220032004200520062007
Compounded ReturnStandard Deviation
Sharpe Ratio
-3.9%-0.7%2.0%9.4%14.0%17.4%13.1%7.1%8.2%0.87
-1.8%2.3%3.1%8.7%14.5%14.2%15.5%7.9%7.0%1.13
We are able to generate a compounded annual return of 7.9% with a standard
deviation of 7.0% and a corresponding Sharpe Ratio of 1.13. While the compounded
return increased marginally, from 7.1% to 7.9%, there was a significant improvement in
terms of Sharpe Ratio. The marginal improvement for the compounded return could be
due to the relatively low hurdle rate set for the PMP. Two interesting years to note are
2001 and 2002 in which the EWP had returns of -3.9% and -0.7%. Although our PMP
portfolio was unable to generate positive return in 2001, it is still able to cut down on the
negative return. The PMP portfolio is also able to improve upon the EWP by generating a
positive return in 2002. It seems that our predicted model allows us to select the more
profitable deals to invest in rather than investing in all announced deals.
In order for the PMP to be applicable for actual investments, transaction costs
must be taken into consideration as risk arbitrage requires frequent trading. There are
direct and indirect transaction costs. Direct transaction costs include brokerage
commissions, transaction taxes and other surcharges. Indirect transaction costs include
the price impact arising from the risk arbitrageurs' investments in each deal. For illiquid
financial markets, particularly those in emerging markets, substantial investments in the

companies that are involved in mergers and acquisitions will cause large share price
movements. Using a price impact model developed by Breen, Hodrick and Korajczyk
[16], Mitchell and Pulvino analyzed the risk arbitrage returns, having adjusted for both
direct and indirect transaction costs. They found that direct transaction costs amount to
1.5% of the returns while indirect transaction costs amount to 3.9% of the returns; in
total, transaction costs amount to 5.4%. While it is recognized that their findings only
apply to US mergers and acquisitions, we can adjust the EWP and The EWP and PMP
returns, after adjustment for transaction costs, are 1.7% and 2.5%. Even though both
portfolios are still profitable, the returns are fairly mediocre and could even turn negative
if we were to take into account the higher transaction costs for emerging markets due to
their lower liquidity and higher direct transaction costs.
3.6 Cross-Validation Analysis
One problem with our earlier analysis is that we tried fitting our model on the
same data that we regressed on to get our model in the first place. To circumvent this
problem, we make use of the cross-validation technique. The cross-validation technique
is useful where the amount of available data is insufficient to form strong conclusions
about results. Under cross-validation, the available data is divided into 10 disjoint sets.
We then estimate a prediction model, based on the variables described in Section 3.4, on
nine partitions and test it on the other partitions. The process is repeated ten times in total
for each of the partition. The cross-validation estimate of a given performance statistic is
simply the mean of the statistic evaluated for each random test partition of the data.

We use the cross-validation procedure on our data set, and using the merger
characteristic variables described in Section 3.4, we compute returns by investing in deals
that have a probability of success greater than the hurdle rate established in Section 3.5
(i.e. twice the 3-month U.S. Treasury Bills rate). The portfolio generated a compounded
annual return of 7.6%, with a standard deviation of 7.0%, compounded across all the
simulations, and has a Sharpe Ratio of 1.09. See Table 16 for the comparison between the
predicted model portfolio and cross-validation portfolio returns. Using the T-test at 5%
level, we find that the returns obtained using the cross-validation technique are not
significantly different from the returns obtained using the predicted model. See Table 17
for the T-statistic values. This increases our confidence in using the prediction model as a
means to filter out the more profitable deals from the entire data sample.
Table 16: Comparison between PMP and Cross-Validation Portfolio returns.
2001200220032004200520062007
Compounded ReturnStandard Deviation
Sharpe Ratio
-1.8%2.3%3.1%8.7%14.5%14.2%15.5%7.9%7.0%1.13
-2.1%2.6%2.8%7.5%14.8%14.0%15.3%7.6%7.0%1.09
Year I-IIP Returns Cross- I '(didationReturns

Table 17: T-statistics for PMP versus Cross-Validation Portfolio returns.
2001200220032004200520062007
-0.3060.857-1.071-0.7840.152-0.116-0.095
3.7 Possible Explanations for Risk Arbitrage Returns
Most of the previous studies that attempt to assess the profitability of risk
arbitrage conclude that it generates substantial returns. In this thesis, we first use a
simplified trading strategy that involves investing in all mergers and acquisitions deals
equally. This strategy is observed to be a profitable one. We followed up by developing
another trading strategy that invests only in deals that would generate returns above a pre-
determined hurdle rate as predicted by a multivariate regression model. This strategy
proves to be more profitable than the earlier simplified trading strategy.
There can be several explanations for the profitable returns observed in the two
trading strategies developed in this thesis. The first explanation is that transaction costs
have not been taken into account. As explained earlier, past studies have shown that
transaction costs can amount to 5.4%, thus eroding a significant portion of the annual
returns. The second explanation is that the use of event time, rather than calendar time, to
calculate risk arbitrage returns may also contribute to the excess returns. The event-time
approach involves calculating the rate of return obtained from investing after the merger
announcement and selling after deal resolution. Returns from individual deals are first
I )Cal T-tatsti '

"annualized" and then averaged across deals. The problem with this approach is that it
assumes that the risk arbitrage portfolio can earn event-time returns continuously.
Particularly for transactions that are consummated quickly, this assumption can lead to
large annualized returns. The third explanation for the returns to risk arbitrage is that they
represent compensation to investors for bearing extraordinary amounts of systematic risk.
Because most announced mergers are successfully consummated, risk arbitrage
investments usually generate small positive returns. Conditional on successful
consummation, these returns depend on the initial arbitrage spread and not on overall
stock market returns. Therefore, returns to risk arbitrage should contain very little
systematic risk. However, as highlighted earlier, risk arbitrage returns may be positively
correlated with market returns during severe market downturns. This will be true if the
probability of deal failure increases in depreciating markets.

Chapter 4: Summary and Future Work
4.1 Summary
The main theme of this thesis is the quantification of the risk arbitrage investment
process in emerging markets. We first computed the price impact of various deal
characteristics to develop an intuition on the factors that affect risk arbitrage returns. This
was followed by the formulation of trading strategies based on a prediction model. The
model is derived from deal characteristics and we construct and analyze portfolios based
on our prediction model. Our portfolio construction is concentrated on simple strategies
and we obtain annual risk-adjusted returns in excess of 7.9%. The described investment
process and characterization of the risk and return in risk arbitrage can be used as a
stepping stone towards an actual risk arbitrage strategy.
4.2 Future Work
This thesis has approached the risk arbitrage process in emerging markets in a
quantitative manner. While we analyzed many deal characteristics that could impact a
deal's return, there are many more that were not considered. One factor that could impact
risk arbitrage returns significantly is the transaction costs. The companies in our data
sample belong to various emerging markets and each market has its unique transaction
costs. Mitchell and Pulvino have shown that transaction costs, which include trading
commissions, taxes, liquidity, and would erode 5.4% of the returns in their study on risk
arbitrage for U.S. companies. It would make the findings more robust if the transaction
costs could be quantified for each of the emerging markets mentioned in the thesis.

Another factor that could impact risk arbitrage returns is the resistance of the target in
each deal. Hoffmeister and Dyl [16] find that the resistance of targets is one of several
major factors affecting the success of merger attempts. More recently, Schwert [18] finds
that hostile offers have the lowest success rates. Therefore, it is possible that we could
improve on our prediction model by including target resistance as a dummy variable.
Another area that should be studied is the risk arbitrage process in cross-border
deals between companies in developed and emerging markets. There has been a large
increase in the volume of cross-border mergers and acquisitions in recent years. Chari,
Ouimet, and Tesar [19] have shown that cross-border deals are mutually beneficial to the
acquirer and target companies. It is worthwhile to see whether the risk arbitrage strategies
that are developed in this thesis can be applied profitably in such deals.

Appendix A: List of countries
ArgentinaBermudaBrazilCayman IslandsChileChinaColombiaEgyptHungaryIndiaIndonesiaIsraelLithuaniaMalaysiaMexicoPeruPhilippinesPolandRussian FedSloveniaSouth AfricaSri LankaThailandTurkey


Bibliography
[1] Capital Ideas: The Improbably Origins ofModern Wall Street, The Free Press, 1992
[2] Pitaro, R., Deals...Deals...And more deals, Gabelli University Press, 1999.
[3] Dukes, W., C. Frohlich, and C. Ma, "Risk arbitrage in tender offers: Handsomerewards - and not for insiders only," Journal of Portfolio Management, Summer, pp. 47-55, 1992.
[4] Jindra, J., and R. Walkling, "Arbitrage spreads and the market pricing of proposedacquisitions," Journal ofFinancial Economics, Vol. 64, No. 1, 2002.
[5] Mitchell, M., and T. Pulvino, "Characteristics of risk and return in risk arbitrage,"Journal ofFinance, Vol. 56, pp. 2135-75, 2001.
[6] Billingsley, R., Understanding Arbitrage: An Intuitive Approach to FinancialAnalysis, Wharton School Publishing, 2006.
[7] Ineichen, A., Absolute Returns: The Risk of Opportunities of Hedge Fund Investing,John Wiley & Sons, Inc., 2003.
[8] Moore, K., G. Lai, and Z. Song, "A Microstructure Examination of the Effect of RiskArbitrage on the Trading in Acquiring Company Shares in Stock Mergers."
[9] Mobius, M., Emerging Markets, Pitman Publishing, 1996.
[10] Fuss, R., "The Financial Characteristics between 'Emerging' and 'Developed'Equity Markets."
[11 ] Naheta, A., "Risk Arbitrage: Analysis and Trading Systems," 2004.
[12] Mitchell, M., T. Pulvino and E. Stafford, "Price Pressure around Mergers," The Journalof Finance, Vol. LIX, No. 1, pp. 31-63, 2004.
[13] Wang, J., "Research and Development of Risk Arbitrage Trading Systems," 2005.
[14] Larcker, D. and T. Lys, "An empirical analysis of the incentives to engage in costlyinformation acquisition," Journal ofFinancial Economics, Vol. 18, pp. 111-126, 1987.
[15] Shleifer, A., and R. Vishny, "The limits of arbitrage," Journal of Finance, Vol. 52,pp. 35-55, 1997.
[16] Breen, W, L. Hodrick, and R. Korajczyk, "The determinants of equity illiquidity,"Working Paper, 1999.

[17] Hoffmeister, J., and E. Dyl, "Predicting Outcomes of Cash Tender Offers,"Financial Management, Vol. 9, pp. 50-58, 1980.
[18] Schwert, W., "Hostility in Takeovers: In the Eyes of the Beholder?" Journal ofFinance, Vol. 55, pp. 2599-2640, 2000.
[19] Chari, A., P. Ouimet, and L. Tesar, "Cross Border Mergers and Acquisitions inEmerging Markets: The Stock Market Valuation of Corporate Control."