Embed Size (px)
Citation preview

Rigorous Course Taking: Advanced Placement, International Baccalaureate, Concurrent Enrollment and Postsecondary
Enrollment Options Programs
Report to the Legislature
As required by Minnesota Statutes, section 120B.13
This document is made available electronically by the Minnesota Legislative Reference Library as part of an ongoing digital archiving project. http://www.leg.state.mn.us/lrl/lrl.asp

For more information:
Mary Barrie, Ed.D Office of Career and College Success Minnesota Department of Education (MDE)1500 Highway 36 West Roseville, MN 55113 (651) [email protected]
https://education.mn.gov
As requested by Minnesota Statutes, section 3.197: This report cost approximately $7,707.59 to prepare, including staff time, printing and mailing expenses.
Upon request, this material will be made available in an alternative format such as large print, braille or audio recording. Printed on recycled paper.

Rigorous Course Taking 3
Table of Contents
Legislative Charge .......................................................................................................................................................4 Rigorous Course Taking: Overview of Legislation ......................................................................................................5 Advanced Placement Program Description ................................................................................................................5
Advanced Placement Program Participation ......................................................................................................6
Advanced Placement Exam Profile .................................................................................................................. 10 International Baccalaureate Program Description .................................................................................................. 11
Minnesota IB Program Participation ............................................................................................................... 12
International Baccalaureate Exam Profile ....................................................................................................... 17 Teacher Training and Exams: Advanced Placement and International Baccalaureate ........................................... 18 Expenditures: Advanced Placement and International Baccalaureate ................................................................... 19
AP and IB Program Allocations and Combined Expenditures (2011-2017) ..................................................... 20 Postsecondary Enrollment Options Program Description....................................................................................... 26
PSEO State-Approved Early/Middle College Programs ................................................................................... 26
Postsecondary Enrollment Options Program Participation ............................................................................ 28 Concurrent Enrollment Program Description .......................................................................................................... 32
Oversight and Funding..................................................................................................................................... 32
Concurrent Enrollment (CE) Program Participation ........................................................................................ 34 Overall Findings: Dual Credit Programs in Minnesota ............................................................................................ 38 Recommendations: Dual Credit Programs .............................................................................................................. 39 Appendices .............................................................................................................................................................. 40
Appendix A. Advanced Placement and International Baccalaureate Programs ............................................. 40
Appendix B. Advanced Placement Public and Nonpublic Schools Reimbursements FY 2017 ........................ 42
Appendix C. International Baccalaureate Public and Nonpublic Reimbursements FY 2017 ........................... 54
Appendix D. Minnesota International Baccalaureate World Schools FY 2017 ............................................... 56
Appendix E. State-Approved Early/Middle College Programs FY 2017 ........................................................... 57
Appendix F. Postsecondary Enrollment by Institutions and the total number of credits and expenditures .. 59
Appendix G. Concurrent Enrollment Aid by District Course Count, Credit Count and Expenditures* ........... 61
Appendix H. Concurrent Enrollment by Institutions and the total number of credits .................................... 76

Rigorous Course Taking 4
Legislative Charge
Minnesota Statutes, section 120B.13, subdivision 4. Rigorous course taking information; AP, IB, and PSEO
The commissioner shall submit the following information on rigorous course taking, disaggregated by student subgroup, school district, and postsecondary institution, to the education committees of the legislature each year by February 1:
(1) the number of pupils enrolled in postsecondary enrollment options under section 124D.09, including concurrent enrollment, career and technical education courses offered as a concurrent enrollment course, advanced placement, and international baccalaureate courses in each school district;
(2) the number of teachers in each district attending training programs offered by the college board, International Baccalaureate North America, Inc., or Minnesota concurrent enrollment programs;
(3) the number of teachers in each district participating in support programs; (4) recent trends in the field of postsecondary enrollment options under section 124D.09, including
concurrent enrollment, advanced placement, and international baccalaureate programs; (5) expenditures for each category in this section and under sections 124D.09 and 124D.091, including
career and technical education courses offered as a concurrent enrollment course; and (6) other recommendations for the state program or the postsecondary enrollment options under section
124D.09, including concurrent enrollment.

Rigorous Course Taking 5
Rigorous Course Taking: Overview of Legislation
The Minnesota Legislature has appropriated funding to support the development of Advanced Placement (AP), International Baccalaureate (IB), Concurrent Enrollment, and Postsecondary Enrollment Options (PSEO). These programs, designed to offer pathways, opportunities and preparation for the world beyond high school, continue to increase in both student enrollment and success for Minnesota students. In 2016-17, the legislative appropriation for the Advanced Placement (AP) and International Baccalaureate (IB) programs was $4,500,000, with $500,000 of that funding earmarked specifically for teacher training. In addition, the appropriation specified, “The advanced placement program shall receive 75 percent of the appropriation each year and the international baccalaureate program shall receive 25 percent of the appropriation each year.” View Minnesota Statutes, section 120B.13 (see Appendix A: Advanced Placement and International Baccalaureate Programs).
Courses taken through the Postsecondary Enrollment Options (PSEO) program and through concurrent enrollment programs are also supported through separate funding formulas, with PSEO payments made to postsecondary institutions, and concurrent enrollment reimbursements provided directly to participating school districts. View Minnesota Statutes, sections 124D.09 and 124D.091.
This report will describe specifics and progress of each of the four above-mentioned programs: AP, IB, PSEO and Concurrent Enrollment.
Advanced Placement Program Description
The Advanced Placement Program is a cooperative educational endeavor between secondary schools and colleges and universities. Since its inception in 1955, the College Board Program has provided motivated high school students with the opportunity to take college-level courses in a high school setting. The program consists of more than 35 college-level courses and standardized exams that assess proficiency in these courses. The College Board supports secondary schools by providing facilitated teacher training and a curriculum of high academic intensity and quality that enables students to meet the standards for college-level learning in these subjects. Most colleges and universities in the United States, as well as institutions in 30 other countries, use AP exam results in the admissions process as a designation of a student’s ability to succeed in rigorous curricula. Colleges may award credit and/or placement into higher-level college courses so that college entrants can move directly into the courses that match their level of academic preparation.
Advanced Placement is open to any secondary school that is willing to organize one or more courses, foster teacher development and administer the AP Exams. All AP exams (except Studio Art, which is a portfolio assessment) consist of dozens of multiple-choice questions scored by machine, and free-response questions (essays, translations, problems), which are scored at the annual AP Reading by more than 10,000 college faculty and secondary AP teachers.
All schools wishing to label a course “AP” must first receive authorization for each course by completing the AP audit process, which involves submitting a copy of the course syllabus for review by college faculty. The AP course audit provides clear guidelines on curricular and resource requirements that must be in place and helps colleges better interpret courses marked “AP” on students’ transcripts. For further information about the program, Visit the College Board website for more information about Advanced Placement.

Rigorous Course Taking 6
Minnesota is in its 26th year of providing AP exam fee support for students. In 2017, 325 public and non-public schools offered AP courses. The number of students testing and exams taken in fiscal year (FY) 2017 continued to demonstrate significant gains on AP exams and student participation.
Advanced Placement Program Participation
AP exam subsidies were again available for public and non-public school students. In 2017, the state reimbursed $53 per exam for category one students (fee-reduced, low-income) and $40 per exam for exams taken by category two students (non-fee-reduced).
AP Exam Fees Fee-reduced students Non-fee-reduced students
Cost of Exam $93 $93
College Board reduction $31 $0
School rebate $9 $9 (optional)
MDE reimbursement $53 $40
Total Cost to Students $0 $44 or $53 (if school does not waive rebate)
The College Board waived $31 per exam for all fee-reduced students and, if schools also waived their $9 exam administration rebate from the College Board, the state reimbursement covered the remaining cost of these exams. Schools were invoiced $53 per category one exam.
The charts below provide a snapshot of the Minnesota student performance in 2017 on AP exams as well as an overview of the 2017 Minnesota AP test takers, disaggregated by score, gender, and ethnicity.
Overview AP Test Scores 2017
Advanced Placement Tests
Total Score of
1 Score of
2 Score of
3 Score of
4 Score of
5 Percent of
3 +
Total Number 73,559 8,364 16,699 20,971 16,647 10,878 66%
Overview of AP Test Takers 2017
Gender Total Percent
Male 20,744 46%
Female 24,604 54%
Total AP test takers: 45,348

Rigorous Course Taking 7
The charts below detail participation in AP teacher training to AP programs over the last six years. Of note are increases in participation by students of color (97 percent increase) and low-income students (34 percent), as well as increase in total participation by students (29 percent). With this growth, the chart also shows that there is increased course offerings (18 percent) and balanced participation in teacher training opportunities as these programs grow. Minnesota’s percent of students scoring three or above continues to be well above the national average.
AP Funding FY 11 FY 12 FY 13 FY 14 FY 15 FY 16 FY 17
Total Schools Funded 262 262 252 232 301 242 252
Public Schools Testing 217 219 208 192 264 262 266
Nonpublic Schools Testing 41 43 44 40 49 39 42
Total Schools Testing 232 291 279 291 314 322 325
AP Exams FY 11 FY 12 FY 13 FY 14 FY 15 FY 16 FY 17
Total Students Taking Exams 35,091 37,363 38,769 40,870 42,814 43,780 45,348
Percent Increase Students 8% 6% 4% 5% 5% 2% 4%
Total Exams Taken 56,942 62,022 64,705 67,830 70,699 71,136 73,559
Students of Color (SOC) 5,294 5,904 6,642 7,286 7,150 9,582 10,452
Exams taken by SOC 7,927 8,987 10,212 11,278 12,276 15,985 17,426
Low-Income Students 3,138 3,322 3,671 -- 5,023 4,033 4,208
Exams taken by Low-Income 4,481 4,766 5,355 -- -- 5,698 5,940
Average Exams per Student 1.6 1.6 1.7 1.7 1.7 1.6 1.6
Percent of AP Passing Exams FY 11 FY 12 FY 13 FY 14 FY 15 FY 16 FY 17
Minnesota Scores 3 or above 65% 66% 65% 66% 66% 66% 66%
National Scores 3 or above 58% 56% 57% 57% 56% 57% 58%
AP Teacher Training FY 11 FY 12 FY 13 FY 14 FY 15 FY 16 FY 17
AP Summer Institutes 408 458 477 456 442 428 419
Out-of-State 10 17 26 17 32 36 29
Support Programs 434 470 445 444 459 464 486
AP Courses Offered 1,677 1,721 1,726 1,776 1,874 1,943 1,981
Percent increase AP Courses 2% 3% .5% 3% 6% 4% 2%
AP Teachers 1,470 1,639 1,775 1,521 1,628 1,767 1,897
Total Teacher Training 852 945 962 917 933 928 934

Rigorous Course Taking 8
The following chart illustrates AP exam participation trends by students of color, which include American Indian, Asian/Pacific Islander, Black/African American, Latino/Hispanic and Multi-Racial.
See Appendix B: Advanced Placement Public and Nonpublic Schools Reimbursements FY 2017.

Rigorous Course Taking 9
In the past six years, high schools in Minnesota have increased the number of students gaining access to and experiencing success in AP, and the population of AP exam takers is increasingly diverse. Though still under-represented in AP classrooms, in 2017 more minority students experienced success in AP than ever before, with the total number of students of color taking AP exams more than doubling in the last six years. The following chart shows the percentages of Minnesota students taking AP exams FY 2011-2017 by Student Groups.
AP Student Groups FY 11 FY 12 FY 13 FY 14 FY 15 FY 16 FY 17 Percent Increase
(2011-17)
American Indian 128 154 158 166 160 124 118 -8%
Exams 182 225 229 238 233 170 165 -9%
Asian 2,581 2,899 3,244 3,566 3,827 3,758 4,203 63%
Exams 4,915 5,572 6,299 6,924 7,358 7,042 7,926 61%
Black/African-American 1,061 1,157 1,315 1,486 1,659 1,642 1,876 77%
Exams 1,593 1,685 1,958 2,210 2,365 2,307 2,683 68%
Latino/Hispanic 810 959 1,074 1,208 1,504 2,326 2,457 203%
Exams 1,237 1,505 1,726 1,906 2,320 3,579 3,726 201%
Multi-Racial (two or more races)
-- -- -- -- -- 1,732 1,798 4%
Exams -- -- -- -- -- 2,831 2,926 3%
Other 714 735 851 860 840 27 7 -99%
Exams 1,253 1,313 1,534 1,524 1,467 56 9 -99%
Not Stated 1,042 1,431 851 747 1,182 704 917 -12%
Exams 1,496 2,195 1,088 972 1,487 959 1,273 -15%
White 28,755 30,028 31,276 32,837 33,635 33,467 33,972 18%
Exams 46,266 49,527 51,871 54,054 55,457 54,192 54,851 19%
Total Students 35,091 37,363 38,769 40,870 42,807 43,780 45,348 29%
Percent Increase Students 8% 6% 4% 5% 5% 2% 4% --
Total Exams 56,942 62,022 64,705 67,819 70,687 71,136 73,559 29%
Percent Increase Exams 7% 9% 4% 5% 4% 1% 3% --
Note: Beginning with the 2015-16 school year, the collection and reporting of race/ethnicity was updated to align with U.S. adding Multi-Racial as a choice of race/ethnicity.

Rigorous Course Taking 10
Advanced Placement Exam Profile
Minnesota data indicates annual significant increases in exam participation along with steady growth in the number of exams scoring three or higher. The chart below shows the comparison of total number of AP exams taken with AP exams score of three or higher from 2011 to 2017.
Minnesota data has shown improvement over time in the performance on AP exams. The table below disaggregates the passing scores by race in 2017.
AP scores 3+ 3 4 5 Total
American Indian 44 21 2 67
Asian/Pacific Islander 1,934 1,759 1,569 5,262
Black/African American 632 310 126 1,068
Latino/Hispanic 970 666 390 2,026
Multi-Racial 847 647 460 1,954
White 16,190 12,996 8,158 37,344
Other 2 2 -- 4
No Response 352 246 173 771
Total all groups 20,971 16,647 10,878 48,496
The following chart shows, in 2017, 438 public students taking AP exams self-identified as Limited-English proficient, an increase of 175 percent since 2011.
AP Exam Participants FY 11 FY 12 FY 13 FY 14 FY 15 FY 16 FY 17 Percent Increase
(2011-17)
Limited-English Proficient 159 168 398 160 167 387 438 175%

Rigorous Course Taking 11
International Baccalaureate Program Description
The International Baccalaureate (IB) is a non-profit, educational foundation established in 1968, offering four highly respected programs of international education that span the primary, middle and secondary school years. The Primary Years Programme (PYP) is designed for students aged 3-12; the Middle Years Programme (MYP) for students aged 11-16, the Diploma Programme (DP) for students aged 16-19, and the IB Career-related Programme (CP) is designed for students aged 16-19 to engage in career-related learning. Schools must complete an extensive application process to become authorized IB World Schools and offer these programs. The IB works with over one million students attending more than 4,000 IB World Schools in 153 countries worldwide.
The Diploma Programme (DP) is a comprehensive two-year international curriculum available in English, French and Spanish. The DP offers 157 exams in 51 disciplines that generally allow students to fulfill the requirements of their national or state education systems. Students who participate in the full Diploma Programme are required to study and examine in six different academic subjects. At least three of the six subjects are taken at the higher level where students study the subject area in depth for two academic years totaling 240 hours. Challenging, standard level IB courses span one academic year and total a minimum of 150 hours. Students who are not diploma candidates can choose to take individual IB courses and subsequent exams to earn IB certificates.
The format of exams is both written and oral and includes essay, multiple choice and short answer questions. In some subject areas, students also prepare a portfolio for assessment. Each subject has at least two exam periods for different types of exams for a total of four hours of examination. Each examined subject is graded on a scale of one to seven (maximum). The award of the diploma requires a minimum total of 24 points and satisfactory completion of the following three additional requirements:
• The Extended Essay is approximately 4,000 words, requiring students to write an independent, original research paper in one of the six subject areas;
• A critical thinking course known as Theory of Knowledge explores the relationships among the various disciplines and ensures that students engage in critical reflection and analysis of the knowledge acquired within and beyond the classroom; and,
• A minimum of 150 hours participation in Creativity, Action and Service (CAS), which are extracurricular community-action service, artistic and physical activities.
Visit the International Baccalaureate website for more information (http://www.ibo.org).

Rigorous Course Taking 12
Minnesota IB Program Participation
In 2017, 79 IB programs were in place in 62 “authorized” Minnesota schools. Some schools implement several programs (e.g., CP and DP or DP and MYP or MYP and PYP in the same building). The chart below shows the number of Minnesota schools offering IB programs. Participating schools receive support and guidance through MDE, Minnesota Association of IB World Schools (MNIB), the International Baccalaureate of the Americas (IBA), and the International Baccalaureate (IB).
Growth Since FY 11
Authorized IB Schools FY 11 FY 12 FY 13 FY 14 FY 15 FY 16 FY 17
PYP Schools 17 18 22 23 24 24 24 +7
MYP Schools 17 21 22 22 23 30 31 +14
DP Schools 20 20 20 20 20 20 20 --
CP Schools -- 2 2 2 2 3 4 +4
TOTALS 54 59 67 67 69 77 79 +25
In 2017, the total number of students testing at the Diploma Programme level increased 15.4 percent, from 3,462 to 3,995. These students took 8,691 exams, with 4,652 (54 percent) earning a score of four or above on a seven point scale. The overall number of low-income students and students of color has increased over the past six years. Students of color represent 40 percent of students testing and 40 percent of IB exams taken. Students can elect to take individual IB courses or the full IB diploma. In 2017, 193 Minnesota students earned the full IB diploma. The following chart shows total number of students testing at the DP/CP level by students of color, low-income students and the number of diplomas earned.
Percent Increase
(2011-17) Diploma Program (DP) FY 11 FY 12 FY 13 FY 14 FY 15 FY 16 FY 17
Total Students 2,602 2,799 3,150 3,553 3,651 3,462 3,995 54%
Total Exams 5,402 6,144 7,373 7,577 7,698 8,024 8,691 61%
Students of Color (SOC) 932 996 1,194 1,394 1,206 1,306 1,581 70%
SOC Exams 1,794 2,243 2,612 2,819 2,533 2,945 3,433 --
Low-income students 767 808 622 1,102 1,110 1,003 1,177 53%
Low-income Exams 1,578 1,769 2,242 2,230 2,431 2,202 1,376 --
Diplomas Earned 173 191 287 222 197 204 193 12%

Rigorous Course Taking 13
Brooklyn Center, South Saint Paul and Fridley Public Schools have district-wide IB programs that serve all elementary and middle school students in those districts. Approximately one-third of all Minnesota IB schools are in Minneapolis (16) and St Paul (9). There are 27 districts, charter schools and private schools with IB programs. All are located in the metro area, except Grand Rapids, Forest Lake, Lakes International Language Academy, Sauk Rapids, St. John’s Prep, Rochester Montessori and Rochester Arts and Science Academy.
At this time, there are eight programs preparing to become authorized IB World schools. In order to become authorized, a school or district must go through five specific steps including a feasibility study/strategic planning process–comprehensive school changes to curriculum, instruction, and professional development that occurs during the two-step application process. After this has been completed, schools undergo a site visit from the IB Americas. After a successful visit, the school then achieves the Authorized IB World School status. Follow up visits are required to maintain their IB authorization.
In 1992, IB developed a Middle Years Programme (MYP), which offers a broad academic base along with Approaches to Learning and other areas of interaction for students in grades 6-10. The MYP can be a stand-alone program or part of the pre-IB preparation for the Diploma Programme. In Minnesota in 2017, there were 26 Middle Years Programmes (MYP) in 31 schools, all located in the greater metro area.
The Primary Years Programme (PYP) was developed in 1997. It offers an inquiry-based program for students in pre-K through fifth grade. In 2017, 26 schools were authorized to offer the PYP. The PYP and MYP schools also go through a comprehensive process to become authorized. Both the MYP and the PYP are school-wide models that serve all students.
The IB Career-related Programme (CP) was introduced in 2012. The CP builds on prior learning in the IB Middle Years Programme and incorporates elements of the IB Diploma Program. Through CP, students have the opportunities for career and technical training along with rigorous academic work to earn a Career Certificate. As of November 2014, the CP can be offered as a standalone program in schools that are not DP authorized. Schools that do not currently offer DP can add the standalone CP by offering at least two DP courses along with the other CP requirements. Schools currently offering the DP can add the CP with an expedited authorization process. In 2017, the number of CP schools increased from three to four. Fridley High School was authorized and began offering the CP to their junior students. This makes Fridley a four-programme IB Continuum school district. Only Minneapolis has the same distinction in Minnesota.
See Appendix D for a list of Minnesota International Baccalaureate World Schools.

Rigorous Course Taking 14
The IB programs in Minnesota have evidenced overall growth in the past six years in the numbers of students of color (70 percent increase) and low-income students (53 percent) taking IB exams. The following charts detail participation and exams in IB programs over the last six years.
IB Funding FY 11 FY 12 FY 13 FY 14 FY 15 FY 16 FY 17
Schools Funded 65 60 56 53 64 65 65
Career-related Program (CP) -- -- -- -- 2 3 4
Diploma Program (DP) 21 21 20 20 20 20 20
Middle Years Program (MYP) 22 21 15 18 18 18 22
Primary Years Program (PYP) 22 18 15 20 20 24 23
Total DP Schools Testing 19 21 20 20 20 20 20
IB Exams FY 11 FY 12 FY 13 FY 14 FY 15 FY 16 FY 17
Total Students Taking Exams 2,602 2,799 3,150 3,553 3,599 3,462 3,994
Percent Increase Students 12% 8% 12% 11% 1% -4% 15%
Total Exams Taken 5,402 6,144 7,373 7,577 7,698 8,024 8,065
Percent Increase Exams 9% 14% 20% 3% 2% 4% 1%
Students of Color (SOC) 932 996 1,194 1,394 1,206 1,306 1,581
SOC Exams Taken 1,794 2,243 2,612 2,819 2,533 2,945 3,433
Low-Income Students 767 808 622 1,102 1,110 1,003 1,177
Low-Income Exams Taken 1,578 1,769 2,242 2,230 2,431 2,202 1,376
Average Exams per Student 2.3 2.2 2.3 2.1 2.1 2.3 2
IB Passing Exams FY 11 FY 12 FY 13 FY 14 FY 15 FY 16 FY 17
Percent of Minnesota Scores 4 or above (Range 1-7)
64% 58% 53% 63% 57% 54% 54%
Percent of National Scores 4 or above (Range 1-7) 71% 74% 79% 74% 57% 74% 74%
Diplomas Earned 173 191 287 222 197 204 193
IB Teacher Training FY 11 FY 12 FY 13 FY 14 FY 15 FY 16 FY 17
Out-of-State 305 292 328 214 318 351 289
Minnesota 967 934 907 737 767 587 838
Online Training 22 28 36 19 22 29 36
Total Teacher Training 1,294 1,254 1,271 970 1,107 967 1,163

Rigorous Course Taking 15
The following chart illustrates IB exam participation trends by students of color, which include American Indian, Asian/Pacific Islander, Black/African American, Latino/Hispanic and Multi-Racial.
See Appendix C: International Baccalaureate World Schools Reimbursements FY 2017.

Rigorous Course Taking 16
The following chart provides a breakdown by student groups of both student participation and the number of exams taken over the last six years. Of note are increases in total participation by students (54 percent), and the number of exams taken (61 percent); with the greatest increase in the Hispanic (160 percent) and exams (206 percent), Black/Non-Hispanic (105 percent) and exams (126 percent), American Indian (54 percent) and exams (71 percent), and Asian/Pacific Islander (39 percent) and exams (58 percent).
IB Student Groups FY 11 FY 12 FY 13 FY 14 FY 15 FY 16 FY 17 Percent Increase
(2011-17)
American Indian 13 12 21 21 22 12 20 54%
Exams 28 31 42 35 40 26 48 71%
Asian/Pacific Islander 456 461 495 596 537 547 632 39%
Exams 898 1,051 1,038 1,220 1,124 1,303 1,421 58%
Black/Non-Hispanic 240 238 366 390 359 416 493 105%
Exams 450 528 851 768 732 898 1,015 126%
Hispanic 141 178 208 297 288 284 367 160%
Exams 258 397 476 597 637 607 789 206%
Multi-Racial (two or more races)
-- -- -- -- -- 47 69 --
Exams -- -- -- -- -- 111 153 --
Other 82 107 104 88 107 -- 3 --
Exams 160 236 205 195 210 -- 4 --
Not Stated 1 0 0 2 162 9 -- --
Exams 0 0 0 4 281 9 -- --
White/Non-Hispanic 1,669 1,803 1,956 2,159 2,176 2,417 2,411 44%
Exams 3,608 3,901 4,761 4,758 4,674 5,079 5,257 46%
Total Students 2,602 2,789 3,150 3,553 3,651 3,462 3,995 54%
Percent Increase Students 12% 7% 13% 11% 3% -5% 15% --
Total Exams 5,402 6,144 7,373 7,557 7,698 8,024 8,691 61%
Percent Increase Exams 9% 9% 20% 2% 2% 4% 1% --
Note: Beginning with the 2015-16 school year, the collection and reporting of race/ethnicity was updated to align with U.S. adding Multi-Racial as a choice of race/ethnicity.

Rigorous Course Taking 17
International Baccalaureate Exam Profile
An IB Exam score of four or higher can translate into college credit once a student enters a postsecondary program. Minnesota data indicates annual increases in exam participation along with an overall growth in numbers of exams scoring four or higher. The chart below shows the comparison of total number of IB exams taken with IB exam scores of four or higher.
Minnesota data has shown consistent improvement over time in the performance of low-income students on their exams. Low-income participants include those students who were identified as meeting the federal guidelines for free or reduced-price lunch. On a scale of 1-7, passing scores are 4 or higher. The chart below disaggregates the passing scores on exams by student groups and income level in 2017.
IB Exam Scores of 4+
4 5 6 7 Total
Asian/Pacific Islander 343 165 38 14 560
Black 209 114 24 9 356
Hispanic 160 115 74 19 368
American Indian 7 7 3 0 17
Multi-Racial 38 27 15 1 81
White 1,415 1,283 499 73 3,270
Total 2,172 1,711 653 116 4,647
Low-income 555 267 89 20 931
Non-low-income 1,617 1,444 564 96 3,721

Rigorous Course Taking 18
Teacher Training and Exams: Advanced Placement and International Baccalaureate
During the 2016-17 fiscal year, in-depth teacher training was conducted by certified AP and IB trainers and providers. The training, provided through the College Board (AP) and International Baccalaureate (IB), is designed to prepare teachers to deliver rigorous college-level curriculum in the secondary setting and challenging academic experiences in the middle and primary grades.
In support of Advanced Placement, MDE has worked with the College Board, Minnesota Advanced Placement Advisory Board (MnAPAC), Augsburg University and Carleton College to facilitate in-depth training for AP teachers. In the summer of FY 2017, Carleton trained 355 teachers and Augsburg trained 64 teachers during the Advanced Placement Summer Institutes. Twenty-nine AP teachers received out-of-state training. In addition, 486 teachers participated in professional development for the AP program. In total 934 participants took part in these opportunities funded through this legislative appropriation.
MDE’s support of IB teacher training is conducted through coordination with the IB, the IB Americas, and the Minnesota Association of IB World Schools (MNIB). IB teacher training is primarily offered at out-of-state sites. During 2017, out-of-state IB training was attended by 289 teachers, and 838 teachers participated in workshops and professional networking opportunities coordinated by the Minnesota Association of IB World Schools. In addition, special on-site trainings were offered in partnerships with specific districts and the International Baccalaureate. Thirty-six teachers participated in online training. A total of 1,163 participants attended some form of professional development for the IB program.
AP and IB exam fees for public and non-public students are subsidized by legislative action. Specific direction is given to require the state to pay all exam fees for low-income students. Combining the two programs, 49,342 students took 82,250 AP and IB exams in Minnesota in 2017, an increase of 4 percent in participating students, and 4 percent in number of exams taken. Schools reported 5,385 of participating students qualified as low-income and accounted for 11 percent of participating students. In 2017, participation by students of color increased 10 percent from 2016 and accounted for 24 percent of total participants. Minnesota is continuing to close the opportunity gap for underrepresented students in these programs.

Rigorous Course Taking 19
Expenditures: Advanced Placement and International Baccalaureate
Since 2006, the Legislature has appropriated $4,500,000 each year, to fund the costs of student exam fees and teacher training, with 75 percent of the appropriation designated for AP programs and 25 percent designated for IB programs. Additionally, at least $500,000 each year is to be used to support teacher training in AP and IB programs. Minnesota Statutes, section 120B.13 also directs the commissioner to pay all AP and IB exams fees for low-income students and to pay a portion of the exam fees for other public and non-public students. MDE was directed to work in consultation with the Minnesota AP Advisory Council and the Minnesota Association of IB World Schools to determine the manner in which the allocated funding would be distributed.
In 2017, AP Teacher Scholarships were available up to $700 for in-state teacher training and up to $900 for out-of-state training. Scholarships subsidize costs related to tuition, travel, room and board for AP teachers who attended training. The following criteria are used to determine out-of-state travel for AP: (1) training was not available in Minnesota or (2) dates at Carleton or Augsburg were not feasible for participants. Actual expenditures for AP teacher training and support programs were $379,036.
International Baccalaureate teacher training in 2017 was offered both in-state and out-of-state. In-state support programs and workshops were offered through the Minnesota Association of IB World Schools and attended by 571 teachers. Official IB teacher trainings were offered in Minnesota and attended by 267 teachers. IBO official trainings were also offered outside of Minnesota, and attended by 289 teachers. Actual expenditures for IB teacher training were $311,456.
AP Exam fees were subsidized at a rate of $53 per student, per exam for students of low-income families applying for fee reductions that are provided by the College Board. Other students were subsidized at a rate of $40 per student, per exam. Schools use free and reduced-price lunch eligibility as the criteria for determining low-income students who qualify for the fee reduction. The College Board provided the $31 fee reduction and the school is expected to waive the $9 fee for low-income students. Actual expenditures for AP exams in 2017 were $3,003,454.
IB Exam fee subsidies for low-income students (based on eligibility for free or reduced-price lunch) were subsidized at the full cost of $284 for the first exam and full cost of $116 for each additional exam per student. All other student exams were funded at $80 for the first exam and $20 for each additional exam. Actual expenditures for IB exams in 2017 were $813,544.
The payment schedule for exams has varied over time. The state distributes reimbursements to all AP and IB schools for exams and teacher training after exams have been ordered and teacher training has been completed. Schools must submit an application for reimbursement to apply for subsidies and then submit a copy of their Invoice to MDE. The budget for FY 2017 was $4,500,000. Actual expenditures for exams and teacher training for AP were $3,382,490 and $1,125,000 for IB, bringing the total expenditures for FY 2017 to $4,507,490.

Rigorous Course Taking 20
AP and IB Program Allocations and Combined Expenditures (2011-2017)
AP and IB FY 11 FY 12 FY 13 FY 14 FY 15 FY 16 FY 17
Program Allocations
4.5M 4.5M 4.5M 4.5M 4.5M 4.5M 4.5M
Teacher Training $980,384 $769,541 $642,732 $503,950 $663,209 $676,303 $403,350
Student Exam Subsidies
$3,363,533 $3,825,070 $4,109,130 $3,936,830 $3,719,511 $3,611,738 $3,816,998
Support Programs $115,580 $82,950 $80,100 $19,500 $157,000 $112,495 $287,142
Total Expenditures $4,459,497 $4,677,561 $4,831,962 $4,460,280 $4,539,720 $4,400,536 $4,507,490
AP Program Expenditures and Exam Costs (2011-2017)
AP Program Expenditures
FY 11 FY 12 FY 13 FY 14 FY 15 FY 16 FY 17
Teacher Training $443,405 $380,536 $242,972 $178,100 $281,200 $275,693 $277,350
Support Programs $75,950 $82,950 $80,100 $19,500 $97,055 $112,495 $101,686
Total teacher Training
$519,356 $463,486 $323,071 $197,600 $378,255 $388,188 $379,036
AP Exam Cost $87 $89 $89 $89 $91 $92 $93
Minnesota Payment/Exam
$50 $50 $50 $50 $40 $40 $40
Low-income Payment/Exam
$57 $53 $53 $53 $53 $53 $53
Public Exam Subsidies
$2,482,379 $2,718,609 $2,946,338 $2,774,604 $2,674,977 $2,565,091 $2,681,476
Nonpublic Exam Subsidies
$303,554 $341,104 $348,276 $347,710 $310,359 $312,060 $321,978
Total Exam Expenditures
$2,785,933 $3,059,713 $3,294,614 $3,936,830 $2,985,336 $2,877,151 $3,003,454
Total Expenditures $3,305,288 $3,523,199 $3,617,685 $4,134,430 $3,363,591 $3,265,339 $3,382,490

Rigorous Course Taking 21
IB Program Expenditures and Exam Costs (2011-2017)
IB Expenditures FY 11 FY 12 FY 13 FY 14 FY 15 FY 16 FY 17
Teacher Training $576,609 $389,005 $319,661 $296,165 $441,954 $390,413 $126,456
Support Programs $39,630 -- -- -- $59,945 -- $185,456
Total teacher Training
$576,609 $389,005 $319,661 $303,790 $441,954 $390,413 $311,456
IB Exam Cost per First/Second Exam
$237/$96 $245/$100 $255/$104 $265/$108 $270/$110 $277/$113 $284/$116
Minnesota Payment per First/Second Exam
$150/$50 $160/$65 $160/$65 $85/$20 $85/$25 $85/$25 $80/$20
Low-income First/Second Exam Payment
$237/$96 $245/100 $255/104 $265/$108 $270/$110 $277/$113 $284/$116
DP Student Exam Subsidies
$577,600 $765,357 $814,516 $814,516 $734,175 $734,587 $813,544
Total Expenditure $1,154,209 $1,154,362 $1,134,176 $1,118,306 $1,176,129 $1,125,000 $1,125,000

Rigorous Course Taking 22
College Credits and Policies
Participating colleges in more than 30 countries receive AP grades and grant credit or appropriate placement to students who have done well on AP examinations. The IB Diploma is accepted as an admissions credential at more than 1,000 North American colleges and in more than 100 countries.
More than 90 percent of U.S. colleges and universities have an AP and IB policy granting incoming students academic credit, placement or both, for qualifying grades on AP or IB exams. Most public and private institutions in Minnesota have AP and IB credit policies. These courses are equivalent to college freshman-level courses and with enough qualifying grades, students often enter college with a sophomore-level standing.
As articulated in Minnesota Statutes, section 120B.13, subdivision 3a:
The colleges and universities of the Minnesota State Colleges and Universities system must award, and the University of Minnesota and private postsecondary institutions are encouraged to award, college credit to high school students who receive a score of three or higher on an advanced placement or four or higher on the international baccalaureate program examination.
Minnesota State Colleges and Universities (Minnesota State) has adopted a policy establishing common practices among higher education institutions for awarding credit for scores of three-five in AP and scores of four-seven in IB. In Minnesota, 61 colleges and universities acknowledge Advanced Placement exam scores and 47 colleges and universities acknowledge International Baccalaureate exam scores. Large numbers of Minnesota high school graduates who participate in the AP and IB Programs are attending colleges out of state.
In May 2017, 45,348 students took 73,559 AP exams with 48,496 AP exams (or 66 percent) earning a score of three or above on a five-point scale, indicating proficiency. If all students who earned a score of three or above and were awarded credit by their postsecondary institution, the resulting value to Minnesota families through credits earned at Minnesota postsecondary institutions is potentially $25,896,864 at Minnesota State Colleges (average $178/credit x 3 credit course x 48,496), $38,845,296 Minnesota State Universities (average $267/credit x 3 credit course x 48,496), and $68,524,848 University of Minnesota (average $471/credit x 3 credit course x 48,496).
In 2017, 62 public and non-public schools provided IB programs. In 2017, 3,995 students took 8,691 IB exams with 4,652 (or 54 percent) earning a score of four or above on a seven-point scale, indicating proficiency. If all students who took IB courses, earned a score of four or above on the IB exams, and were awarded credit by their postsecondary intuition, the resulting value to Minnesota families through credits earned at Minnesota postsecondary institutions is potentially $2,484,168 at Minnesota State Colleges (average $178/credit x 3 credit course x 4,652), $3,726,252 at Minnesota State Universities (average $267/credit x 3 credit course x 4,652), and $6,573,276 at the University of Minnesota (average $471/credit x 3 credit course x 4,652).

Rigorous Course Taking 23
Administration: AP and IB Programs
MDE is responsible for the administration of AP and IB program components as funded by legislation. The intent of the legislated funding is to assist public and non-public students in paying for AP and IB exam fees as well as providing essential teacher training for both programs.
MDE Staff Responsibilities:
• Communicate opportunities for exam fee subsidies to all Minnesota schools and students; • Gather data from individual public and non-public schools regarding their AP and IB programs, including
the number of students tested, exams taken, courses offered and teachers teaching an AP or IB course; • Work with the College Board to create invoice forms for payment of AP fees; • Work with the public and non-public schools to pay for exam fees for all AP and IB exams; and, • Prepare documentation to provide direct payment of exam subsidies to AP and IB districts. • Assist in the development, promotion, and evaluation of the teacher trainings. • Work with the College Board and MNIB to support teachers and provide follow-up to training
experiences. • Process reimbursements for out-of-state and in-state training opportunities attended by educators. • Process reimbursements to school districts for student exam fees. • Prepare and maintain the AP and IB budgets; • Prepare annual reports to the Legislature and respond to legislative inquiries; • Work with Minnesota public and private universities and colleges to prepare credit policies for courses
earned through Advanced Placement and International Baccalaureate Exams; • Provide information and present at conferences about these programs to groups of interested parents,
educators and students; • Respond to phone and email requests from program coordinators, teachers, parents and students; • Communicate regularly with AP and IB coordinators regarding program information, application
reimbursement processes for exams and teacher training and payments to their school or district; • Maintain update information via MDE website, outreach events, statewide conferences and workshops;
and, • Gather and report data to the media, higher education, secondary schools, and other organizations
regarding student participation and performance in AP and IB programs.

Rigorous Course Taking 24
Recent Trends: AP and IB Programs
1. Increasing alignment and rigor in courses prior to High School
In an effort to increase the number of underrepresented and first generation college-going students enrolling in and succeeding in postsecondary opportunities, students need preparation for and access to rigorous college-level work while still in high school. Additionally, students in middle school or earlier need access to support programs designed to motivate and prepare them for these courses. Minnesota school districts are increasing their efforts to offer aligned programs designed to enhance critical knowledge and thinking skills at the middle level or earlier. International Baccalaureate offers the middle years (MYP) and the primary years programs (PYP), while the College Board has developed both curriculum (Springboard) and assessments (AP-Potential) designed to support and identify students with the potential to succeed in rigorous courses. An increasing number of Minnesota districts and teachers are participating in professional development opportunities (Pre-AP) that intend to support vertical teaming and enhance the critical thinking skills required for student success in these courses and at the postsecondary level. In 2017, 31 percent more Minnesota students took 32 percent more exams than Minnesota students did in 2011. Additionally many districts are adding courses and programs designed to address college knowledge, skills and behaviors at the middle level. Examples include the AVID program–Advancement Via Individual Determination Approaches to Learning and Ramp Up to Readiness.
2. Promoting equity in rigorous courses
Both the AP and the IB programs are committed to increasing student diversity in rigorous classrooms while simultaneously increasing their success. Although progress has been made to close equity gaps in participation and success among underserved minority and low-income students, challenges remain in Minnesota. The number of passing exams continues to increase along with increased participation of students of color. In 2017, our data continues to indicate that more overall students of color are participating in these programs, but their participation numbers are not yet representative of their numbers in our overall population. We have made continued strong progress as a state. Experts generally conclude that AP exam fee reductions are an effective way to increase the number of test-takers and tests taken per student.
3. Funding
Minnesota’s legislative appropriation has provided critical support for the AP and IB programs. Projecting for 2018 and beyond, the continued growth in exam taking and increasing number of students engaged in both AP and IB will need continuing support; however, the appropriations for these programs remains flat. The amount available for individual exam reimbursements continues to decrease as the number of student exams increases, potentially impacting student participation.
During 2009-2013, a federal Advanced Placement Incentive Program grant has allowed Minnesota to build an access and equity website (www.readysetgomn.org). This site is designed to utilize the power of technology to inform, support, and engage underrepresented students and their families in participating and succeeding in rigorous courses and postsecondary opportunities. MDE continues to expand resources available and the use of this site, utilizing digital tools to increase the participation of all students in courses preparing them and leading to postsecondary and career success.

Rigorous Course Taking 25
Recommendations: Advanced Placement and International Baccalaureate
As the AP and IB programs in Minnesota continue to expand, there is an ongoing need to provide challenging learning opportunities for all learners; to support teachers delivering this level of program rigor; and to encourage schools to initiate, sustain and/or expand AP and IB programs. Challenging, rigorous learning opportunities are essential to preparing students for success in postsecondary institutions, and ensuring career and college readiness. State accountability requires public reporting for student achievement, but in addition, Minnesota is reporting advanced academic opportunities, including AP and IB course information.
Specific recommendations for enhancing AP and IB programs in Minnesota include:
• Maintain and increase legislative support for student exams and teacher training; • Utilize MDE’s working relationship with the College Board and International Baccalaureate Organization
to maximize opportunities for Minnesota students and families; • Increase access to AP and IB courses among students in rural communities through regionally based and
online teacher training opportunities; • Expand efforts to address the specific needs of underrepresented students, particularly American Indian,
African American and Hispanic males, through small, grant-based pilot programs and outreach to parent and community groups;
• Foster growth in Pre-AP and IB middle year and primary year programs; • Increase offerings that prepare teachers for delivering rigorous courses; • Support the development and expansion of AP and IB online courses and digital technology training to
enhance face-to-face courses; • Focus on increased student achievement and access to both programs. • Support middle level and earlier programs designed to prepare all students for success in high school
and beyond. • Support the development and expansion of IBCP to leverage IBDP and Career and Technical Education
learning opportunities, and to establish another pathway option for students. • Support the elimination of entrance criteria to participate in AP or IB courses. • Support more program redesign and course option efforts at the local-level to leverage limited
resources to meet both student and community workforce needs. • Support the use of rigorous course offerings to support critical goals in local World’s Best Workforce
(WBWF) plans to help eliminate the achievement gap, increase graduation rates and ensure career and college readiness.

Rigorous Course Taking 26
Postsecondary Enrollment Options Program Description
In 1985, Minnesota became the first state in the nation to pass legislation to support course taking at the postsecondary level by eligible high school juniors and seniors. The Postsecondary Enrollment Options (PSEO) program in Minnesota allows high school students to enroll in courses taught by college instructors on college campuses with each participating postsecondary institution setting its own enrollment requirements for admission. The program provides students with a greater variety of class offerings and the opportunity to pursue more challenging coursework than may be available at the high school. Students may enroll on a part-time or full-time basis. PSEO allows high school students to earn college credit at no cost and, after graduation from high school, to potentially enter into postsecondary institutions with some course requirements already met. The postsecondary institutions generate a separate college transcript with their college courses and grades for the participating high school students. Legislation allows eligible 10th-grade students to enroll initially in one Career and Technical Education (CTE) course through PSEO. If the student earns a “C” or higher grade in this first course, she/he is eligible to take additional CTE courses while in 10th grade. In order to be eligible, a 10th-grade student must have taken the eighth-grade MCA reading test in the eighth-grade, and have met the composite proficiency level of “meets or exceeds.” If a student did not take the eighth-grade MCA, the postsecondary institution may accept another test score.
Any public, nonpublic, home school or American Indian-controlled tribal contract or grant student classified as an 11th- or 12th-grader and accepted by a postsecondary institution may enroll either full- or part-time in nonsectarian courses or programs at that postsecondary institution. Students participating in cultural exchange programs are not eligible.
Eligible institutions include the University of Minnesota and its branches; all state universities, community colleges and technical colleges; private, Minnesota, two- or four-year, residential, degree granting, liberal arts colleges; non-profit, degree granting trade schools; or accredited opportunities industrialization centers in Minnesota.
The PSEO program is funded through legislative direction under Minnesota Statutes, section 124D.09. There is no cost for students to participate in this program. PSEO funding from the state that flows through MDE pays for tuition, fees and required textbooks at the postsecondary institution when students participate in PSEO. Funds are available to help pay transportation expenses for PSEO students whose families are at or below the poverty level, as determined by the federal government, to participate in PSEO courses on college campuses.
PSEO State-Approved Early/Middle College Programs
Subdivision 9 of Minnesota Statutes, section 124D.09 legislation provides the opportunity to use PSEO funding for developmental coursework when a student who is enrolled in the graduation incentives program enrolls full-time in an Early/Middle College Program. This program model is a partnership between a State-Approved Alternative Program (SAAP) and an eligible postsecondary institution, which is specifically designed to offer well-defined pathways to postsecondary degrees and/or credentials. Students engaged in these programs are able to earn dual credit with intentional academic and wraparound supports offered by the partnership.
The first eight of these Early/Middle College models were implemented in 2014-2015. More partnerships are forming across the state each year, and the numbers have grown from 27 in FY 2016, to 39 in FY 2017 with 65 program approvals for 2017-2018.

Rigorous Course Taking 27
The Minnesota Department of Education works closely with Minnesota State Colleges and Universities (Minnesota State) to assist and support approved Early/Middle College programs with implementation through annual workshops and webinars. The Midwest Research and Education Laboratory (REL) conducted focus group interviews with approved 2015-16 partnerships to provide information to the Minnesota Department of Education on the early success and challenges of these programs. In 2016, REL Midwest and Twin Cities Public Television co-produced a documentary, Back on Track: Journeys to a High School Degree, which portrays the impact of these new programs on students.
See Appendix E for a list of State-Approved Early/Middle College Programs FY 2017.

Rigorous Course Taking 28
Postsecondary Enrollment Options Program Participation
Sixty-two Minnesota colleges and universities participated in PSEO during the 2016-17 school year. Participation in PSEO by public high school students has gradually increased 25 percent between FY 2011 and 2017; low-income enrollment has grown by 69 percent, and accounts for almost 23 percent of participants. The chart below shows total number of public school students participating in PSEO by gender, students of color, and low-income students.
PSEO Participants FY 11 FY 12 FY 13 FY 14 FY 15 FY 16 FY 17 Percent Increase
(2011-17)
Female 3,912 4,216 4,615 4,675 5,113 5,551 4,958 27%
Male 1,932 2,137 2,300 2,354 2,655 2,724 2,364 22%
Special Education 158 160 170 189 176 196 201 27%
English Learners 78 70 59 47 80 106 123 58%
Free/Reduced-Price Eligible 992 1,139 1,319 1,371 1,676 1,873 1,680 69%
Students of Color 952 1,023 1,197 1,290 1,646 1,982 1,784 87%
Public School Students Only 5,844 6,353 6,915 7,029 7,768 8,275 7,322 25%
In the past six years, participation in PSEO by students of color have increased by 87 percent since 2011, and these students account for only 24.3 percent of the total participants. The following chart illustrates PSEO participation trends by students of color, which include American Indian, Asian/Pacific Islander, Black/African American, Latino/Hispanic and Multi-Racial.

Rigorous Course Taking 29
In 2016-17, participation in PSEO by black students increased by 116 percent since 2011. Participation in PSEO by Hispanic students has significantly increased by 202 percent. Participation in PSEO by American Indian students increased by 151 percent. The following chart details the increase in PSEO participation since 2011 by student groups.
PSEO Student Groups FY 11 FY 12 FY 13 FY 14 FY 15 FY 16 FY 17 Percent
Increase (2011-17)
American Indian 47 60 63 78 107 132 118 151%
Asian/Pacific Islander 452 473 498 578 714 736 575 27%
Hispanic 132 156 226 226 301 384 399 202%
Black 321 334 410 408 524 730 692 116%
White 4,892 5,330 5,718 5,741 6,122 6,293 5,538 13%
Total Students 5,844 6,353 6,915 7,029 7,768 8,275 7,322 25%
Minnesota statute appropriates funding for public, private and homeschooled students to participate in PSEO. In 2016-17, the average reimbursement per enrolled student was $3,170, or $198/credit. This has increased a small amount since 2010-11, when the average reimbursement was $2,971 per student, or $180/credit. In 2017, public school students accounted for 71.6 percent of those enrolled in PSEO, homeschooled students were 17.8 percent of enrollees, and nonpublic/private school students made up 10.4 percent of the PSEO population.
Fiscal Year
Traditional (Nonpublic/private)
Home School
Public Total Average Credits Per Participant
Amount Paid to PSEO Institutions
FY 11 733 1,476 5,844 8,263 16.55 $24,548,954.00
FY 12 726 1,503 6,353 8,582 16.58 $25,520,262.04
FY 13 762 1,702 6,712 9,176 16.55 $27,872,659.00
FY 14 787 1,697 6,794 9,278 16.67 $28,820,576.00
FY 15 759 1,842 7,575 10,176 16.43 $31,817,630.00
FY 16 908 1,799 8,103 10,810 16.05 $33,739,855.51
FY 17 1,042 1,779 7,118 9,939 15.96 $31,510,869.10

Rigorous Course Taking 30
The table below outlines participation in the last six years among eligible Minnesota postsecondary institutions, with technical colleges evidencing the greatest growth at 73 percent, followed by community and technical colleges with a 69 percent increase. Considering increases in enrollment and tuition, reimbursements to postsecondary institutions have increased 28 percent over the past six years. The following table shows the increases in PSEO reimbursements from 2011 to 2017 by institution type.
PSEO Reimbursement by Institution Type
FY 11 FY 12 FY 13 FY 14 FY 15 FY 16 FY 17 Percent Increase (2011-17)
Technical Colleges $1,338,694 $1,294,860 $1,587,160 $1,838,069 $1,856,469 $1,934,185 $2,311,704.00 73%
State Community Colleges
9,558,870 9,972,326 10,513,542 10,468,211 11,644,226 $11,398,842 $8,770,970.40 8%
State Universities $1,617,207 $1,827,141 $2,053,673 $1,986,970 $2,063,505 $2,331,948 $2,342,685.60 45%
University of Minnesota and Campuses
$2,705,042 $2,649,064 $3,102,239 $2,721,977 $2,767,007 $3,086,646 $2,644,557.60 2%
Private Colleges $4,091,442 $4,243,002 $4,590,918 $5,278,832 $5,799,849 $5,750,453 $6,565,716.00 60%
Community and Technical Colleges
$5,237,698 $5,533,870 $6,025,133 $6,526,513 $7,686,574 $9,237,780 $8,875,235.50 69%
Total $24,548,954 $25,520,262 $27,872,659 $28,820,576 $31,817,630 $33,739,855 $31,510,869.10 28%
See Appendix F for postsecondary enrollment by institutions and the total number of credits and expenditures FY 2017.

Rigorous Course Taking 31
Recommendations: Postsecondary Enrollment Options (PSEO) Program
• Continue to provide information to students about Minnesota Statutes, section 124D.09, subdivision 7 which requires that by March 1 of each year, a district must provide up-to-date information on the district's website and in materials that are distributed to parents and students about the program, including information about enrollment requirements and the ability to earn postsecondary credit to all pupils in grades eight, nine, ten and eleven.
• Encourage students entering grade 10 to participate in PSEO career and technical education courses. Research on the impact of the expansion of PSEO into 10th grade is needed to help inform additional programming.
• Continue to provide information via MDE’s Postsecondary Enrollment Options (PSEO) page, MDE’s Superintendent Mail and MDE’s Concurrent Enrollment page.
• Provide information to students enrolled in State Approved Alternative Programs about the opportunity to participate in PSEO via Early/Middle College Programs.
• Continue outreach via family engagements events, statewide conferences and workshops. • Provide workshop and training opportunities to State-Approved Alternative Programs and
postsecondary institutions to promote and sustain Early/Middle College partnerships.

Rigorous Course Taking 32
Concurrent Enrollment Program Description
Concurrent enrollment serves public high school students enrolled in a postsecondary course taught during the regular school day and offered through a partnership between a high school and a college or university. Qualified high school instructors or college faculty teach the courses, which are offered at the secondary school or another location, according to an agreement between a public school board and the eligible postsecondary institution (Minnesota Statutes, section 124D.091, subdivision 10). The same assessment methods and content are used as the equivalent sections taught on the college campus. Students can earn high school and college credit upon successful completion of the course or courses. Students earn a grade based on their work over the entire term of the course and on multiple and varied assessments. College/university credit is granted for successful completion of the course, rather than on the results of a single high-stakes test.
Oversight and Funding
Accreditation of postsecondary institutions through the Higher Learning Commission (HLC) and the National Alliance for Concurrent Enrollment Partnerships (NACEP) set standards for quality and rigor in Minnesota concurrent enrollment programs. These accrediting bodies ensure that concurrent enrollment courses offered in high schools are the same courses that are offered on the sponsoring postsecondary institution campus and that students in the high schools are held to the same academic standards as students on campus. NACEP Accreditation Standards and HLC Accreditation Criteria are similar and cover areas such as teacher credentials and preparation, rigor of courses and curricular standards, expectations for student learning and learning outcomes, access to learning resources, and monitoring and oversight. NACEP accreditation also requires program evaluation and student surveys to monitor transferability of credits earned through concurrent enrollment. Learn more about Minnesota Transfer Curriculum (MnTC).
The state reimbursement provides funding to districts to help defray the cost of offering college and/or university courses in high schools. Districts are eligible for concurrent enrollment aid if the partnering postsecondary institution is accredited by NACEP, in the process of being accredited, or provides clear evidence of comparable standards. The Minnesota Department of Education monitors compliance with this statute by requiring non-NACEP-accredited programs to sign a letter of assurances indicating the program meets this requirement and is an eligible institution as defined by Minnesota Statutes, section 124D.09, subdivision 2.
The concurrent enrollment appropriation supports funding of up to $150 per student, out of a four million dollar appropriation, to districts that offer a concurrent enrollment course according to an agreement under Minnesota Statutes, section 124D.09, subdivisions 10 and 16. Reimbursements are pro-rated based on total concurrent enrollment participation across the state. In FY 2017, the pro-rated reimbursement was $54.01/student/course.
Teacher credentials and preparation
By requiring that concurrent enrollment programs be NACEP-accredited or meet comparable standards, the state requires that concurrent enrollment teachers be “approved by the respective college/university academic department and meet the academic department’s requirements for teaching the college/university courses.” Accredited programs or those meeting comparable standards must also provide “annual discipline-specific professional development activities and ongoing collegial interaction to address course content, course delivery, assessment, evaluation, and/or research development in the field.” The Higher Learning Commission also

Rigorous Course Taking 33
expects that postsecondary institutions require “the same level of credentials and qualifications for faculty in dual credit courses or programs that it does for its regular higher-education courses.”
The HLC determines the criteria for faculty qualifications including high school teachers teaching Concurrent Enrollment. For more information, read HLC’s 2017 updated guidelines Determining Qualified Faculty Through HLC’s Criteria for Accreditation and Assumed Practices. Visit HLC’s website to access additional resources on determining qualified faculty
Transferability of credits
The transferability of credits to other postsecondary institutions is determined by the receiving postsecondary institution. The Minnesota Transfer Curriculum is comprised of general education courses reflecting competencies adopted by the public higher education entities in Minnesota.
• Each system college and university shall implement the Minnesota Transfer Curriculum as appropriate to its academic certificates, diplomas, and degrees consistent with criteria specified in Procedure 3.36.1 Academic Programs.
• Each system college and university shall adopt a policy to implement the Minnesota Transfer Curriculum consistent with Board of Trustees' policies and Chancellor's procedures.
• Each receiving system college and university shall accept a Minnesota Transfer Curriculum course, goal area, or the entire curriculum as determined and documented by the sending system college or university.
• Each receiving system college and university shall accept the entire Minnesota Transfer Curriculum as determined and documented by the University of Minnesota.
For more information regarding transferability of credits policy:
Minnesota State Colleges and Universities Transferability of Credits Policy (http://www.minnstate.edu/board/procedure/337p1.html)
University of Minnesota Transferability of Credits Policy (http://policy.umn.edu/education/degreerequirement)
Rigorous Course Taking 34
Additional concurrent enrollment programs, involving active partnerships and agreements between high schools and postsecondary institutions, are occurring across the state. The programs which have not requested state funding, are not included or counted in this report.
Concurrent Enrollment (CE) Program Participation
In 2016-17, 319 districts and charter schools offered 74,059 concurrent enrollment courses to 31,971 students through 38 Minnesota colleges and universities for 255,527 college credits. CE participation by public school students has gradually increased between FY 2011 and 2017. The following table details CE program participation of public high school students eligible for aid between FY 2011 and 2017. Of note are increases in total participation by students (58 percent); with the greatest increase in students of color (184 percent), followed by English Learners (105 percent), Special Education (98 percent), and low-income students (81 percent).
Concurrent Enrollment Eligible for Aid
FY 11 FY 12 FY 13 FY 14 FY 15 FY 16 FY 17 Percent
Increase (2011-17)
Female 11,860 12,553 13,764 14,121 15,522 17,542 18,323 54%
Male 8,422 9,142 9,785 10,610 11,776 12,705 13,648 62%
Special Education 329 391 392 404 518 603 652 98%
English Learners 91 73 66 82 171 168 187 105%
Free/Reduced-Price Eligible 3,204 3,495 3,859 4,309 4,928 5,408 5,793 81%
Students of Color 1,781 1,911 2,368 2,749 3,474 4,151 5,059 184%
Public School Students Only 20,282 21,695 23,548 24,731 27,298 30,247 31,971 58%

Rigorous Course Taking 35
In the past six years, participation in CE by students of color have increased by 184 percent; although these students account for only 15.8 percent of the total participants. The following chart illustrates CE participation trends by students of color, which include American Indian, Asian/Pacific Islander, Black/African American, Latino/Hispanic and Multi-Racial.
In 2016-17, the total number of students participating in CE increased 6 percent; from 30,247 to 31,971. Participation in CE by black students has significantly increased by 257 percent since 2011. Participation by Hispanic students significantly increased by 204 percent. Participation in CE by American Indian students has increased by 62 percent. The following table details the increases in CE participation since 2011 by student groups.
Concurrent Enrollment Student Groups
FY 11 FY 12 FY 13 FY 14 FY 15 FY 16 FY 17 Percent Increase (2011-17)
American Indian 202 239 254 237 294 342 328 62%
Asian/Pacific Islander 764 810 1,019 1,175 1,383 1,617 2,045 168%
Hispanic 424 432 552 678 939 1,043 1,291 204%
Black 391 430 543 659 858 1,149 1,395 257%
White 18,501 19,784 21,216 22,007 23,824 26,096 26,912 45%
Total Students 20,282 21,695 23,548 24,731 27,298 30,247 31,971 58%
See Appendix G for Concurrent Enrollment Aid by District and total Course Count, Credits and Expenditures

Rigorous Course Taking 36
Minnesota Statutes 2014, section 120B.13, subdivision 4, was amended to include the reporting of career and technical education courses offered as a concurrent enrollment course.
Career Technical Education (CTE) Concurrent Enrollment
In 2016-17, the total number of students participating in CTE CE increased 11 percent; from 3,933 to 4,385 from FY 2016. There were 4,385 students in 150 districts taking 5,792 CTE concurrent enrollment courses for 16,348 college credits. These students account for 13.7 percent of total participating CE students. The following table shows the comparison of CE eligible for aid participation in career technical education (CTE) CE courses and total count of overall CE participation from FY 2016 to FY 2017.
Concurrent Enrollment Eligible for Aid Participants
FY 16 CTE CE Only
FY 16 Total CE
FY 17 CTE CE Only
FY 17 Total CE
Female 2,044 17,542 2,204 18,323
Male 1,922 12,705 2,181 13,648
Special Education 233 603 217 652
English Learners 35 168 44 187
Free/Reduced-Price Eligible 971 5,408 1,060 5,793
Public School Students Only 3,966 30,247 4,385 31,917
Participation in CTE CE by black students accounts for 6.7 percent of total CTE CE participants, and 4.3 percent of total CE participants. Participation by Hispanic students accounts for 3.6 percent of CTE CE participants, and 4 percent of total CE participants. Participation by American Indian students accounts for 2 percent of CTE CE participants, and 1 percent of total CE participants. The following table shows the comparison of CE eligible for aid participation in CTE CE courses and total count of overall CE participation from FY 2016 to FY 2017 by student groups.
Concurrent Enrollment Eligible for Aid Student Groups
FY 16 CTE CE Only
FY 16 Total CE
FY 17 CTE CE Only
FY 17 Total CE
American Indian 103 342 92 328
Asian or Pacific Islander 172 1,617 225 2,045
Hispanic 123 1,043 161 1,291
Black 227 1,149 295 1,395
White 3,341 26,096 3,612 26,912
Total Students 3,966 30,247 4,385 31,971
See Appendix H for Concurrent Enrollment by Institutions and the total number of credits.

Rigorous Course Taking 37
Recommendations: Concurrent Enrollment Program
Concurrent enrollment is an increasingly popular option for Minnesota high schools seeking to offer postsecondary opportunities for their students on the high school campus. Greater efforts need to be made to increase the enrollment and success of students of color in these classes. The ability to offer high-quality, concurrent enrollment courses to high school students requires effective communication, targeted strategies and partnership between systems. Strategies to support and expand the necessary collaborative professional development between high school and postsecondary faculty should be sought. Additional efforts to promote and support these innovative initiatives are needed.
• Continue to require concurrent enrollment program administrators as well as appropriate system-level administrators from Minnesota State or the University of Minnesota to sign a letter of assurances indicating the program meets standards comparable to NACEP Accreditation Standards and Higher Learning Commission Accreditation Criteria in order to provide for greater oversight of non-NACEP-accredited concurrent enrollment programs. This mirrors NACEP’s accreditation process which requires official letters verifying compliance with certain standards.
• Convene a Concurrent Enrollment Advisory Board to develop recommendations for systematically addressing the shortage of high school teachers that currently meet the qualifications to teach college/university courses through concurrent enrollment. The board should include, at a minimum, representatives from graduate teacher programs, the Minnesota Board of Teaching, Minnesota State, University of Minnesota, concurrent enrollment programs, and Minnesota Concurrent Enrollment Partnerships (MnCEP).
• Provide increased funding for concurrent enrollment aid to the pro-rated reimbursement for districts, teacher training and credentialing.
• Ensure that eligibility criteria for participating in concurrent enrollment includes multiple indicators of a student’s ability to succeed in a postsecondary course or subject, rather than relying solely on indicators of overall academic standing such as GPA or class rank.
• Consider subject or course indicators that might include, for example, performance in prior related courses.
• Develop strategies and identify resources for high school teachers to obtain the HLC-required credentials to teach concurrent enrollment courses.
• Consider credit for prior learning, teaching and student performance to count as credit for teacher credentialing.

Rigorous Course Taking 38
Overall Findings: Dual Credit Programs in Minnesota
In 2016-17, total participation in dual credit programs increased 3.3 percent from 2015-16, while statewide high school enrollment increased slightly by 1.2 percent. AP and IB program participation (measured by the number of students taking exams) increased by more than 30 percent between 2011 and 2017. PSEO participation (measured by the number of students taking classes) increased over the same seven-year period (25 percent), from 5,844 to 7,322 public school students. Concurrent Enrollment also experienced an increase in participation (58 percent) between 2011 and 2017, from 20,282 to 31,971.
Although the percentage of students of color participation increased significantly in all programs, the percentages remained lower than the overall percentage of students of color in the state (31.5 percent). This was the case for AP (23 percent students of color in 2017), PSEO (24.3 percent in 2017), and Concurrent Enrollment (15.8 percent in 2017). The exception was IB, which had 39.5 percent students of color in the program in 2017.
As with racial diversity, socioeconomic diversity of participation for all of the programs increased significantly but remained at or below the average for the state. The average enrollment for the state was 38.5 percent in the Free and Reduced-Price Lunch program over the past six years. In 2016-17, the percentage of low-income student participation in AP was 9.2 percent, in IB – 29.4 percent, in PSEO – 22.9 percent, and in Concurrent Enrollment – 18.1 percent.

Rigorous Course Taking 39
Recommendations: Dual Credit Programs
Minnesota schools have demonstrated that the legislative support provided to dual credit programs is an essential factor in helping to increase participation and opportunities and raised expectations and outcomes for Minnesota students. Secondary teachers who have participated in AP and IB professional development opportunities have reported their involvement has helped hone their instructional skills, infused rigor into all of their classes, and provided a source of professional renewal and growth that is highly beneficial to their students. Support for intentional and collaborative professional development opportunities between postsecondary and secondary concurrent enrollment faculty would also have this effect as well as assist in the articulation of secondary and postsecondary curriculum and expectations.
The expansion of pre-AP courses and growth in number of IB Middle Year Program and Primary Year Program schools demonstrates the value districts, as well as individual schools, are placing on providing rigor in the early years to prepare students to successfully engage in AP and IB in high school and attain their postsecondary goals. Programs intending to increase awareness of college and career opportunities and requirements as well as the development of the behaviors and skills necessary for success in rigorous programs need to occur before high school. Programs and supports at the middle level should be expanded and supported.
Additional recommendations include:
• Continue to provide timely and clear information to all students and their parents about the availability of dual credit opportunities as well as the impact they may have on future opportunities, especially targeting low-income, English Learners (EL), first generation, alternative learning students and families of color;
• Enhance pathways to postsecondary through supporting collaborations and partnerships between high schools and postsecondary institutions (e.g., “early college”);
• Provide support for postsecondary faculty to work with high school faculty to develop aligned interventions and focused support for students while still in high school;
• Provide support for pilot dual credit programs offered at the high school that intend to increase participation of underrepresented groups;
• Provide support to pilot college and career readiness programs offered at the middle school that intend to increase the awareness, readiness and participation of underrepresented groups;
• Continue to enhance Minnesota’s SLED’s system to provide rigorous course taking and other experiential learning and outcome data to inform about resources for high school programming and the impact on postsecondary credits, credentials and career attainment; and
• Enhance partnerships through supporting collaborations and partnerships between State-Approved Alternative programs and postsecondary institutions to develop early/middle college.
Rigorous Course Taking 40
Appendices
Appendix A. Advanced Placement and International Baccalaureate Programs
120B.13 ADVANCED PLACEMENT AND INTERNATIONAL BACCALAUREATE PROGRAMS
Subdivision 1. Program structure; training programs for teachers.
Critical to schools' educational success is ongoing advanced placement and international baccalaureate-approved teacher training. A secondary teacher assigned by a district to teach an advanced placement or international baccalaureate course or other interested educator may participate in a training program offered by The College Board or International Baccalaureate North America, Inc. The state may pay a portion of the tuition, room, board, and out-of-state travel costs a teacher or other interested educator incurs in participating in a training program. The commissioner shall determine application procedures and deadlines, select teachers and other interested educators to participate in the training program, and determine the payment process and amount of the subsidy. The procedures determined by the commissioner shall, to the extent possible, ensure that advanced placement and international baccalaureate courses become available in all parts of the state and that a variety of course offerings are available in school districts. This subdivision does not prevent teacher or other interested educator participation in training programs offered by The College Board or International Baccalaureate North America, Inc., when tuition is paid by a source other than the state.
Subdivision 2. Support programs.
The commissioner shall provide support programs during the school year for teachers who attended the training programs and teachers experienced in teaching advanced placement or international baccalaureate courses. The support programs shall provide teachers with opportunities to share instructional ideas with other teachers. The state may pay the costs of participating in the support programs, including substitute teachers, if necessary, and program affiliation costs.
Subdivision 3. Subsidy for examination fees.
The state may pay all or part of the fee for advanced placement or international baccalaureate examinations. The commissioner shall pay all examination fees for all public and nonpublic students of low-income families, as defined by the commissioner, and to the limit of the available appropriation, shall also pay a portion or all of the examination fees for other public and nonpublic students sitting for an advanced placement examination, international baccalaureate examination, or both. The commissioner shall determine procedures for state payments of fees.
Subdivision 3a. College credit.
The colleges and universities of the Minnesota State Colleges and Universities system must award, and the University of Minnesota and private postsecondary institutions are encouraged to award, college credit to high school students who receive a score of three or higher on an advanced placement or four or higher on the international baccalaureate program examination.
Subdivision 4. Rigorous course taking information; AP, IB, and PSEO.
The commissioner shall submit the following information on rigorous course taking, disaggregated by student subgroup, school district, and postsecondary institution, to the education committees of the legislature each year by February 1:

Rigorous Course Taking 41
(1) the number of pupils enrolled in postsecondary enrollment options under section 124D.09, includingconcurrent enrollment, career and technical education courses offered as a concurrent enrollmentcourse, advanced placement, and international baccalaureate courses in each school district;
(2) the number of teachers in each district attending training programs offered by the college board,International Baccalaureate North America, Inc., or Minnesota concurrent enrollment programs;
(3) the number of teachers in each district participating in support programs;(4) recent trends in the field of postsecondary enrollment options under section 124D.09, including
concurrent enrollment, advanced placement, and international baccalaureate programs;(5) expenditures for each category in this section and under sections 124D.09 and 124D.091, including
career and technical education courses offered as a concurrent enrollment course; and(6) other recommendations for the state program or the postsecondary enrollment options under section
124D.09, including concurrent enrollment.
Appropriations
Session Laws 2015, 89th Legislature, 2015 chapter 3, article 3, section 15, subdivision 4
Subdivision 4. Examination fees; teacher training and support programs.
(a) For students' advanced placement and international baccalaureate examination fees underMinnesota Statutes, section 120B.13, subdivision 3, and the training and related costs for teachers and other interested educators under Minnesota Statutes, section 120B.13, subdivision 1:
$ 4,500,000 ..... 2016
$ 4,500,000 ..... 2017
(b) The advanced placement program shall receive 75 percent of the appropriation each year and theinternational baccalaureate program shall receive 25 percent of the appropriation each year. The department, in consultation with representatives of the advanced placement and international baccalaureate programs selected by the Advanced Placement Advisory Council and IBMN, respectively, shall determine the amounts of the expenditures each year for examination fees and training and support programs for each program.
(c) Notwithstanding Minnesota Statutes, section 120B.13, subdivision 1, at least $500,000 each year isfor teachers to attend subject matter summer training programs and follow-up support workshops approved by the advanced placement or international baccalaureate programs. The amount of the subsidy for each teacher attending an advanced placement or international baccalaureate summer training program or workshop shall be the same. The commissioner shall determine the payment process and the amount of the subsidy.
(d) The commissioner shall pay all examination fees for all students of low-income families underMinnesota Statutes, section 120B.13, subdivision 3, and to the extent of available appropriations shall also pay examination fees for students sitting for an advanced placement examination, international baccalaureate examination, or both.

Rigorous Course Taking 42
Appendix B. Advanced Placement Public and Nonpublic Schools Reimbursements FY 2017
DISTRICT NAME NUMBER-TYPE – School Name Number of AP Student Participants
Number of AP Teachers
Trained
AP Exam Expenditures
AP Training and Support Expenditures
Total AP Expenditures for FY 2017
Ada-Borup School District #2854-01 – Ada-Borup High School 1 1 - $850 $850
ADRIAN DISTRICT #0511-01 – Adrian High School 10 - $360 - $360
ALBERT LEA DISTRICT #0241-01 – Albert Lea Senior High School 130 2 $9,785 $1,400 $11,185
ALEXANDRIA DISTRICT #0206-01 – Alexandria Area High School 163 - $8,298 - $8,298
ANOKA-HENNEPIN DISTRICT #0011-01 – Andover High School 423 19 $27,782 $6,270 $34,052
ANOKA-HENNEPIN DISTRICT #0011-01 – Anoka High School 266 3 $15,742 $900 $16,642
ANOKA-HENNEPIN DISTRICT #0011-01 – Blaine High School 499 9 $22,771 $4,860 $27,631
ANOKA-HENNEPIN DISTRICT #0011-01 – Champlin Park High School 362 5 $19,576 $900 $20,476
ANOKA-HENNEPIN DISTRICT #0011-01 – Coon Rapids High School 216 6 $12,057 $2,240 $14,297
AUSTIN DISTRICT #0492-01 – Austin High School 154 - $8,601 - $8,601
BAGLEY DISTRICT #0162-01 – Bagley Junior-Senior High School 12 2 $679 $360 $1,039
BARNESVILLE DISTRICT #0146-01 – Barnesville High School 15 - $840 - $840
BARNUM PUBLIC SCHOOLS #0091-01 – Barnum High School 5 1 - $850 $850
BECKER DISTRICT #0726-01 – Becker High School 132 - $5,624 - $5,624
BELLE PLAINE SCHOOL DISTRICT #0716-01 – Belle Plaine High School 37 5 $1,546 $2,100 $3,646
BEMIDJI DISTRICT #0031-01 – Bemidji High School 184 2 $10,385 $360 $10,745
BERTHA-HEWITT DISTRICT #0786-01 – Bertha-Hewitt High School 5 - $213 - $213
BIG LAKE DISTRICT #0727-01 – Big Lake High School 32 - $1,293 - $1,293
BLACKDUCK DISTRICT #0032-01 – Blackduck High School 33 - $1,609 - $1,609
BLOOMINGTON PUBLIC SCHOOLS #0271-01 – Jefferson High School 395 6 $30,295 $5,980 $36,275
BLOOMINGTON PUBLIC SCHOOLS #0271-01 – Kennedy Senior High School 357 13 $25,157 $1,420 $26,577

Rigorous Course Taking 43
DISTRICT NAME NUMBER-TYPE – School Name Number of AP Student Participants
Number of AP Teachers
Trained
AP Exam Expenditures
AP Training and Support Expenditures
Total AP Expenditures for FY 2017
Blue Earth Area School District #2860-01 – Blue Earth Area High School 26 - $1,078 - $1,078
BRAINERD DISTRICT #0181-01 – Brainerd Senior High School 488 8 $34,084 $6,200 $40,284
BUFFALO-HANOVER-MONTROSE DISTRICT #0877-01 – Buffalo High School 75 2 $3,519 $1,700 $5,219
BURNSVILLE DISTRICT #0191-01 – Burnsville Senior High School 440 3 $23,675 $2,100 $25,775
BYRON DISTRICT #0531-01 – Byron High School 23 - $1,120 - $1,120
CAMBRIDGE-ISANTI PUBLIC SCHOOLS #0911-01 – Cambridge-Isanti High School 116 1 $8,671 $180 $8,851
CANNON FALLS DISTRICT #0252-01 – Cannon Falls High School 100 3 $6,327 $1,400 $7,727
CASS LAKE-BENA PUBLIC SCHOOLS #0115-01 – Cass Lake-Bena High School 2 1 $199 $850 $1,049
CENTENNIAL DISTRICT #0012-01 – Centennial High School 577 15 $32,082 $3,190 $35,272
CENTRAL DISTRICT #0108-01 – Central High School 58 - $2,772 - $2,772
CHATFIELD DISTRICT #0227-01 – Chatfield High School 28 1 $1,173 $850 $2,023
CHISAGO LAKES SCHOOL DISTRICT #2144-01 – Chisago Lakes High School 136 5 $9,240 $540 $9,780
COLUMBIA HEIGHTS DISTRICT #0013-01 – Columbia Heights High School 166 10 $13,378 $2,810 $16,188
COOK COUNTY PUBLIC SCHOOLS #0166-01 – Cook County High School 35 2 $2,637 $1,550 $4,187
CROOKSTON DISTRICT #0593-01 – Crookston High School 41 - $2,371 - $2,371
DASSEL-COKATO DISTRICT #0466-01 – Dassel-Cokato High School 15 - $600 - $600
DELANO DISTRICT #0879-01 – Delano Senior High School 112 5 $5,400 $1,940 $7,340
DETROIT LAKES DISTRICT #0022-01 – Detroit Lakes High School 115 - $6,120 - $6,120
DISTANCE LEARNING PROGRAM #0138-01 – North Branch High School 7 - $320 - $320
DOVER-EYOTA DISTRICT #0533-01 – Dover-Eyota High School 16 1 $653 $850 $1,503
DULUTH PUBLIC SCHOOLS #0709-01 – Denfeld High School 108 - $5,946 - $5,946
DULUTH PUBLIC SCHOOLS #0709-01 – East High School 156 - $8,994 - $8,994

Rigorous Course Taking 44
DISTRICT NAME NUMBER-TYPE – School Name Number of AP Student Participants
Number of AP Teachers
Trained
AP Exam Expenditures
AP Training and Support Expenditures
Total AP Expenditures for FY 2017
EAGLE RIDGE ACADEY CHARTER SCHOOL #4122-07 59 - $3,772 - $3,772
EASTERN CARVER COUNTY #0112-01 – Chanhassen High School 537 3 $38,807 $1,580 $40,387
EASTERN CARVER COUNTY #0112-01 – Chaska High School 363 7 $33,456 $2,280 $35,736
EDEN PRAIRIE DISTRICT #0272-01 – Eden Prairie High School 836 12 $71,843 $2,500 $74,343
EDINA DISTRICT #0273-01 – Edina High School 1,248 5 $95,395 $2,100 $97,495
ELK RIVER DISTRICT #0728-01 – Elk River High School 393 2 $23,772 $880 $24,652
ELK RIVER DISTRICT #0728-01 – Rogers High School 345 3 $19,616 $540 $20,156
ELK RIVER DISTRICT #0728-01 – Zimmerman High School 105 2 $5,407 $880 $6,287
ESKO DISTRICT #0099-01 – Lincoln Secondary - Esko 10 - $400 - $400
FAIRMONT AREA SCHOOL DISTRICT #2752-01 – Fairmont High School 68 1 $3,386 $850 $4,236
FARIBAULT DISTRICT #0656-01 – Faribault Senior High School 95 4 $4,904 $2,800 $7,704
FARMINGTON DISTRICT #0192-01 – Farmington High School 377 7 $17,855 $1,080 $18,935
FERGUS FALLS PUBLIC SCHOOLS #0544-01 – Kennedy Secondary School 44 1 $1,919 $850 $2,769
FOREST LAKE DISTRICT #0831-01 – Forest Lake Senior High School 373 6 $21,028 $1,760 $22,788
GFW #2365-01 – GFW High School 20 - $1,397 - $1,397
GOODHUE DISTRICT #0253-01 – Goodhue Public School 15 1 $560 $180 $740
GRAND MEADOW PUBLIC SCHOOLS #0495-01 – Grand Meadow High School 5 - $213 - $213
GREAT RIVER SCHOOL #4105-01 – Great River School 6 - $253 - $253
HARBOR CITY INTERNATIONAL CHARTER #4085-07 52 - $2,809 - $2,809
HASTINGS DISTRICT #0200-01 – Hastings High School 214 5 $19,692 $1,420 $21,112
HAWLEY DISTRICT #0150-01 – Hawley High School 17 - $680 - $680
HIAWATHA COLLEGIATE CHARTER SCHOOL #4170-07 35 5 $1,763 $2,800 $4,563

Rigorous Course Taking 45
DISTRICT NAME NUMBER-TYPE – School Name Number of AP Student Participants
Number of AP Teachers
Trained
AP Exam Expenditures
AP Training and Support Expenditures
Total AP Expenditures for FY 2017
HINCKLEY-FINLAYSON SCHOOLS #2165-01 – Hinckley-Finlayson High School 24 1 $1,651 $850 $2,501
HMONG COLLEGE PREP ACADEMY CHARTER SCHOOL #4103-07 4 - $199 - $199
HOLDINGFORD SCHOOL DISTRICT #0738-01 – Holdingford High School 1 - $40 - $40
HOPKINS SCHOOL DISTRICT #0270-01 – Hopkins High School 600 10 $42,722 $4,220 $46,942
HOUSTON PUBLIC SCHOOLS #0294-01 – Houston High School 21 - $1,065 - $1,065
HOUSTON PUBLIC SCHOOLS #0294-01 – Minnesota Virtual Academy 7 - $120 - $120
HOWARD LAKE-WAVERLY-WINSTED DISTRICT #2687-01 52 2 $3,064 $1,550 $4,614
HUTCHINSON DISTRICT #0423-01 – Hutchinson High School 182 1 $11,816 $850 $12,666
INTERNATIONAL FALLS PUBLIC SCHOOL #0361-01 – Falls Secondary 21 1 $1,065 $700 $1,765
INVER GROVE HEIGHTS PUBLIC SCHOOLS #0199-01 – Simley High School 281 1 $25,176 $180 $25,356
JORDAN DISTRICT #0717-01 – Jordan High School 44 1 $1,746 - $1,746
KASSON-MANTORVILLE DISTRICT #0204-01 – Kasson-Mantorville High School 25 - $1,320 - $1,320
KENYON-WANAMINGO DISTRICT #2172-01 – Kenyon-Wanamingo High School 45 - $2,611 - $2,611
KERKHOVEN-MURDOCK-SUNBURG (KMS) #0775-01 – KMS High School 25 2 - $1,700 $1,700
KIMBALL DISTRICT #0739-01 – Kimball Area High School 24 2 $1,000 $1,700 $2,700
LAKE CITY SCHOOL DISTRICT #0813-01 – Lake-City Lincoln Secondary 110 7 $5,903 $2,300 $8,203
LAKE OF THE WOODS DISTRICT #0390-01 – Lake of the Woods High School 23 - $1,052 - $1,052
LAKE PARK AUDUBON DISTRICT #2889-01 – Lake Park-Audubon High School 18 - $746 - $746
LAKEVILLE DISTRICT #0194-01 – Lakeville North High School 721 11 $52,157 $5,100 $57,257
LAKEVILLE DISTRICT #0194-01 – Lakeville South High School 638 4 $41,120 $1,760 $42,880
LE SUEUR-HENDERSON DISTRICT #2397-01 – Le Sueur-Henderson High School 26 6 $1,225 $3,130 $4,355
LEWISTON-ALTURA DISTRICT #0857-01 – Lewiston-Altura High School 25 - $2,008 - $2,008

Rigorous Course Taking 46
DISTRICT NAME NUMBER-TYPE – School Name Number of AP Student Participants
Number of AP Teachers
Trained
AP Exam Expenditures
AP Training and Support Expenditures
Total AP Expenditures for FY 2017
LITCHFIELD SCHOOL DISTRICT #0465-01 – Litchfield Senior High School 8 - $320 - $320
LONG PRAIRIE-GREY EAGLE DISTRICT #2753-01 – Secondary School 73 5 $3,474 $4,100 $7,574
LUVERNE SCHOOL DISTRICT #2184-01 – Luverne Public School 23 - $1,240 - $1,240
MAHTOMEDI SCHOOL DISTRICT #0832-01 – Mahtomedi Senior High School 347 5 $21,840 $2,760 $24,600
MAIN STREET SCHOOL PERFORMING ARTS CHARTER SCHOOL #4110-07 59 3 $3,117 $1,580 $4,697
MANKATO PUBLIC SCHOOL DISTRICT #0077-01 – Mankato East High School 293 4 $22,113 $1,760 $23,873
MANKATO PUBLIC SCHOOL DISTRICT #0077-01 – Mankato West High School 448 6 $32,277 $2,460 $34,737
MARSHALL PUBLIC SCHOOL DISTRICT #0413-01 – Marshall Senior High School 148 2 $7,649 $1,700 $9,349
MATH AND SCIENCE ACADEMY CHARTER SCHOOL #4043-07 76 4 $5,559 $1,910 $7,469
MEDFORD PUBLIC SCHOOL DISTRICT #0763-01 – Medford High School 40 1 $1,264 - $1,264
MESABI EAST SCHOOL DISTRICT #2711-01 – Mesabi East Senior High School 20 - $838 - $838
METRO SCHOOLS COLLEGE PREP CHARTER SCHOOL #4131-07 29 2 $1,550 $1,550 $3,100
MINNEAPOLIS COLLEGE PREPARATORY CHARTER SCHOOL #4203-07 - - - - -
MINNEAPOLIS DISTRICT #0001-03 – Edison Senior High School 12 1 $584 - $584
MINNEAPOLIS DISTRICT #0001-03 – Heritage Academy 13 2 $1,484 - $1,484
MINNEAPOLIS DISTRICT #0001-03 – North Community High School 34 1 $2,373 $700 $3,073
MINNEAPOLIS DISTRICT #0001-03 – Patrick Henry High School 24 3 $1,312 - $1,312
MINNEAPOLIS DISTRICT #0001-03 – Roosevelt High School 5 2 $306 $700 $1,006
MINNEAPOLIS DISTRICT #0001-03 – South High School 406 22 $30,965 $9,150 $40,115
MINNEAPOLIS DISTRICT #0001-03 – Southwest High School 721 7 $37,082 $1,400 $38,482
MINNEAPOLIS DISTRICT #0001-03 – Washburn High School 394 4 $19,266 $850 $20,116
MINNEAPOLIS DISTRICT #0001-03 – Wellstone International High School 28 - $1,538 - $1,538

Rigorous Course Taking 47
DISTRICT NAME NUMBER-TYPE – School Name Number of AP Student Participants
Number of AP Teachers
Trained
AP Exam Expenditures
AP Training and Support Expenditures
Total AP Expenditures for FY 2017
MINNETONKA SCHOOL DISTRICT #0276-01 – Minnetonka High School 1,414 36 $102,851 $12,670 $115,521
MINNEWASKA SCHOOL DISTRICT #2149-01 – Minnewaska Area High School 16 - $719 - $719
MINNESOTA TRANSITIONS CHARTER SCHOOL #4017-07 6 - $213 - $213
MONTEVIDEO DISTRICT #0129-01 – Montevideo Senior High School 45 - $1,905 - $1,905
MONTICELLO DISTRICT #0882-01 – Monticello High School 119 2 $6,437 $360 $6,797
MOORHEAD DISTRICT #0152-01 – Moorhead Senior High School 389 9 $22,257 $6,310 $28,567
MORA PUBLIC SCHOOL DISTRICT #0332-01 – Mora High School 5 - $160 - $160
MOUNDS VIEW SCHOOL DISTRICT #0621-01 – Irondale Senior High School 603 19 $44,364 $6,440 $50,804
MOUNDS VIEW SCHOOL DISTRICT #0621-01 – Mounds View High School 713 7 $63,568 $1,780 $65,348
NEW LONDON-SPICER SCHOOL DISTRICT #0345-01 – Senior High School 26 - $1,293 - $1,293
NEW PRAGUE AREA SCHOOLS #0721-01 – New Prague High School 151 - $6,292 - $6,292
NEW ULM DISTRICT #0088-01 – New Ulm Senior High School 56 - $2,400 - $2,400
NEW YORK MILLS DISTRICT #0553-01 – New York Mills High School 7 - $293 - $293
NON-PUBLIC SCHOOLS – Blake School Northrup Campus 276 1 $27,041 $850 $27,891
NON-PUBLIC SCHOOLS – Cristo Rey Jesuit High School 121 3 $11,111 $1,580 $12,691
NON-PUBLIC SCHOOLS – De La Salle High School 237 3 $19,731 $1,730 $21,461
NON-PUBLIC SCHOOLS – Minnehaha Academy 154 4 $15,400 $1,760 $17,160
NON-PUBLIC SCHOOLS – Legacy Christian Academy 35 6 $1,520 $540 $2,060
NON-PUBLIC SCHOOLS – Al-Amal School 23 0 $1,234 - $1,234
NON-PUBLIC SCHOOLS – Totino-Grace High School 231 10 $16,039 $3,415 $19,454
NON-PUBLIC SCHOOLS – Loyola High School 57 7 $3,106 $2,450 $5,556

Rigorous Course Taking 48
DISTRICT NAME NUMBER-TYPE – School Name Number of AP Student Participants
Number of AP Teachers
Trained
AP Exam Expenditures
AP Training and Support Expenditures
Total AP Expenditures for FY 2017
NON-PUBLIC SCHOOLS – Minnesota Valley Lutheran High School 36 2 $2,479 $360 $2,839
NON-PUBLIC SCHOOLS – Mayer Lutheran High School 47 - $2,613 - $2,613
NON-PUBLIC SCHOOLS – Holy Family Catholic High School 143 - $9,440 - $9,440
NON-PUBLIC SCHOOLS – Southwest Christian High School 61 2 $2,600 $180 $2,780
NON-PUBLIC SCHOOLS – Park Christian School 25 - $1,160 - $1,160
NON-PUBLIC SCHOOLS – Convent of the Visitation School 158 4 $12,640 $1,910 $14,550
NON-PUBLIC SCHOOLS – Saint Croix Lutheran High School 107 2 $7,720 $965 $8,685
NON-PUBLIC SCHOOLS – Saint Thomas Academy 224 3 $19,223 $1,580 $20,803
NON-PUBLIC SCHOOLS – Saint Agnes High School 47 1 $2,637 $700 $3,337
NON-PUBLIC SCHOOLS – Breck School 221 2 $18,285 $360 $18,645
NON-PUBLIC SCHOOLS – International School of Minnesota 61 6 $6,000 $2,120 $8,120
NON-PUBLIC SCHOOLS – Bethany Academy 14 - $480 - $480
NON-PUBLIC SCHOOLS – Heritage Christian Academy** 62 5 - $2,990 $2,990
NON-PUBLIC SCHOOLS – Academy of Holy Angels 255 12 $22,200 $3,870 $26,070
NON-PUBLIC SCHOOLS – Benilde-Saint Margaret's School 239 5 $19,650 $2,990 $22,640
NON-PUBLIC SCHOOLS – Providence Academy 55 - $4,280 - $4,280
NON-PUBLIC SCHOOLS – West Lutheran High School 29 3 $1,200 $1,580 $2,780
NON-PUBLIC SCHOOLS – Marshall School 90 3 $7,799 $1,700 $9,499
NON-PUBLIC SCHOOLS – Rochester Lourdes High School 139 7 $7,760 $1,940 $9,700
NON-PUBLIC SCHOOLS – Schaeffer Academy 27 - $2,320 - $2,320
NON-PUBLIC SCHOOLS – Hillcrest Lutheran Academy 38 2 $2,000 $360 $2,360
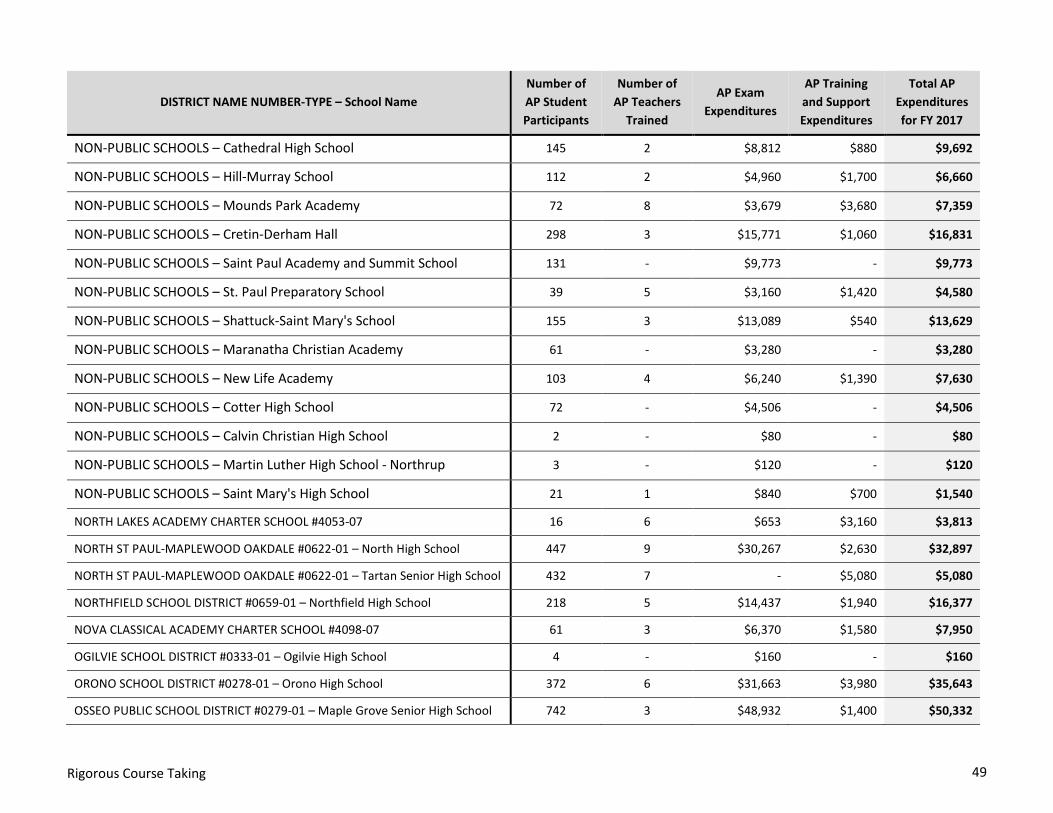
Rigorous Course Taking 49
DISTRICT NAME NUMBER-TYPE – School Name Number of AP Student Participants
Number of AP Teachers
Trained
AP Exam Expenditures
AP Training and Support Expenditures
Total AP Expenditures for FY 2017
NON-PUBLIC SCHOOLS – Cathedral High School 145 2 $8,812 $880 $9,692
NON-PUBLIC SCHOOLS – Hill-Murray School 112 2 $4,960 $1,700 $6,660
NON-PUBLIC SCHOOLS – Mounds Park Academy 72 8 $3,679 $3,680 $7,359
NON-PUBLIC SCHOOLS – Cretin-Derham Hall 298 3 $15,771 $1,060 $16,831
NON-PUBLIC SCHOOLS – Saint Paul Academy and Summit School 131 - $9,773 - $9,773
NON-PUBLIC SCHOOLS – St. Paul Preparatory School 39 5 $3,160 $1,420 $4,580
NON-PUBLIC SCHOOLS – Shattuck-Saint Mary's School 155 3 $13,089 $540 $13,629
NON-PUBLIC SCHOOLS – Maranatha Christian Academy 61 - $3,280 - $3,280
NON-PUBLIC SCHOOLS – New Life Academy 103 4 $6,240 $1,390 $7,630
NON-PUBLIC SCHOOLS – Cotter High School 72 - $4,506 - $4,506
NON-PUBLIC SCHOOLS – Calvin Christian High School 2 - $80 - $80
NON-PUBLIC SCHOOLS – Martin Luther High School - Northrup 3 - $120 - $120
NON-PUBLIC SCHOOLS – Saint Mary's High School 21 1 $840 $700 $1,540
NORTH LAKES ACADEMY CHARTER SCHOOL #4053-07 16 6 $653 $3,160 $3,813
NORTH ST PAUL-MAPLEWOOD OAKDALE #0622-01 – North High School 447 9 $30,267 $2,630 $32,897
NORTH ST PAUL-MAPLEWOOD OAKDALE #0622-01 – Tartan Senior High School 432 7 - $5,080 $5,080
NORTHFIELD SCHOOL DISTRICT #0659-01 – Northfield High School 218 5 $14,437 $1,940 $16,377
NOVA CLASSICAL ACADEMY CHARTER SCHOOL #4098-07 61 3 $6,370 $1,580 $7,950
OGILVIE SCHOOL DISTRICT #0333-01 – Ogilvie High School 4 - $160 - $160
ORONO SCHOOL DISTRICT #0278-01 – Orono High School 372 6 $31,663 $3,980 $35,643
OSSEO PUBLIC SCHOOL DISTRICT #0279-01 – Maple Grove Senior High School 742 3 $48,932 $1,400 $50,332

Rigorous Course Taking 50
DISTRICT NAME NUMBER-TYPE – School Name Number of AP Student Participants
Number of AP Teachers
Trained
AP Exam Expenditures
AP Training and Support Expenditures
Total AP Expenditures for FY 2017
OSSEO PUBLIC SCHOOL DISTRICT #0279-01 – Osseo High School 398 4 $24,453 $2,280 $26,733
OSSEO PUBLIC SCHOOL DISTRICT #0279-01 – Park Center Senior High School 200 - $9,807 - $9,807
OWATONNA DISTRICT #0761-01 – Owatonna High School 108 4 $7,275 $2,280 $9,555
PARNASSUS PREPARATORY CHARTER SCHOOL #4199-07 18 3 - $1,550 $1,550
PELICAN RAPIDS DISTRICT #0548-01 – Pelican Rapids High School 8 - $426 - $426
PERHAM-DENT DISTRICT #0549-01 – Perham High School 52 - $2,197 - $2,197
PERPICH CENTER FOR ARTS EDUCATION #1000-01 50 1 $2,545 $850 $3,395
PINE CITY DISTRICT #0578-01 – Pine City High School 13 - $600 - $600
PINE ISLAND DISTRICT #0255-01 – Pine Island High School 16 - $640 - $640
PIPESTONE AREA SCHOOL DISTRICT #2689-01 – Pipestone Area High School 12 - $532 - $532
PLAINVIEW-ELGIN-MILLVILLE #2899-01 – Plainview-Elgin-Millville High 16 - $653 - $653
PRAIRIE SEEDS ACADEMY CHARTER SCHOOL #4126-07 - 2 - $1,400 $1,400
PRINCETON DISTRICT #0477-01 – Princeton High School 68 2 $3,661 $1,700 $5,361
PRIOR LAKE-SAVAGE AREA SCHOOLS #0719-01 – Prior Lake High School 580 7 $40,293 $2,640 $42,933
RED ROCK CENTRAL SCHOOL DISTRICT #2884-01 – Red Rock Central Secondary 26 - $1,264 - $1,264
RED WING SCHOOL DISTRICT #0256-01 – Red Wing High School 127 2 $8,741 $1,400 $10,141
REDWOOD AREA SCHOOL DISTRICT #2897-01 – Redwood Valley High School 47 - $2,595 - $2,595
RICHFIELD SCHOOL DISTRICT #0280-01 – Richfield Senior High School 157 7 $8,166 $4,380 $12,546
ROBBINSDALE SCHOOL DISTRICT #0281-01 – Robbinsdale Armstrong 786 14 $58,990 $5,270 $64,260
ROBBINSDALE SCHOOL DISTRICT #0281-01 – Robbinsdale Cooper 163 3 $7,447 $1,400 $8,847
ROCHESTER SCHOOL DISTRICT #0535-01 – Century High School 332 1 $32,870 $700 $33,570
ROCHESTER SCHOOL DISTRICT #0535-01 – John Marshall High School 297 2 $24,611 $1,400 $26,011

Rigorous Course Taking 51
DISTRICT NAME NUMBER-TYPE – School Name Number of AP Student Participants
Number of AP Teachers
Trained
AP Exam Expenditures
AP Training and Support Expenditures
Total AP Expenditures for FY 2017
ROCHESTER SCHOOL DISTRICT #0535-01 – Mayo High School 283 5 $26,044 $2,100 $28,144
ROCKFORD SCHOOL DISTRICT #0883-01 – Rockford High School 29 2 $1,973 $880 $2,853
ROSEMOUNT-APPLE VALLEY-EAGAN #0196-01 – Apple Valley High School 247 5 $18,040 $1,940 $19,980
ROSEMOUNT-APPLE VALLEY-EAGAN #0196-01 – Eagan High School 618 3 $41,120 $360 $41,480
ROSEMOUNT-APPLE VALLEY-EAGAN #0196-01 – Eastview High School 586 4 $51,539 $1,760 $53,299
ROSEMOUNT-APPLE VALLEY-EAGAN #0196-01 – Rosemount High School 575 11 $46,700 $1,620 $48,320
ROSEMOUNT-APPLE VALLEY-EAGAN #0196-01 – School Environmental Studies 107 2 $8,228 $880 $9,108
ROSEVILLE DISTRICT #0623-01 – Roseville Area High School 575 16 $35,995 $4,940 $40,935
ROYALTON DISTRICT #0485-01 – Royalton High School 16 - $680 - $680
RUSH CITY DISTRICT #0139-01 – Rush City High School 4 - $160 - $160
RUSHFORD-PETERSON PUBLIC SCHOOLS #0239-01 – Senior High School 11 1 $599 $700 $1,299
SARTELL-ST. STEPHEN SCHOOL DISTRICT #0748-01 – Sartell High School 365 2 $21,855 - $21,855
SAUK RAPIDS-RICE PUBLIC SCHOOLS #0047-01 – Sauk Rapids-Rice High School 236 10 $13,520 $1,400 $14,920
SHAKOPEE DISTRICT #0720-01 – Shakopee Senior High School 651 14 $40,374 $6,265 $46,639
SLEEPY EYE DISTRICT #0084-01 – Sleepy Eye High School 6 - $279 - $279
SOUTH WASHINGTON COUNTY SCHOOLS #0833-01 – East Ridge High School 651 7 $43,696 $1,400 $45,096
SOUTH WASHINGTON COUNTY SCHOOLS #0833-01 – Park High School 316 7 $14,430 $2,800 $17,230
SOUTH WASHINGTON COUNTY SCHOOLS #0833-01 – Woodbury High School 754 8 $49,620 $2,100 $51,720
SPECTRUM CHARTER SCHOOL #4160-07 44 1 $2,157 $265 $2,422
SPRING GROVE SCHOOL DISTRICT #0297-01 – Spring Grove High School 22 1 $1,400 $850 $2,250
SPRING LAKE PARK DISTRICT #0016-01 – Spring Lake Park High School 394 9 $14,485 $9,189 $23,674
ST CHARLES DISTRICT #0858-01 – Saint Charles High School 42 - $1,920 - $1,920

Rigorous Course Taking 52
DISTRICT NAME NUMBER-TYPE – School Name Number of AP Student Participants
Number of AP Teachers
Trained
AP Exam Expenditures
AP Training and Support Expenditures
Total AP Expenditures for FY 2017
ST CROIX PREPARATORY ACADEMY CHARTER SCHOOL #4120-07 218 5 $17,795 $1,495 $19,290
ST PAUL CONSERVATORY PERFORMING ART CHARTER SCHOOL #4112-07 69 7 $3,811 $4,900 $8,711
ST. ANTHONY-NEW BRIGHTON SCHOOLS #0282-01 288 12 $20,280 $4,485 $24,765
ST. CLOUD DISTRICT #0742-01 – Apollo High School 262 13 $19,486 $2,550 $22,036
ST. CLOUD DISTRICT #0742-01 – Technical High School 279 23 $25,143 $6,170 $31,313
ST. FRANCIS #0015-01 – St. Francis High School 119 6 $6,404 $3,100 $9,504
ST. LOUIS PARK DISTRICT #0283-01 – St. Louis Park High School 551 4 $32,260 $10,727 $42,987
ST. MICHAEL-ALBERTVILLE SCHOOL DIST #0885-01 – Senior High School 273 8 $16,223 $5,350 $21,573
ST. PAUL SCHOOL DISTRICT #0625-01 – Central High School ISD 625 550 2 $42,858 - $42,858
ST. PAUL SCHOOL DISTRICT #0625-01 – Como Park Senior High School 259 16 $26,113 $7,285 $33,398
ST. PAUL SCHOOL DISTRICT #0625-01 – Creative Arts High School 46 8 $3,320 $3,500 $6,820
ST. PAUL SCHOOL DISTRICT #0625-01 – Humboldt Senior High School 106 4 $7,083 $2,800 $9,883
ST. PAUL SCHOOL DISTRICT #0625-01 – John A Johnson High School 165 - $8,711 - $8,711
ST. PAUL SCHOOL DISTRICT #0625-01 – Open World Learning Community 50 1 $4,963 - $4,963
ST. PAUL SCHOOL DISTRICT #0625-01 – Washington Technical Magnet School 106 2 $5,371 $700 $6,071
ST. PETER SCHOOL DISTRICT #0508-01 – St. Peter High School 45 2 - - -
STEWARTVILLE SCHOOL DISTRICT #0534-01 – Stewartville High School 10 - $893 - $893
STILLWATER AREA DISTRICT #0834-01 – Stillwater Area Senior High School 967 29 $64,276 $7,035 $71,311
THIEF RIVER FALLS SCHOOL DISTRICT #0564-01 – Lincoln Senior High School 55 - $2,370 - $2,370
TRACY AREA PUBLIC SCHOOLS #2904-01 – Tracy Junior-Senior High School 15 3 $560 $2,250 $2,810
TREKNORTH CHARTER SCHOOL #4106-07 30 - $2,628 - $2,628
TWIN CITIES ACADEMY CHARTER SCHOOL #4132-07 48 6 $3,470 $3,950 $7,420

Rigorous Course Taking 53
DISTRICT NAME NUMBER-TYPE – School Name Number of AP Student Participants
Number of AP Teachers
Trained
AP Exam Expenditures
AP Training and Support Expenditures
Total AP Expenditures for FY 2017
VIRGINIA DISTRICT #0706-01 – Virginia Secondary School 18 - $720 - $720
WABASHA-KELLOGG DISTRICT #0811-01 – Wabasha-Kellogg High School 15 - $840 - $840
WACONIA DISTRICT #0110-01 – Waconia High School 235 9 $13,664 $4,180 $17,844
WASECA DISTRICT #0829-01 – Waseca High School 137 2 $8,073 $1,400 $9,473
WAUBUN-OGEMA-WHITE EARTH PUBLIC SCHOOL #0435-01 – High School 17 3 $680 $850 $1,530
WAYZATA DISTRICT #0284-01 – Wayzata High School 948 28 $74,278 $3,990 $78,268
WEST ST PAUL-MENDOTA HTS-EAGAN #0197-01 – Henry Sibley High School 297 2 $24,608 $940 $25,548
WESTONKA DISTRICT #0277-01 – Mound Westonka High School 176 8 - $1,760 $1,760
WHITE BEAR LAKE SCHOOL DISTRICT #0624-01 – South Campus 556 11 $31,578 $4,550 $36,128
WILLMAR DISTRICT #0347-01 – Willmar Senior High School 99 2 $5,200 $1,700 $6,900
WINONA AREA DISTRICT #0861-01 – Winona Senior High School 132 3 $7,313 $1,700 $9,013
WORTHINGTON DISTRICT #0518-01 – Worthington Senior High School 108 4 $5,714 $530 $6,244
ZUMBROTA-MAZEPPA SCHOOL DISTRICT #2805-01 – Senior High School 26 - $1,120 - $1,120
Totals: 45,348 934 $3,003,454 $379,036 $3,382,490

Rigorous Course Taking 54
Appendix C. International Baccalaureate Public and Nonpublic Reimbursements FY 2017
Name and District Number (Number-Type) Number of IB
Diploma Student Participant
Number of IB Teachers Trained
IB Exam Expenditures
IB Training and Support
Expenditures
Total IB Expenditures
ANNUNCIATION SCHOOL – Non-public School 374 15 - $1,410 $1,410
ANOKA-HENNEPIN SCHOOL DISTRICT #0011-01 457 17 $96,816 $5,300 $102,116
BROOKLYN CENTER SCHOOL DISTRICT #0286-01 23 7 $8,996 $140 $9,136
COMMUNITY SCHOOL OF EXCELLENCE #4181-07 - 9 - $6,790 $6,790
FOREST LAKE PUBLIC SCHOOL DISTRICT #0831-01 - 6 - $920 $920
FRIDLEY PUBLIC SCHOOL DISTRICT #0014-01 163 52 $40,832 $28,700 $69,532
GRAND RAPIDS SCHOOL DISTRICT #0318-01 87 8 $11,404 $2,560 $13,964
GREAT RIVER CHARTER SCHOOL #4105-07 38 18 $5,512 $5,250 $10,762
HOPKINS PUBLIC SCHOOL DISTRICT #0270-01 - 40 - $8,540 $8,540
INTERNATIONAL SPANISH LANGUAGE ACADEMY #4167-07 - 7 - $1,610 $1,610
LAKES INTERNATIONAL LANGUAGE ACADEMY #4116-07 - 52 - $15,420 $15,420
MINNEAPOLIS PUBLIC SCHOOL DISTRICT #0001-03 865 358 $208,172 $70,566 $278,738
MINNETONKA PUBLIC SCHOOL DISTRICT #0276-01 650 27 $62,188 $7,940 $70,128
NORTHEAST COLLEGE PREP #4219-07 - 3 - $560 $560
OSSEO PUBLIC SCHOOL DISTRICT #0279-01 184 78 $49,276 $25,180 $74,456
PRAIRIE SEEDS ACADEMY #4126-07 - 2 - $100 $100
ROBBINSDALE PUBLIC SCHOOL DISTRICT #0281-01 92 48 $18,132 $16,700 $34,832
ROCHESTER ARTS AND SCIENCES ACADEMY – Non-public School - 9 - $1,860 $1,860
SAUK RAPIDS-RICE PUBLIC SCHOOL DISTRICT #0047-01 - 2 - $1,640 $1,640
SOUTH ST.PAUL PUBLIC SCHOOL DISTRICT #0006-03 151 33 $32,432 $9,420 $41,852

Rigorous Course Taking 55
Name and District Number (Number-Type) Number of IB
Diploma Student Participant
Number of IB Teachers Trained
IB Exam Expenditures
IB Training and Support
Expenditures
Total IB Expenditures
SOUTH WASHINGTON COUNTY SCHOOL DISTRICT #0833-01 190 32 $26,024 $9,530 $35,554
SAINT JOHN’S PREPARATORY SCHOOL – Non-public School 62 50 $8,416 $3,540 $11,956
ST. JUDE OF THE LAKE – Non-public School - 4 - $920 $920
ST. LOUIS PARK SCHOOL DISTRICT #0283-01 203 54 $27,596 $6,670 $34,266
ST. PAUL PUBLIC SCHOOL DISTRICT #0625-01 915 220 $217,748 $69,290 $287,038
STONEBRIDGE WORLD SCHOOL #4169-07 - 21 - $2,360 $2,360
WHITE BEAR LAKE PUBLIC SCHOOL DISTRICT #0624-01 - 15 - $8,540 $8,540
TOTALS 4,454 1,187 $813,544 $311,456 $1,125,000

Rigorous Course Taking 56
Appendix D. Minnesota International Baccalaureate World Schools FY 2017
The Primary Years Program (PYP) Global Academy, Charter Int'l Spanish Language Academy, Charter Lakes Int'l Language Academy, Charter Stonebridge World School, Charter *Northeast College Prep, Charter*Tesfa International, CharterScandia Elementary, Forest LakeHayes Elementary, FridleyStevenson Elementary, FridleyBancroft Elementary, MinneapolisElizabeth Hall International, MinneapolisWhittier International, MinneapolisRochester Arts and Sciences Academy, Private
St. Jude of the Lake School, Private *Annunciation Catholic School, PrivateLakeview Elementary, Robbinsdale**Rice Elementary, Sauk Rapids-RiceKaposia Education Center, South St. PaulLincoln Center Elementary, South St. PaulAquila Elementary, St. Louis ParkPeter Hobart Elementary, St. Louis ParkSusan Lindgren Elementary, St. Louis ParkBenjamin E. Mays International, St. PaulHazel Park Prep Academy, St. PaulHighland Park Elementary, St. PaulMatoska International, White Bear Lake
Middle Years Program (MYP) Brooklyn Center Junior/Senior High, Brooklyn Center Community School of Excellence, Charter *Lakes Int'l Language Academy, CharterPrairie Seeds Academy, Charter*Southwest Junior High School, Forest LakeFridley Middle/Fridley High School, FridleyHopkins North Junior High School, HopkinsHopkins West Junior High School, HopkinsAnthony Middle School, MinneapolisAnwatin Middle School, MinneapolisEdison High School, MinneapolisNortheast Middle School, MinneapolisPatrick Henry High School, MinneapolisSanford Middle School, Minneapolis
Roosevelt High, Minneapolis Southwest High School, Minneapolis *Washburn High School, MinneapolisNorthview Middle School/Park Center, OsseoRochester Montessori, PrivateRobbinsdale Middle/Cooper High School, RobbinsdaleSouth St. Paul Secondary, South St. PaulSt. Louis Park Middle School, St. Louis ParkHazel Park Prep Academy, St. PaulHighland Park Junior/Senior High, St. PaulRamsey Junior High/Central High School, St. PaulHarding High School, St. PaulCentral Middle School, White Bear LakeSunrise Park Middle School, White Bear Lake
Diploma Programme (DP)Champlin Park High School, Anoka-Hennepin Brooklyn Center Senior High, Brooklyn Center Great River School, Charter *Lakes Int'l Language Academy, CharterFridley High School, FridleyGrand Rapids High School, Grand RapidsEdison High School, MinneapolisPatrick Henry High School, MinneapolisRoosevelt High School, MinneapolisSouthwest High School, MinneapolisWashburn High School, Minneapolis
Minnetonka High School, Minnetonka Park Center High School, Osseo St. John's Preparatory School, Private Cooper High School, Robbinsdale South St. Paul Secondary, South St. Paul Park High School, South Washington County St. Louis Park High School, St. Louis Park Central High School, St. Paul Harding High School, St. Paul Highland Park High School, St. Paul
IB Career-related Program (CP)Patrick Henry High School, Minneapolis Roosevelt High School, Minneapolis
Southwest High School, Minneapolis Fridley High School, Fridley
*Candidate school; **Consideration Phase

Rigorous Course Taking 57
Appendix E. State-Approved Early/Middle College Programs FY 2017
State-Approved Early Middle College Program SAAP Name and Number (District Number-Type-Site) Postsecondary Institution Name
ALC/RCTC TRANSITIONS PROGRAM ROCHESTER AREA LEARNING CENTER #0535-01-306 Rochester Community and Technical College
COLLEGE CONNECT Anoka-Hennepin Technical High School #0011-01-110 Anoka Technical College
College Connections Pine City Alternative Learning Center #0578-01-692 Pine Technical and Community College
College Connections (C2) Riverside Academy #0911-01-380 Pine Technical and Community College
College Connections Program Crossroads Learning Center #2580-01-035 Pine Technical and Community College
Destination: Diploma to Degree (D3) Brooklyn Center Academy #286-01-763 Minneapolis Community and Technical College (MCTC)
Destination: Diploma to Degree (D3) Options at Edina High School #0273-01-621 Minneapolis Community and Technical College (MCTC)
Destination: Diploma to Degree (D3) Edison High School – SWS #0001-03-455 Minneapolis Community and Technical College (MCTC)
Destination: Diploma to Degree (D3) Henry High School - SWS #0001-03-456 Minneapolis Community and Technical College (MCTC)
Destination: Diploma to Degree (D3) Heritage - SWS #0001-03-417 Minneapolis Community and Technical College (MCTC)
Destination: Diploma to Degree (D3) Longfellow Alternative High School #0001-03-353 Minneapolis Community and Technical College (MCTC)
Destination: Diploma to Degree (D3) Loring Nicollet Alternative School #0001-03-349 Minneapolis Community and Technical College (MCTC)
Destination: Diploma to Degree (D3) Menlo Park Academy #0001-03-373 Minneapolis Community and Technical College (MCTC)
Destination: Diploma to Degree (D3) MERC Alternative School #0001-03-348 Minneapolis Community and Technical College (MCTC)
Destination: Diploma to Degree (D3) NaWayEe Center School #0001-03-361 Minneapolis Community and Technical College (MCTC)
Destination: Diploma to Degree (D3) PYC Arts and Tech High School #0001-03-357 Minneapolis Community and Technical College (MCTC)
Destination: Diploma to Degree (D3) Roosevelt High School - SWS #0001-03-462 Minneapolis Community and Technical College (MCTC)
Destination: Diploma to Degree (D3) Takoda Prep #0001-03-393 Minneapolis Community and Technical College (MCTC)
Destination: Diploma to Degree (D3) Volunteers of America High School #0001-03-419 Minneapolis Community and Technical College (MCTC)
Destination: Diploma to Degree (D3) Washburn High School - SWS #0001-03-457 Minneapolis Community and Technical College (MCTC)
Destination: Diploma to Degree (D3) Wellstone High School - SWS #0001-03-458 Minneapolis Community and Technical College (MCTC)
Destination: Diploma to Degree (D3) Mounds View Adult Education #0621-01-059 Minneapolis Community and Technical College (MCTC)

Rigorous Course Taking 58
State-Approved Early Middle College Program SAAP Name and Number (District Number-Type-Site) Postsecondary Institution Name
Destination: Diploma to Degree (D3) Mounds View ALC #0621-01-060 Minneapolis Community and Technical College (MCTC)
Destination: Diploma to Degree (D3) Metro Heights Academy #0916-06-465 Minneapolis Community and Technical College (MCTC)
Destination: Diploma to Degree (D3) Cooper Academy #0281-01-600 Minneapolis Community and Technical College (MCTC)
Destination: Diploma to Degree (D3) Highview Alternative Learning Center #0281-01-200 Minneapolis Community and Technical College (MCTC)
Early Middle College (EMC) Fergus Falls Fergus Falls Alternative Learning Center #0544-01-370 Minnesota State Community and Technical College
Enter Here! College Transition w/ Support Riverside Academy #0911-01-380 Anoka Ramsey Community College
FED Early/Middle College Freshwater Education District ALC #6004-61-020 Central Lakes College
Focus on the Future Red River Area Learning Center #0152-01-980 MSCTC-Moorhead
Global College Academy Burnsville Alternative Learning Center #0191-01-514 Dakota County Technical College
Hennepin Gateway to College Hennepin Gateway to College #0287-06-801 Hennepin Technical College
Hinckley-Finlayson ALP EMC Program Hinckley-Finlayson Alternative Program #2165-01-040 Pine Technical and Community College
Mora ALC College Connections Mora Alternative Learning Center #0332-01-050 Pine Technical and Community College
Owatonna REACH Owatonna Alternative Learning Center #0761-01-610 Riverland Community College
Pathways College Academy Lakeville Area Learning Center #0194-01-590 Dakota County Technical College
Pathways College Academy Lakeville Area Learning Center #0194-01-590 Inver Hills Community College
Richfield-Normandale Prep Richfield Career Education Program #0280-01-035 Normandale Community College
Saint Paul Gateway to College ALC Gateway to College #0625-01-718 Saint Paul College
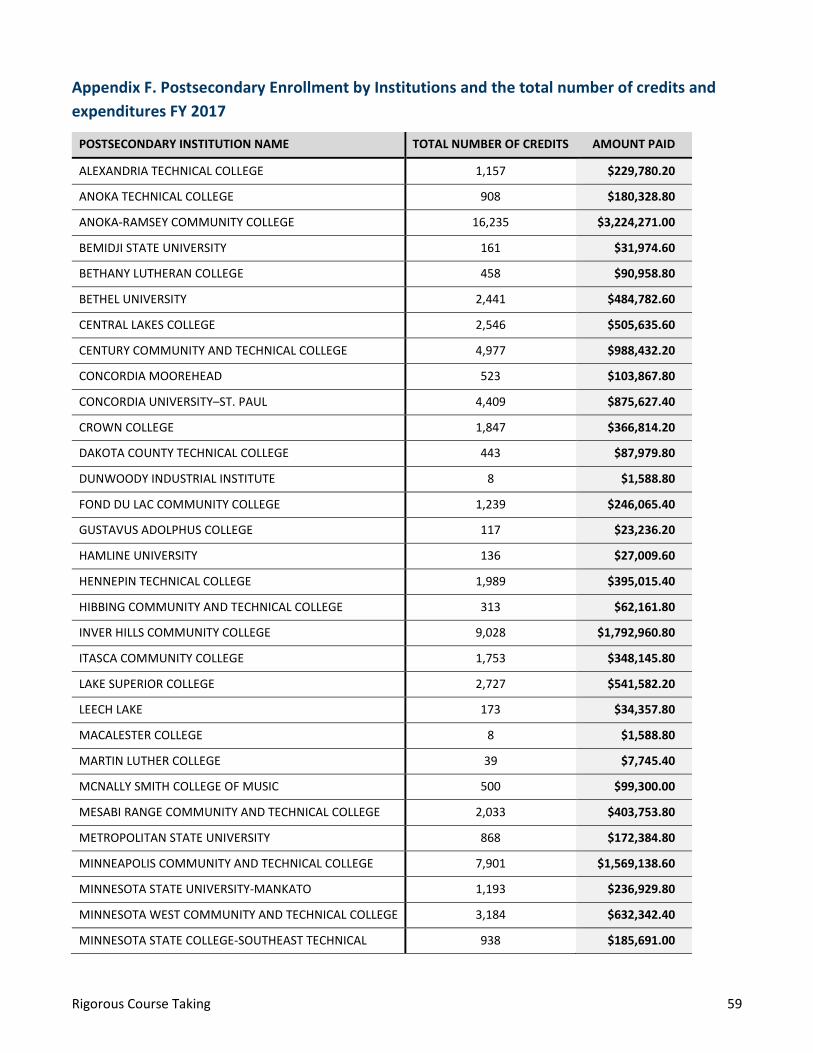
Rigorous Course Taking 59
Appendix F. Postsecondary Enrollment by Institutions and the total number of credits and expenditures FY 2017
POSTSECONDARY INSTITUTION NAME TOTAL NUMBER OF CREDITS AMOUNT PAID
ALEXANDRIA TECHNICAL COLLEGE 1,157 $229,780.20
ANOKA TECHNICAL COLLEGE 908 $180,328.80
ANOKA-RAMSEY COMMUNITY COLLEGE 16,235 $3,224,271.00
BEMIDJI STATE UNIVERSITY 161 $31,974.60
BETHANY LUTHERAN COLLEGE 458 $90,958.80
BETHEL UNIVERSITY 2,441 $484,782.60
CENTRAL LAKES COLLEGE 2,546 $505,635.60
CENTURY COMMUNITY AND TECHNICAL COLLEGE 4,977 $988,432.20
CONCORDIA MOOREHEAD 523 $103,867.80
CONCORDIA UNIVERSITY–ST. PAUL 4,409 $875,627.40
CROWN COLLEGE 1,847 $366,814.20
DAKOTA COUNTY TECHNICAL COLLEGE 443 $87,979.80
DUNWOODY INDUSTRIAL INSTITUTE 8 $1,588.80
FOND DU LAC COMMUNITY COLLEGE 1,239 $246,065.40
GUSTAVUS ADOLPHUS COLLEGE 117 $23,236.20
HAMLINE UNIVERSITY 136 $27,009.60
HENNEPIN TECHNICAL COLLEGE 1,989 $395,015.40
HIBBING COMMUNITY AND TECHNICAL COLLEGE 313 $62,161.80
INVER HILLS COMMUNITY COLLEGE 9,028 $1,792,960.80
ITASCA COMMUNITY COLLEGE 1,753 $348,145.80
LAKE SUPERIOR COLLEGE 2,727 $541,582.20
LEECH LAKE 173 $34,357.80
MACALESTER COLLEGE 8 $1,588.80
MARTIN LUTHER COLLEGE 39 $7,745.40
MCNALLY SMITH COLLEGE OF MUSIC 500 $99,300.00
MESABI RANGE COMMUNITY AND TECHNICAL COLLEGE 2,033 $403,753.80
METROPOLITAN STATE UNIVERSITY 868 $172,384.80
MINNEAPOLIS COMMUNITY AND TECHNICAL COLLEGE 7,901 $1,569,138.60
MINNESOTA STATE UNIVERSITY-MANKATO 1,193 $236,929.80
MINNESOTA WEST COMMUNITY AND TECHNICAL COLLEGE 3,184 $632,342.40
MINNESOTA STATE COLLEGE-SOUTHEAST TECHNICAL 938 $185,691.00

Rigorous Course Taking 60
POSTSECONDARY INSTITUTION NAME TOTAL NUMBER OF CREDITS AMOUNT PAID
MOORHEAD STATE UNIVERSITY 347 $68,914.20
MINNEAPOLIS COLLEGE OF ART AND DESIGN 29 $5,759.40
MSCTC-MOORHEAD CAMPUS 3,043 $604,339.80
NORMANDALE COMMUNITY COLLEGE 10,052 $1,996,327.20
NORTH CENTRAL UNIVERSITY 2,305 $457,773.00
NORTH HENNEPIN COMMUNITY COLLEGE 5,106 $1,014,051.60
NORTHLAND COMMUNITY AND TECHNICAL COLLEGE 503 $99,895.80
NORTHWEST TECHNICAL COLLEGE 110 $21,846.00
OAK HILLS CHRISTIAN COLLEGE 69 $13,703.40
PINE TECHNICAL COLLEGE 303 $60,175.80
PRESENTATION COLLEGE 7 $1,390.20
RAINY RIVER COMMUNITY COLLEGE 151 $29,988.60
RIDGEWATER COLLEGE 4,638 $921,106.80
RIVERLAND COMMUNITY AND TECHNICAL COLLEGE 3,111 $617,844.60
ROCHESTER COMMUNITY AND TECHNICAL COLLEGE 3,839 $762,425.50
SAINT PAUL COLLEGE 5,874 $1,166,576.40
SOUTH CENTRAL TECHNICAL COLLEGE 1,462 $290,353.20
SOUTHWEST STATE UNIVERSITY 516 $102,477.60
ST. CATHERINE UNIVERSITY 244 $48,458.40
ST. CLOUD STATE UNIVERSITY 7,964 $1,581,650.40
ST. CLOUD TECHNCIAL COLLEGE 4,333 $860,533.80
ST. MARY'S COLLEGE 217 $43,096.20
SUMMIT ACADEMY 30 $5,958.00
U OF M – CROOKSTON CAMPUS 618 $122,734.80
U OF M – DULUTH CAMPUS 1,636 $324,909.60
U OF M – EXTENSION 10,678 $2,120,650.80
U OF M – MORRIS CAMPUS 384 $76,262.40
UNIVERSITY OF NORTHWESTERN – ST. PAUL 19,673 $3,907,057.80
VERMILION COMMUNITY COLLEGE 260 $51,636.00
WHITE EARTH 167 $33,166.20
WINONA STATE UNIVERSITY 747 $148,354.20
TOTAL 158,668 $31,510,869.10
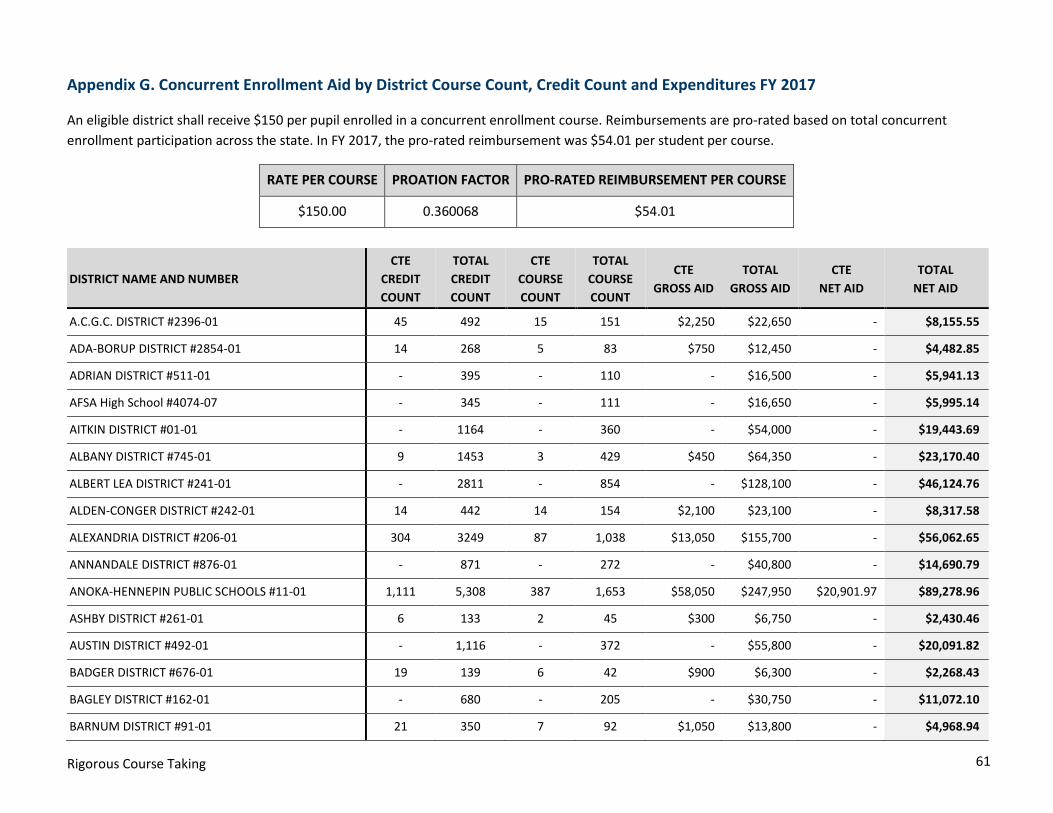
Rigorous Course Taking 61
Appendix G. Concurrent Enrollment Aid by District Course Count, Credit Count and Expenditures FY 2017
An eligible district shall receive $150 per pupil enrolled in a concurrent enrollment course. Reimbursements are pro-rated based on total concurrent enrollment participation across the state. In FY 2017, the pro-rated reimbursement was $54.01 per student per course.
RATE PER COURSE PROATION FACTOR PRO-RATED REIMBURSEMENT PER COURSE
$150.00 0.360068 $54.01
DISTRICT NAME AND NUMBER CTE
CREDIT COUNT
TOTAL CREDIT COUNT
CTE COURSE COUNT
TOTAL COURSE COUNT
CTE GROSS AID
TOTAL GROSS AID
CTE NET AID
TOTAL NET AID
A.C.G.C. DISTRICT #2396-01 45 492 15 151 $2,250 $22,650 - $8,155.55
ADA-BORUP DISTRICT #2854-01 14 268 5 83 $750 $12,450 - $4,482.85
ADRIAN DISTRICT #511-01 - 395 - 110 - $16,500 - $5,941.13
AFSA High School #4074-07 - 345 - 111 - $16,650 - $5,995.14
AITKIN DISTRICT #01-01 - 1164 - 360 - $54,000 - $19,443.69
ALBANY DISTRICT #745-01 9 1453 3 429 $450 $64,350 - $23,170.40
ALBERT LEA DISTRICT #241-01 - 2811 - 854 - $128,100 - $46,124.76
ALDEN-CONGER DISTRICT #242-01 14 442 14 154 $2,100 $23,100 - $8,317.58
ALEXANDRIA DISTRICT #206-01 304 3249 87 1,038 $13,050 $155,700 - $56,062.65
ANNANDALE DISTRICT #876-01 - 871 - 272 - $40,800 - $14,690.79
ANOKA-HENNEPIN PUBLIC SCHOOLS #11-01 1,111 5,308 387 1,653 $58,050 $247,950 $20,901.97 $89,278.96
ASHBY DISTRICT #261-01 6 133 2 45 $300 $6,750 - $2,430.46
AUSTIN DISTRICT #492-01 - 1,116 - 372 - $55,800 - $20,091.82
BADGER DISTRICT #676-01 19 139 6 42 $900 $6,300 - $2,268.43
BAGLEY DISTRICT #162-01 - 680 - 205 - $30,750 - $11,072.10
BARNUM DISTRICT #91-01 21 350 7 92 $1,050 $13,800 - $4,968.94

Rigorous Course Taking 62
DISTRICT NAME AND NUMBER CTE
CREDIT COUNT
TOTAL CREDIT COUNT
CTE COURSE COUNT
TOTAL COURSE COUNT
CTE GROSS AID
TOTAL GROSS AID
CTE NET AID
TOTAL NET AID
BATTLE LAKE DISTRICT #542-01 8 519 2 160 $300 $24,000 - $8,641.64
BECKER DISTRICT #726-01 - 1240 - 336 - $50,400 - $18,147.45
BELGRADE-BROOTEN-ELROSA DISTRICT #2364-01 - 314 - 110 - $16,500 - $5,941.13
BELLE PLAINE DISTRICT #0716-01 - 505 - 146 - $21,900 - $7,885.50
BEMIDJI DISTRICT #0031-01 - 1814 - 513 - $76,950 - $27,707.26
BENSON DISTRICT #0777-01 95 904 39 295 $5,850 $44,250 - $15,933.03
BERTHA-HEWITT SCHOOL DISTRICT #786-01 9 156 3 47 $450 $7,050 - $2,538.48
BIG LAKE DISTRICT #727-01 - 978 - 300 - $45,000 - $16,203.08
BIRD ISLAND-OLIVIA-LAKE LILLIAN #2534-01 - 230 - 58 - $8,700 - $3,132.60
BLACKDUCK DISTRICT #32-01 5 17 2 7 $300 $1,050 $108.02 $378.07
BLOOMING PRAIRIE PUBLIC SCHOOL DIST #756-01 - 352 - 99 - $14,850 - $5,347.02
BLOOMINGTON PUBLIC SCHOOLS #271-01 48 837 12 248 $1,800 $37,200 - $13,394.54
BLUE EARTH AREA PUBLIC SCHOOL #2860-01 - 394 - 106 - $15,900 - $5,725.09
BRAHAM DISTRICT #314-01 27 435 18 128 $2,700 $19,200 - $6,913.31
BRAINERD DISTRICT #181-01 159 1802 53 497 $7,950 $74,550 - $26,843.10
BRANDON-EVANSVILLE SCHOOL DISTRICT #2908-01 7 356 3 111 $450 $16,650 - $5,995.14
BRECKENRIDGE DISTRICT #0846-01 - 537 - 167 - $25,050 - $9,019.71
BROOKLYN CENTER SCHOOL DISTRICT #286-01 165 384 55 117 $8,250 $17,550 $2,970.56 $6,319.20
BROWERVILLE DISTRICT #787-01 - 285 - 85 - $12,750 - $4,590.87
BUFFALO LK-HECTOR-STEWART DISTRICT #2159-01 - 151 - 47 - $7,050 - $2,538.48
BUFFALO-HANOVER-MONTROSE DISTRICT #877-01 815 4464 348 1,595 $52,200 $239,250 $18,795.57 $86,146.37
BURNSVILLE DISTRICT #191-01 295 3992 109 1,075 $16,350 $161,250 $5,887.12 $58,061.03

Rigorous Course Taking 63
DISTRICT NAME AND NUMBER CTE
CREDIT COUNT
TOTAL CREDIT COUNT
CTE COURSE COUNT
TOTAL COURSE COUNT
CTE GROSS AID
TOTAL GROSS AID
CTE NET AID
TOTAL NET AID
BYRON DISTRICT #531-01 - 1142 - 403 - $60,450 - $21,766.14
CALEDONIA DISTRICT #299-01 - 275 - 96 - $14,400 - $5,184.99
CAMBRIDGE-ISANTI PUBLIC SCHOOL DIST #911-01 146 2791 63 816 $9,450 $122,400 - $44,072.37
CANBY DISTRICT #891-01 - 315 - 103 - $15,450 - $5,563.06
CANNON FALLS DISTRICT #252-01 - 3 - 1 - $150 - $54.01
CARLTON DISTRICT #93-01 48 701 16 188 $2,400 $28,200 - $10,153.93
CEDAR MOUNTAIN SCHOOL DISTRICT #2754-01 - 76 - 23 - $3,450 - $1,242.24
CENTENNIAL DISTRICT #12-01 - 671 - 163 - $24,450 - $8,803.67
CENTRAL DISTRICT #108-01 - 384 - 86 - $12,900 - $4,644.88
CHATFIELD PUBLIC SCHOOLS #0227-01 - 245 - 77 - $11,550 - $4,158.79
CHISAGO LAKES SCHOOL DISTRICT #2144-01 481 3157 162 968 $24,300 $145,200 - $52,281.93
CHISHOLM DISTRICT #695-01 69 207 23 69 $3,450 $10,350 - $3,726.71
CHOKIO-ALBERTA DISTRICT #771-01 - 110 - 34 - $5,100 - $1,836.35
CITY ACADEMY #4000-07 - 39 - 11 - $1,650 - $594.11
CLEARBROOK-GONVICK SCHOOL DISTRICT #2311-01 5 158 2 47 $300 $7,050 - $2,538.48
CLEVELAND DISTRICT #391-01 - 440 - 137 - $20,550 - $7,399.41
CLIMAX-SHELLY PUBLIC SCHOOLS #592-01 4 92 1 30 $150 $4,500 - $1,620.31
CLINTON-GRACEVILLE-BEARDSLEY #2888-01 12 298 4 91 $600 $13,650 - $4,914.93
CLOQUET DISTRICT #94-01 197 2330 79 689 $11,850 $103,350 $4,266.81 $37,213.07
COMMUNITY OF PEACE ACADEMY #4015-07 - 192 - 55 - $8,250 - $2,970.56
COOK COUNTY PUBLIC SCHOOLS #166-01 - 87 - 29 - $4,350 - $1,566.30
CROMWELL-WRIGHT PUBLIC SCHOOLS #95-01 60 151 20 41 $3,000 $6,150 - $2,214.42

Rigorous Course Taking 64
DISTRICT NAME AND NUMBER CTE
CREDIT COUNT
TOTAL CREDIT COUNT
CTE COURSE COUNT
TOTAL COURSE COUNT
CTE GROSS AID
TOTAL GROSS AID
CTE NET AID
TOTAL NET AID
CROOKSTON DISTRICT #593-01 - 210 - 70 - $10,500 - $3,780.72
CROSBY-IRONTON SCHOOL DISTRICT #182-01 51 1198 24 353 $3,600 $52,950 - $19,065.62
DASSEL-COKATO DISTRICT #466-01 - 1420 - 477 - $71,550 - $25,762.89
DAWSON-BOYD DISTRICT #378-01 - 160 - 48 - $7,200 - $2,592.49
DEER RIVER DISTRICT #317-01 59 496 19 143 $2,850 $21,450 $1,026.19 $7,723.47
DELANO DISTRICT #879-01 - 1654 - 517 - $77,550 - $27,923.31
DETROIT LAKES DISTRICT #22-01 - 1435 - 373 - $55,950 - $20,145.83
DILWORTH-GLYNDON-FELTON #2164-01 - 1129 - 325 - $48,750 - $17,553.34
DOVER-EYOTA DISTRICT #533-01 - 305 - 73 - $10,950 - $3,942.75
DULUTH DISTRICT #709-01 512 5763 197 1,566 $29,550 $234,900 $10,640.02 $84,580.07
EAGLE RIDGE ACADEMY CHARTER #4122-07 - 44 - 11 - $1,650 - $594.11
EAGLE VALLEY DISTRICT #2759-01 - 22 - 6 - $900 - $324.06
EAST CENTRAL SCHOOL DISTRICT #2580-01 96 550 46 174 $6,900 $26,100 - $9,397.79
EAST GRAND FORKS PUBLIC SCHOOL DIST #595-01 44 1378 16 429 $2,400 $64,350 - $23,170.40
EDEN PRAIRIE DISTRICT #272-01 - 1480 - 296 - $44,400 - $15,987.04
EDEN VALLEY-WATKINS SCHOOL DISTRICT #463-01 - 699 - 184 - $27,600 - $9,937.89
EDGERTON DISTRICT #581-01 - 176 - 55 - $8,250 - $2,970.56
EDINA DISTRICT #273-01 - 588 - 160 - $24,000 - $8,641.64
EL COLEGIO CHARTER SCHOOL #4057-07 - 15 - 5 - $750 - $270.05
ELK RIVER DISTRICT #728-01 - 3985 - 1,067 - $160,050 - $57,628.95
ELLSWORTH DISTRICT #514-01 - 21 - 7 - $1,050 - $378.07
ELY DISTRICT #696-01 34 477 17 139 $2,550 $20,850 - $7,507.43

Rigorous Course Taking 65
DISTRICT NAME AND NUMBER CTE
CREDIT COUNT
TOTAL CREDIT COUNT
CTE COURSE COUNT
TOTAL COURSE COUNT
CTE GROSS AID
TOTAL GROSS AID
CTE NET AID
TOTAL NET AID
ESKO DISTRICT #99-01 - 1580 - 491 - $73,650 - $26,519.04
EVELETH-GILBERT SCHOOL DISTRICT #2154-01 34 581 17 164 $2,550 $24,600 - $8,857.68
FACE TO FACE ACADEMY CHARTER #4036-07 - 81 - 23 - $3,450 - $1,242.24
FAIRMONT AREA SCHOOL DISTRICT #2752-01 64 567 16 173 $2,400 $25,950 - $9,343.78
FARIBAULT DISTRICT #656-01 39 719 17 202 $2,550 $30,300 - $10,910.07
FARMINGTON DISTRICT #192-01 - 551 - 142 - $21,300 - $7,669.46
FERGUS FALLS DISTRICT #544-01 98 1566 28 474 $4,200 $71,100 - $25,600.86
FERTILE-BELTRAMI SCHOOL DISTRICT #599-01 4 669 2 231 $300 $34,650 - $12,476.37
FILLMORE CENTRAL #2198-01 - 422 - 131 - $19,650 - $7,075.34
FISHER DISTRICT #600-01 18 259 6 76 $900 $11,400 - $4,104.78
FLOODWOOD DISTRICT #698-01 - 8 - 2 - $300 - $108.02
FOLEY DISTRICT #51-01 - 1530 - 452 - $67,800 - $24,412.64
FOREST LAKE DISTRICT #831-01 1135 2859 349 853 $52,350 $127,950 $18,849.58 $46,070.75
FOSSTON DISTRICT #601-01 - 353 - 107 - $16,050 - $5,779.10
FRAZEE-VERGAS DISTRICT #23-01 6 716 2 222 $300 $33,300 $108.02 $11,990.28
FRIDLEY DISTRICT #14-01 204 204 56 56 $8,400 $8,400 - $3,024.57
FULDA DISTRICT #505-01 - 759 - 224 - $33,600 - $12,098.30
G.F.W. #2365-01 - 255 - 85 - $12,750 - $4,590.87
GLENCOE-SILVER LAKE SCHOOL DISTRICT #2859-01 39 693 19 232 $2,850 $34,800 - $12,530.38
GOODHUE DISTRICT #253-01 17 172 6 57 $900 $8,550 - $3,078.58
GOODRIDGE DISTRICT #561-01 3 86 1 29 $150 $4,350 - $1,566.30
GRAND MEADOW SCHOOL DISTRICT #495-01 - 127 - 39 - $5,850 - $2,106.40

Rigorous Course Taking 66
DISTRICT NAME AND NUMBER CTE
CREDIT COUNT
TOTAL CREDIT COUNT
CTE COURSE COUNT
TOTAL COURSE COUNT
CTE GROSS AID
TOTAL GROSS AID
CTE NET AID
TOTAL NET AID
GRAND RAPIDS DISTRICT #318-01 161 1532 56 440 $8,400 $66,000 - $23,764.52
GREENBUSH-MIDDLE RIVER SCHOOL DIST. #2683-01 3 203 1 60 $150 $9,000 - $3,240.62
GREENWAY DISTRICT #316-01 193 813 104 275 $15,600 $41,250 - $14,852.82
GRYGLA DISTRICT #447-01 8 59 3 20 $450 $3,000 - $1,080.21
HANCOCK DISTRICT #768-01 117 492 39 149 $5,850 $22,350 - $8,047.53
HARBOR CITY INTERNATIONAL CHARTER #4085-07 - 166 - 47 - $7,050 - $2,538.48
HASTINGS DISTRICT #200-01 - 1235 - 357 - $53,550 - $19,281.66
HAWLEY DISTRICT #150-01 83 1311 28 466 $4,200 $69,900 - $25,168.78
HAYFIELD DISTRICT #203-01 84 324 32 102 $4,800 $15,300 - $5,509.05
HENNING DISTRICT #545-01 135 333 45 111 $6,750 $16,650 - $5,995.14
HERMAN-NORCROSS SCHOOL DISTRICT #264-01 - 20 - 5 - $750 - $270.05
HERMANTOWN DISTRICT #700-01 295 1681 99 438 $14,850 $65,700 - $23,656.49
HERON LAKE-OKABENA SCHOOL DISTRICT #330-01 - 204 - 70 - $10,500 - $3,780.72
HIBBING DISTRICT #701-01 169 659 69 205 $10,350 $30,750 - $11,072.10
HILL CITY DISTRICT #02-01 4 31 2 11 $300 $1,650 - $594.11
HINCKLEY-FINLAYSON SCHOOL DISTRICT #2165-01 45 451 21 142 $3,150 $21,300 - $7,669.46
HMONG COLLEGE PREP ACADEMY #4103-07 - 320 - 80 - $12,000 - $4,320.82
HOLDINGFORD DISTRICT #738-01 - 1039 - 321 - $48,150 - $17,337.29
HOPKINS DISTRICT #270-01 573 2077 191 525 $28,650 $78,750 $10,315.96 $28,355.39
HOUSTON DISTRICT #294-01 - 5 - 1 - $150 - $54.01
HOWARD LAKE-WAVERLY-WINSTED #2687-01 27 99 9 29 $1,350 $4,350 - $1,566.30
HUTCHINSON DISTRICT #423-01 - 670 - 211 - $31,650 - $11,396.17

Rigorous Course Taking 67
DISTRICT NAME AND NUMBER CTE
CREDIT COUNT
TOTAL CREDIT COUNT
CTE COURSE COUNT
TOTAL COURSE COUNT
CTE GROSS AID
TOTAL GROSS AID
CTE NET AID
TOTAL NET AID
INTERNATIONAL FALLS SCHOOL DISTRICT #361-01 235 955 98 311 $14,700 $46,650 $5,293.01 $16,797.19
INVER GROVE HEIGHTS SCHOOLS #199-01 216 385 48 83 $7,200 $12,450 $2,592.49 $4,482.85
ISLE DISTRICT #473-01 15 205 5 57 $750 $8,550 - $3,078.58
JACKSON COUNTY CENTRAL DISTRICT #2895-01 76 544 19 156 $2,850 $23,400 - $8,425.60
JANESVILLE-WALDORF-PEMBERTON #2835-01 54 222 18 71 $2,700 $10,650 - $3,834.73
JORDAN DISTRICT #717-01 - 457 - 125 - $18,750 - $6,751.28
KASSON-MANTORVILLE SCHOOL DISTRICT #204-01 - 1045 - 435 - $65,250 - $23,494.46
KELLIHER DISTRICT #36-01 11 62 4 21 $600 $3,150 - $1,134.22
KENYON-WANAMINGO SCHOOL DISTRICT #2172-01 - 21 - 7 - $1,050 - $378.07
KERKHOVEN-MURDOCK-SUNBURG #775-01 27 136 9 46 $1,350 $6,900 - $2,484.47
KIMBALL DISTRICT #739-01 36 888 18 238 $2,700 $35,700 - $12,854.44
KINGSLAND DISTRICT #2137-01 - 674 - 208 - $31,200 - $11,234.13
KITTSON CENTRAL SCHOOL DISTRICT #2171-01 6 294 2 103 $300 $15,450 - $5,563.06
LA CRESCENT-HOKAH SCHOOL DISTRICT #300-01 - 365 - 86 - $12,900 - $4,644.88
LAC QUI PARLE VALLEY SCHOOL DIST. #2853-01 - 491 - 170 - $25,500 - $9,181.74
LAKE CITY DISTRICT #813-01 - 156 - 52 - $7,800 - $2,808.53
LAKE CRYSTAL-WELLCOME MEMORIAL #2071-01 - 174 - 55 - $8,250 - $2,970.56
LAKE OF THE WOODS SCHOOL DISTRICT #390-01 5 536 2 174 $300 $26,100 $108.02 $9,397.79
LAKE PARK AUDUBON SCHOOL DISTRICT #2889-01 - 287 - 83 - $12,450 - $4,482.85
LAKE SUPERIOR DISTRICT #381-01 64 880 29 227 $4,350 $34,050 - $12,260.33
LAKEVIEW SCHOOL DISTRICT #2167-01 - 441 - 129 - $19,350 - $6,967.32
LAKEVILLE DISTRICT #194-01 273 1103 82 420 $12,300 $63,000 - $22,684.31

Rigorous Course Taking 68
DISTRICT NAME AND NUMBER CTE
CREDIT COUNT
TOTAL CREDIT COUNT
CTE COURSE COUNT
TOTAL COURSE COUNT
CTE GROSS AID
TOTAL GROSS AID
CTE NET AID
TOTAL NET AID
LANCASTER DISTRICT #356-01 11 77 4 26 $600 $3,900 - $1,404.27
LANESBORO DISTRICT #229-01 - 109 - 29 - $4,350 - $1,566.30
LAPORTE DISTRICT #306-01 3 30 1 10 $150 $1,500 - $540.10
LE SUEUR-HENDERSON SCHOOL DISTRICT #2397-01 6 70 2 18 $300 $2,700 - $972.18
LESTER PRAIRIE DISTRICT #424-01 - 92 - 20 - $3,000 - $1,080.21
LINCOLN INTERNATIONAL SCHOOL #4178-07 - 36 - 12 - $1,800 - $648.12
LITCHFIELD DISTRICT #465-01 - 1219 - 327 - $49,050 - $17,661.36
LITTLE FALLS DISTRICT #482-01 42 1729 14 505 $2,100 $75,750 - $27,275.18
LITTLEFORK-BIG FALLS SCHOOL DIST. #362-01 - 72 - 24 - $3,600 - $1,296.25
LONG PRAIRIE-GREY EAGLE DISTRICT #2753-01 15 1310 5 395 $750 $59,250 - $21,334.05
LUVERNE DISTRICT #2184-01 - 345 - 115 - $17,250 - $6,211.18
MACCRAY SCHOOL DISTRICT #2180-01 18 255 6 77 $900 $11,550 - $4,158.79
MADELIA DISTRICT #837-01 - 265 - 66 - $9,900 - $3,564.68
MAHNOMEN DISTRICT #432-01 40 183 16 60 $2,400 $9,000 - $3,240.62
MAHTOMEDI DISTRICT #832-01 - 1234 - 268 - $40,200 - $14,474.75
MAPLE LAKE DISTRICT #881-01 - 794 - 217 - $32,550 - $11,720.23
MAPLE RIVER SCHOOL DISTRICT #2135-01 - 575 - 169 - $25,350 - $9,127.73
MARSHALL COUNTY CENTRAL SCHOOLS #441-01 6 282 2 96 $300 $14,400 - $5,184.99
MARSHALL DISTRICT #413-01 30 503 15 197 $2,250 $29,550 - $10,640.02
MARTIN COUNTY WEST SCHOOL DISTRICT #2448-01 - 451 - 115 - $17,250 - $6,211.18
MCGREGOR DISTRICT #04-01 - 66 - 22 - $3,300 - $1,188.23
MEDFORD DISTRICT #763-01 - 291 - 95 - $14,250 - $5,130.97

Rigorous Course Taking 69
DISTRICT NAME AND NUMBER CTE
CREDIT COUNT
TOTAL CREDIT COUNT
CTE COURSE COUNT
TOTAL COURSE COUNT
CTE GROSS AID
TOTAL GROSS AID
CTE NET AID
TOTAL NET AID
MELROSE DISTRICT #740-01 - 2690 - 782 - $117,300 - $42,236.02
MENAHGA DISTRICT #821-01 - 153 - 51 - $7,650 - $2,754.52
MESABI EAST SCHOOL DISTRICT #2711-01 62 452 33 144 $4,950 $21,600 - $7,777.48
MILACA DISTRICT #912-01 40 1058 25 317 $3,750 $47,550 - $17,121.25
MINNEAPOLIS DISTRICT #01-03 425 2945 175 849 $26,250 $127,350 $9,451.80 $45,854.71
MINNEOTA DISTRICT #414-01 - 246 - 77 - $11,550 - $4,158.79
MINNESOTA ONLINE High School #4150-07 - 3 - 1 - $150 - $54.01
MINNESOTA TRANSITIONS CHARTER SCH #4017-07 - 21 - 7 - $1,050 - $378.07
MINNETONKA DISTRICT #276-01 - 190 - 38 - $5,700 - $2,052.39
MINNEWASKA SCHOOL DISTRICT #2149-01 - 1455 - 439 - $65,850 - $23,710.50
MONTEVIDEO DISTRICT #129-01 9 713 3 190 $450 $28,500 - $10,261.95
MONTICELLO DISTRICT #882-01 59 2342 21 700 $3,150 $105,000 - $37,807.18
MOORHEAD DISTRICT #152-01 - 615 - 161 - $24,150 - $8,695.65
MOOSE LAKE DISTRICT #97-01 - 230 - 60 - $9,000 - $3,240.62
MORA DISTRICT #332-01 - 649 - 161 - $24,150 - $8,695.65
MORRIS AREA PUBLIC SCHOOLS #2769-01 33 839 11 227 $1,650 $34,050 - $12,260.33
MOUNDS VIEW DISTRICT #621-01 714 10581 186 2,757 $27,900 $413,550 - $148,906.29
MOUNTAIN IRON-BUHL SCHOOL DISTRICT #712-01 48 379 18 120 $2,700 $18,000 - $6,481.23
MOUNTAIN LAKE PUBLIC SCHOOLS #173-01 - 103 - 43 - $6,450 - $2,322.44
MURRAY COUNTY CENTRAL DISTRICT #2169-01 - 296 - 91 - $13,650 - $4,914.93
NASHWAUK-KEEWATIN SCHOOL DISTRICT #319-01 78 380 37 135 $5,550 $20,250 - $7,291.39
NEVIS DISTRICT #308-01 39 591 13 187 $1,950 $28,050 - $10,099.92

Rigorous Course Taking 70
DISTRICT NAME AND NUMBER CTE
CREDIT COUNT
TOTAL CREDIT COUNT
CTE COURSE COUNT
TOTAL COURSE COUNT
CTE GROSS AID
TOTAL GROSS AID
CTE NET AID
TOTAL NET AID
NEW LONDON-SPICER SCHOOL DISTRICT #345-01 27 556 9 162 $1,350 $24,300 - $8,749.66
NEW PRAGUE AREA SCHOOLS #721-01 - 1477 - 445 - $66,750 - $24,034.57
NEW ULM DISTRICT #88-01 - 1295 - 375 - $56,250 - $20,253.85
NEW YORK MILLS DISTRICT #553-01 3 378 1 122 $150 $18,300 - $6,589.25
NICOLLET DISTRICT #507-01 - 411 - 119 - $17,850 - $6,427.22
NORMAN COUNTY EAST DISTRICT #2215-01 61 319 22 108 $3,300 $16,200 - $5,833.11
NORMAN COUNTY WEST DISTRICT #2527-01 23 116 9 40 $1,350 $6,000 - $2,160.41
NORTH BRANCH PUBLIC SCHOOLS #138-01 - 1611 - 430 - $64,500 - $23,224.41
NORTH LAKES ACADEMY #4053-07 - 240 - 60 - $9,000 - $3,240.62
NORTH ST PAUL-MAPLEWOOD OAKDALE #622-01 - 2911 - 795 - $119,250 - $42,938.16
NORTHLAND COMMUNITY SCHOOLS #118-01 28 146 13 50 $1,950 $7,500 - $2,700.51
NOVA CLASSICAL ACADEMY #4098-07 - 368 - 88 - $13,200 - $4,752.90
NRHEG SCHOOL DISTRICT #2168-01 - 466 - 158 - $23,700 - $8,533.62
OGILVIE DISTRICT #333-01 18 29 6 9 $900 $1,350 - $486.09
ONAMIA DISTRICT #480-01 12 115 4 31 $600 $4,650 - $1,674.32
ORONO DISTRICT #278-01 135 187 45 58 $6,750 $8,700 - $3,132.60
ORTONVILLE PUBLIC SCHOOLS #2903-01 20 140 7 46 $1,050 $6,900 $378.07 $2,484.47
OSAKIS DISTRICT #213-01 45 1435 14 454 $2,100 $68,100 - $24,520.66
OWATONNA DISTRICT #761-01 - 2030 - 519 - $77,850 - $28,031.33
PACT CHARTER SCHOOL #4008-07 - 113 - 33 - $4,950 - $1,782.34
PARK RAPIDS DISTRICT #309-01 - 994 - 334 - $50,100 - $18,039.43
PARKERS PRAIRIE DISTRICT #547-01 26 688 8 207 $1,200 $31,050 - $11,180.12

Rigorous Course Taking 71
DISTRICT NAME AND NUMBER CTE
CREDIT COUNT
TOTAL CREDIT COUNT
CTE COURSE COUNT
TOTAL COURSE COUNT
CTE GROSS AID
TOTAL GROSS AID
CTE NET AID
TOTAL NET AID
PARNASSUS PREPARATORY CHARTER #4199-07 - 110 - 22 - $3,300 - $1,188.23
PAYNESVILLE DISTRICT #741-01 - 439 - 145 - $21,750 - $7,831.49
PELICAN RAPIDS DISTRICT #548-01 - 141 - 42 - $6,300 - $2,268.43
PEQUOT LAKES PUBLIC SCHOOLS #186-01 269 2561 107 783 $16,050 $117,450 - $42,290.04
PERHAM-DENT DISTRICT #549-01 54 615 18 237 $2,700 $35,550 - $12,800.43
PIERZ DISTRICT #484-01 174 1495 65 483 $9,750 $72,450 - $26,086.96
PILLAGER DISTRICT #116-01 - 808 - 228 - $34,200 - $12,314.34
PINE CITY DISTRICT #578-01 96 993 57 294 $8,550 $44,100 - $15,879.02
PINE ISLAND DISTRICT #255-01 - 618 - 194 - $29,100 - $10,477.99
PINE RIVER-BACKUS SCHOOL DISTRICT #2174-01 51 1019 17 318 $2,550 $47,700 - $17,175.26
PIPESTONE AREA SCHOOL DISTRICT #2689-01 - 563 - 144 - $21,600 - $7,777.48
PLAINVIEW-ELGIN-MILLVILLE #2899-01 - 687 - 192 - $28,800 - $10,369.97
PRINCETON DISTRICT #477-01 - 1236 - 323 - $48,450 - $17,445.31
PRIOR LAKE-SAVAGE AREA SCHOOLS #719-01 280 2026 84 527 $12,600 $79,050 - $28,463.41
PROCTOR DISTRICT #704-01 - 1246 - 375 - $56,250 - $20,253.85
RED LAKE COUNTY CENTRAL PUBLIC SCH #2906-01 66 445 21 144 $3,150 $21,600 - $7,777.48
RED LAKE FALLS DISTRICT #630-01 3 195 1 65 $150 $9,750 - $3,510.67
RED ROCK CENTRAL SCHOOL DISTRICT #2884-01 - 179 - 55 - $8,250 - $2,970.56
RED WING DISTRICT #256-01 - 1079 - 309 - $46,350 - $16,689.17
REDWOOD AREA SCHOOL DISTRICT #2897-01 - 120 - 40 - $6,000 - $2,160.41
RENVILLE COUNTY WEST DISTRICT #2890-01 18 335 6 93 $900 $13,950 - $5,022.95
RICHFIELD DISTRICT #280-01 - 1558 - 438 - $65,700 - $23,656.49

Rigorous Course Taking 72
DISTRICT NAME AND NUMBER CTE
CREDIT COUNT
TOTAL CREDIT COUNT
CTE COURSE COUNT
TOTAL COURSE COUNT
CTE GROSS AID
TOTAL GROSS AID
CTE NET AID
TOTAL NET AID
ROBBINSDALE DISTRICT #281-01 - 72 - 18 - $2,700 - $972.18
ROCHESTER DISTRICT #535-01 - 791 - 226 - $33,900 - $12,206.32
ROCKFORD DISTRICT #883-01 - 719 - 209 - $31,350 - $11,288.14
ROCORI DISTRICT #750-01 - 3480 - 985 - $147,750 - $53,200.11
ROSEAU DISTRICT #682-01 - 809 - 254 - $38,100 - $13,718.61
ROSEMOUNT-APPLE VALLEY-EAGAN #196-01 112 6819 28 1,566 $4,200 $234,900 - $84,580.07
ROSEVILLE DISTRICT #623-01 343 1226 143 375 $21,450 $56,250 $7,723.47 $20,253.85
ROYALTON DISTRICT #485-01 33 256 15 92 $2,250 $13,800 - $4,968.94
RTR PUBLIC SCHOOLS #2902-01 - 411 - 128 - $19,200 - $6,913.31
RUSH CITY DISTRICT #139-01 32 461 8 128 $1,200 $19,200 - $6,913.31
RUSHFORD-PETERSON PUBLIC SCHOOLS #239-01 - 307 - 98 - $14,700 - $5,293.01
SARTELL-ST. STEPHEN SCHOOL DISTRICT #748-01 168 2433 42 680 $6,300 $102,000 - $36,726.98
SAUK CENTRE DISTRICT #743-01 18 1587 6 436 $900 $65,400 - $23,548.47
SAUK RAPIDS-RICE PUBLIC SCHOOLS #47-01 - 1100 - 267 - $40,050 - $14,420.74
SEBEKA DISTRICT #820-01 15 515 5 158 $750 $23,700 - $8,533.62
SHAKOPEE DISTRICT #720-01 211 3301 61 853 $9,150 $127,950 - $46,070.75
SIBLEY EAST SCHOOL DISTRICT #2310-01 30 776 10 233 $1,500 $34,950 - $12,584.39
SLEEPY EYE DISTRICT #84-01 - 326 - 99 - $14,850 - $5,347.02
SOUTH KOOCHICHING SCHOOL DISTRICT #363-01 8 10 3 4 $450 $600 - $216.04
SOUTH WASHINGTON COUNTY DISTRICT #833-01 - 2538 - 607 - $91,050 - $32,784.23
SPECTRUM High School #4160-07 87 1163 29 340 $4,350 $51,000 - $18,363.49
SPRING GROVE SCHOOL DISTRICT #297-01 - 60 - 20 - $3,000 - $1,080.21

Rigorous Course Taking 73
DISTRICT NAME AND NUMBER CTE
CREDIT COUNT
TOTAL CREDIT COUNT
CTE COURSE COUNT
TOTAL COURSE COUNT
CTE GROSS AID
TOTAL GROSS AID
CTE NET AID
TOTAL NET AID
SPRING LAKE PARK PUBLIC SCHOOLS #16-01 - 431 - 94 - $14,100 - $5,076.96
SPRINGFIELD DISTRICT #85-01 - 373 - 116 - $17,400 - $6,265.19
ST PAUL CONSERVATORY PERFORMING ART #4112-07 - 508 - 127 - $19,050 - $6,859.30
ST. ANTHONY-NEW BRIGHTON SCHOOLS #282-01 - 405 - 85 - $12,750 - $4,590.87
ST. CHARLES DISTRICT #858-01 - 42 - 14 - $2,100 - $756.14
ST. CLAIR DISTRICT #75-01 - 779 - 250 - $37,500 - $13,502.57
ST. CLOUD DISTRICT #742-01 96 2312 27 620 $4,050 $93,000 $1,458.28 $33,486.36
ST. FRANCIS DISTRICT #15-01 - 1606 - 511 - $76,650 - $27,599.24
ST. JAMES DISTRICT #840-01 - 535 - 147 - $22,050 - $7,939.51
ST. LOUIS COUNTY SCHOOL DISTRICT #2142-01 179 1535 75 485 $11,250 $72,750 - $26,194.98
ST. MICHAEL-ALBERTVILLE DISTRICT #885-01 - 966 - 222 - $33,300 - $11,990.28
ST. PAUL DISTRICT #625-01 167 5217 73 1,421 $10,950 $213,150 $3,942.75 $76,748.58
ST. PETER DISTRICT #508-01 36 905 12 248 $1,800 $37,200 - $13,394.54
STAPLES-MOTLEY SCHOOL DISTRICT #2170-01 132 726 44 203 $6,600 $30,450 - $10,964.08
STEPHEN-ARGYLE CENTRAL SCHOOLS #2856-01 12 621 4 211 $600 $31,650 - $11,396.17
STEWARTVILLE DISTRICT #534-01 24 881 12 272 $1,800 $40,800 - $14,690.79
STILLWATER AREA PUBLIC SCHOOLS #834-01 65 509 24 265 $3,600 $39,750 - $14,312.72
SWANVILLE DISTRICT #486-01 - 203 - 62 - $9,300 - $3,348.64
TECHNICAL ACADEMIES OF MINNESOTA #4217-07 - 22 - 11 - $1,650 - $594.11
THIEF RIVER FALLS SCHOOL DISTRICT #564-01 - 750 - 247 - $37,050 - $13,340.53
TRACY AREA DISTRICT #2904-01 - 333 - 99 - $14,850 - $5,347.02
TREKNORTH High School #4106-07 8 29 3 10 $450 $1,500 - $540.10
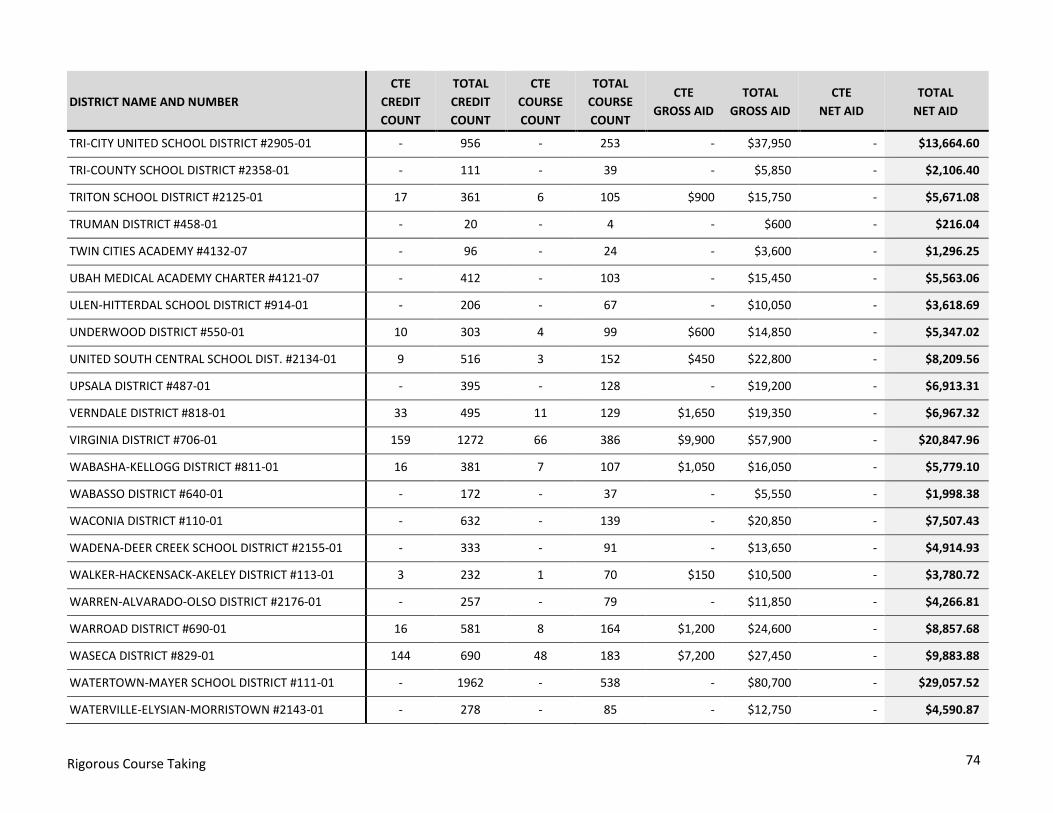
Rigorous Course Taking 74
DISTRICT NAME AND NUMBER CTE
CREDIT COUNT
TOTAL CREDIT COUNT
CTE COURSE COUNT
TOTAL COURSE COUNT
CTE GROSS AID
TOTAL GROSS AID
CTE NET AID
TOTAL NET AID
TRI-CITY UNITED SCHOOL DISTRICT #2905-01 - 956 - 253 - $37,950 - $13,664.60
TRI-COUNTY SCHOOL DISTRICT #2358-01 - 111 - 39 - $5,850 - $2,106.40
TRITON SCHOOL DISTRICT #2125-01 17 361 6 105 $900 $15,750 - $5,671.08
TRUMAN DISTRICT #458-01 - 20 - 4 - $600 - $216.04
TWIN CITIES ACADEMY #4132-07 - 96 - 24 - $3,600 - $1,296.25
UBAH MEDICAL ACADEMY CHARTER #4121-07 - 412 - 103 - $15,450 - $5,563.06
ULEN-HITTERDAL SCHOOL DISTRICT #914-01 - 206 - 67 - $10,050 - $3,618.69
UNDERWOOD DISTRICT #550-01 10 303 4 99 $600 $14,850 - $5,347.02
UNITED SOUTH CENTRAL SCHOOL DIST. #2134-01 9 516 3 152 $450 $22,800 - $8,209.56
UPSALA DISTRICT #487-01 - 395 - 128 - $19,200 - $6,913.31
VERNDALE DISTRICT #818-01 33 495 11 129 $1,650 $19,350 - $6,967.32
VIRGINIA DISTRICT #706-01 159 1272 66 386 $9,900 $57,900 - $20,847.96
WABASHA-KELLOGG DISTRICT #811-01 16 381 7 107 $1,050 $16,050 - $5,779.10
WABASSO DISTRICT #640-01 - 172 - 37 - $5,550 - $1,998.38
WACONIA DISTRICT #110-01 - 632 - 139 - $20,850 - $7,507.43
WADENA-DEER CREEK SCHOOL DISTRICT #2155-01 - 333 - 91 - $13,650 - $4,914.93
WALKER-HACKENSACK-AKELEY DISTRICT #113-01 3 232 1 70 $150 $10,500 - $3,780.72
WARREN-ALVARADO-OLSO DISTRICT #2176-01 - 257 - 79 - $11,850 - $4,266.81
WARROAD DISTRICT #690-01 16 581 8 164 $1,200 $24,600 - $8,857.68
WASECA DISTRICT #829-01 144 690 48 183 $7,200 $27,450 - $9,883.88
WATERTOWN-MAYER SCHOOL DISTRICT #111-01 - 1962 - 538 - $80,700 - $29,057.52
WATERVILLE-ELYSIAN-MORRISTOWN #2143-01 - 278 - 85 - $12,750 - $4,590.87

Rigorous Course Taking 75
DISTRICT NAME AND NUMBER CTE
CREDIT COUNT
TOTAL CREDIT COUNT
CTE COURSE COUNT
TOTAL COURSE COUNT
CTE GROSS AID
TOTAL GROSS AID
CTE NET AID
TOTAL NET AID
WAUBUN-OGEMA-WHITE EARTH DISTRICT #435-01 37 201 14 69 $2,100 $10,350 - $3,726.71
WAYZATA DISTRICT #284-01 1,075 1,148 338 379 $50,700 $56,850 $18,255.47 $20,469.89
WEST CENTRAL AREA #2342-01 - 46 - 14 - $2,100 - $756.14
WEST ST. PAUL-MENDOTA HTS.-EAGAN #197-01 - 974 - 223 - $33,450 - $12,044.29
WESTBROOK-WALNUT GROVE SCHOOLS #2898-01 - 212 - 73 - $10,950 - $3,942.75
WESTONKA DISTRICT #277-01 - 320 - 64 - $9,600 - $3,456.66
WHEATON AREA DISTRICT #803-01 - 366 - 98 - $14,700 - $5,293.01
WHITE BEAR LAKE SCHOOL DISTRICT #624-01 137 2,344 60 591 $9,000 $88,650 - $31,920.06
WILLMAR DISTRICT #347-01 8 632 6 150 $900 $22,500 - $8,101.54
WILLOW RIVER DISTRICT #577-01 - 71 - 21 - $3,150 - $1,134.22
WINDOM DISTRICT #177-01 - 795 - 224 - $33,600 - $12,098.30
WIN-E-MAC SCHOOL DISTRICT #2609-01 48 540 18 185 $2,700 $27,750 - $9,991.90
WINONA AREA DISTRICT #861-01 136 481 34 121 $5,100 $18,150 - $6,535.24
WORTHINGTON DISTRICT #518-01 39 110 26 45 $3,900 $6,750 - $2,430.46
WRENSHALL DISTRICT #100-01 - 73 - 27 - $4,050 - $1,458.28
YELLOW MEDICINE EAST #2190-01 18 299 6 90 $900 $13,500 - $4,860.92
ZUMBROTA-MAZEPPA SCHOOL DISTRICT #2805-01 - 241 - 73 - $10,950 - $3,942.75
TOTALS 16,348 255,527 5,792 74,059 $868,800 $11,108,850 $312,827.44 $3,999,945.91

Rigorous Course Taking 76
Appendix H. Concurrent Enrollment by Institutions and the total number of credits FY 2017
POSTSECONDARY INSTITUTION TOTAL NUMBER OF CREDITS
ALEXANDRIA TECHNICAL COLLEGE 6,130
ANOKA TECHNICAL COLLEGE 1,111
ANOKA-RAMSEY 15,088
BEMIDJI STATE UNIVERSITY 2,835
BETHEL UNIVERSITY 365
CENTRAL LAKES COLLEGE 20,342
CENTURY COMMUNITY AND TECHNICAL COLLEGE 485
FOND DU LAC TRIBAL AND COMMUNITY COLLEGE 13,788
HENNEPIN TECHNICAL COLLEGE 2,454
HIBBING COMMUNITY AND TECHNICAL 774
INVER HILLS COMMUNITY COLLEGE 1,367
ITASCA COMMUNITY COLLEGE 1,623
LAKE SUPERIOR COLLEGE 7,883
MESABI RANGE COLLEGE 2,069
MINNEAPOLIS COMMUNITY AND TECHNICAL COLLEGE 1,386
MINNESOTA STATE UNIVERSITY-MANKATO 5,609
MINNESOTA WEST COMMUNITY AND TECHNICAL 1,294
MINNESOTA STATE SOUTHEAST TECHNICAL 1,694
MSCTC-MOORHEAD CAMPUS 15,751
NORMANDALE COMMUNITY COLLEGE 2,806
NORTH HENNEPIN COMMUNITY COLLEGE 2,544
NORTHLAND COMMUNITY AND TECHNICAL COLLEGE 4,397
NORTHWEST TECHNICAL COLLEGE 711
PINE TECHNICAL AND COMMUNITY COLLEGE 6,587
RAINY RIVER COMMUNITY COLLEGE 535
RIDGEWATER COLLEGE 597
RIVERLAND COMMUNITY AND TECHNICAL COLLEGE 6,255
ROCHESTER COMMUNITY AND TECHNICAL 208
SAINT PAUL COLLEGE 1,345

Rigorous Course Taking 77
POSTSECONDARY INSTITUTION TOTAL NUMBER OF CREDITS
SOUTH CENTRAL TECHNICAL COLLEGE 128
SOUTHWEST STATE UNIVERSITY 35,576
ST. CLOUD STATE UNIVERSITY 17,451
ST. CLOUD TECHNICAL AND COMMUNITY COLLEGE 410
UNIVERSITY OF MINNESOTA – CROOKSTON CAMPUS 8,182
UNIVERSITY OF MINNESOTA – DULUTH CAMPUS 6,406
UNIVERSITY OF MINNESOTA – EXTENSION 56,797
UNIVERSITY OF MINNESOTA – MORRIS CAMPUS 144
VERMILION COMMUNITY COLLEGE 2,752
TOTAL 255,879