Embed Size (px)
Citation preview
Page | 1
The effects of foreign direct investment in India:
Evidence from selected industries during the period of 2004 – 2008
By Ricky Shah
2012
A Dissertation presented in part consideration for the degree of MSc
International Business

Page | 2
Table of Contents
1. List of Tables ................................................................................................................................... 4
2. List of Figures ................................................................................................................................. 4
3. List of Equation ............................................................................................................................... 5
4. Abstract .......................................................................................................................................... 6
5. Acknowledgment ........................................................................................................................... 7
1 Structure of the Dissertation .......................................................................................................... 8
1.1 Introduction ............................................................................................................................ 8
1.2 Section 2 Literature Review .................................................................................................. 8
1.3 Section 3 Methodology ......................................................................................................... 9
1.4 Section 4 Analysis and Discussion of Empirical Results: ........................................................ 9
1.5 Section 5 Conclusion ........................................................................................................... 10
2 Introduction ................................................................................................................................. 11
2.1 Global Trends of FDI ............................................................................................................. 11
2.2 FDI and Growth .................................................................................................................... 14
2.3 India Before and after reforms ............................................................................................. 15
2.4 Purpose of Research ............................................................................................................. 20
3 Literature Review ......................................................................................................................... 22
3.1 Definition of Trade liberalisation .......................................................................................... 22
3.2 Definition of FDI ................................................................................................................... 22
3.3 Strategies of FDI ................................................................................................................... 23
3.4 Types of FDI .......................................................................................................................... 24
3.5 Theories of FDI...................................................................................................................... 25
3.5.1 Product Life Cycle Theory ............................................................................................. 25
3.5.2 Eclectic paradigm theory .............................................................................................. 28
3.5.3 MacDougall – Kemp Theory .......................................................................................... 30
3.5.4 Internalisation Theory .................................................................................................. 31
3.6 Effects of FDI ........................................................................................................................ 31
4 Research Methodology ................................................................................................................ 34
4.1 Quantitative Research .......................................................................................................... 34
4.2 Multiple Regression analysis ................................................................................................ 34
4.3 Data Collection ..................................................................................................................... 35
4.3.1 Brief background on the industries which will be analysed .......................................... 36

Page | 3
4.4 Method of research .............................................................................................................. 39
4.4.1 Cobb-Douglas Production Function .............................................................................. 40
4.4.2 Fixed effect and Random effects method ..................................................................... 42
4.4.3 Final Regress Equation with fixed effects ..................................................................... 42
4.4.4 Hypothesis .................................................................................................................... 43
5 Analysis and Discussion of Empirical Results ................................................................................ 45
5.1 Interpretation of results ....................................................................................................... 48
5.2 Future prospects of foreign direct investment within India ................................................. 54
6 Conclusion .................................................................................................................................... 55
6.1 .................................................................................................................................................... 56
6.2 Limitations of Research ........................................................................................................ 57
6.3 Improvements and Possible Future Research Questions...................................................... 58
7 References .................................................................................................................................... 59

Page | 4
1. List of Tables
Table 1 Share of Global FDI Inflows ........................................................................................................ 13
Table 2 Key Economic Indicators for China and India .............................................................................. 17
Table 3 Fixed Effects Multiple Regression Model Results ....................................................................... 45
Table 4 Estimated coefficients of the three models with their corresponding R-squared values,
F-values and probability of the F-value ................................................................................................... 48
Table 5 Estimates and P-values of model 1 and 2 .................................................................................. 49
Table 6 Estimates for Model 2 ................................................................................................................ 50
2. List of Figures
Figure 1 Global FDI inflows by type of economies during the periods 1980 – 2008 ................................ 12
Figure 2 FDI Inflows into India ................................................................................................................. 19
Figure 3 Sector composition of FDI flows ................................................................................................. 19
Figure 4 Three Stages of the Product Life Cycle Theory for USA, Developed Countries and Developing
Countries. Taken from R Vernon (1966) paper “International Investment and International Trade in
the Product Life Cycle” ............................................................................................................................. 27
Figure 5 Telecommunications industry Revenues ................................................................................... 36
Figure 6 Growth of the Indian Automobile Industry ................................................................................ 37
Figure 7 Growth rate of energy generation .............................................................................................. 38
Figure 8 Graph of Industry wise FDI Inflow .............................................................................................. 39

Page | 5
3. List of Equation
Equation 1 General Multiple Regression Equation……………………………………………………………………… 35
Equation 2 Cobb Douglas Production Function……………………………………………………………………………… 40
Equation 3 Final Multiple Fixed Effects Regression Model……………………………………………………………… 42
Equation 4 Adapted Final Multiple Fixed Effects Regression Model………………………………………………… 43
Equation 5 Estimated Equation for Model 1……………………………………………………………………………………. 49
Equation 6 Final Estimated Multiple Fixed Effects Regression Model……………………………………………...50
Page | 6
4. Abstract
India over the last 20 years has seen a significant difference in its economy due to changes in
its trade Liberalisation laws of 1991. After changing the trade laws India has become a global
economy and has seen a rise in foreign investors looking for business opportunities which has
boosted foreign capital into its economy. The purpose of this research was to find the effect of
foreign direct investment inflows in India using Prowess panel data on five industries which include
Automobile, Telecommunication, Construction, Energy Generation and Transport. A fixed effect
multiple regression model was generated using the Cobb-Douglass production function to analyse
this data. The results showed a positive significance of FDI inflow on productivity hence meeting the
hypothesis. This research is important as it allows for a clear understanding of how FDI affects India
and what measures can be taken to improve this relationship.

Page | 7
5. Acknowledgment
Writing this dissertation has been one of the most challenging piece of work I have faced
throughout my life. It would not have been possible for me to complete this dissertation without the
support, guidance and patience of my mother Arti Shah, my father Sandip Shah, my friends Priyal
Gudka, Muslim Janoowala and Viraaj Malde and especially my supervisor Dr Joel Stiebale who
without him I would not have got half as far. It is to them I owe my deepest gratitude. I would also
like to thank the University of Nottingham Business School for allowing me to learn and develop my
skills which I will cherish for the rest of my life.

Page | 8
1 Structure of the Dissertation
The Structure of the Dissertation is as follows: There will be 5 sections in total each with related
subsections.
1.1 Introduction The first section of the dissertation introduces:
Foreign direct investment and its global presence.
Explores foreign direct investments’ global trends; this gains an insight into the
patterns of FDI which occurred over the last three decades in terms of growth. ,
India before and after the trade liberalisation reforms of 1991
The purpose of the research which is to explore the effects of FDI within India.
1.2 Section 2 Literature Review
The second section of the dissertation includes:
The definitions of trade liberalisation and foreign direct investment.
The four strategies of foreign direct investment:
1. Resource-seeking FDI
2. Market-seeking FDI
3. Efficiency-seeking FDI
4. Strategic Asset-seeking FDI
The different types of foreign direct investment:
1. Vertical-FDI
2. Horizontal-FDI
3. Conglomerate-FDI
The theories foreign direct investment:
1. Product Life Cycle

Page | 9
2. Eclectic Paradigm
3. Macdougall-Kemp
4. Internalisation
The effects of foreign direct investment.
1.3 Section 3 Methodology
The third section describes:
A definition of quantitative research and the reasoning for choosing this method of
research.
Multiple regression analysis
The Data Collection method using Prowess and public data
The following industries which are being researched:
1. Automobile
2. Telecommunication
3. Transport
4. Energy Generation
5. Construction
An outline of how the research will be performed using the Cobb-Douglas production
function and whether the fixed effect or random effect method will be chosen for
the analysis.
The hypothesis of foreign direct investment in India
1.4 Section 4 Analysis and Discussion of Empirical Results:
The fourth section includes:
The results of the regression analysis model explained in section 3.
Page | 10
An analysis of multiple regressions on the derived model of productivity and how
these results are compare to other literature.
The future prospects of foreign direct investment in India
1.5 Section 5 Conclusion
Section five gives the meaning and usefulness of this research paper, by understanding the
results and portraying ideas for India to increase the effectiveness of foreign direct investment.
Furthermore the limitations of the research are portrayed with solutions for future researchers.
Lastly, further research questions developed from this research are given with ways to take this
research further.

Page | 11
2 Introduction
Foreign Direct Investment (FDI) plays an important role in the growth of the current economic
global climate. Change in trade liberalisation laws of global economies allows for foreign companies
to perform FDI into permitted economics. Over the last thirty years foreign direct investment has
become an important factor in world economies and businesses becoming global. Initially in the
1980’s it was common for FDI to take place in the Triad nations which includes European countries in
the European Union, the United States of America and Japan. This later started going through a
transition phase from the Triad nations to developing nations which had fewer laws and tremendous
economic growth rates, such as China and India, which appealed greatly to these companies. Foreign
direct investment is advantageous for both developed and developing countries, through the
creation of jobs and increase in tax revenues for the host nation and increased GDP and global
presence (Marchick & Slaughter, 2008).
2.1 Global Trends of FDI
Over the years, FDI has been growing at a fast rate due to the increasing number of liberalisation
of regulatory regime changes in favour for foreign direct investment. According to the World
Investment Report (1999), “ out of 145 regulatory changes relating to FDI made during 1998 by 60
countries, 94% were in the direction of creating more favourable conditions for FDI.” This trend
continued for almost a decade where more developing countries making trade liberalisation changes
in favour of FDI because it was a great way for host nations to gain from the revenues generated by
multinational companies. India is a good example of a country which changed its liberalisation laws
and made available its resources to international investors. Figure 1 below shows the global flows of
foreign direct investment between the periods of 1980 to 2008.

Page | 12
The graph is broken down into three economics; developed, developing and transition. Each
economy is combined to give the world total FDI flow between the periods of 1980 to 2008. What is
evident; is the overall flow between the years 1980 to 2000 was increasing. The rapid increase of
global FDI over the last two decades was mainly concentrated in developed countries within Asia and
Latin America. The top seven developing countries; China, Mexico, Brazil, Singapore, Russia, Chile
and India, made up three quarters of inward FDI flows globally (Velde, 2006).
There are cycles which can be seen in the flows of FDI over time due to economic exogenous
shocks which have occurred; this can be seen in figure 1 during 2000 and 2007. Up until 2000, the
flow of FDI had tripled between the years 1997 and 2000. This was driven by a boom in mergers and
acquisitions between the United States and Europe combined with the fast growth of FDI to non-
Japan East Asia (United Nations , 1992), however, from 2001 it started to decrease. This decrease
could be due to the financial crisis which took place in the late 1990’s in East Asia and Latin America
which had a delayed effect on FDI. FDI fell significantly over the next two years due to the lack in
confidence by businesses on developing economies. Having recovered relatively quickly by 2003 the
flow of FDI was once again increasing, this time however, at an even faster rate up until late 2007.
Figure 1 Global FDI inflows by type of economies during the periods 1980 – 2008 (Billions of dollars) (UNCTAD, 2009)
Page | 13
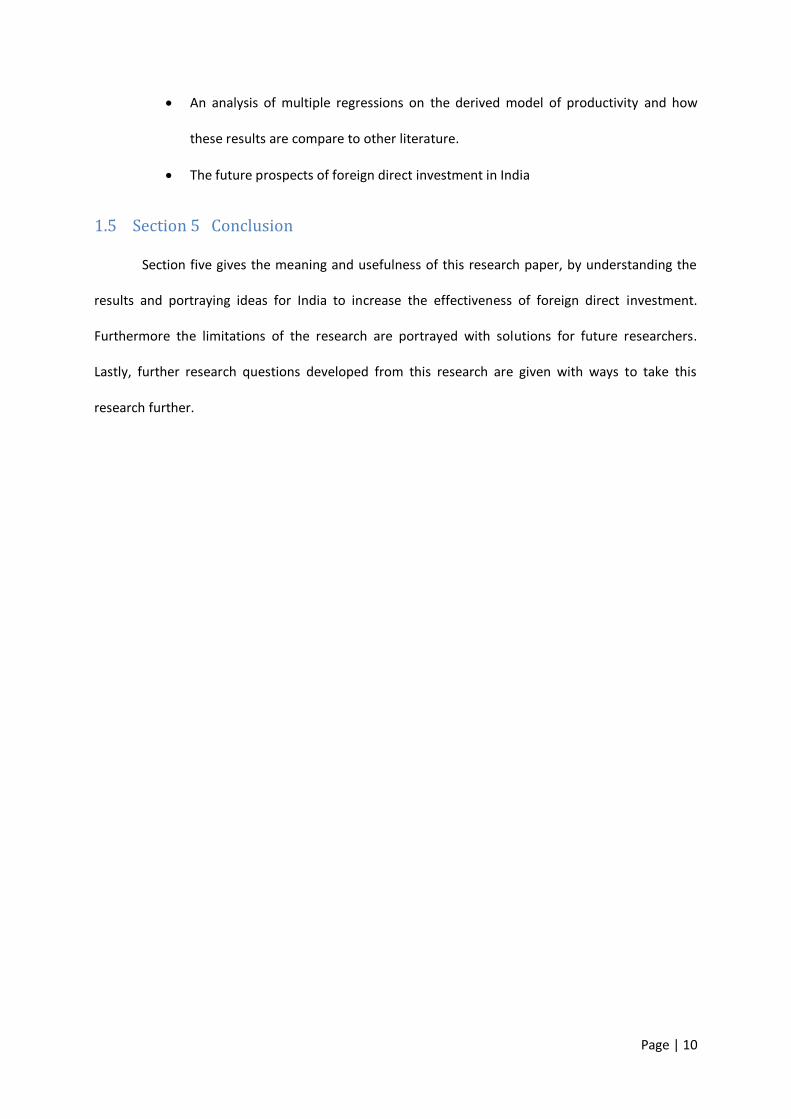
When once again with the economic downturn and the sub-prime problem in the United States and
globally, FDI was impacted severely (UNCTAD, 2008).
Table 1 above, shows the breakdown of foreign direct investment inflows globally. In the late
1980’s we can see the main bulk of FDI was in the developed countries, whereas in the late 1990’s
there was a decrease in the amount of inflows for the developed countries and an increase in inflows
of FDI for the developing countries. This transition between developed and developing nations could
be due to businesses wanting to exploit resources which were not available to them in developed
nations.
Table 1 Share of Global FDI Inflows (Bagella, et al., 2004)

Page | 14
2.2 FDI and Growth
There have been great amounts of literature on whether Foreign Direct Investment creates
growth for an economy. Growth can be viewed in two ways, looking at the macro term you can have
economic growth, whereas in micro terms you can have sector and firm level growth. Carkovic and
Levine (2005) state “Unlike the microeconomic evidence, macroeconomic studies using aggregate
FDI flows for a broad cross section of countries generally suggest a positive role for FDI in generating
economic growth.” With great studies by the likes of Carkovic and Levine (2005), Dunning (1977) and
Vernon (1966) backing the idea that FDI increase productivity which in turn leads to economic
development and growth. However, views on exactly how FDI can lead to growth vary between
researchers. Alfro et al. (2006), mention a generic route of FDI leading to economic growth by
providing capital financing and the creation of positive externalities through the adoption of
technology. Others like Caves (1974) looks at growth in a micro perspective by focusing on industries,
Caves (1974) found a positive relationship between FDI and the growth of the industry through the
average value added per worker of domestic firms in that sector, in other words a spill over in that
industry from the investing firms benefited local firms. However, Balasubramanyam, Salisu and
Sapsford (1996) found that an industry with trade openness growth was more common than in an
industry without.
Zhang (2006) gives a conflicting view on FDI and economic growth through possible effects
on China. He gives four possible outcomes which may affect China due to its openness to FDI. Firstly
he describes the possibility of China lowering domestic savings and investment, secondly, in the long-
run FDI may lower China’s foreign exchange earnings on current and capital accounts, thirdly the
contributions of investments from firms’ public revenues may be less than anticipated due to
transfer pricing and the amount of FDI allowed by the government and finally the technological
knowledge and management know-how brought by the investing companies may slow down the
development of scarce skills and resources because of the foreign presence in the Chinese market
(Zhang, 2006).
Page | 15
2.3 India Before and after reforms
For many years after gaining independence, the economic policies by the Indian Government
were made up of planning, control and regulations (Beena, et al., 2004). Pre 1991, India had a mixed
economy method to running its economy. The mixed economy view meant that India tried to keep
its industries away from the international market. By doing so it helped to build a strong industrial
base with great local production, it allowed the number of people in poverty to decrease as more
jobs were available. Furthermore it allowed for companies to export into foreign markets and help
bring in revenues from abroad. The education standard was growing with India producing an
increasing amount of educated and skilled labourers. India became one of the most self sufficient
economies in the world (Daga, 2012). However, there were limitations to India’s development due to
the technology and resources which were available to them. Due to high priority industries, the
government placed regulations which allowed domestic firms to enter into technology licensing
arrangements with foreign investors which involved equity stakes at a cap of 40%. However, foreign
presence in an industry was disliked especially in the industry with consumer goods (Beena, et al.,
2004).
In the 1980’s India went through a period of serious balance of payments crisis which
resulted in the government asking for a large loan from the International Monetary Fund (IMF) and
the World Bank; however this was on the condition that India would liberalize its trade and
investment policies. Therefore, these economic downturns lead to a more relaxed foreign
investment policy by the Indian government (Nayak, 2006). These relaxed investment policies were
the beginning of India becoming one of the fastest growing economies in the world due to foreign
investment. During this period China was going through a rapid increase of FDI inflows since opening
its door to world trade in 1979 which further encouraged India to follow in its footsteps after seeing
the benefits (Dang, 2002). 1991 was the year when India changed its economic environment through
trade liberalisation reforms. Before the reforms India’s development strategy discouraged foreign

Page | 16
investment, this resulted in a domestic industry which was heavily protected due to import controls
and high duties on imports (Beena, et al., 2004).
The trade liberalisation reforms of 1991 in India allowed for the economy to be opened to
foreign investors. The reforms included reduction in import controls, lowering of custom duties,
almost eliminating licensing controls on private investments, lowered the tax rates and helped break
down public sector monopolies allowing for the private sector to take over (DeLong, 2001). This was
a big step for India which led to one of the greatest decisions made by the Indian government. The
initial reason for India making the reforms was to “encourage economic activity and hence rise
production and employment” (Nambiar, et al., 1991).
One of the main changes made by the reforms was the de-licensing of almost all the
industries apart from eighteen. This allowed for companies to have freedom to accept investments
from abroad to help expand their businesses. Further to this, foreign direct investment policies were
also relaxed, by reducing the constraints such as diminishing the requirement of a licence for
production led to many foreign firms investing directly into different industries in India bringing with
them competition for local firms. The Indian government hoped that foreign investment would bring
in technological advances from the developed nations together with marketing managerial
techniques from experienced companies (Research and Information Systems for Developing
Countries, 2011). It was hoped local companies could benefit by learning these western techniques
which they then can deploy in their own business plans.
After the 1991 reforms there has been a rapid increase in the amount of FDI coming into the
economy. The flow of FDI which came into the economy in 1991 was around $0.3 billion; however,
by 1997 FDI inflows reached $15.8 billion which gives an indication of the monetary effects the trade
liberalisation reforms had on foreign investors. According to Beena et al. (2004) foreign direct
investment grew by almost 44% annually between 1991 and 2001. However, in comparison to other
developing countries such as China, India’s achievement of net FDI inflow was not at impressive. This

Page | 17
may be due to the fact that China opened its doors to FDI almost 12 years before India, therefore it
has given enough time for foreign investors to understand China’s market and were ready to invest,
whereas for India, foreign investors were still sceptical on whether to invest there or not.
In Table 2 we can see that China’s GDP was very similar to India’s GDP in 1980, however
from there on the growth that India saw was incomparable to China. In 2002 China’s GDP rose to
more than double India’s GDP; which may be due to the fact that the amount of FDI China was
gaining from abroad was significantly greater than India (Wei, 2005). China’s net inflow of FDI in 1990
was $0.4 billion which rose to $52.7 billion by 2002, however India’s net inflow of FDI in 1990 was
$0.7 billion which only rose to $2.6 billion by 2002 (Wei, 2005). According to the World Investment
Report 2003, FDI is the driving force for China’s economic growth; conversely India is less dependent
on FDI growing their economy (UNCTAD, 2003).
According to Ahluwalia (2002), the industrial policies had seen to have the best effect as
most of the government industrial controls which were in place in the past had been disassembled.
Prior to the 1991 reforms, the Indian government had full control over eighteen industries labelled
Table 2 Key Economic Indicators for China and India (Wei, 2005)
Page | 18
the public sector industries. These industries included the telecommunications and telecom industry,
plant and machinery industry, oil industry, iron and steel industry, air transport service industry and
electricity generation and distribution industry. However after the reforms, these eighteen public
sector industries had been reduced to only three: the defence aircraft and warships industry, atomic
energy industry and the railway transport industry. This allowed many firms from home and abroad
to enter the country and start investing heavily into these now free industries.
The Liberalisation of foreign direct investment meant that a good number of industries
where allowed 100 percent foreign ownership apart from the banking sector, insurance companies,
telecommunication and airlines industries. Along with this, the ease of gaining permission to invest
into an industry was greatly simplified compared to before. The policy set caps of 100 percent, 74
percent and 51 percent of foreign equity allowed to be invested with automatic approval depending
on the industry. The investors which sought after a particular industry which were within the limits of
automatic approval stated above had to register with the Reserve Bank of India, after which they
were legible to invest. Conversely, if the industry was over the threshold of automatic approval, the
foreign firm would have to apply through the Foreign Investment Promotion Board for approval to
invest. The reforms have led to many local companies upgrading their technology and finding more
efficient ways of producing their goods. Further to this many local firms were merging with foreign
firms as competing with their quality and types of good would have made it harder for them to
compete.
Page | 19
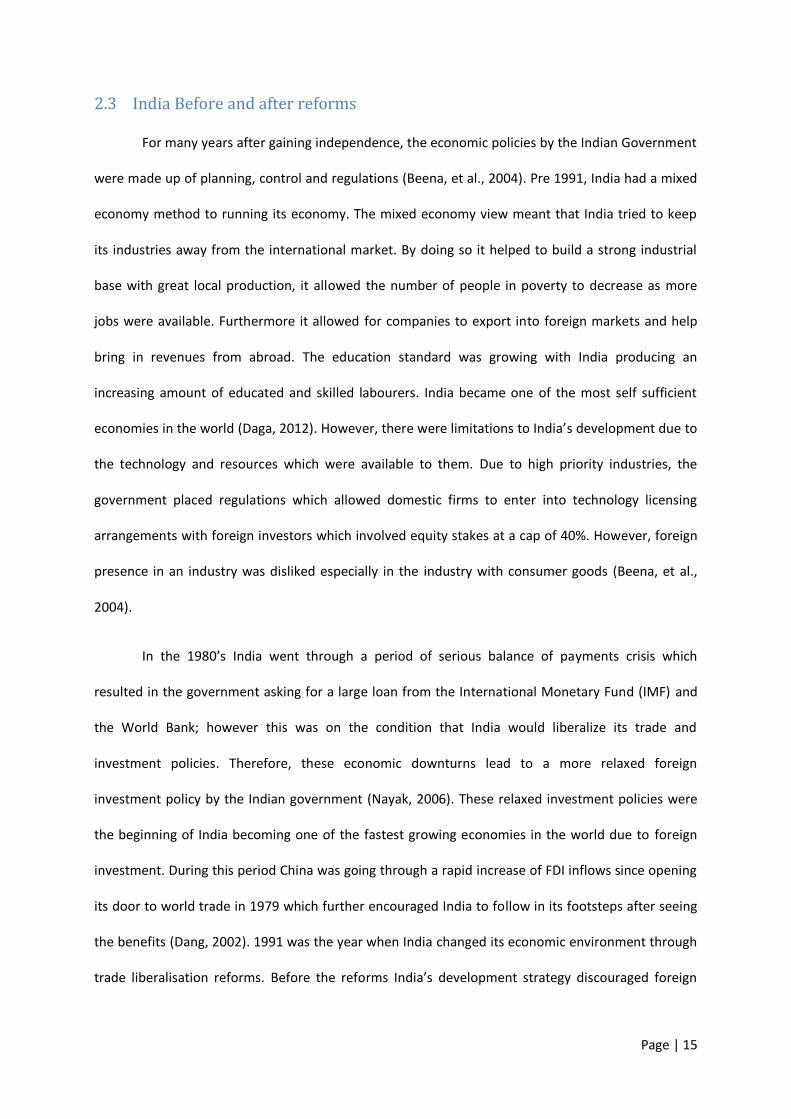
Figure 2 shows the FDI inflows into India after the trade liberalisation reforms in 1991. It is
evident an upward trend can be seen with FDI inflows more than doubling in 2006 – 07 with almost
$19 billion compared to $7 billion the previous year. According to UNCTAD (2007) after China, India is
the second most desired place for FDI, yet still India’s FDI inflow only amounts to 1.7 percent of its
GDP in 2007.
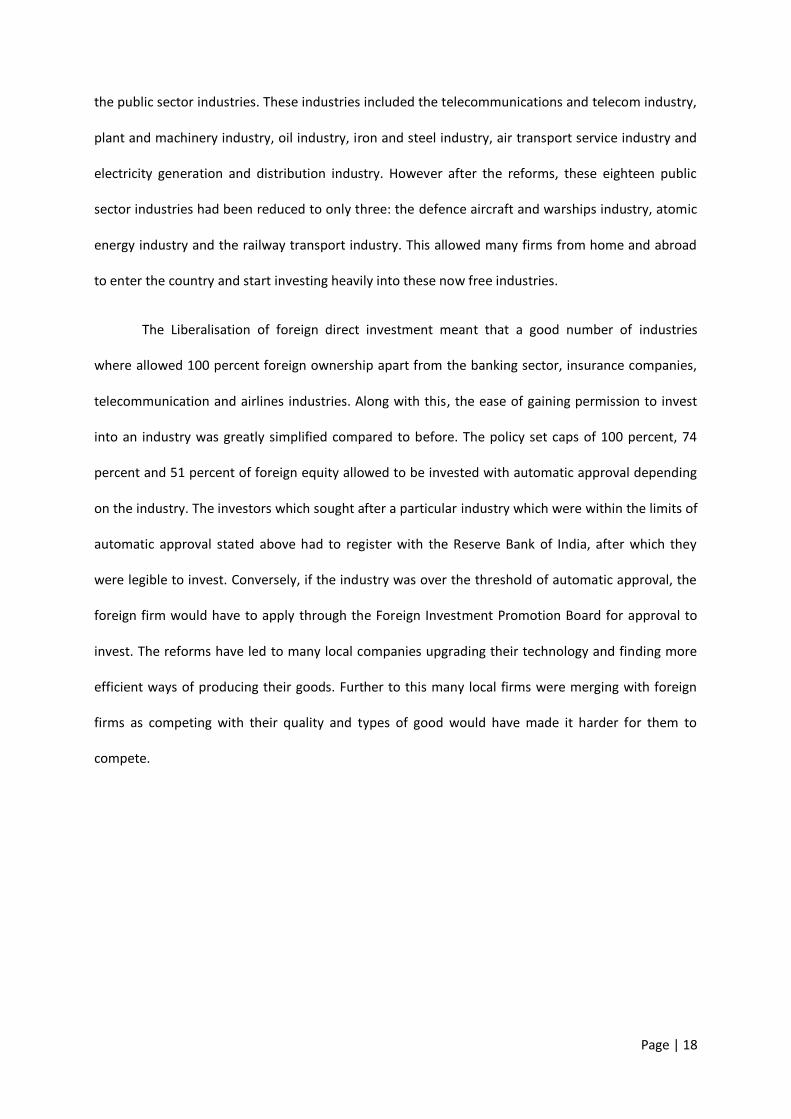
Figure 3 Sector composition of FDI flows (Chakraborty & Nunnenkamp, 2008)
Figure 2 FDI Inflows into India (Rajan, et al., 2008)
Page | 20
According to Chakraborty and Nunnenkamp (2008) the flow of FDI has shifted tremendously
from the primary and manufacturing sectors to the service sectors since the mid-1990. Figure 3
below shows how the flow of FDI has changed over the years. Initially in the late 1980’s FDI was
mainly in the secondary sector however as time went on, the flow went through a transition from
the primary and secondary sectors to the booming service tertiary sector by 1996. They later go on
to say that the growth effects of FDI are dependent on the sector and not as a whole because some
industries are heavily dependent on FDI.
2.4 Purpose of Research
Foreign Direct Investment in India has been a growing area many researchers have been
focusing on over the last twenty years, however many questions have yet to be answered. FDI has
been proven in certain economies to be the reason for tremendous growth i.e. China. For India, FDI
may not be the main reason for the growth it has been experiencing, however, for some industries it
may have. There are certain industries in India which have seen great amounts of growth over the
last 20 years; however, what has caused this growth is uncertain. Athreye and Kapur (2001) believe
that because the input of FDI compared to domestic capital is little, growth-led FDI is much more
likely than FDI-led Growth. This is believed because the increase in economic activity helps grow the
market size, which increase the possibilities for investors to gain from economies of scale in a larger
market. One main question which needs to be answered is whether foreign direct investment caused
the high levels of growth in certain industries, and if not what may have been the cause of such
tremendous growth.
The primary objective of this research is to investigate whether foreign direct investment is
the main cause of growth in the fastest growing industries. This can help give further insight into the
workings of FDI in a developing nation. A secondary objective which will help answer the primary
objective is to see whether an increase in FDI inflow into an industry has affected the productivity of
the firms within the industry.

Page | 21
By researching in these areas it will give a greater understanding of how FDI impacts
productivity therefore growth at an industry level. Also it will help to understand the importance of
FDI for India’s economy and if slacker trade Liberalisation plays in favour of these industries.
Furthermore, it can provide research knowledge to similar economies to India who wishes to take a
similar path.
Page | 22
3 Literature Review
3.1 Definition of Trade liberalisation
Trade liberalisation is common for countries which have sustained growth over a period of time.
According to OECD (2012), when a country liberalises trade they will benefit economically, through
capitalising on areas of comparative advantage gained by their resources available. Greenway (1998)
initially describes a simplistic definition of trade liberalisation through a two sector Heckscher-Ohlin
world, where the elimination of tariffs and caps will restore the free-trade price of the product or
service. However, looking at a realistic view Greenway (1998) goes on to say “In practice things are
more complicated and there are at least two other concepts which are used: changes in policy which
reduce anti-export bias and move the relative prices of tradable goods towards neutrality; the
substitution of more efficient for less efficient forms of intervention.” This goes to show that
efficiency plays an important part of trade liberalisation and if not constructed correctly will lead to
greater inefficiency than without liberalisation.
The main drawback for trade Liberalisation would be the possibility of job losses due to the
major multinational companies who would bring lower prices with their good thus eliminating the
game of competition with the locals over time.
3.2 Definition of FDI
he Organization for Economic Cooperation and Development (OEDC) defines Foreign Direct
Investment (FDI) as “An entity resident in one economy obtains a lasting interest in an entity resident
in an economy other than their own” (OECD, 1999). In other words, an investor from outside the
economy intends to acquire an asset and manage in that economy. Similarly The United National
Page | 23
(UN) defines FDI as “an investment made to acquire a lasting interest in or effective control over an
enterprise operating outside of the economy of the investor”.
“Foreign Direct Investment is one of the measures of growing economic globalization” (Azhar
& K.N.Marimuthu, 2012). The World economy is one which is Global, with firms from countries which
are abundant in capital, increasingly going abroad to find resources which are short at home in
countries which are liberalizing their policies and allowing them to enter. Developed countries are
increasingly looking for markets with cheap labour and scope for growth and higher profits.
According to Graham and Spaulding, FDI in its Classical Definition is “a company from one country
making a physical investment into building a factory in another country.” (Graham & Spaulding,
2005). With many different meanings of FDI, the underlining significance is the same, where one i.e.
Multinational Company or investor seeks for an opportunity to invest in another market with
cheaper production facilities, newer technology and the availability of products, skills and capital.
3.3 Strategies of FDI
According to Shenkar and Luo (2008), there are four main strategies: Resource-seeking FDI,
Market-seeking FDI, Efficiency-seeking FDI and Strategic Asset-seeking FDI. Resource-seeking FDI
tries to gain access to certain types of resources at a cheaper price than could be obtained at home.
Resources can be categorised into physical resources like raw materials, into cheap or skilled labour,
and into technological, organizational and managerial resources. Market-seeking FDI is a strategy
which companies use to gain access to a greater market size which would allow for the firm to grow
faster than at home through sales. However, this is not the only reason for market seeking, it can
also give the firm access to suppliers which may not be available at home or it may need to adapt to
consumers tastes and needs. Efficiency-seeking FDI, aims to gain from a different location with
resource and market-seeking investment. Companies who seek this sort of FDI try to take advantage
of factors such as endowments, cultures, policies and market structure by producing in a many

Page | 24
locations to supply too many markets. Lastly, Strategic Asset-seeking FDI tries to obtain assets of
firms in the foreign locations to help develop their international competitiveness. These companies
make strategic alliances or take over local firms which helps increase their global presence (Shenkar
& Luo, 2008).
3.4 Types of FDI
According to Moosa (2002) types of FDI can be placed into two categories; the first
category being in the perspective of the investor and the second category being in the perspective
off the host nation. In Caves (1971) view, the perspective of the investor incorporates horizontal FDI,
vertical FDI and conglomerate FDI. Horizontal FDI is carried out when the company wants to produce
the same products abroad in the host country as they produced in the home country, in other words,
a horizontal expansion of the company. Horizontal FDI is normally undertaken in gaining
monopolistic or oligopolistic advantages, for example, through patents or avoiding laws in their
home nation. Conversely, vertical FDI is undertaken to exploit resources not available in their home
nations such as raw materials. Vertical FDI is also undertaken for the company to be closer to their
consumers through acquiring factories or distribution outlets. Finally, conglomerate FDI combines
both horizontal and vertical FDI (Moosa, 2002). For example, a company which looks for investment
abroad will do so where there is a consumer base or the availability of resources such as raw
materials as well as wanting a horizontal expansion of their company in that location by opening
their own production plant. This sort of investment helps to make a multinational company
diversified.
According to Tambunlertchai (2009), in the perspective of the host nation, types of FDI
include import-substituting FDI, export-increasing FDI and government-initiated FDI. Import-
substituting FDI is a form of FDI where the host nation will start to produce good which it was
importing from the investing nation, which in turn decreases imports and help to reduce the balance

Page | 25
of trade deficit. This form of FDI is determined by its market size and the barriers of trade which are
in place. Export-increasing FDI is a form of FDI whereby the host country has an opportunity to
export sources of raw materials and other goods to the investing company’s country and other
countries the company has relations to. Finally government-initiated FDI is used when the
government of the host nation incentivises investors to help reduce the balance of payment deficit.
3.5 Theories of FDI
There has been a great deal of literature trying to explain the reasons for firms to seek investment
abroad through FDI, of which the well known theories will be discussed below.
3.5.1 Product Life Cycle Theory
The Product life cycle theory by Raymond Vernon was introduced in the mid – 1960’s and is a
plain explanation of Foreign Direction Investment and why U.S manufacturers shifted from exporting
to FDI. The theory came from the observation that for much of the 20th century many of the world’s
new products were designed, manufactured and sold in the United States of America. This of course
had its benefits, the wealth and size of the consumer market incentivises the development of new
products. However, it also included drawbacks such as the costly labour and raw materials of which
some would be imported from a foreign market, leading to the firms’ development of cost-reduction
methods of production. Vernon argued, initially firms developed products in the United States as
they believed it was better to keep production close to the home market due to the uncertainty of
introducing a new product into an unknown market as this outweighed the opportunity of cheaper
production costs. As the product is introduced in the world market and becomes standardised
demand for that product increases, thus making it worthwhile to start producing these goods at a
cheaper price to beat competition (Hill(a), 2011).
Page | 26
Vernon (1966) argues that firms which produce goods for sale in their home market carry out
FDI to produce goods to sell in a foreign market as well. Vernon suggests that firms undertake FDI
depending on what part of the Product life cycle they are on. For the firm to undertake FDI in a
country its demand should be large enough to support local production. The next stage would be a
total shift of production to a developing country when there is product standardisation and market
saturation. This would lead to price competition, thus following cheap labour and resources as this is
seen to be the best way for cost reduction.
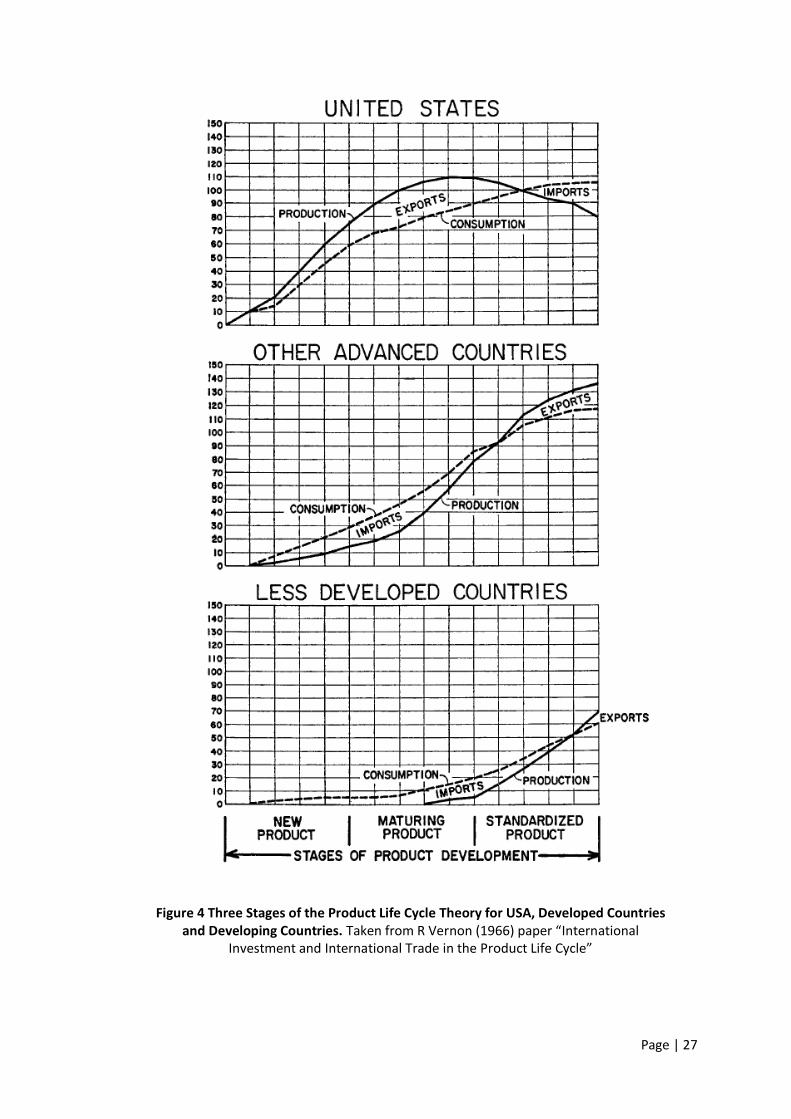
Vernon (1966) proposed the product life cycle has three stages, the New Product stage,
Maturing Product Stage and the Standardized Product Stage. Figure 4, taken from R Vernon (1966)
paper “International Investment and International Trade in the Product Life Cycle”, helps to portray
his view of how countries should respond in terms of which stage their product is in. In his paper he
took the United States as a base for introducing new products into the market due to its position in
terms of average income, unit labour costs and possible demand for the new product. With this in
mind he shows how at first the United States is likely to produce more than its own country can
consume so they can export it to other developed and developing countries. This can be seen with
the production and consumption lines on the three graphs.
Page | 27
Figure 4 Three Stages of the Product Life Cycle Theory for USA, Developed Countries and Developing Countries. Taken from R Vernon (1966) paper “International
Investment and International Trade in the Product Life Cycle”

Page | 28
When the product enters the Maturing stage of its life, Vernon goes on to explain that the
United States reaches a maximum on exports, however other developing countries are importing less
and producing more of the product. This is the verge of transition between importing and exporting
for other advanced countries. The final stage of the product life cycle, the saturated product is where
there are many producers of the product. This leads to a price competition between manufacturers,
thus pushing them to find ways in reducing manufacturing costs by going to economics where labour
and raw materials are cheaper to come by giving them a competitive advantage. In figure one this
can be seen by developing countries staring to export around the world and developed countries are
now importing the product.
However, according to Hill ((b),2011) the Product life cycle theory fails to suggest why a firm
should take on FDI and not just continue to export from home to other economies, or licence the
right to local companies to produce its good and sell them to their home nations. On the other hand,
Morgan and Katsikeas (1997) rightly states “ The product life cycle theory of international trade was
found to be a useful framework for explaining and predicting international trade patterns as well as
multinational enterprise expansions.”
3.5.2 Eclectic paradigm theory
John Dunning in 1977 came up with the Eclectic paradigm theory through the OLI paradigm.
The OLI paradigm is the collection of three foreign direct investment theories, Industrial Organization
theory, Internalization theory and Location Specific theory. The Eclectic paradigm is used to explore
the complex components of FDI (Investment & Income, 2012).
FDI = Ownership advantage + Location-specific advantage + Internalization advantage
Ownership advantage: Is normally intangible and can be shifted through the company at
little cost, examples include brand name or technology. Initially when a firm enters a foreign market
Page | 29
they are at a disadvantage compared to local competitors thus possessing an ownership advantage
allows them to fairly compete (Javorcik, 2002).
Location-specific advantage: Are advantages which arise from using resource endowments or
assets which are in a particular location abroad combined with the companies own resources and
know-how allowing it to benefit. For the company to benefit most from the foreign resources and
assets, they will need to set up production facilities where they are located, i.e. FDI. All in all,
Dunning’s Eclectic Paradigm theory helps explain how the location factors affect the decision and the
losses and gains of undergoing FDI. Dunning argues that in addition to the Internationalisation
theory, location-specific advantages are of great importance when deciding whether to undertake
FDI (Dunning, 1977).
Internalization advantage: puts forward the question whether it is beneficial for the firm to
expand to a foreign market within the firm or to sell or lease the right to other firms in the host
country who goes ahead and expands in their name, however, this leads to a loss of full control over
its production activity (Moosa, 2002). This decision can be down to the cost involved in starting up in
a new location or possible the laws which are in place in the host nation, in which case the firm may
be forced into selling or leasing rights if they really want to enter that market.
Moosa (2002) goes on to explain, if a firm has ownership advantage which allows it to compete with
host nation firms, its decision to perform FDI next depends on the location-specific and
internalization advantages. He gives three possibilities:
1. With location-specific advantage in favour for a host nation’s expansion but no
internalization advantages present for investment abroad, the firm either sell or lease its
rights to a local firm as there is an opportunity for money to be made.
2. With internalization advantages present and location-specific advantages are in favour for a
home expansion then the firm will expands at home and exports its goods abroad.

Page | 30
3. With internalization advantages present and location-specific advantages in favour for an
expansion into the host (Faeth, 2009)nations market, foreign direct investment will take
place as this will benefit the firm the most with lesser risk thus leading the firm to a
transition into a multinational company.
3.5.3 MacDougall – Kemp Theory
One of the initial theories of foreign direct investment was developed by MacDougall (1960),
however was later improved by Kemp (1964). MacDougall and Kemp assumed a two country model,
the home nation and the host nation, and the price of capital being equal to its marginal productivity.
They describe when the capital has free movement from the capital abundant economy to the capital
scarce economy; its marginal productivity becomes equal to one another. This tends to improve the
use of resources in the two countries which in turn leads to an increase in welfare (Sharan, 2009).
With the investment abroad, the investing countries output decreases, however this does not lead to
a fall in the revenues gained by their economy as capital will still be generated from the foreign direct
investment. Therefore if the income generated from the FDI is greater than the loss of output in the
home country, investors will continue to invest abroad as they will be gaining greater income from
the investment. Furthermore the host nation also sees an increase in income due to the investment,
as without the investment it would not be gaining from the inflow the investment has brought.
Sceptics say that the MacDougall-Kemp Theory only works in the perfect worlds, where there is full
employment, perfect competition and constant returns to scale. Also it only considers on product
and two factors of production. Faeth (2009) mentions capital is expected to move to the capital
scarce country, and the country can control capital returns by implementing taxes on international
mobile capital to increase welfare.

Page | 31
3.5.4 Internalisation Theory
The internalisation theory explains the possible growth of companies for pursuing foreign direct
investment. The theory was initially thought up by Hymer in 1976, but later developed further by
Buckley and Casson in 1976 and Hennart in 1982. Hymer mentioned two important determinants of
FDI, the first one being the removal of competition and the second being the advantages companies
posses in an activity, be it production, technology and so forth (Denisia, 2010).
Buckley and Casson (1976) state that firms organise their internal structure and activities in a way
that gains them specific advantages which they can later exploit when performing FDI. Dunning
(1977) uses Internalisation theory as part of his own OLI Eclectic Paradigm theory, however he argues
that it alone Internalisation theory only explains part of FDI flows and should be used in conjunction
with ownership and location advantages. Hymer (1976) who also came up with the term firm-specific
advantage, he states that FDI only takes place if benefits of exploiting firm-specific advantages are
greater than the relative costs of investing abroad (Denisia, 2010).
3.6 Effects of FDI
According to Nguyen et al. (2008), developing host nations seek foreign direct investment
inflows to help develop small inexperienced domestic sectors. However, how the host nation
benefits from FDI is up for argument. There are many factors which need to be considered when
looking at the effect of FDI, for example, if the host nation has tight policies on FDI it is likely there
will be minimal benefits from FDI inflows. However, with slacker policies like India after the trade
liberalisation of 1991, it’s most likely they benefit from FDI. Golub (2009) mentions that countries can
benefit from FDI through increased job availability, greater capital availability, transfer of
technological knowledge and greater economies of scale through greater competition. These

Page | 32
benefits in turn will be passed on to consumers in the form of cheaper and better quality products
and services.
The host country wages can also be affected through FDI inflows. A general question exists
with FDI and host nation wages, and that is whether FDI inflows cause the wage rate to increase in
the location where foreign investments are made. According to Lipsey (2002), the effects of FDI are
linked to wage spillovers. Wage spillovers is when a foreign owned firm may pay higher wages than
domestic firms which has a spillover effect on local firms as workers may demand more pay as they
may feel they are not being paid enough.
Wage spillover is not the only spillover a country can expect from FDI inflows. Host nations
expect positive spillovers through productivity and efficiency benefits when MNC’s invest (Nguyen, et
al., 2008). Productivity and efficiency are likely to increase due to the advanced technologies which
MNC may bring with them which can be passed onto local firms through spillovers. Furthermore, FDI
created productivity growth can also include learning-by-doing, learning-by-watching and movement
of labour from the MNC’s to local firms (Nguyen, et al., 2008). In other words, local firms may watch
and copy the MNC’s method of business and learn new skills that may help them grow in terms of an
increase in productivity.
FDI inflows can have a negative effect on small local firms as they may be pushed out due to
giant MNC’s entering the industry which can lead to monopolising the industry. This effect in its self
can be positive and negative. By an industry becoming monopolistic, it can help drive down prices
and increase the quality of products available, however, it may also reduce the choice of products
available in the market, furthermore it can lead to loss of jobs as the smaller firms will be pushed out
as they cannot compete with the cheaper prices and quality of products (Blomstrom & Kokko, 2001).
Positive effects can be seen for the home nation in terms of capital inflow by the MNC’s, this
can help reduce the balance of payments deficit of a nation. Furthermore, it allows for ties to be built
between two countries which can be used in their benefit later on. For example, India and Pakistan

Page | 33
have had their differences; however India permitted foreign direct investment from Pakistan in May
2012 which was a step in the right direction in mending the relationship of trade and economics
between the two countries. It was hoped that the change in policy would help bring together the two
nations and help recoup their relationship, which seems to be working as Pakistan are now in the
process of allowing India in performing outward FDI into Pakistan (Taneja & Bimal, 2012).

Page | 34
4 Research Methodology
4.1 Quantitative Research
Quantitative research consists of a statistical model which tries to explain data that has
been collected through either primary or secondary data extraction. The data can either be gathered
through a sample or a population. Quantitative research can allow for the researcher to distinguish
between results being genuine or by chance, however, the main uses it has is that it allows for the
presentation and interpretation of the data. There are two methods which can be used; descriptive
statistics and inferential statistics. Descriptive statistics consist of measures of trends; mean, median
and mode, and the measures of variability; range, standard deviation and variance. This type of
statistics allows for the researcher to get an overview of the data which is obtained. Inferential
Statistics research consists of statistical tests to test the hypotheses and comparing the findings to
the sample or population.
Quantitative research was chosen for this research paper because it allows for the data to
be analysed thus helping determine whether FDI actually affects productivity and therefore growth
of the industry. The reasons for not choosing qualitative research is because it only gives an insight
into what people believe by observing what they say, therefore not giving hard facts on why the
outcome is the way it is. In other words quantitative research is objective whereas qualitative
research is subjective.
4.2 Multiple Regression analysis
Multiple regression analysis is a method used to evaluate the relationship of a dependent
variable on a number of independent variables. The outcome can deduce whether the relationship is
linear or non-linear. The general form of a multiple regression form is as follows:

Page | 35
Equation 1 General Multiple Regression Equation
Where Yt is the dependent variable and Xjt are the independent variables or the regressors
with k number of parameters to be estimated, this also is the number of degrees of freedom
(Asteriou & Hall, 2007).
4.3 Data Collection
I will be obtaining my company data from Prowess, which is a data base with includes time-
series data from 1990 – 2008. The data includes the financial performance of ever company listed
and unlisted in India with a selection of many variables including data from their balance sheets and
income statements (Prowess, 2012). The Data for the amount of FDI inflow into each industry will
also be gathered from the Institute for Studies in Industrial Development reports.
The firm level data which will be obtained from Prowess is in a panel data format, allowing
for multiple entity observations at multiple points of time. The panel data available is unbalanced
panel data, meaning some observations are missing for some time periods. This can sometimes cause
problems when the data missing is not of random cause, however in this case the missing data is of
random cause thus will not affect our results. Panel data allows for the researcher to have control
over the variables which cannot be observed or measured across entities, furthermore, it also allows
for control over variables which change over a period of time but not across entities.
Data for the number of employees is not a must for companies to declare in their balance
sheet or profit loss accounts thus it is not available in the Prowess data base and has to be calculated.
The method Topalova (2010) used will be the method which has to be used to calculate the number
of employees in this research. The method consists of finding the average wage rate for the
industries which are going be researched, and then divide this number by the expenditure for each
firm in terms of salaries and wages. This method may not be the most accurate way of working out

Page | 36
the number of employees however with the limitations of this research it is the most viable. The
number of employees is a very important pieced of data which is required for this research to take
place, as this value can help calculate the productivity for each firm. The data for the average wage
rate for each industry will be obtained from the government of India Directorate of Economics and
Statistics website (Governemnt of India , 2012). Here the report for Employment and Unemployment
are available from the National Sample Survey for the years 2004 through to 2008 with the exception
of 2006. The data required for the year of 2006 will be calculated by averaging the data for years
2005 and 2007.
4.3.1 Brief background on the industries which will be analysed
Each of these industries was chosen because they have shown signs of growth between the period of
2004 and 2008.
Telecommunication services
According to D&B India, the telecommunications industry has seen an upward trend in
growth between these years, and they believe it is due to globalisation of the world economies (D&B
India, 2012). In 2006 telecommunication revenues was at 867 Rs billion this has increased to 1291 Rs
billion by 2008 which is a 32.8% increase over three years.
Figure 5: Telecommunications industry Revenues (Rs bn) (D&B India, 2012)

Page | 37
Automobile
The Automobile Industry is also another fast growing industry with an upward trend over the
four year period. As seen in figure 6, in 2004 the automobile industry sold about 7 million units,
however this had increased to almost 11.5 million by 2008 (Indua Reports, 2012). This tremendous
growth in the number of unit being sold may be due to the effect of the increasing amount of foreign
direct investment inflows.
Transport which includes road, rail, air and water
The transport industry is a very important industry in India as transport links are important for
businesses to function, especially for foreign investing companies who need links all over India. As
the transport industry grows it can have knock on effect to other industries as it allows for easier
accessibility to many locations around India. As the inflow of FDI grew in India so did the transport
industry, thus leading to the question whether FDI could be the reason for growth.
Figure 6 Growth of the Indian Automobile Industry (Indua Reports, 2012)

Page | 38
Housing and Industrial Construction
The construction industry is a very big industry in India, which includes both housing construction
and industrial construction. According to Malukani (2010) the construction industry grew 20%
annually between the periods of 2004 to 2008 and contributed around 8% to India’s GDP.
Furthermore, FDI in the housing sector alone brought in $8.4 billion between 2000 and 2010
(Malukani, 2010). The growth of 20% makes this a good industry to analyse the effects of FDI.
Electricity Generation
Figure 7 below shows the growth rate as well as the amount of energy being produced for the
energy generation industry in India (Emerging Market Direct, 2012). We can see that the amount of
energy generation was increasing at a steady rate over the last 10 years. This growth shows that
India’s increasing consumption is in direct correlation with the growth of India, however, it’s also in
direct correlation with the increasing amount of FDI coming into the country. This makes it a viable
choice of industry when looking at whether FDI is the cause of increased productivity.
Figure 7: Growth rate of energy generation (Emerging Market Direct, 2012)

Page | 39
Figure 8 shows the industry wise foreign direct investment flows for each of the industries
described above. It is clear that the FDI inflow for all industries apart from the transport industry has
been increasing between the years of 2004 to 2008. The question is whether this increase in inflow
has had an effect on the industries growth through increased productivity. The following section
describes how the research will be performed to answer this question.
4.4 Method of research
There have been many researchers analyzing the impact of trade Liberalisation reforms on
firm productivity in developed and developing countries. For example Topalova (2010) looked at the
connection between changes in tariffs and firm productivity, however, they found no real evidence,
and Tybout et al. (1991) looked at the link between Liberalisation in Chile and productivity who also
found no evidence which links the two. However, according to Topalova (2010) Tybour and
Westbrook (1995) did see an increase in productivity in Mexico after Liberalisation.
0.00
5000.00
10000.00
15000.00
20000.00
25000.00
30000.00
35000.00
40000.00
2004 2005 2006 2007 2008 Am
ou
nt
of
FDI i
nfl
ow
(R
s cr
ore
)
Year
Industry wise FDI Inflow
Automobile Industry
Construction Industry
Transport Industry
Telecommunication Industry
Energy Generation Industry
Figure 8: Graph of Industry wise FDI Inflow

Page | 40
4.4.1 Cobb-Douglas Production Function
This research will be using the Cobb-Douglas production function like Topalova (2010) and
Tybout et al. (1991) used in their research. The Cobb-Douglas function was developed by Charles
Cobb and Paul Douglas in 1928 when studying the growth of the American economy between 1899
and 1922. The function involves a simple perception of the economy where the production is
dependent on the labour involved and the amount of capital which was invested (Cobb & H.Douglas,
1928). The function is as follows:
Equation 2 Cobb Douglas Production Function
Where:
Y = Total Productivity Output
L = Total Labour input
K = Total Capital employed
A = Total Factors of Productivity
Factor A includes variables that can affect the productivity of the firms. The variables which
will be included in this research are: total raw material costs (RM) for the reason that increase in the
raw material expenditure will be due to firms wanting to increase its productivity; power and fuel
costs (PF) for the reason that firms may increase its power and fuel consumption because they need
it for them to support an increase in production; total research and development cost (R&D) for the
reason they may wish to bring out new services or products which will have an indirect effect on
productivity and total FDI into the industry (FDI) for the reason that an increase in FDI into an
industry can have an effect on production for firms in that industry due to the possibility of spillovers
Page | 41
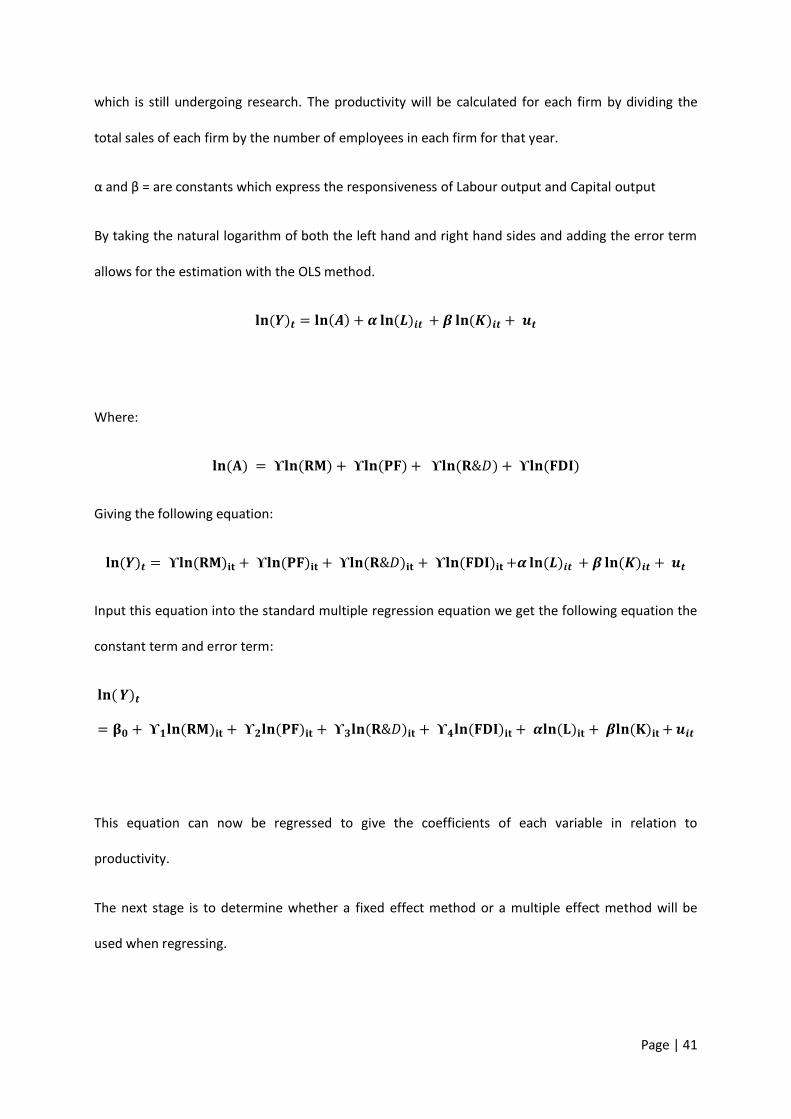
which is still undergoing research. The productivity will be calculated for each firm by dividing the
total sales of each firm by the number of employees in each firm for that year.
α and β = are constants which express the responsiveness of Labour output and Capital output
By taking the natural logarithm of both the left hand and right hand sides and adding the error term
allows for the estimation with the OLS method.
Where:
Giving the following equation:
Input this equation into the standard multiple regression equation we get the following equation the
constant term and error term:
This equation can now be regressed to give the coefficients of each variable in relation to
productivity.
The next stage is to determine whether a fixed effect method or a multiple effect method will be
used when regressing.

Page | 42
4.4.2 Fixed effect and Random effects method
When working with panel data the fixed effect method refers to an estimator for the
coefficients, with time independent effects for each variable correlated with the regressors. In other
words, the fixed effect method allows the researcher who has many observations (n > 1000) to use
the changes in variables over time to predict the effects of the independent variables on the
dependent variable (Princeton Universty , 2012). However, if the data presents some omitted
variables which are constant over time yet vary between different cases, and other variables might
be fixed between cases and change over time, then random effects method can be used to include
both types of variables.
For this research a fixed effects method is chosen due to the size of the data in terms of
observations and the variables are fixed between each company and change over time. Furthermore
the fixed effects multiple regression model will use the changes in the variables over time to
estimate the effects of foreign direct investment and other independent variables against the
dependent variable productivity.
4.4.3 Final Regress Equation with fixed effects
Equation 3 Final Multiple Fixed Effects Regression Model
As the panel data obtained from Prowess is unbalanced much of the data for the variables
is missing as it is not required for companies to give the data in their balance sheet and profit loss
account. Due to the missing data when processing in term of their natural logarithms gives rise to
errors that will be displayed. To account for the variables with missing data, each value under each

Page | 43
variable will be scaled down using each firm’s salary and wage giving more accurate estimations from
the multiple regression analysis.
After scaling down the variables with the missing data we get the following equation:
Equation 4 Adapted Final Multiple Fixed Effects Regression Model
This equation will be fed into the program STATA where it will give an estimate for the
equation in a table format with coefficients for each variable, the standard error for each of the
variables, the t values for each of the variable and the p values for each of the variables at 95%
significance. For all the variables with the absolute t value less than one will be removed from the
regression model. After removing the insignificant variables the regression model will be run again
leaving the variables with has significance on productivity.
4.4.4 Hypothesis
According to the developed regression model, it is predicted that an increase of foreign
direct investment into India will lead to an increase in overall productivity which in turn will lead to
significant growth in the economy. Evidence of increased growth due to FDI can be seen in China,
Chile, Mexico, Cameroon and other developing nations (Topalova, 2010) (Njikam & Cockburn, 2007).
However, given that FDI is not the only variable which influences productivity compared to the other
variables discussed in the methodology; expenditure on raw materials, research and development,
power and fuel, labour input and capital employed, it is expected to have more of an impact due to
the effects which have been seen in other nations.

Page | 44
4.4.4.1 Other Possible Outcomes of FDI effects
The reasons as to which foreign direct investment may not been so influential could be due
to the fact that India is more of a service nation compared to other developing countries.
Furthermore, there may be closer relationship between labour input and capital employed to
productivity, thus if there is a positive FDI influence, it is likely that they may be more influential as
they are key for productivity to increase according to Cobb-Douglass (Cobb & H.Douglas, 1928).
Page | 45
5 Analysis and Discussion of Empirical Results
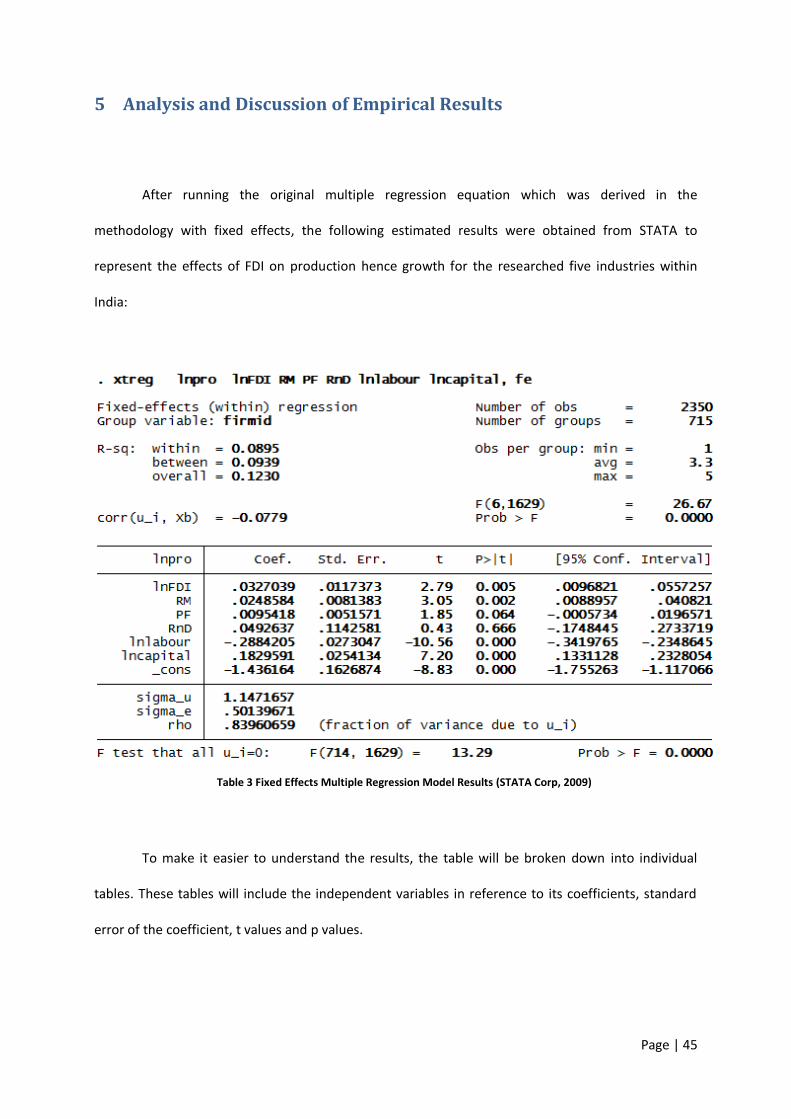
After running the original multiple regression equation which was derived in the
methodology with fixed effects, the following estimated results were obtained from STATA to
represent the effects of FDI on production hence growth for the researched five industries within
India:
To make it easier to understand the results, the table will be broken down into individual
tables. These tables will include the independent variables in reference to its coefficients, standard
error of the coefficient, t values and p values.
Table 3 Fixed Effects Multiple Regression Model Results (STATA Corp, 2009)

Page | 46
F-test
The overall F-test is used to see if the independent variables are significant in predicting the
dependent variable which is the overall significance test for the model. If the probability of the F-test
is less than 0.05 (5% significance level) then the independent variables are significant.
However, if the probability is greater than 0.05 then the independent variables show no significance
on the dependent variable and the model needs to be changed.
R-squared
The R-squared value gives the proportion of variance with respect to the dependent variable
and is between zero and one. The higher the percentage, the higher the association the independent
variables have on the dependent variable.
Estimated Coefficients
The coefficients values given in the results are the estimated coefficients of the model. They
show the effect independent variables have on the dependent variable. The value of the estimated
coefficient can positively or negatively affect the dependent variable.
Standard Error of Coefficients
The standard error values are a measure of how accurate the coefficients for the model. The
lower the value the more representative the coefficients are. The value of the standard error is
inversely proportional to the sample size, thus the larger the sample size the lower the standard
error will be.

Page | 47
T-Test and Probability at 95% confidence level
The T-test signifies the individual significance of the coefficients. It allows to eliminate any
variables which are statistically unimportant in the model as it can make the model inaccurate
(Weibull, 2008). The model can be regressed again after eliminating the statistically unimportant
variable to give a better representation of the coefficients of the other variables. The probabilities
are used in testing the null hypothesis which in this case would be that the coefficients are equal to
zero. The coefficients which have P-values less than 0.05 (95% confidence level) would be significant
and thus would reject the null hypothesis and for all values above 0.05 you would accept the null
hypothesis as they are not significant for the model.

Page | 48
5.1 Interpretation of results
Table 4 shows the results of the 2 models with their corresponding estimated coefficients of
the independent variables. From model 1 it can be seen that the f-test value is 26.67 with its
probability being a value less than the significance level of 0.05. For model 2 the f-test value is 39.07
with its probability less than the significance level. Therefore rejecting the null hypothesis
for both the models indicates they are significant in predicting the dependent
variable.
Table 4 Estimated coefficients of the three models with their corresponding R-squared values, F-values and probability of
the F-value (STATA Corp, 2009)

Page | 49
The estimated equation for model 1 has been calculated by substituting the estimated
coefficients obtained from the fixed effect multiple regression analysis which can be seen in Table 4:
Equation 5 Estimated Equation for Model 1
Before the coefficients can be analysed, a check has to be performed to see which variables
have a significant effect on productivity. When working with STATA, the program inform which
variables are significant at which significance level by displaying the number of asterisks. It is
identifiable in Table 5 the two variables which do not pass the significance test are Power & Fuel
expenditure and Research & Development expenditure because their p-values are above 0.05.
Therefore they have very little or no significance to the dependent variable probability. By removing
these variables from model 1 we obtained the new model, model 2. Here we can see how removing
the insignificant variables have affected the coefficients of the remaining significant variables, as all
the variables absolute values have increased.
Table 5 Estimates and P-values of model 1 and 2 (STATA Corp, 2009)
Page | 50
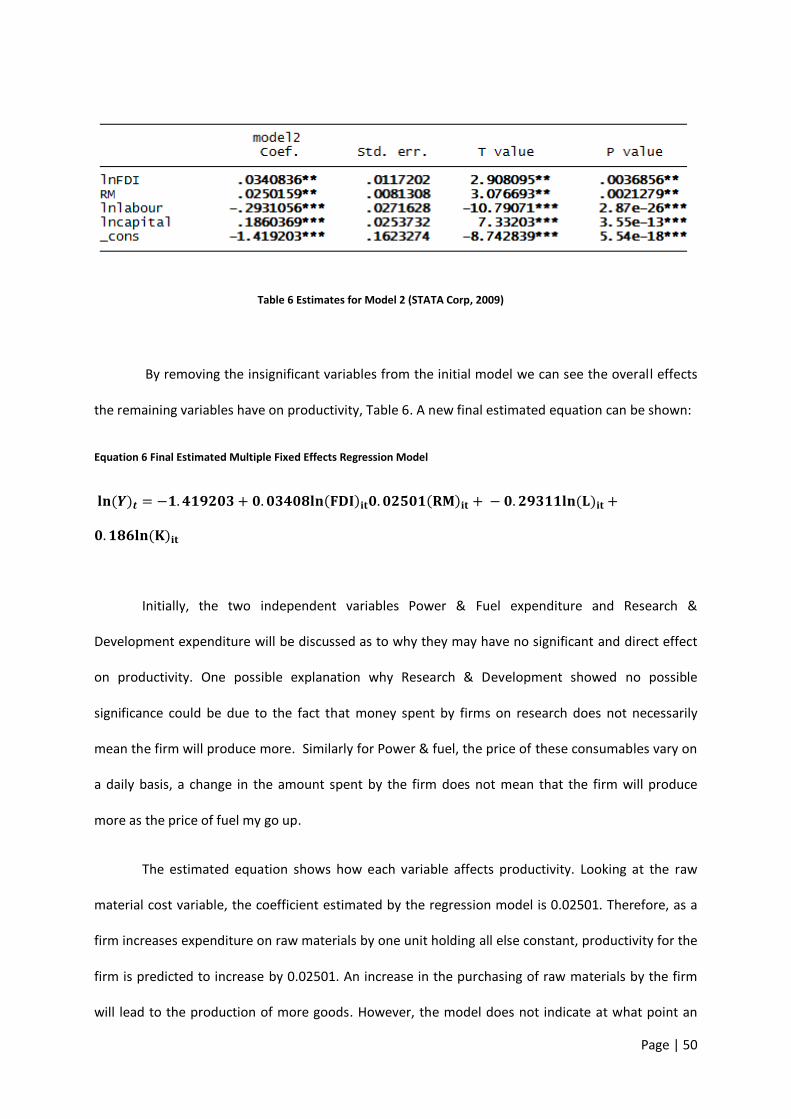
By removing the insignificant variables from the initial model we can see the overall effects
the remaining variables have on productivity, Table 6. A new final estimated equation can be shown:
Equation 6 Final Estimated Multiple Fixed Effects Regression Model
Initially, the two independent variables Power & Fuel expenditure and Research &
Development expenditure will be discussed as to why they may have no significant and direct effect
on productivity. One possible explanation why Research & Development showed no possible
significance could be due to the fact that money spent by firms on research does not necessarily
mean the firm will produce more. Similarly for Power & fuel, the price of these consumables vary on
a daily basis, a change in the amount spent by the firm does not mean that the firm will produce
more as the price of fuel my go up.
The estimated equation shows how each variable affects productivity. Looking at the raw
material cost variable, the coefficient estimated by the regression model is 0.02501. Therefore, as a
firm increases expenditure on raw materials by one unit holding all else constant, productivity for the
firm is predicted to increase by 0.02501. An increase in the purchasing of raw materials by the firm
will lead to the production of more goods. However, the model does not indicate at what point an
Table 6 Estimates for Model 2 (STATA Corp, 2009)

Page | 51
increase in expenditure on raw materials will lead to diseconomies of scale. The regression model
could be made more efficient by factoring diseconomies of scale into the independent variable. The
estimated coefficient of labour is -0.2931. Therefore, an increase in labour by one unit and holding all
things constant, will lead to an estimated fall in productivity by 0.2931 which could be seen as an
anomaly because if the labour input increase the firms productivity should increase. An explanation
for this outcome could be due to the fact that the firms are efficient in terms of labour force
therefore anymore labour inputs will lead to an inefficient outcome which could lead to a negative
effect on output. The estimated coefficient for capital employed is 0.1860, meaning a unit increase in
capital employed and holding other variables constant will lead to an increase in productivity by
0.1860 units. Foreign direct inflow has a coefficient of 0.03408, thus a unit increase of FDI into an
industry holding all else constant will lead to productivity increasing by 0.03408. Overall we can see
the model shows a positive correlation between the independent variables and productivity.
The model 1 and 2 estimates obtained were calculated from five industry sample sizes which
include Automobile, Telecommunication, Construction, Energy Generation and Transport between
the periods of 2004 – 2008. The inflow of foreign direct investment is of most interest in this
research; the variable obtained a positive coefficient and has a statistically significant effect on
productivity, which was the expected outcome according to the hypothesis. These results suggest
that the more FDI inflows India receives holding all other variables constant, the greater the
productivity output. Furthermore, the results suggest, the greater FDI inflow for a certain industry
the more the productivity will increase for that industry alone. However, the empirical results show
labour and capital inputs having more of a significant effect on productivity than FDI inflow, due to
their coefficients having greater absolute values. This was an expected outcome according to Cobb-
Douglas (1928) and Taplova (2010).
The finding from this research seem to be consistent with Taplova (2007) and Nijikam &
Cockburn (2007), as both showed positive effects of foreign direct investment inflows into United

Page | 52
Kingdom and Cameroon respectively after trade liberalisation, and as expected did not agree with
Tybout et al. (1991) and their results on Chile. The main reason for the positive effect on productivity
due to FDI according to Taplova (2007) was due to technological spillovers between investing and
local firms. For foreign direct investment to have a positive effect on productivity in India could be
due to the reasons discussed in the literature review such as the spillover effect.
Foreign direct investment has lead to MNC’s investing into different industries for example
the construction industry which can create spillover effects in terms of technological advances and
setting standards to be followed by locals such as the health and safety standard which can lead to a
more efficient work force. Technological advances are more easily and therefore more likely to be
spilled over into these five sectors compared to a business model spill over which may take time to
adapt.
Productivity has many other factors influencing it which has not been part of the scope for
the study. There is biasness with the model chosen to identify the effects of FDI on productivity as it
doesn’t take in consideration all variables. The R-squared value for model 2 is 0.087, shows that
future predicted outcome by this model are only 8.7% likely to be correct. Such a low value was
expected as there are many variables which can affect productivity which have not been accounted
for in this model. The greater the number of variables used with a significant effect on productivity,
the greater the projection power of the model. Would the value of the coefficient of FDI inflow be
affected if other variables influencing productivity such as worker satisfaction, working environment,
work morale, technological advances, government presence, raw material prices and location of
work place were included in the research. However, with the limitations of the available resources
and time this could not be researched. Furthermore, the methods in which the number of people
employed was a very vague method as it effectively took the average number of workers for the
industry and divided it by individual wage expenditure. This method and model doesn’t take into

Page | 53
consideration the different weightings of each firm, therefore the model is not very efficient in
describing the relationship between the variables and productivity.
Overall the estimated values shown by this model shows promising results as the aim was to
show the effects of foreign direct investment inflow into India. However according to the hypothesis
FDI was expected to have the least effect in comparison to the other variables included in the model.
In true fact foreign direct investment was the second most significant positive variable on
productivity after capital employed.

Page | 54
5.2 Future prospects of foreign direct investment within India
Foreign direct investment over the last 20 years has been a key element for the global
environment we have today. Over this period many developed nations have looked to developing
nations for investment opportunities such as China, Mexico, Brazil and Chile. India has the second
largest market available after China for investors, making it an attractive location for money to be
made. With the world population growing at a rate of 1.2% in 2008 and with India having a growth
rate higher than other desirable FDI locations around the world, India has the possibility to sustain
these high levels of FDI inflow which has been beneficial to local people through the creation of jobs,
educating of new skills and bringing an overall better standard of living (World Bank, 2012).
According to Moran (1999), foreign direct investment helps break down the cycle of
underdevelopment which developing nations have been facing to give them a better standard of
living. He describes how low levels of productivity leads to firms not paying enough money to their
workers, which leads to the workers not being able to afford to save, which leads to people not being
able to invest, which leads to lower firm productivity. However, as time progresses this cycle is slowly
being broken through MNC’s introducing the western way to do business. India has seen evidence of
a better living standard through the growth of its gross domestic product over the last 16 years
(Trading Economics, 2012). These promising growth rates partly created by FDI inflows over the years
can help bring in further FDI from nations as they see India as an investable location.
Page | 55
6 Conclusion
This research contains several contributions to the literature on the effects of foreign direct
investment in India. Using firm level panel data for five industries; Automobile, Telecommunication,
Construction, Energy Generation and Transport, obtained from Prowess and the public data available
of foreign direct investment into the industries. A regression model was made to analyse the impact
FDI has on the productivity of the firms. This research is important in understanding the long term
implications of trade liberalisation and therefore FDI on a nation. Understanding the link can play an
important role for future nations who wish to liberalise and gain from foreign direct investment.
Using the Cobb-Douglas production function, a linear fixed effects multiple regression model
for the relationship between productivity and foreign direct investment was developed. Using STATA
to run the regression model, an estimation of the relationship between productivity independent
variables where calculated. Initially the insignificant variables were removed from the model and the
regression was run again to give a more accurate estimation for the variables relation to productivity.
The finding showed a positive relationship between foreign direct investment inflows into an
industry and productivity. The results estimated a coefficient for FDI in relation to
productivity, meaning a unit rise in FDI inflow will lead to increase in productivity holding all
else constant. This research is consistent with Taplova (2007) and Nijiikam & Cockburn (2007) as they
also saw a positive relationship with foreign direct investment and productivity.
Reasons as to why India may not be benefitting to its potential from foreign direct
investment could be due to global perception. There was a study conducted on how India could
attract much more FDI if the global perception of India being a highly corrupt nation changed. The
study was on public sector corruption, which showed that investors are more likely to be deterred
away from a country with a corrupt government (Deccan Herald, 2010). If India were to crack down
Page | 56
on government corruption, it is likely to see a greater positive effect of foreign direct investment as
investor’s perception of India would change and would increase investment confidence.
On the 14th of September 2012 India allowed upto 51% foreign direct investment into the
retail supermarket sector a policy they were initially against (Mukherjee, 2012). Allowing foreign
supermarkets into India could lead to a negative impact on small local retail outlets. However
Mukgerjee (2012) describes that allowing retailers like Wal-Mart and Carrefour into the market place
will increase employment and foreign capital into India. The government believes these benefits
outweigh the possible losses of small local businesses (Mukherjee, 2012).
Allowing FDI into the retail sector may positive decision by the Indian government as not only
will it allow for greater levels of FDI into India but also will benefit local consumers in terms of the
price of goods. However, there is a possibility of a monopoly occurring if India one day increases the
FDI limit in the retail sector to 100% like they have done to many other sectors such as the
pharmaceutical industry (The Economic Times, 2011). The government needs to find the right
balance which won’t harm too many local businesses.
Another reason hindering maximum foreign direct investment effects in India is due to the
divisions within the government to push through policy changes which support foreign investors
(Mukherjee, 2012). This has lead to a slowdown in foreign direct investment. To overcome this
challenge the government needs to work with the foreign investment promotion board to favour
foreign investors by reducing trade barriers and providing incentives to increase foreign investments.
6.1
Page | 57
6.2 Limitations of Research
The results obtained in this research are debatable due to biasness in the regression model,
even though great care was taken in making the model as efficient as possible with the resources
available and the limitations of the research. Firstly, the panel data was unbalanced, hence a true
capture of the observations were not included in the model which may have had a negative effect on
the estimates. Secondly, because the panel was unbalanced the natural logarithm of the variables
raw material cost, power and fuel expenditure and research and development expenditure could not
be calculated thus not following the Cobb-Douglas production function exactly. However, not being
able to natural log the variables was compensated by dividing the values by salaries and wages of the
individual firms allowing for the values to be scaled down according to the size of the firm. This may
not be a very accurate method however the most viable with the resource available. Having access to
all the missing data would most certainly give a more accurate estimation of the regression model.
One important limitation which needs to be discusses is lagged effects of foreign direct investment.
Having only considered a period of five years, it is possible that the effects on productivity are not
fully identifiable as they have not yet had enough time to take effect. According to Alfaro and
Charlton (2007) a separate variables of lagged FDI should be included in the model to take into
account these effects.
Page | 58
6.3 Improvements and Possible Future Research Questions
Ways in which future researchers can improve on the regression model within this research
include, using a fully balanced panel data set, this would allow for a more accurate measure of the
estimates as there will be no missing data. Another method to improve this research could be to
include many more variables which have a relationship in affecting productivity as this would give a
better understanding of the effect of foreign direct investment in comparison to other variables.
After performing this research many questions have arisen which needs to be answered, these
questions include:
1. Does FDI inflow bring in higher levels of FDI inflows in the Future?
2. Inter industry relationship: Does FDI inflow into one industry lead to FDI inflow into another?
3. Is FDI the best form of foreign investment for India?

Page | 59
7 References
Ahluwalia, M. S., 2002. Economic Reforms in India Since 1991: Has Gradualism Worked. Journal of
Economic Perspectives, Vol. 16(Iss. 3), pp. pp. 67 - 88.
Alfaro, L., Chanda, A., Ozcan, S. K.-. & Sayek, S., 2006. How Does Foreign Direct Investment Promote
Economic Growth? Exploring the Effects of Financial Markets on Linkages, Cambridge, MA: National
Bureau of Economic Research.
Alfaro, L. & Charlton, A., 2007. Growth and the Quality of Foreign Direct Investment: Is ALL FDI Equal ,
Boston: Harvard Business School.
Asteriou, D. & Hall, S. G., 2007. Applied Econometrics A modern Approach. Revised Edition ed. New
York: Palgrave MacMillan .
Athreye, S. & Kapur, S., 2001. Private Foreign Investment in India: Pain or Panacea?. The World
Economy, Volume Vol. 24, pp. pp. 399-424.
Azhar, S. & K.N.Marimuthu, 2012. An overview of Foreign Direct Investment in India. International
Journal of Multidisiciplinary Management Studies, volume 2 (Issue 1), p. 202.
Bagella, M., Becchetti, L., Hasan, I. & Hunter, W. C., 2004. Monetart Intergration, Markets and
Regulations. First Edition ed. London: Elsevier Ltd..
Balasubramanyam, V., Salisu, M. & Sapsford, D., 1996. Foreign Direct Investment and Growth in EP
and IS Countries. Economic Journal, Vol. 106(Iss. 434), pp. pp. 92 - 105.
Beena, P., Laveesh Bhandari, S. B., Gokarn, S. & Tandon, A., 2004. Foreign Direct Investment in India.
In: Investment Strategies in Emerging Markets. London: EE, p. pp.126.
Blomstrom, M. & Kokko, A., 2001. FDI and Human Capital: A Research Agenda, Paris: OECD
Development Centre.
Buckley, P. & Casson, M., 1976. The Future of Multinational Enterprise, London: Homes & Meier.
Carkovic, M. & Levine, R., 2005. Does foreign Direct Investment Accelerate Economic Growth. In:
Doed Foreign Direct Investment Promote Development . Washinton DC: Institute for International
Economics, pp. pp. 195 - 220.
Caves, R. E., 1971. International Corporations: The Industrial Economics of Foreign Investment.
Economica, 38 Vol(149 Issue), pp. 1-27 .
Chakraborty, C. & Nunnenkamp, P., 2008. Economic Reforms, FDI, and Economic Growth in India: A
Sector Level Analysis. World Development, Vol. 36(Iss. 7), pp. pp. 1192 - 1212.
Cobb, C. W. & H.Douglas, P., 1928. A theory of Production, Chicago: American Economic Association.

Page | 60
D&B India, 2012. Overview of Telecom Industry. [Online]
Available at: http://www.dnb.co.in/IndianTelecomIndustry/OverviewTI.asp
[Accessed 22nd August 2012].
Daga, P., 2012. India's Economic Development Before 1991. [Online]
Available at: http://www.preservearticles.com/201104215582/indias-economic-development-
before-1991.html
[Accessed 19th July 2012].
Dang, X., 2002. Foreign Direct Investment in China , Manhattan : Kansas State University.
Deccan Herald, 2010. Corruption Impeding FDI Inflow to India: Study. [Online]
Available at: http://www.deccanherald.com/content/36505/corruption-impeding-fdi-inflow
[Accessed 13th September 2012].
DeLong, J. B., 2001. India Since Independence: An Analytic Groth Narrative , California : Berkeley.
Denisia, V., 2010. Foreign Direct Investment Theories: An overview of the Main FDI Theories.
European Journal of Interdiscipplinary Studies , Issue Iss. 3, pp. pp. 53-59.
Directorate of Economics and Statistics , 2004. A Report on Employment and Unemployment
Situation , Mumbai: Government of India.
Directorate of Economics and Statistics , 2005. A Report on Employment and Unemployment
Situation , Mumbai: Governemnt of India.
Directorate of Economics and Statistics , 2007. A Report on Employment and Unemployment
Situation , Mumbai: Government of India.
Directorate of Economics and Statistics, 2008. A Report on Employment and Unemployment Situation
, Mumbai: Government of India.
Dunning, J. H., 1977. Trade, Location of Economic Activity and the MNE: A search for an Eclectic
approach. The International Allocation of Economic Activity, Volume Macmillan: London, pp. pp: 395
- 418.
Emerging Market Direct, 2012. India's appetite for energy is outstripping supply. [Online]
Available at: http://emergingmarketsdirect.wordpress.com/2012/08/17/indias-electricity-demand-
outstripping-supply/
[Accessed 22nd August 2012].
Faeth, I., 2009. Determinants of Foreign Direct Investment - A Tale of Nine Theoretical Models.
Journal of Economic Surveys, Vol. 23(Iss. 1), pp. pp. 165 - 196.
Golub, S. S., 2009. Opennes to Foreign Direct Investment in Services: An International Coparative
Analysis. The World Economy, pp. 1245 - 1268.
Governemnt of India , 2012. Directorate of Economics and Statistis. [Online]
Available at: http://mahades.maharashtra.gov.in/displayAllReports.do
[Accessed 14th August 2012].
Page | 61
Graham, J. P. & Spaulding, R. B., 2005. Going Global. [Online]
Available at: http://www.going-global.com/articles/understanding_foreign_direct_investment.htm
[Accessed 10th July 2012].
Greenway, D., 1998. Does Trade Liberalisatiion Promote Economic Development. Scottish Journal of
Political Economy, Vol. 45(Iss. 5), pp. pp. 491 - 511.
Hennart, J., 1982. A Theory of Multinational Enterprise, Michigan: University of Michigan Press.
Hill(a), 2011. chapter 5 International Trade Theory. In: International Business Competing in the Global
Marketplace. eight edition ed. New York: McGraw-Hill Irwin, pp. pp. 175 - 177.
Hill, 2011. Chapter 7 Foreign Direct Investment. In: International Business Competing in the Global
Marketplace. New York: McGraw-Hill Irwin, pp. pp. 243 - 244.
Hymer, S., 1976. The International Operations of Nation Firms, A Study of Foreign Direct Investment,
Cambridge: MLT Press.
Indua Reports, 2012. Evolution and Growth of Indian Auto Industry. [Online]
Available at: http://india-reports.com/articles/Auto-Industry-India-Evolution-Growth.aspx
[Accessed 22nd August 2012].
Investment & Income, 2012. OLI Paradigm - The Eclectic Theory was evolved by John Dunning.
[Online]
Available at: http://www.investmentsandincome.com/investments/oli-paradigm.html
[Accessed 12 July 2012].
Javorcik, B. S., 2002. The Composition of Foreign Direct Investment and Protection of Intellectual
Property Rights: Evidence from Transition Economies. European Economic Review, Volume review 48,
pp. pp. 39 - 62.
Kemp, M., 1964. The Pure Theory of International Trade. The review of Economic Studies , Vol. 14(Iss.
2), pp. pp. 98 - 112.
MacDougall, G., 1960. The Benefits and Costs of Private Investment from Abroad: a Theoretical
Approach. Economic Record, Volume 36, pp. pp 13 - 35.
Malukani, M., 2010. India's Contruction Sector on Path to Growth Diversification. [Online]
Available at: http://www.ibtimes.com/articles/66418/20100928/construction-india-economic-
development-gdp.htm
[Accessed 15h August 2012].
Marchick, D. M. & Slaughter, M. J., 2008. Global FDI Policy Correcting a Protectionist Drift, New York:
Council on Foreign Relations.
Moosa, I. A., 2002. Foreign Direct Investment Theory, Evidence and Practice. 1st Edition ed. New
York: Palgrave.
Moran, T. H., 1999. The Impact of FDI on Host-Country Development: The Heritage of Theoory and
Evidence. In: Foreign Direct Investmeent and Development: The New Policy Agenda for Developing

Page | 62
Countries and Economies in Transition. Washindon DC: Institute for Internationall Economics, pp. pp.
19 - 25.
Morgan, R. E. & Katsikeas, C. S., 1997. Theories of International Trade, Foreign Direct Investment and
Firm Internalization: a Critique.. Management Decision, Vol. 35(Iss. 1), pp. pp. 68 - 78.
Mukherjee, B. P. a. P., 2012. Singh's Biggest Allly to Quit India Coalition Over Foreign Retaill. [Online]
Available at: http://www.businessweek.com/news/2012-09-18/singh-s-biggest-ally-to-quit-ruling-
alliance-over-foreign-retail
[Accessed 18th September 2012].
Nambiar, R., Mungekar, B. & Tadas, G., 1991. Is Import Liberaalisation Hurting Domestic Industry and
Employment/. Economic and Political Weekly, pp. pp. 417 - 424.
Nayak, A. K., 2006. Globalization of Foreign Direct Investment in India: 1900s - 2000, North Carolina,
Chapel Hill: Conference of the Historical Society.
Nguyen, C. D. et al., 2008. FDI Horizontal and Vertical Effects on Local Firm Technical Efficiency,
Vietnam: VEAM.
Njikam, O. & Cockburn, J., 2007. Trade Liveralization and Productivity Growth: Firm- level Evidence
from Carmeroon, Cameroon: University of Yaounde.
OECD, 1999. OECD Benchmark Definition of Foreign Direct Investment. Third Edition ed. France: OECD
Publications.
OECD, 2012. Trade Liberalisation. [Online]
Available at: http://www.oecd.org/trade/tradeliberalisation.htm
[Accessed 15th July 2012].
Princeton Universty , 2012. Panel Data. [Online]
Available at: http://dss.princeton.edu/online_help/stats_packages/stata/panel.htm
[Accessed 15th August 2012].
Prowess, 2012. Prowess. [Online]
Available at: http://www.ats.ucla.edu/stat/stata/dae/mvreg.htm
[Accessed 15th August 2012].
Rajan, R. S., Rongala, S. & Ghosh, R., 2008. Attracting Foreign Direct Investment to India, Virginia:
George Mason University.
Rao, K. C. & Dhar, B., 2011. India's FDI Inflows Trands & Concepts, New Delhi: ISID.
Research and Information Systems for Developing Countries, 2011. India's FDI Inflows Trends and
Concepts, New Delhi: Institute for Studies in Industrial Development.
Sharan, V., 2009. International Financial Management. 5th Edition ed. New Delhi: PHI Learning
Private Limited.
Shenkar, O. & Luo, Y., 2008. International Business. Second Edition ed. London: Sage Publications .

Page | 63
STATA Corp, 2009. STATA Statistical Software Release 11.. College Station: TX: StataCorp LP..
Tambunlertchai, S., 2009. Foreign Direct Investment and Export Performance in Thailand. [Online]
Available at:
http://wesscholar.wesleyan.edu/cgi/viewcontent.cgi?article=1381&context=etd_hon_theses
[Accessed July 2012].
Taneja, N. & Bimal, S., 2012. FDI - a major milestone in Indo-Pak ties. [Online]
Available at: http://www.thehindubusinessline.com/opinion/columns/article3807921.ece
[Accessed 3rd September 2012].
The Economic Times, 2011. 100% FDI regime in Pharmeceutical Sector. [Online]
Available at: http://articles.economictimes.indiatimes.com/2011-10-11/news/30266948_1_drug-
companies-fdi-limit-indian-drug
[Accessed 14th September 2012].
Topalova, P., 2010. Trade Liberalization and Firm Productivity: The Case of India, New York:
International Monetart Fund.
Trading Economics, 2012. India GDP Growth Rate. [Online]
Available at: http://www.tradingeconomics.com/india/gdp-growth
[Accessed 15th September 2012].
Tybout, James, Melo, J. D. & Corbo, V., 1991. The effects of trade Reforms on Scale and Technical
Efficiency: New Evidence from Chile. Journal of International Economics, Vol. 31(Iss. 1), pp. pp. 231 -
259.
UNCTAD, 2003. World Investment Report 2003: FDI policies for development National and
International Perspectives, New York: UNCTAD.
UNCTAD, 2007. World Investment Report 2007, New York and Geneva: Oxford University Press.
UNCTAD, 2008. World Investent Report 2008 Transnational Corporations and the Infrastructure
Challenge, New York and Geneva: United Nations .
UNCTAD, 2009. Assessing the Impact of the Current Financial and Economic Crisis on Global FDI
Flows, Geneva: UNCTAD.
United Nations , 1992. World Investment Report 1992 Transnational Corporations as Engines of
Growth, New York: United Nations.
Velde, D. W. t., 2006. Foreign Direct Investment and Development An Historical Perspective, New
York: Overseas Development Institute.
Vernon, R., 1966. International Investment and International Trade in the Product Cycle. Quarterly
Journal of Economics , Issue 80, pp. pp. 190 - 207.
Weibull, 2008. Hypothesis Tests in Multiple Linear Regression. [Online]
Available at:
http://www.weibull.com/DOEWeb/hypothesis_tests_in_multiple_linear_regression.htm#Test on

Page | 64
Individual Regression Coefficients ( t Test)
[Accessed 3rd September 2012].
Wei, W., 2005. China and India: Any difference in their FDI performances?. Journal of Asian
Economics, Volume Vol 16, pp. pp. 719 - 736.
World Bank, 2012. Population Growth Rate. [Online]
Available at: http://www.worldbank.org/depweb/english/modules/social/pgr/
[Accessed 13th September 2012].
Zhang, K. H., 2006. Foreign Direct Investment and Economic Growth in China: A Panel Data Study for
1992 - 2004, Illinois: Illinois State University.