Embed Size (px)
Citation preview
Richards Boulevard – Olive Drive Corridor
Transportation Analysis Report
Appendix
December 2016
RS16-3438
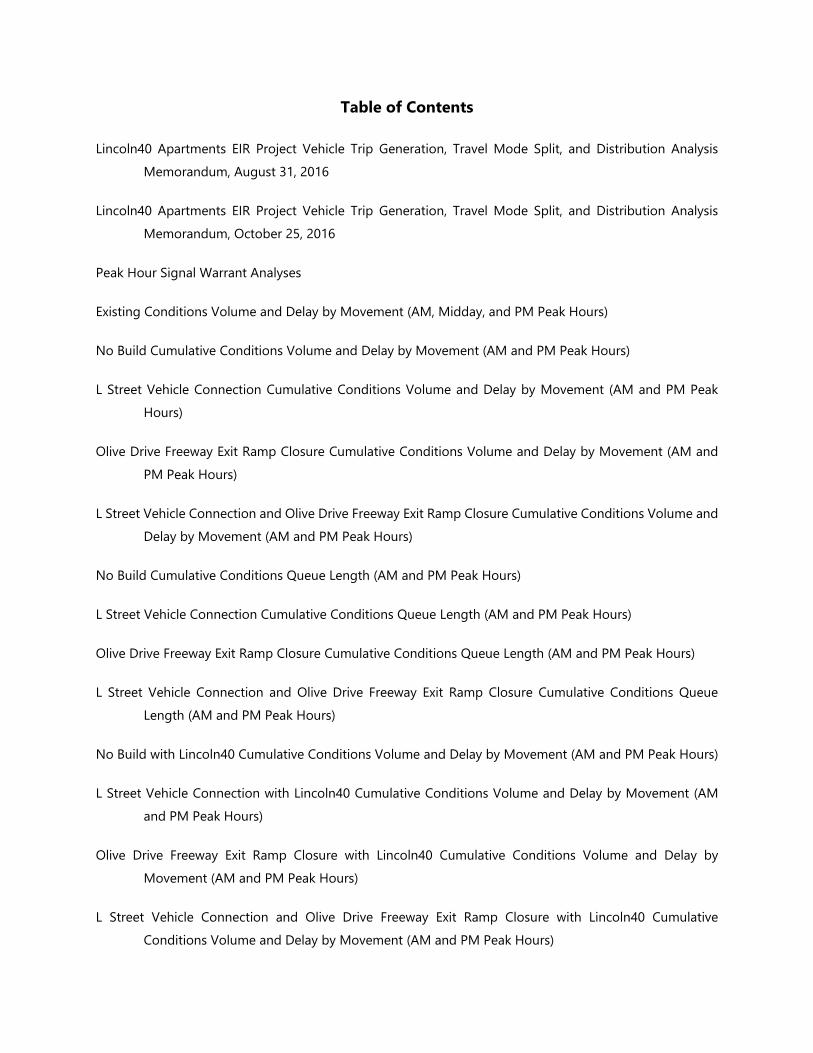
Table of Contents
Lincoln40 Apartments EIR Project Vehicle Trip Generation, Travel Mode Split, and Distribution Analysis Memorandum, August 31, 2016
Lincoln40 Apartments EIR Project Vehicle Trip Generation, Travel Mode Split, and Distribution Analysis Memorandum, October 25, 2016
Peak Hour Signal Warrant Analyses
Existing Conditions Volume and Delay by Movement (AM, Midday, and PM Peak Hours)
No Build Cumulative Conditions Volume and Delay by Movement (AM and PM Peak Hours)
L Street Vehicle Connection Cumulative Conditions Volume and Delay by Movement (AM and PM Peak Hours)
Olive Drive Freeway Exit Ramp Closure Cumulative Conditions Volume and Delay by Movement (AM and PM Peak Hours)
L Street Vehicle Connection and Olive Drive Freeway Exit Ramp Closure Cumulative Conditions Volume and Delay by Movement (AM and PM Peak Hours)
No Build Cumulative Conditions Queue Length (AM and PM Peak Hours)
L Street Vehicle Connection Cumulative Conditions Queue Length (AM and PM Peak Hours)
Olive Drive Freeway Exit Ramp Closure Cumulative Conditions Queue Length (AM and PM Peak Hours)
L Street Vehicle Connection and Olive Drive Freeway Exit Ramp Closure Cumulative Conditions Queue Length (AM and PM Peak Hours)
No Build with Lincoln40 Cumulative Conditions Volume and Delay by Movement (AM and PM Peak Hours)
L Street Vehicle Connection with Lincoln40 Cumulative Conditions Volume and Delay by Movement (AM and PM Peak Hours)
Olive Drive Freeway Exit Ramp Closure with Lincoln40 Cumulative Conditions Volume and Delay by Movement (AM and PM Peak Hours)
L Street Vehicle Connection and Olive Drive Freeway Exit Ramp Closure with Lincoln40 Cumulative Conditions Volume and Delay by Movement (AM and PM Peak Hours)

No Build with Lincoln40 Cumulative Conditions Queue Length (AM and PM Peak Hours)
L Street Vehicle Connection with Lincoln40 Cumulative Conditions Queue Length (AM and PM Peak Hours)
Olive Drive Freeway Exit Ramp Closure with Lincoln40 Cumulative Conditions Queue Length (AM and PM Peak Hours)
L Street Vehicle Connection and Olive Drive Freeway Exit Ramp Closure with Lincoln40 Cumulative Conditions Queue Length (AM and PM Peak Hours)
L Street Vehicle Connection without I-80/Richards Boulevard Interchange Improvements Cumulative Conditions Volume and Delay by Movement (AM and PM Peak Hours)
L Street Vehicle Connection without I-80/Richards Boulevard Interchange Improvements Cumulative Conditions Queue Length (AM and PM Peak Hours)
L Street Vehicle Connection Northbound Only Cumulative Conditions Volume and Delay by Movement (AM and PM Peak Hours)
L Street Vehicle Connection Northbound Only Cumulative Conditions Queue Length (AM and PM Peak Hours)
MEMORANDUM #2
Date: August 31, 2016
To: Nick Pappani (Raney Planning & Management); Ike Njoku (City of Davis)
From: Jimmy Fong and Fred Choa (Fehr & Peers)
Subject: Davis Lincoln40 Apartments EIR
Project Vehicle Trip Generation and Distribution Analysis
RS16-3459
This memorandum documents the results of the vehicle trip generation and trip distribution analysis for the
proposed Lincoln 40 Apartments Project in Davis, California.
Proposed Project
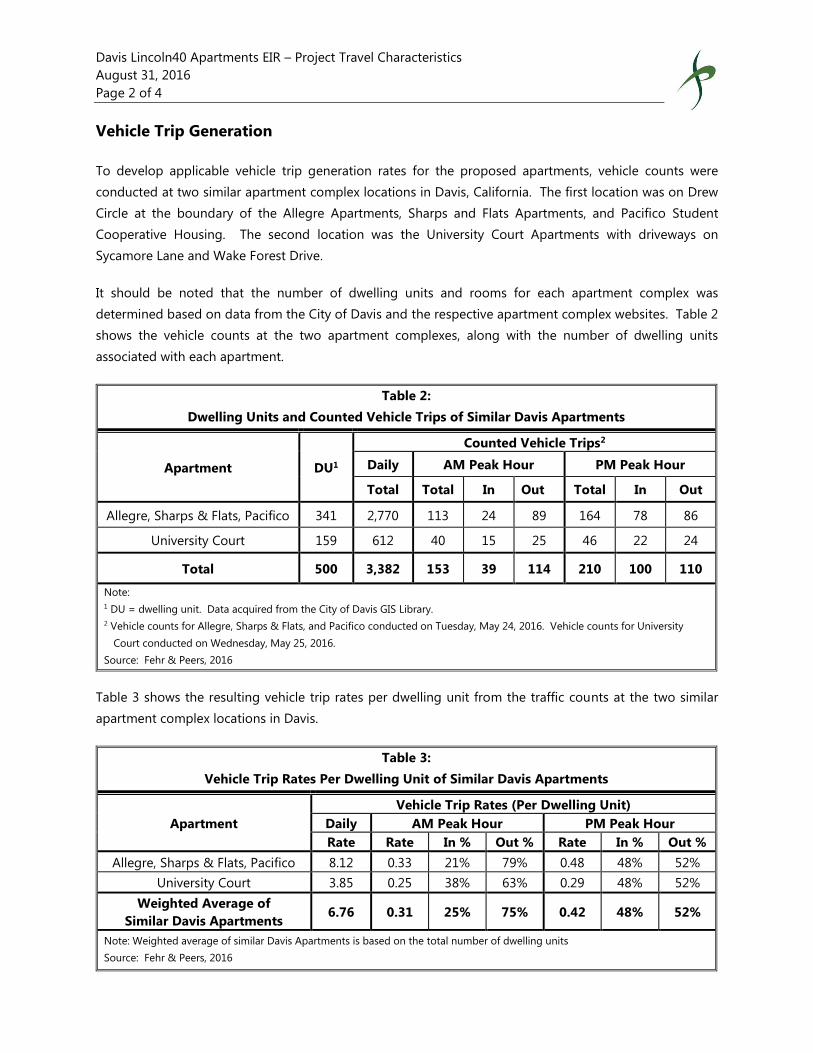
The proposed project is located on Olive Drive in close proximity to Richards Boulevard, Downtown Davis
and UC Davis. The Davis Lincoln40 Apartments complex would be oriented towards a student population
with unit types consisting of two (2) to five (5) bedrooms. Table 1 shows the proposed number of dwelling
units and rooms by unit type of the proposed project.
Table 1:
Proposed Lincoln 40 Apartments Project – Unit Type, Dwelling Units and Rooms
Unit Type Dwelling Units Rooms
2 bedroom 17 34
3 bedroom 21 63
4 bedroom 84 336
5 bedroom 8 40
Total 130 473
Source: HighBridge Properties, June 2016.
Due to the unique travel characteristics of a student-oriented apartment in Davis, calculating trip generation
using local data at similar apartment complexes is more appropriate than using the general apartment trip
rates in the Institute of Transportation Engineers Trip Generation Manual.
Davis Lincoln40 Apartments EIR – Project Travel Characteristics
August 31, 2016
Page 2 of 4
Vehicle Trip Generation
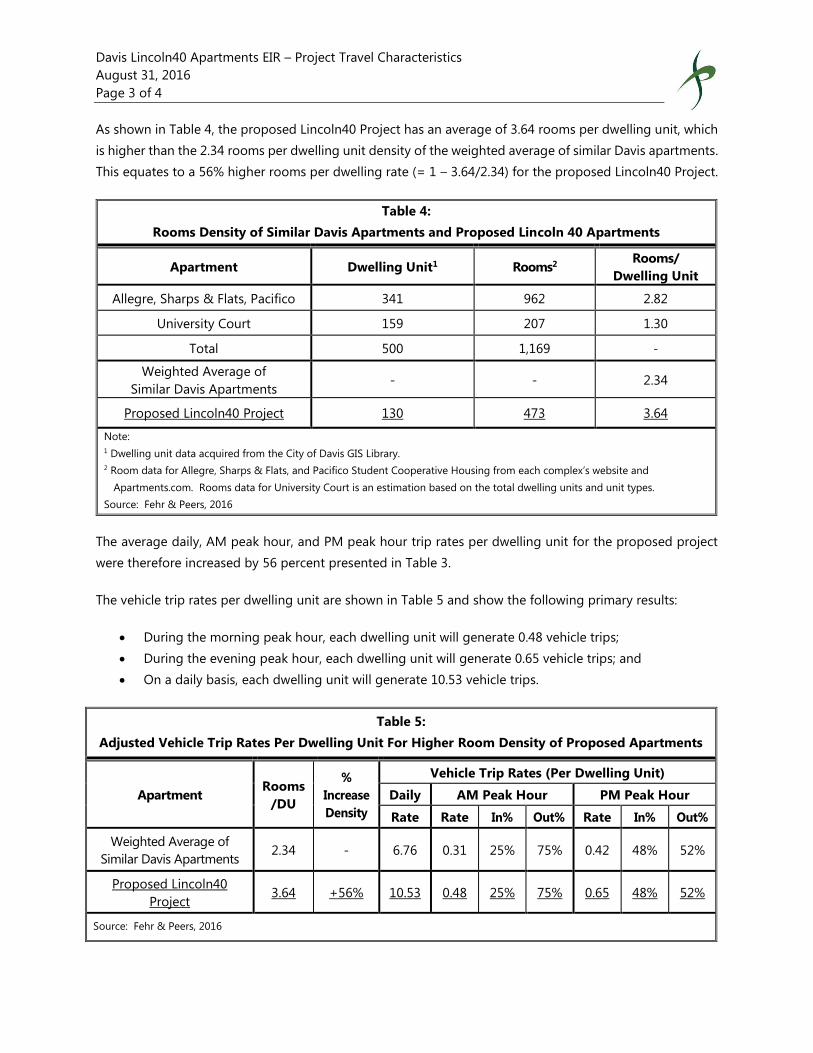
To develop applicable vehicle trip generation rates for the proposed apartments, vehicle counts were
conducted at two similar apartment complex locations in Davis, California. The first location was on Drew
Circle at the boundary of the Allegre Apartments, Sharps and Flats Apartments, and Pacifico Student
Cooperative Housing. The second location was the University Court Apartments with driveways on
Sycamore Lane and Wake Forest Drive.
It should be noted that the number of dwelling units and rooms for each apartment complex was
determined based on data from the City of Davis and the respective apartment complex websites. Table 2
shows the vehicle counts at the two apartment complexes, along with the number of dwelling units
associated with each apartment.
Table 2:
Dwelling Units and Counted Vehicle Trips of Similar Davis Apartments
Apartment DU1
Counted Vehicle Trips2
Daily AM Peak Hour PM Peak Hour
Total Total In Out Total In Out
Allegre, Sharps & Flats, Pacifico 341 2,770 113 24 89 164 78 86
University Court 159 612 40 15 25 46 22 24
Total 500 3,382 153 39 114 210 100 110
Note:
1 DU = dwelling unit. Data acquired from the City of Davis GIS Library.
2 Vehicle counts for Allegre, Sharps & Flats, and Pacifico conducted on Tuesday, May 24, 2016. Vehicle counts for University
Court conducted on Wednesday, May 25, 2016.
Source: Fehr & Peers, 2016
Table 3 shows the resulting vehicle trip rates per dwelling unit from the traffic counts at the two similar
apartment complex locations in Davis.
Table 3:
Vehicle Trip Rates Per Dwelling Unit of Similar Davis Apartments
Apartment
Vehicle Trip Rates (Per Dwelling Unit)
Daily AM Peak Hour PM Peak Hour
Rate Rate In % Out % Rate In % Out %
Allegre, Sharps & Flats, Pacifico 8.12 0.33 21% 79% 0.48 48% 52%
University Court 3.85 0.25 38% 63% 0.29 48% 52%
Weighted Average of
Similar Davis Apartments 6.76 0.31 25% 75% 0.42 48% 52%
Note: Weighted average of similar Davis Apartments is based on the total number of dwelling units
Source: Fehr & Peers, 2016
Davis Lincoln40 Apartments EIR – Project Travel Characteristics
August 31, 2016
Page 3 of 4
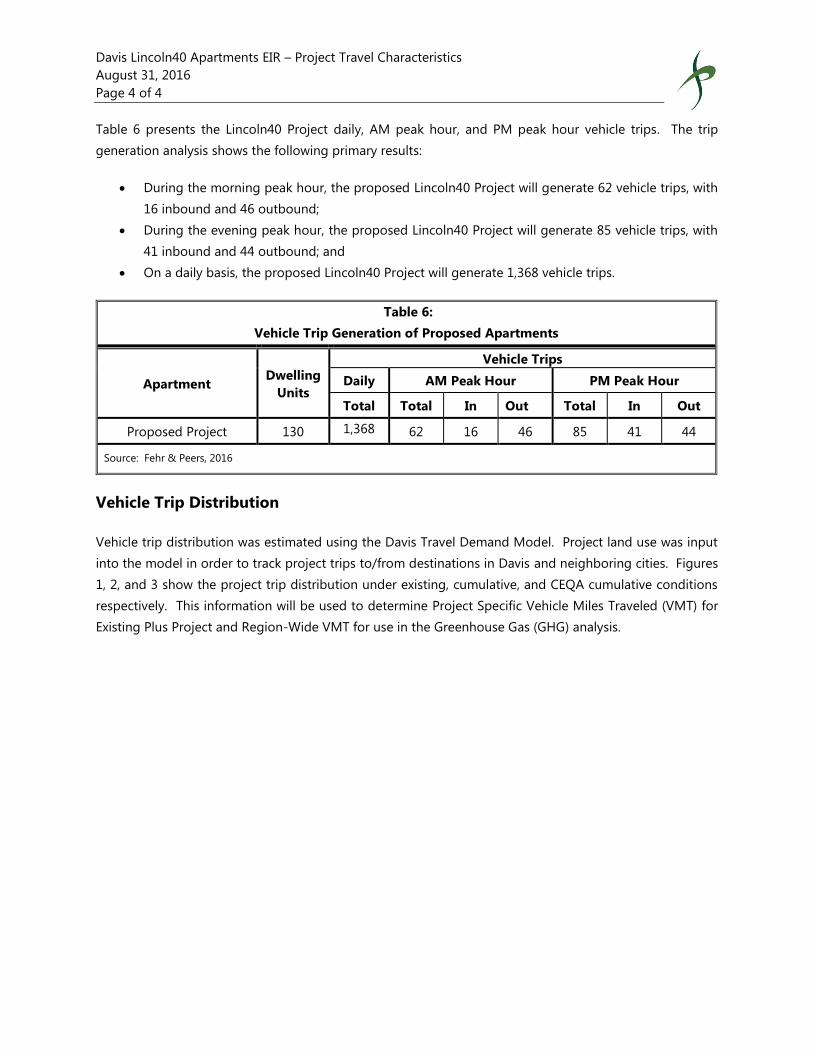
As shown in Table 4, the proposed Lincoln40 Project has an average of 3.64 rooms per dwelling unit, which
is higher than the 2.34 rooms per dwelling unit density of the weighted average of similar Davis apartments.
This equates to a 56% higher rooms per dwelling rate (= 1 – 3.64/2.34) for the proposed Lincoln40 Project.
Table 4:
Rooms Density of Similar Davis Apartments and Proposed Lincoln 40 Apartments
Apartment Dwelling Unit1 Rooms2 Rooms/
Dwelling Unit
Allegre, Sharps & Flats, Pacifico 341 962 2.82
University Court 159 207 1.30
Total 500 1,169 -
Weighted Average of
Similar Davis Apartments - - 2.34
Proposed Lincoln40 Project 130 473 3.64
Note:
1 Dwelling unit data acquired from the City of Davis GIS Library.
2 Room data for Allegre, Sharps & Flats, and Pacifico Student Cooperative Housing from each complex’s website and
Apartments.com. Rooms data for University Court is an estimation based on the total dwelling units and unit types.
Source: Fehr & Peers, 2016
The average daily, AM peak hour, and PM peak hour trip rates per dwelling unit for the proposed project
were therefore increased by 56 percent presented in Table 3.
The vehicle trip rates per dwelling unit are shown in Table 5 and show the following primary results:
During the morning peak hour, each dwelling unit will generate 0.48 vehicle trips;
During the evening peak hour, each dwelling unit will generate 0.65 vehicle trips; and
On a daily basis, each dwelling unit will generate 10.53 vehicle trips.
Table 5:
Adjusted Vehicle Trip Rates Per Dwelling Unit For Higher Room Density of Proposed Apartments
Apartment Rooms
/DU
%
Increase
Density
Vehicle Trip Rates (Per Dwelling Unit)
Daily AM Peak Hour PM Peak Hour
Rate Rate In% Out% Rate In% Out%
Weighted Average of
Similar Davis Apartments 2.34 - 6.76 0.31 25% 75% 0.42 48% 52%
Proposed Lincoln40
Project 3.64 +56% 10.53 0.48 25% 75% 0.65 48% 52%
Source: Fehr & Peers, 2016
Davis Lincoln40 Apartments EIR – Project Travel Characteristics
August 31, 2016
Page 4 of 4
Table 6 presents the Lincoln40 Project daily, AM peak hour, and PM peak hour vehicle trips. The trip
generation analysis shows the following primary results:
During the morning peak hour, the proposed Lincoln40 Project will generate 62 vehicle trips, with
16 inbound and 46 outbound;
During the evening peak hour, the proposed Lincoln40 Project will generate 85 vehicle trips, with
41 inbound and 44 outbound; and
On a daily basis, the proposed Lincoln40 Project will generate 1,368 vehicle trips.
Table 6:
Vehicle Trip Generation of Proposed Apartments
Apartment Dwelling
Units
Vehicle Trips
Daily AM Peak Hour PM Peak Hour
Total Total In Out Total In Out
Proposed Project 130 1,368 62 16 46 85 41 44
Source: Fehr & Peers, 2016
Vehicle Trip Distribution
Vehicle trip distribution was estimated using the Davis Travel Demand Model. Project land use was input
into the model in order to track project trips to/from destinations in Davis and neighboring cities. Figures
1, 2, and 3 show the project trip distribution under existing, cumulative, and CEQA cumulative conditions
respectively. This information will be used to determine Project Specific Vehicle Miles Traveled (VMT) for
Existing Plus Project and Region-Wide VMT for use in the Greenhouse Gas (GHG) analysis.

C St
A St
Olive DrB St
E St
F StD St
Third St
G St
Second St
I St
First St
J St
Fourth St
Cow
ell B
lvd
Rese
arch
Par
k Dr
K St
L St
Richards Blvd
Fifth St
Chiles R
d
Old Davis Rd
H St
University Ave
Rice Ln
Solan
o Par
k Cir
Russell Blvd
Morris Way
Aggie Ln
§̈¦80
Second St
Inbound
Project Site
!
!
!
!
!
!
!
!
!
!
!
¾À12%
¾À11%
¾À88%
¾À33%
¾À8%
¾À2%
¾À2%
¾À22%
¾À11%
¾À15%
¾À7%
¾À1%
¾À9%
N:\20
16 Pr
ojects
\3459
_Dav
isLinc
oln40
EIR\G
raphic
s\Draf
t\GIS\
MXD\
fig01
_Trip
_Ex.m
xd
Inbound & Outbound Project Trip Distribution -Existing Conditions
!
Trip DistributionProject Site
City of DavisUniversity of California Davis Campus
Figure 1
C St
A St
Olive DrB St
E St
F StD St
Third St
G St
Second St
I St
First St
J St
Fourth St
Cow
ell B
lvd
Rese
arch
Par
k Dr
K St
L St
Richards Blvd
Fifth St
Chiles R
d
Old Davis Rd
H St
University Ave
Rice Ln
Solan
o Par
k Cir
Russell Blvd
Morris Way
Aggie Ln
§̈¦80
Second St
Outbound
Project Site
!
!
!
!
!
!
!
!
!
¾À7%
¾À100%!
¾À10%
¾À31%
¾À17%
¾À30%
¾À8%
¾À10%
¾À6%
¾À7%
¾À2%
¾À2%

C St
A St
Olive DrB St
E St
F StD St
Third St
G St
Second St
I St
First St
J St
Fourth St
Cow
ell B
lvd
Rese
arch
Par
k Dr
K St
L St
Richards Blvd
Fifth St
Chiles R
d
Old Davis Rd
H St
University Ave
Rice Ln
Solan
o Par
k Cir
Russell Blvd
Morris Way
Aggie Ln
§̈¦80
Second St
Inbound
Project Site
!
!
!
!
!
!
!
!
¾À2%
¾À14%
¾À11%¾À9%
¾À9%!
!
¾À18%
!
¾À13%
¾À12%
¾À87%
¾À32%
¾À9%
¾À2%
¾À1%
\\Fps
a03\D
ata\20
16 Pr
ojects
\3459
_Dav
isLinc
oln40
EIR\G
raphic
s\Draf
t\GIS\
MXD\
fig02
_Trip
_Cum
u.mxd
Inbound & Outbound Project Trip Distribution -Cumulative Conditions
!
Trip DistributionProject Site
City of DavisUniversity of California Davis Campus
Figure 2
C St
A St
Olive DrB St
E St
F StD St
Third St
G St
Second St
I St
First St
J St
Fourth St
Cow
ell B
lvd
Rese
arch
Par
k Dr
K St
L St
Richards Blvd
Fifth St
Chiles R
d
Old Davis Rd
H St
University Ave
Rice Ln
Solan
o Par
k Cir
Russell Blvd
Morris Way
Aggie Ln
§̈¦80
Second St
Outbound
Project Site
!
!
!
!
!
!
!
!
!
!
¾À16%
¾À31%
¾À100% ¾À9%
¾À11%
¾À7%
¾À1% ¾À9%
¾À2%
¾À10%
¾À28%¾À7%

C St
A St
Olive DrB St
E St
F StD St
Third St
G St
Second St
I St
First St
J St
Fourth St
Cow
ell B
lvd
Rese
arch
Par
k Dr
K St
L St
Richards Blvd
Fifth St
Chiles R
d
Old Davis Rd
H St
University Ave
Rice Ln
Solan
o Par
k Cir
Russell Blvd
Morris Way
Aggie Ln
§̈¦80
Second St
Inbound
Project Site
!
!
!
!
!
!
!
!
!
!
!
¾À9%
¾À13%
¾À12%
¾À87%
¾À32%
¾À9%
¾À20%
¾À2%
¾À1%
¾À9%
¾À2%
¾À15%
¾À11%
¾À17%
N:\20
16 Pr
ojects
\3459
_Dav
isLinc
oln40
EIR\G
raphic
s\Draf
t\GIS\
MXD\
fig03
_Trip
_CEQ
A.mxd
Inbound & Outbound Project Trip Distribution -CEQA Cumulative Conditions
!
Trip DistributionProject Site
City of DavisUniversity of California Davis Campus
Figure 3
C St
A St
Olive DrB St
E St
F StD St
Third St
G St
Second St
I St
First St
J St
Fourth St
Cow
ell B
lvd
Rese
arch
Par
k Dr
K St
L St
Richards Blvd
Fifth St
Chiles R
d
Old Davis Rd
H St
University Ave
Rice Ln
Solan
o Par
k Cir
Russell Blvd
Morris Way
Aggie Ln
§̈¦80
Second St
Outbound
Project Site
!
!
!
!
!
!
!
!
!
!
¾À16%
¾À100%
¾À31%
¾À9%
¾À11%
¾À6%
¾À1% ¾À9%
¾À2%
¾À15%
¾À4%¾À27%

MEMORANDUM #2
Date: October 25, 2016
To: Nick Pappani (Raney Planning & Management); Ike Njoku (City of Davis)
From: Jimmy Fong and Fred Choa (Fehr & Peers)
Subject: Lincoln40 Apartments EIR
Project Vehicle Trip Generation, Travel Mode Split, and Distribution Analysis
RS16-3459
This memorandum documents the results of the vehicle trip generation, travel mode split, and trip
distribution analysis for the proposed Lincoln40 Apartments Project in Davis, California.
Proposed Project
The proposed project is located on Olive Drive in close proximity to Richards Boulevard, Downtown Davis
and UC Davis. The Lincoln40 Apartments complex would be oriented towards a student population with
unit types consisting of two to five bedrooms. Table 1 shows the proposed number of dwelling units and
rooms by unit type of the proposed project.
Table 1:
Proposed Lincoln 40 Apartments Project – Unit Type, Dwelling Units and Rooms
Unit Type Dwelling Units Rooms
2 bedroom 17 34
3 bedroom 21 63
4 bedroom 84 336
5 bedroom 8 40
Total 130 473
Source: HighBridge Properties, June 2016.
Due to the unique travel characteristics of a student-oriented apartment in Davis, calculating trip
generation using local data at similar apartment complexes was more appropriate than using the industry
standard of general apartment trip rates in the Institute of Transportation Engineers (ITE) Trip Generation
Manual.
Davis Lincoln40 Apartments EIR – Project Travel Characteristics
October 25, 2016
Page 2 of 6
Vehicle Trip Generation
This section describes the following steps for determining the project’s vehicle trip generation:
Vehicle data collection at apartment complexes similar to the proposed project
Adjustment of vehicle trip rate for higher density of proposed project
Adjustment of vehicle trip rate for parking cost and reduced parking supply of proposed project
Vehicle Data Collection at Apartment Complexes Similar to Lincoln40 Project
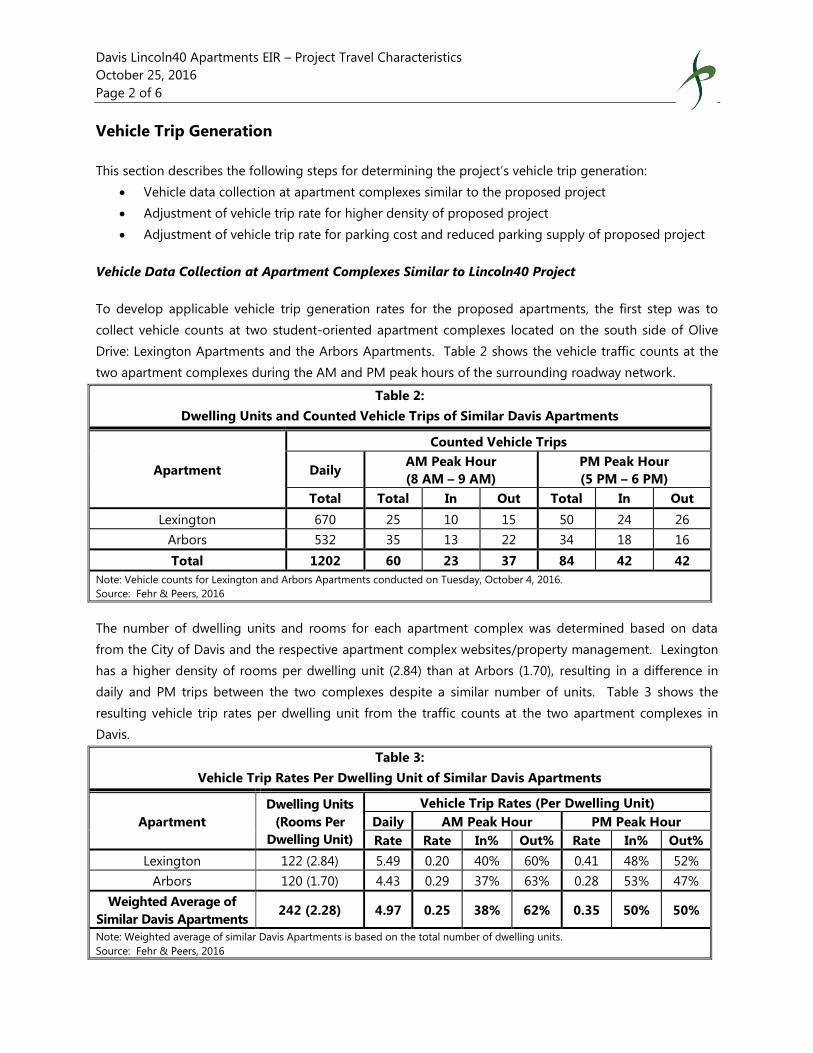
To develop applicable vehicle trip generation rates for the proposed apartments, the first step was to
collect vehicle counts at two student-oriented apartment complexes located on the south side of Olive
Drive: Lexington Apartments and the Arbors Apartments. Table 2 shows the vehicle traffic counts at the
two apartment complexes during the AM and PM peak hours of the surrounding roadway network.
Table 2:
Dwelling Units and Counted Vehicle Trips of Similar Davis Apartments
Apartment
Counted Vehicle Trips
Daily AM Peak Hour
(8 AM – 9 AM)
PM Peak Hour
(5 PM – 6 PM)
Total Total In Out Total In Out
Lexington 670 25 10 15 50 24 26
Arbors 532 35 13 22 34 18 16
Total 1202 60 23 37 84 42 42
Note: Vehicle counts for Lexington and Arbors Apartments conducted on Tuesday, October 4, 2016.
Source: Fehr & Peers, 2016
The number of dwelling units and rooms for each apartment complex was determined based on data
from the City of Davis and the respective apartment complex websites/property management. Lexington
has a higher density of rooms per dwelling unit (2.84) than at Arbors (1.70), resulting in a difference in
daily and PM trips between the two complexes despite a similar number of units. Table 3 shows the
resulting vehicle trip rates per dwelling unit from the traffic counts at the two apartment complexes in
Davis.
Table 3:
Vehicle Trip Rates Per Dwelling Unit of Similar Davis Apartments
Apartment
Dwelling Units
(Rooms Per
Dwelling Unit)
Vehicle Trip Rates (Per Dwelling Unit)
Daily AM Peak Hour PM Peak Hour
Rate Rate In% Out% Rate In% Out%
Lexington 122 (2.84) 5.49 0.20 40% 60% 0.41 48% 52%
Arbors 120 (1.70) 4.43 0.29 37% 63% 0.28 53% 47%
Weighted Average of
Similar Davis Apartments 242 (2.28) 4.97 0.25 38% 62% 0.35 50% 50%
Note: Weighted average of similar Davis Apartments is based on the total number of dwelling units.
Source: Fehr & Peers, 2016

Davis Lincoln40 Apartments EIR – Project Travel Characteristics
October 25, 2016
Page 3 of 6
Adjustment for Higher Density (Rooms Per Dwelling Unit) of Lincoln40 Project
As shown in Table 4, the proposed Lincoln40 Project has an average of 3.64 rooms per dwelling unit,
which is higher than the 2.28 rooms per dwelling unit density of the weighted average of similar Davis
apartments. This equates to a 59 percent (3.64 / 2.28) higher rooms per dwelling rate for the proposed
Lincoln40 Project.
Table 4:
Rooms Density of Similar Davis Apartments and Proposed Lincoln40 Apartments
Apartment Dwelling Unit1 Rooms2 Rooms/Dwelling Unit
Lexington 122 347 2.84
Arbors 120 206 1.70
Total 242 553 -
Weighted Average of Similar Davis Apartments - - 2.28
Proposed Lincoln40 Project 130 473 3.64
Note: 1 Dwelling unit data acquired from the City of Davis GIS Library. 2 Room data for Lexington and Arbors Apartments from each complex’s website and property management.
Source: Fehr & Peers, 2016
Comparison of density based on number of residents was also evaluated. Property management at
Lexington specified 407 residents at their complex, Arbors approximated 275 residents, resulting in a total
682 residents in 242 dwelling units (average 2.82 residents per dwelling unit). Lincoln40 proposes a
maximum of 708 residents in 130 dwelling units (average 5.45 residents per dwelling unit). This would
equate to a 93 percent higher residents per dwelling unit density; however, considering the number of
residents can vary, we determined that the rooms per dwelling unit adjustment for the trip generation
estimate was appropriate.
The average daily, AM peak hour, and PM peak hour trip rates per dwelling unit for the proposed project
were therefore increased by 59 percent to reflect the increased room density of the project, as shown in
Table 5. The primary reasons for applying these adjustments are:
Despite Lincoln40 proposing a similar number of dwelling units (130) compared to Lexington
(122) or Arbors (120), the number of rooms is 36 percent higher than Lexington, and 130 percent
higher than Arbors.
The additional residents based on increased density would add additional vehicle, bicycle,
pedestrian, and transit trips to and from the project site.
Table 5:
Adjusted Vehicle Trip Rates Per Dwelling Unit For Higher Room Density of Lincoln40 Apartments
Apartment Rooms
/DU
%
Increase
Density
Vehicle Trip Rates (Per Dwelling Unit)
Daily AM Peak Hour PM Peak Hour
Rate Rate In% Out% Rate In% Out%
Weighted Average of
Similar Davis Apartments 2.28 - 4.97 0.25 38% 62% 0.35 50% 50%
Preliminary Vehicle Trip
Rates for Lincoln40 3.64 +59% 7.91 0.39 38% 62% 0.55 50% 50%
Source: Fehr & Peers, 2016

Davis Lincoln40 Apartments EIR – Project Travel Characteristics
October 25, 2016
Page 4 of 6
Adjustment for Parking Cost and Reduced Parking Supply of Lincoln40 Project
The project proposes to charge per parking space as an additional monthly fee from rent. In addition, the
project proposes to provide 239 parking spaces, which is a 6.6% variance from the City of Davis zoning
code that requires 256 parking spaces.
This unbundled parking cost and reduction in parking supply has the potential to reduce parking demand
and the associated number of vehicles and vehicle trips to and from the project. The additional parking
cost also has the potential for residents to use other travel modes (walking, bicycling, or transit) to travel
to and from the project site.
To estimate the potential reduction in vehicle trips due to these parking strategies, the Transportation
Demand Management Model (TDM+) was used. This model incorporates comprehensive peer-reviewed
research by the California Air Pollution Control Officers Association for estimating percentage reduction in
vehicle miles of travel (VMT) based on specific transportation demand management strategies (including
parking), and was calibrated and validated to actual trip generation. Inputs into the model include the
proposal to charge an additional fee for parking, and the difference between the unconstrained parking
demand and the proposed parking supply.
To determine the unconstrained parking demand, peak parking occupancy counts were conducted at
Lexington Apartments and the Arbors Apartments. Peak parking demand occurred between 2:00 AM and
5:00 AM, at which time both parking lots were not fully occupied (approximately 92% at Lexington and
70% at Arbors). The peak unconstrained parking demand was determined to be 0.71 parking spaces per
room, which would equate to 336 parking spaces for the Lincoln40 project. The project proposes a
parking supply of 0.51 parking spaces per room (239 parking spaces / 473 rooms).
Output from the TDM+ model resulted in a 13 percent reduction in VMT. VMT is a good indicator of
vehicle trips; therefore, we applied the same reduction percentage to the vehicle trip generation rates.
The resulting vehicle trip rates after this parking adjustment are presented in Table 6.
Table 6:
Adjusted Vehicle Trip Rates Per Dwelling Unit For Parking Cost and Reduced Parking Supply of
Proposed Apartments
Parking Scenario % Decrease
in Trips
Vehicle Trip Rates (Per Dwelling Unit)
Daily AM Peak Hour PM Peak Hour
Rate Rate In% Out% Rate In% Out%
Unconstrained free parking - 7.91 0.39 38% 62% 0.55 50% 50%
Final Vehicle Trip Generation
Rates for Lincoln40 Project -13% 6.88 0.34 38% 62% 0.48 50% 50%
Source: Fehr & Peers, 2016

Davis Lincoln40 Apartments EIR – Project Travel Characteristics
October 25, 2016
Page 5 of 6
Final Vehicle Trip Generation and Comparison
Table 7 presents the final vehicle trip generation rates for the Lincoln40 project after refinements to reflect
the particular location, higher density, and parking constraints, plus comparison of vehicle trip generation
based on other non-refined methodologies.
Table 7:
Comparison of Vehicle Trip Generation Rates
Vehicle Trip Generation Methodology
Vehicle Trip Rates (Per Dwelling Unit)
Daily AM Peak Hour PM Peak Hour
Rate Rate In% Out% Rate In% Out%
Davis Travel Demand Model1 5.96 0.43 15% 85% 0.47 70% 30%
ITE (Land Use 220 – Apartment)2 6.65 0.51 20% 80% 0.62 65% 35%
Final Vehicle Trip Generation Rates for
Lincoln40 Project3 6.88 0.34 38% 62% 0.48 50% 50%
Notes:
1 Vehicle trip rates shown for the Davis Travel Demand Model assumes input of 130 dwelling units for a general Davis apartment.
2 Vehicle trip rates shown for ITE assumes input of 130 dwelling units for a general apartment (ITE Land Use Code 220).
3 Final vehicle trip rates for Lincoln40 Project assumes input of 130 dwelling units based on local Lexington and Arbors
Apartments count data, refinement for higher room density, and adjustment for parking constraints.
Source: Fehr & Peers, 2016
Despite the higher density of the proposed Lincoln40 Apartments compared to a typical
apartment in Davis or in the Institute of Transportation Engineers (ITE) Trip Generation Manual,
the total vehicle trips are comparable due to the high percentage of trips by non-automobile
modes (bicycle, walk, transit), as presented in the following section.
During the AM peak hour, the refined Lincoln40 Project vehicle trip generation rate was estimated
to be 21 percent lower than the Davis Travel Demand Model and 33 percent lower than industry
standard, general apartment trip rates in ITE based on number of dwelling units.
During the PM peak hour, the refined Lincoln40 Project vehicle trip generation rate was estimated
to be 1 percent higher than the Davis Travel Demand Model and 23 percent lower than ITE.
On a daily basis, the refined Lincoln40 Project vehicle trip generation was estimated to be 15
percent higher than the Davis Travel Demand Model and 3 percent higher than ITE.
The resulting daily, AM peak hour (8 AM – 9 AM), and PM peak hour (5 PM – 6 PM) vehicle trips following
the final adjusted Lincoln40 vehicle trip rates are presented in Table 8.
Table 8:
Final Vehicle Trip Generation of Proposed Lincoln40 Apartments
Apartment Dwelling
Units
Vehicle Trips
Daily AM Peak Hour PM Peak Hour
Total Total In Out Total In Out
Lincoln40 Project 130 894 45 17 28 63 32 31
Source: Fehr & Peers, 2016
Davis Lincoln40 Apartments EIR – Project Travel Characteristics
October 25, 2016
Page 6 of 6
Travel Mode Split
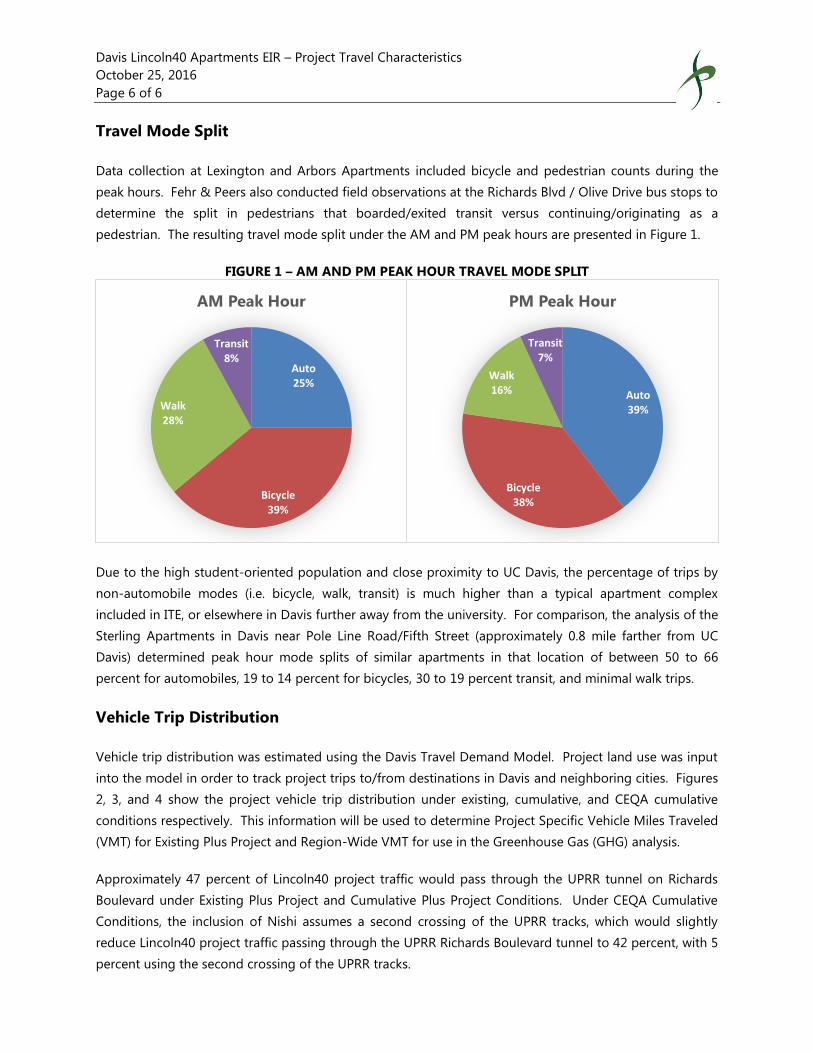
Data collection at Lexington and Arbors Apartments included bicycle and pedestrian counts during the
peak hours. Fehr & Peers also conducted field observations at the Richards Blvd / Olive Drive bus stops to
determine the split in pedestrians that boarded/exited transit versus continuing/originating as a
pedestrian. The resulting travel mode split under the AM and PM peak hours are presented in Figure 1.
FIGURE 1 – AM AND PM PEAK HOUR TRAVEL MODE SPLIT
Due to the high student-oriented population and close proximity to UC Davis, the percentage of trips by
non-automobile modes (i.e. bicycle, walk, transit) is much higher than a typical apartment complex
included in ITE, or elsewhere in Davis further away from the university. For comparison, the analysis of the
Sterling Apartments in Davis near Pole Line Road/Fifth Street (approximately 0.8 mile farther from UC
Davis) determined peak hour mode splits of similar apartments in that location of between 50 to 66
percent for automobiles, 19 to 14 percent for bicycles, 30 to 19 percent transit, and minimal walk trips.
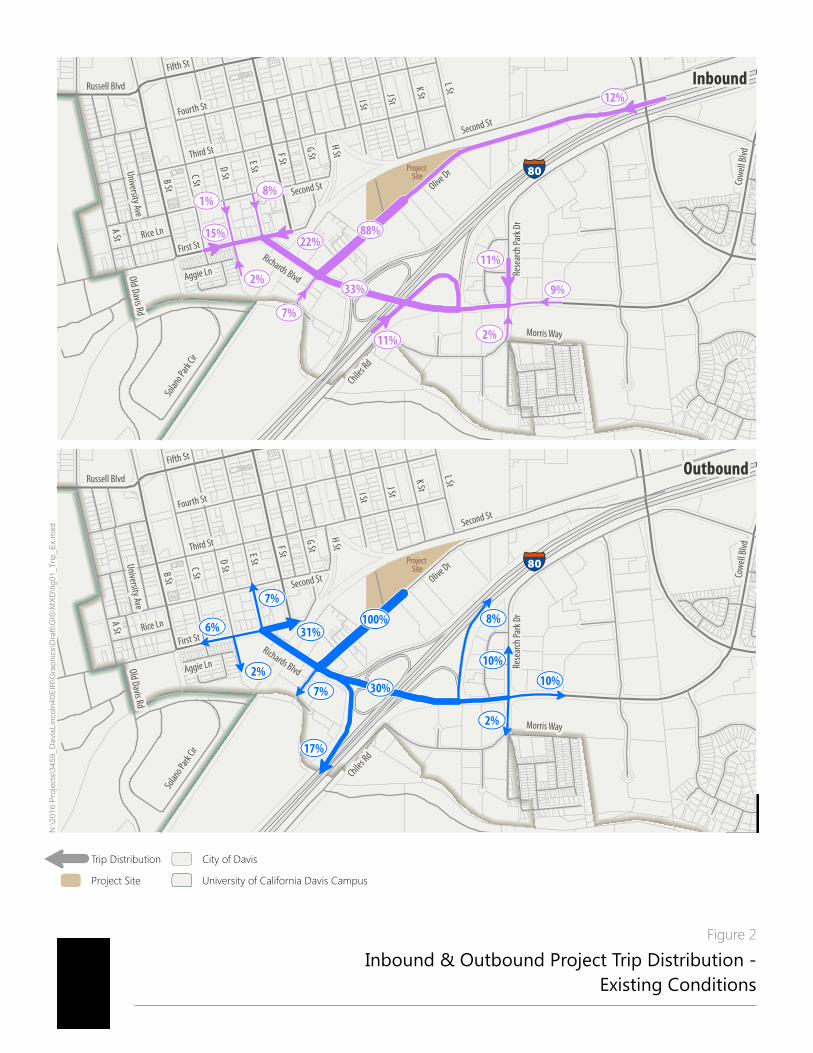
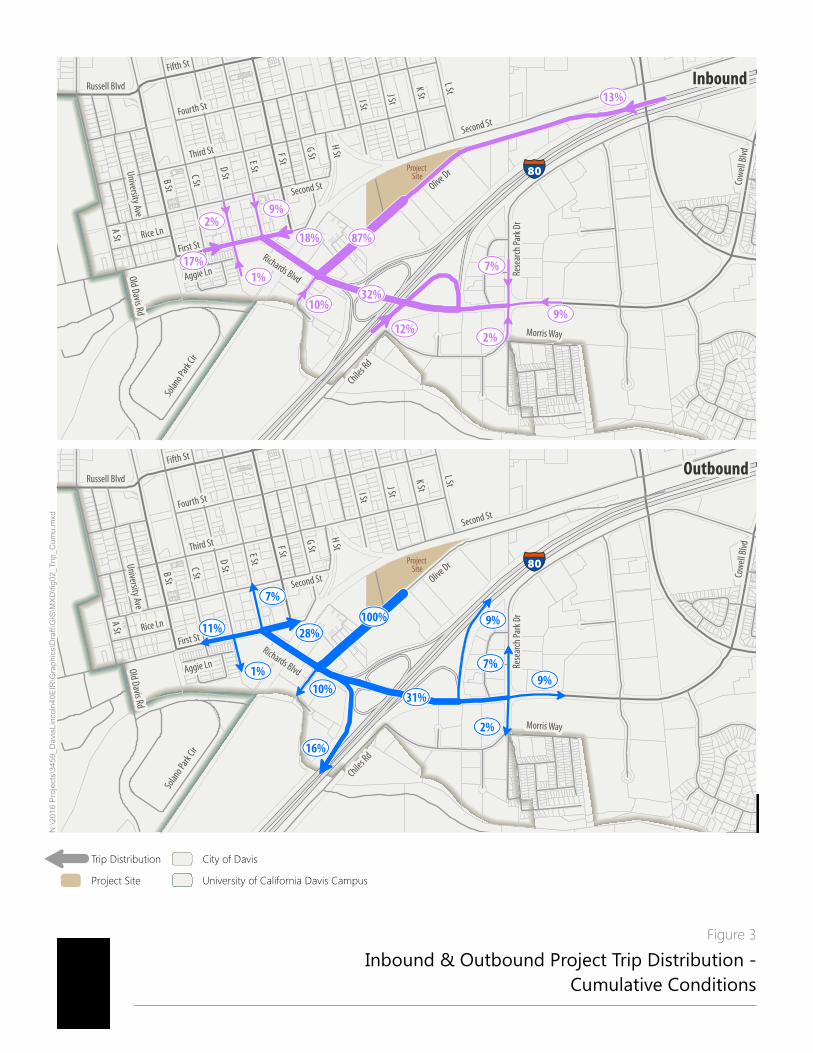
Vehicle Trip Distribution
Vehicle trip distribution was estimated using the Davis Travel Demand Model. Project land use was input
into the model in order to track project trips to/from destinations in Davis and neighboring cities. Figures
2, 3, and 4 show the project vehicle trip distribution under existing, cumulative, and CEQA cumulative
conditions respectively. This information will be used to determine Project Specific Vehicle Miles Traveled
(VMT) for Existing Plus Project and Region-Wide VMT for use in the Greenhouse Gas (GHG) analysis.
Approximately 47 percent of Lincoln40 project traffic would pass through the UPRR tunnel on Richards
Boulevard under Existing Plus Project and Cumulative Plus Project Conditions. Under CEQA Cumulative
Conditions, the inclusion of Nishi assumes a second crossing of the UPRR tracks, which would slightly
reduce Lincoln40 project traffic passing through the UPRR Richards Boulevard tunnel to 42 percent, with 5
percent using the second crossing of the UPRR tracks.
Auto25%
Bicycle39%
Walk28%
Transit8%
AM Peak Hour
Auto39%
Bicycle38%
Walk16%
Transit7%
PM Peak Hour
C St
A St
Olive DrB St
E St
F StD St
Third St
G St
Second St
I St
First St
J St
Fourth St
Cow
ell B
lvd
Rese
arch
Par
k Dr
K St
L St
Richards Blvd
Fifth St
Chiles R
d
Old Davis Rd
H St
University Ave
Rice Ln
Solan
o Par
k Cir
Russell Blvd
Morris Way
Aggie Ln
§̈¦80
Second St
Inbound
Project Site
!
!
!
!
!
!
!
!
!
!
!
¾À12%
¾À11%
¾À88%
¾À33%
¾À8%
¾À2%
¾À2%
¾À22%
¾À11%
¾À15%
¾À7%
¾À1%
¾À9%
N:\20
16 Pr
ojects
\3459
_Dav
isLinc
oln40
EIR\G
raphic
s\Draf
t\GIS\
MXD\
fig01
_Trip
_Ex.m
xd
Inbound & Outbound Project Trip Distribution -Existing Conditions
!
Trip DistributionProject Site
City of DavisUniversity of California Davis Campus
Figure 2
C St
A St
Olive DrB St
E St
F StD St
Third St
G St
Second St
I St
First St
J St
Fourth St
Cow
ell B
lvd
Rese
arch
Par
k Dr
K St
L St
Richards Blvd
Fifth St
Chiles R
d
Old Davis Rd
H St
University Ave
Rice Ln
Solan
o Par
k Cir
Russell Blvd
Morris Way
Aggie Ln
§̈¦80
Second St
Outbound
Project Site
!
!
!
!
!
!
!
!
!
¾À7%
¾À100%!
¾À10%
¾À31%
¾À17%
¾À30%
¾À8%
¾À10%
¾À6%
¾À7%
¾À2%
¾À2%
C St
A St
Olive DrB St
E St
F StD St
Third St
G St
Second St
I St
First St
J St
Fourth St
Cow
ell B
lvd
Rese
arch
Par
k Dr
K St
L St
Richards Blvd
Fifth St
Chiles R
d
Old Davis Rd
H St
University Ave
Rice Ln
Solan
o Par
k Cir
Russell Blvd
Morris Way
Aggie Ln
§̈¦80
Second St
Inbound
Project Site
!
!
!
!
!
!
!
!
¾À2%
¾À17%
¾À10%¾À9%
¾À7%!
!
¾À18%
!
¾À13%
¾À12%
¾À87%
¾À32%
¾À9%
¾À2%
¾À1%
N:\20
16 Pr
ojects
\3459
_Dav
isLinc
oln40
EIR\G
raphic
s\Draf
t\GIS\
MXD\
fig02
_Trip
_Cum
u.mxd
Inbound & Outbound Project Trip Distribution -Cumulative Conditions
!
Trip DistributionProject Site
City of DavisUniversity of California Davis Campus
Figure 3
C St
A St
Olive DrB St
E St
F StD St
Third St
G St
Second St
I St
First St
J St
Fourth St
Cow
ell B
lvd
Rese
arch
Par
k Dr
K St
L St
Richards Blvd
Fifth St
Chiles R
d
Old Davis Rd
H St
University Ave
Rice Ln
Solan
o Par
k Cir
Russell Blvd
Morris Way
Aggie Ln
§̈¦80
Second St
Outbound
Project Site
!
!
!
!
!
!
!
!
!
!
¾À16%
¾À31%
¾À100% ¾À9%
¾À9%
¾À7%
¾À1% ¾À7%
¾À2%
¾À10%
¾À28%¾À11%

C St
A St
Olive DrB St
E St
F StD St
Third St
G St
Second St
I St
First St
J St
Fourth St
Cow
ell B
lvd
Rese
arch
Par
k Dr
K St
L St
Richards Blvd
Fifth St
Chiles R
d
Old Davis Rd
H St
University Ave
Rice Ln
Solan
o Par
k Cir
Russell Blvd
Morris Way
Aggie Ln
§̈¦80
Second St
Inbound
Project Site
!
!
!
!
!
!
!
!
!
!
!
¾À7%
¾À13%
¾À12%
¾À87%
¾À32%
¾À9%
¾À20%
¾À2%
¾À1%
¾À9%
¾À2%
¾À15%
¾À12%
¾À18%
N:\20
16 Pr
ojects
\3459
_Dav
isLinc
oln40
EIR\G
raphic
s\Draf
t\GIS\
MXD\
fig03
_Trip
_CEQ
A.mxd
Inbound & Outbound Project Trip Distribution -CEQA Cumulative Conditions
!
Trip DistributionProject Site
City of DavisUniversity of California Davis Campus
Figure 4
C St
A St
Olive DrB St
E St
F StD St
Third St
G St
Second St
I St
First St
J St
Fourth St
Cow
ell B
lvd
Rese
arch
Par
k Dr
K St
L St
Richards Blvd
Fifth St
Chiles R
d
Old Davis Rd
H St
University Ave
Rice Ln
Solan
o Par
k Cir
Russell Blvd
Morris Way
Aggie Ln
§̈¦80
Second St
Outbound
Project Site
!
!
!
!
!
!
!
!
!
!
¾À16%
¾À100%
¾À31%
¾À9%
¾À9%
¾À7%
¾À1% ¾À7%
¾À2%
¾À15%
¾À6%¾À28%

Project Richards-Olive CorridorMajor Street 3rd St Scenario Cumulative - L St ExtensionMinor Street K St Peak Hour AM
Turn Movement Volumes Major Street DirectionNB SB EB WB
Left 159 26 20 228 North/SouthThrough 2 2 94 510 x East/WestRight 240 17 125 12Total 401 45 239 750
Major Street Minor StreetWarrant Met
3rd St K St
2 2YES
Number of Approach Lanes
* Note: Traffic Volume for Major Street is Total Volume of Both Approches. Traffic Volume for Minor Street is the Volume of High Volume Approach.
Traffic Volume (VPH) * 989 401
0
100
200
300
400
500
600
400 500 600 700 800 900 1000 1100 1200 1300 1400 1500 1600 1700 1800
Min
or
Str
eet
Hig
her
Vo
lum
e A
pp
roac
h -
VP
H
Major Street - Total of Both Approaches - Vehicle Per Hour (VPH)
Warrant 3B, Peak Hour
* Note: 150 vph applies as the lower threshold volume for a minor-streetapproach with two or more lanes and 100 vph applies as the lower
threshold volume for a minor-street approach with one lane.
Source: California Manual on Uniform Traffic Control Devices, Caltrans, 2014
150*
100*
2 or More Lanes & 2 or More Lanes
1 Lane & 1 Lane
2 or More Lanes & 1 Lane

Project Richards-Olive CorridorMajor Street 3rd St Scenario Cumulative - L St ExtensionMinor Street K St Peak Hour PM
Turn Movement Volumes Major Street DirectionNB SB EB WB
Left 234 57 13 430 North/SouthThrough 4 4 169 351 x East/WestRight 243 12 268 51Total 481 73 450 832
2 2YES
Number of Approach Lanes
* Note: Traffic Volume for Major Street is Total Volume of Both Approches. Traffic Volume for Minor Street is the Volume of High Volume Approach.
Traffic Volume (VPH) * 1,282 481
Major Street Minor StreetWarrant Met
3rd St K St
0
100
200
300
400
500
600
400 500 600 700 800 900 1000 1100 1200 1300 1400 1500 1600 1700 1800
Min
or
Str
eet
Hig
her
Vo
lum
e A
pp
roac
h -
VP
H
Major Street - Total of Both Approaches - Vehicle Per Hour (VPH)
Warrant 3B, Peak Hour
* Note: 150 vph applies as the lower threshold volume for a minor-streetapproach with two or more lanes and 100 vph applies as the lower
threshold volume for a minor-street approach with one lane.
Source: California Manual on Uniform Traffic Control Devices, Caltrans, 2014
150*
100*
2 or More Lanes & 2 or More Lanes
1 Lane & 1 Lane
2 or More Lanes & 1 Lane
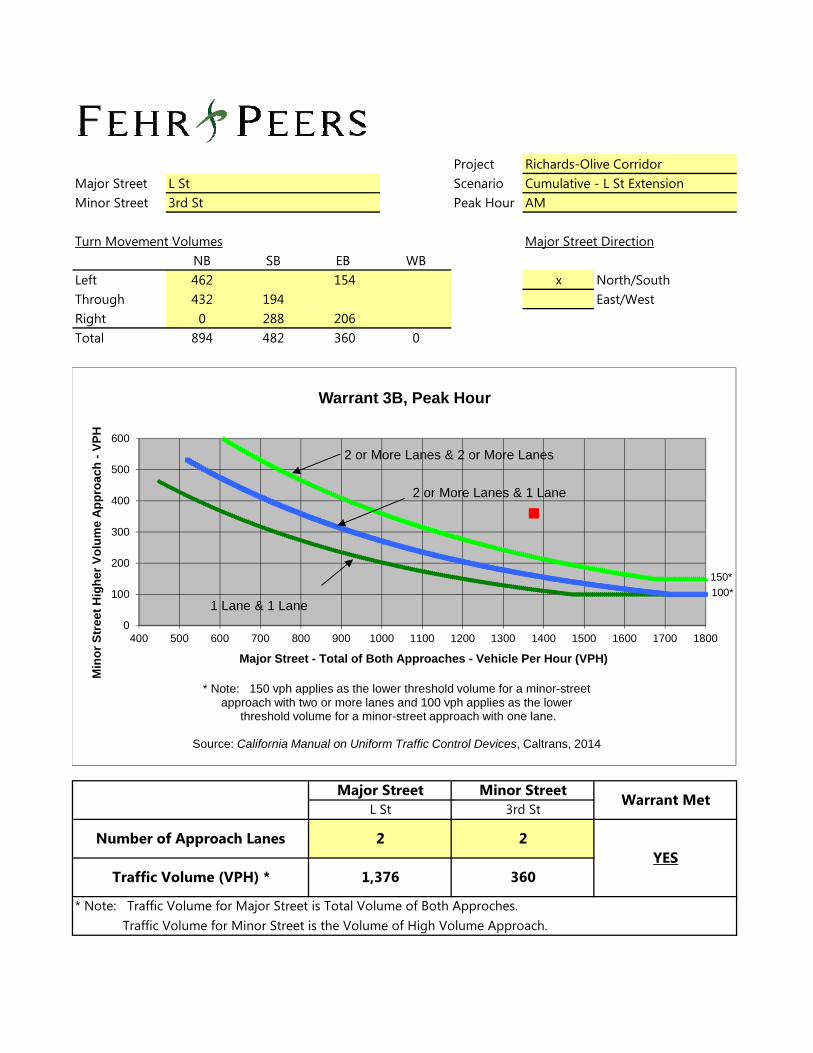
Project Richards-Olive CorridorMajor Street L St Scenario Cumulative - L St ExtensionMinor Street 3rd St Peak Hour AM
Turn Movement Volumes Major Street DirectionNB SB EB WB
Left 462 154 x North/SouthThrough 432 194 East/WestRight 0 288 206Total 894 482 360 0
Major Street Minor StreetWarrant Met
L St 3rd St
2 2YES
Number of Approach Lanes
* Note: Traffic Volume for Major Street is Total Volume of Both Approches. Traffic Volume for Minor Street is the Volume of High Volume Approach.
Traffic Volume (VPH) * 1,376 360
0
100
200
300
400
500
600
400 500 600 700 800 900 1000 1100 1200 1300 1400 1500 1600 1700 1800
Min
or
Str
eet
Hig
her
Vo
lum
e A
pp
roac
h -
VP
H
Major Street - Total of Both Approaches - Vehicle Per Hour (VPH)
Warrant 3B, Peak Hour
* Note: 150 vph applies as the lower threshold volume for a minor-streetapproach with two or more lanes and 100 vph applies as the lower
threshold volume for a minor-street approach with one lane.
Source: California Manual on Uniform Traffic Control Devices, Caltrans, 2014
150*
100*
2 or More Lanes & 2 or More Lanes
1 Lane & 1 Lane
2 or More Lanes & 1 Lane

Project Richards-Olive CorridorMajor Street L St Scenario Cumulative - L St ExtensionMinor Street 3rd St Peak Hour PM
Turn Movement Volumes Major Street DirectionNB SB EB WB
Left 368 212 x North/SouthThrough 498 203 East/WestRight 464 257Total 866 667 469 0
Major Street Minor StreetWarrant Met
L St 3rd St
2 2YES
Number of Approach Lanes
* Note: Traffic Volume for Major Street is Total Volume of Both Approches. Traffic Volume for Minor Street is the Volume of High Volume Approach.
Traffic Volume (VPH) * 1,533 469
0
100
200
300
400
500
600
400 500 600 700 800 900 1000 1100 1200 1300 1400 1500 1600 1700 1800
Min
or
Str
eet
Hig
her
Vo
lum
e A
pp
roac
h -
VP
H
Major Street - Total of Both Approaches - Vehicle Per Hour (VPH)
Warrant 3B, Peak Hour
* Note: 150 vph applies as the lower threshold volume for a minor-streetapproach with two or more lanes and 100 vph applies as the lower
threshold volume for a minor-street approach with one lane.
Source: California Manual on Uniform Traffic Control Devices, Caltrans, 2014
150*
100*
2 or More Lanes & 2 or More Lanes
1 Lane & 1 Lane
2 or More Lanes & 1 Lane
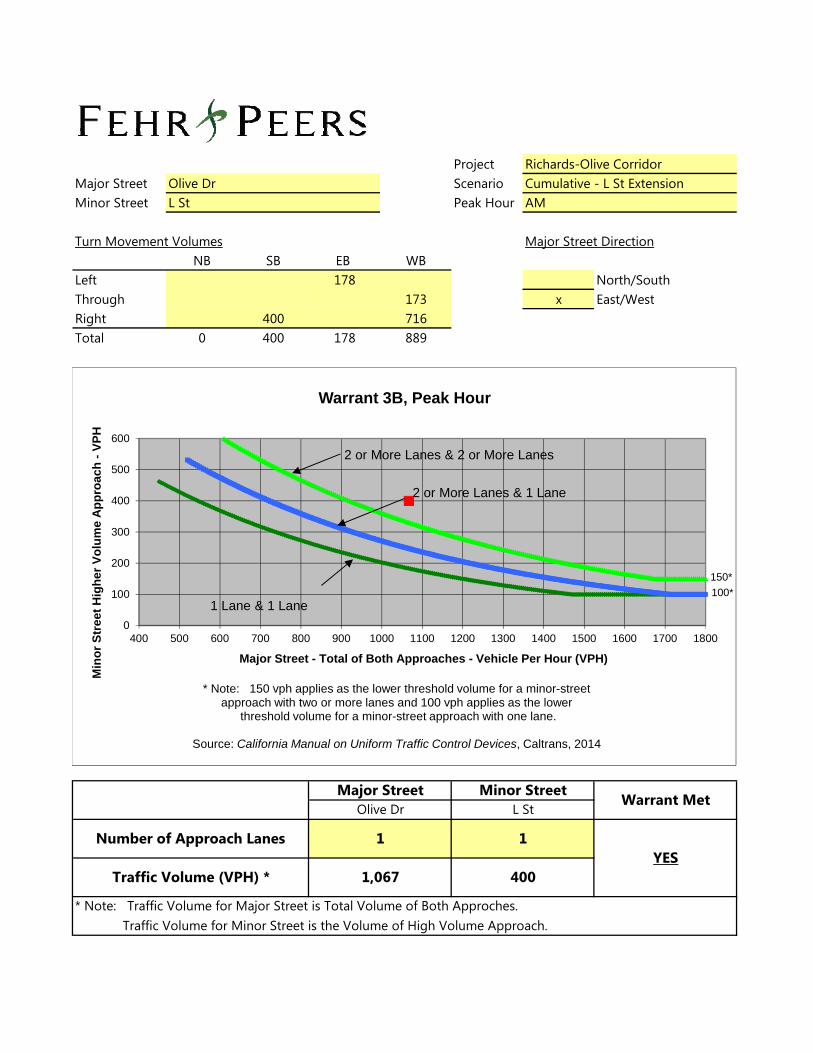
Project Richards-Olive CorridorMajor Street Olive Dr Scenario Cumulative - L St ExtensionMinor Street L St Peak Hour AM
Turn Movement Volumes Major Street DirectionNB SB EB WB
Left 178 North/SouthThrough 173 x East/WestRight 400 716Total 0 400 178 889
Major Street Minor StreetWarrant Met
Olive Dr L St
1 1YES
Number of Approach Lanes
* Note: Traffic Volume for Major Street is Total Volume of Both Approches. Traffic Volume for Minor Street is the Volume of High Volume Approach.
Traffic Volume (VPH) * 1,067 400
0
100
200
300
400
500
600
400 500 600 700 800 900 1000 1100 1200 1300 1400 1500 1600 1700 1800
Min
or
Str
eet
Hig
her
Vo
lum
e A
pp
roac
h -
VP
H
Major Street - Total of Both Approaches - Vehicle Per Hour (VPH)
Warrant 3B, Peak Hour
* Note: 150 vph applies as the lower threshold volume for a minor-streetapproach with two or more lanes and 100 vph applies as the lower
threshold volume for a minor-street approach with one lane.
Source: California Manual on Uniform Traffic Control Devices, Caltrans, 2014
150*
100*
2 or More Lanes & 2 or More Lanes
1 Lane & 1 Lane
2 or More Lanes & 1 Lane

Project Richards-Olive CorridorMajor Street Olive Dr Scenario Cumulative - L St ExtensionMinor Street L St Peak Hour PM
Turn Movement Volumes Major Street DirectionNB SB EB WB
Left 374 North/SouthThrough 158 x East/WestRight 460 492Total 0 460 374 650
Major Street Minor StreetWarrant Met
Olive Dr L St
1 1YES
Number of Approach Lanes
* Note: Traffic Volume for Major Street is Total Volume of Both Approches. Traffic Volume for Minor Street is the Volume of High Volume Approach.
Traffic Volume (VPH) * 1,024 460
0
100
200
300
400
500
600
400 500 600 700 800 900 1000 1100 1200 1300 1400 1500 1600 1700 1800
Min
or
Str
eet
Hig
her
Vo
lum
e A
pp
roac
h -
VP
H
Major Street - Total of Both Approaches - Vehicle Per Hour (VPH)
Warrant 3B, Peak Hour
* Note: 150 vph applies as the lower threshold volume for a minor-streetapproach with two or more lanes and 100 vph applies as the lower
threshold volume for a minor-street approach with one lane.
Source: California Manual on Uniform Traffic Control Devices, Caltrans, 2014
150*
100*
2 or More Lanes & 2 or More Lanes
1 Lane & 1 Lane
2 or More Lanes & 1 Lane

Fehr & Peers 11/18/2016
Vissim Post-Processor Richards Blvd - Olive Dr CirculationAverage Results from 10 Runs Existing ConditionsVolume and Delay by Movement AM Peak Hour
Intersection 1 K St/Third St Side-street Stop
Demand Total Delay (sec/veh)Direction Movement Volume (vph) Average Percent Average Std. Dev. LOS
Left Turn 3 2 76.7% 4.0 3.5 AThrough 1 1 60.0% 1.4 2.9 ARight Turn 2 2 105.0% 1.6 2.6 A
Subtotal 6 5 83.3% 6.4 0.8 ALeft Turn 2 2 120.0% 4.2 3.9 AThrough 1 0 40.0% 1.3 2.7 ARight Turn 15 13 88.7% 6.6 1.0 A
Subtotal 18 16 89.4% 6.7 1.0 ALeft Turn 10 10 99.0% 0.9 1.0 AThrough 111 110 99.1% 0.5 0.1 ARight Turn 4 4 92.5% 0.3 0.3 A
Subtotal 125 124 98.9% 0.5 0.2 ALeft Turn 2 2 100.0% 0.4 0.9 AThrough 170 160 94.1% 0.2 0.1 ARight Turn 2 2 85.0% 0.3 0.3 A
Subtotal 174 164 94.0% 0.2 0.1 ATotal 323 308 95.4% 0.8 0.1 A
5.9Intersection 2 L St/Third St Side-street Stop
Demand Total Delay (sec/veh)Direction Movement Volume (vph) Average Percent Average Std. Dev. LOS
Left Turn 92 89 96.5% 1.6 0.5 AThrough 159 152 95.6% 0.5 0.4 ARight Turn
Subtotal 251 241 95.9% 0.9 0.4 ALeft TurnThrough 186 171 91.9% 0.1 0.0 ARight Turn 82 75 91.0% 0.9 0.4 A
Subtotal 268 246 91.6% 0.4 0.1 ALeft Turn 52 53 102.3% 8.1 1.0 AThroughRight Turn 63 62 97.9% 6.9 0.8 A
Subtotal 115 115 99.9% 7.5 0.9 ALeft TurnThroughRight Turn
SubtotalTotal 634 601 94.8% 2.0 0.3 A
8.0
NB
SB
EB
WB
Served Volume (vph)
NB
SB
EB
WB
Served Volume (vph)

Fehr & Peers 11/18/2016
Vissim Post-Processor Richards Blvd - Olive Dr CirculationAverage Results from 10 Runs Existing ConditionsVolume and Delay by Movement AM Peak Hour
Intersection 3 Arbor Apts Dwy (East)/Olive Dr Side-street Stop
Demand Total Delay (sec/veh)Direction Movement Volume (vph) Average Percent Average Std. Dev. LOS
Left Turn 11 12 109.1% 7.6 1.0 AThroughRight Turn
Subtotal 11 12 109.1% 7.6 1.0 ALeft TurnThroughRight Turn
SubtotalLeft TurnThrough 13 16 123.1% 0.3 0.4 ARight Turn 6 5 88.3% 0.8 0.8 A
Subtotal 19 21 112.1% 0.5 0.4 ALeft Turn 2 2 95.0% 0.1 0.2 AThrough 154 150 97.3% 0.5 0.1 ARight Turn
Subtotal 156 152 97.2% 0.5 0.1 ATotal 186 185 99.5% 0.9 0.1 A
7.0
Served Volume (vph)
NB
SB
EB
WB

Vissim Post-Processor Richards Blvd - Olive Dr Circulation
Average Results from 10 Runs Existing Conditions
Volume and Delay by Movement AM Peak Hour
Intersection 4 D St/First St Signal
Demand Total Delay (sec/veh)
Direction Movement Volume (vph) Average Percent Average Std. Dev. LOS
Left Turn 12 11 87.5% 40.1 35.1 D
Through 15 13 89.3% 44.9 16.9 D
Right Turn 28 30 107.1% 6.7 1.0 A
Subtotal 55 54 98.0% 26.9 7.3 C
Left Turn 24 22 93.3% 51.2 11.1 D
Through 20 21 102.5% 42.3 19.3 D
Right Turn 15 15 100.0% 6.8 4.4 A
Subtotal 59 58 98.1% 38.0 9.2 D
Left Turn 3 2 76.7% 34.2 41.5 C
Through 262 267 101.9% 15.1 8.8 B
Right Turn 31 31 98.7% 24.8 23.6 C
Subtotal 296 300 101.3% 16.4 9.3 B
Left Turn 31 32 104.5% 69.7 9.1 E
Through 437 436 99.7% 6.5 3.2 A
Right Turn 50 50 99.0% 4.7 3.1 A
Subtotal 518 518 100.0% 11.2 3.1 B
Total 928 930 100.2% 15.5 4.8 B
73.3
Intersection 5 E St-Richards Blvd/First St Signal
Demand Total Delay (sec/veh)
Direction Movement Volume (vph) Average Percent Average Std. Dev. LOS
Left Turn 491 489 99.6% 28.7 9.6 C
Through 86 90 104.1% 27.8 6.5 C
Right Turn 229 219 95.4% 11.8 5.4 B
Subtotal 806 797 98.9% 24.2 8.4 C
Left Turn 1 1 60.0% 3.8 8.3 A
Through 85 85 99.4% 48.7 8.4 D
Right Turn 10 10 98.0% 9.4 9.0 A
Subtotal 96 95 98.9% 44.7 7.8 D
Left Turn 9 9 95.6% 77.2 44.7 E
Through 23 23 100.0% 80.3 30.3 F
Right Turn 282 287 101.9% 10.7 3.0 B
Subtotal 314 319 101.6% 18.2 5.9 B
Left Turn 130 130 100.3% 64.0 8.6 E
Through 17 18 107.1% 45.4 16.1 D
Right Turn 3 2 76.7% 3.4 6.1 A
Subtotal 150 151 100.6% 61.3 7.6 E
Total 1,366 1,362 99.7% 28.1 6.5 C
72.8
Served Volume (vph)
NB
SB
WB
EB
WB
Served Volume (vph)
NB
SB
EB
Fehr & Peers 11/22/2016

Vissim Post-Processor Richards Blvd - Olive Dr Circulation
Average Results from 10 Runs Existing Conditions
Volume and Delay by Movement AM Peak Hour
Intersection 6 Richards Blvd/Olive Dr Signal
Demand Total Delay (sec/veh)
Direction Movement Volume (vph) Average Percent Average Std. Dev. LOS
Left Turn 80 80 99.5% 100.4 14.1 F
Through 612 615 100.5% 29.4 9.7 C
Right Turn 31 32 101.9% 17.4 15.2 B
Subtotal 723 726 100.5% 37.7 8.5 D
Left Turn 31 33 106.1% 38.1 7.1 D
Through 440 448 101.8% 10.4 3.2 B
Right Turn 26 23 89.2% 10.2 9.2 B
Subtotal 497 504 101.4% 12.5 3.1 B
Left Turn 37 36 97.3% 53.9 9.6 D
Through 7 7 100.0% 43.1 35.0 D
Right Turn 58 60 102.8% 25.2 12.6 C
Subtotal 102 103 100.6% 36.8 11.3 D
Left Turn 106 100 94.6% 53.1 10.4 D
Through 18 17 95.0% 59.0 26.9 E
Right Turn 157 146 92.7% 52.7 21.8 D
Subtotal 281 263 93.6% 53.4 13.6 D
Total 1,603 1,596 99.6% 32.7 3.3 C
85.8
Intersection 7 Richards Blvd/I-80 WB Ramps Uncontrolled
Demand Total Delay (sec/veh)
Direction Movement Volume (vph) Average Percent Average Std. Dev. LOS
Left Turn
Through 400 406 101.5% 13.6 15.3 B
Right Turn 359 354 98.5% 1.6 0.4 A
Subtotal 759 760 100.1% 8.2 8.6 A
Left Turn
Through 422 419 99.4% 0.6 0.1 A
Right Turn 195 200 102.6% 1.4 0.3 A
Subtotal 617 619 100.4% 0.9 0.2 A
Left Turn
Through
Right Turn 179 180 100.5% 0.8 0.1 A
Subtotal 179 180 100.5% 0.8 0.1 A
Left Turn
Through
Right Turn 389 389 100.0% 5.7 7.1 A
Subtotal 389 389 100.0% 5.7 7.1 A
Total 1,944 1,948 100.2% 4.7 4.6 A
5.5
Served Volume (vph)
NB
SB
EB
WB
Served Volume (vph)
NB
SB
EB
WB
Fehr & Peers 11/22/2016

Vissim Post-Processor Richards Blvd - Olive Dr Circulation
Average Results from 10 Runs Existing Conditions
Volume and Delay by Movement AM Peak Hour
Intersection 8 Richards Blvd/I-80 EB Ramps Signal
Demand Total Delay (sec/veh)
Direction Movement Volume (vph) Average Percent Average Std. Dev. LOS
Left Turn
Through 575 579 100.6% 25.0 2.2 C
Right Turn 93 90 96.2% 13.5 1.8 B
Subtotal 668 668 100.0% 23.4 1.8 C
Left Turn 241 237 98.3% 51.1 3.6 D
Through 360 364 101.1% 12.2 3.0 B
Right Turn
Subtotal 601 601 100.0% 28.0 2.4 C
Left Turn
Through
Right Turn
Subtotal
Left Turn 429 430 100.2% 55.2 17.7 E
Through
Right Turn 184 180 97.9% 23.2 14.7 C
Subtotal 613 610 99.5% 45.5 16.6 D
Total 1,882 1,879 99.8% 32.4 7.1 C
53.4
Intersection 9 Research Park Dr/Richards Blvd Signal
Demand Total Delay (sec/veh)
Direction Movement Volume (vph) Average Percent Average Std. Dev. LOS
Left Turn 64 63 98.8% 51.4 9.1 D
Through 6 5 88.3% 38.3 34.3 D
Right Turn 30 30 101.0% 8.1 4.6 A
Subtotal 100 99 98.8% 37.3 7.7 D
Left Turn 22 24 110.5% 53.8 13.6 D
Through 19 20 102.6% 40.6 14.0 D
Right Turn 82 78 94.9% 17.0 9.7 B
Subtotal 123 122 98.9% 28.4 9.6 C
Left Turn 187 187 99.9% 46.8 7.0 D
Through 469 472 100.6% 25.3 5.4 C
Right Turn 133 136 102.4% 22.6 5.9 C
Subtotal 789 795 100.8% 30.1 6.0 C
Left Turn 30 31 101.7% 59.7 16.7 E
Through 487 487 99.9% 23.1 4.3 C
Right Turn 20 18 90.0% 8.9 8.1 A
Subtotal 537 535 99.6% 24.9 4.8 C
Total 1,549 1,551 100.1% 28.6 4.8 C
55.1
NB
SB
EB
WB
Served Volume (vph)
NB
Served Volume (vph)
SB
EB
WB
Fehr & Peers 11/22/2016

Fehr & Peers 11/18/2016
Vissim Post-Processor Richards Blvd - Olive Dr CirculationAverage Results from 10 Runs Existing ConditionsVolume and Delay by Movement Midday Peak Hour
Intersection 1 K St/Third St Side-street Stop
Demand Total Delay (sec/veh)Direction Movement Volume (vph) Average Percent Average Std. Dev. LOS
Left Turn 4 4 92.5% 5.0 3.6 AThrough 2 2 80.0% 4.9 5.3 ARight Turn 3 3 86.7% 2.8 3.0 A
Subtotal 9 8 87.8% 7.4 1.2 ALeft Turn 4 4 90.0% 5.1 3.8 AThrough 2 2 80.0% 4.4 5.0 ARight Turn 10 11 109.0% 6.3 0.7 A
Subtotal 16 16 100.6% 6.7 0.8 ALeft Turn 5 4 80.0% 0.5 0.7 AThrough 208 209 100.6% 1.0 0.3 ARight Turn 2 2 105.0% 0.3 0.3 A
Subtotal 215 215 100.2% 1.0 0.3 ALeft Turn 4 5 122.5% 1.6 2.3 AThrough 142 141 99.5% 0.2 0.1 ARight Turn 4 4 102.5% 0.3 0.3 A
Subtotal 150 150 100.2% 0.3 0.2 ATotal 390 390 99.9% 1.1 0.2 A
6.0Intersection 2 L St/Third St Side-street Stop
Demand Total Delay (sec/veh)Direction Movement Volume (vph) Average Percent Average Std. Dev. LOS
Left Turn 93 92 99.2% 1.1 0.4 AThrough 147 148 101.0% 0.3 0.2 ARight Turn
Subtotal 240 241 100.3% 0.6 0.3 ALeft TurnThrough 184 183 99.5% 0.2 0.1 ARight Turn 57 57 100.5% 0.7 0.1 A
Subtotal 241 240 99.8% 0.3 0.1 ALeft Turn 99 100 101.0% 10.2 1.4 BThroughRight Turn 116 115 99.5% 9.0 1.3 A
Subtotal 215 215 100.2% 9.6 1.0 ALeft TurnThroughRight Turn
SubtotalTotal 696 697 100.1% 3.3 0.3 A
10.0
Served Volume (vph)
NB
SB
EB
WB
Served Volume (vph)
NB
SB
EB
WB
Fehr & Peers 11/18/2016
Vissim Post-Processor Richards Blvd - Olive Dr CirculationAverage Results from 10 Runs Existing ConditionsVolume and Delay by Movement Midday Peak Hour
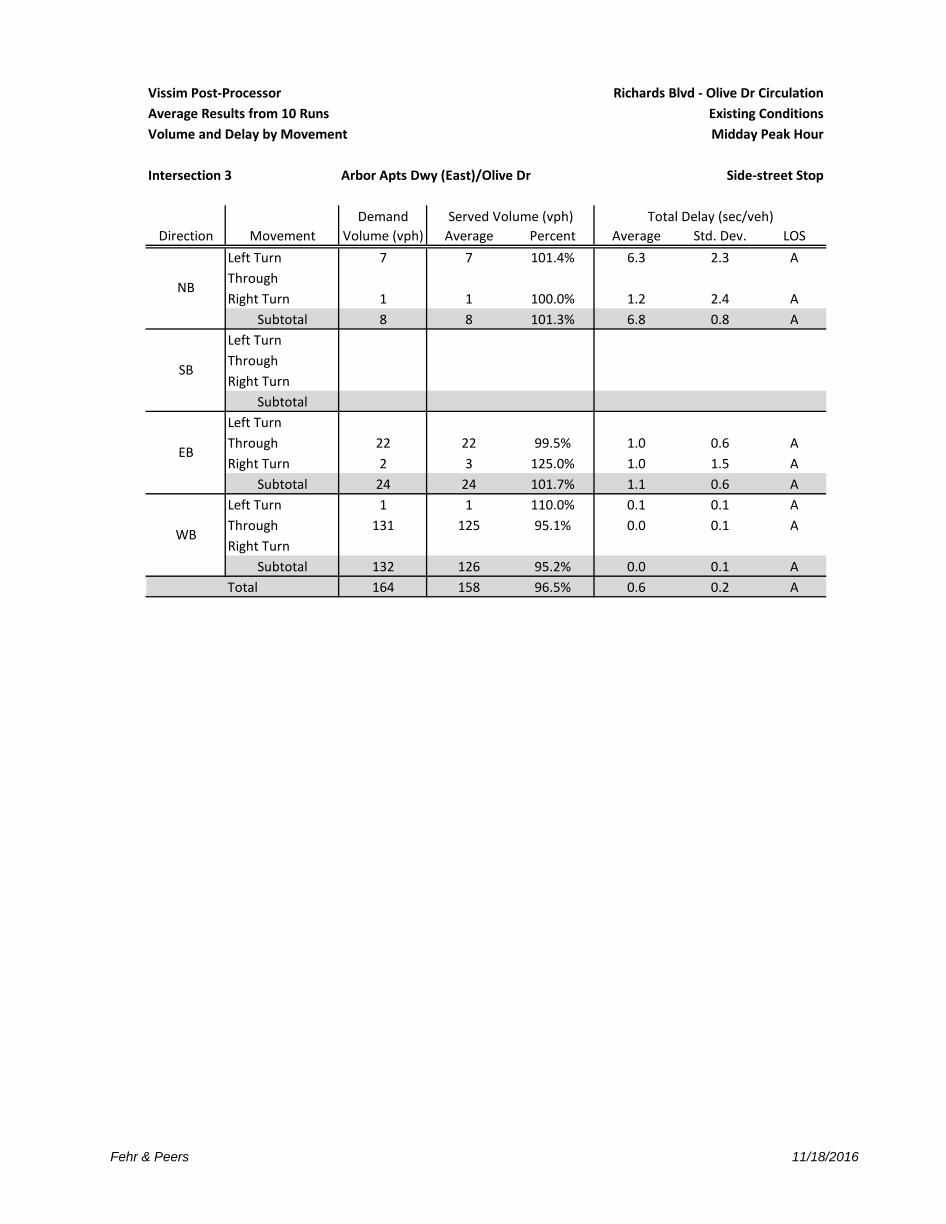
Intersection 3 Arbor Apts Dwy (East)/Olive Dr Side-street Stop
Demand Total Delay (sec/veh)Direction Movement Volume (vph) Average Percent Average Std. Dev. LOS
Left Turn 7 7 101.4% 6.3 2.3 AThroughRight Turn 1 1 100.0% 1.2 2.4 A
Subtotal 8 8 101.3% 6.8 0.8 ALeft TurnThroughRight Turn
SubtotalLeft TurnThrough 22 22 99.5% 1.0 0.6 ARight Turn 2 3 125.0% 1.0 1.5 A
Subtotal 24 24 101.7% 1.1 0.6 ALeft Turn 1 1 110.0% 0.1 0.1 AThrough 131 125 95.1% 0.0 0.1 ARight Turn
Subtotal 132 126 95.2% 0.0 0.1 ATotal 164 158 96.5% 0.6 0.2 A
6.7
SB
EB
WB
Served Volume (vph)
NB
Fehr & Peers 11/18/2016
Vissim Post-Processor Richards Blvd - Olive Dr CirculationAverage Results from 10 Runs Existing ConditionsVolume and Delay by Movement Midday Peak Hour
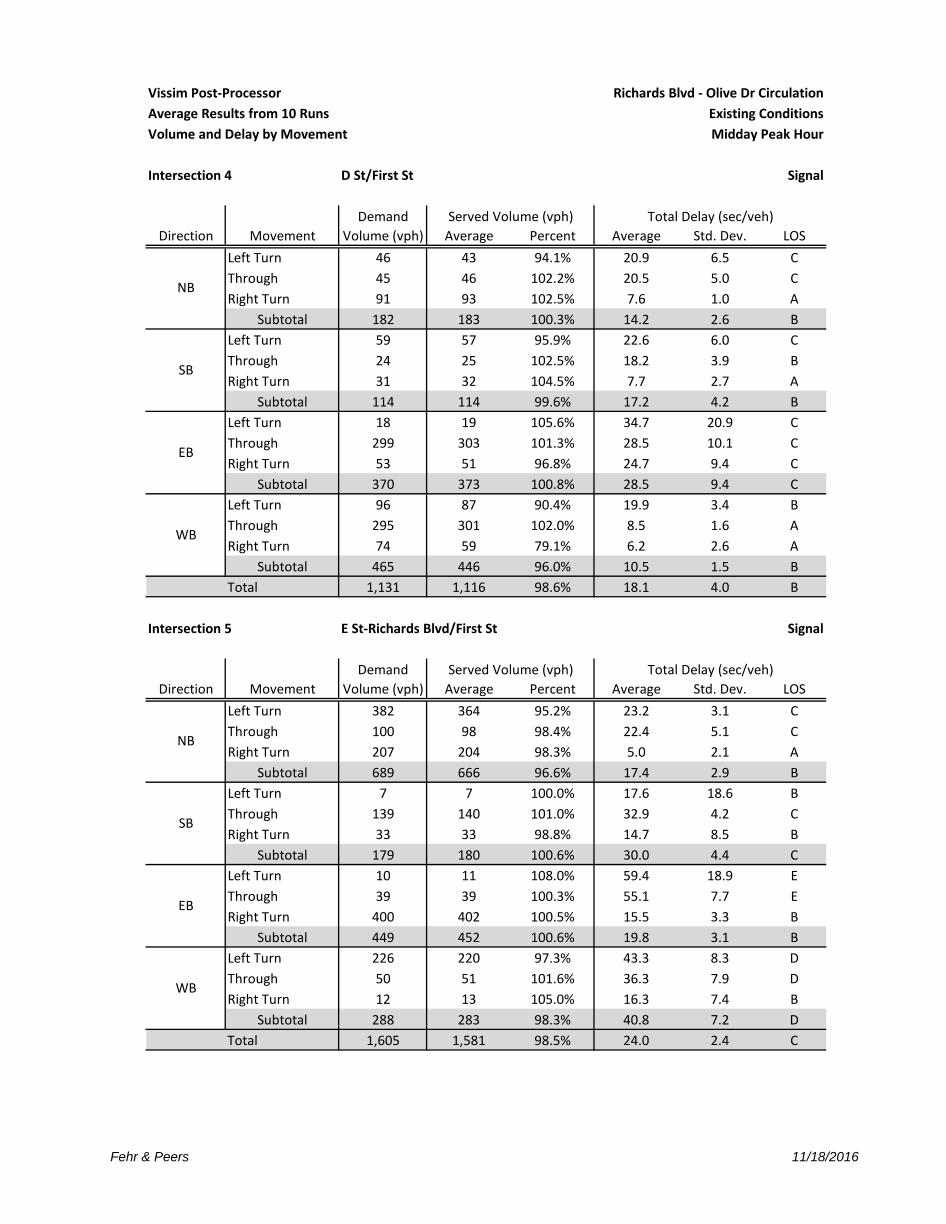
Intersection 4 D St/First St Signal
Demand Total Delay (sec/veh)Direction Movement Volume (vph) Average Percent Average Std. Dev. LOS
Left Turn 46 43 94.1% 20.9 6.5 CThrough 45 46 102.2% 20.5 5.0 CRight Turn 91 93 102.5% 7.6 1.0 A
Subtotal 182 183 100.3% 14.2 2.6 BLeft Turn 59 57 95.9% 22.6 6.0 CThrough 24 25 102.5% 18.2 3.9 BRight Turn 31 32 104.5% 7.7 2.7 A
Subtotal 114 114 99.6% 17.2 4.2 BLeft Turn 18 19 105.6% 34.7 20.9 CThrough 299 303 101.3% 28.5 10.1 CRight Turn 53 51 96.8% 24.7 9.4 C
Subtotal 370 373 100.8% 28.5 9.4 CLeft Turn 96 87 90.4% 19.9 3.4 BThrough 295 301 102.0% 8.5 1.6 ARight Turn 74 59 79.1% 6.2 2.6 A
Subtotal 465 446 96.0% 10.5 1.5 BTotal 1,131 1,116 98.6% 18.1 4.0 B
30.4Intersection 5 E St-Richards Blvd/First St Signal
Demand Total Delay (sec/veh)Direction Movement Volume (vph) Average Percent Average Std. Dev. LOS
Left Turn 382 364 95.2% 23.2 3.1 CThrough 100 98 98.4% 22.4 5.1 CRight Turn 207 204 98.3% 5.0 2.1 A
Subtotal 689 666 96.6% 17.4 2.9 BLeft Turn 7 7 100.0% 17.6 18.6 BThrough 139 140 101.0% 32.9 4.2 CRight Turn 33 33 98.8% 14.7 8.5 B
Subtotal 179 180 100.6% 30.0 4.4 CLeft Turn 10 11 108.0% 59.4 18.9 EThrough 39 39 100.3% 55.1 7.7 ERight Turn 400 402 100.5% 15.5 3.3 B
Subtotal 449 452 100.6% 19.8 3.1 BLeft Turn 226 220 97.3% 43.3 8.3 DThrough 50 51 101.6% 36.3 7.9 DRight Turn 12 13 105.0% 16.3 7.4 B
Subtotal 288 283 98.3% 40.8 7.2 DTotal 1,605 1,581 98.5% 24.0 2.4 C
49.5
Served Volume (vph)
NB
SB
WB
EB
WB
Served Volume (vph)
NB
SB
EB

Fehr & Peers 11/18/2016
Vissim Post-Processor Richards Blvd - Olive Dr CirculationAverage Results from 10 Runs Existing ConditionsVolume and Delay by Movement Midday Peak Hour
Intersection 6 Richards Blvd/Olive Dr Signal
Demand Total Delay (sec/veh)Direction Movement Volume (vph) Average Percent Average Std. Dev. LOS
Left Turn 57 57 99.3% 37.0 5.0 DThrough 495 477 96.3% 17.4 2.5 BRight Turn 55 55 99.8% 3.2 1.7 A
Subtotal 607 588 96.9% 17.9 2.2 BLeft Turn 65 69 105.7% 25.0 6.4 CThrough 670 660 98.5% 14.2 2.1 BRight Turn 30 31 102.0% 10.8 4.2 B
Subtotal 765 759 99.3% 15.1 2.5 BLeft Turn 40 41 102.3% 24.7 7.8 CThrough 10 9 92.0% 23.0 11.8 CRight Turn 64 64 100.6% 15.1 5.1 B
Subtotal 114 115 100.4% 19.4 5.7 BLeft Turn 159 149 93.8% 37.7 19.7 DThrough 34 32 95.3% 32.1 9.9 CRight Turn 154 145 93.8% 22.1 5.8 C
Subtotal 347 326 94.0% 30.7 11.3 CTotal 1,833 1,788 97.6% 19.1 2.5 B
31.8Intersection 7 Richards Blvd/I-80 WB Ramps Uncontrolled
Demand Total Delay (sec/veh)Direction Movement Volume (vph) Average Percent Average Std. Dev. LOS
Left TurnThrough 444 427 96.1% 2.0 1.1 ARight Turn 284 283 99.6% 1.2 0.2 A
Subtotal 728 710 97.5% 1.7 0.7 ALeft TurnThrough 639 623 97.4% 0.8 0.3 ARight Turn 293 290 99.1% 1.3 0.3 A
Subtotal 932 913 97.9% 0.9 0.3 ALeft TurnThroughRight Turn 100 99 99.2% 0.8 0.1 A
Subtotal 100 99 99.2% 0.8 0.1 ALeft TurnThroughRight Turn 235 238 101.1% 0.7 0.1 A
Subtotal 235 238 101.1% 0.7 0.1 ATotal 1,995 1,959 98.2% 1.2 0.3 A
2.0
Served Volume (vph)
NB
SB
EB
WB
Served Volume (vph)
NB
SB
EB
WB

Fehr & Peers 11/18/2016
Vissim Post-Processor Richards Blvd - Olive Dr CirculationAverage Results from 10 Runs Existing ConditionsVolume and Delay by Movement Midday Peak Hour
Intersection 8 Richards Blvd/I-80 EB Ramps Signal
Demand Total Delay (sec/veh)Direction Movement Volume (vph) Average Percent Average Std. Dev. LOS
Left TurnThrough 547 524 95.8% 7.5 2.4 ARight Turn 130 101 77.6% 7.3 1.6 A
Subtotal 677 625 92.3% 7.5 2.1 ALeft Turn 293 290 98.9% 52.6 6.3 DThrough 446 435 97.5% 8.1 2.2 ARight Turn
Subtotal 739 725 98.0% 25.6 2.8 CLeft TurnThroughRight Turn
SubtotalLeft Turn 303 303 100.0% 45.4 6.7 DThroughRight Turn 181 184 101.5% 10.1 3.0 B
Subtotal 484 487 100.6% 32.6 4.9 CTotal 1,900 1,836 96.7% 21.5 2.5 C
52.6Intersection 9 Research Park Dr/Richards Blvd Signal
Demand Total Delay (sec/veh)Direction Movement Volume (vph) Average Percent Average Std. Dev. LOS
Left Turn 56 55 97.9% 59.8 8.3 EThrough 3 3 113.3% 37.4 45.5 DRight Turn 23 24 104.8% 9.9 6.2 A
Subtotal 82 82 100.4% 47.3 6.0 DLeft Turn 48 47 98.8% 46.7 10.8 DThrough 26 26 101.5% 55.0 13.1 DRight Turn 89 87 97.4% 19.3 8.6 B
Subtotal 163 161 98.5% 35.1 9.7 DLeft Turn 173 170 98.3% 57.4 9.9 EThrough 508 502 98.8% 12.0 4.2 BRight Turn 68 67 98.2% 9.1 5.2 A
Subtotal 749 739 98.7% 22.8 3.8 CLeft Turn 23 25 107.4% 59.0 12.5 EThrough 480 478 99.7% 15.7 3.7 BRight Turn 27 25 93.0% 5.3 5.4 A
Subtotal 530 528 99.7% 17.3 3.6 BTotal 1,524 1,510 99.1% 23.6 2.6 C
57.9
NB
SB
EB
WB
Served Volume (vph)
NB
Served Volume (vph)
SB
EB
WB
Fehr & Peers 11/18/2016
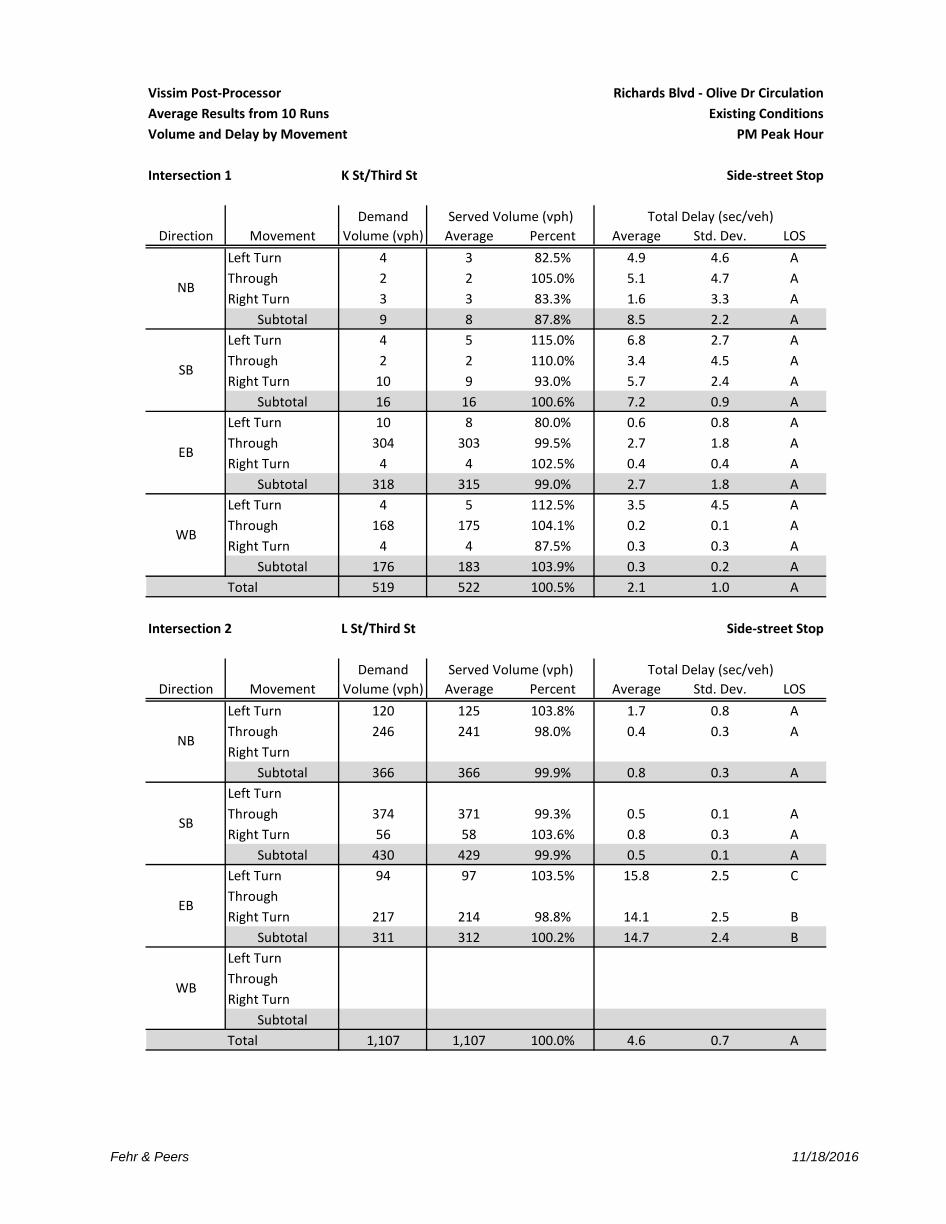
Vissim Post-Processor Richards Blvd - Olive Dr CirculationAverage Results from 10 Runs Existing ConditionsVolume and Delay by Movement PM Peak Hour
Intersection 1 K St/Third St Side-street Stop
Demand Total Delay (sec/veh)Direction Movement Volume (vph) Average Percent Average Std. Dev. LOS
Left Turn 4 3 82.5% 4.9 4.6 AThrough 2 2 105.0% 5.1 4.7 ARight Turn 3 3 83.3% 1.6 3.3 A
Subtotal 9 8 87.8% 8.5 2.2 ALeft Turn 4 5 115.0% 6.8 2.7 AThrough 2 2 110.0% 3.4 4.5 ARight Turn 10 9 93.0% 5.7 2.4 A
Subtotal 16 16 100.6% 7.2 0.9 ALeft Turn 10 8 80.0% 0.6 0.8 AThrough 304 303 99.5% 2.7 1.8 ARight Turn 4 4 102.5% 0.4 0.4 A
Subtotal 318 315 99.0% 2.7 1.8 ALeft Turn 4 5 112.5% 3.5 4.5 AThrough 168 175 104.1% 0.2 0.1 ARight Turn 4 4 87.5% 0.3 0.3 A
Subtotal 176 183 103.9% 0.3 0.2 ATotal 519 522 100.5% 2.1 1.0 A
6.8Intersection 2 L St/Third St Side-street Stop
Demand Total Delay (sec/veh)Direction Movement Volume (vph) Average Percent Average Std. Dev. LOS
Left Turn 120 125 103.8% 1.7 0.8 AThrough 246 241 98.0% 0.4 0.3 ARight Turn
Subtotal 366 366 99.9% 0.8 0.3 ALeft TurnThrough 374 371 99.3% 0.5 0.1 ARight Turn 56 58 103.6% 0.8 0.3 A
Subtotal 430 429 99.9% 0.5 0.1 ALeft Turn 94 97 103.5% 15.8 2.5 CThroughRight Turn 217 214 98.8% 14.1 2.5 B
Subtotal 311 312 100.2% 14.7 2.4 BLeft TurnThroughRight Turn
SubtotalTotal 1,107 1,107 100.0% 4.6 0.7 A
15.8
Served Volume (vph)
NB
SB
EB
WB
Served Volume (vph)
NB
SB
EB
WB
Fehr & Peers 11/18/2016
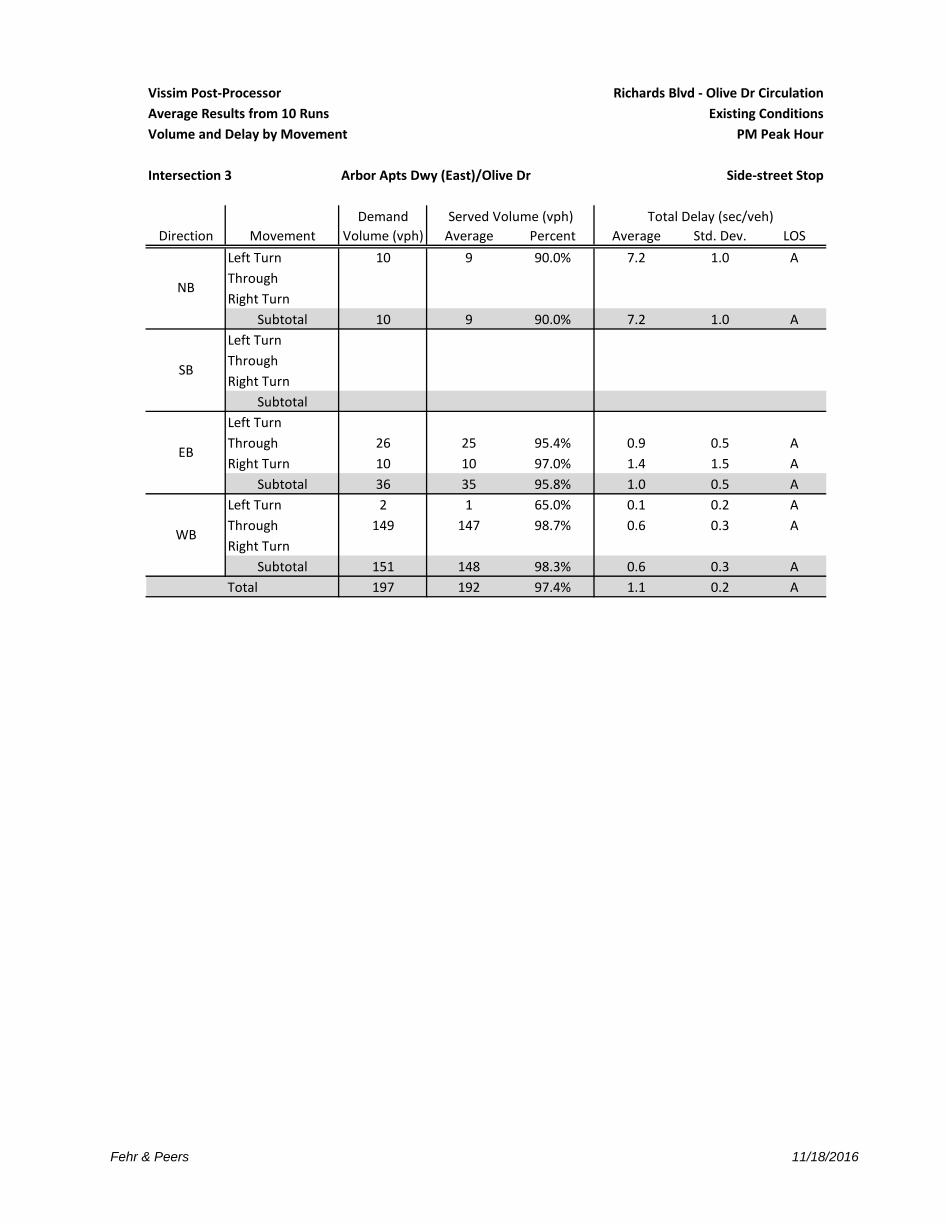
Vissim Post-Processor Richards Blvd - Olive Dr CirculationAverage Results from 10 Runs Existing ConditionsVolume and Delay by Movement PM Peak Hour
Intersection 3 Arbor Apts Dwy (East)/Olive Dr Side-street Stop
Demand Total Delay (sec/veh)Direction Movement Volume (vph) Average Percent Average Std. Dev. LOS
Left Turn 10 9 90.0% 7.2 1.0 AThroughRight Turn
Subtotal 10 9 90.0% 7.2 1.0 ALeft TurnThroughRight Turn
SubtotalLeft TurnThrough 26 25 95.4% 0.9 0.5 ARight Turn 10 10 97.0% 1.4 1.5 A
Subtotal 36 35 95.8% 1.0 0.5 ALeft Turn 2 1 65.0% 0.1 0.2 AThrough 149 147 98.7% 0.6 0.3 ARight Turn
Subtotal 151 148 98.3% 0.6 0.3 ATotal 197 192 97.4% 1.1 0.2 A
6.6
SB
EB
WB
Served Volume (vph)
NB

Vissim Post‐Processor Richards Blvd ‐ Olive Dr Circulation
Average Results from 10 Runs Existing Conditions
Volume and Delay by Movement PM Peak Hour
Intersection 4 D St/First St Signal
Demand Total Delay (sec/veh)
Direction Movement Volume (vph) Average Percent Average Std. Dev. LOS
Left Turn 27 26 95.6% 26.5 7.0 C
Through 41 41 100.0% 30.8 5.4 C
Right Turn 61 64 104.4% 8.4 3.3 A
Subtotal 129 131 101.2% 19.4 3.7 B
Left Turn 85 83 97.6% 24.3 4.5 C
Through 29 29 98.6% 23.6 6.2 C
Right Turn 21 22 106.2% 8.0 6.1 A
Subtotal 135 134 99.2% 21.1 3.4 C
Left Turn 14 13 90.7% 75.0 27.9 E
Through 374 383 102.3% 47.7 11.9 D
Right Turn 59 58 97.5% 47.0 13.9 D
Subtotal 447 453 101.3% 48.5 12.0 D
Left Turn 77 74 96.5% 29.8 5.9 C
Through 308 311 101.0% 10.1 3.2 B
Right Turn 48 49 102.9% 7.8 2.7 A
Subtotal 433 435 100.4% 13.2 2.4 B
Total 1,144 1,152 100.7% 28.6 5.6 C
58.3
Intersection 5 E St‐Richards Blvd/First St Signal
Demand Total Delay (sec/veh)
Direction Movement Volume (vph) Average Percent Average Std. Dev. LOS
Left Turn 376 379 100.7% 13.4 4.1 B
Through 108 108 100.3% 10.3 4.3 B
Right Turn 250 243 97.0% 4.2 1.1 A
Subtotal 734 730 99.4% 9.7 2.8 A
Left Turn 6 6 101.7% 55.1 34.4 E
Through 166 168 101.1% 61.5 5.2 E
Right Turn 21 21 98.1% 34.3 16.6 C
Subtotal 193 195 100.8% 58.6 5.3 E
Left Turn 10 10 96.0% 67.4 24.1 E
Through 53 56 105.3% 77.9 21.0 E
Right Turn 457 465 101.7% 13.4 3.0 B
Subtotal 520 530 101.9% 21.1 4.1 C
Left Turn 201 200 99.3% 72.3 15.2 E
Through 36 36 99.2% 44.6 14.0 D
Right Turn 6 6 95.0% 30.9 32.0 C
Subtotal 243 241 99.1% 67.4 13.0 E
Total 1,690 1,695 100.3% 27.9 2.1 C
78.4
Served Volume (vph)
NB
SB
WB
EB
WB
Served Volume (vph)
NB
SB
EB
Fehr & Peers 12/1/2016

Vissim Post‐Processor Richards Blvd ‐ Olive Dr Circulation
Average Results from 10 Runs Existing Conditions
Volume and Delay by Movement PM Peak Hour
Intersection 6 Richards Blvd/Olive Dr Signal
Demand Total Delay (sec/veh)
Direction Movement Volume (vph) Average Percent Average Std. Dev. LOS
Left Turn 46 50 108.5% 73.6 11.9 E
Through 536 539 100.5% 25.4 6.8 C
Right Turn 52 50 96.3% 5.2 2.4 A
Subtotal 634 639 100.8% 28.3 7.0 C
Left Turn 92 92 100.3% 58.2 6.5 E
Through 698 704 100.9% 15.6 3.3 B
Right Turn 34 35 103.2% 15.3 7.4 B
Subtotal 824 831 100.9% 19.8 3.9 B
Left Turn 32 31 96.6% 55.3 12.5 E
Through 5 5 102.0% 31.7 33.9 C
Right Turn 74 74 99.7% 23.7 10.8 C
Subtotal 111 110 98.9% 34.5 9.6 C
Left Turn 142 135 94.8% 121.9 55.0 F
Through 17 17 97.1% 79.4 56.1 E
Right Turn 166 158 95.4% 65.4 44.7 E
Subtotal 325 309 95.2% 91.3 46.8 F
Total 1,894 1,889 99.8% 35.7 8.4 D
126.0
Intersection 7 Richards Blvd/I‐80 WB Ramps Uncontrolled
Demand Total Delay (sec/veh)
Direction Movement Volume (vph) Average Percent Average Std. Dev. LOS
Left Turn
Through 447 453 101.3% 6.7 2.6 A
Right Turn 437 431 98.6% 2.3 0.4 A
Subtotal 884 884 100.0% 4.6 1.3 A
Left Turn
Through 635 636 100.2% 0.7 0.2 A
Right Turn 321 318 99.2% 1.4 0.3 A
Subtotal 956 954 99.8% 0.9 0.2 A
Left Turn
Through
Right Turn 90 90 100.1% 0.7 0.1 A
Subtotal 90 90 100.1% 0.7 0.1 A
Left Turn
Through
Right Turn 221 221 99.9% 1.0 0.5 A
Subtotal 221 221 99.9% 1.0 0.5 A
Total 2,151 2,149 99.9% 2.5 0.6 A
3.8
Served Volume (vph)
NB
SB
EB
WB
Served Volume (vph)
NB
SB
EB
WB
Fehr & Peers 12/1/2016
Vissim Post‐Processor Richards Blvd ‐ Olive Dr Circulation
Average Results from 10 Runs Existing Conditions
Volume and Delay by Movement PM Peak Hour
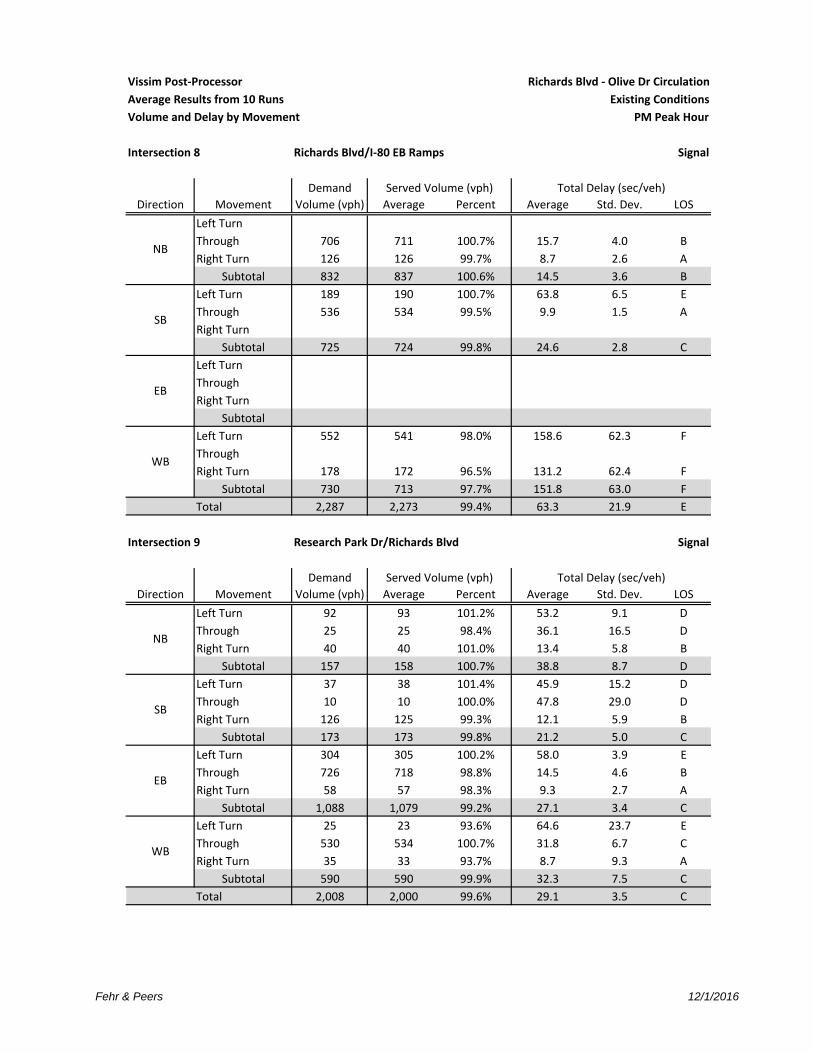
Intersection 8 Richards Blvd/I‐80 EB Ramps Signal
Demand Total Delay (sec/veh)
Direction Movement Volume (vph) Average Percent Average Std. Dev. LOS
Left Turn
Through 706 711 100.7% 15.7 4.0 B
Right Turn 126 126 99.7% 8.7 2.6 A
Subtotal 832 837 100.6% 14.5 3.6 B
Left Turn 189 190 100.7% 63.8 6.5 E
Through 536 534 99.5% 9.9 1.5 A
Right Turn
Subtotal 725 724 99.8% 24.6 2.8 C
Left Turn
Through
Right Turn
Subtotal
Left Turn 552 541 98.0% 158.6 62.3 F
Through
Right Turn 178 172 96.5% 131.2 62.4 F
Subtotal 730 713 97.7% 151.8 63.0 F
Total 2,287 2,273 99.4% 63.3 21.9 E
77.8
Intersection 9 Research Park Dr/Richards Blvd Signal
Demand Total Delay (sec/veh)
Direction Movement Volume (vph) Average Percent Average Std. Dev. LOS
Left Turn 92 93 101.2% 53.2 9.1 D
Through 25 25 98.4% 36.1 16.5 D
Right Turn 40 40 101.0% 13.4 5.8 B
Subtotal 157 158 100.7% 38.8 8.7 D
Left Turn 37 38 101.4% 45.9 15.2 D
Through 10 10 100.0% 47.8 29.0 D
Right Turn 126 125 99.3% 12.1 5.9 B
Subtotal 173 173 99.8% 21.2 5.0 C
Left Turn 304 305 100.2% 58.0 3.9 E
Through 726 718 98.8% 14.5 4.6 B
Right Turn 58 57 98.3% 9.3 2.7 A
Subtotal 1,088 1,079 99.2% 27.1 3.4 C
Left Turn 25 23 93.6% 64.6 23.7 E
Through 530 534 100.7% 31.8 6.7 C
Right Turn 35 33 93.7% 8.7 9.3 A
Subtotal 590 590 99.9% 32.3 7.5 C
Total 2,008 2,000 99.6% 29.1 3.5 C
69.4
NB
SB
EB
WB
Served Volume (vph)
NB
Served Volume (vph)
SB
EB
WB
Fehr & Peers 12/1/2016
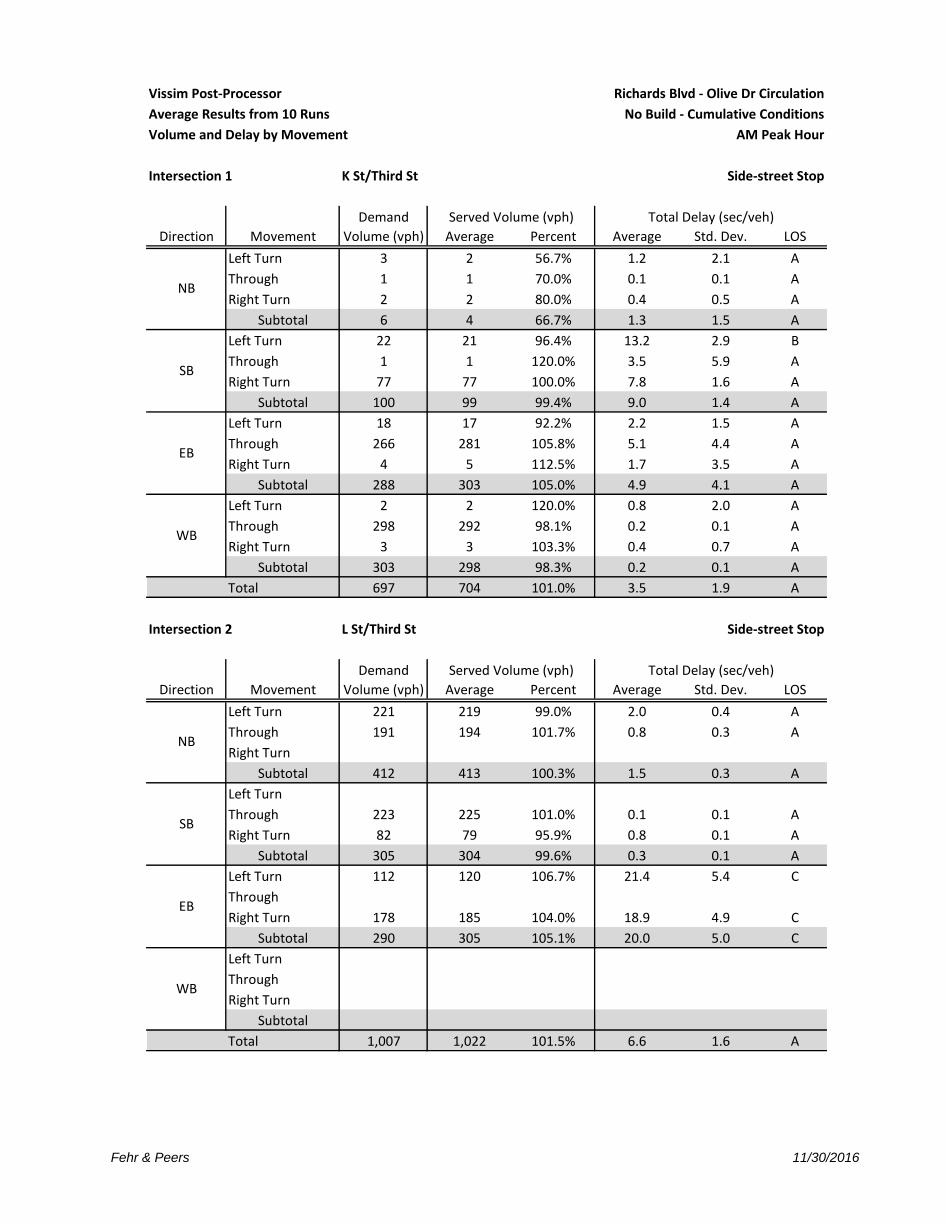
Vissim Post-Processor Richards Blvd - Olive Dr Circulation
Average Results from 10 Runs No Build - Cumulative Conditions
Volume and Delay by Movement AM Peak Hour
Intersection 1 K St/Third St Side-street Stop
Demand Total Delay (sec/veh)
Direction Movement Volume (vph) Average Percent Average Std. Dev. LOS
Left Turn 3 2 56.7% 1.2 2.1 A
Through 1 1 70.0% 0.1 0.1 A
Right Turn 2 2 80.0% 0.4 0.5 A
Subtotal 6 4 66.7% 1.3 1.5 A
Left Turn 22 21 96.4% 13.2 2.9 B
Through 1 1 120.0% 3.5 5.9 A
Right Turn 77 77 100.0% 7.8 1.6 A
Subtotal 100 99 99.4% 9.0 1.4 A
Left Turn 18 17 92.2% 2.2 1.5 A
Through 266 281 105.8% 5.1 4.4 A
Right Turn 4 5 112.5% 1.7 3.5 A
Subtotal 288 303 105.0% 4.9 4.1 A
Left Turn 2 2 120.0% 0.8 2.0 A
Through 298 292 98.1% 0.2 0.1 A
Right Turn 3 3 103.3% 0.4 0.7 A
Subtotal 303 298 98.3% 0.2 0.1 A
Total 697 704 101.0% 3.5 1.9 A
12.2
Intersection 2 L St/Third St Side-street Stop
Demand Total Delay (sec/veh)
Direction Movement Volume (vph) Average Percent Average Std. Dev. LOS
Left Turn 221 219 99.0% 2.0 0.4 A
Through 191 194 101.7% 0.8 0.3 A
Right Turn
Subtotal 412 413 100.3% 1.5 0.3 A
Left Turn
Through 223 225 101.0% 0.1 0.1 A
Right Turn 82 79 95.9% 0.8 0.1 A
Subtotal 305 304 99.6% 0.3 0.1 A
Left Turn 112 120 106.7% 21.4 5.4 C
Through
Right Turn 178 185 104.0% 18.9 4.9 C
Subtotal 290 305 105.1% 20.0 5.0 C
Left Turn
Through
Right Turn
Subtotal
Total 1,007 1,022 101.5% 6.6 1.6 A
19.8
Served Volume (vph)
NB
SB
EB
WB
Served Volume (vph)
NB
SB
EB
WB
Fehr & Peers 11/30/2016

Vissim Post-Processor Richards Blvd - Olive Dr Circulation
Average Results from 10 Runs No Build - Cumulative Conditions
Volume and Delay by Movement AM Peak Hour
Intersection 3 Arbor Apts Dwy (East)/Olive Dr Side-street Stop
Demand Total Delay (sec/veh)
Direction Movement Volume (vph) Average Percent Average Std. Dev. LOS
Left Turn 24 21 86.7% 5.5 0.6 A
Through
Right Turn
Subtotal 24 21 86.7% 5.5 0.6 A
Left Turn
Through
Right Turn
Subtotal
Left Turn
Through 21 17 80.0% 1.5 1.3 A
Right Turn 12 14 119.2% 1.4 0.7 A
Subtotal 33 31 94.2% 1.7 0.9 A
Left Turn 2 2 85.0% 0.6 1.1 A
Through 158 154 97.4% 0.2 0.1 A
Right Turn
Subtotal 160 156 97.3% 0.2 0.1 A
Total 217 208 95.6% 1.0 0.3 A
5.6
Intersection 4 D St/First St Signal
Demand Total Delay (sec/veh)
Direction Movement Volume (vph) Average Percent Average Std. Dev. LOS
Left Turn 14 14 101.4% 44.1 22.3 D
Through 17 16 94.1% 34.7 13.3 C
Right Turn 31 33 105.2% 8.5 6.8 A
Subtotal 62 63 101.3% 23.5 5.7 C
Left Turn 85 88 103.1% 81.3 70.7 F
Through 29 30 104.8% 77.1 64.5 E
Right Turn 68 68 100.0% 32.5 38.2 C
Subtotal 182 186 102.2% 63.5 54.7 E
Left Turn 28 28 100.4% 57.3 13.7 E
Through 227 234 102.9% 16.4 12.7 B
Right Turn 32 30 94.4% 11.7 6.8 B
Subtotal 287 292 101.7% 20.3 10.8 C
Left Turn 33 32 96.1% 64.6 10.8 E
Through 481 464 96.4% 5.8 2.1 A
Right Turn 51 47 92.2% 3.4 1.4 A
Subtotal 565 543 96.0% 9.4 2.1 A
Total 1,096 1,083 98.8% 22.9 13.3 C
71.4
SB
EB
WB
Served Volume (vph)
NB
SB
Served Volume (vph)
NB
EB
WB
Fehr & Peers 11/30/2016
Vissim Post-Processor Richards Blvd - Olive Dr Circulation
Average Results from 10 Runs No Build - Cumulative Conditions
Volume and Delay by Movement AM Peak Hour
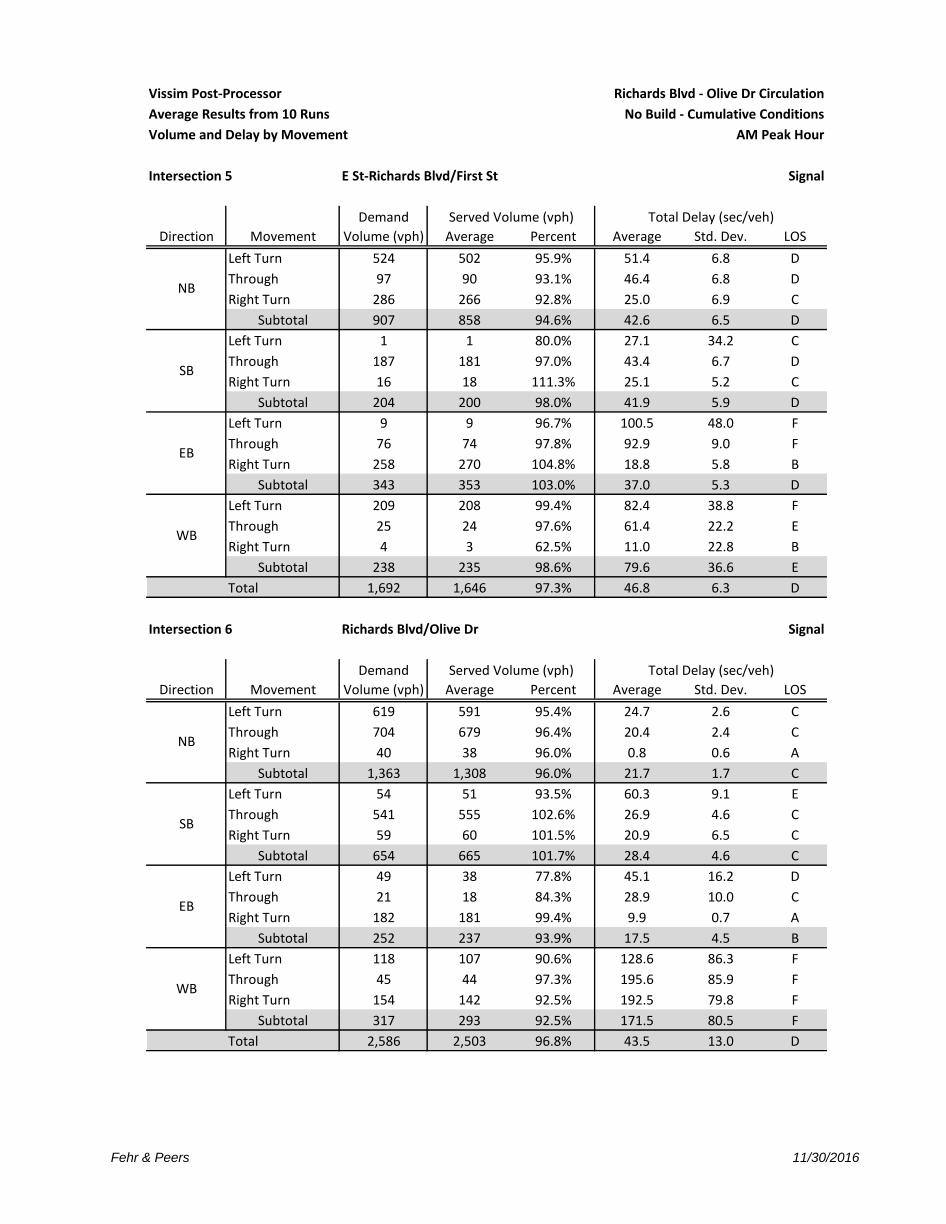
Intersection 5 E St-Richards Blvd/First St Signal
Demand Total Delay (sec/veh)
Direction Movement Volume (vph) Average Percent Average Std. Dev. LOS
Left Turn 524 502 95.9% 51.4 6.8 D
Through 97 90 93.1% 46.4 6.8 D
Right Turn 286 266 92.8% 25.0 6.9 C
Subtotal 907 858 94.6% 42.6 6.5 D
Left Turn 1 1 80.0% 27.1 34.2 C
Through 187 181 97.0% 43.4 6.7 D
Right Turn 16 18 111.3% 25.1 5.2 C
Subtotal 204 200 98.0% 41.9 5.9 D
Left Turn 9 9 96.7% 100.5 48.0 F
Through 76 74 97.8% 92.9 9.0 F
Right Turn 258 270 104.8% 18.8 5.8 B
Subtotal 343 353 103.0% 37.0 5.3 D
Left Turn 209 208 99.4% 82.4 38.8 F
Through 25 24 97.6% 61.4 22.2 E
Right Turn 4 3 62.5% 11.0 22.8 B
Subtotal 238 235 98.6% 79.6 36.6 E
Total 1,692 1,646 97.3% 46.8 6.3 D
83.6
Intersection 6 Richards Blvd/Olive Dr Signal
Demand Total Delay (sec/veh)
Direction Movement Volume (vph) Average Percent Average Std. Dev. LOS
Left Turn 619 591 95.4% 24.7 2.6 C
Through 704 679 96.4% 20.4 2.4 C
Right Turn 40 38 96.0% 0.8 0.6 A
Subtotal 1,363 1,308 96.0% 21.7 1.7 C
Left Turn 54 51 93.5% 60.3 9.1 E
Through 541 555 102.6% 26.9 4.6 C
Right Turn 59 60 101.5% 20.9 6.5 C
Subtotal 654 665 101.7% 28.4 4.6 C
Left Turn 49 38 77.8% 45.1 16.2 D
Through 21 18 84.3% 28.9 10.0 C
Right Turn 182 181 99.4% 9.9 0.7 A
Subtotal 252 237 93.9% 17.5 4.5 B
Left Turn 118 107 90.6% 128.6 86.3 F
Through 45 44 97.3% 195.6 85.9 F
Right Turn 154 142 92.5% 192.5 79.8 F
Subtotal 317 293 92.5% 171.5 80.5 F
Total 2,586 2,503 96.8% 43.5 13.0 D
99.6
WB
Served Volume (vph)
NB
SB
EB
WB
Served Volume (vph)
NB
SB
EB
Fehr & Peers 11/30/2016
Vissim Post-Processor Richards Blvd - Olive Dr Circulation
Average Results from 10 Runs No Build - Cumulative Conditions
Volume and Delay by Movement AM Peak Hour
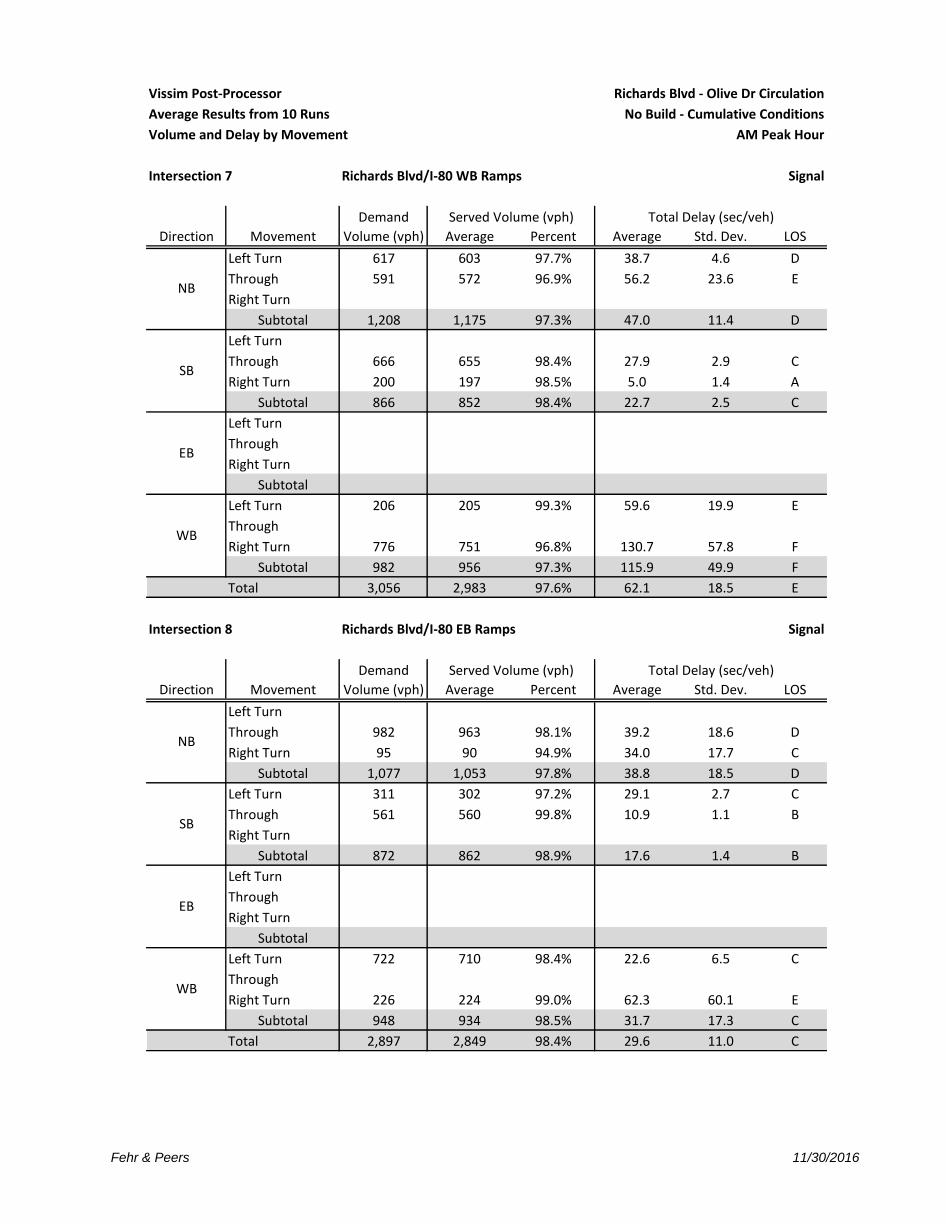
Intersection 7 Richards Blvd/I-80 WB Ramps Signal
Demand Total Delay (sec/veh)
Direction Movement Volume (vph) Average Percent Average Std. Dev. LOS
Left Turn 617 603 97.7% 38.7 4.6 D
Through 591 572 96.9% 56.2 23.6 E
Right Turn
Subtotal 1,208 1,175 97.3% 47.0 11.4 D
Left Turn
Through 666 655 98.4% 27.9 2.9 C
Right Turn 200 197 98.5% 5.0 1.4 A
Subtotal 866 852 98.4% 22.7 2.5 C
Left Turn
Through
Right Turn
Subtotal
Left Turn 206 205 99.3% 59.6 19.9 E
Through
Right Turn 776 751 96.8% 130.7 57.8 F
Subtotal 982 956 97.3% 115.9 49.9 F
Total 3,056 2,983 97.6% 62.1 18.5 E
42.6
Intersection 8 Richards Blvd/I-80 EB Ramps Signal
Demand Total Delay (sec/veh)
Direction Movement Volume (vph) Average Percent Average Std. Dev. LOS
Left Turn
Through 982 963 98.1% 39.2 18.6 D
Right Turn 95 90 94.9% 34.0 17.7 C
Subtotal 1,077 1,053 97.8% 38.8 18.5 D
Left Turn 311 302 97.2% 29.1 2.7 C
Through 561 560 99.8% 10.9 1.1 B
Right Turn
Subtotal 872 862 98.9% 17.6 1.4 B
Left Turn
Through
Right Turn
Subtotal
Left Turn 722 710 98.4% 22.6 6.5 C
Through
Right Turn 226 224 99.0% 62.3 60.1 E
Subtotal 948 934 98.5% 31.7 17.3 C
Total 2,897 2,849 98.4% 29.6 11.0 C
30.4
NB
SB
EB
WB
Served Volume (vph)
NB
SB
EB
WB
Served Volume (vph)
Fehr & Peers 11/30/2016

Vissim Post-Processor Richards Blvd - Olive Dr Circulation
Average Results from 10 Runs No Build - Cumulative Conditions
Volume and Delay by Movement AM Peak Hour
Intersection 9 Research Park Dr/Richards Blvd Signal
Demand Total Delay (sec/veh)
Direction Movement Volume (vph) Average Percent Average Std. Dev. LOS
Left Turn 85 83 98.0% 71.8 18.6 E
Through 5 4 86.0% 26.7 33.3 C
Right Turn 40 40 99.8% 6.9 3.9 A
Subtotal 130 128 98.1% 51.2 14.5 D
Left Turn 22 22 100.9% 48.5 22.6 D
Through 22 20 91.4% 33.9 15.2 C
Right Turn 136 132 97.3% 12.4 2.4 B
Subtotal 180 175 97.0% 20.0 4.8 B
Left Turn 418 411 98.2% 54.5 7.4 D
Through 718 719 100.2% 15.4 3.3 B
Right Turn 147 145 98.6% 17.5 3.5 B
Subtotal 1,283 1,275 99.4% 28.9 4.3 C
Left Turn 38 38 99.5% 128.9 37.8 F
Through 821 803 97.8% 95.0 32.5 F
Right Turn 23 22 96.1% 74.8 31.6 E
Subtotal 882 863 97.9% 95.5 32.3 F
Total 2,475 2,440 98.6% 54.2 13.5 D
100.0
Served Volume (vph)
NB
SB
EB
WB
Fehr & Peers 11/30/2016

Vissim Post-Processor Richards Blvd - Olive Dr Circulation
Average Results from 10 Runs No Build - Cumulative Conditions
Volume and Delay by Movement PM Peak Hour
Intersection 1 K St/Third St Side-street Stop
Demand Total Delay (sec/veh)
Direction Movement Volume (vph) Average Percent Average Std. Dev. LOS
Left Turn 4 4 92.5% 3.8 4.6 A
Through 2 2 75.0% 1.2 3.3 A
Right Turn 3 3 90.0% 7.2 17.2 A
Subtotal 9 8 87.8% 6.2 8.0 A
Left Turn 5 5 106.0% 16.7 17.8 C
Through 2 2 85.0% 6.7 5.0 A
Right Turn 16 17 106.9% 6.9 0.8 A
Subtotal 23 24 104.8% 10.5 4.6 B
Left Turn 12 9 77.5% 52.6 40.8 F
Through 358 350 97.8% 74.6 36.4 F
Right Turn 4 4 110.0% 46.9 32.4 E
Subtotal 374 364 97.2% 73.7 36.2 F
Left Turn 4 5 125.0% 2.7 3.9 A
Through 372 369 99.3% 0.3 0.2 A
Right Turn 24 25 102.5% 1.1 1.1 A
Subtotal 400 399 99.8% 0.4 0.3 A
Total 806 795 98.6% 35.4 16.5 E
41.7
Intersection 2 L St/Third St Side-street Stop
Demand Total Delay (sec/veh)
Direction Movement Volume (vph) Average Percent Average Std. Dev. LOS
Left Turn 268 265 98.9% 2.8 0.8 A
Through 247 251 101.7% 0.8 0.3 A
Right Turn
Subtotal 515 516 100.2% 1.8 0.6 A
Left Turn
Through 408 406 99.4% 0.2 0.1 A
Right Turn 132 133 101.1% 1.2 0.2 A
Subtotal 540 539 99.8% 0.5 0.1 A
Left Turn 94 98 103.9% 44.9 9.5 E
Through
Right Turn 272 260 95.7% 42.2 8.7 E
Subtotal 366 358 97.8% 42.9 8.8 E
Left Turn
Through
Right Turn
Subtotal
Total 1,421 1,413 99.5% 12.1 1.8 B
41.3
NB
SB
EB
WB
Served Volume (vph)
NB
SB
EB
WB
Served Volume (vph)
Fehr & Peers 11/30/2016

Vissim Post-Processor Richards Blvd - Olive Dr Circulation
Average Results from 10 Runs No Build - Cumulative Conditions
Volume and Delay by Movement PM Peak Hour
Intersection 3 Arbor Apts Dwy (East)/Olive Dr Side-street Stop
Demand Total Delay (sec/veh)
Direction Movement Volume (vph) Average Percent Average Std. Dev. LOS
Left Turn 20 20 99.0% 5.8 0.8 A
Through
Right Turn
Subtotal 20 20 99.0% 5.8 0.8 A
Left Turn
Through
Right Turn
Subtotal
Left Turn
Through 35 23 66.9% 2.2 1.4 A
Right Turn 14 19 137.1% 2.8 1.4 A
Subtotal 49 43 86.9% 2.5 1.0 A
Left Turn 2 3 130.0% 0.2 0.3 A
Through 161 169 104.7% 0.6 0.2 A
Right Turn
Subtotal 163 171 105.0% 0.6 0.2 A
Total 232 234 100.6% 1.4 0.2 A
5.4
Intersection 4 D St/First St Signal
Demand Total Delay (sec/veh)
Direction Movement Volume (vph) Average Percent Average Std. Dev. LOS
Left Turn 31 31 100.0% 25.4 9.2 C
Through 46 45 98.5% 30.0 8.0 C
Right Turn 64 66 102.7% 12.8 3.5 B
Subtotal 141 142 100.7% 20.5 3.7 C
Left Turn 187 184 98.4% 83.0 28.3 F
Through 41 45 109.3% 87.9 40.8 F
Right Turn 56 55 97.7% 52.8 25.6 D
Subtotal 284 284 99.9% 77.8 28.2 E
Left Turn 23 25 107.0% 120.2 68.6 F
Through 378 377 99.8% 118.4 58.5 F
Right Turn 62 59 95.0% 112.5 60.0 F
Subtotal 463 461 99.5% 118.1 58.9 F
Left Turn 77 77 99.6% 32.6 3.6 C
Through 372 368 98.9% 13.1 2.1 B
Right Turn 49 52 105.7% 8.7 2.2 A
Subtotal 498 497 99.7% 15.6 1.3 B
Total 1,386 1,383 99.8% 62.7 18.8 E
92.6
EB
WB
Served Volume (vph)
NB
SB
Served Volume (vph)
NB
SB
EB
WB
Fehr & Peers 11/30/2016

Vissim Post-Processor Richards Blvd - Olive Dr Circulation
Average Results from 10 Runs No Build - Cumulative Conditions
Volume and Delay by Movement PM Peak Hour
Intersection 5 E St-Richards Blvd/First St Signal
Demand Total Delay (sec/veh)
Direction Movement Volume (vph) Average Percent Average Std. Dev. LOS
Left Turn 314 321 102.3% 21.8 4.5 C
Through 185 182 98.2% 23.3 5.0 C
Right Turn 356 338 95.0% 9.9 2.9 A
Subtotal 855 841 98.4% 17.2 3.8 B
Left Turn 6 6 100.0% 50.0 34.8 D
Through 190 190 99.8% 50.9 13.4 D
Right Turn 27 25 93.0% 25.5 9.0 C
Subtotal 223 221 99.0% 48.2 12.3 D
Left Turn 10 9 87.0% 65.3 31.4 E
Through 53 52 97.4% 81.2 11.7 F
Right Turn 566 572 101.0% 17.6 2.3 B
Subtotal 629 632 100.5% 24.3 2.0 C
Left Turn 205 198 96.4% 52.3 10.4 D
Through 157 151 96.0% 43.8 5.9 D
Right Turn 10 10 96.0% 18.8 13.2 B
Subtotal 372 358 96.2% 47.8 6.0 D
Total 2,079 2,052 98.7% 28.5 3.0 C
74.6
Intersection 6 Richards Blvd/Olive Dr Signal
Demand Total Delay (sec/veh)
Direction Movement Volume (vph) Average Percent Average Std. Dev. LOS
Left Turn 217 212 97.6% 41.4 5.1 D
Through 631 631 100.0% 8.9 2.6 A
Right Turn 58 56 95.7% 1.5 0.9 A
Subtotal 906 899 99.2% 15.7 2.2 B
Left Turn 110 109 98.6% 71.0 13.7 E
Through 789 791 100.3% 14.7 5.2 B
Right Turn 62 60 97.3% 13.3 7.5 B
Subtotal 961 960 99.9% 21.3 7.0 C
Left Turn 38 18 47.1% 36.9 16.7 D
Through 35 16 46.6% 38.4 15.3 D
Right Turn 455 455 99.9% 16.3 2.3 B
Subtotal 528 489 92.6% 18.0 1.8 B
Left Turn 149 154 103.2% 90.5 43.0 F
Through 34 35 104.1% 72.6 43.7 E
Right Turn 186 185 99.6% 51.1 34.4 D
Subtotal 369 374 101.5% 71.8 37.0 E
Total 2,764 2,722 98.5% 26.3 7.0 C
70.7
WB
Served Volume (vph)
NB
SB
EB
WB
Served Volume (vph)
NB
SB
EB
Fehr & Peers 11/30/2016

Vissim Post-Processor Richards Blvd - Olive Dr Circulation
Average Results from 10 Runs No Build - Cumulative Conditions
Volume and Delay by Movement PM Peak Hour
Intersection 7 Richards Blvd/I-80 WB Ramps Signal
Demand Total Delay (sec/veh)
Direction Movement Volume (vph) Average Percent Average Std. Dev. LOS
Left Turn 776 750 96.6% 33.2 2.7 C
Through 587 583 99.3% 2.9 0.9 A
Right Turn
Subtotal 1,363 1,333 97.8% 20.5 1.7 C
Left Turn
Through 1,186 1,176 99.1% 19.8 1.9 B
Right Turn 368 372 101.0% 10.5 1.5 B
Subtotal 1,554 1,547 99.6% 17.6 1.6 B
Left Turn
Through
Right Turn
Subtotal
Left Turn 85 84 99.2% 44.0 7.5 D
Through
Right Turn 324 326 100.7% 10.9 1.4 B
Subtotal 409 411 100.4% 17.2 1.7 B
Total 3,326 3,291 98.9% 18.7 1.1 B
45.2
Intersection 8 Richards Blvd/I-80 EB Ramps Signal
Demand Total Delay (sec/veh)
Direction Movement Volume (vph) Average Percent Average Std. Dev. LOS
Left Turn
Through 1,193 1,161 97.3% 27.1 2.8 C
Right Turn 125 119 95.5% 28.8 5.0 C
Subtotal 1,318 1,280 97.1% 27.3 2.8 C
Left Turn 465 462 99.4% 37.0 4.7 D
Through 806 803 99.6% 19.4 9.9 B
Right Turn
Subtotal 1,271 1,265 99.5% 25.9 6.5 C
Left Turn
Through
Right Turn
Subtotal
Left Turn 800 797 99.6% 31.4 14.4 C
Through
Right Turn 170 171 100.6% 11.2 2.4 B
Subtotal 970 968 99.8% 28.0 12.6 C
Total 3,559 3,513 98.7% 26.9 5.7 C
39.0
NB
SB
EB
WB
Served Volume (vph)
NB
SB
EB
WB
Served Volume (vph)
Fehr & Peers 11/30/2016

Vissim Post-Processor Richards Blvd - Olive Dr Circulation
Average Results from 10 Runs No Build - Cumulative Conditions
Volume and Delay by Movement PM Peak Hour
Intersection 9 Research Park Dr/Richards Blvd Signal
Demand Total Delay (sec/veh)
Direction Movement Volume (vph) Average Percent Average Std. Dev. LOS
Left Turn 104 101 96.8% 69.1 11.0 E
Through 25 24 97.2% 31.4 13.3 C
Right Turn 54 57 106.3% 9.6 3.7 A
Subtotal 183 182 99.7% 46.3 8.9 D
Left Turn 40 37 93.3% 89.1 28.5 F
Through 16 17 108.1% 72.7 36.8 E
Right Turn 431 427 99.0% 61.9 31.2 E
Subtotal 487 481 98.8% 64.5 31.3 E
Left Turn 426 432 101.4% 63.1 12.0 E
Through 1,110 1,096 98.8% 24.7 2.4 C
Right Turn 70 68 97.0% 21.9 5.4 C
Subtotal 1,606 1,596 99.4% 34.8 3.5 C
Left Turn 29 25 86.9% 84.6 17.5 F
Through 699 660 94.4% 50.3 15.1 D
Right Turn 39 37 94.1% 24.7 12.1 C
Subtotal 767 722 94.1% 50.5 14.8 D
Total 3,043 2,982 98.0% 44.5 7.0 D
75.2
SB
EB
WB
Served Volume (vph)
NB
Fehr & Peers 11/30/2016

Vissim Post-Processor Richards Blvd - Olive Dr Circulation
Average Results from 10 Runs L St Extension - Cumulative Conditions
Volume and Delay by Movement AM Peak Hour
Intersection 1 K St/Third St Signal
Demand Total Delay (sec/veh)
Direction Movement Volume (vph) Average Percent Average Std. Dev. LOS
Left Turn 159 159 100.0% 30.7 3.3 C
Through 2 2 75.0% 12.3 21.5 B
Right Turn 240 239 99.7% 9.2 1.6 A
Subtotal 401 400 99.7% 17.9 2.3 B
Left Turn 26 27 101.9% 30.3 7.8 C
Through 2 2 80.0% 12.7 22.0 B
Right Turn 17 17 98.8% 9.1 3.6 A
Subtotal 45 45 99.8% 22.7 6.5 C
Left Turn 20 21 107.0% 47.4 16.9 D
Through 94 94 99.5% 32.2 4.2 C
Right Turn 125 125 99.8% 16.7 5.3 B
Subtotal 239 240 100.3% 25.1 4.4 C
Left Turn 228 222 97.3% 18.8 2.2 B
Through 510 509 99.9% 3.5 0.8 A
Right Turn 12 9 77.5% 2.7 3.1 A
Subtotal 750 741 98.7% 8.3 1.4 A
Total 1,435 1,425 99.3% 14.5 1.7 B
51.0
Intersection 2 L St/Third St Signal
Demand Total Delay (sec/veh)
Direction Movement Volume (vph) Average Percent Average Std. Dev. LOS
Left Turn 462 458 99.1% 34.7 4.7 C
Through 432 433 100.3% 10.1 1.9 B
Right Turn
Subtotal 894 891 99.7% 22.4 3.8 C
Left Turn
Through 194 199 102.4% 30.7 5.8 C
Right Turn 288 283 98.4% 17.4 4.2 B
Subtotal 482 482 100.0% 22.9 4.2 C
Left Turn 154 155 100.9% 26.0 3.1 C
Through
Right Turn 206 204 99.0% 9.1 2.2 A
Subtotal 360 359 99.8% 16.4 2.2 B
Left Turn
Through
Right Turn
Subtotal
Total 1,736 1,732 99.8% 21.2 2.3 C
30.3
Served Volume (vph)
NB
SB
EB
WB
Served Volume (vph)
NB
SB
EB
WB
Fehr & Peers 11/30/2016

Vissim Post-Processor Richards Blvd - Olive Dr Circulation
Average Results from 10 Runs L St Extension - Cumulative Conditions
Volume and Delay by Movement AM Peak Hour
Intersection 3 L St/Olive Dr Signal
Demand Total Delay (sec/veh)
Direction Movement Volume (vph) Average Percent Average Std. Dev. LOS
Left Turn
Through
Right Turn
Subtotal
Left Turn
Through
Right Turn 400 401 100.1% 37.7 15.5 D
Subtotal 400 401 100.1% 37.7 15.5 D
Left Turn 178 180 100.9% 35.3 3.9 D
Through
Right Turn
Subtotal 178 180 100.9% 35.3 3.9 D
Left Turn
Through 173 169 97.4% 86.9 45.4 F
Right Turn 716 710 99.2% 85.9 46.5 F
Subtotal 889 879 98.9% 86.1 46.2 F
Total 1,467 1,459 99.5% 67.5 25.1 E
34.4
Intersection 4 D St/First St Signal
Demand Total Delay (sec/veh)
Direction Movement Volume (vph) Average Percent Average Std. Dev. LOS
Left Turn 14 11 77.1% 31.3 17.9 C
Through 15 16 106.0% 33.5 10.8 C
Right Turn 29 31 106.2% 15.0 12.1 B
Subtotal 58 58 99.1% 25.1 8.4 C
Left Turn 75 74 98.7% 77.9 48.2 E
Through 22 22 98.2% 65.0 26.3 E
Right Turn 16 16 100.0% 23.0 27.2 C
Subtotal 113 112 98.8% 67.2 36.4 E
Left Turn 5 5 106.0% 51.2 47.4 D
Through 329 336 102.0% 34.8 22.4 C
Right Turn 33 33 99.1% 26.4 20.0 C
Subtotal 367 374 101.8% 34.9 22.1 C
Left Turn 36 39 108.6% 58.0 8.9 E
Through 537 535 99.7% 9.4 1.3 A
Right Turn 51 47 91.4% 10.1 4.5 B
Subtotal 624 621 99.5% 12.3 1.1 B
Total 1,162 1,164 100.1% 25.6 8.6 C
63.4
SB
EB
WB
Served Volume (vph)
NB
SB
Served Volume (vph)
NB
EB
WB
Fehr & Peers 11/30/2016

Vissim Post-Processor Richards Blvd - Olive Dr Circulation
Average Results from 10 Runs L St Extension - Cumulative Conditions
Volume and Delay by Movement AM Peak Hour
Intersection 5 E St-Richards Blvd/First St Signal
Demand Total Delay (sec/veh)
Direction Movement Volume (vph) Average Percent Average Std. Dev. LOS
Left Turn 515 510 99.0% 52.3 8.8 D
Through 63 60 94.4% 54.9 6.6 D
Right Turn 154 151 98.1% 24.0 5.6 C
Subtotal 732 720 98.4% 46.6 8.4 D
Left Turn 1 1 60.0% 7.5 23.6 A
Through 169 164 97.3% 37.1 5.9 D
Right Turn 11 12 109.1% 16.9 10.7 B
Subtotal 181 177 97.8% 36.0 6.3 D
Left Turn 9 11 121.1% 117.2 34.9 F
Through 73 75 102.9% 120.9 25.8 F
Right Turn 351 355 101.1% 16.0 2.0 B
Subtotal 433 441 101.8% 37.4 7.0 D
Left Turn 97 98 100.7% 44.8 4.7 D
Through 98 97 99.3% 41.3 5.1 D
Right Turn 3 3 100.0% 34.2 32.2 C
Subtotal 198 198 100.0% 43.3 4.2 D
Total 1,544 1,536 99.5% 42.4 6.1 D
107.2
Intersection 6 Richards Blvd/Olive Dr Signal
Demand Total Delay (sec/veh)
Direction Movement Volume (vph) Average Percent Average Std. Dev. LOS
Left Turn 504 496 98.5% 38.4 3.2 D
Through 587 568 96.8% 18.1 4.5 B
Right Turn 80 79 99.3% 6.1 1.0 A
Subtotal 1,171 1,144 97.7% 25.9 2.0 C
Left Turn 20 22 109.5% 78.0 21.0 E
Through 513 517 100.8% 35.8 5.9 D
Right Turn 84 78 92.5% 42.9 4.5 D
Subtotal 617 617 100.0% 37.9 5.6 D
Left Turn 42 44 105.7% 68.7 20.8 E
Through 40 38 94.5% 29.5 8.2 C
Right Turn 133 134 100.5% 11.6 1.8 B
Subtotal 215 216 100.4% 28.1 6.0 C
Left Turn 369 372 100.7% 125.5 62.6 F
Through 87 87 99.5% 82.4 44.8 F
Right Turn 103 98 95.3% 74.8 42.1 E
Subtotal 559 556 99.5% 110.0 56.1 F
Total 2,562 2,533 98.9% 48.6 12.4 D
89.0
WB
Served Volume (vph)
NB
SB
EB
WB
Served Volume (vph)
NB
SB
EB
Fehr & Peers 11/30/2016
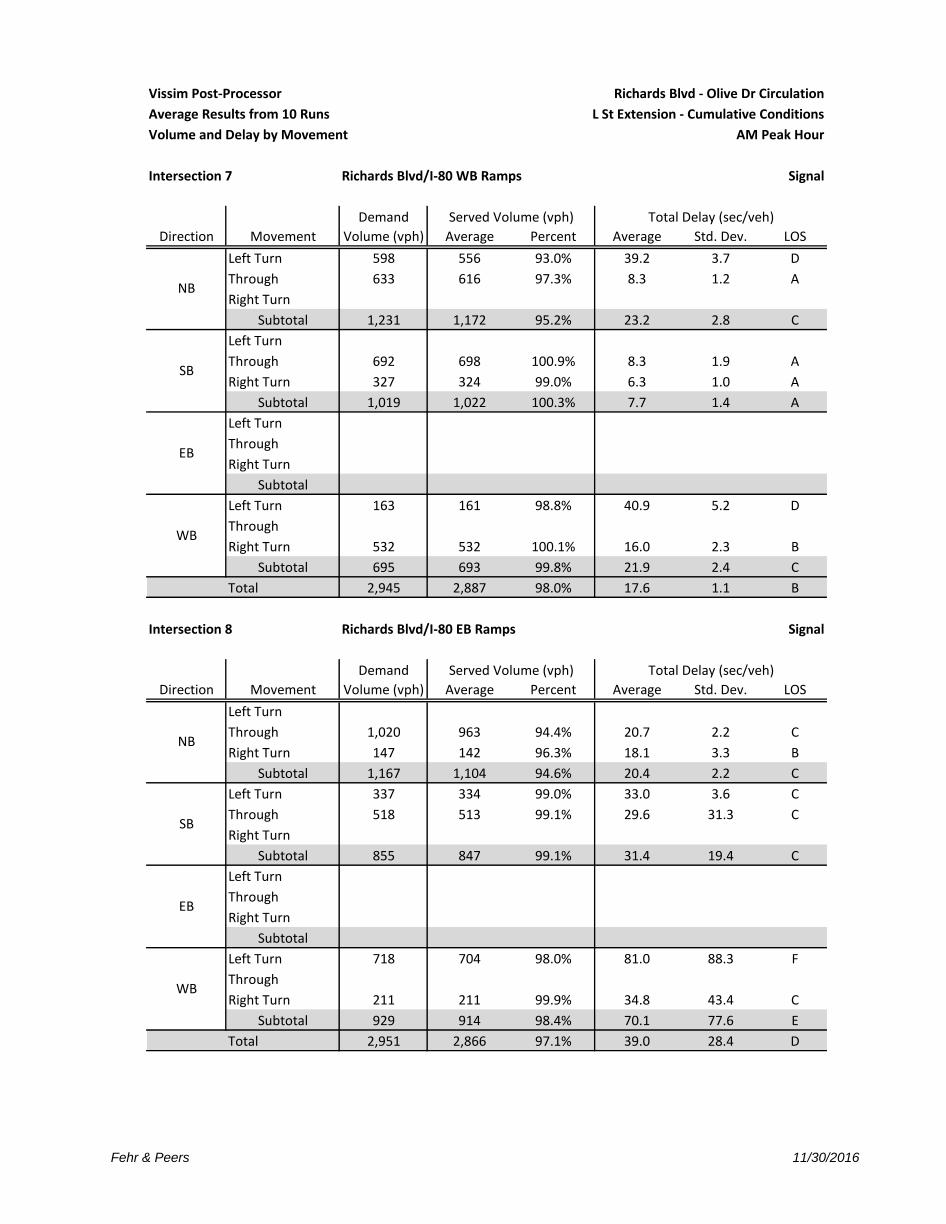
Vissim Post-Processor Richards Blvd - Olive Dr Circulation
Average Results from 10 Runs L St Extension - Cumulative Conditions
Volume and Delay by Movement AM Peak Hour
Intersection 7 Richards Blvd/I-80 WB Ramps Signal
Demand Total Delay (sec/veh)
Direction Movement Volume (vph) Average Percent Average Std. Dev. LOS
Left Turn 598 556 93.0% 39.2 3.7 D
Through 633 616 97.3% 8.3 1.2 A
Right Turn
Subtotal 1,231 1,172 95.2% 23.2 2.8 C
Left Turn
Through 692 698 100.9% 8.3 1.9 A
Right Turn 327 324 99.0% 6.3 1.0 A
Subtotal 1,019 1,022 100.3% 7.7 1.4 A
Left Turn
Through
Right Turn
Subtotal
Left Turn 163 161 98.8% 40.9 5.2 D
Through
Right Turn 532 532 100.1% 16.0 2.3 B
Subtotal 695 693 99.8% 21.9 2.4 C
Total 2,945 2,887 98.0% 17.6 1.1 B
42.3
Intersection 8 Richards Blvd/I-80 EB Ramps Signal
Demand Total Delay (sec/veh)
Direction Movement Volume (vph) Average Percent Average Std. Dev. LOS
Left Turn
Through 1,020 963 94.4% 20.7 2.2 C
Right Turn 147 142 96.3% 18.1 3.3 B
Subtotal 1,167 1,104 94.6% 20.4 2.2 C
Left Turn 337 334 99.0% 33.0 3.6 C
Through 518 513 99.1% 29.6 31.3 C
Right Turn
Subtotal 855 847 99.1% 31.4 19.4 C
Left Turn
Through
Right Turn
Subtotal
Left Turn 718 704 98.0% 81.0 88.3 F
Through
Right Turn 211 211 99.9% 34.8 43.4 C
Subtotal 929 914 98.4% 70.1 77.6 E
Total 2,951 2,866 97.1% 39.0 28.4 D
33.6
NB
SB
EB
WB
Served Volume (vph)
NB
SB
EB
WB
Served Volume (vph)
Fehr & Peers 11/30/2016
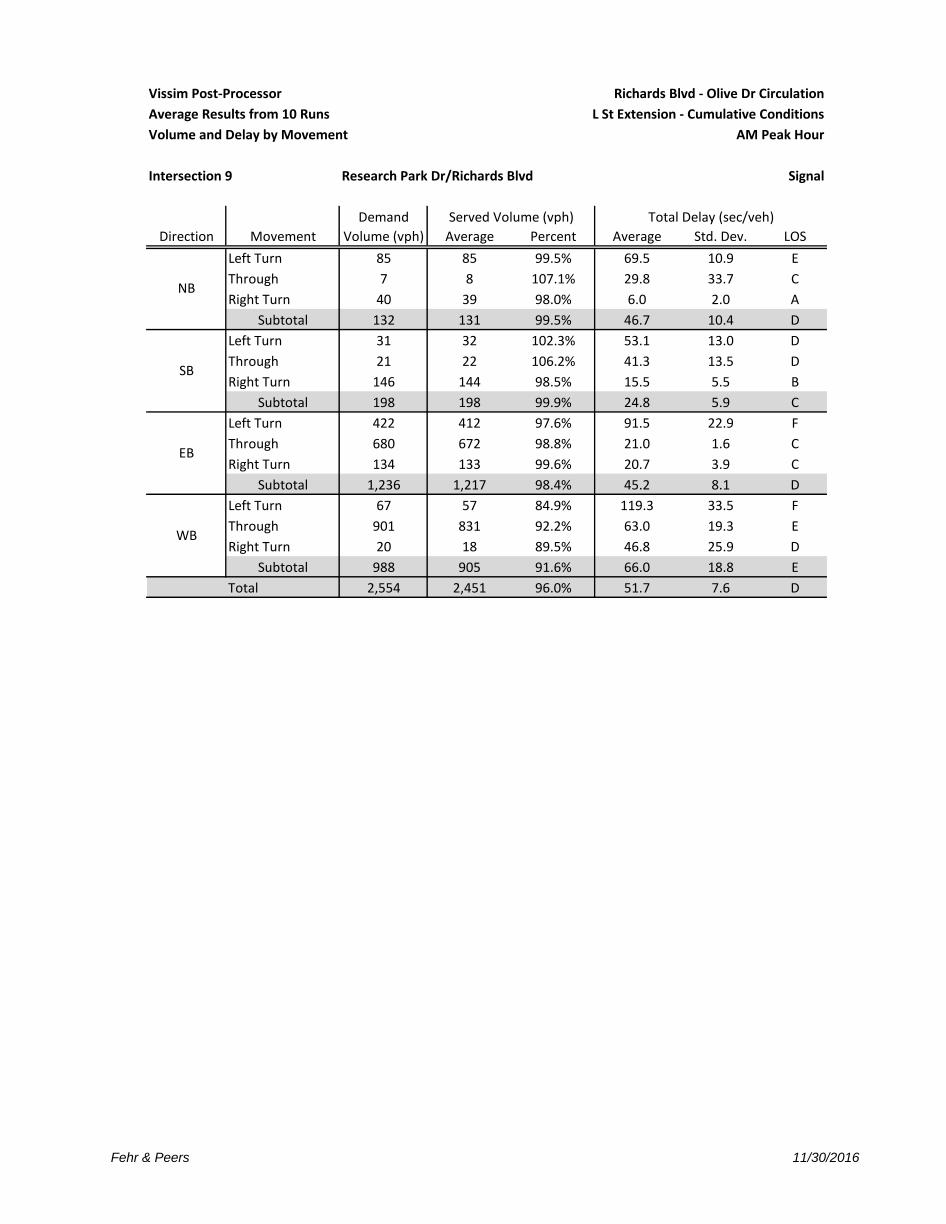
Vissim Post-Processor Richards Blvd - Olive Dr Circulation
Average Results from 10 Runs L St Extension - Cumulative Conditions
Volume and Delay by Movement AM Peak Hour
Intersection 9 Research Park Dr/Richards Blvd Signal
Demand Total Delay (sec/veh)
Direction Movement Volume (vph) Average Percent Average Std. Dev. LOS
Left Turn 85 85 99.5% 69.5 10.9 E
Through 7 8 107.1% 29.8 33.7 C
Right Turn 40 39 98.0% 6.0 2.0 A
Subtotal 132 131 99.5% 46.7 10.4 D
Left Turn 31 32 102.3% 53.1 13.0 D
Through 21 22 106.2% 41.3 13.5 D
Right Turn 146 144 98.5% 15.5 5.5 B
Subtotal 198 198 99.9% 24.8 5.9 C
Left Turn 422 412 97.6% 91.5 22.9 F
Through 680 672 98.8% 21.0 1.6 C
Right Turn 134 133 99.6% 20.7 3.9 C
Subtotal 1,236 1,217 98.4% 45.2 8.1 D
Left Turn 67 57 84.9% 119.3 33.5 F
Through 901 831 92.2% 63.0 19.3 E
Right Turn 20 18 89.5% 46.8 25.9 D
Subtotal 988 905 91.6% 66.0 18.8 E
Total 2,554 2,451 96.0% 51.7 7.6 D
95.9
Served Volume (vph)
NB
SB
EB
WB
Fehr & Peers 11/30/2016

Vissim Post-Processor Richards Blvd - Olive Dr Circulation
Average Results from 10 Runs L St Extension - Cumulative Conditions
Volume and Delay by Movement PM Peak Hour
Intersection 1 K St/Third St Signal
Demand Total Delay (sec/veh)
Direction Movement Volume (vph) Average Percent Average Std. Dev. LOS
Left Turn 234 238 101.6% 32.1 2.1 C
Through 4 3 67.5% 16.4 19.4 B
Right Turn 243 241 99.2% 11.0 2.7 B
Subtotal 481 482 100.1% 21.7 2.3 C
Left Turn 57 56 98.9% 37.8 11.4 D
Through 4 4 110.0% 25.9 41.7 C
Right Turn 12 12 100.0% 8.8 5.5 A
Subtotal 73 73 99.7% 33.5 10.3 C
Left Turn 13 13 99.2% 153.3 20.4 F
Through 169 160 94.7% 123.9 7.8 F
Right Turn 268 249 92.9% 110.2 11.6 F
Subtotal 450 422 93.8% 116.5 9.7 F
Left Turn 430 414 96.3% 28.2 3.1 C
Through 351 350 99.7% 5.1 1.3 A
Right Turn 51 50 97.5% 3.0 1.8 A
Subtotal 832 814 97.8% 16.7 2.1 B
Total 1,836 1,790 97.5% 42.1 1.9 D
156.5
Intersection 2 L St/Third St Signal
Demand Total Delay (sec/veh)
Direction Movement Volume (vph) Average Percent Average Std. Dev. LOS
Left Turn 368 372 101.1% 49.8 8.9 D
Through 498 483 97.0% 17.1 2.9 B
Right Turn
Subtotal 866 855 98.7% 31.3 5.4 C
Left Turn
Through 203 191 93.8% 72.0 5.1 E
Right Turn 464 439 94.7% 64.2 5.2 E
Subtotal 667 630 94.4% 66.7 4.5 E
Left Turn 212 211 99.6% 28.2 3.4 C
Through
Right Turn 257 248 96.5% 9.9 1.9 A
Subtotal 469 459 97.9% 18.9 2.0 B
Left Turn
Through
Right Turn
Subtotal
Total 2,002 1,944 97.1% 39.7 3.0 D
55.5
Served Volume (vph)
NB
SB
EB
WB
Served Volume (vph)
NB
SB
EB
WB
Fehr & Peers 12/1/2016

Vissim Post-Processor Richards Blvd - Olive Dr Circulation
Average Results from 10 Runs L St Extension - Cumulative Conditions
Volume and Delay by Movement PM Peak Hour
Intersection 3 L St/Olive Dr Signal
Demand Total Delay (sec/veh)
Direction Movement Volume (vph) Average Percent Average Std. Dev. LOS
Left Turn
Through
Right Turn
Subtotal
Left Turn
Through
Right Turn 460 441 95.8% 28.0 11.2 C
Subtotal 460 441 95.8% 28.0 11.2 C
Left Turn 374 366 97.9% 99.5 47.3 F
Through
Right Turn
Subtotal 374 366 97.9% 99.5 47.3 F
Left Turn
Through 158 158 100.2% 54.4 38.3 D
Right Turn 492 488 99.1% 54.2 36.6 D
Subtotal 650 646 99.4% 54.3 37.1 D
Total 1,484 1,453 97.9% 58.6 26.7 E
69.7
Intersection 4 D St/First St Signal
Demand Total Delay (sec/veh)
Direction Movement Volume (vph) Average Percent Average Std. Dev. LOS
Left Turn 30 30 100.3% 28.0 12.4 C
Through 45 43 95.3% 36.7 11.0 D
Right Turn 64 65 102.0% 28.8 13.3 C
Subtotal 139 138 99.5% 31.2 9.6 C
Left Turn 204 118 57.6% 404.2 153.9 F
Through 41 21 52.0% 379.9 157.8 F
Right Turn 34 19 56.8% 322.0 151.9 F
Subtotal 279 158 56.7% 393.0 153.0 F
Left Turn 45 41 91.1% 205.2 96.7 F
Through 410 404 98.5% 169.0 80.6 F
Right Turn 59 55 92.4% 178.5 102.5 F
Subtotal 514 499 97.1% 172.7 82.0 F
Left Turn 78 75 96.5% 87.3 19.7 F
Through 418 425 101.6% 16.0 4.4 B
Right Turn 49 46 93.1% 3.8 3.4 A
Subtotal 545 546 100.1% 26.1 5.1 C
Total 1,477 1,341 90.8% 114.0 27.8 F
328.0
SB
EB
WB
Served Volume (vph)
NB
SB
Served Volume (vph)
NB
EB
WB
Fehr & Peers 12/1/2016

Vissim Post-Processor Richards Blvd - Olive Dr Circulation
Average Results from 10 Runs L St Extension - Cumulative Conditions
Volume and Delay by Movement PM Peak Hour
Intersection 5 E St-Richards Blvd/First St Signal
Demand Total Delay (sec/veh)
Direction Movement Volume (vph) Average Percent Average Std. Dev. LOS
Left Turn 370 370 99.9% 36.3 13.3 D
Through 199 208 104.7% 38.7 10.4 D
Right Turn 101 105 103.6% 16.0 7.0 B
Subtotal 670 683 101.9% 33.7 11.4 C
Left Turn 6 6 93.3% 28.8 21.8 C
Through 159 158 99.3% 38.9 3.1 D
Right Turn 23 23 100.9% 21.0 13.3 C
Subtotal 188 187 99.3% 36.5 3.6 D
Left Turn 10 7 72.0% 90.9 49.7 F
Through 98 102 103.6% 112.3 17.8 F
Right Turn 570 484 84.8% 20.7 5.4 C
Subtotal 678 592 87.4% 39.9 6.4 D
Left Turn 116 117 101.2% 39.1 5.3 D
Through 152 149 98.2% 43.6 10.9 D
Right Turn 7 6 91.4% 32.3 23.0 C
Subtotal 275 273 99.3% 41.6 6.1 D
Total 1,811 1,735 95.8% 37.4 6.2 D
104.1
Intersection 6 Richards Blvd/Olive Dr Signal
Demand Total Delay (sec/veh)
Direction Movement Volume (vph) Average Percent Average Std. Dev. LOS
Left Turn 157 152 97.1% 46.7 7.2 D
Through 523 532 101.7% 22.6 6.2 C
Right Turn 199 193 96.9% 6.8 1.0 A
Subtotal 879 877 99.8% 23.4 3.1 C
Left Turn 29 23 78.6% 81.6 20.7 F
Through 763 695 91.1% 34.5 8.4 C
Right Turn 53 43 81.1% 39.9 14.7 D
Subtotal 845 761 90.1% 36.1 8.6 D
Left Turn 43 45 104.0% 64.7 17.6 E
Through 82 82 99.4% 40.1 4.4 D
Right Turn 409 406 99.2% 16.2 2.9 B
Subtotal 534 532 99.6% 24.5 4.3 C
Left Turn 382 362 94.7% 93.5 37.5 F
Through 78 72 92.1% 50.0 22.5 D
Right Turn 104 103 98.8% 37.9 20.3 D
Subtotal 564 536 95.1% 77.7 32.4 E
Total 2,822 2,706 95.9% 38.6 8.6 D
77.7
WB
Served Volume (vph)
NB
SB
EB
WB
Served Volume (vph)
NB
SB
EB
Fehr & Peers 12/1/2016
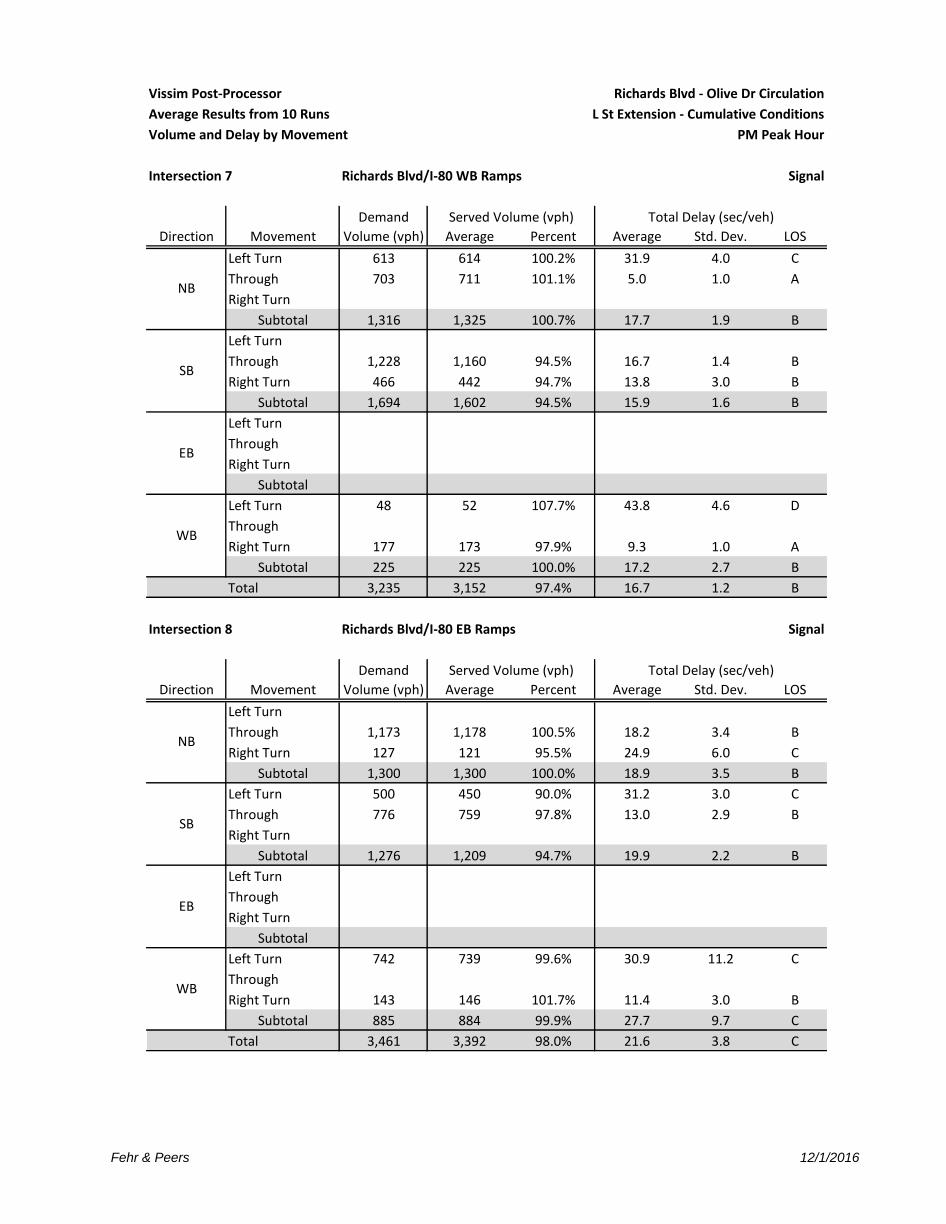
Vissim Post-Processor Richards Blvd - Olive Dr Circulation
Average Results from 10 Runs L St Extension - Cumulative Conditions
Volume and Delay by Movement PM Peak Hour
Intersection 7 Richards Blvd/I-80 WB Ramps Signal
Demand Total Delay (sec/veh)
Direction Movement Volume (vph) Average Percent Average Std. Dev. LOS
Left Turn 613 614 100.2% 31.9 4.0 C
Through 703 711 101.1% 5.0 1.0 A
Right Turn
Subtotal 1,316 1,325 100.7% 17.7 1.9 B
Left Turn
Through 1,228 1,160 94.5% 16.7 1.4 B
Right Turn 466 442 94.7% 13.8 3.0 B
Subtotal 1,694 1,602 94.5% 15.9 1.6 B
Left Turn
Through
Right Turn
Subtotal
Left Turn 48 52 107.7% 43.8 4.6 D
Through
Right Turn 177 173 97.9% 9.3 1.0 A
Subtotal 225 225 100.0% 17.2 2.7 B
Total 3,235 3,152 97.4% 16.7 1.2 B
41.7
Intersection 8 Richards Blvd/I-80 EB Ramps Signal
Demand Total Delay (sec/veh)
Direction Movement Volume (vph) Average Percent Average Std. Dev. LOS
Left Turn
Through 1,173 1,178 100.5% 18.2 3.4 B
Right Turn 127 121 95.5% 24.9 6.0 C
Subtotal 1,300 1,300 100.0% 18.9 3.5 B
Left Turn 500 450 90.0% 31.2 3.0 C
Through 776 759 97.8% 13.0 2.9 B
Right Turn
Subtotal 1,276 1,209 94.7% 19.9 2.2 B
Left Turn
Through
Right Turn
Subtotal
Left Turn 742 739 99.6% 30.9 11.2 C
Through
Right Turn 143 146 101.7% 11.4 3.0 B
Subtotal 885 884 99.9% 27.7 9.7 C
Total 3,461 3,392 98.0% 21.6 3.8 C
30.8
NB
SB
EB
WB
Served Volume (vph)
NB
SB
EB
WB
Served Volume (vph)
Fehr & Peers 12/1/2016

Vissim Post-Processor Richards Blvd - Olive Dr Circulation
Average Results from 10 Runs L St Extension - Cumulative Conditions
Volume and Delay by Movement PM Peak Hour
Intersection 9 Research Park Dr/Richards Blvd Signal
Demand Total Delay (sec/veh)
Direction Movement Volume (vph) Average Percent Average Std. Dev. LOS
Left Turn 107 106 99.3% 73.1 12.9 E
Through 25 24 97.2% 33.1 11.7 C
Right Turn 48 48 99.6% 9.7 5.9 A
Subtotal 180 178 99.1% 50.2 10.1 D
Left Turn 44 43 97.7% 98.2 26.7 F
Through 16 16 100.6% 96.9 32.3 F
Right Turn 460 457 99.3% 74.5 30.3 E
Subtotal 520 516 99.2% 77.3 29.4 E
Left Turn 402 392 97.4% 63.8 12.4 E
Through 1,048 1,036 98.8% 23.4 3.0 C
Right Turn 68 68 100.1% 19.3 3.8 B
Subtotal 1,518 1,495 98.5% 34.0 4.4 C
Left Turn 32 32 100.6% 64.8 14.7 E
Through 649 644 99.2% 43.4 7.4 D
Right Turn 59 59 99.5% 16.3 8.1 B
Subtotal 740 735 99.3% 42.3 7.6 D
Total 2,958 2,925 98.9% 44.2 6.6 D
78.1
Served Volume (vph)
NB
SB
EB
WB
Fehr & Peers 12/1/2016

Vissim Post-Processor Richards Blvd - Olive Dr Circulation
Average Results from 10 Runs Olive Dr Off-Ramp Closure - Cumulative Conditions
Volume and Delay by Movement AM Peak Hour
Intersection 1 K St/Third St Side-street Stop
Demand Total Delay (sec/veh)
Direction Movement Volume (vph) Average Percent Average Std. Dev. LOS
Left Turn 3 2 80.0% 0.7 1.0 A
Through 1 1 80.0% 0.0 0.0 A
Right Turn 2 2 90.0% 1.4 2.5 A
Subtotal 6 5 83.3% 2.1 2.2 A
Left Turn 22 21 94.5% 12.6 6.8 B
Through 1 2 160.0% 3.1 5.1 A
Right Turn 77 77 99.6% 7.4 1.4 A
Subtotal 100 99 99.1% 8.7 3.0 A
Left Turn 18 16 90.6% 3.3 5.4 A
Through 266 266 100.1% 3.1 4.0 A
Right Turn 4 4 97.5% 0.5 0.4 A
Subtotal 288 286 99.4% 3.1 4.0 A
Left Turn 2 2 115.0% 3.2 8.5 A
Through 298 293 98.3% 0.4 0.3 A
Right Turn 3 3 103.3% 0.1 0.2 A
Subtotal 303 298 98.4% 0.4 0.4 A
Total 697 689 98.8% 2.7 2.1 A
12.6
Intersection 2 L St/Third St Side-street Stop
Demand Total Delay (sec/veh)
Direction Movement Volume (vph) Average Percent Average Std. Dev. LOS
Left Turn 221 218 98.7% 2.2 0.6 A
Through 191 195 101.9% 0.7 0.2 A
Right Turn
Subtotal 412 413 100.2% 1.4 0.2 A
Left Turn
Through 223 224 100.4% 0.1 0.0 A
Right Turn 82 80 97.4% 0.9 0.2 A
Subtotal 305 304 99.6% 0.3 0.1 A
Left Turn 112 118 105.5% 20.1 4.2 C
Through
Right Turn 178 171 96.1% 17.4 4.0 C
Subtotal 290 289 99.8% 18.5 3.9 C
Left Turn
Through
Right Turn
Subtotal
Total 1,007 1,006 99.9% 6.1 1.4 A
18.3
Served Volume (vph)
NB
SB
EB
WB
Served Volume (vph)
NB
SB
EB
WB
Fehr & Peers 12/2/2016
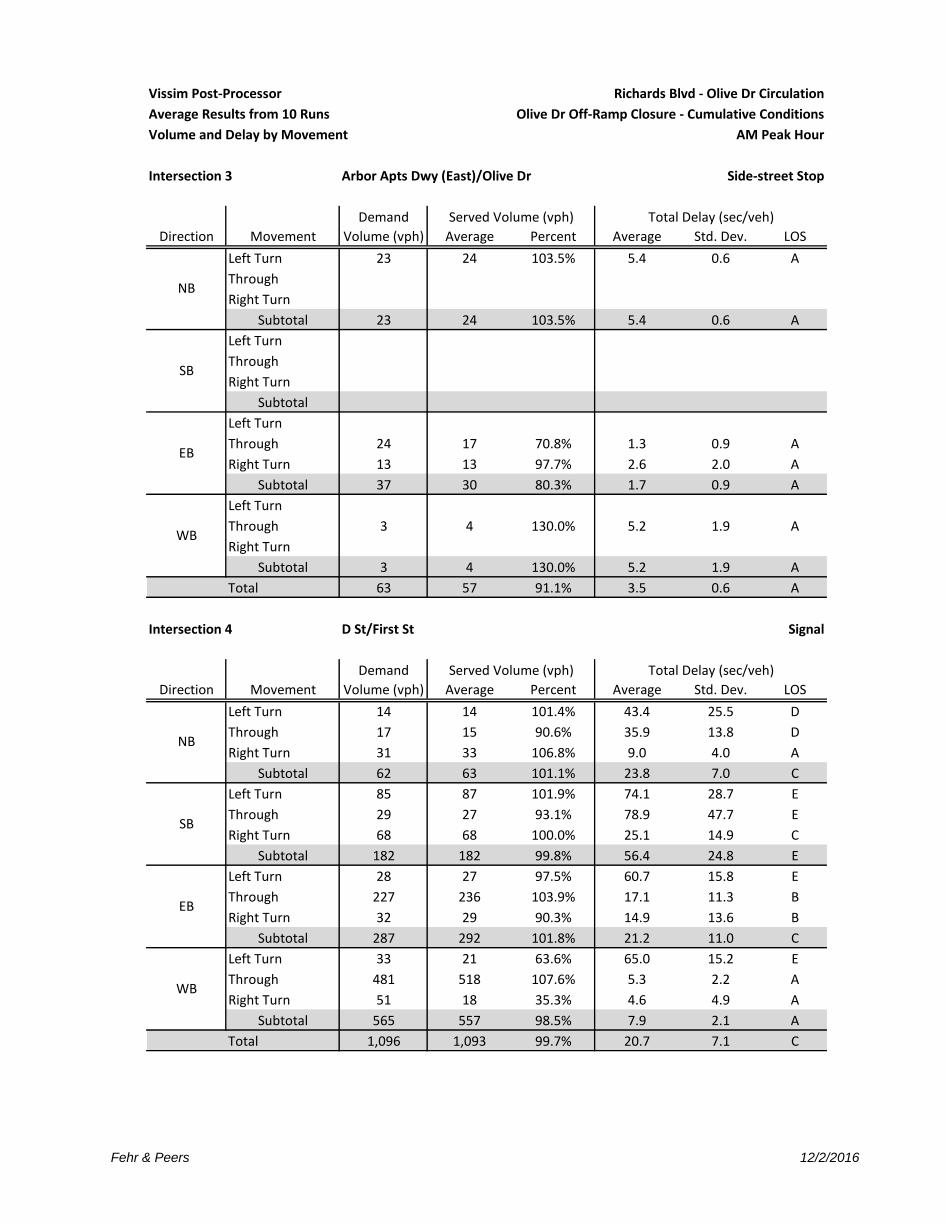
Vissim Post-Processor Richards Blvd - Olive Dr Circulation
Average Results from 10 Runs Olive Dr Off-Ramp Closure - Cumulative Conditions
Volume and Delay by Movement AM Peak Hour
Intersection 3 Arbor Apts Dwy (East)/Olive Dr Side-street Stop
Demand Total Delay (sec/veh)
Direction Movement Volume (vph) Average Percent Average Std. Dev. LOS
Left Turn 23 24 103.5% 5.4 0.6 A
Through
Right Turn
Subtotal 23 24 103.5% 5.4 0.6 A
Left Turn
Through
Right Turn
Subtotal
Left Turn
Through 24 17 70.8% 1.3 0.9 A
Right Turn 13 13 97.7% 2.6 2.0 A
Subtotal 37 30 80.3% 1.7 0.9 A
Left Turn
Through 3 4 130.0% 5.2 1.9 A
Right Turn
Subtotal 3 4 130.0% 5.2 1.9 A
Total 63 57 91.1% 3.5 0.6 A
5.4
Intersection 4 D St/First St Signal
Demand Total Delay (sec/veh)
Direction Movement Volume (vph) Average Percent Average Std. Dev. LOS
Left Turn 14 14 101.4% 43.4 25.5 D
Through 17 15 90.6% 35.9 13.8 D
Right Turn 31 33 106.8% 9.0 4.0 A
Subtotal 62 63 101.1% 23.8 7.0 C
Left Turn 85 87 101.9% 74.1 28.7 E
Through 29 27 93.1% 78.9 47.7 E
Right Turn 68 68 100.0% 25.1 14.9 C
Subtotal 182 182 99.8% 56.4 24.8 E
Left Turn 28 27 97.5% 60.7 15.8 E
Through 227 236 103.9% 17.1 11.3 B
Right Turn 32 29 90.3% 14.9 13.6 B
Subtotal 287 292 101.8% 21.2 11.0 C
Left Turn 33 21 63.6% 65.0 15.2 E
Through 481 518 107.6% 5.3 2.2 A
Right Turn 51 18 35.3% 4.6 4.9 A
Subtotal 565 557 98.5% 7.9 2.1 A
Total 1,096 1,093 99.7% 20.7 7.1 C
64.5
SB
EB
WB
Served Volume (vph)
NB
SB
Served Volume (vph)
NB
EB
WB
Fehr & Peers 12/2/2016

Vissim Post-Processor Richards Blvd - Olive Dr Circulation
Average Results from 10 Runs Olive Dr Off-Ramp Closure - Cumulative Conditions
Volume and Delay by Movement AM Peak Hour
Intersection 5 E St-Richards Blvd/First St Signal
Demand Total Delay (sec/veh)
Direction Movement Volume (vph) Average Percent Average Std. Dev. LOS
Left Turn 524 516 98.5% 42.5 8.9 D
Through 97 100 103.5% 44.6 8.2 D
Right Turn 286 281 98.4% 17.7 6.6 B
Subtotal 907 898 99.0% 34.7 7.9 C
Left Turn 1 1 80.0% 14.2 24.4 B
Through 187 185 99.1% 35.9 4.3 D
Right Turn 16 18 113.8% 19.9 9.1 B
Subtotal 204 204 100.1% 34.8 3.6 C
Left Turn 9 10 105.6% 97.3 38.1 F
Through 76 82 107.4% 82.9 22.3 F
Right Turn 258 268 103.8% 12.9 2.4 B
Subtotal 343 359 104.7% 32.3 8.1 C
Left Turn 209 209 99.8% 62.0 18.4 E
Through 25 25 98.4% 36.0 14.2 D
Right Turn 4 3 85.0% 2.2 4.7 A
Subtotal 238 237 99.4% 59.0 16.8 E
Total 1,692 1,698 100.3% 37.9 4.5 D
76.2
Intersection 6 Richards Blvd/Olive Dr Signal
Demand Total Delay (sec/veh)
Direction Movement Volume (vph) Average Percent Average Std. Dev. LOS
Left Turn 631 653 103.4% 22.3 2.3 C
Through 780 773 99.0% 14.8 2.8 B
Right Turn 58 42 71.7% 0.6 0.3 A
Subtotal 1,469 1,467 99.9% 17.7 1.9 B
Left Turn 54 49 91.5% 58.0 7.2 E
Through 541 560 103.4% 21.4 4.2 C
Right Turn 59 59 99.5% 20.6 8.7 C
Subtotal 654 668 102.1% 23.9 4.6 C
Left Turn 49 48 96.9% 40.7 6.8 D
Through 21 19 90.0% 25.1 12.6 C
Right Turn 182 183 100.7% 6.8 0.9 A
Subtotal 252 250 99.0% 14.7 3.1 B
Left Turn 60 64 107.0% 39.1 4.2 D
Through 33 36 108.5% 45.4 8.2 D
Right Turn 78 77 98.1% 36.6 7.8 D
Subtotal 171 177 103.2% 39.5 5.5 D
Total 2,546 2,561 100.6% 20.5 1.6 C
54.7
WB
Served Volume (vph)
NB
SB
EB
WB
Served Volume (vph)
NB
SB
EB
Fehr & Peers 12/2/2016

Vissim Post-Processor Richards Blvd - Olive Dr Circulation
Average Results from 10 Runs Olive Dr Off-Ramp Closure - Cumulative Conditions
Volume and Delay by Movement AM Peak Hour
Intersection 7 I-80 WB Ramps/Richards Blvd Signal
Demand Total Delay (sec/veh)
Direction Movement Volume (vph) Average Percent Average Std. Dev. LOS
Left Turn 617 601 97.3% 37.6 3.2 D
Through 591 589 99.6% 28.9 14.8 C
Right Turn
Subtotal 1,208 1,189 98.5% 33.0 6.6 C
Left Turn
Through 617 632 102.5% 30.5 2.6 C
Right Turn 167 194 116.0% 6.2 1.4 A
Subtotal 784 826 105.4% 25.0 2.1 C
Left Turn
Through
Right Turn
Subtotal
Left Turn 255 240 94.0% 55.9 17.6 E
Through
Right Turn 882 894 101.4% 93.1 43.8 F
Subtotal 1,137 1,134 99.7% 85.5 38.7 F
Total 3,129 3,149 100.6% 49.9 14.8 D
41.8
Intersection 8 I-80 EB Ramps/Richards Blvd Signal
Demand Total Delay (sec/veh)
Direction Movement Volume (vph) Average Percent Average Std. Dev. LOS
Left Turn
Through 982 978 99.6% 27.5 8.7 C
Right Turn 95 96 101.3% 24.8 8.2 C
Subtotal 1,077 1,074 99.7% 27.3 8.5 C
Left Turn 311 305 98.1% 29.8 4.2 C
Through 561 572 101.9% 11.5 1.5 B
Right Turn
Subtotal 872 877 100.6% 17.9 1.9 B
Left Turn
Through
Right Turn
Subtotal
Left Turn 722 713 98.8% 19.5 1.2 B
Through
Right Turn 226 227 100.4% 20.1 14.5 C
Subtotal 948 940 99.2% 19.4 3.3 B
Total 2,897 2,891 99.8% 22.0 4.2 C
31.5
NB
SB
EB
WB
Served Volume (vph)
NB
SB
EB
WB
Served Volume (vph)
Fehr & Peers 12/2/2016

Vissim Post-Processor Richards Blvd - Olive Dr Circulation
Average Results from 10 Runs Olive Dr Off-Ramp Closure - Cumulative Conditions
Volume and Delay by Movement AM Peak Hour
Intersection 9 Research Park Dr/Richards Blvd Signal
Demand Total Delay (sec/veh)
Direction Movement Volume (vph) Average Percent Average Std. Dev. LOS
Left Turn 85 86 101.6% 64.4 10.8 E
Through 5 5 94.0% 33.5 22.5 C
Right Turn 40 39 98.0% 6.5 3.0 A
Subtotal 130 130 100.2% 44.5 8.6 D
Left Turn 22 23 102.7% 48.8 14.4 D
Through 22 20 92.3% 42.6 17.5 D
Right Turn 136 136 100.2% 16.2 8.1 B
Subtotal 180 179 99.6% 23.5 7.1 C
Left Turn 418 399 95.4% 46.0 5.2 D
Through 718 724 100.9% 13.7 1.9 B
Right Turn 147 160 108.7% 15.4 2.3 B
Subtotal 1,283 1,283 100.0% 23.9 1.9 C
Left Turn 38 38 98.7% 85.0 24.9 F
Through 821 811 98.8% 56.1 19.4 E
Right Turn 23 24 105.7% 30.4 14.0 C
Subtotal 882 873 98.9% 57.0 18.8 E
Total 2,475 2,465 99.6% 36.1 7.1 D
76.7
Served Volume (vph)
NB
SB
EB
WB
Fehr & Peers 12/2/2016

Vissim Post‐Processor Richards Blvd ‐ Olive Dr Circulation
Average Results from 10 Runs Olive Dr Off‐Ramp Closure ‐ Cumulative Conditions
Volume and Delay by Movement PM Peak Hour
Intersection 1 K St/Third St Side‐street Stop
Demand Total Delay (sec/veh)
Direction Movement Volume (vph) Average Percent Average Std. Dev. LOS
Left Turn 4 4 95.0% 2.5 3.0 A
Through 2 2 85.0% 1.3 3.7 A
Right Turn 3 2 80.0% 4.0 5.7 A
Subtotal 9 8 87.8% 4.5 2.6 A
Left Turn 5 4 76.0% 15.0 13.5 C
Through 2 2 80.0% 4.3 6.5 A
Right Turn 16 16 96.9% 7.2 2.5 A
Subtotal 23 21 90.9% 10.0 4.2 A
Left Turn 12 9 75.8% 56.4 50.4 F
Through 358 352 98.3% 75.5 46.2 F
Right Turn 4 4 100.0% 48.7 39.9 E
Subtotal 374 365 97.6% 75.0 46.1 F
Left Turn 4 4 110.0% 2.2 3.7 A
Through 372 368 98.8% 0.2 0.0 A
Right Turn 24 26 107.5% 0.9 0.5 A
Subtotal 400 398 99.5% 0.2 0.1 A
Total 806 792 98.2% 35.9 20.9 E
33.0
Intersection 2 L St/Third St Side‐street Stop
Demand Total Delay (sec/veh)
Direction Movement Volume (vph) Average Percent Average Std. Dev. LOS
Left Turn 268 265 98.8% 2.5 0.5 A
Through 247 250 101.3% 0.7 0.3 A
Right Turn
Subtotal 515 515 100.0% 1.6 0.5 A
Left Turn
Through 408 406 99.5% 0.2 0.1 A
Right Turn 132 132 100.2% 1.1 0.2 A
Subtotal 540 538 99.6% 0.4 0.1 A
Left Turn 94 93 99.3% 44.7 10.5 E
Through
Right Turn 272 265 97.4% 43.2 8.3 E
Subtotal 366 358 97.9% 43.6 8.3 E
Left Turn
Through
Right Turn
Subtotal
Total 1,421 1,412 99.3% 12.3 1.7 B
45.2
Served Volume (vph)
NB
SB
EB
WB
Served Volume (vph)
NB
SB
EB
WB
Fehr & Peers 12/5/2016

Vissim Post‐Processor Richards Blvd ‐ Olive Dr Circulation
Average Results from 10 Runs Olive Dr Off‐Ramp Closure ‐ Cumulative Conditions
Volume and Delay by Movement PM Peak Hour
Intersection 3 Arbor Apts Dwy (East)/Olive Dr Side‐street Stop
Demand Total Delay (sec/veh)
Direction Movement Volume (vph) Average Percent Average Std. Dev. LOS
Left Turn 20 20 99.5% 5.3 0.3 A
Through
Right Turn
Subtotal 20 20 99.5% 5.3 0.3 A
Left Turn
Through
Right Turn
Subtotal
Left Turn
Through 40 23 57.0% 2.9 2.0 A
Right Turn 16 19 118.8% 4.3 2.1 A
Subtotal 56 42 74.6% 3.6 1.4 A
Left Turn
Through 9 4 45.6% 6.1 0.9 A
Right Turn
Subtotal 9 4 45.6% 6.1 0.9 A
Total 85 66 77.4% 4.3 0.9 A
5.2
Intersection 4 D St/First St Signal
Demand Total Delay (sec/veh)
Direction Movement Volume (vph) Average Percent Average Std. Dev. LOS
Left Turn 31 30 97.4% 23.1 8.6 C
Through 46 46 99.8% 24.1 3.1 C
Right Turn 64 64 99.4% 13.2 3.6 B
Subtotal 141 140 99.1% 18.8 3.2 B
Left Turn 187 183 97.8% 76.4 30.7 E
Through 41 45 109.8% 76.5 35.6 E
Right Turn 56 54 95.9% 46.1 26.2 D
Subtotal 284 282 99.2% 71.3 31.2 E
Left Turn 23 22 97.0% 106.4 48.6 F
Through 378 378 100.1% 110.8 55.2 F
Right Turn 62 60 97.4% 92.9 48.2 F
Subtotal 463 461 99.5% 108.8 53.7 F
Left Turn 77 63 81.9% 31.2 5.3 C
Through 372 399 107.2% 14.6 2.4 B
Right Turn 49 29 60.0% 11.2 6.8 B
Subtotal 498 491 98.7% 16.4 2.4 B
Total 1,386 1,374 99.1% 58.2 22.0 E
77.0
SB
EB
WB
Served Volume (vph)
NB
SB
Served Volume (vph)
NB
EB
WB
Fehr & Peers 12/5/2016

Vissim Post‐Processor Richards Blvd ‐ Olive Dr Circulation
Average Results from 10 Runs Olive Dr Off‐Ramp Closure ‐ Cumulative Conditions
Volume and Delay by Movement PM Peak Hour
Intersection 5 E St‐Richards Blvd/First St Signal
Demand Total Delay (sec/veh)
Direction Movement Volume (vph) Average Percent Average Std. Dev. LOS
Left Turn 314 306 97.5% 21.6 5.5 C
Through 185 203 109.6% 22.9 5.1 C
Right Turn 356 381 107.0% 9.6 2.4 A
Subtotal 855 890 104.1% 16.8 3.8 B
Left Turn 6 6 96.7% 66.4 57.4 E
Through 190 188 99.2% 55.7 25.5 E
Right Turn 27 26 94.4% 30.0 28.9 C
Subtotal 223 220 98.5% 53.5 25.7 D
Left Turn 10 9 93.0% 50.8 30.1 D
Through 53 54 100.9% 77.3 13.8 E
Right Turn 566 566 100.0% 18.4 2.9 B
Subtotal 629 629 100.0% 24.6 3.5 C
Left Turn 205 198 96.4% 63.0 27.1 E
Through 157 161 102.2% 42.2 6.9 D
Right Turn 10 10 104.0% 21.6 13.5 C
Subtotal 372 369 99.1% 53.8 17.0 D
Total 2,079 2,107 101.3% 30.1 6.3 C
83.9
Intersection 6 Richards Blvd/Olive Dr Signal
Demand Total Delay (sec/veh)
Direction Movement Volume (vph) Average Percent Average Std. Dev. LOS
Left Turn 227 238 105.0% 37.1 2.5 D
Through 684 742 108.5% 7.3 1.1 A
Right Turn 86 54 62.9% 2.3 1.6 A
Subtotal 997 1,034 103.7% 14.4 0.9 B
Left Turn 110 107 97.3% 68.2 8.8 E
Through 789 786 99.6% 15.6 7.5 B
Right Turn 62 61 98.1% 13.9 6.5 B
Subtotal 961 954 99.3% 21.5 8.7 C
Left Turn 38 17 45.3% 44.9 14.7 D
Through 35 16 46.6% 48.9 17.3 D
Right Turn 455 454 99.8% 15.2 1.7 B
Subtotal 528 487 92.3% 17.3 1.2 B
Left Turn 78 80 102.7% 45.6 5.5 D
Through 24 24 97.9% 41.4 18.1 D
Right Turn 133 127 95.8% 23.5 13.7 C
Subtotal 235 231 98.3% 33.1 10.0 C
Total 2,721 2,707 99.5% 19.0 3.2 B
69.4
WB
Served Volume (vph)
NB
SB
EB
WB
Served Volume (vph)
NB
SB
EB
Fehr & Peers 12/5/2016
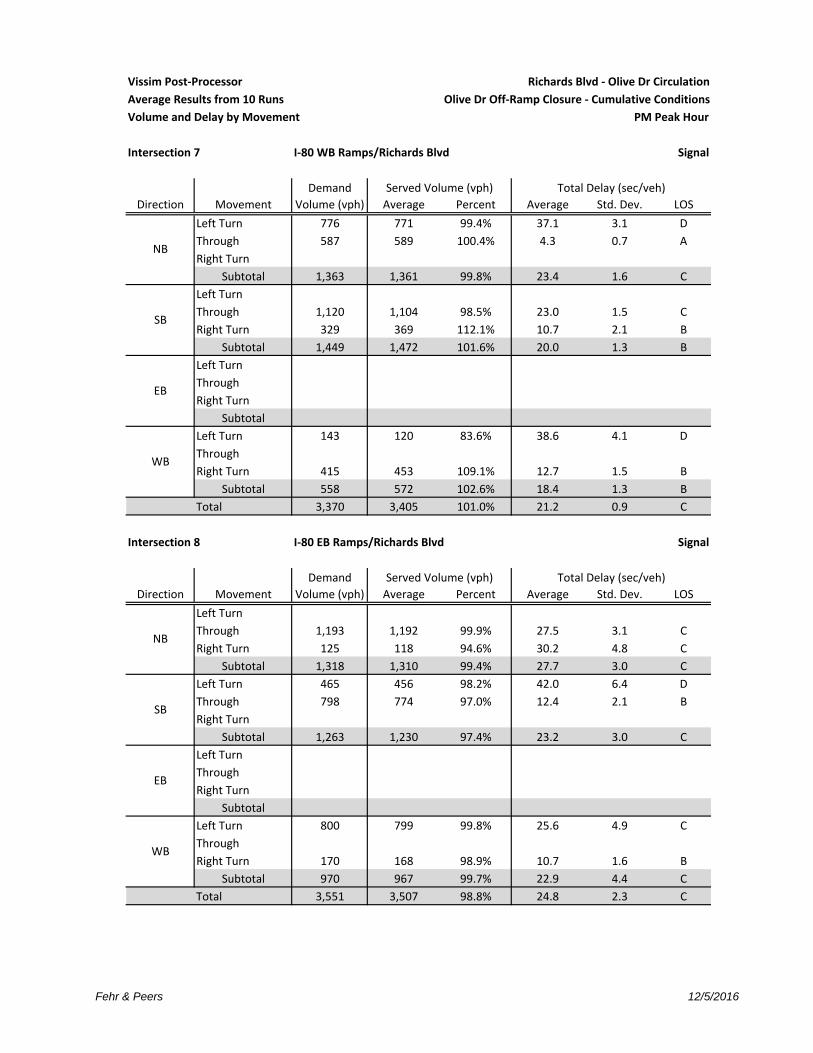
Vissim Post‐Processor Richards Blvd ‐ Olive Dr Circulation
Average Results from 10 Runs Olive Dr Off‐Ramp Closure ‐ Cumulative Conditions
Volume and Delay by Movement PM Peak Hour
Intersection 7 I‐80 WB Ramps/Richards Blvd Signal
Demand Total Delay (sec/veh)
Direction Movement Volume (vph) Average Percent Average Std. Dev. LOS
Left Turn 776 771 99.4% 37.1 3.1 D
Through 587 589 100.4% 4.3 0.7 A
Right Turn
Subtotal 1,363 1,361 99.8% 23.4 1.6 C
Left Turn
Through 1,120 1,104 98.5% 23.0 1.5 C
Right Turn 329 369 112.1% 10.7 2.1 B
Subtotal 1,449 1,472 101.6% 20.0 1.3 B
Left Turn
Through
Right Turn
Subtotal
Left Turn 143 120 83.6% 38.6 4.1 D
Through
Right Turn 415 453 109.1% 12.7 1.5 B
Subtotal 558 572 102.6% 18.4 1.3 B
Total 3,370 3,405 101.0% 21.2 0.9 C
41.5
Intersection 8 I‐80 EB Ramps/Richards Blvd Signal
Demand Total Delay (sec/veh)
Direction Movement Volume (vph) Average Percent Average Std. Dev. LOS
Left Turn
Through 1,193 1,192 99.9% 27.5 3.1 C
Right Turn 125 118 94.6% 30.2 4.8 C
Subtotal 1,318 1,310 99.4% 27.7 3.0 C
Left Turn 465 456 98.2% 42.0 6.4 D
Through 798 774 97.0% 12.4 2.1 B
Right Turn
Subtotal 1,263 1,230 97.4% 23.2 3.0 C
Left Turn
Through
Right Turn
Subtotal
Left Turn 800 799 99.8% 25.6 4.9 C
Through
Right Turn 170 168 98.9% 10.7 1.6 B
Subtotal 970 967 99.7% 22.9 4.4 C
Total 3,551 3,507 98.8% 24.8 2.3 C
39.6
NB
SB
EB
WB
Served Volume (vph)
NB
SB
EB
WB
Served Volume (vph)
Fehr & Peers 12/5/2016
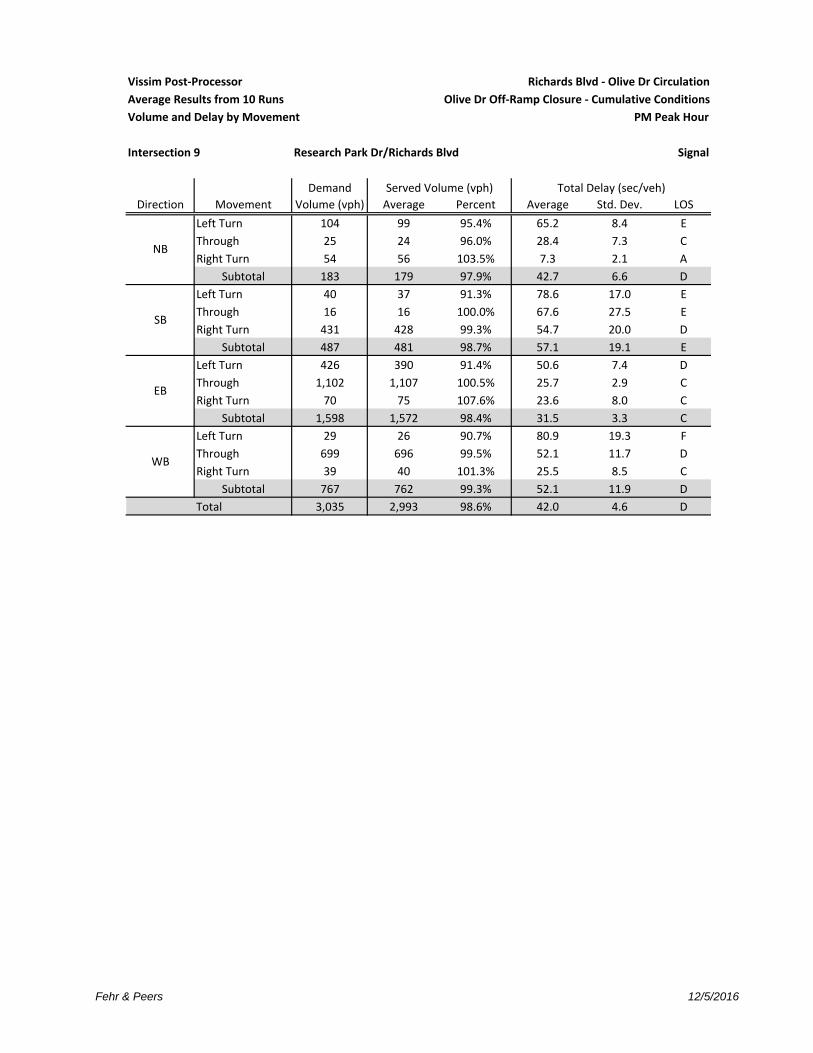
Vissim Post‐Processor Richards Blvd ‐ Olive Dr Circulation
Average Results from 10 Runs Olive Dr Off‐Ramp Closure ‐ Cumulative Conditions
Volume and Delay by Movement PM Peak Hour
Intersection 9 Research Park Dr/Richards Blvd Signal
Demand Total Delay (sec/veh)
Direction Movement Volume (vph) Average Percent Average Std. Dev. LOS
Left Turn 104 99 95.4% 65.2 8.4 E
Through 25 24 96.0% 28.4 7.3 C
Right Turn 54 56 103.5% 7.3 2.1 A
Subtotal 183 179 97.9% 42.7 6.6 D
Left Turn 40 37 91.3% 78.6 17.0 E
Through 16 16 100.0% 67.6 27.5 E
Right Turn 431 428 99.3% 54.7 20.0 D
Subtotal 487 481 98.7% 57.1 19.1 E
Left Turn 426 390 91.4% 50.6 7.4 D
Through 1,102 1,107 100.5% 25.7 2.9 C
Right Turn 70 75 107.6% 23.6 8.0 C
Subtotal 1,598 1,572 98.4% 31.5 3.3 C
Left Turn 29 26 90.7% 80.9 19.3 F
Through 699 696 99.5% 52.1 11.7 D
Right Turn 39 40 101.3% 25.5 8.5 C
Subtotal 767 762 99.3% 52.1 11.9 D
Total 3,035 2,993 98.6% 42.0 4.6 D
68.5
Served Volume (vph)
NB
SB
EB
WB
Fehr & Peers 12/5/2016

Vissim Post‐Processor Richards Blvd ‐ Olive Dr Circulation
Average Results from 10 Runs L St Extension & Olive Dr Off‐Ramp Closure ‐ Cumulative Conditions
Volume and Delay by Movement AM Peak Hour
Intersection 1 K St/Third St Signal
Demand Total Delay (sec/veh)
Direction Movement Volume (vph) Average Percent Average Std. Dev. LOS
Left Turn 196 198 101.2% 32.2 3.0 C
Through 2 1 65.0% 13.8 26.9 B
Right Turn 217 214 98.4% 9.6 1.3 A
Subtotal 415 413 99.5% 20.4 2.3 C
Left Turn 14 13 90.7% 28.6 10.8 C
Through 2 2 105.0% 21.0 24.2 C
Right Turn 16 14 89.4% 6.4 3.8 A
Subtotal 32 29 90.9% 17.1 7.1 B
Left Turn 10 10 98.0% 48.5 27.9 D
Through 131 131 100.2% 35.0 5.6 C
Right Turn 125 123 98.6% 23.7 5.2 C
Subtotal 266 264 99.3% 30.7 5.7 C
Left Turn 256 260 101.4% 18.0 3.1 B
Through 193 191 99.1% 2.4 0.9 A
Right Turn 6 6 106.7% 1.4 2.0 A
Subtotal 455 457 100.5% 11.4 1.8 B
Total 1,168 1,164 99.6% 19.3 2.2 B
50.0
Intersection 2 L St/Third St Signal
Demand Total Delay (sec/veh)
Direction Movement Volume (vph) Average Percent Average Std. Dev. LOS
Left Turn 225 227 100.7% 9.1 2.9 A
Through 310 313 100.9% 1.8 0.9 A
Right Turn
Subtotal 535 539 100.8% 4.8 1.5 A
Left Turn
Through 213 210 98.7% 27.0 3.8 C
Right Turn 230 232 100.7% 10.0 2.2 B
Subtotal 443 442 99.7% 18.1 2.6 B
Left Turn 178 178 99.7% 27.0 2.1 C
Through
Right Turn 184 181 98.6% 8.9 1.1 A
Subtotal 362 359 99.1% 18.0 1.5 B
Left Turn
Through
Right Turn
Subtotal
Total 1,340 1,340 100.0% 13.0 1.1 B
26.2
NB
SB
EB
WB
Served Volume (vph)
NB
SB
EB
WB
Served Volume (vph)
Fehr & Peers 12/2/2016

Vissim Post‐Processor Richards Blvd ‐ Olive Dr Circulation
Average Results from 10 Runs L St Extension & Olive Dr Off‐Ramp Closure ‐ Cumulative Conditions
Volume and Delay by Movement AM Peak Hour
Intersection 3 L St/Olive Dr Signal
Demand Total Delay (sec/veh)
Direction Movement Volume (vph) Average Percent Average Std. Dev. LOS
Left Turn
Through
Right Turn
Subtotal
Left Turn
Through
Right Turn 397 392 98.8% 9.9 0.7 A
Subtotal 397 392 98.8% 9.9 0.7 A
Left Turn 522 527 101.0% 25.5 1.9 C
Through
Right Turn
Subtotal 522 527 101.0% 25.5 1.9 C
Left Turn
Through 17 17 101.8% 21.1 6.4 C
Right Turn 13 12 90.0% 15.9 6.8 B
Subtotal 30 29 96.7% 18.6 4.7 B
Total 949 949 100.0% 18.7 1.2 B
25.4
Intersection 4 D St/First St Signal
Demand Total Delay (sec/veh)
Direction Movement Volume (vph) Average Percent Average Std. Dev. LOS
Left Turn 13 12 92.3% 34.4 18.3 C
Through 16 15 93.1% 39.7 20.4 D
Right Turn 29 31 106.6% 6.6 1.5 A
Subtotal 58 58 99.7% 22.3 7.7 C
Left Turn 61 60 98.4% 40.1 7.2 D
Through 24 24 100.0% 43.7 18.0 D
Right Turn 20 20 98.5% 17.5 14.7 B
Subtotal 105 104 98.8% 37.7 10.3 D
Left Turn 3 2 70.0% 21.8 30.5 C
Through 334 337 101.0% 15.0 5.1 B
Right Turn 33 34 103.6% 14.1 7.0 B
Subtotal 370 374 101.0% 15.1 5.1 B
Left Turn 34 35 101.8% 53.7 6.7 D
Through 561 554 98.7% 6.9 1.7 A
Right Turn 51 50 97.5% 4.4 1.7 A
Subtotal 646 638 98.8% 9.2 1.6 A
Total 1,179 1,173 99.5% 14.1 2.5 B
56.1
EB
WB
Served Volume (vph)
NB
SB
Served Volume (vph)
NB
SB
EB
WB
Fehr & Peers 12/2/2016
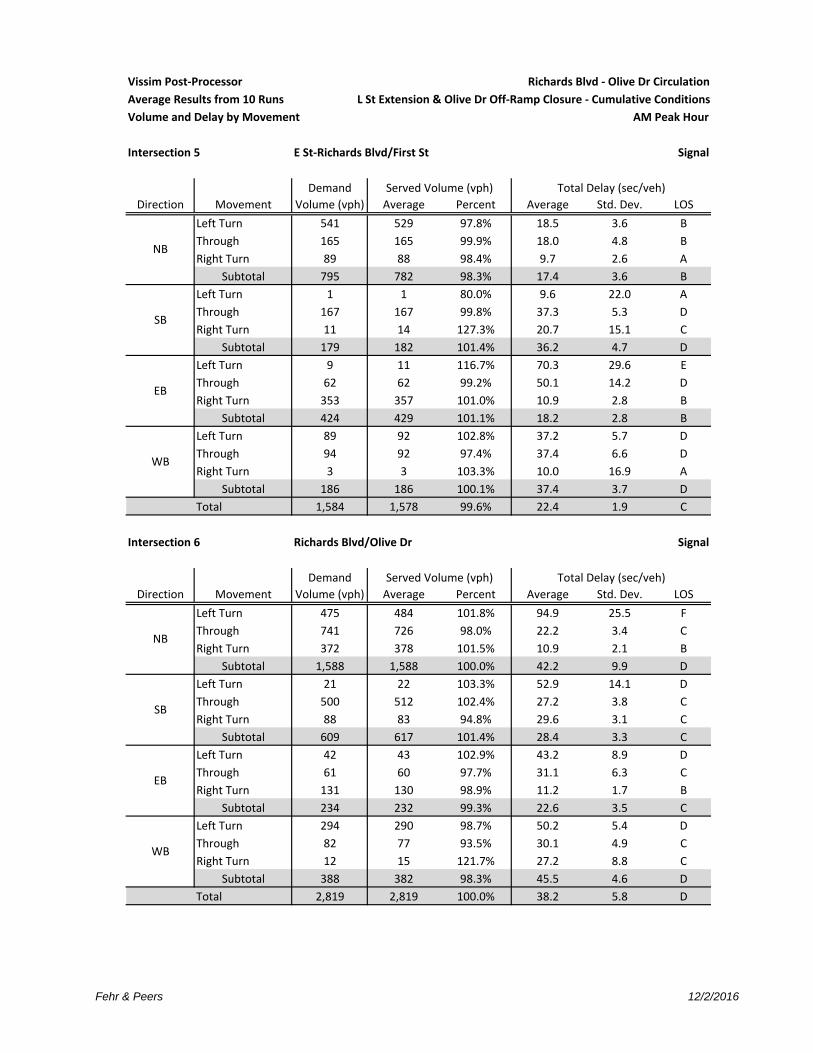
Vissim Post‐Processor Richards Blvd ‐ Olive Dr Circulation
Average Results from 10 Runs L St Extension & Olive Dr Off‐Ramp Closure ‐ Cumulative Conditions
Volume and Delay by Movement AM Peak Hour
Intersection 5 E St‐Richards Blvd/First St Signal
Demand Total Delay (sec/veh)
Direction Movement Volume (vph) Average Percent Average Std. Dev. LOS
Left Turn 541 529 97.8% 18.5 3.6 B
Through 165 165 99.9% 18.0 4.8 B
Right Turn 89 88 98.4% 9.7 2.6 A
Subtotal 795 782 98.3% 17.4 3.6 B
Left Turn 1 1 80.0% 9.6 22.0 A
Through 167 167 99.8% 37.3 5.3 D
Right Turn 11 14 127.3% 20.7 15.1 C
Subtotal 179 182 101.4% 36.2 4.7 D
Left Turn 9 11 116.7% 70.3 29.6 E
Through 62 62 99.2% 50.1 14.2 D
Right Turn 353 357 101.0% 10.9 2.8 B
Subtotal 424 429 101.1% 18.2 2.8 B
Left Turn 89 92 102.8% 37.2 5.7 D
Through 94 92 97.4% 37.4 6.6 D
Right Turn 3 3 103.3% 10.0 16.9 A
Subtotal 186 186 100.1% 37.4 3.7 D
Total 1,584 1,578 99.6% 22.4 1.9 C
52.3
Intersection 6 Richards Blvd/Olive Dr Signal
Demand Total Delay (sec/veh)
Direction Movement Volume (vph) Average Percent Average Std. Dev. LOS
Left Turn 475 484 101.8% 94.9 25.5 F
Through 741 726 98.0% 22.2 3.4 C
Right Turn 372 378 101.5% 10.9 2.1 B
Subtotal 1,588 1,588 100.0% 42.2 9.9 D
Left Turn 21 22 103.3% 52.9 14.1 D
Through 500 512 102.4% 27.2 3.8 C
Right Turn 88 83 94.8% 29.6 3.1 C
Subtotal 609 617 101.4% 28.4 3.3 C
Left Turn 42 43 102.9% 43.2 8.9 D
Through 61 60 97.7% 31.1 6.3 C
Right Turn 131 130 98.9% 11.2 1.7 B
Subtotal 234 232 99.3% 22.6 3.5 C
Left Turn 294 290 98.7% 50.2 5.4 D
Through 82 77 93.5% 30.1 4.9 C
Right Turn 12 15 121.7% 27.2 8.8 C
Subtotal 388 382 98.3% 45.5 4.6 D
Total 2,819 2,819 100.0% 38.2 5.8 D
53.1
WB
Served Volume (vph)
NB
SB
EB
WB
Served Volume (vph)
NB
SB
EB
Fehr & Peers 12/2/2016
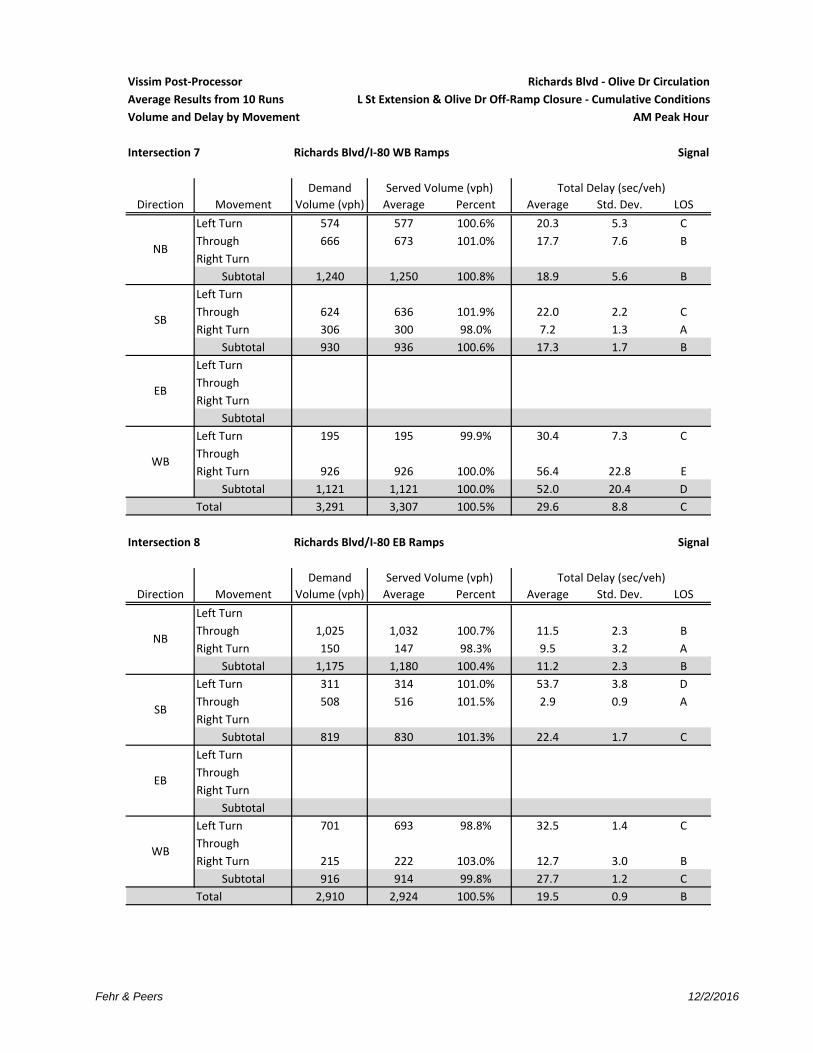
Vissim Post‐Processor Richards Blvd ‐ Olive Dr Circulation
Average Results from 10 Runs L St Extension & Olive Dr Off‐Ramp Closure ‐ Cumulative Conditions
Volume and Delay by Movement AM Peak Hour
Intersection 7 Richards Blvd/I‐80 WB Ramps Signal
Demand Total Delay (sec/veh)
Direction Movement Volume (vph) Average Percent Average Std. Dev. LOS
Left Turn 574 577 100.6% 20.3 5.3 C
Through 666 673 101.0% 17.7 7.6 B
Right Turn
Subtotal 1,240 1,250 100.8% 18.9 5.6 B
Left Turn
Through 624 636 101.9% 22.0 2.2 C
Right Turn 306 300 98.0% 7.2 1.3 A
Subtotal 930 936 100.6% 17.3 1.7 B
Left Turn
Through
Right Turn
Subtotal
Left Turn 195 195 99.9% 30.4 7.3 C
Through
Right Turn 926 926 100.0% 56.4 22.8 E
Subtotal 1,121 1,121 100.0% 52.0 20.4 D
Total 3,291 3,307 100.5% 29.6 8.8 C
29.5
Intersection 8 Richards Blvd/I‐80 EB Ramps Signal
Demand Total Delay (sec/veh)
Direction Movement Volume (vph) Average Percent Average Std. Dev. LOS
Left Turn
Through 1,025 1,032 100.7% 11.5 2.3 B
Right Turn 150 147 98.3% 9.5 3.2 A
Subtotal 1,175 1,180 100.4% 11.2 2.3 B
Left Turn 311 314 101.0% 53.7 3.8 D
Through 508 516 101.5% 2.9 0.9 A
Right Turn
Subtotal 819 830 101.3% 22.4 1.7 C
Left Turn
Through
Right Turn
Subtotal
Left Turn 701 693 98.8% 32.5 1.4 C
Through
Right Turn 215 222 103.0% 12.7 3.0 B
Subtotal 916 914 99.8% 27.7 1.2 C
Total 2,910 2,924 100.5% 19.5 0.9 B
53.1
NB
SB
EB
WB
Served Volume (vph)
NB
SB
EB
WB
Served Volume (vph)
Fehr & Peers 12/2/2016

Vissim Post‐Processor Richards Blvd ‐ Olive Dr Circulation
Average Results from 10 Runs L St Extension & Olive Dr Off‐Ramp Closure ‐ Cumulative Conditions
Volume and Delay by Movement AM Peak Hour
Intersection 9 Research Park Dr/Richards Blvd Signal
Demand Total Delay (sec/veh)
Direction Movement Volume (vph) Average Percent Average Std. Dev. LOS
Left Turn 89 85 96.0% 41.0 7.4 D
Through 5 5 108.0% 20.6 20.5 C
Right Turn 41 42 101.5% 5.5 0.8 A
Subtotal 135 132 98.1% 29.0 8.0 C
Left Turn 31 33 105.2% 40.9 8.1 D
Through 21 21 99.0% 32.8 11.9 C
Right Turn 158 155 98.4% 13.4 3.5 B
Subtotal 210 209 99.4% 19.0 4.8 B
Left Turn 357 357 100.1% 31.3 7.0 C
Through 716 719 100.4% 17.1 2.1 B
Right Turn 136 132 97.1% 19.1 1.8 B
Subtotal 1,209 1,208 100.0% 21.4 2.1 C
Left Turn 63 61 97.1% 98.2 20.8 F
Through 893 896 100.3% 79.8 17.4 E
Right Turn 70 63 90.0% 60.5 17.4 E
Subtotal 1,026 1,020 99.4% 79.7 17.2 E
Total 2,580 2,570 99.6% 45.3 6.2 D
74.5
SB
EB
WB
Served Volume (vph)
NB
Fehr & Peers 12/2/2016
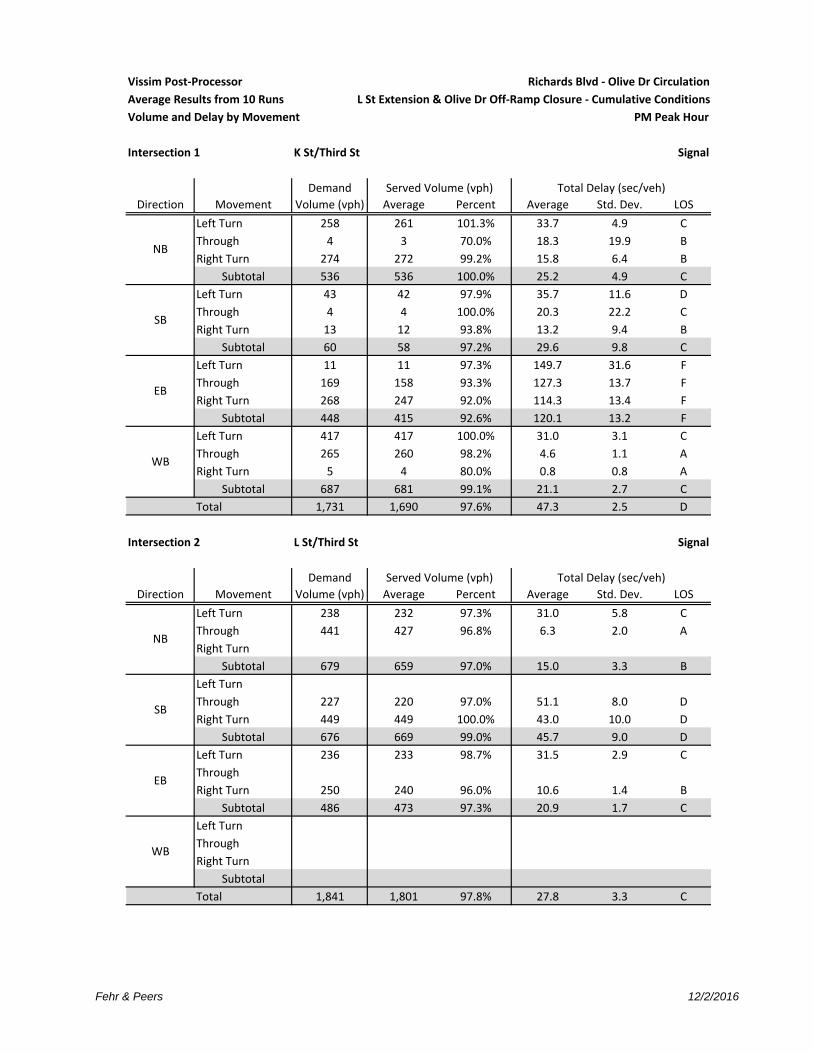
Vissim Post‐Processor Richards Blvd ‐ Olive Dr Circulation
Average Results from 10 Runs L St Extension & Olive Dr Off‐Ramp Closure ‐ Cumulative Conditions
Volume and Delay by Movement PM Peak Hour
Intersection 1 K St/Third St Signal
Demand Total Delay (sec/veh)
Direction Movement Volume (vph) Average Percent Average Std. Dev. LOS
Left Turn 258 261 101.3% 33.7 4.9 C
Through 4 3 70.0% 18.3 19.9 B
Right Turn 274 272 99.2% 15.8 6.4 B
Subtotal 536 536 100.0% 25.2 4.9 C
Left Turn 43 42 97.9% 35.7 11.6 D
Through 4 4 100.0% 20.3 22.2 C
Right Turn 13 12 93.8% 13.2 9.4 B
Subtotal 60 58 97.2% 29.6 9.8 C
Left Turn 11 11 97.3% 149.7 31.6 F
Through 169 158 93.3% 127.3 13.7 F
Right Turn 268 247 92.0% 114.3 13.4 F
Subtotal 448 415 92.6% 120.1 13.2 F
Left Turn 417 417 100.0% 31.0 3.1 C
Through 265 260 98.2% 4.6 1.1 A
Right Turn 5 4 80.0% 0.8 0.8 A
Subtotal 687 681 99.1% 21.1 2.7 C
Total 1,731 1,690 97.6% 47.3 2.5 D
126.4
Intersection 2 L St/Third St Signal
Demand Total Delay (sec/veh)
Direction Movement Volume (vph) Average Percent Average Std. Dev. LOS
Left Turn 238 232 97.3% 31.0 5.8 C
Through 441 427 96.8% 6.3 2.0 A
Right Turn
Subtotal 679 659 97.0% 15.0 3.3 B
Left Turn
Through 227 220 97.0% 51.1 8.0 D
Right Turn 449 449 100.0% 43.0 10.0 D
Subtotal 676 669 99.0% 45.7 9.0 D
Left Turn 236 233 98.7% 31.5 2.9 C
Through
Right Turn 250 240 96.0% 10.6 1.4 B
Subtotal 486 473 97.3% 20.9 1.7 C
Left Turn
Through
Right Turn
Subtotal
Total 1,841 1,801 97.8% 27.8 3.3 C
39.8
Served Volume (vph)
NB
SB
EB
WB
Served Volume (vph)
NB
SB
EB
WB
Fehr & Peers 12/2/2016

Vissim Post‐Processor Richards Blvd ‐ Olive Dr Circulation
Average Results from 10 Runs L St Extension & Olive Dr Off‐Ramp Closure ‐ Cumulative Conditions
Volume and Delay by Movement PM Peak Hour
Intersection 3 L St/Olive Dr Signal
Demand Total Delay (sec/veh)
Direction Movement Volume (vph) Average Percent Average Std. Dev. LOS
Left Turn
Through
Right Turn
Subtotal
Left Turn
Through
Right Turn 477 460 96.5% 5.3 0.7 A
Subtotal 477 460 96.5% 5.3 0.7 A
Left Turn 662 645 97.4% 9.6 3.1 A
Through
Right Turn
Subtotal 662 645 97.4% 9.6 3.1 A
Left Turn
Through 19 17 90.5% 39.4 8.4 D
Right Turn 17 14 81.8% 16.4 8.4 B
Subtotal 36 31 86.4% 30.5 6.9 C
Total 1,175 1,136 96.7% 8.4 2.0 A
38.6
Intersection 4 D St/First St Signal
Demand Total Delay (sec/veh)
Direction Movement Volume (vph) Average Percent Average Std. Dev. LOS
Left Turn 31 29 92.3% 51.5 13.9 D
Through 44 44 99.1% 62.0 23.3 E
Right Turn 64 68 106.6% 23.6 7.7 C
Subtotal 139 140 101.0% 40.6 11.0 D
Left Turn 177 124 69.8% 344.7 76.8 F
Through 39 27 68.2% 340.8 87.9 F
Right Turn 32 23 71.6% 284.1 86.7 F
Subtotal 248 173 69.8% 334.2 76.6 F
Left Turn 22 22 99.5% 217.8 69.3 F
Through 444 419 94.4% 198.0 36.9 F
Right Turn 61 56 92.3% 206.4 56.5 F
Subtotal 527 497 94.3% 199.6 39.6 F
Left Turn 78 75 96.4% 42.5 11.8 D
Through 427 426 99.8% 9.4 2.2 A
Right Turn 49 48 97.3% 9.1 4.3 A
Subtotal 554 549 99.1% 14.6 3.6 B
Total 1,468 1,360 92.6% 122.5 11.6 F
261.0
SB
EB
WB
Served Volume (vph)
NB
SB
Served Volume (vph)
NB
EB
WB
Fehr & Peers 12/2/2016
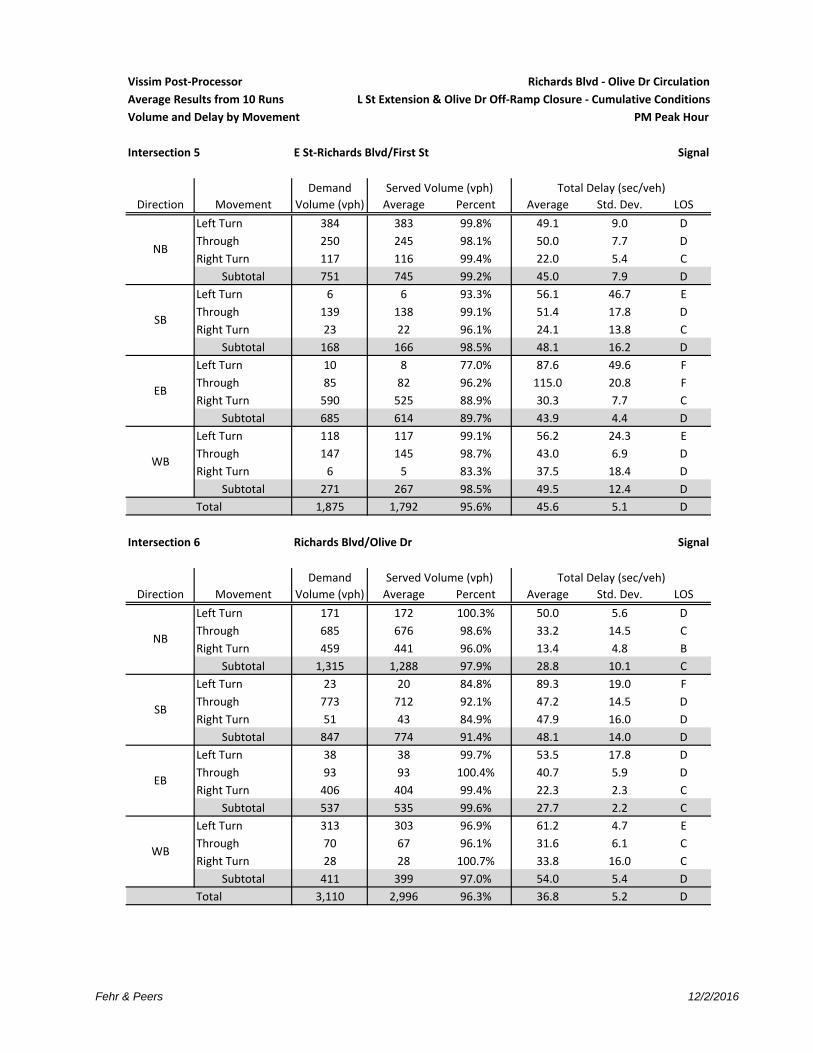
Vissim Post‐Processor Richards Blvd ‐ Olive Dr Circulation
Average Results from 10 Runs L St Extension & Olive Dr Off‐Ramp Closure ‐ Cumulative Conditions
Volume and Delay by Movement PM Peak Hour
Intersection 5 E St‐Richards Blvd/First St Signal
Demand Total Delay (sec/veh)
Direction Movement Volume (vph) Average Percent Average Std. Dev. LOS
Left Turn 384 383 99.8% 49.1 9.0 D
Through 250 245 98.1% 50.0 7.7 D
Right Turn 117 116 99.4% 22.0 5.4 C
Subtotal 751 745 99.2% 45.0 7.9 D
Left Turn 6 6 93.3% 56.1 46.7 E
Through 139 138 99.1% 51.4 17.8 D
Right Turn 23 22 96.1% 24.1 13.8 C
Subtotal 168 166 98.5% 48.1 16.2 D
Left Turn 10 8 77.0% 87.6 49.6 F
Through 85 82 96.2% 115.0 20.8 F
Right Turn 590 525 88.9% 30.3 7.7 C
Subtotal 685 614 89.7% 43.9 4.4 D
Left Turn 118 117 99.1% 56.2 24.3 E
Through 147 145 98.7% 43.0 6.9 D
Right Turn 6 5 83.3% 37.5 18.4 D
Subtotal 271 267 98.5% 49.5 12.4 D
Total 1,875 1,792 95.6% 45.6 5.1 D
116.6
Intersection 6 Richards Blvd/Olive Dr Signal
Demand Total Delay (sec/veh)
Direction Movement Volume (vph) Average Percent Average Std. Dev. LOS
Left Turn 171 172 100.3% 50.0 5.6 D
Through 685 676 98.6% 33.2 14.5 C
Right Turn 459 441 96.0% 13.4 4.8 B
Subtotal 1,315 1,288 97.9% 28.8 10.1 C
Left Turn 23 20 84.8% 89.3 19.0 F
Through 773 712 92.1% 47.2 14.5 D
Right Turn 51 43 84.9% 47.9 16.0 D
Subtotal 847 774 91.4% 48.1 14.0 D
Left Turn 38 38 99.7% 53.5 17.8 D
Through 93 93 100.4% 40.7 5.9 D
Right Turn 406 404 99.4% 22.3 2.3 C
Subtotal 537 535 99.6% 27.7 2.2 C
Left Turn 313 303 96.9% 61.2 4.7 E
Through 70 67 96.1% 31.6 6.1 C
Right Turn 28 28 100.7% 33.8 16.0 C
Subtotal 411 399 97.0% 54.0 5.4 D
Total 3,110 2,996 96.3% 36.8 5.2 D
78.2
WB
Served Volume (vph)
NB
SB
EB
WB
Served Volume (vph)
NB
SB
EB
Fehr & Peers 12/2/2016

Vissim Post‐Processor Richards Blvd ‐ Olive Dr Circulation
Average Results from 10 Runs L St Extension & Olive Dr Off‐Ramp Closure ‐ Cumulative Conditions
Volume and Delay by Movement PM Peak Hour
Intersection 7 Richards Blvd/I‐80 WB Ramps Signal
Demand Total Delay (sec/veh)
Direction Movement Volume (vph) Average Percent Average Std. Dev. LOS
Left Turn 595 580 97.4% 31.8 5.1 C
Through 832 813 97.7% 24.8 19.4 C
Right Turn
Subtotal 1,427 1,392 97.6% 28.0 12.8 C
Left Turn
Through 1,157 1,099 95.0% 33.0 5.9 C
Right Turn 475 457 96.3% 16.3 3.8 B
Subtotal 1,632 1,556 95.3% 27.9 5.2 C
Left Turn
Through
Right Turn
Subtotal
Left Turn 112 114 101.6% 29.8 4.8 C
Through
Right Turn 503 500 99.4% 25.9 6.4 C
Subtotal 615 614 99.8% 26.6 4.9 C
Total 3,674 3,562 96.9% 27.7 4.9 C
31.0
Intersection 8 Richards Blvd/I‐80 EB Ramps Signal
Demand Total Delay (sec/veh)
Direction Movement Volume (vph) Average Percent Average Std. Dev. LOS
Left Turn
Through 1,284 1,244 96.8% 22.6 10.6 C
Right Turn 136 133 97.6% 24.2 10.0 C
Subtotal 1,420 1,376 96.9% 22.7 10.5 C
Left Turn 474 428 90.3% 48.5 4.2 D
Through 795 783 98.5% 7.2 1.9 A
Right Turn
Subtotal 1,269 1,211 95.4% 21.7 3.3 C
Left Turn
Through
Right Turn
Subtotal
Left Turn 703 694 98.7% 32.2 1.5 C
Through
Right Turn 143 149 103.9% 22.4 21.9 C
Subtotal 846 842 99.6% 30.5 3.9 C
Total 3,535 3,430 97.0% 24.3 5.3 C
47.6
NB
SB
EB
WB
Served Volume (vph)
NB
SB
EB
WB
Served Volume (vph)
Fehr & Peers 12/2/2016

Vissim Post‐Processor Richards Blvd ‐ Olive Dr Circulation
Average Results from 10 Runs L St Extension & Olive Dr Off‐Ramp Closure ‐ Cumulative Conditions
Volume and Delay by Movement PM Peak Hour
Intersection 9 Research Park Dr/Richards Blvd Signal
Demand Total Delay (sec/veh)
Direction Movement Volume (vph) Average Percent Average Std. Dev. LOS
Left Turn 118 115 97.0% 43.2 4.6 D
Through 24 24 100.0% 27.9 17.3 C
Right Turn 46 49 106.7% 7.4 5.4 A
Subtotal 188 188 99.8% 31.5 5.5 C
Left Turn 59 55 92.9% 130.7 20.7 F
Through 14 12 85.7% 106.2 58.4 F
Right Turn 507 464 91.6% 124.1 11.8 F
Subtotal 580 531 91.6% 124.9 12.3 F
Left Turn 375 361 96.3% 35.6 7.2 D
Through 1,053 1,039 98.7% 18.7 1.5 B
Right Turn 70 72 102.9% 18.3 3.5 B
Subtotal 1,498 1,473 98.3% 22.9 2.2 C
Left Turn 29 27 93.8% 51.9 11.4 D
Through 711 707 99.4% 42.1 12.2 D
Right Turn 65 63 97.5% 17.5 11.2 B
Subtotal 805 798 99.1% 40.6 12.0 D
Total 3,071 2,989 97.3% 46.4 4.5 D
78.9
Served Volume (vph)
NB
SB
EB
WB
Fehr & Peers 12/2/2016

Vissim Post-Processor Richards Blvd - Olive Dr Circulation
Average Results from 10 Runs No Build - Cumulative Conditions
Queue Length AM Peak Hour
Intersection 1 K St/Third St Side-street Stop
Storage Average Queue (ft) Maximum Queue (ft) Exceeds
Direction Movement (ft) Average Std. Dev. Minimum Maximum Average Std. Dev. Minimum Maximum Storage?
U Turn
Second Left
Left Turn 360 0 0 0 0 13 12 0 24 NO
Through 360 0 0 0 0 14 12 0 25 NO
Right Turn 360 0 0 0 0 2 7 0 21 NO
Second Right
U Turn
Second Left
Left Turn 420 3 1 2 4 67 15 51 91 NO
Through 3,700 3 1 2 4 67 15 51 91 NO
Right Turn 420 3 1 2 4 67 15 51 91 NO
Second Right
U Turn
Second Left
Left Turn 250 1 1 0 3 51 45 0 137 NO
Through 250 0 0 0 0 0 0 0 0 NO
Right Turn 250 1 1 0 3 54 46 0 142 NO
Second Right
U Turn
Second Left
Left Turn 250 0 0 0 0 26 16 0 48 NO
Through 250 0 0 0 0 73 14 66 104 NO
Right Turn 250 0 0 0 0 33 21 0 59 NO
Second Right
NB
SB
EB
WB
Fehr & Peers 12/2/2016
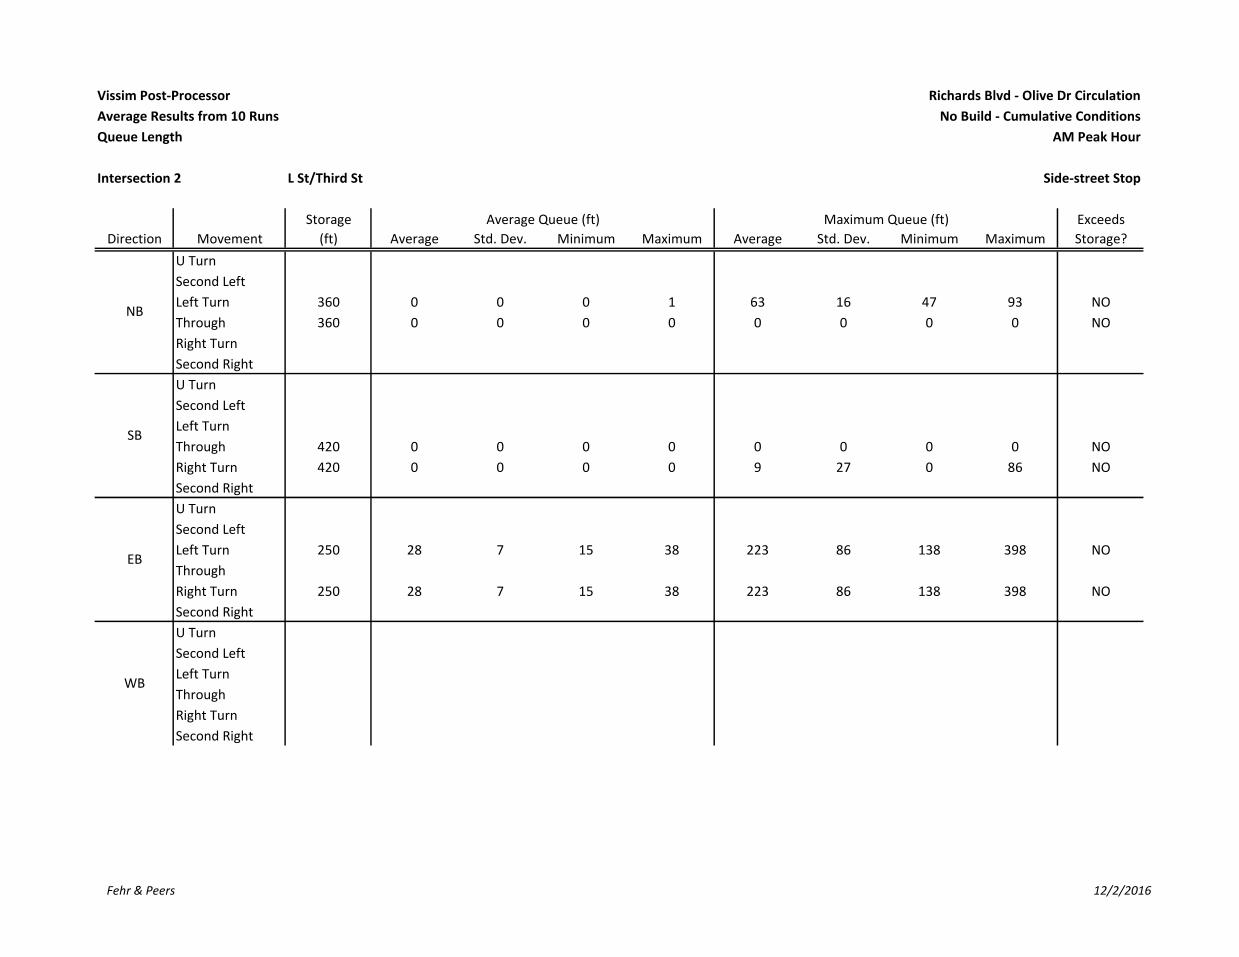
Vissim Post-Processor Richards Blvd - Olive Dr Circulation
Average Results from 10 Runs No Build - Cumulative Conditions
Queue Length AM Peak Hour
Intersection 2 L St/Third St Side-street Stop
Storage Average Queue (ft) Maximum Queue (ft) Exceeds
Direction Movement (ft) Average Std. Dev. Minimum Maximum Average Std. Dev. Minimum Maximum Storage?
U Turn
Second Left
Left Turn 360 0 0 0 1 63 16 47 93 NO
Through 360 0 0 0 0 0 0 0 0 NO
Right Turn
Second Right
U Turn
Second Left
Left Turn
Through 420 0 0 0 0 0 0 0 0 NO
Right Turn 420 0 0 0 0 9 27 0 86 NO
Second Right
U Turn
Second Left
Left Turn 250 28 7 15 38 223 86 138 398 NO
Through
Right Turn 250 28 7 15 38 223 86 138 398 NO
Second Right
U Turn
Second Left
Left Turn
Through
Right Turn
Second Right
NB
SB
EB
WB
Fehr & Peers 12/2/2016

Vissim Post-Processor Richards Blvd - Olive Dr Circulation
Average Results from 10 Runs No Build - Cumulative Conditions
Queue Length AM Peak Hour
Intersection 3 Arbor Apts Dwy (East)/Olive Dr Side-street Stop
Storage Average Queue (ft) Maximum Queue (ft) Exceeds
Direction Movement (ft) Average Std. Dev. Minimum Maximum Average Std. Dev. Minimum Maximum Storage?
U Turn
Second Left
Left Turn 460 0 0 0 0 36 16 23 60 NO
Through
Right Turn
Second Right
U Turn
Second Left
Left Turn
Through
Right Turn
Second Right
U Turn
Second Left
Left Turn
Through 2,000 4 11 0 35 46 119 0 376 NO
Right Turn 2,000 0 0 0 0 9 11 0 25 NO
Second Right
U Turn
Second Left
Left Turn 1,400 0 0 0 0 2 7 0 22 NO
Through 1,400 0 0 0 0 0 0 0 0 NO
Right Turn
Second Right
SB
EB
WB
NB
Fehr & Peers 12/2/2016
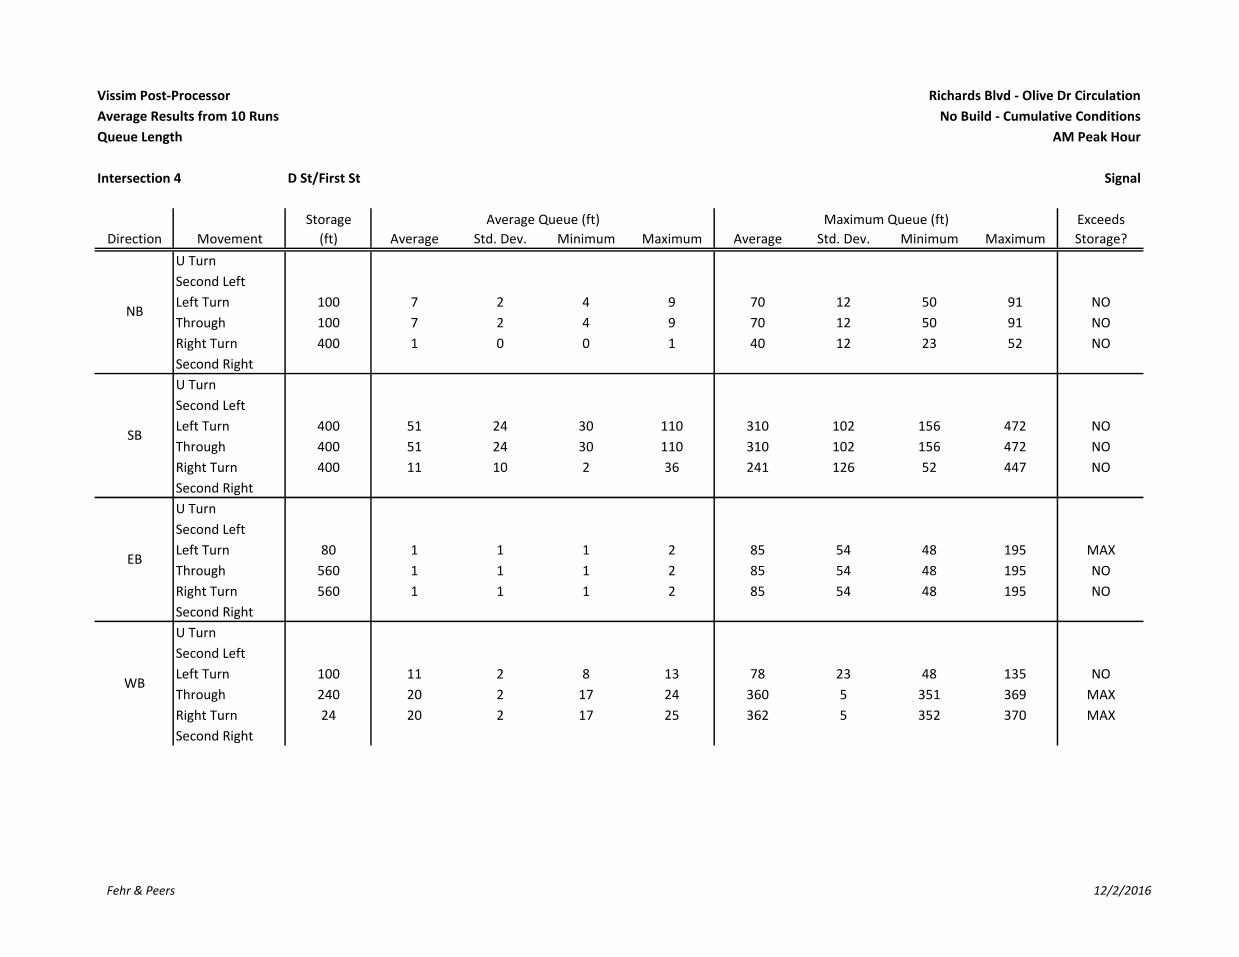
Vissim Post-Processor Richards Blvd - Olive Dr Circulation
Average Results from 10 Runs No Build - Cumulative Conditions
Queue Length AM Peak Hour
Intersection 4 D St/First St Signal
Storage Average Queue (ft) Maximum Queue (ft) Exceeds
Direction Movement (ft) Average Std. Dev. Minimum Maximum Average Std. Dev. Minimum Maximum Storage?
U Turn
Second Left
Left Turn 100 7 2 4 9 70 12 50 91 NO
Through 100 7 2 4 9 70 12 50 91 NO
Right Turn 400 1 0 0 1 40 12 23 52 NO
Second Right
U Turn
Second Left
Left Turn 400 51 24 30 110 310 102 156 472 NO
Through 400 51 24 30 110 310 102 156 472 NO
Right Turn 400 11 10 2 36 241 126 52 447 NO
Second Right
U Turn
Second Left
Left Turn 80 1 1 1 2 85 54 48 195 MAX
Through 560 1 1 1 2 85 54 48 195 NO
Right Turn 560 1 1 1 2 85 54 48 195 NO
Second Right
U Turn
Second Left
Left Turn 100 11 2 8 13 78 23 48 135 NO
Through 240 20 2 17 24 360 5 351 369 MAX
Right Turn 24 20 2 17 25 362 5 352 370 MAX
Second Right
NB
SB
EB
WB
Fehr & Peers 12/2/2016

Vissim Post-Processor Richards Blvd - Olive Dr Circulation
Average Results from 10 Runs No Build - Cumulative Conditions
Queue Length AM Peak Hour
Intersection 5 E St-Richards Blvd/First St Signal
Storage Average Queue (ft) Maximum Queue (ft) Exceeds
Direction Movement (ft) Average Std. Dev. Minimum Maximum Average Std. Dev. Minimum Maximum Storage?
U Turn
Second Left
Left Turn 640 50 9 36 62 220 10 210 231 NO
Through 640 50 9 36 62 220 10 210 231 NO
Right Turn 180 50 9 36 62 220 10 210 231 MAX
Second Right
U Turn
Second Left
Left Turn
Through 400 46 3 39 49 253 33 211 302 NO
Right Turn 400 5 3 1 13 194 69 80 294 NO
Second Right
U Turn
Second Left
Left Turn 100 54 22 28 87 357 123 176 494 MAX
Through 220 54 22 28 87 357 123 176 494 MAX
Right Turn 200 28 5 22 37 375 73 267 489 MAX
Second Right
U Turn
Second Left
Left Turn 220 78 16 59 112 317 74 246 468 MAX
Through 240 78 16 59 112 317 74 246 468 MAX
Right Turn 240 78 16 59 112 317 74 246 468 MAX
Second Right
NB
SB
EB
WB
Fehr & Peers 12/2/2016

Vissim Post-Processor Richards Blvd - Olive Dr Circulation
Average Results from 10 Runs No Build - Cumulative Conditions
Queue Length AM Peak Hour
Intersection 6 Richards Blvd/Olive Dr Signal
Storage Average Queue (ft) Maximum Queue (ft) Exceeds
Direction Movement (ft) Average Std. Dev. Minimum Maximum Average Std. Dev. Minimum Maximum Storage?
U Turn
Second Left
Left Turn 100 247 34 187 301 572 8 566 586 AVG
Through 1,540 224 37 163 283 565 8 559 579 NO
Right Turn 100 0 0 0 0 28 17 21 77 NO
Second Right
U Turn
Second Left
Left Turn 590 19 5 11 25 394 179 91 718 NO
Through 590 99 16 79 124 684 68 548 751 MAX
Right Turn 250 7 5 1 15 262 67 126 329 MAX
Second Right
U Turn
Second Left
Left Turn 225 9 3 5 14 90 19 64 121 NO
Through 600 9 1 7 10 83 12 67 99 NO
Right Turn 225 9 1 8 10 85 12 68 101 NO
Second Right
U Turn
Second Left
Left Turn 200 100 146 2 407 504 362 113 1,146 MAX
Through 2,000 100 146 2 407 504 362 113 1,146 NO
Right Turn 2,000 100 146 2 407 504 362 113 1,146 NO
Second Right
NB
SB
EB
WB
Fehr & Peers 12/2/2016

Vissim Post-Processor Richards Blvd - Olive Dr Circulation
Average Results from 10 Runs No Build - Cumulative Conditions
Queue Length AM Peak Hour
Intersection 7 Richards Blvd/I-80 WB Ramps Signal
Storage Average Queue (ft) Maximum Queue (ft) Exceeds
Direction Movement (ft) Average Std. Dev. Minimum Maximum Average Std. Dev. Minimum Maximum Storage?
U Turn
Second Left
Left Turn 800 81 4 73 85 305 6 295 310 NO
Through 800 81 24 42 128 334 14 323 362 NO
Right Turn
Second Right
U Turn
Second Left
Left Turn
Through 590 64 3 62 70 329 45 291 446 NO
Right Turn 200 0 0 0 1 94 45 56 211 NO
Second Right
U Turn
Second Left
Left Turn
Through
Right Turn
Second Right
U Turn
Second Left
Left Turn 400 41 3 35 47 257 46 198 324 NO
Through
Right Turn
Second Right
NB
SB
EB
WB
Fehr & Peers 12/2/2016

Vissim Post-Processor Richards Blvd - Olive Dr Circulation
Average Results from 10 Runs No Build - Cumulative Conditions
Queue Length AM Peak Hour
Intersection 8 Richards Blvd/I-80 EB Ramps Signal
Storage Average Queue (ft) Maximum Queue (ft) Exceeds
Direction Movement (ft) Average Std. Dev. Minimum Maximum Average Std. Dev. Minimum Maximum Storage?
U Turn
Second Left
Left Turn
Through 500 96 22 65 139 498 55 387 564 NO
Right Turn 500 78 21 49 119 468 55 357 534 NO
Second Right
U Turn
Second Left
Left Turn 360 27 3 23 34 171 21 144 206 NO
Through 1,300 14 2 13 17 181 20 143 207 NO
Right Turn
Second Right
U Turn
Second Left
Left Turn
Through
Right Turn
Second Right
U Turn
Second Left
Left Turn 160 43 5 38 56 260 80 186 446 MAX
Through
Right Turn 1,260 46 35 12 106 520 445 115 1,281 NO
Second Right
SB
EB
WB
NB
Fehr & Peers 12/2/2016

Vissim Post-Processor Richards Blvd - Olive Dr Circulation
Average Results from 10 Runs No Build - Cumulative Conditions
Queue Length AM Peak Hour
Intersection 9 Research Park Dr/Richards Blvd Signal
Storage Average Queue (ft) Maximum Queue (ft) Exceeds
Direction Movement (ft) Average Std. Dev. Minimum Maximum Average Std. Dev. Minimum Maximum Storage?
U Turn
Second Left
Left Turn 100 28 5 21 39 127 17 109 160 MAX
Through 620 1 1 0 3 61 20 25 89 NO
Right Turn
Second Right
U Turn
Second Left
Left Turn 120 7 2 4 11 65 12 47 92 NO
Through 3,940 14 6 7 29 172 84 97 395 NO
Right Turn
Second Right
U Turn 440 138 17 120 182 523 22 487 555 MAX
Second Left
Left Turn 440 138 17 120 182 523 22 487 555 MAX
Through 440 45 4 40 53 348 89 278 513 NO
Right Turn
Second Right
U Turn
Second Left
Left Turn 80 33 25 15 99 471 395 83 1,133 MAX
Through 180 427 141 220 621 1,140 13 1,124 1,163 AVG
Right Turn
Second Right
WB
NB
SB
EB
Fehr & Peers 12/2/2016

Vissim Post-Processor Richards Blvd - Olive Dr Circulation
Average Results from 10 Runs No Build - Cumulative Conditions
Queue Length PM Peak Hour
Intersection 1 K St/Third St Side-street Stop
Storage Average Queue (ft) Maximum Queue (ft) Exceeds
Direction Movement (ft) Average Std. Dev. Minimum Maximum Average Std. Dev. Minimum Maximum Storage?
U Turn
Second Left
Left Turn 360 0 0 0 0 18 15 0 47 NO
Through 360 0 0 0 0 15 11 0 24 NO
Right Turn 360 0 0 0 0 9 12 0 25 NO
Second Right
U Turn
Second Left
Left Turn 420 1 0 0 1 36 12 24 54 NO
Through 3,700 1 0 0 1 36 12 24 54 NO
Right Turn 420 1 0 0 1 36 12 24 54 NO
Second Right
U Turn
Second Left
Left Turn 250 30 16 8 60 371 90 234 449 MAX
Through 250 0 0 0 0 12 15 0 33 NO
Right Turn 250 31 16 8 62 375 90 238 453 MAX
Second Right
U Turn
Second Left
Left Turn 250 0 0 0 1 50 26 0 95 NO
Through 250 1 0 0 1 84 15 66 104 NO
Right Turn 250 0 0 0 1 59 30 0 106 NO
Second Right
NB
SB
EB
WB
Fehr & Peers 11/30/2016

Vissim Post-Processor Richards Blvd - Olive Dr Circulation
Average Results from 10 Runs No Build - Cumulative Conditions
Queue Length PM Peak Hour
Intersection 2 L St/Third St Side-street Stop
Storage Average Queue (ft) Maximum Queue (ft) Exceeds
Direction Movement (ft) Average Std. Dev. Minimum Maximum Average Std. Dev. Minimum Maximum Storage?
U Turn
Second Left
Left Turn 360 2 1 1 2 112 59 53 245 NO
Through 360 0 0 0 0 0 0 0 0 NO
Right Turn
Second Right
U Turn
Second Left
Left Turn
Through 420 0 0 0 0 0 0 0 0 NO
Right Turn 420 0 0 0 0 7 15 0 41 NO
Second Right
U Turn
Second Left
Left Turn 250 117 43 53 191 652 124 360 742 MAX
Through
Right Turn 250 117 43 53 191 652 124 360 742 MAX
Second Right
U Turn
Second Left
Left Turn
Through
Right Turn
Second Right
NB
SB
EB
WB
Fehr & Peers 11/30/2016

Vissim Post-Processor Richards Blvd - Olive Dr Circulation
Average Results from 10 Runs No Build - Cumulative Conditions
Queue Length PM Peak Hour
Intersection 3 Arbor Apts Dwy (East)/Olive Dr Side-street Stop
Storage Average Queue (ft) Maximum Queue (ft) Exceeds
Direction Movement (ft) Average Std. Dev. Minimum Maximum Average Std. Dev. Minimum Maximum Storage?
U Turn
Second Left
Left Turn 460 0 0 0 0 33 17 22 60 NO
Through
Right Turn
Second Right
U Turn
Second Left
Left Turn
Through
Right Turn
Second Right
U Turn
Second Left
Left Turn
Through 2,000 0 0 0 0 0 0 0 0 NO
Right Turn 2,000 0 0 0 0 16 16 0 49 NO
Second Right
U Turn
Second Left
Left Turn 1,400 0 0 0 0 0 0 0 0 NO
Through 1,400 0 0 0 0 0 0 0 0 NO
Right Turn
Second Right
NB
SB
EB
WB
Fehr & Peers 11/30/2016

Vissim Post-Processor Richards Blvd - Olive Dr Circulation
Average Results from 10 Runs No Build - Cumulative Conditions
Queue Length PM Peak Hour
Intersection 4 D St/First St Signal
Storage Average Queue (ft) Maximum Queue (ft) Exceeds
Direction Movement (ft) Average Std. Dev. Minimum Maximum Average Std. Dev. Minimum Maximum Storage?
U Turn
Second Left
Left Turn 100 11 2 7 14 123 29 86 182 MAX
Through 100 11 2 7 14 123 29 86 182 MAX
Right Turn 400 2 1 1 3 72 40 23 166 NO
Second Right
U Turn
Second Left
Left Turn 400 147 47 84 218 431 35 345 459 MAX
Through 400 147 47 84 218 431 35 345 459 MAX
Right Turn 400 49 20 22 75 425 38 350 449 MAX
Second Right
U Turn
Second Left
Left Turn 80 94 71 35 262 701 118 530 835 AVG
Through 560 94 71 35 262 701 118 530 835 MAX
Right Turn 560 94 71 35 262 701 118 530 835 MAX
Second Right
U Turn
Second Left
Left Turn 100 14 1 12 17 116 20 88 151 MAX
Through 240 29 7 20 37 330 38 260 353 MAX
Right Turn 24 30 7 20 37 332 38 262 355 AVG
Second Right
NB
SB
EB
WB
Fehr & Peers 11/30/2016

Vissim Post-Processor Richards Blvd - Olive Dr Circulation
Average Results from 10 Runs No Build - Cumulative Conditions
Queue Length PM Peak Hour
Intersection 5 E St-Richards Blvd/First St Signal
Storage Average Queue (ft) Maximum Queue (ft) Exceeds
Direction Movement (ft) Average Std. Dev. Minimum Maximum Average Std. Dev. Minimum Maximum Storage?
U Turn
Second Left
Left Turn 640 4 3 0 11 166 54 49 209 NO
Through 640 4 3 0 11 166 54 49 209 NO
Right Turn 180 4 3 0 11 166 54 49 209 NO
Second Right
U Turn
Second Left
Left Turn
Through 400 65 9 52 80 367 49 287 414 NO
Right Turn 400 5 3 1 9 235 76 136 397 NO
Second Right
U Turn
Second Left
Left Turn 100 53 14 28 73 496 1 496 498 MAX
Through 220 53 14 28 73 496 1 496 498 MAX
Right Turn 200 142 23 106 176 500 12 495 534 MAX
Second Right
U Turn
Second Left
Left Turn 220 64 6 54 71 265 40 215 339 MAX
Through 240 64 6 54 71 265 40 215 339 MAX
Right Turn 240 64 6 54 71 265 40 215 339 MAX
Second Right
NB
SB
EB
WB
Fehr & Peers 11/30/2016
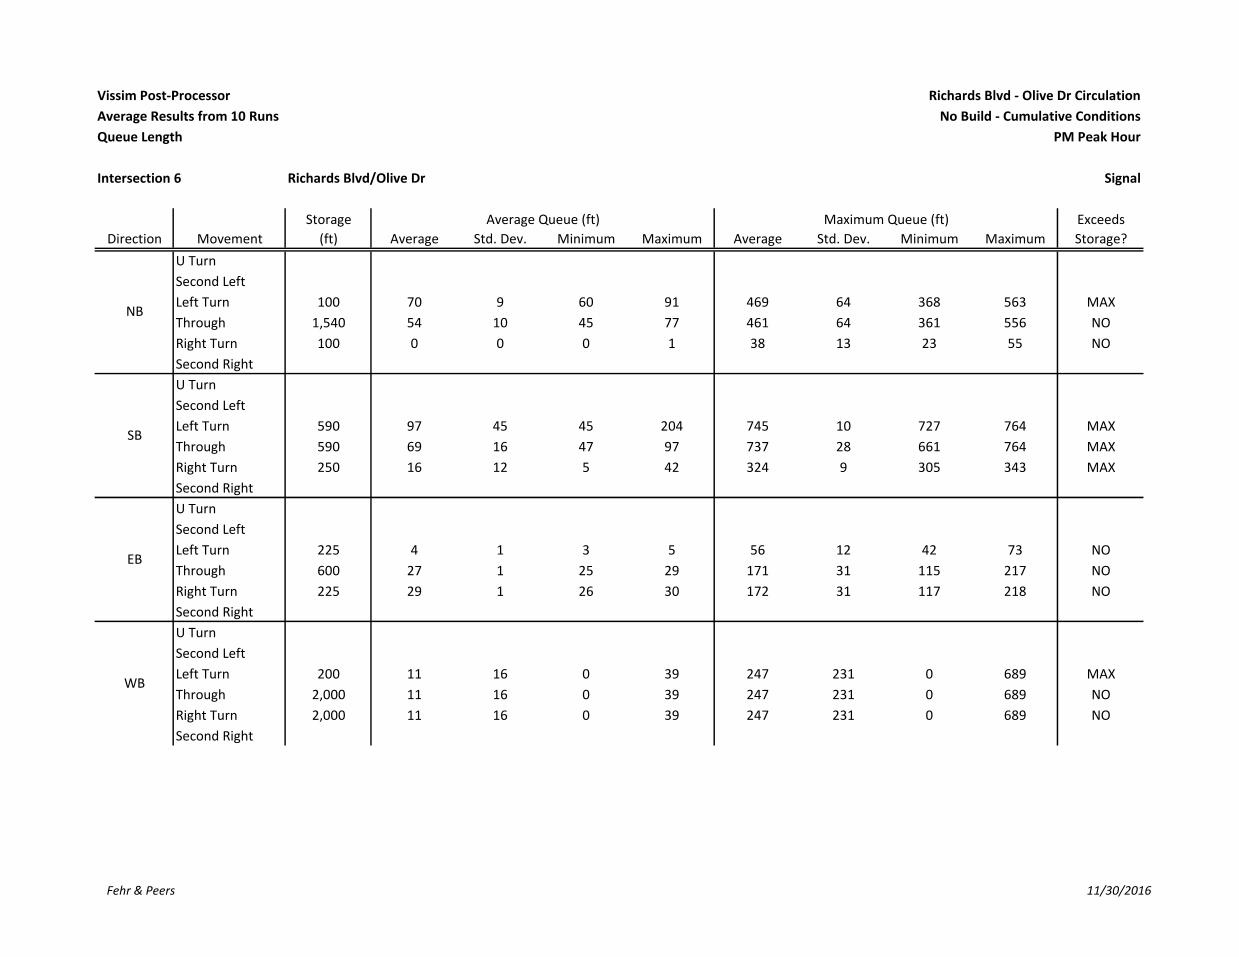
Vissim Post-Processor Richards Blvd - Olive Dr Circulation
Average Results from 10 Runs No Build - Cumulative Conditions
Queue Length PM Peak Hour
Intersection 6 Richards Blvd/Olive Dr Signal
Storage Average Queue (ft) Maximum Queue (ft) Exceeds
Direction Movement (ft) Average Std. Dev. Minimum Maximum Average Std. Dev. Minimum Maximum Storage?
U Turn
Second Left
Left Turn 100 70 9 60 91 469 64 368 563 MAX
Through 1,540 54 10 45 77 461 64 361 556 NO
Right Turn 100 0 0 0 1 38 13 23 55 NO
Second Right
U Turn
Second Left
Left Turn 590 97 45 45 204 745 10 727 764 MAX
Through 590 69 16 47 97 737 28 661 764 MAX
Right Turn 250 16 12 5 42 324 9 305 343 MAX
Second Right
U Turn
Second Left
Left Turn 225 4 1 3 5 56 12 42 73 NO
Through 600 27 1 25 29 171 31 115 217 NO
Right Turn 225 29 1 26 30 172 31 117 218 NO
Second Right
U Turn
Second Left
Left Turn 200 11 16 0 39 247 231 0 689 MAX
Through 2,000 11 16 0 39 247 231 0 689 NO
Right Turn 2,000 11 16 0 39 247 231 0 689 NO
Second Right
WB
NB
SB
EB
Fehr & Peers 11/30/2016
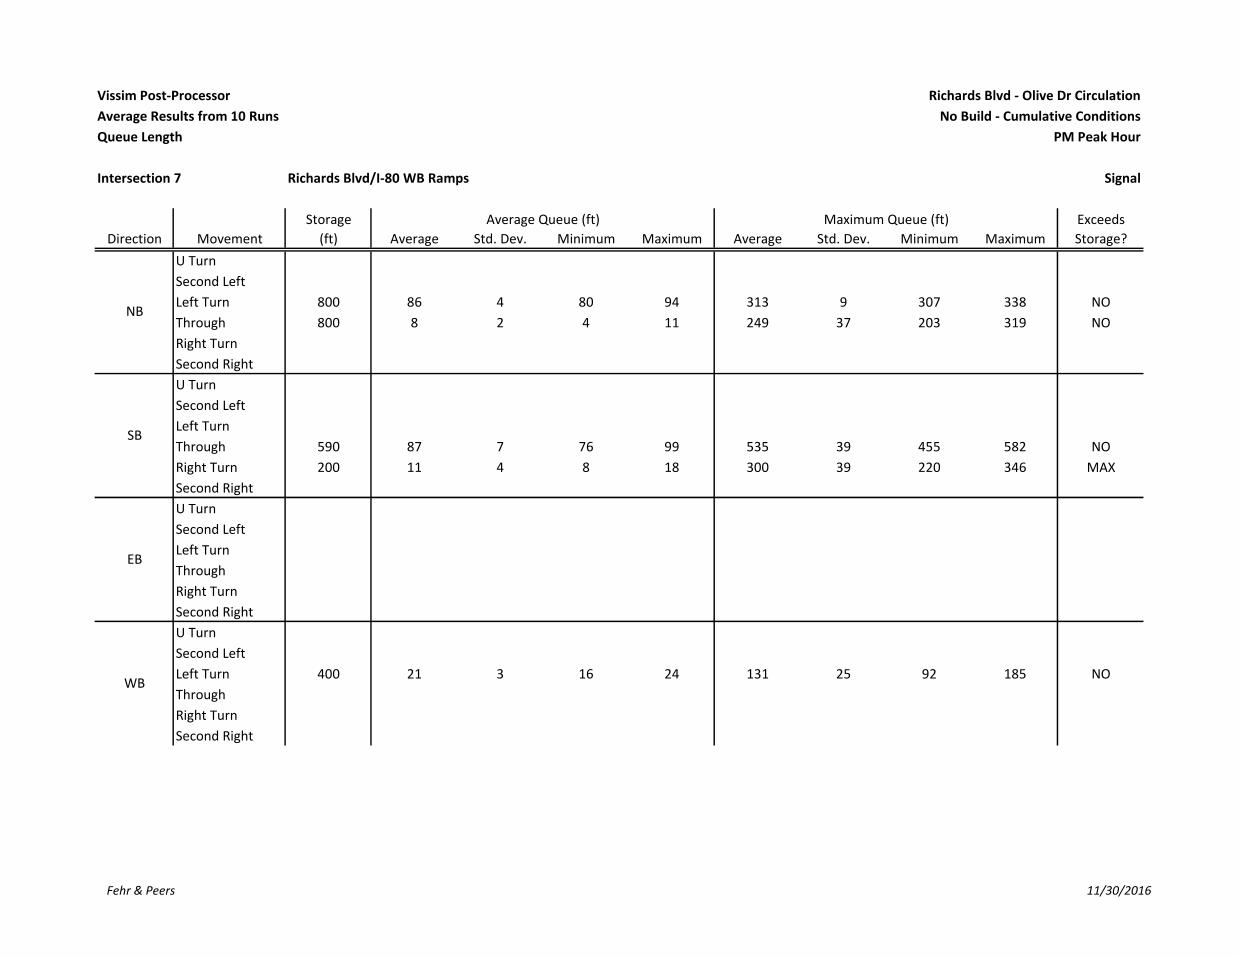
Vissim Post-Processor Richards Blvd - Olive Dr Circulation
Average Results from 10 Runs No Build - Cumulative Conditions
Queue Length PM Peak Hour
Intersection 7 Richards Blvd/I-80 WB Ramps Signal
Storage Average Queue (ft) Maximum Queue (ft) Exceeds
Direction Movement (ft) Average Std. Dev. Minimum Maximum Average Std. Dev. Minimum Maximum Storage?
U Turn
Second Left
Left Turn 800 86 4 80 94 313 9 307 338 NO
Through 800 8 2 4 11 249 37 203 319 NO
Right Turn
Second Right
U Turn
Second Left
Left Turn
Through 590 87 7 76 99 535 39 455 582 NO
Right Turn 200 11 4 8 18 300 39 220 346 MAX
Second Right
U Turn
Second Left
Left Turn
Through
Right Turn
Second Right
U Turn
Second Left
Left Turn 400 21 3 16 24 131 25 92 185 NO
Through
Right Turn
Second Right
NB
SB
EB
WB
Fehr & Peers 11/30/2016

Vissim Post-Processor Richards Blvd - Olive Dr Circulation
Average Results from 10 Runs No Build - Cumulative Conditions
Queue Length PM Peak Hour
Intersection 8 Richards Blvd/I-80 EB Ramps Signal
Storage Average Queue (ft) Maximum Queue (ft) Exceeds
Direction Movement (ft) Average Std. Dev. Minimum Maximum Average Std. Dev. Minimum Maximum Storage?
U Turn
Second Left
Left Turn
Through 500 120 10 103 135 404 16 376 426 NO
Right Turn 500 97 10 81 112 374 16 347 396 NO
Second Right
U Turn
Second Left
Left Turn 360 55 6 44 65 223 23 184 256 NO
Through 1,300 27 8 19 44 286 63 214 425 NO
Right Turn
Second Right
U Turn
Second Left
Left Turn
Through
Right Turn
Second Right
U Turn
Second Left
Left Turn 160 65 16 51 110 310 95 231 545 MAX
Through
Right Turn 1,260 8 1 6 11 111 20 86 156 NO
Second Right
NB
SB
EB
WB
Fehr & Peers 11/30/2016

Vissim Post-Processor Richards Blvd - Olive Dr Circulation
Average Results from 10 Runs No Build - Cumulative Conditions
Queue Length PM Peak Hour
Intersection 9 Research Park Dr/Richards Blvd Signal
Storage Average Queue (ft) Maximum Queue (ft) Exceeds
Direction Movement (ft) Average Std. Dev. Minimum Maximum Average Std. Dev. Minimum Maximum Storage?
U Turn
Second Left
Left Turn 100 32 4 27 39 135 31 106 199 MAX
Through 620 6 1 3 8 104 29 67 169 NO
Right Turn
Second Right
U Turn
Second Left
Left Turn 120 13 5 7 22 134 95 64 344 MAX
Through 3,940 137 62 75 290 544 107 337 634 NO
Right Turn
Second Right
U Turn 440 193 39 150 273 555 2 551 559 MAX
Second Left
Left Turn 440 193 39 150 273 555 2 551 559 MAX
Through 440 99 6 92 107 552 8 534 560 MAX
Right Turn
Second Right
U Turn
Second Left
Left Turn 80 11 3 7 16 137 122 53 426 MAX
Through 180 126 27 101 182 699 198 475 1,133 MAX
Right Turn
Second Right
EB
WB
NB
SB
Fehr & Peers 11/30/2016
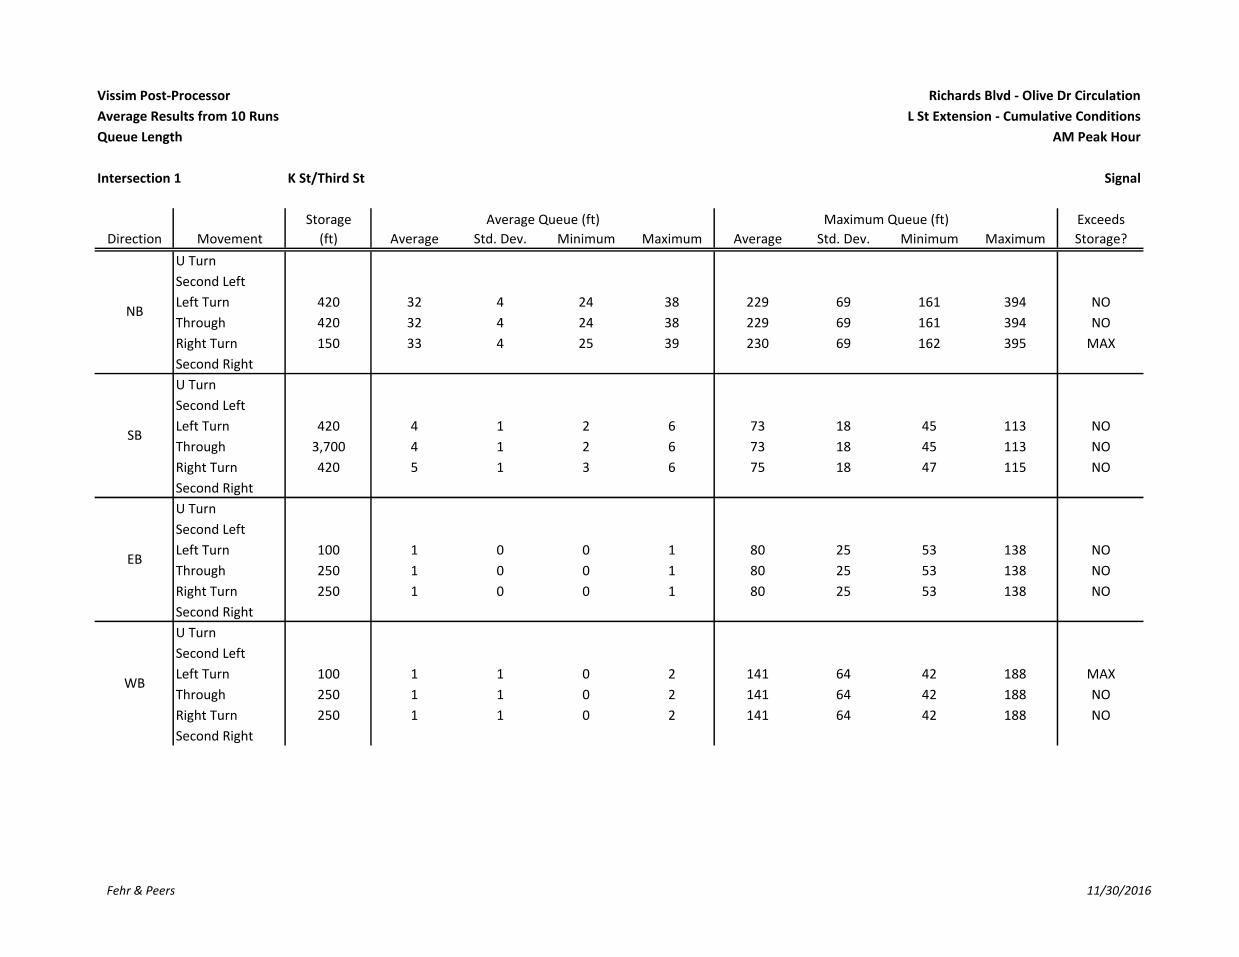
Vissim Post-Processor Richards Blvd - Olive Dr Circulation
Average Results from 10 Runs L St Extension - Cumulative Conditions
Queue Length AM Peak Hour
Intersection 1 K St/Third St Signal
Storage Average Queue (ft) Maximum Queue (ft) Exceeds
Direction Movement (ft) Average Std. Dev. Minimum Maximum Average Std. Dev. Minimum Maximum Storage?
U Turn
Second Left
Left Turn 420 32 4 24 38 229 69 161 394 NO
Through 420 32 4 24 38 229 69 161 394 NO
Right Turn 150 33 4 25 39 230 69 162 395 MAX
Second Right
U Turn
Second Left
Left Turn 420 4 1 2 6 73 18 45 113 NO
Through 3,700 4 1 2 6 73 18 45 113 NO
Right Turn 420 5 1 3 6 75 18 47 115 NO
Second Right
U Turn
Second Left
Left Turn 100 1 0 0 1 80 25 53 138 NO
Through 250 1 0 0 1 80 25 53 138 NO
Right Turn 250 1 0 0 1 80 25 53 138 NO
Second Right
U Turn
Second Left
Left Turn 100 1 1 0 2 141 64 42 188 MAX
Through 250 1 1 0 2 141 64 42 188 NO
Right Turn 250 1 1 0 2 141 64 42 188 NO
Second Right
NB
SB
EB
WB
Fehr & Peers 11/30/2016

Vissim Post-Processor Richards Blvd - Olive Dr Circulation
Average Results from 10 Runs L St Extension - Cumulative Conditions
Queue Length AM Peak Hour
Intersection 2 L St/Third St Signal
Storage Average Queue (ft) Maximum Queue (ft) Exceeds
Direction Movement (ft) Average Std. Dev. Minimum Maximum Average Std. Dev. Minimum Maximum Storage?
U Turn
Second Left
Left Turn 150 69 14 52 93 502 8 478 506 MAX
Through 490 69 14 52 93 502 8 478 506 MAX
Right Turn
Second Right
U Turn
Second Left
Left Turn
Through 420 33 8 19 47 364 71 238 444 NO
Right Turn 420 10 4 5 18 279 50 215 342 NO
Second Right
U Turn
Second Left
Left Turn 125 25 3 22 31 207 58 155 300 MAX
Through
Right Turn 250 25 3 22 32 208 58 156 300 NO
Second Right
U Turn
Second Left
Left Turn
Through
Right Turn
Second Right
NB
SB
EB
WB
Fehr & Peers 11/30/2016

Vissim Post-Processor Richards Blvd - Olive Dr Circulation
Average Results from 10 Runs L St Extension - Cumulative Conditions
Queue Length AM Peak Hour
Intersection 3 L St/Olive Dr Signal
Storage Average Queue (ft) Maximum Queue (ft) Exceeds
Direction Movement (ft) Average Std. Dev. Minimum Maximum Average Std. Dev. Minimum Maximum Storage?
U Turn
Second Left
Left Turn
Through
Right Turn
Second Right
U Turn
Second Left
Left Turn
Through
Right Turn 375 77 18 45 109 416 98 267 569 MAX
Second Right
U Turn
Second Left
Left Turn 750 31 4 25 36 199 30 153 244 NO
Through
Right Turn
Second Right
U Turn
Second Left
Left Turn
Through 1,400 401 271 102 897 1,435 345 825 1,695 MAX
Right Turn 1,400 405 271 105 901 1,437 341 832 1,686 MAX
Second Right
NB
SB
EB
WB
Fehr & Peers 11/30/2016
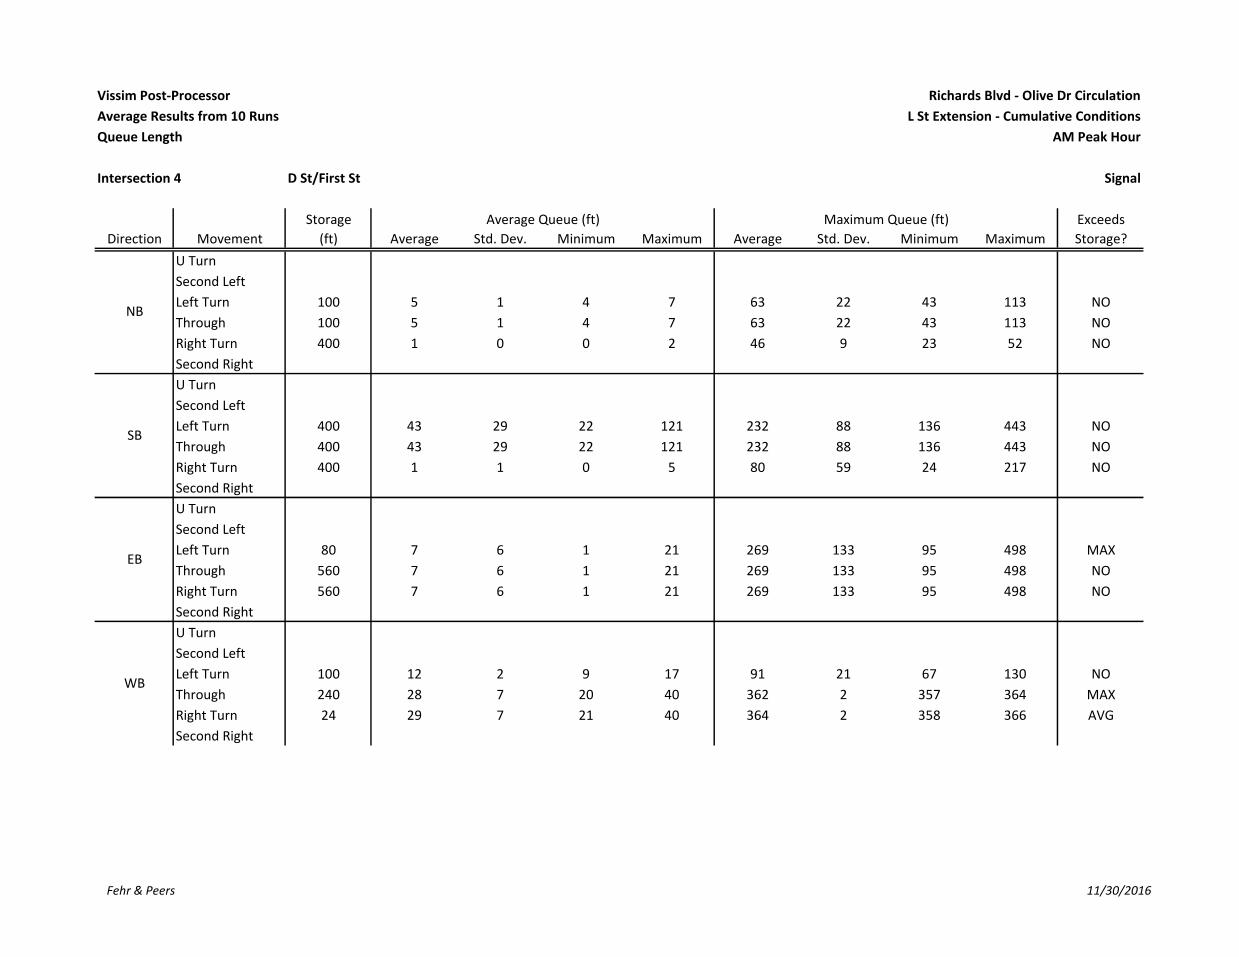
Vissim Post-Processor Richards Blvd - Olive Dr Circulation
Average Results from 10 Runs L St Extension - Cumulative Conditions
Queue Length AM Peak Hour
Intersection 4 D St/First St Signal
Storage Average Queue (ft) Maximum Queue (ft) Exceeds
Direction Movement (ft) Average Std. Dev. Minimum Maximum Average Std. Dev. Minimum Maximum Storage?
U Turn
Second Left
Left Turn 100 5 1 4 7 63 22 43 113 NO
Through 100 5 1 4 7 63 22 43 113 NO
Right Turn 400 1 0 0 2 46 9 23 52 NO
Second Right
U Turn
Second Left
Left Turn 400 43 29 22 121 232 88 136 443 NO
Through 400 43 29 22 121 232 88 136 443 NO
Right Turn 400 1 1 0 5 80 59 24 217 NO
Second Right
U Turn
Second Left
Left Turn 80 7 6 1 21 269 133 95 498 MAX
Through 560 7 6 1 21 269 133 95 498 NO
Right Turn 560 7 6 1 21 269 133 95 498 NO
Second Right
U Turn
Second Left
Left Turn 100 12 2 9 17 91 21 67 130 NO
Through 240 28 7 20 40 362 2 357 364 MAX
Right Turn 24 29 7 21 40 364 2 358 366 AVG
Second Right
NB
SB
EB
WB
Fehr & Peers 11/30/2016

Vissim Post-Processor Richards Blvd - Olive Dr Circulation
Average Results from 10 Runs L St Extension - Cumulative Conditions
Queue Length AM Peak Hour
Intersection 5 E St-Richards Blvd/First St Signal
Storage Average Queue (ft) Maximum Queue (ft) Exceeds
Direction Movement (ft) Average Std. Dev. Minimum Maximum Average Std. Dev. Minimum Maximum Storage?
U Turn
Second Left
Left Turn 640 10 5 4 18 196 22 135 211 NO
Through 640 10 5 4 18 196 22 135 211 NO
Right Turn 180 10 5 4 18 196 22 135 211 MAX
Second Right
U Turn
Second Left
Left Turn
Through 400 42 3 37 48 251 35 215 323 NO
Right Turn 400 4 2 1 7 196 67 89 282 NO
Second Right
U Turn
Second Left
Left Turn 100 86 20 61 120 511 16 486 524 MAX
Through 220 86 20 61 120 511 16 486 524 MAX
Right Turn 200 52 19 31 88 469 42 371 496 MAX
Second Right
U Turn
Second Left
Left Turn 220 31 3 26 35 168 25 125 210 NO
Through 240 31 3 26 35 168 25 125 210 NO
Right Turn 240 31 3 26 35 168 25 125 210 NO
Second Right
NB
SB
EB
WB
Fehr & Peers 11/30/2016

Vissim Post-Processor Richards Blvd - Olive Dr Circulation
Average Results from 10 Runs L St Extension - Cumulative Conditions
Queue Length AM Peak Hour
Intersection 6 Richards Blvd/Olive Dr Signal
Storage Average Queue (ft) Maximum Queue (ft) Exceeds
Direction Movement (ft) Average Std. Dev. Minimum Maximum Average Std. Dev. Minimum Maximum Storage?
U Turn
Second Left
Left Turn 100 92 9 82 108 487 108 366 682 MAX
Through 1,540 56 11 43 73 471 108 358 675 NO
Right Turn 100 0 0 0 0 35 15 20 70 NO
Second Right
U Turn
Second Left
Left Turn 590 9 8 3 29 189 230 47 687 NO
Through 590 172 37 124 237 733 39 648 760 MAX
Right Turn 250 170 37 122 235 730 39 646 758 MAX
Second Right
U Turn
Second Left
Left Turn 225 14 2 11 16 91 13 66 110 NO
Through 600 11 1 8 13 90 15 67 118 NO
Right Turn 225 12 2 9 13 91 15 68 119 NO
Second Right
U Turn
Second Left
Left Turn 200 59 71 2 220 553 350 205 1,142 MAX
Through 2,000 59 71 2 220 553 350 205 1,142 NO
Right Turn 2,000 59 71 2 220 553 350 205 1,142 NO
Second Right
WB
NB
SB
EB
Fehr & Peers 11/30/2016
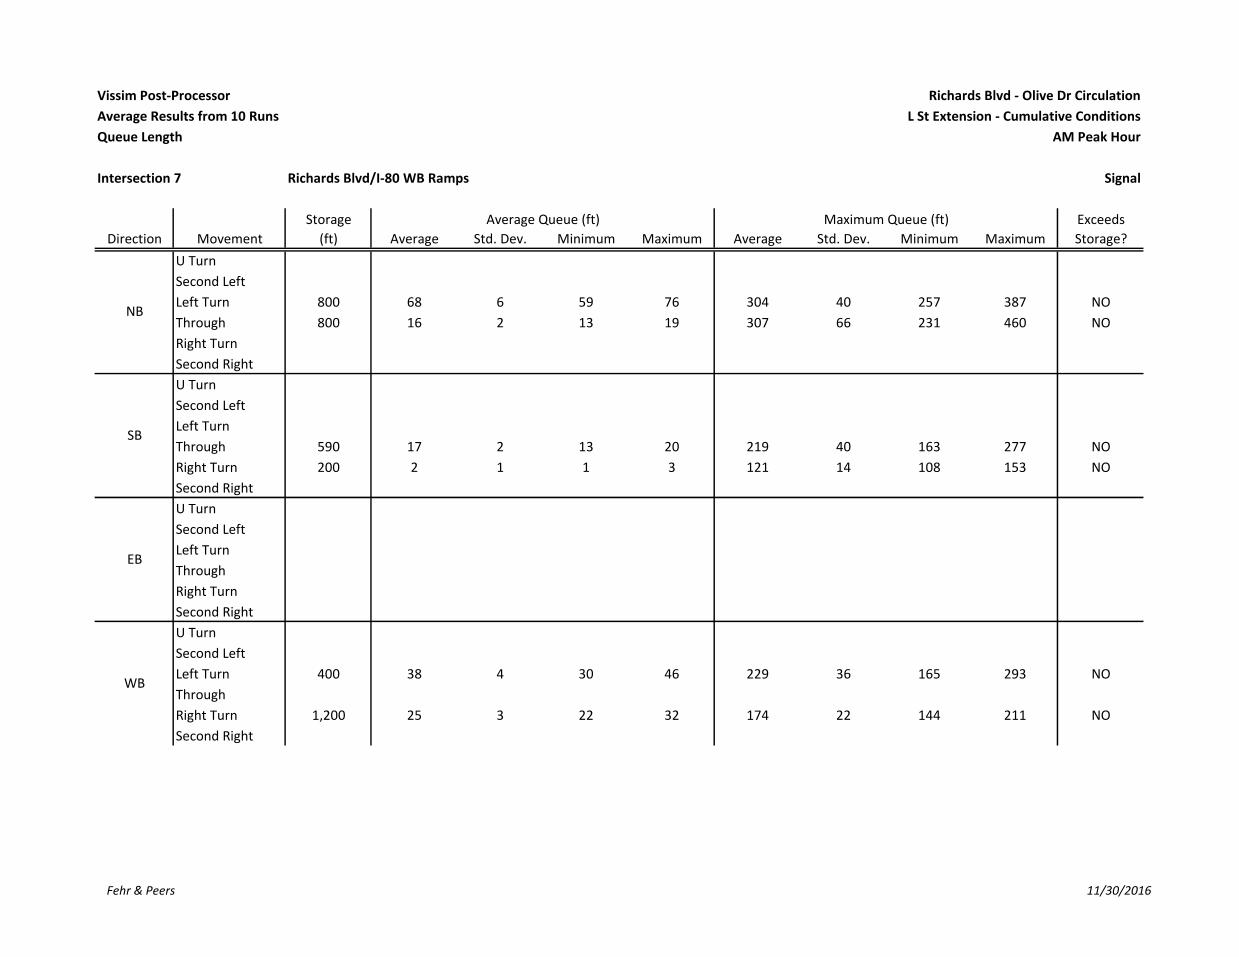
Vissim Post-Processor Richards Blvd - Olive Dr Circulation
Average Results from 10 Runs L St Extension - Cumulative Conditions
Queue Length AM Peak Hour
Intersection 7 Richards Blvd/I-80 WB Ramps Signal
Storage Average Queue (ft) Maximum Queue (ft) Exceeds
Direction Movement (ft) Average Std. Dev. Minimum Maximum Average Std. Dev. Minimum Maximum Storage?
U Turn
Second Left
Left Turn 800 68 6 59 76 304 40 257 387 NO
Through 800 16 2 13 19 307 66 231 460 NO
Right Turn
Second Right
U Turn
Second Left
Left Turn
Through 590 17 2 13 20 219 40 163 277 NO
Right Turn 200 2 1 1 3 121 14 108 153 NO
Second Right
U Turn
Second Left
Left Turn
Through
Right Turn
Second Right
U Turn
Second Left
Left Turn 400 38 4 30 46 229 36 165 293 NO
Through
Right Turn 1,200 25 3 22 32 174 22 144 211 NO
Second Right
NB
SB
EB
WB
Fehr & Peers 11/30/2016
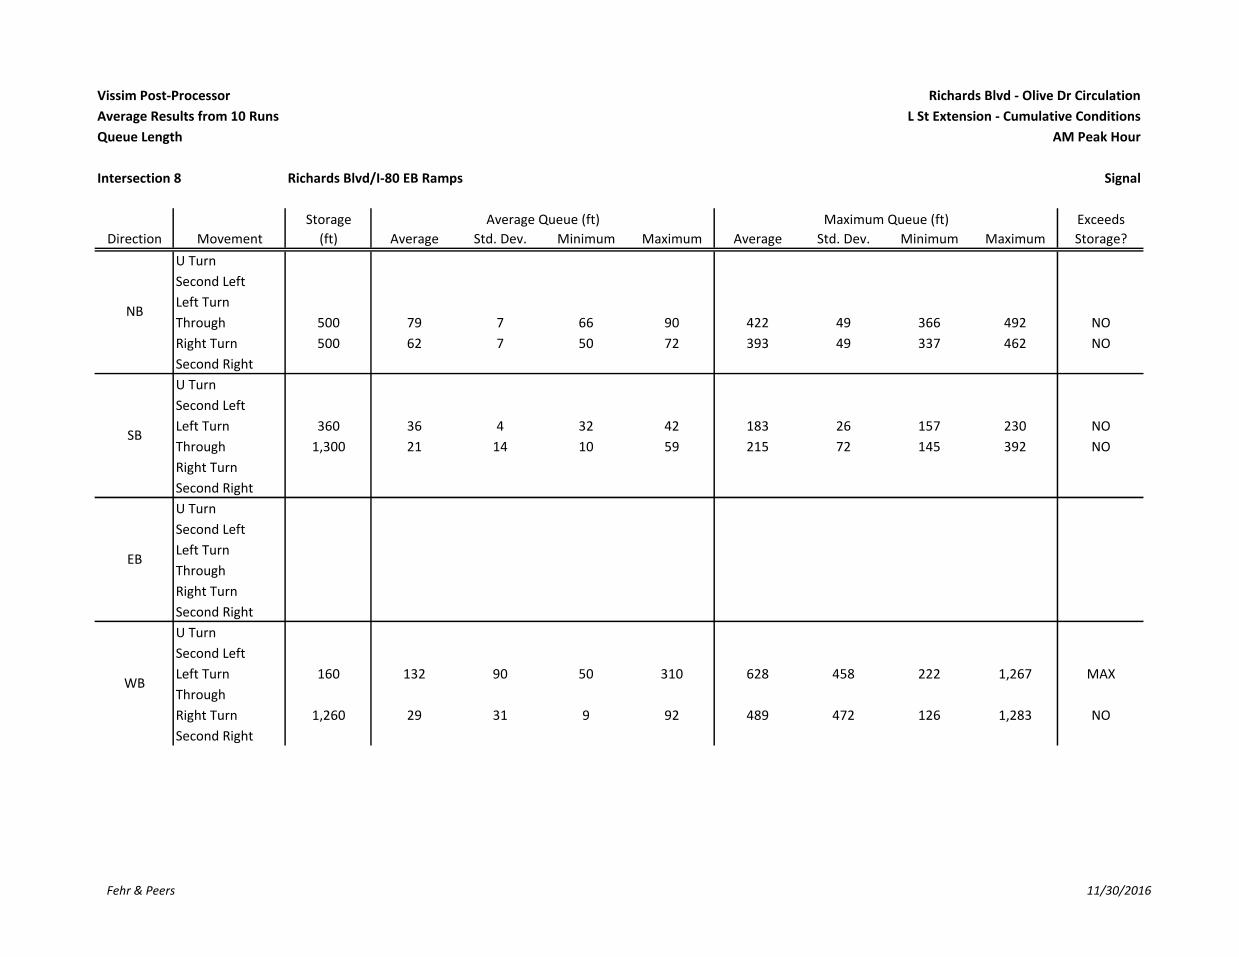
Vissim Post-Processor Richards Blvd - Olive Dr Circulation
Average Results from 10 Runs L St Extension - Cumulative Conditions
Queue Length AM Peak Hour
Intersection 8 Richards Blvd/I-80 EB Ramps Signal
Storage Average Queue (ft) Maximum Queue (ft) Exceeds
Direction Movement (ft) Average Std. Dev. Minimum Maximum Average Std. Dev. Minimum Maximum Storage?
U Turn
Second Left
Left Turn
Through 500 79 7 66 90 422 49 366 492 NO
Right Turn 500 62 7 50 72 393 49 337 462 NO
Second Right
U Turn
Second Left
Left Turn 360 36 4 32 42 183 26 157 230 NO
Through 1,300 21 14 10 59 215 72 145 392 NO
Right Turn
Second Right
U Turn
Second Left
Left Turn
Through
Right Turn
Second Right
U Turn
Second Left
Left Turn 160 132 90 50 310 628 458 222 1,267 MAX
Through
Right Turn 1,260 29 31 9 92 489 472 126 1,283 NO
Second Right
NB
SB
EB
WB
Fehr & Peers 11/30/2016

Vissim Post-Processor Richards Blvd - Olive Dr Circulation
Average Results from 10 Runs L St Extension - Cumulative Conditions
Queue Length AM Peak Hour
Intersection 9 Research Park Dr/Richards Blvd Signal
Storage Average Queue (ft) Maximum Queue (ft) Exceeds
Direction Movement (ft) Average Std. Dev. Minimum Maximum Average Std. Dev. Minimum Maximum Storage?
U Turn
Second Left
Left Turn 100 28 4 24 33 127 32 91 205 MAX
Through 620 2 1 0 3 67 19 44 94 NO
Right Turn
Second Right
U Turn
Second Left
Left Turn 120 10 1 8 12 82 16 65 113 NO
Through 3,940 14 3 8 21 197 52 131 311 NO
Right Turn
Second Right
U Turn 440 297 72 189 399 564 10 548 585 MAX
Second Left
Left Turn 440 297 72 189 399 564 10 548 585 MAX
Through 440 47 5 38 53 350 63 269 454 NO
Right Turn
Second Right
U Turn
Second Left
Left Turn 80 109 65 42 252 972 225 525 1,145 AVG
Through 180 257 89 132 403 1,055 148 759 1,145 AVG
Right Turn
Second Right
EB
WB
NB
SB
Fehr & Peers 11/30/2016

Vissim Post-Processor Richards Blvd - Olive Dr Circulation
Average Results from 10 Runs L St Extension - Cumulative Conditions
Queue Length PM Peak Hour
Intersection 1 K St/Third St Signal
Storage Average Queue (ft) Maximum Queue (ft) Exceeds
Direction Movement (ft) Average Std. Dev. Minimum Maximum Average Std. Dev. Minimum Maximum Storage?
U Turn
Second Left
Left Turn 420 49 4 43 55 375 73 290 507 NO
Through 420 49 4 43 55 375 73 290 507 NO
Right Turn 150 50 4 45 56 377 73 291 509 MAX
Second Right
U Turn
Second Left
Left Turn 420 10 2 8 14 104 19 87 138 NO
Through 3,700 10 2 8 14 104 19 87 138 NO
Right Turn 420 11 2 9 14 106 19 88 140 NO
Second Right
U Turn
Second Left
Left Turn 100 209 23 163 230 320 11 313 339 AVG
Through 250 209 23 163 230 320 11 313 339 MAX
Right Turn 250 209 23 163 230 320 11 313 339 MAX
Second Right
U Turn
Second Left
Left Turn 100 19 3 14 23 189 3 187 196 MAX
Through 250 19 3 14 23 189 3 187 196 NO
Right Turn 250 19 3 14 23 189 3 187 196 NO
Second Right
NB
SB
EB
WB
Fehr & Peers 12/1/2016
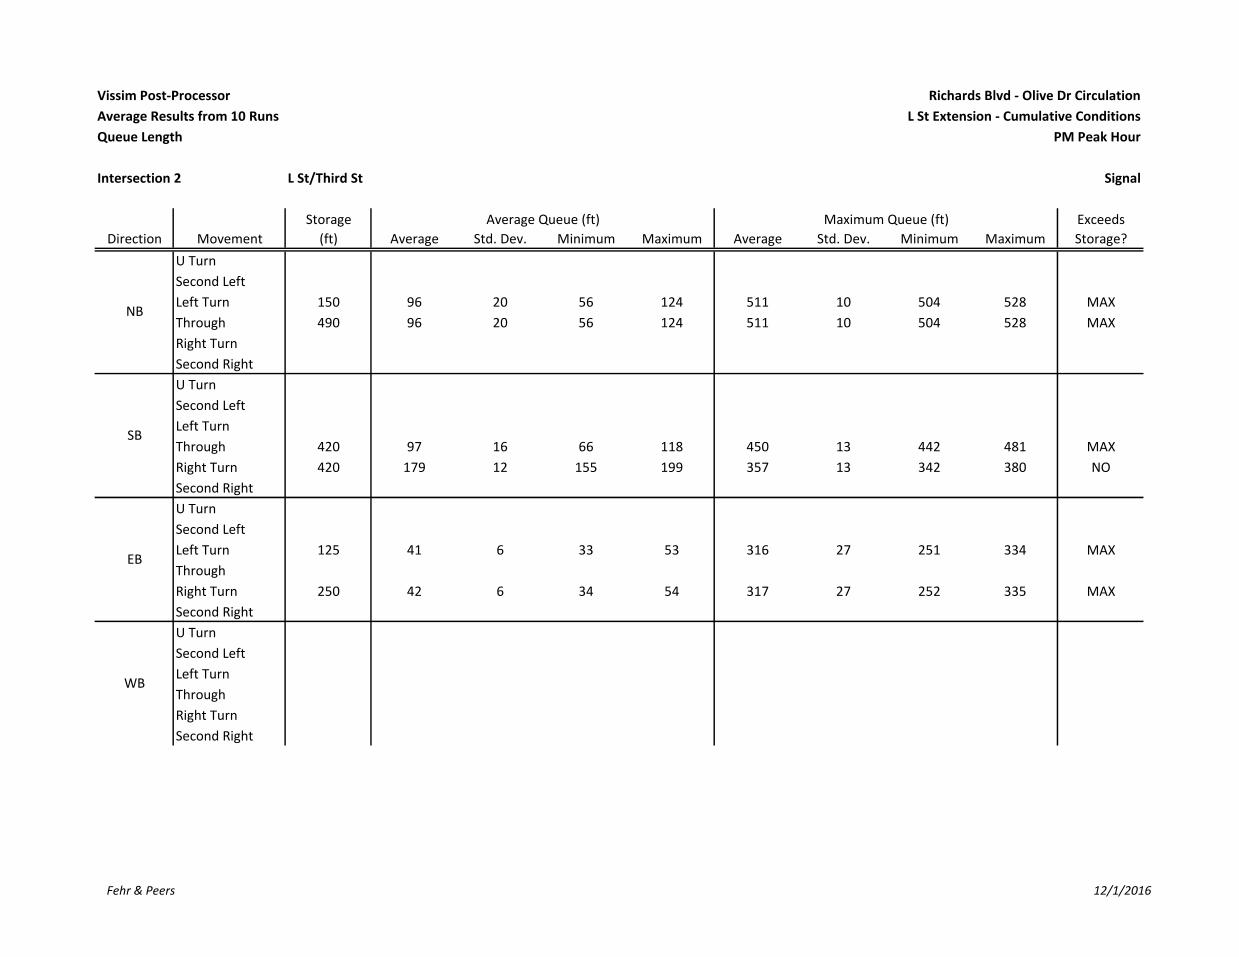
Vissim Post-Processor Richards Blvd - Olive Dr Circulation
Average Results from 10 Runs L St Extension - Cumulative Conditions
Queue Length PM Peak Hour
Intersection 2 L St/Third St Signal
Storage Average Queue (ft) Maximum Queue (ft) Exceeds
Direction Movement (ft) Average Std. Dev. Minimum Maximum Average Std. Dev. Minimum Maximum Storage?
U Turn
Second Left
Left Turn 150 96 20 56 124 511 10 504 528 MAX
Through 490 96 20 56 124 511 10 504 528 MAX
Right Turn
Second Right
U Turn
Second Left
Left Turn
Through 420 97 16 66 118 450 13 442 481 MAX
Right Turn 420 179 12 155 199 357 13 342 380 NO
Second Right
U Turn
Second Left
Left Turn 125 41 6 33 53 316 27 251 334 MAX
Through
Right Turn 250 42 6 34 54 317 27 252 335 MAX
Second Right
U Turn
Second Left
Left Turn
Through
Right Turn
Second Right
NB
SB
EB
WB
Fehr & Peers 12/1/2016

Vissim Post-Processor Richards Blvd - Olive Dr Circulation
Average Results from 10 Runs L St Extension - Cumulative Conditions
Queue Length PM Peak Hour
Intersection 3 L St/Olive Dr Signal
Storage Average Queue (ft) Maximum Queue (ft) Exceeds
Direction Movement (ft) Average Std. Dev. Minimum Maximum Average Std. Dev. Minimum Maximum Storage?
U Turn
Second Left
Left Turn
Through
Right Turn
Second Right
U Turn
Second Left
Left Turn
Through
Right Turn 375 80 23 54 116 379 81 275 545 MAX
Second Right
U Turn
Second Left
Left Turn 750 194 77 101 310 627 257 368 1,157 NO
Through
Right Turn
Second Right
U Turn
Second Left
Left Turn
Through 1,400 166 127 31 466 923 350 392 1,656 NO
Right Turn 1,400 170 128 34 471 929 348 399 1,656 NO
Second Right
NB
SB
EB
WB
Fehr & Peers 12/1/2016

Vissim Post-Processor Richards Blvd - Olive Dr Circulation
Average Results from 10 Runs L St Extension - Cumulative Conditions
Queue Length PM Peak Hour
Intersection 4 D St/First St Signal
Storage Average Queue (ft) Maximum Queue (ft) Exceeds
Direction Movement (ft) Average Std. Dev. Minimum Maximum Average Std. Dev. Minimum Maximum Storage?
U Turn
Second Left
Left Turn 100 14 1 13 18 148 60 109 310 MAX
Through 100 14 1 13 18 148 60 109 310 MAX
Right Turn 400 4 2 2 8 93 40 52 189 NO
Second Right
U Turn
Second Left
Left Turn 400 388 16 348 403 449 8 443 463 MAX
Through 400 388 16 348 403 449 8 443 463 MAX
Right Turn 400 84 59 19 190 448 7 434 463 MAX
Second Right
U Turn
Second Left
Left Turn 80 189 103 75 334 808 23 774 845 AVG
Through 560 189 103 75 334 808 23 774 845 MAX
Right Turn 560 189 103 75 334 808 23 774 845 MAX
Second Right
U Turn
Second Left
Left Turn 100 41 10 28 57 234 112 96 362 MAX
Through 240 33 10 23 52 289 68 216 354 MAX
Right Turn 24 33 10 23 53 291 68 218 356 AVG
Second Right
NB
SB
EB
WB
Fehr & Peers 12/1/2016
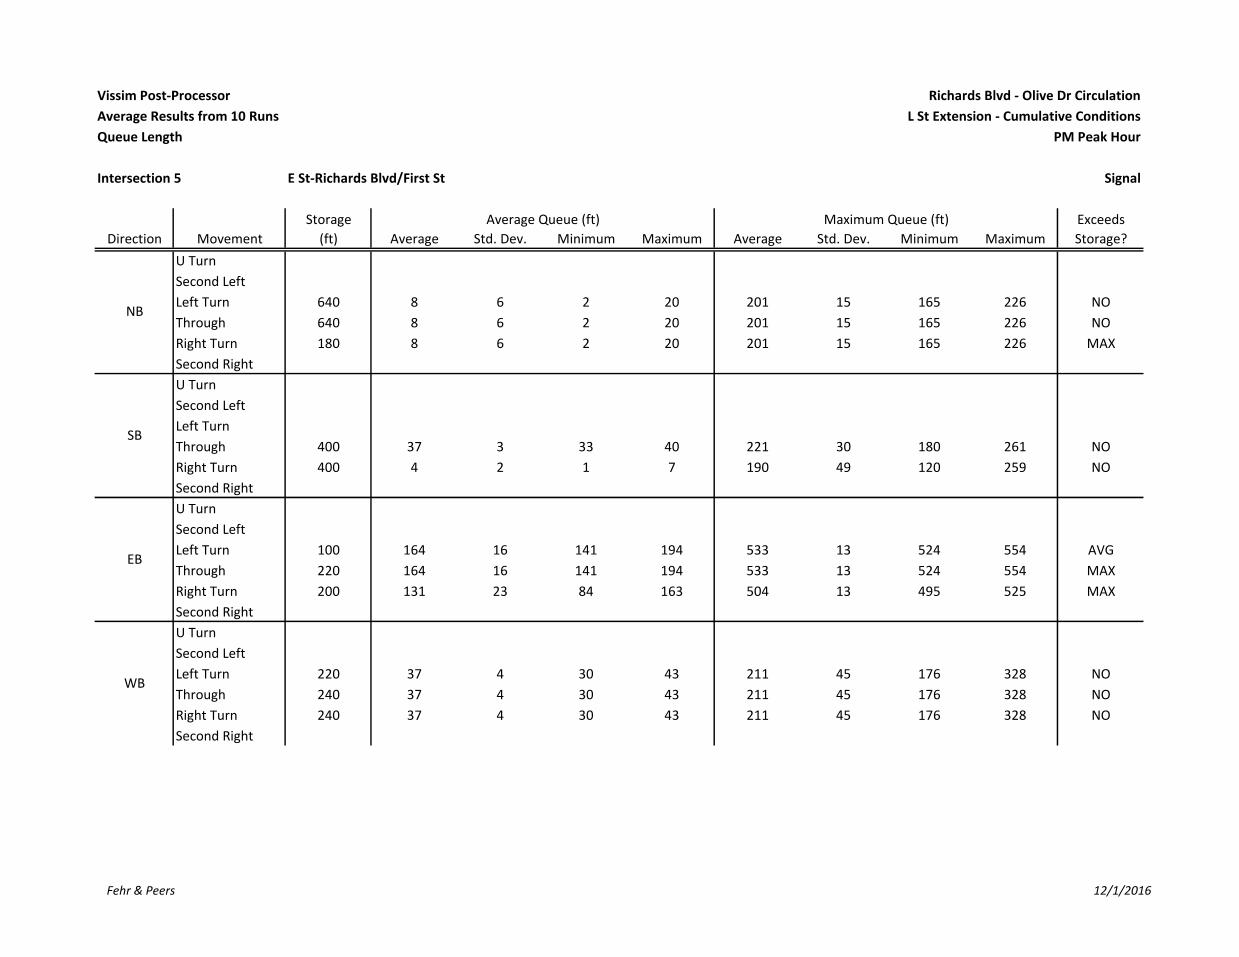
Vissim Post-Processor Richards Blvd - Olive Dr Circulation
Average Results from 10 Runs L St Extension - Cumulative Conditions
Queue Length PM Peak Hour
Intersection 5 E St-Richards Blvd/First St Signal
Storage Average Queue (ft) Maximum Queue (ft) Exceeds
Direction Movement (ft) Average Std. Dev. Minimum Maximum Average Std. Dev. Minimum Maximum Storage?
U Turn
Second Left
Left Turn 640 8 6 2 20 201 15 165 226 NO
Through 640 8 6 2 20 201 15 165 226 NO
Right Turn 180 8 6 2 20 201 15 165 226 MAX
Second Right
U Turn
Second Left
Left Turn
Through 400 37 3 33 40 221 30 180 261 NO
Right Turn 400 4 2 1 7 190 49 120 259 NO
Second Right
U Turn
Second Left
Left Turn 100 164 16 141 194 533 13 524 554 AVG
Through 220 164 16 141 194 533 13 524 554 MAX
Right Turn 200 131 23 84 163 504 13 495 525 MAX
Second Right
U Turn
Second Left
Left Turn 220 37 4 30 43 211 45 176 328 NO
Through 240 37 4 30 43 211 45 176 328 NO
Right Turn 240 37 4 30 43 211 45 176 328 NO
Second Right
NB
SB
EB
WB
Fehr & Peers 12/1/2016

Vissim Post-Processor Richards Blvd - Olive Dr Circulation
Average Results from 10 Runs L St Extension - Cumulative Conditions
Queue Length PM Peak Hour
Intersection 6 Richards Blvd/Olive Dr Signal
Storage Average Queue (ft) Maximum Queue (ft) Exceeds
Direction Movement (ft) Average Std. Dev. Minimum Maximum Average Std. Dev. Minimum Maximum Storage?
U Turn
Second Left
Left Turn 100 74 17 55 106 542 118 333 713 MAX
Through 1,540 73 19 53 113 534 118 326 703 NO
Right Turn 100 1 0 1 1 82 43 48 163 NO
Second Right
U Turn
Second Left
Left Turn 590 11 3 6 15 253 182 50 478 NO
Through 590 192 33 112 229 735 50 593 762 MAX
Right Turn 250 191 33 110 227 733 50 590 760 MAX
Second Right
U Turn
Second Left
Left Turn 225 16 6 9 28 106 26 68 140 NO
Through 600 34 2 31 37 201 49 130 290 NO
Right Turn 225 35 2 32 38 203 49 131 291 NO
Second Right
U Turn
Second Left
Left Turn 200 18 28 0 94 289 221 23 749 MAX
Through 2,000 18 28 0 94 289 221 23 749 NO
Right Turn 2,000 18 28 0 94 289 221 23 749 NO
Second Right
WB
NB
SB
EB
Fehr & Peers 12/1/2016

Vissim Post-Processor Richards Blvd - Olive Dr Circulation
Average Results from 10 Runs L St Extension - Cumulative Conditions
Queue Length PM Peak Hour
Intersection 7 Richards Blvd/I-80 WB Ramps Signal
Storage Average Queue (ft) Maximum Queue (ft) Exceeds
Direction Movement (ft) Average Std. Dev. Minimum Maximum Average Std. Dev. Minimum Maximum Storage?
U Turn
Second Left
Left Turn 800 60 5 53 68 294 41 251 371 NO
Through 800 7 2 4 9 285 100 141 453 NO
Right Turn
Second Right
U Turn
Second Left
Left Turn
Through 590 58 6 47 66 463 75 275 552 NO
Right Turn 200 11 3 6 18 257 40 206 334 MAX
Second Right
U Turn
Second Left
Left Turn
Through
Right Turn
Second Right
U Turn
Second Left
Left Turn 400 12 3 9 18 104 32 47 158 NO
Through
Right Turn 1,200 5 0 4 6 71 12 62 100 NO
Second Right
NB
SB
EB
WB
Fehr & Peers 12/1/2016

Vissim Post-Processor Richards Blvd - Olive Dr Circulation
Average Results from 10 Runs L St Extension - Cumulative Conditions
Queue Length PM Peak Hour
Intersection 8 Richards Blvd/I-80 EB Ramps Signal
Storage Average Queue (ft) Maximum Queue (ft) Exceeds
Direction Movement (ft) Average Std. Dev. Minimum Maximum Average Std. Dev. Minimum Maximum Storage?
U Turn
Second Left
Left Turn
Through 500 68 8 59 86 382 37 346 452 NO
Right Turn 500 48 7 40 65 352 37 316 423 NO
Second Right
U Turn
Second Left
Left Turn 360 41 4 34 49 209 22 179 244 NO
Through 1,300 16 2 13 20 216 29 174 257 NO
Right Turn
Second Right
U Turn
Second Left
Left Turn
Through
Right Turn
Second Right
U Turn
Second Left
Left Turn 160 60 10 53 88 265 43 207 346 MAX
Through
Right Turn 1,260 8 1 6 9 113 28 76 162 NO
Second Right
NB
SB
EB
WB
Fehr & Peers 12/1/2016

Vissim Post-Processor Richards Blvd - Olive Dr Circulation
Average Results from 10 Runs L St Extension - Cumulative Conditions
Queue Length PM Peak Hour
Intersection 9 Research Park Dr/Richards Blvd Signal
Storage Average Queue (ft) Maximum Queue (ft) Exceeds
Direction Movement (ft) Average Std. Dev. Minimum Maximum Average Std. Dev. Minimum Maximum Storage?
U Turn
Second Left
Left Turn 100 36 5 32 45 138 25 108 187 MAX
Through 620 5 1 4 8 102 22 66 139 NO
Right Turn
Second Right
U Turn
Second Left
Left Turn 120 14 5 8 24 180 185 70 636 MAX
Through 3,940 167 48 102 238 634 3 626 636 NO
Right Turn
Second Right
U Turn 440 166 41 119 252 515 61 369 555 MAX
Second Left
Left Turn 440 166 41 119 252 515 61 369 555 MAX
Through 440 82 6 72 94 502 59 364 557 MAX
Right Turn
Second Right
U Turn
Second Left
Left Turn 80 12 4 8 21 140 121 58 371 MAX
Through 180 108 17 87 135 620 130 446 840 MAX
Right Turn
Second Right
EB
WB
NB
SB
Fehr & Peers 12/1/2016

Vissim Post-Processor Richards Blvd - Olive Dr Circulation
Average Results from 10 Runs Olive Dr Off-Ramp Closure - Cumulative Conditions
Queue Length AM Peak Hour
Intersection 1 K St/Third St Side-street Stop
Storage Average Queue (ft) Maximum Queue (ft) Exceeds
Direction Movement (ft) Average Std. Dev. Minimum Maximum Average Std. Dev. Minimum Maximum Storage?
U Turn
Second Left
Left Turn 360 0 0 0 0 7 11 0 22 NO
Through 360 0 0 0 0 7 11 0 23 NO
Right Turn 360 0 0 0 0 2 7 0 21 NO
Second Right
U Turn
Second Left
Left Turn 420 3 1 2 4 68 21 50 115 NO
Through 3,700 3 1 2 4 68 21 50 115 NO
Right Turn 420 3 1 2 4 68 21 50 115 NO
Second Right
U Turn
Second Left
Left Turn 250 0 1 0 2 32 40 0 107 NO
Through 250 0 0 0 0 0 0 0 0 NO
Right Turn 250 0 1 0 3 34 42 0 111 NO
Second Right
U Turn
Second Left
Left Turn 250 0 0 0 0 30 32 0 89 NO
Through 250 0 0 0 0 71 10 65 94 NO
Right Turn 250 0 0 0 1 40 34 0 100 NO
Second Right
NB
SB
EB
WB
Fehr & Peers 12/2/2016

Vissim Post-Processor Richards Blvd - Olive Dr Circulation
Average Results from 10 Runs Olive Dr Off-Ramp Closure - Cumulative Conditions
Queue Length AM Peak Hour
Intersection 2 L St/Third St Side-street Stop
Storage Average Queue (ft) Maximum Queue (ft) Exceeds
Direction Movement (ft) Average Std. Dev. Minimum Maximum Average Std. Dev. Minimum Maximum Storage?
U Turn
Second Left
Left Turn 360 1 0 0 1 67 17 45 99 NO
Through 360 0 0 0 0 0 0 0 0 NO
Right Turn
Second Right
U Turn
Second Left
Left Turn
Through 420 0 0 0 0 0 0 0 0 NO
Right Turn 420 0 0 0 0 5 15 0 47 NO
Second Right
U Turn
Second Left
Left Turn 250 26 6 19 40 201 78 138 414 NO
Through
Right Turn 250 26 6 19 40 201 78 138 414 NO
Second Right
U Turn
Second Left
Left Turn
Through
Right Turn
Second Right
NB
SB
EB
WB
Fehr & Peers 12/2/2016

Vissim Post-Processor Richards Blvd - Olive Dr Circulation
Average Results from 10 Runs Olive Dr Off-Ramp Closure - Cumulative Conditions
Queue Length AM Peak Hour
Intersection 3 Arbor Apts Dwy (East)/Olive Dr Side-street Stop
Storage Average Queue (ft) Maximum Queue (ft) Exceeds
Direction Movement (ft) Average Std. Dev. Minimum Maximum Average Std. Dev. Minimum Maximum Storage?
U Turn
Second Left
Left Turn 460 0 0 0 0 35 14 22 59 NO
Through
Right Turn
Second Right
U Turn
Second Left
Left Turn
Through
Right Turn
Second Right
U Turn
Second Left
Left Turn
Through 2,000 0 0 0 0 0 0 0 0 NO
Right Turn 2,000 0 0 0 0 2 7 0 23 NO
Second Right
U Turn
Second Left
Left Turn 1,400 #VALUE! #VALUE! #VALUE! #VALUE! #VALUE! #VALUE! #VALUE! #VALUE! #VALUE!
Through 1,400 0 0 0 0 0 0 0 0 NO
Right Turn
Second Right
NB
SB
EB
WB
Fehr & Peers 12/2/2016

Vissim Post-Processor Richards Blvd - Olive Dr Circulation
Average Results from 10 Runs Olive Dr Off-Ramp Closure - Cumulative Conditions
Queue Length AM Peak Hour
Intersection 4 D St/First St Signal
Storage Average Queue (ft) Maximum Queue (ft) Exceeds
Direction Movement (ft) Average Std. Dev. Minimum Maximum Average Std. Dev. Minimum Maximum Storage?
U Turn
Second Left
Left Turn 100 7 2 4 10 77 19 60 112 NO
Through 100 7 2 4 10 77 19 60 112 NO
Right Turn 400 1 0 0 1 41 13 23 60 NO
Second Right
U Turn
Second Left
Left Turn 400 44 11 27 60 262 64 161 360 NO
Through 400 44 11 27 60 262 64 161 360 NO
Right Turn 400 8 7 3 28 165 84 67 365 NO
Second Right
U Turn
Second Left
Left Turn 80 2 2 1 8 129 111 48 381 MAX
Through 560 2 2 1 8 129 111 48 381 NO
Right Turn 560 2 2 1 8 129 111 48 381 NO
Second Right
U Turn
Second Left
Left Turn 100 7 1 6 9 69 22 42 116 NO
Through 240 6 4 1 13 302 85 124 355 MAX
Right Turn 24 6 4 2 14 303 85 125 357 MAX
Second Right
NB
SB
EB
WB
Fehr & Peers 12/2/2016

Vissim Post-Processor Richards Blvd - Olive Dr Circulation
Average Results from 10 Runs Olive Dr Off-Ramp Closure - Cumulative Conditions
Queue Length AM Peak Hour
Intersection 5 E St-Richards Blvd/First St Signal
Storage Average Queue (ft) Maximum Queue (ft) Exceeds
Direction Movement (ft) Average Std. Dev. Minimum Maximum Average Std. Dev. Minimum Maximum Storage?
U Turn
Second Left
Left Turn 640 34 6 21 40 224 16 209 249 NO
Through 640 34 6 21 40 224 16 209 249 NO
Right Turn 180 34 6 21 40 224 16 209 249 MAX
Second Right
U Turn
Second Left
Left Turn
Through 400 39 2 36 42 232 32 198 289 NO
Right Turn 400 2 2 1 7 166 39 108 231 NO
Second Right
U Turn
Second Left
Left Turn 100 61 23 26 102 397 112 158 496 MAX
Through 220 61 23 26 102 397 112 158 496 MAX
Right Turn 200 19 3 13 23 329 81 228 419 MAX
Second Right
U Turn
Second Left
Left Turn 220 68 10 59 91 282 51 226 365 MAX
Through 240 68 10 59 91 282 51 226 365 MAX
Right Turn 240 68 10 59 91 282 51 226 365 MAX
Second Right
NB
SB
EB
WB
Fehr & Peers 12/2/2016

Vissim Post-Processor Richards Blvd - Olive Dr Circulation
Average Results from 10 Runs Olive Dr Off-Ramp Closure - Cumulative Conditions
Queue Length AM Peak Hour
Intersection 6 Richards Blvd/Olive Dr Signal
Storage Average Queue (ft) Maximum Queue (ft) Exceeds
Direction Movement (ft) Average Std. Dev. Minimum Maximum Average Std. Dev. Minimum Maximum Storage?
U Turn
Second Left
Left Turn 100 228 25 185 263 571 10 566 595 AVG
Through 1,540 205 29 155 244 564 10 558 588 NO
Right Turn 100 0 0 0 0 25 13 0 45 NO
Second Right
U Turn
Second Left
Left Turn 590 16 5 11 25 307 228 89 693 NO
Through 590 82 10 63 99 629 81 522 747 MAX
Right Turn 250 82 10 63 99 629 81 522 747 MAX
Second Right
U Turn
Second Left
Left Turn 225 11 3 7 17 97 23 65 132 NO
Through 600 7 1 6 8 73 11 61 94 NO
Right Turn 225 7 1 6 9 74 11 62 95 NO
Second Right
U Turn
Second Left
Left Turn 200 13 2 11 17 109 29 69 157 NO
Through 2,000 18 4 12 24 162 29 120 218 NO
Right Turn 2,000 24 4 17 30 172 29 129 228 NO
Second Right
WB
NB
SB
EB
Fehr & Peers 12/2/2016
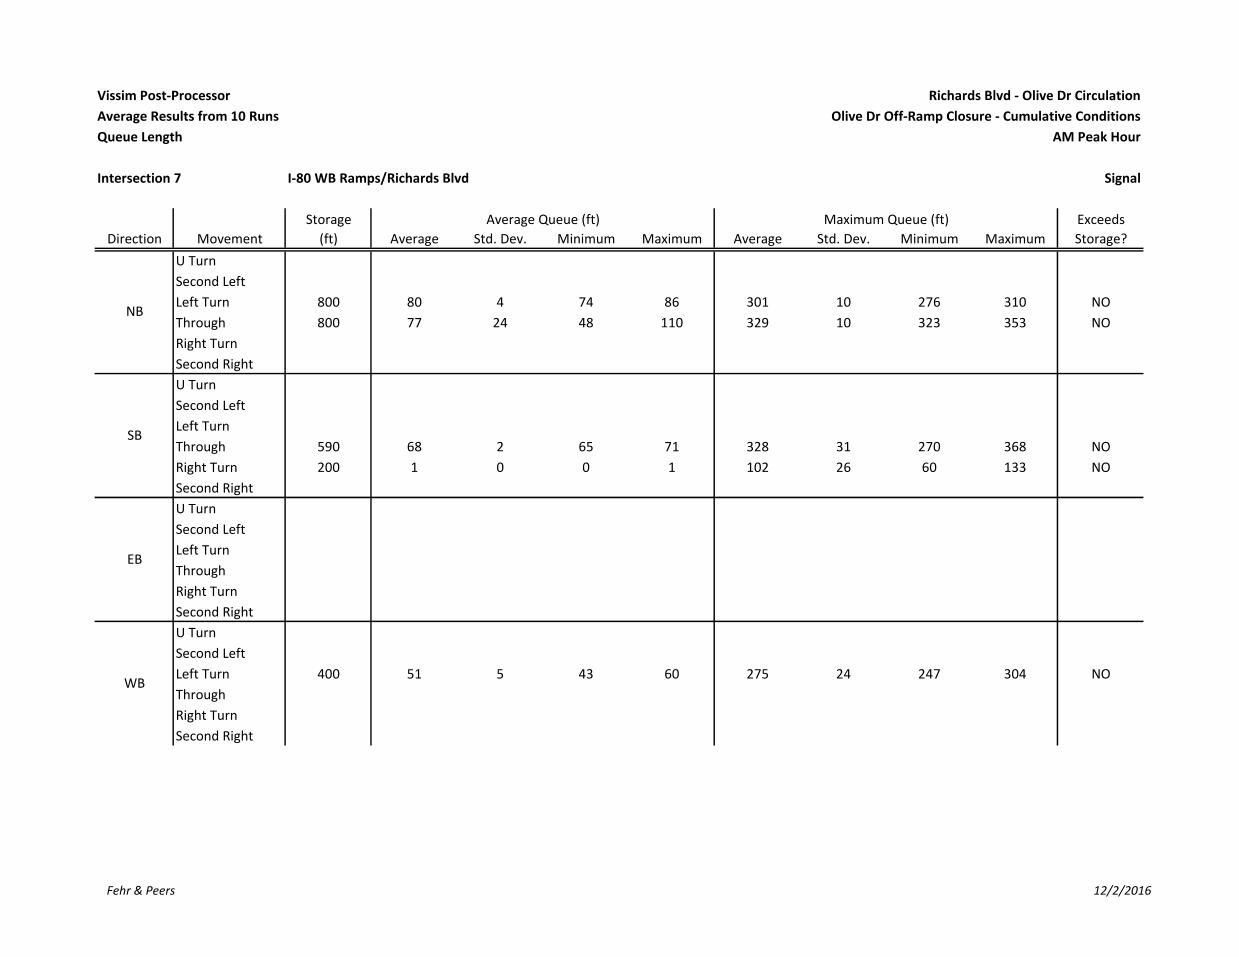
Vissim Post-Processor Richards Blvd - Olive Dr Circulation
Average Results from 10 Runs Olive Dr Off-Ramp Closure - Cumulative Conditions
Queue Length AM Peak Hour
Intersection 7 I-80 WB Ramps/Richards Blvd Signal
Storage Average Queue (ft) Maximum Queue (ft) Exceeds
Direction Movement (ft) Average Std. Dev. Minimum Maximum Average Std. Dev. Minimum Maximum Storage?
U Turn
Second Left
Left Turn 800 80 4 74 86 301 10 276 310 NO
Through 800 77 24 48 110 329 10 323 353 NO
Right Turn
Second Right
U Turn
Second Left
Left Turn
Through 590 68 2 65 71 328 31 270 368 NO
Right Turn 200 1 0 0 1 102 26 60 133 NO
Second Right
U Turn
Second Left
Left Turn
Through
Right Turn
Second Right
U Turn
Second Left
Left Turn 400 51 5 43 60 275 24 247 304 NO
Through
Right Turn
Second Right
NB
SB
EB
WB
Fehr & Peers 12/2/2016

Vissim Post-Processor Richards Blvd - Olive Dr Circulation
Average Results from 10 Runs Olive Dr Off-Ramp Closure - Cumulative Conditions
Queue Length AM Peak Hour
Intersection 8 I-80 EB Ramps/Richards Blvd Signal
Storage Average Queue (ft) Maximum Queue (ft) Exceeds
Direction Movement (ft) Average Std. Dev. Minimum Maximum Average Std. Dev. Minimum Maximum Storage?
U Turn
Second Left
Left Turn
Through 500 95 11 81 114 462 33 414 530 NO
Right Turn 500 76 10 64 95 432 33 384 500 NO
Second Right
U Turn
Second Left
Left Turn 360 29 2 25 32 183 28 135 231 NO
Through 1,300 15 2 12 17 184 27 144 223 NO
Right Turn
Second Right
U Turn
Second Left
Left Turn
Through
Right Turn
Second Right
U Turn
Second Left
Left Turn 160 42 2 38 46 242 38 184 298 MAX
Through
Right Turn 1,260 19 8 9 34 192 54 111 276 NO
Second Right
NB
SB
EB
WB
Fehr & Peers 12/2/2016

Vissim Post-Processor Richards Blvd - Olive Dr Circulation
Average Results from 10 Runs Olive Dr Off-Ramp Closure - Cumulative Conditions
Queue Length AM Peak Hour
Intersection 9 Research Park Dr/Richards Blvd Signal
Storage Average Queue (ft) Maximum Queue (ft) Exceeds
Direction Movement (ft) Average Std. Dev. Minimum Maximum Average Std. Dev. Minimum Maximum Storage?
U Turn
Second Left
Left Turn 100 29 6 22 43 131 27 89 178 MAX
Through 620 1 1 0 3 54 24 22 92 NO
Right Turn
Second Right
U Turn
Second Left
Left Turn 120 6 1 5 7 62 13 45 89 NO
Through 3,940 13 3 9 17 164 38 112 225 NO
Right Turn
Second Right
U Turn 440 127 17 108 159 495 47 413 536 MAX
Second Left
Left Turn 440 127 17 108 159 495 47 413 536 MAX
Through 440 37 5 30 44 324 51 272 460 NO
Right Turn
Second Right
U Turn
Second Left
Left Turn 80 18 8 12 38 176 222 66 798 MAX
Through 180 169 28 140 222 1,003 163 740 1,168 MAX
Right Turn
Second Right
EB
WB
NB
SB
Fehr & Peers 12/2/2016
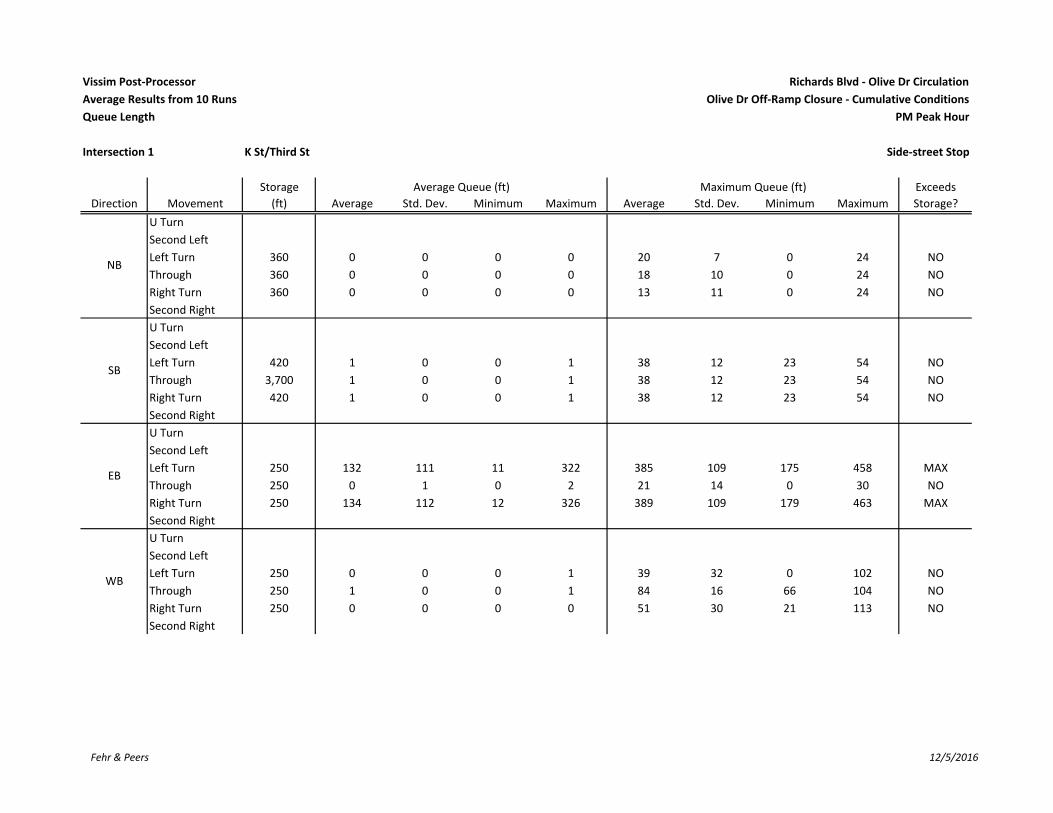
Vissim Post‐Processor Richards Blvd ‐ Olive Dr Circulation
Average Results from 10 Runs Olive Dr Off‐Ramp Closure ‐ Cumulative Conditions
Queue Length PM Peak Hour
Intersection 1 K St/Third St Side‐street Stop
Storage Average Queue (ft) Maximum Queue (ft) Exceeds
Direction Movement (ft) Average Std. Dev. Minimum Maximum Average Std. Dev. Minimum Maximum Storage?
U Turn
Second Left
Left Turn 360 0 0 0 0 20 7 0 24 NO
Through 360 0 0 0 0 18 10 0 24 NO
Right Turn 360 0 0 0 0 13 11 0 24 NO
Second Right
U Turn
Second Left
Left Turn 420 1 0 0 1 38 12 23 54 NO
Through 3,700 1 0 0 1 38 12 23 54 NO
Right Turn 420 1 0 0 1 38 12 23 54 NO
Second Right
U Turn
Second Left
Left Turn 250 132 111 11 322 385 109 175 458 MAX
Through 250 0 1 0 2 21 14 0 30 NO
Right Turn 250 134 112 12 326 389 109 179 463 MAX
Second Right
U Turn
Second Left
Left Turn 250 0 0 0 1 39 32 0 102 NO
Through 250 1 0 0 1 84 16 66 104 NO
Right Turn 250 0 0 0 0 51 30 21 113 NO
Second Right
NB
SB
EB
WB
Fehr & Peers 12/5/2016

Vissim Post‐Processor Richards Blvd ‐ Olive Dr Circulation
Average Results from 10 Runs Olive Dr Off‐Ramp Closure ‐ Cumulative Conditions
Queue Length PM Peak Hour
Intersection 2 L St/Third St Side‐street Stop
Storage Average Queue (ft) Maximum Queue (ft) Exceeds
Direction Movement (ft) Average Std. Dev. Minimum Maximum Average Std. Dev. Minimum Maximum Storage?
U Turn
Second Left
Left Turn 360 2 0 1 2 106 35 66 175 NO
Through 360 0 0 0 0 0 0 0 0 NO
Right Turn
Second Right
U Turn
Second Left
Left Turn
Through 420 0 0 0 0 0 0 0 0 NO
Right Turn 420 0 0 0 0 13 21 0 48 NO
Second Right
U Turn
Second Left
Left Turn 250 299 176 85 584 677 123 429 765 AVG
Through
Right Turn 250 299 176 85 584 677 123 429 765 AVG
Second Right
U Turn
Second Left
Left Turn
Through
Right Turn
Second Right
NB
SB
EB
WB
Fehr & Peers 12/5/2016

Vissim Post‐Processor Richards Blvd ‐ Olive Dr Circulation
Average Results from 10 Runs Olive Dr Off‐Ramp Closure ‐ Cumulative Conditions
Queue Length PM Peak Hour
Intersection 3 Arbor Apts Dwy (East)/Olive Dr Side‐street Stop
Storage Average Queue (ft) Maximum Queue (ft) Exceeds
Direction Movement (ft) Average Std. Dev. Minimum Maximum Average Std. Dev. Minimum Maximum Storage?
U Turn
Second Left
Left Turn 460 0 0 0 0 32 15 22 60 NO
Through
Right Turn
Second Right
U Turn
Second Left
Left Turn
Through
Right Turn
Second Right
U Turn
Second Left
Left Turn
Through 2,000 0 0 0 0 0 0 0 0 NO
Right Turn 2,000 0 0 0 0 11 12 0 24 NO
Second Right
U Turn
Second Left
Left Turn
Through 1,400 0 0 0 0 0 0 0 0 NO
Right Turn
Second Right
NB
SB
EB
WB
Fehr & Peers 12/5/2016

Vissim Post‐Processor Richards Blvd ‐ Olive Dr Circulation
Average Results from 10 Runs Olive Dr Off‐Ramp Closure ‐ Cumulative Conditions
Queue Length PM Peak Hour
Intersection 4 D St/First St Signal
Storage Average Queue (ft) Maximum Queue (ft) Exceeds
Direction Movement (ft) Average Std. Dev. Minimum Maximum Average Std. Dev. Minimum Maximum Storage?
U Turn
Second Left
Left Turn 100 10 2 7 13 107 23 72 156 MAX
Through 100 10 2 7 13 107 23 72 156 MAX
Right Turn 400 2 1 2 4 73 24 44 118 NO
Second Right
U Turn
Second Left
Left Turn 400 112 34 63 173 431 31 344 445 MAX
Through 400 112 34 63 173 431 31 344 445 MAX
Right Turn 400 24 11 5 40 380 87 208 449 NO
Second Right
U Turn
Second Left
Left Turn 80 87 62 19 168 633 176 417 845 AVG
Through 560 87 62 19 168 633 176 417 845 MAX
Right Turn 560 87 62 19 168 633 176 417 845 MAX
Second Right
U Turn
Second Left
Left Turn 100 11 1 8 12 94 12 74 115 NO
Through 240 29 5 23 40 336 33 253 354 MAX
Right Turn 24 30 5 24 41 338 33 254 356 AVG
Second Right
NB
SB
EB
WB
Fehr & Peers 12/5/2016

Vissim Post‐Processor Richards Blvd ‐ Olive Dr Circulation
Average Results from 10 Runs Olive Dr Off‐Ramp Closure ‐ Cumulative Conditions
Queue Length PM Peak Hour
Intersection 5 E St‐Richards Blvd/First St Signal
Storage Average Queue (ft) Maximum Queue (ft) Exceeds
Direction Movement (ft) Average Std. Dev. Minimum Maximum Average Std. Dev. Minimum Maximum Storage?
U Turn
Second Left
Left Turn 640 3 3 0 9 186 49 69 234 NO
Through 640 3 3 0 9 186 49 69 234 NO
Right Turn 180 3 3 0 9 186 49 69 234 MAX
Second Right
U Turn
Second Left
Left Turn
Through 400 66 15 52 97 348 62 257 416 NO
Right Turn 400 9 7 1 25 271 99 161 418 NO
Second Right
U Turn
Second Left
Left Turn 100 55 21 31 99 483 42 364 498 MAX
Through 220 55 21 31 99 483 42 364 498 MAX
Right Turn 200 144 27 105 188 497 1 495 500 MAX
Second Right
U Turn
Second Left
Left Turn 220 67 11 55 90 297 53 218 402 MAX
Through 240 67 11 55 90 297 53 218 402 MAX
Right Turn 240 67 11 55 90 297 53 218 402 MAX
Second Right
NB
SB
EB
WB
Fehr & Peers 12/5/2016
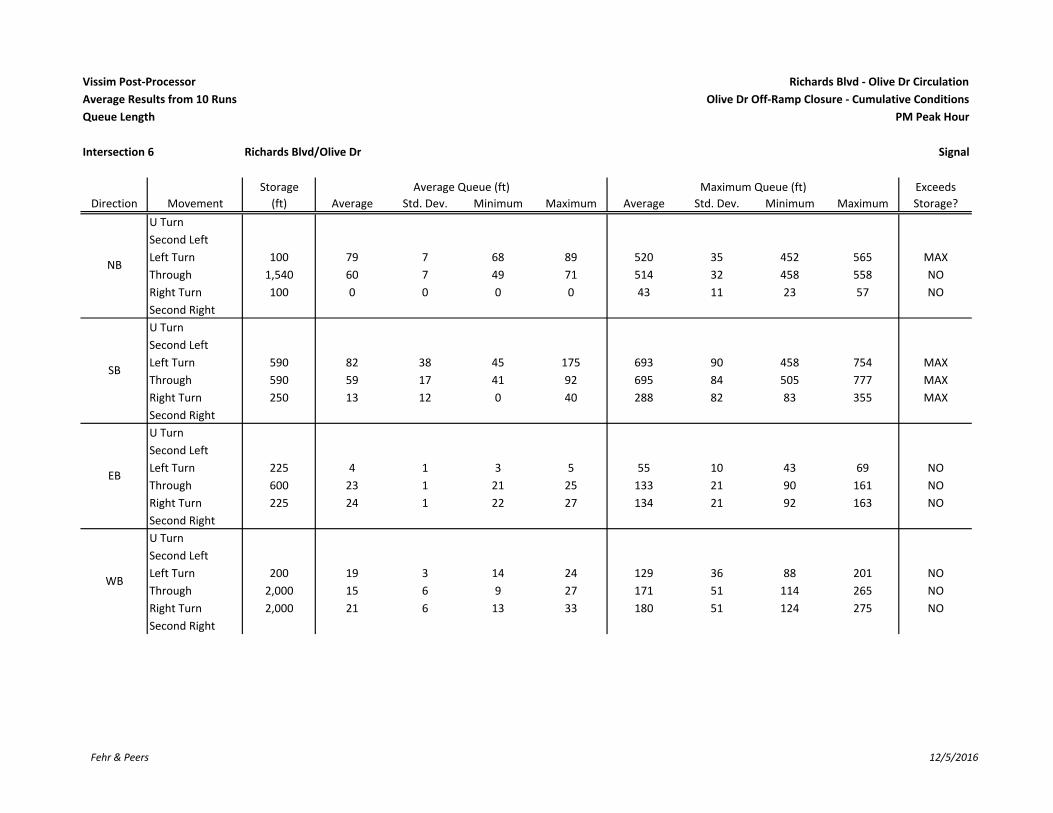
Vissim Post‐Processor Richards Blvd ‐ Olive Dr Circulation
Average Results from 10 Runs Olive Dr Off‐Ramp Closure ‐ Cumulative Conditions
Queue Length PM Peak Hour
Intersection 6 Richards Blvd/Olive Dr Signal
Storage Average Queue (ft) Maximum Queue (ft) Exceeds
Direction Movement (ft) Average Std. Dev. Minimum Maximum Average Std. Dev. Minimum Maximum Storage?
U Turn
Second Left
Left Turn 100 79 7 68 89 520 35 452 565 MAX
Through 1,540 60 7 49 71 514 32 458 558 NO
Right Turn 100 0 0 0 0 43 11 23 57 NO
Second Right
U Turn
Second Left
Left Turn 590 82 38 45 175 693 90 458 754 MAX
Through 590 59 17 41 92 695 84 505 777 MAX
Right Turn 250 13 12 0 40 288 82 83 355 MAX
Second Right
U Turn
Second Left
Left Turn 225 4 1 3 5 55 10 43 69 NO
Through 600 23 1 21 25 133 21 90 161 NO
Right Turn 225 24 1 22 27 134 21 92 163 NO
Second Right
U Turn
Second Left
Left Turn 200 19 3 14 24 129 36 88 201 NO
Through 2,000 15 6 9 27 171 51 114 265 NO
Right Turn 2,000 21 6 13 33 180 51 124 275 NO
Second Right
WB
NB
SB
EB
Fehr & Peers 12/5/2016

Vissim Post‐Processor Richards Blvd ‐ Olive Dr Circulation
Average Results from 10 Runs Olive Dr Off‐Ramp Closure ‐ Cumulative Conditions
Queue Length PM Peak Hour
Intersection 7 I‐80 WB Ramps/Richards Blvd Signal
Storage Average Queue (ft) Maximum Queue (ft) Exceeds
Direction Movement (ft) Average Std. Dev. Minimum Maximum Average Std. Dev. Minimum Maximum Storage?
U Turn
Second Left
Left Turn 800 94 4 90 101 310 2 307 312 NO
Through 800 10 2 6 14 276 42 174 316 NO
Right Turn
Second Right
U Turn
Second Left
Left Turn
Through 590 93 10 79 113 514 48 447 582 NO
Right Turn 200 13 5 7 22 279 48 212 347 MAX
Second Right
U Turn
Second Left
Left Turn
Through
Right Turn
Second Right
U Turn
Second Left
Left Turn 400 28 4 23 35 179 38 117 249 NO
Through
Right Turn
Second Right
NB
SB
EB
WB
Fehr & Peers 12/5/2016
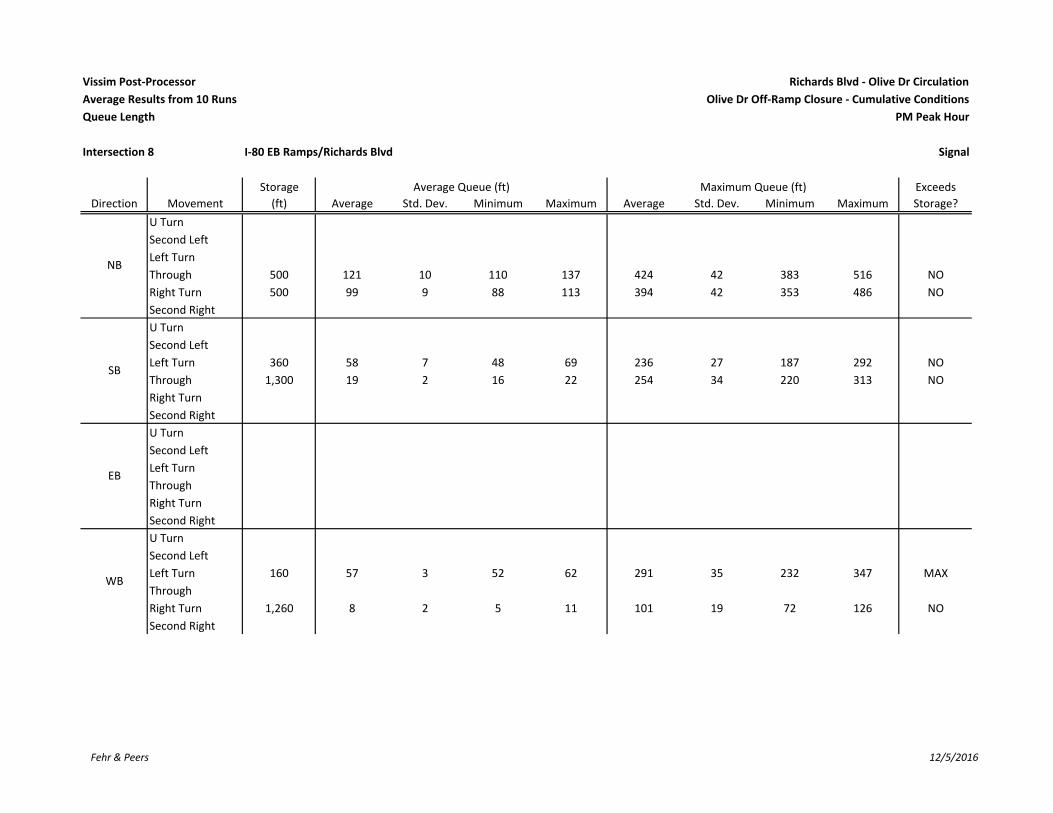
Vissim Post‐Processor Richards Blvd ‐ Olive Dr Circulation
Average Results from 10 Runs Olive Dr Off‐Ramp Closure ‐ Cumulative Conditions
Queue Length PM Peak Hour
Intersection 8 I‐80 EB Ramps/Richards Blvd Signal
Storage Average Queue (ft) Maximum Queue (ft) Exceeds
Direction Movement (ft) Average Std. Dev. Minimum Maximum Average Std. Dev. Minimum Maximum Storage?
U Turn
Second Left
Left Turn
Through 500 121 10 110 137 424 42 383 516 NO
Right Turn 500 99 9 88 113 394 42 353 486 NO
Second Right
U Turn
Second Left
Left Turn 360 58 7 48 69 236 27 187 292 NO
Through 1,300 19 2 16 22 254 34 220 313 NO
Right Turn
Second Right
U Turn
Second Left
Left Turn
Through
Right Turn
Second Right
U Turn
Second Left
Left Turn 160 57 3 52 62 291 35 232 347 MAX
Through
Right Turn 1,260 8 2 5 11 101 19 72 126 NO
Second Right
NB
SB
EB
WB
Fehr & Peers 12/5/2016
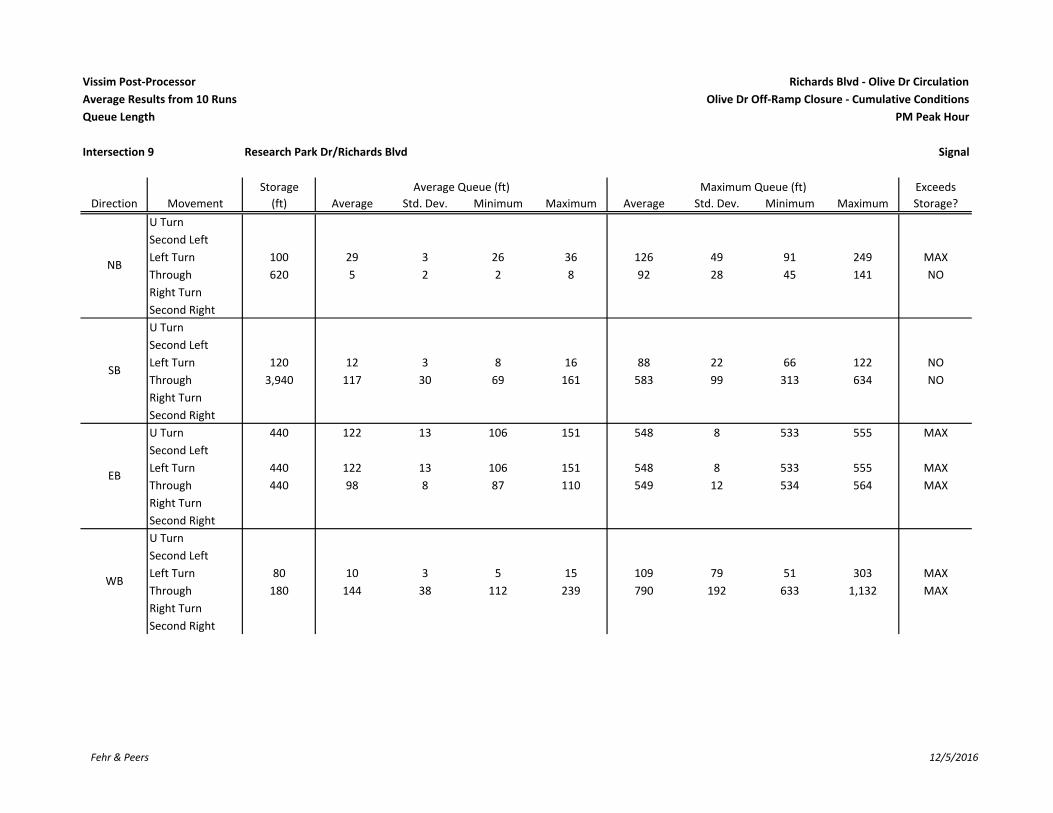
Vissim Post‐Processor Richards Blvd ‐ Olive Dr Circulation
Average Results from 10 Runs Olive Dr Off‐Ramp Closure ‐ Cumulative Conditions
Queue Length PM Peak Hour
Intersection 9 Research Park Dr/Richards Blvd Signal
Storage Average Queue (ft) Maximum Queue (ft) Exceeds
Direction Movement (ft) Average Std. Dev. Minimum Maximum Average Std. Dev. Minimum Maximum Storage?
U Turn
Second Left
Left Turn 100 29 3 26 36 126 49 91 249 MAX
Through 620 5 2 2 8 92 28 45 141 NO
Right Turn
Second Right
U Turn
Second Left
Left Turn 120 12 3 8 16 88 22 66 122 NO
Through 3,940 117 30 69 161 583 99 313 634 NO
Right Turn
Second Right
U Turn 440 122 13 106 151 548 8 533 555 MAX
Second Left
Left Turn 440 122 13 106 151 548 8 533 555 MAX
Through 440 98 8 87 110 549 12 534 564 MAX
Right Turn
Second Right
U Turn
Second Left
Left Turn 80 10 3 5 15 109 79 51 303 MAX
Through 180 144 38 112 239 790 192 633 1,132 MAX
Right Turn
Second Right
EB
WB
NB
SB
Fehr & Peers 12/5/2016

Vissim Post‐Processor Richards Blvd ‐ Olive Dr Circulation
Average Results from 10 Runs L St Extension & Olive Dr Off‐Ramp Closure ‐ Cumulative Conditions
Queue Length AM Peak Hour
Intersection 1 K St/Third St Signal
Storage Average Queue (ft) Maximum Queue (ft) Exceeds
Direction Movement (ft) Average Std. Dev. Minimum Maximum Average Std. Dev. Minimum Maximum Storage?
U Turn
Second Left
Left Turn 420 41 5 32 47 267 51 175 330 NO
Through 420 41 5 32 47 267 51 175 330 NO
Right Turn 150 42 5 33 48 268 51 176 331 MAX
Second Right
U Turn
Second Left
Left Turn 420 2 1 1 4 52 13 23 68 NO
Through 3,700 2 1 1 4 52 13 23 68 NO
Right Turn 420 3 1 1 5 54 13 25 70 NO
Second Right
U Turn
Second Left
Left Turn 100 2 1 1 4 128 34 72 196 MAX
Through 250 2 1 1 4 128 34 72 196 NO
Right Turn 250 2 1 1 4 128 34 72 196 NO
Second Right
U Turn
Second Left
Left Turn 100 1 0 0 1 104 47 34 174 MAX
Through 250 1 0 0 1 104 47 34 174 NO
Right Turn 250 1 0 0 1 104 47 34 174 NO
Second Right
NB
SB
EB
WB
Fehr & Peers 12/2/2016
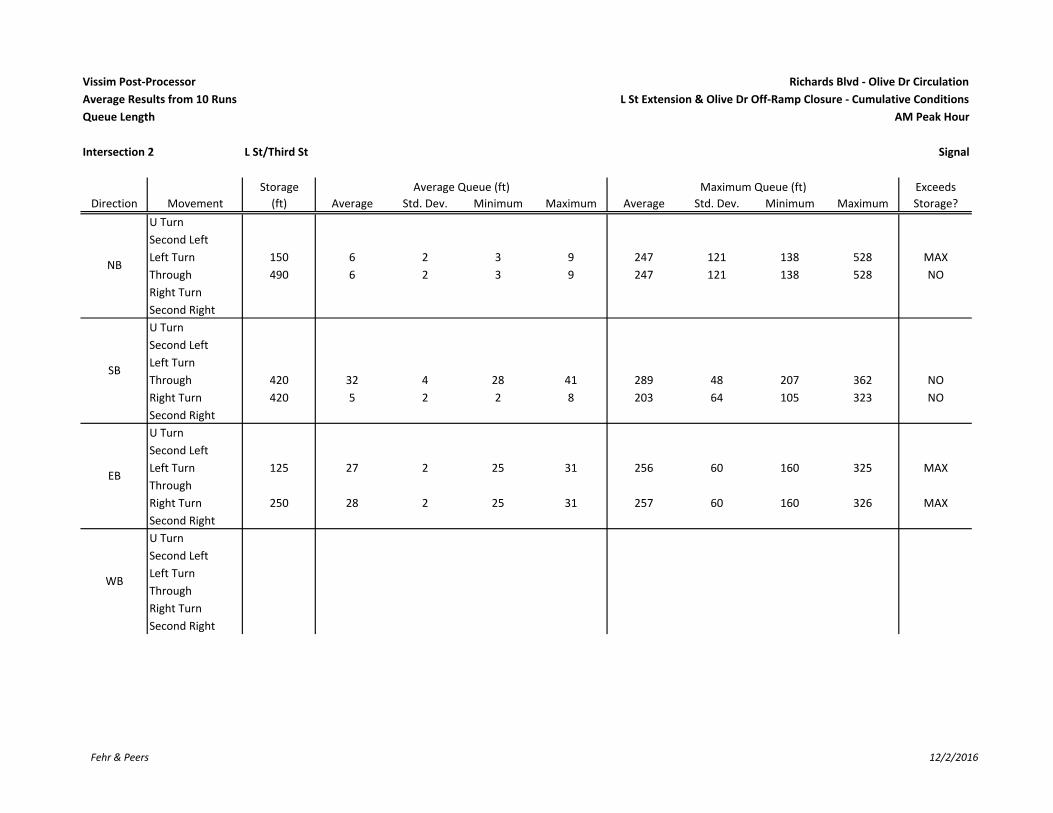
Vissim Post‐Processor Richards Blvd ‐ Olive Dr Circulation
Average Results from 10 Runs L St Extension & Olive Dr Off‐Ramp Closure ‐ Cumulative Conditions
Queue Length AM Peak Hour
Intersection 2 L St/Third St Signal
Storage Average Queue (ft) Maximum Queue (ft) Exceeds
Direction Movement (ft) Average Std. Dev. Minimum Maximum Average Std. Dev. Minimum Maximum Storage?
U Turn
Second Left
Left Turn 150 6 2 3 9 247 121 138 528 MAX
Through 490 6 2 3 9 247 121 138 528 NO
Right Turn
Second Right
U Turn
Second Left
Left Turn
Through 420 32 4 28 41 289 48 207 362 NO
Right Turn 420 5 2 2 8 203 64 105 323 NO
Second Right
U Turn
Second Left
Left Turn 125 27 2 25 31 256 60 160 325 MAX
Through
Right Turn 250 28 2 25 31 257 60 160 326 MAX
Second Right
U Turn
Second Left
Left Turn
Through
Right Turn
Second Right
NB
SB
EB
WB
Fehr & Peers 12/2/2016
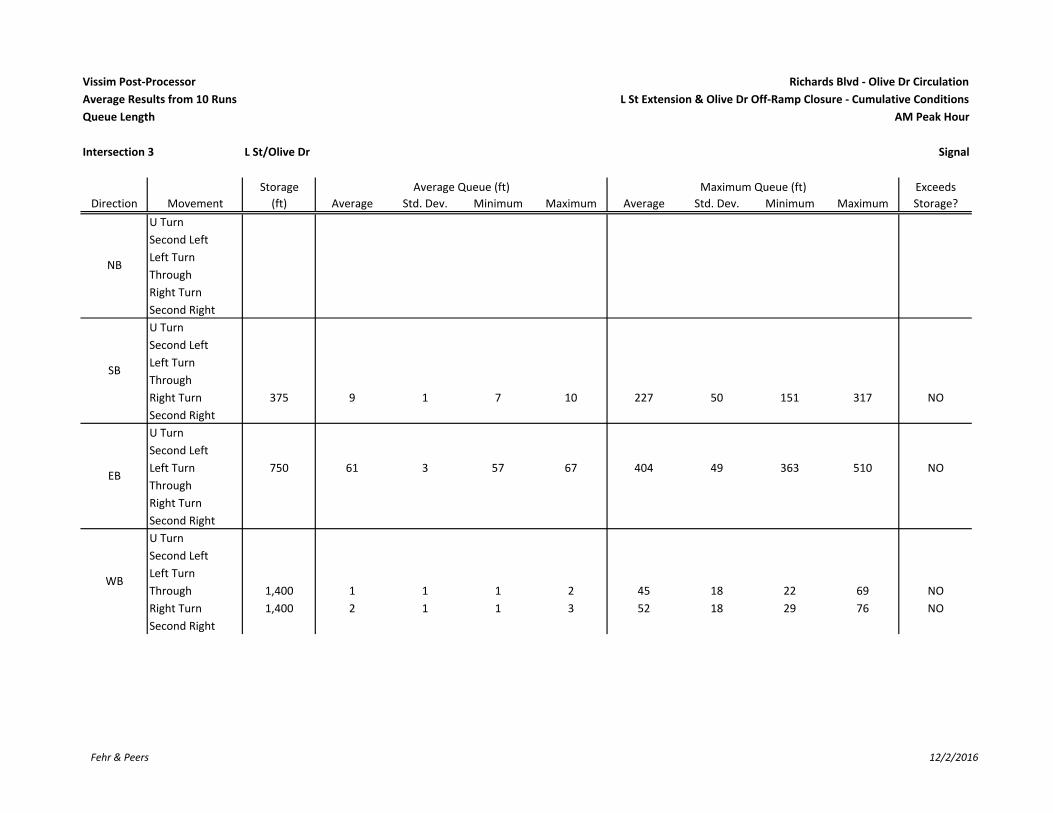
Vissim Post‐Processor Richards Blvd ‐ Olive Dr Circulation
Average Results from 10 Runs L St Extension & Olive Dr Off‐Ramp Closure ‐ Cumulative Conditions
Queue Length AM Peak Hour
Intersection 3 L St/Olive Dr Signal
Storage Average Queue (ft) Maximum Queue (ft) Exceeds
Direction Movement (ft) Average Std. Dev. Minimum Maximum Average Std. Dev. Minimum Maximum Storage?
U Turn
Second Left
Left Turn
Through
Right Turn
Second Right
U Turn
Second Left
Left Turn
Through
Right Turn 375 9 1 7 10 227 50 151 317 NO
Second Right
U Turn
Second Left
Left Turn 750 61 3 57 67 404 49 363 510 NO
Through
Right Turn
Second Right
U Turn
Second Left
Left Turn
Through 1,400 1 1 1 2 45 18 22 69 NO
Right Turn 1,400 2 1 1 3 52 18 29 76 NO
Second Right
SB
EB
WB
NB
Fehr & Peers 12/2/2016

Vissim Post‐Processor Richards Blvd ‐ Olive Dr Circulation
Average Results from 10 Runs L St Extension & Olive Dr Off‐Ramp Closure ‐ Cumulative Conditions
Queue Length AM Peak Hour
Intersection 4 D St/First St Signal
Storage Average Queue (ft) Maximum Queue (ft) Exceeds
Direction Movement (ft) Average Std. Dev. Minimum Maximum Average Std. Dev. Minimum Maximum Storage?
U Turn
Second Left
Left Turn 100 5 1 3 9 67 24 45 113 NO
Through 100 5 1 3 9 67 24 45 113 NO
Right Turn 400 0 0 0 1 45 10 23 61 NO
Second Right
U Turn
Second Left
Left Turn 400 19 3 15 25 147 21 117 182 NO
Through 400 19 3 15 25 147 21 117 182 NO
Right Turn 400 1 0 1 1 53 32 24 113 NO
Second Right
U Turn
Second Left
Left Turn 80 1 0 1 2 98 54 48 205 MAX
Through 560 1 0 1 2 98 54 48 205 NO
Right Turn 560 1 0 1 2 98 54 48 205 NO
Second Right
U Turn
Second Left
Left Turn 100 10 3 6 16 84 26 45 129 NO
Through 240 4 2 2 10 236 107 94 363 NO
Right Turn 24 5 2 3 10 238 107 95 365 MAX
Second Right
NB
SB
EB
WB
Fehr & Peers 12/2/2016

Vissim Post‐Processor Richards Blvd ‐ Olive Dr Circulation
Average Results from 10 Runs L St Extension & Olive Dr Off‐Ramp Closure ‐ Cumulative Conditions
Queue Length AM Peak Hour
Intersection 5 E St‐Richards Blvd/First St Signal
Storage Average Queue (ft) Maximum Queue (ft) Exceeds
Direction Movement (ft) Average Std. Dev. Minimum Maximum Average Std. Dev. Minimum Maximum Storage?
U Turn
Second Left
Left Turn 640 2 2 0 6 158 49 58 204 NO
Through 640 2 2 0 6 158 49 58 204 NO
Right Turn 180 2 2 0 6 158 49 58 204 NO
Second Right
U Turn
Second Left
Left Turn
Through 400 34 3 29 39 215 33 184 301 NO
Right Turn 400 2 2 1 5 147 49 52 207 NO
Second Right
U Turn
Second Left
Left Turn 100 38 2 34 42 455 86 259 519 MAX
Through 220 38 2 34 42 455 86 259 519 MAX
Right Turn 200 26 4 20 32 423 85 231 491 MAX
Second Right
U Turn
Second Left
Left Turn 220 21 2 19 23 135 24 100 174 NO
Through 240 21 2 19 23 135 24 100 174 NO
Right Turn 240 21 2 19 23 135 24 100 174 NO
Second Right
NB
SB
EB
WB
Fehr & Peers 12/2/2016
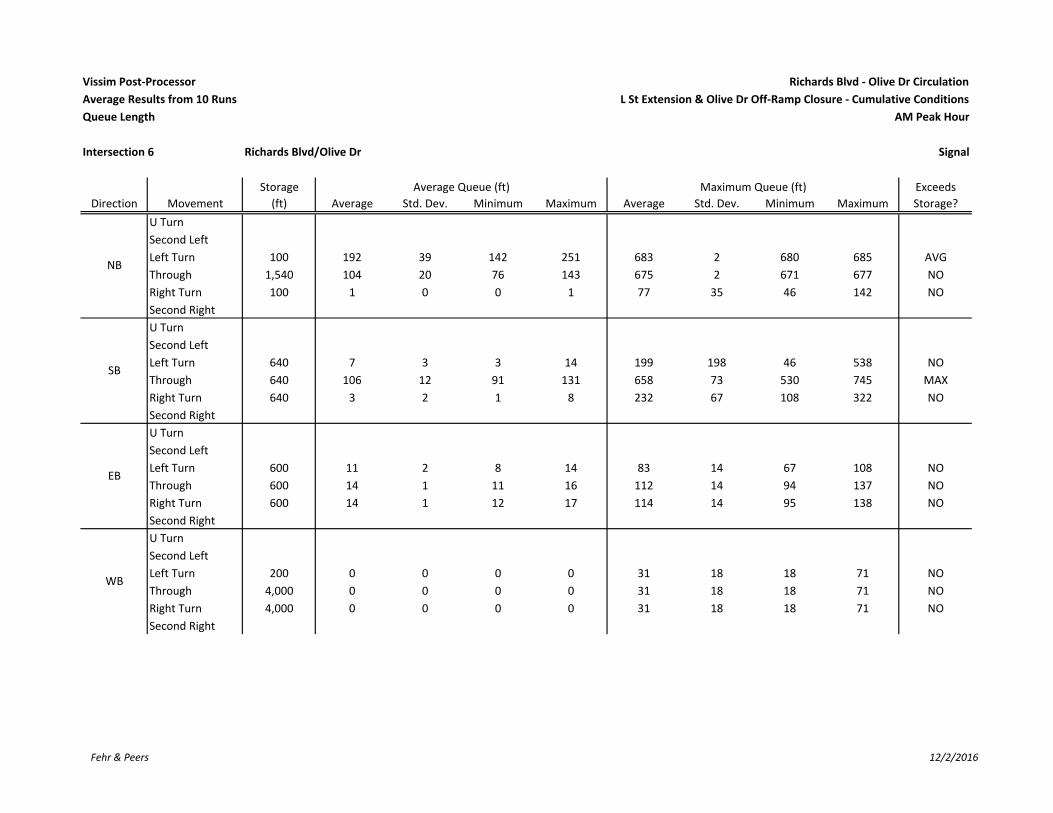
Vissim Post‐Processor Richards Blvd ‐ Olive Dr Circulation
Average Results from 10 Runs L St Extension & Olive Dr Off‐Ramp Closure ‐ Cumulative Conditions
Queue Length AM Peak Hour
Intersection 6 Richards Blvd/Olive Dr Signal
Storage Average Queue (ft) Maximum Queue (ft) Exceeds
Direction Movement (ft) Average Std. Dev. Minimum Maximum Average Std. Dev. Minimum Maximum Storage?
U Turn
Second Left
Left Turn 100 192 39 142 251 683 2 680 685 AVG
Through 1,540 104 20 76 143 675 2 671 677 NO
Right Turn 100 1 0 0 1 77 35 46 142 NO
Second Right
U Turn
Second Left
Left Turn 640 7 3 3 14 199 198 46 538 NO
Through 640 106 12 91 131 658 73 530 745 MAX
Right Turn 640 3 2 1 8 232 67 108 322 NO
Second Right
U Turn
Second Left
Left Turn 600 11 2 8 14 83 14 67 108 NO
Through 600 14 1 11 16 112 14 94 137 NO
Right Turn 600 14 1 12 17 114 14 95 138 NO
Second Right
U Turn
Second Left
Left Turn 200 0 0 0 0 31 18 18 71 NO
Through 4,000 0 0 0 0 31 18 18 71 NO
Right Turn 4,000 0 0 0 0 31 18 18 71 NO
Second Right
NB
SB
EB
WB
Fehr & Peers 12/2/2016
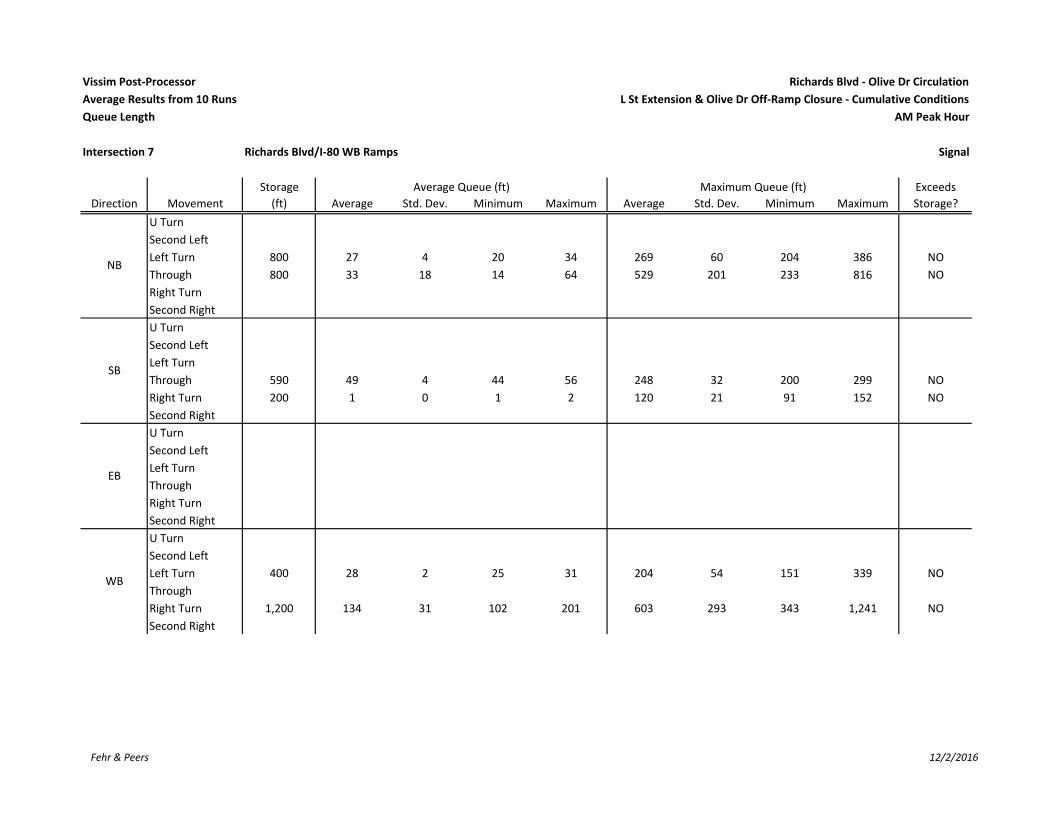
Vissim Post‐Processor Richards Blvd ‐ Olive Dr Circulation
Average Results from 10 Runs L St Extension & Olive Dr Off‐Ramp Closure ‐ Cumulative Conditions
Queue Length AM Peak Hour
Intersection 7 Richards Blvd/I‐80 WB Ramps Signal
Storage Average Queue (ft) Maximum Queue (ft) Exceeds
Direction Movement (ft) Average Std. Dev. Minimum Maximum Average Std. Dev. Minimum Maximum Storage?
U Turn
Second Left
Left Turn 800 27 4 20 34 269 60 204 386 NO
Through 800 33 18 14 64 529 201 233 816 NO
Right Turn
Second Right
U Turn
Second Left
Left Turn
Through 590 49 4 44 56 248 32 200 299 NO
Right Turn 200 1 0 1 2 120 21 91 152 NO
Second Right
U Turn
Second Left
Left Turn
Through
Right Turn
Second Right
U Turn
Second Left
Left Turn 400 28 2 25 31 204 54 151 339 NO
Through
Right Turn 1,200 134 31 102 201 603 293 343 1,241 NO
Second Right
NB
SB
EB
WB
Fehr & Peers 12/2/2016

Vissim Post‐Processor Richards Blvd ‐ Olive Dr Circulation
Average Results from 10 Runs L St Extension & Olive Dr Off‐Ramp Closure ‐ Cumulative Conditions
Queue Length AM Peak Hour
Intersection 8 Richards Blvd/I‐80 EB Ramps Signal
Storage Average Queue (ft) Maximum Queue (ft) Exceeds
Direction Movement (ft) Average Std. Dev. Minimum Maximum Average Std. Dev. Minimum Maximum Storage?
U Turn
Second Left
Left Turn
Through 500 34 4 29 40 450 39 397 494 NO
Right Turn 500 20 3 16 26 421 39 368 465 NO
Second Right
U Turn
Second Left
Left Turn 360 54 2 51 58 166 30 117 212 NO
Through 1,300 2 0 1 2 62 29 24 120 NO
Right Turn
Second Right
U Turn
Second Left
Left Turn
Through
Right Turn
Second Right
U Turn
Second Left
Left Turn 160 73 2 69 76 332 47 274 393 MAX
Through
Right Turn 1,260 14 3 11 19 167 47 109 263 NO
Second Right
SB
EB
WB
NB
Fehr & Peers 12/2/2016

Vissim Post‐Processor Richards Blvd ‐ Olive Dr Circulation
Average Results from 10 Runs L St Extension & Olive Dr Off‐Ramp Closure ‐ Cumulative Conditions
Queue Length AM Peak Hour
Intersection 9 Research Park Dr/Richards Blvd Signal
Storage Average Queue (ft) Maximum Queue (ft) Exceeds
Direction Movement (ft) Average Std. Dev. Minimum Maximum Average Std. Dev. Minimum Maximum Storage?
U Turn
Second Left
Left Turn 100 18 2 15 21 107 19 82 139 MAX
Through 620 1 0 0 1 53 10 44 76 NO
Right Turn
Second Right
U Turn
Second Left
Left Turn 120 7 1 5 9 69 14 53 97 NO
Through 3,940 10 2 8 12 154 37 115 228 NO
Right Turn
Second Right
U Turn 440 65 11 52 85 440 77 340 551 NO
Second Left
Left Turn 440 65 11 52 85 440 77 340 551 NO
Through 440 43 5 37 49 328 47 277 418 NO
Right Turn
Second Right
U Turn
Second Left
Left Turn 80 51 38 17 121 900 380 254 1,145 MAX
Through 180 378 70 241 459 1,141 7 1,133 1,156 AVG
Right Turn
Second Right
WB
NB
SB
EB
Fehr & Peers 12/2/2016

Vissim Post‐Processor Richards Blvd ‐ Olive Dr Circulation
Average Results from 10 Runs L St Extension & Olive Dr Off‐Ramp Closure ‐ Cumulative Conditions
Queue Length PM Peak Hour
Intersection 1 K St/Third St Signal
Storage Average Queue (ft) Maximum Queue (ft) Exceeds
Direction Movement (ft) Average Std. Dev. Minimum Maximum Average Std. Dev. Minimum Maximum Storage?
U Turn
Second Left
Left Turn 420 58 8 47 72 403 94 298 602 NO
Through 420 58 8 47 72 403 94 298 602 NO
Right Turn 150 59 8 48 73 405 94 300 603 MAX
Second Right
U Turn
Second Left
Left Turn 420 8 2 5 12 84 20 62 117 NO
Through 3,700 8 2 5 12 84 20 62 117 NO
Right Turn 420 8 2 5 13 85 20 64 118 NO
Second Right
U Turn
Second Left
Left Turn 100 209 30 147 229 320 12 313 351 AVG
Through 250 209 30 147 229 320 12 313 351 MAX
Right Turn 250 209 30 147 229 320 12 313 351 MAX
Second Right
U Turn
Second Left
Left Turn 100 17 4 7 22 189 7 182 208 MAX
Through 250 17 4 7 22 189 7 182 208 NO
Right Turn 250 17 4 7 22 189 7 182 208 NO
Second Right
NB
SB
EB
WB
Fehr & Peers 12/2/2016

Vissim Post‐Processor Richards Blvd ‐ Olive Dr Circulation
Average Results from 10 Runs L St Extension & Olive Dr Off‐Ramp Closure ‐ Cumulative Conditions
Queue Length PM Peak Hour
Intersection 2 L St/Third St Signal
Storage Average Queue (ft) Maximum Queue (ft) Exceeds
Direction Movement (ft) Average Std. Dev. Minimum Maximum Average Std. Dev. Minimum Maximum Storage?
U Turn
Second Left
Left Turn 150 20 5 13 31 366 104 139 527 MAX
Through 490 20 5 13 31 366 104 139 527 NO
Right Turn
Second Right
U Turn
Second Left
Left Turn
Through 420 69 19 43 96 443 2 442 447 MAX
Right Turn 420 105 45 35 157 351 15 340 379 NO
Second Right
U Turn
Second Left
Left Turn 125 51 6 38 58 335 9 323 353 MAX
Through
Right Turn 250 52 6 39 59 336 9 324 354 MAX
Second Right
U Turn
Second Left
Left Turn
Through
Right Turn
Second Right
NB
SB
EB
WB
Fehr & Peers 12/2/2016

Vissim Post‐Processor Richards Blvd ‐ Olive Dr Circulation
Average Results from 10 Runs L St Extension & Olive Dr Off‐Ramp Closure ‐ Cumulative Conditions
Queue Length PM Peak Hour
Intersection 3 L St/Olive Dr Signal
Storage Average Queue (ft) Maximum Queue (ft) Exceeds
Direction Movement (ft) Average Std. Dev. Minimum Maximum Average Std. Dev. Minimum Maximum Storage?
U Turn
Second Left
Left Turn
Through
Right Turn
Second Right
U Turn
Second Left
Left Turn
Through
Right Turn 375 2 0 1 3 119 54 60 224 NO
Second Right
U Turn
Second Left
Left Turn 750 4 1 3 6 177 35 119 231 NO
Through
Right Turn
Second Right
U Turn
Second Left
Left Turn
Through 1,400 3 1 2 4 63 19 46 112 NO
Right Turn 1,400 5 1 4 5 70 19 53 119 NO
Second Right
NB
SB
EB
WB
Fehr & Peers 12/2/2016

Vissim Post‐Processor Richards Blvd ‐ Olive Dr Circulation
Average Results from 10 Runs L St Extension & Olive Dr Off‐Ramp Closure ‐ Cumulative Conditions
Queue Length PM Peak Hour
Intersection 4 D St/First St Signal
Storage Average Queue (ft) Maximum Queue (ft) Exceeds
Direction Movement (ft) Average Std. Dev. Minimum Maximum Average Std. Dev. Minimum Maximum Storage?
U Turn
Second Left
Left Turn 100 27 7 16 39 203 75 101 298 MAX
Through 100 27 7 16 39 203 75 101 298 MAX
Right Turn 400 5 2 3 8 119 69 68 304 NO
Second Right
U Turn
Second Left
Left Turn 400 382 30 314 404 446 5 443 459 MAX
Through 400 382 30 314 404 446 5 443 459 MAX
Right Turn 400 198 76 51 304 450 5 447 464 MAX
Second Right
U Turn
Second Left
Left Turn 80 259 41 202 351 821 11 808 845 AVG
Through 560 259 41 202 351 821 11 808 845 MAX
Right Turn 560 259 41 202 351 821 11 808 845 MAX
Second Right
U Turn
Second Left
Left Turn 100 20 6 15 35 154 79 92 353 MAX
Through 240 28 8 19 41 350 13 315 361 MAX
Right Turn 24 29 8 19 42 352 13 317 363 AVG
Second Right
NB
SB
EB
WB
Fehr & Peers 12/2/2016

Vissim Post‐Processor Richards Blvd ‐ Olive Dr Circulation
Average Results from 10 Runs L St Extension & Olive Dr Off‐Ramp Closure ‐ Cumulative Conditions
Queue Length PM Peak Hour
Intersection 5 E St‐Richards Blvd/First St Signal
Storage Average Queue (ft) Maximum Queue (ft) Exceeds
Direction Movement (ft) Average Std. Dev. Minimum Maximum Average Std. Dev. Minimum Maximum Storage?
U Turn
Second Left
Left Turn 640 20 6 8 29 216 11 199 236 NO
Through 640 20 6 8 29 216 11 199 236 NO
Right Turn 180 20 6 8 29 216 11 199 236 MAX
Second Right
U Turn
Second Left
Left Turn
Through 400 40 6 32 49 242 56 177 353 NO
Right Turn 400 4 4 1 11 167 70 70 282 NO
Second Right
U Turn
Second Left
Left Turn 100 193 15 171 216 530 8 525 552 AVG
Through 220 193 15 171 216 530 8 525 552 MAX
Right Turn 200 209 23 172 248 501 8 496 523 AVG
Second Right
U Turn
Second Left
Left Turn 220 41 8 33 62 189 44 145 272 NO
Through 240 41 8 33 62 189 44 145 272 NO
Right Turn 240 41 8 33 62 189 44 145 272 NO
Second Right
NB
SB
EB
WB
Fehr & Peers 12/2/2016
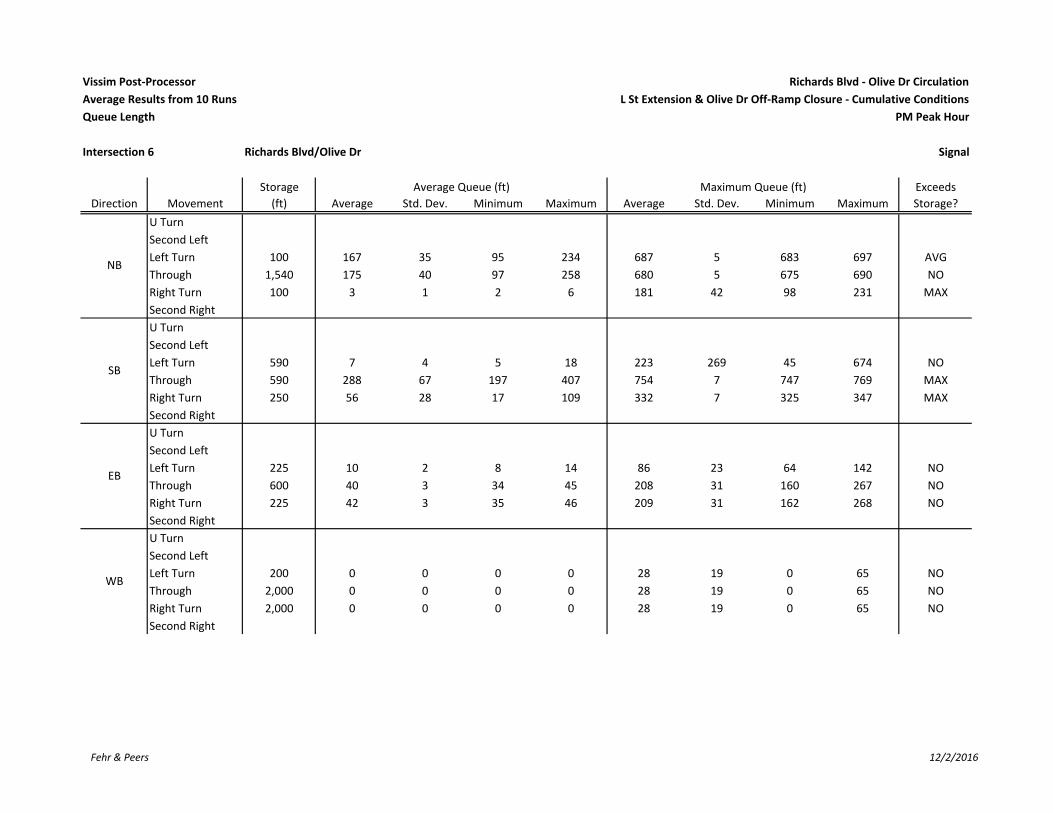
Vissim Post‐Processor Richards Blvd ‐ Olive Dr Circulation
Average Results from 10 Runs L St Extension & Olive Dr Off‐Ramp Closure ‐ Cumulative Conditions
Queue Length PM Peak Hour
Intersection 6 Richards Blvd/Olive Dr Signal
Storage Average Queue (ft) Maximum Queue (ft) Exceeds
Direction Movement (ft) Average Std. Dev. Minimum Maximum Average Std. Dev. Minimum Maximum Storage?
U Turn
Second Left
Left Turn 100 167 35 95 234 687 5 683 697 AVG
Through 1,540 175 40 97 258 680 5 675 690 NO
Right Turn 100 3 1 2 6 181 42 98 231 MAX
Second Right
U Turn
Second Left
Left Turn 590 7 4 5 18 223 269 45 674 NO
Through 590 288 67 197 407 754 7 747 769 MAX
Right Turn 250 56 28 17 109 332 7 325 347 MAX
Second Right
U Turn
Second Left
Left Turn 225 10 2 8 14 86 23 64 142 NO
Through 600 40 3 34 45 208 31 160 267 NO
Right Turn 225 42 3 35 46 209 31 162 268 NO
Second Right
U Turn
Second Left
Left Turn 200 0 0 0 0 28 19 0 65 NO
Through 2,000 0 0 0 0 28 19 0 65 NO
Right Turn 2,000 0 0 0 0 28 19 0 65 NO
Second Right
WB
NB
SB
EB
Fehr & Peers 12/2/2016

Vissim Post‐Processor Richards Blvd ‐ Olive Dr Circulation
Average Results from 10 Runs L St Extension & Olive Dr Off‐Ramp Closure ‐ Cumulative Conditions
Queue Length PM Peak Hour
Intersection 7 Richards Blvd/I‐80 WB Ramps Signal
Storage Average Queue (ft) Maximum Queue (ft) Exceeds
Direction Movement (ft) Average Std. Dev. Minimum Maximum Average Std. Dev. Minimum Maximum Storage?
U Turn
Second Left
Left Turn 800 47 4 38 53 276 31 241 335 NO
Through 800 74 48 9 173 718 236 280 917 NO
Right Turn
Second Right
U Turn
Second Left
Left Turn
Through 590 117 16 97 157 567 74 492 666 NO
Right Turn 200 22 7 13 37 333 75 257 430 MAX
Second Right
U Turn
Second Left
Left Turn
Through
Right Turn
Second Right
U Turn
Second Left
Left Turn 400 19 3 15 23 144 22 113 186 NO
Through
Right Turn 1,200 49 7 44 67 239 54 177 377 NO
Second Right
NB
SB
EB
WB
Fehr & Peers 12/2/2016

Vissim Post‐Processor Richards Blvd ‐ Olive Dr Circulation
Average Results from 10 Runs L St Extension & Olive Dr Off‐Ramp Closure ‐ Cumulative Conditions
Queue Length PM Peak Hour
Intersection 8 Richards Blvd/I‐80 EB Ramps Signal
Storage Average Queue (ft) Maximum Queue (ft) Exceeds
Direction Movement (ft) Average Std. Dev. Minimum Maximum Average Std. Dev. Minimum Maximum Storage?
U Turn
Second Left
Left Turn
Through 500 93 22 72 133 496 55 418 570 NO
Right Turn 500 73 21 53 112 466 55 389 540 NO
Second Right
U Turn
Second Left
Left Turn 360 63 3 57 68 228 11 211 249 NO
Through 1,300 5 1 4 8 182 40 114 249 NO
Right Turn
Second Right
U Turn
Second Left
Left Turn
Through
Right Turn
Second Right
U Turn
Second Left
Left Turn 160 72 2 68 75 297 26 251 326 MAX
Through
Right Turn 1,260 13 7 7 31 160 96 73 385 NO
Second Right
NB
SB
EB
WB
Fehr & Peers 12/2/2016
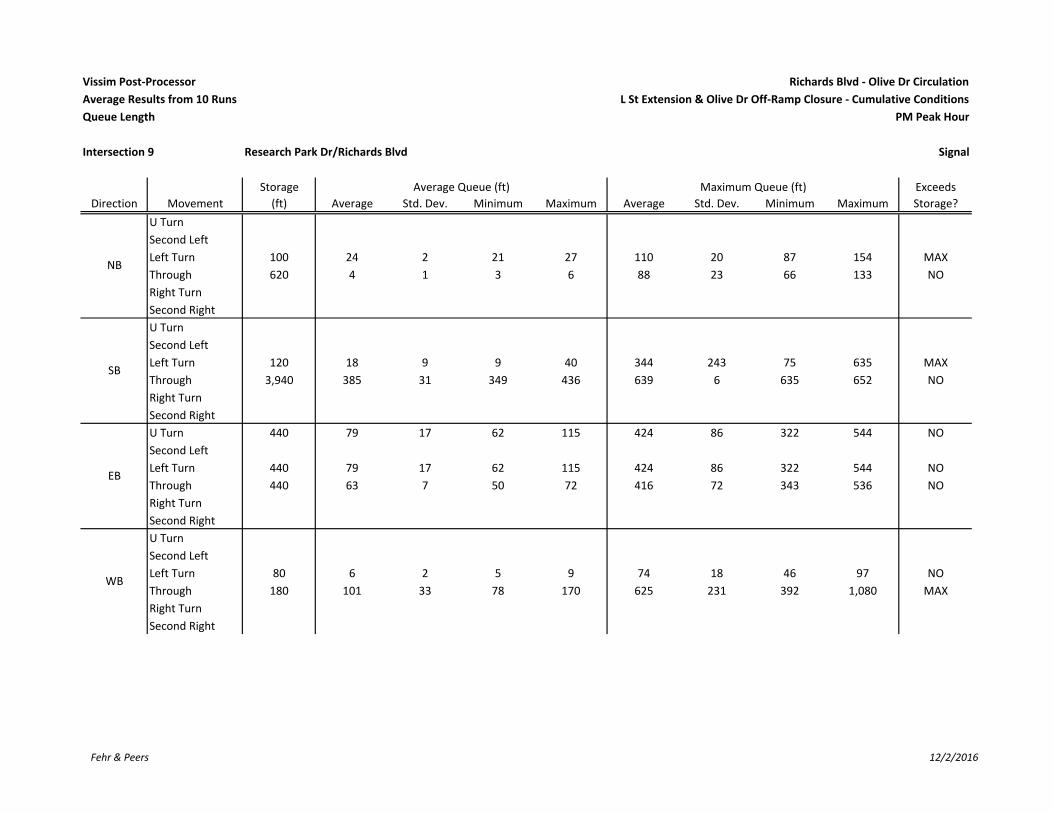
Vissim Post‐Processor Richards Blvd ‐ Olive Dr Circulation
Average Results from 10 Runs L St Extension & Olive Dr Off‐Ramp Closure ‐ Cumulative Conditions
Queue Length PM Peak Hour
Intersection 9 Research Park Dr/Richards Blvd Signal
Storage Average Queue (ft) Maximum Queue (ft) Exceeds
Direction Movement (ft) Average Std. Dev. Minimum Maximum Average Std. Dev. Minimum Maximum Storage?
U Turn
Second Left
Left Turn 100 24 2 21 27 110 20 87 154 MAX
Through 620 4 1 3 6 88 23 66 133 NO
Right Turn
Second Right
U Turn
Second Left
Left Turn 120 18 9 9 40 344 243 75 635 MAX
Through 3,940 385 31 349 436 639 6 635 652 NO
Right Turn
Second Right
U Turn 440 79 17 62 115 424 86 322 544 NO
Second Left
Left Turn 440 79 17 62 115 424 86 322 544 NO
Through 440 63 7 50 72 416 72 343 536 NO
Right Turn
Second Right
U Turn
Second Left
Left Turn 80 6 2 5 9 74 18 46 97 NO
Through 180 101 33 78 170 625 231 392 1,080 MAX
Right Turn
Second Right
EB
WB
NB
SB
Fehr & Peers 12/2/2016

Vissim Post-Processor Richards Blvd - Olive Dr Circulation
Average Results from 10 Runs No Build with Lincoln 40 - Cumulative Conditions
Volume and Delay by Movement AM Peak Hour
Intersection 1 K St/Third St Side-street Stop
Demand Total Delay (sec/veh)
Direction Movement Volume (vph) Average Percent Average Std. Dev. LOS
Left Turn 3 2 56.7% 0.6 1.5 A
Through 1 1 70.0% 0.0 0.1 A
Right Turn 2 2 80.0% 0.4 0.5 A
Subtotal 6 4 66.7% 1.0 1.4 A
Left Turn 22 21 95.9% 12.2 2.2 B
Through 1 1 140.0% 5.3 7.2 A
Right Turn 77 77 99.7% 7.8 1.7 A
Subtotal 100 99 99.3% 8.8 1.6 A
Left Turn 18 17 91.7% 2.0 1.3 A
Through 270 282 104.5% 5.3 5.0 A
Right Turn 4 4 110.0% 1.9 4.3 A
Subtotal 292 303 103.8% 5.0 4.7 A
Left Turn 2 2 115.0% 3.4 7.2 A
Through 299 290 97.0% 0.3 0.1 A
Right Turn 3 3 110.0% 0.6 0.7 A
Subtotal 304 296 97.3% 0.3 0.1 A
Total 702 702 100.0% 3.6 2.1 A
13.2
Intersection 2 L St/Third St Side-street Stop
Demand Total Delay (sec/veh)
Direction Movement Volume (vph) Average Percent Average Std. Dev. LOS
Left Turn 222 218 98.1% 2.0 0.4 A
Through 191 195 102.2% 0.8 0.3 A
Right Turn
Subtotal 413 413 100.0% 1.4 0.3 A
Left Turn
Through 223 226 101.5% 0.1 0.1 A
Right Turn 82 78 94.9% 0.8 0.2 A
Subtotal 305 304 99.7% 0.3 0.1 A
Left Turn 113 123 108.9% 21.6 5.5 C
Through
Right Turn 181 182 100.6% 19.4 4.9 C
Subtotal 294 305 103.8% 20.4 5.0 C
Left Turn
Through
Right Turn
Subtotal
Total 1,012 1,022 101.0% 6.7 1.6 A
19.4
NB
SB
EB
WB
Served Volume (vph)
NB
SB
EB
WB
Served Volume (vph)
Fehr & Peers 12/1/2016

Vissim Post-Processor Richards Blvd - Olive Dr Circulation
Average Results from 10 Runs No Build with Lincoln 40 - Cumulative Conditions
Volume and Delay by Movement AM Peak Hour
Intersection 3 Arbor Apts Dwy (East)/Olive Dr Side-street Stop
Demand Total Delay (sec/veh)
Direction Movement Volume (vph) Average Percent Average Std. Dev. LOS
Left Turn 24 20 85.0% 5.8 0.7 A
Through
Right Turn
Subtotal 24 20 85.0% 5.8 0.7 A
Left Turn
Through
Right Turn
Subtotal
Left Turn
Through 21 15 71.9% 1.6 1.6 A
Right Turn 12 13 109.2% 1.6 1.4 A
Subtotal 33 28 85.5% 1.9 1.3 A
Left Turn 2 2 80.0% 0.3 0.4 A
Through 160 152 95.1% 0.3 0.2 A
Right Turn
Subtotal 162 154 94.9% 0.3 0.1 A
Total 219 202 92.4% 1.1 0.3 A
5.5
Intersection 4 D St/First St Signal
Demand Total Delay (sec/veh)
Direction Movement Volume (vph) Average Percent Average Std. Dev. LOS
Left Turn 14 14 100.7% 37.4 21.4 D
Through 17 16 92.9% 31.0 11.9 C
Right Turn 31 33 104.8% 24.7 14.8 C
Subtotal 62 62 100.6% 28.8 5.7 C
Left Turn 85 73 85.4% 379.4 337.4 F
Through 29 25 86.2% 353.5 345.6 F
Right Turn 68 58 85.6% 278.4 325.8 F
Subtotal 182 156 85.6% 337.2 329.5 F
Left Turn 28 28 98.9% 102.4 74.6 F
Through 229 236 103.1% 70.1 71.0 E
Right Turn 32 29 89.1% 47.6 53.5 D
Subtotal 289 292 101.1% 71.4 70.4 E
Left Turn 33 31 93.9% 63.5 10.6 E
Through 483 470 97.4% 6.6 2.5 A
Right Turn 51 46 90.2% 3.3 1.5 A
Subtotal 567 547 96.5% 10.0 2.3 A
Total 1,100 1,058 96.2% 68.1 31.1 E
136.2
EB
WB
Served Volume (vph)
NB
SB
Served Volume (vph)
NB
SB
EB
WB
Fehr & Peers 12/1/2016

Vissim Post-Processor Richards Blvd - Olive Dr Circulation
Average Results from 10 Runs No Build with Lincoln 40 - Cumulative Conditions
Volume and Delay by Movement AM Peak Hour
Intersection 5 E St-Richards Blvd/First St Signal
Demand Total Delay (sec/veh)
Direction Movement Volume (vph) Average Percent Average Std. Dev. LOS
Left Turn 526 509 96.7% 59.1 5.1 E
Through 100 91 91.1% 56.9 6.1 E
Right Turn 299 272 90.8% 29.3 5.3 C
Subtotal 925 871 94.2% 49.3 4.8 D
Left Turn 1 1 100.0% 5.7 18.0 A
Through 188 182 97.0% 42.1 5.8 D
Right Turn 16 18 113.8% 22.5 15.4 C
Subtotal 205 202 98.3% 40.9 6.6 D
Left Turn 9 8 91.1% 129.2 92.0 F
Through 76 80 105.0% 169.3 49.8 F
Right Turn 260 253 97.3% 22.3 3.9 C
Subtotal 345 341 98.8% 61.9 19.3 E
Left Turn 212 210 99.0% 54.2 8.2 D
Through 25 25 99.2% 41.4 10.2 D
Right Turn 4 3 80.0% 3.5 4.6 A
Subtotal 241 238 98.7% 52.5 7.3 D
Total 1,716 1,652 96.3% 51.3 5.5 D
115.7
Intersection 6 Richards Blvd/Olive Dr Signal
Demand Total Delay (sec/veh)
Direction Movement Volume (vph) Average Percent Average Std. Dev. LOS
Left Turn 619 579 93.6% 24.8 2.9 C
Through 704 686 97.4% 20.4 2.5 C
Right Turn 44 36 81.8% 0.7 0.4 A
Subtotal 1,367 1,301 95.2% 21.7 2.2 C
Left Turn 60 49 81.7% 64.9 5.6 E
Through 541 543 100.4% 32.8 7.8 C
Right Turn 59 57 97.3% 33.5 14.3 C
Subtotal 660 649 98.4% 35.1 7.9 D
Left Turn 49 38 78.0% 40.2 10.9 D
Through 23 19 83.0% 23.9 7.8 C
Right Turn 182 181 99.5% 9.5 1.5 A
Subtotal 254 238 93.9% 15.2 2.5 B
Left Turn 139 116 83.3% 275.2 169.8 F
Through 52 46 88.5% 363.4 183.7 F
Right Turn 172 148 86.0% 341.5 173.0 F
Subtotal 363 310 85.3% 320.0 171.6 F
Total 2,644 2,499 94.5% 67.9 24.7 E
141.0
WB
Served Volume (vph)
NB
SB
EB
WB
Served Volume (vph)
NB
SB
EB
Fehr & Peers 12/1/2016

Vissim Post-Processor Richards Blvd - Olive Dr Circulation
Average Results from 10 Runs No Build with Lincoln 40 - Cumulative Conditions
Volume and Delay by Movement AM Peak Hour
Intersection 7 Richards Blvd/I-80 WB Ramps Signal
Demand Total Delay (sec/veh)
Direction Movement Volume (vph) Average Percent Average Std. Dev. LOS
Left Turn 617 595 96.5% 38.0 4.8 D
Through 595 561 94.2% 58.7 20.7 E
Right Turn
Subtotal 1,212 1,156 95.4% 48.3 11.0 D
Left Turn
Through 680 654 96.1% 27.7 3.0 C
Right Turn 207 201 96.9% 4.4 1.4 A
Subtotal 887 854 96.3% 22.3 2.5 C
Left Turn
Through
Right Turn
Subtotal
Left Turn 206 206 99.8% 49.6 18.3 D
Through
Right Turn 776 755 97.3% 111.2 55.4 F
Subtotal 982 960 97.8% 98.4 47.8 F
Total 3,081 2,971 96.4% 56.8 17.2 E
42.6
Intersection 8 Richards Blvd/I-80 EB Ramps Signal
Demand Total Delay (sec/veh)
Direction Movement Volume (vph) Average Percent Average Std. Dev. LOS
Left Turn
Through 984 954 97.0% 54.1 30.5 D
Right Turn 95 92 97.3% 50.6 36.1 D
Subtotal 1,079 1,046 97.0% 53.8 30.9 D
Left Turn 315 309 98.1% 30.6 4.1 C
Through 571 556 97.4% 11.1 2.0 B
Right Turn
Subtotal 886 865 97.7% 18.3 2.1 B
Left Turn
Through
Right Turn
Subtotal
Left Turn 722 695 96.2% 49.5 54.2 D
Through
Right Turn 228 214 93.8% 165.7 171.2 F
Subtotal 950 908 95.6% 74.5 76.4 E
Total 2,915 2,820 96.7% 46.3 29.1 D
29.9
NB
SB
EB
WB
Served Volume (vph)
NB
SB
EB
WB
Served Volume (vph)
Fehr & Peers 12/1/2016

Vissim Post-Processor Richards Blvd - Olive Dr Circulation
Average Results from 10 Runs No Build with Lincoln 40 - Cumulative Conditions
Volume and Delay by Movement AM Peak Hour
Intersection 9 Research Park Dr/Richards Blvd Signal
Demand Total Delay (sec/veh)
Direction Movement Volume (vph) Average Percent Average Std. Dev. LOS
Left Turn 85 84 98.9% 80.6 25.5 F
Through 5 5 90.0% 25.1 31.5 C
Right Turn 40 39 98.3% 6.4 3.5 A
Subtotal 130 128 98.4% 58.9 20.6 E
Left Turn 22 22 100.9% 42.4 19.0 D
Through 22 21 94.5% 36.1 16.2 D
Right Turn 137 132 96.3% 15.1 4.4 B
Subtotal 181 175 96.6% 21.2 5.2 C
Left Turn 422 405 96.0% 52.8 4.5 D
Through 723 703 97.2% 16.3 3.0 B
Right Turn 148 145 97.6% 17.3 5.1 B
Subtotal 1,293 1,253 96.9% 28.8 3.8 C
Left Turn 38 38 99.2% 124.4 39.5 F
Through 822 803 97.7% 98.4 33.9 F
Right Turn 23 23 100.0% 72.8 30.8 E
Subtotal 883 864 97.8% 98.6 33.5 F
Total 2,487 2,419 97.3% 55.2 13.8 E
99.3
SB
EB
WB
Served Volume (vph)
NB
Fehr & Peers 12/1/2016

Vissim Post-Processor Richards Blvd - Olive Dr Circulation
Average Results from 10 Runs No Build with Lincoln 40 - Cumulative Conditions
Volume and Delay by Movement PM Peak Hour
Intersection 1 K St/Third St Side-street Stop
Demand Total Delay (sec/veh)
Direction Movement Volume (vph) Average Percent Average Std. Dev. LOS
Left Turn 4 3 80.0% 3.6 5.4 A
Through 2 2 105.0% 0.4 0.8 A
Right Turn 3 3 90.0% 4.0 5.8 A
Subtotal 9 8 88.9% 4.1 5.1 A
Left Turn 5 5 104.0% 15.8 12.0 C
Through 2 1 70.0% 4.5 5.2 A
Right Turn 16 14 89.4% 6.5 1.6 A
Subtotal 23 21 90.9% 9.9 5.1 A
Left Turn 12 10 85.0% 71.0 52.7 F
Through 361 348 96.3% 83.2 49.1 F
Right Turn 4 4 100.0% 40.1 41.1 E
Subtotal 377 362 96.0% 82.6 49.1 F
Left Turn 4 5 120.0% 4.1 4.9 A
Through 373 366 98.1% 0.3 0.1 A
Right Turn 24 24 100.4% 0.8 0.4 A
Subtotal 401 395 98.5% 0.4 0.2 A
Total 810 786 97.0% 40.1 23.6 E
45.2
Intersection 2 L St/Third St Side-street Stop
Demand Total Delay (sec/veh)
Direction Movement Volume (vph) Average Percent Average Std. Dev. LOS
Left Turn 269 264 98.1% 2.7 0.5 A
Through 247 252 102.2% 0.8 0.3 A
Right Turn
Subtotal 516 516 100.1% 1.8 0.4 A
Left Turn
Through 408 408 100.1% 0.2 0.0 A
Right Turn 132 130 98.7% 1.1 0.2 A
Subtotal 540 539 99.8% 0.4 0.1 A
Left Turn 95 98 103.6% 46.3 6.6 E
Through
Right Turn 274 257 93.8% 41.8 5.6 E
Subtotal 369 355 96.3% 42.8 5.5 E
Left Turn
Through
Right Turn
Subtotal
Total 1,425 1,410 99.0% 12.1 1.4 B
43.5
Served Volume (vph)
NB
SB
EB
WB
Served Volume (vph)
NB
SB
EB
WB
Fehr & Peers 12/1/2016

Vissim Post-Processor Richards Blvd - Olive Dr Circulation
Average Results from 10 Runs No Build with Lincoln 40 - Cumulative Conditions
Volume and Delay by Movement PM Peak Hour
Intersection 3 Arbor Apts Dwy (East)/Olive Dr Side-street Stop
Demand Total Delay (sec/veh)
Direction Movement Volume (vph) Average Percent Average Std. Dev. LOS
Left Turn 20 20 99.0% 5.7 0.9 A
Through
Right Turn
Subtotal 20 20 99.0% 5.7 0.9 A
Left Turn
Through
Right Turn
Subtotal
Left Turn
Through 35 23 66.9% 2.3 1.9 A
Right Turn 14 20 142.9% 4.8 3.9 A
Subtotal 49 43 88.6% 3.4 1.4 A
Left Turn 2 2 105.0% 0.2 0.3 A
Through 167 158 94.4% 0.3 0.1 A
Right Turn
Subtotal 169 160 94.6% 0.3 0.1 A
Total 238 223 93.7% 1.5 0.3 A
5.3
Intersection 4 D St/First St Signal
Demand Total Delay (sec/veh)
Direction Movement Volume (vph) Average Percent Average Std. Dev. LOS
Left Turn 31 31 101.0% 25.6 7.6 C
Through 46 44 94.8% 28.2 2.7 C
Right Turn 64 64 100.0% 16.5 6.2 B
Subtotal 141 139 98.5% 22.6 3.9 C
Left Turn 188 182 97.0% 132.9 49.3 F
Through 41 43 104.9% 119.7 48.3 F
Right Turn 56 55 98.8% 85.8 44.9 F
Subtotal 285 281 98.5% 122.0 48.8 F
Left Turn 23 24 106.1% 138.8 54.4 F
Through 383 383 100.1% 112.2 45.3 F
Right Turn 62 60 96.5% 110.0 47.0 F
Subtotal 468 468 99.9% 113.2 44.9 F
Left Turn 77 76 99.0% 35.2 5.5 D
Through 373 376 100.7% 15.0 2.2 B
Right Turn 49 49 100.0% 11.7 2.9 B
Subtotal 499 501 100.4% 17.7 2.7 B
Total 1,393 1,388 99.6% 71.0 15.4 E
94.3
SB
EB
WB
Served Volume (vph)
NB
SB
Served Volume (vph)
NB
EB
WB
Fehr & Peers 12/1/2016

Vissim Post-Processor Richards Blvd - Olive Dr Circulation
Average Results from 10 Runs No Build with Lincoln 40 - Cumulative Conditions
Volume and Delay by Movement PM Peak Hour
Intersection 5 E St-Richards Blvd/First St Signal
Demand Total Delay (sec/veh)
Direction Movement Volume (vph) Average Percent Average Std. Dev. LOS
Left Turn 315 321 101.9% 25.7 7.1 C
Through 187 182 97.2% 25.5 7.7 C
Right Turn 367 351 95.7% 11.3 3.4 B
Subtotal 869 854 98.3% 19.7 5.4 B
Left Turn 6 6 100.0% 54.0 40.1 D
Through 194 192 98.9% 60.4 20.8 E
Right Turn 27 26 94.8% 36.5 22.5 D
Subtotal 227 223 98.4% 58.1 19.8 E
Left Turn 10 8 77.0% 54.3 44.7 D
Through 53 51 96.6% 83.0 11.3 F
Right Turn 572 576 100.6% 19.2 4.1 B
Subtotal 635 635 99.9% 25.4 4.4 C
Left Turn 213 212 99.3% 73.4 31.1 E
Through 157 155 98.8% 47.9 10.6 D
Right Turn 10 10 102.0% 34.0 20.3 C
Subtotal 380 377 99.2% 63.3 20.9 E
Total 2,111 2,089 99.0% 34.2 8.1 C
73.3
Intersection 6 Richards Blvd/Olive Dr Signal
Demand Total Delay (sec/veh)
Direction Movement Volume (vph) Average Percent Average Std. Dev. LOS
Left Turn 217 213 98.3% 40.5 4.0 D
Through 631 640 101.4% 8.1 1.4 A
Right Turn 73 57 78.2% 2.4 1.0 A
Subtotal 921 910 98.8% 15.0 1.4 B
Left Turn 128 110 85.6% 70.0 8.3 E
Through 789 809 102.6% 13.7 1.9 B
Right Turn 62 61 98.7% 15.2 3.2 B
Subtotal 979 980 100.1% 19.9 3.0 B
Left Turn 38 16 42.4% 30.1 19.0 C
Through 42 22 52.4% 45.5 14.1 D
Right Turn 455 453 99.6% 16.9 2.3 B
Subtotal 535 491 91.8% 19.0 1.7 B
Left Turn 166 167 100.6% 112.4 52.0 F
Through 40 40 99.3% 92.6 50.4 F
Right Turn 200 194 96.8% 70.7 43.6 E
Subtotal 406 400 98.6% 91.8 45.3 F
Total 2,841 2,782 97.9% 29.4 8.3 C
79.0
WB
Served Volume (vph)
NB
SB
EB
WB
Served Volume (vph)
NB
SB
EB
Fehr & Peers 12/1/2016

Vissim Post-Processor Richards Blvd - Olive Dr Circulation
Average Results from 10 Runs No Build with Lincoln 40 - Cumulative Conditions
Volume and Delay by Movement PM Peak Hour
Intersection 7 I-80 WB Ramps/Richards Blvd Signal
Demand Total Delay (sec/veh)
Direction Movement Volume (vph) Average Percent Average Std. Dev. LOS
Left Turn 776 768 99.0% 33.7 2.4 C
Through 602 597 99.1% 2.9 0.8 A
Right Turn
Subtotal 1,378 1,365 99.0% 20.8 1.6 C
Left Turn
Through 1,197 1,194 99.8% 19.4 2.7 B
Right Turn 374 384 102.7% 11.9 1.3 B
Subtotal 1,571 1,578 100.5% 17.5 2.2 B
Left Turn
Through
Right Turn
Subtotal
Left Turn 85 87 102.0% 42.2 8.2 D
Through
Right Turn 324 324 100.0% 10.6 1.5 B
Subtotal 409 411 100.4% 16.7 2.5 B
Total 3,358 3,354 99.9% 18.8 1.1 B
45.0
Intersection 8 I-80 EB Ramps/Richards Blvd Signal
Demand Total Delay (sec/veh)
Direction Movement Volume (vph) Average Percent Average Std. Dev. LOS
Left Turn
Through 1,202 1,193 99.2% 30.1 3.9 C
Right Turn 125 121 96.6% 32.5 6.0 C
Subtotal 1,327 1,314 99.0% 30.3 3.9 C
Left Turn 468 468 99.9% 42.7 6.6 D
Through 814 820 100.8% 19.1 9.9 B
Right Turn
Subtotal 1,282 1,288 100.5% 27.7 6.2 C
Left Turn
Through
Right Turn
Subtotal
Left Turn 800 803 100.3% 32.6 13.0 C
Through
Right Turn 176 172 97.5% 11.3 1.7 B
Subtotal 976 974 99.8% 28.9 11.0 C
Total 3,585 3,576 99.7% 29.0 5.4 C
41.6
NB
SB
EB
WB
Served Volume (vph)
NB
SB
EB
WB
Served Volume (vph)
Fehr & Peers 12/1/2016

Vissim Post-Processor Richards Blvd - Olive Dr Circulation
Average Results from 10 Runs No Build with Lincoln 40 - Cumulative Conditions
Volume and Delay by Movement PM Peak Hour
Intersection 9 Research Park Dr/Richards Blvd Signal
Demand Total Delay (sec/veh)
Direction Movement Volume (vph) Average Percent Average Std. Dev. LOS
Left Turn 105 101 96.5% 61.8 18.1 E
Through 25 24 94.8% 38.3 15.4 D
Right Turn 54 55 101.1% 9.3 3.4 A
Subtotal 184 180 97.6% 41.8 13.6 D
Left Turn 40 37 92.8% 108.8 34.1 F
Through 16 18 114.4% 99.9 45.5 F
Right Turn 435 426 98.0% 81.4 35.4 F
Subtotal 491 482 98.1% 84.1 35.2 F
Left Turn 429 431 100.4% 69.3 15.0 E
Through 1,114 1,115 100.1% 25.9 2.6 C
Right Turn 71 70 97.9% 28.2 6.3 C
Subtotal 1,614 1,615 100.1% 38.0 5.6 D
Left Turn 29 26 90.7% 95.8 33.7 F
Through 703 697 99.2% 72.7 26.7 E
Right Turn 39 39 100.0% 38.5 28.1 D
Subtotal 771 763 98.9% 72.0 26.7 E
Total 3,060 3,039 99.3% 53.7 8.1 D
77.7
Served Volume (vph)
NB
SB
EB
WB
Fehr & Peers 12/1/2016

Vissim Post-Processor Richards Blvd - Olive Dr Circulation
Average Results from 10 Runs L St Extension with Lincoln 40 - Cumulative Conditions
Volume and Delay by Movement AM Peak Hour
Intersection 1 K St/Third St Signal
Demand Total Delay (sec/veh)
Direction Movement Volume (vph) Average Percent Average Std. Dev. LOS
Left Turn 159 161 101.4% 30.8 4.6 C
Through 2 1 70.0% 5.0 15.1 A
Right Turn 240 239 99.7% 8.9 1.4 A
Subtotal 401 402 100.2% 17.9 2.5 B
Left Turn 26 26 100.4% 28.6 8.6 C
Through 2 2 75.0% 10.3 21.7 B
Right Turn 17 17 101.8% 10.1 4.3 B
Subtotal 45 45 99.8% 22.7 7.3 C
Left Turn 20 22 109.0% 54.4 17.4 D
Through 97 94 96.6% 32.2 5.5 C
Right Turn 125 126 100.9% 17.7 7.8 B
Subtotal 242 242 99.8% 25.9 6.9 C
Left Turn 233 218 93.7% 18.6 3.3 B
Through 510 492 96.5% 3.7 1.4 A
Right Turn 12 8 70.0% 5.5 6.2 A
Subtotal 755 719 95.2% 8.5 2.5 A
Total 1,443 1,408 97.5% 14.9 2.4 B
50.2
Intersection 2 L St/Third St Signal
Demand Total Delay (sec/veh)
Direction Movement Volume (vph) Average Percent Average Std. Dev. LOS
Left Turn 467 450 96.3% 40.2 8.9 D
Through 432 426 98.7% 18.0 5.0 B
Right Turn
Subtotal 899 876 97.4% 29.2 7.5 C
Left Turn
Through 198 187 94.4% 38.1 8.0 D
Right Turn 288 270 93.6% 28.8 10.8 C
Subtotal 486 456 93.9% 32.7 9.2 C
Left Turn 154 154 100.2% 26.5 2.7 C
Through
Right Turn 209 205 97.9% 9.3 1.9 A
Subtotal 363 359 98.9% 16.6 1.2 B
Left Turn
Through
Right Turn
Subtotal
Total 1,748 1,691 96.8% 27.1 3.6 C
33.2
Served Volume (vph)
NB
SB
EB
WB
Served Volume (vph)
NB
SB
EB
WB
Fehr & Peers 12/3/2016

Vissim Post-Processor Richards Blvd - Olive Dr Circulation
Average Results from 10 Runs L St Extension with Lincoln 40 - Cumulative Conditions
Volume and Delay by Movement AM Peak Hour
Intersection 3 L St/Olive Dr Signal
Demand Total Delay (sec/veh)
Direction Movement Volume (vph) Average Percent Average Std. Dev. LOS
Left Turn
Through
Right Turn
Subtotal
Left Turn
Through
Right Turn 407 390 95.8% 32.1 12.4 C
Subtotal 407 390 95.8% 32.1 12.4 C
Left Turn 183 204 111.6% 42.6 5.3 D
Through
Right Turn
Subtotal 183 204 111.6% 42.6 5.3 D
Left Turn
Through 174 161 92.2% 162.9 38.4 F
Right Turn 716 671 93.6% 163.5 40.3 F
Subtotal 890 831 93.4% 163.4 39.9 F
Total 1,480 1,425 96.3% 110.6 22.7 F
50.0
Intersection 4 D St/First St Signal
Demand Total Delay (sec/veh)
Direction Movement Volume (vph) Average Percent Average Std. Dev. LOS
Left Turn 14 11 81.4% 35.0 16.5 C
Through 15 15 98.7% 38.4 13.5 D
Right Turn 29 31 108.3% 18.2 14.4 B
Subtotal 58 58 99.3% 28.8 9.9 C
Left Turn 75 74 98.0% 106.9 117.5 F
Through 22 22 97.7% 87.9 99.9 F
Right Turn 16 17 105.0% 43.9 68.7 D
Subtotal 113 112 98.9% 93.3 104.8 F
Left Turn 5 5 108.0% 79.3 90.0 E
Through 329 336 102.0% 46.8 56.5 D
Right Turn 33 33 99.7% 36.9 49.0 D
Subtotal 367 374 101.9% 46.8 55.9 D
Left Turn 36 38 106.1% 58.2 8.8 E
Through 539 533 99.0% 9.7 1.4 A
Right Turn 51 46 90.4% 9.7 5.3 A
Subtotal 626 618 98.7% 12.3 1.4 B
Total 1,164 1,161 99.7% 32.6 28.8 C
61.9
SB
EB
WB
Served Volume (vph)
NB
SB
Served Volume (vph)
NB
EB
WB
Fehr & Peers 12/3/2016
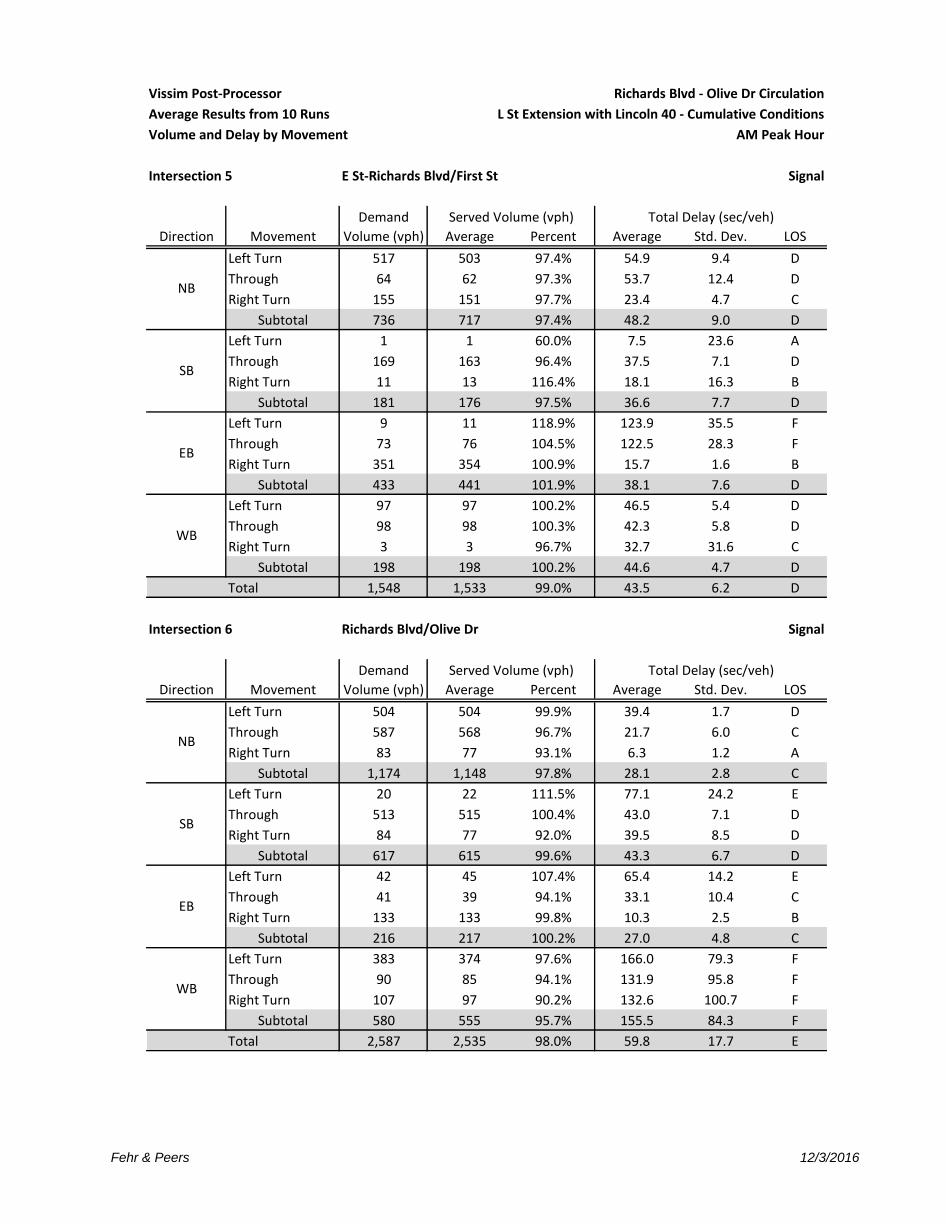
Vissim Post-Processor Richards Blvd - Olive Dr Circulation
Average Results from 10 Runs L St Extension with Lincoln 40 - Cumulative Conditions
Volume and Delay by Movement AM Peak Hour
Intersection 5 E St-Richards Blvd/First St Signal
Demand Total Delay (sec/veh)
Direction Movement Volume (vph) Average Percent Average Std. Dev. LOS
Left Turn 517 503 97.4% 54.9 9.4 D
Through 64 62 97.3% 53.7 12.4 D
Right Turn 155 151 97.7% 23.4 4.7 C
Subtotal 736 717 97.4% 48.2 9.0 D
Left Turn 1 1 60.0% 7.5 23.6 A
Through 169 163 96.4% 37.5 7.1 D
Right Turn 11 13 116.4% 18.1 16.3 B
Subtotal 181 176 97.5% 36.6 7.7 D
Left Turn 9 11 118.9% 123.9 35.5 F
Through 73 76 104.5% 122.5 28.3 F
Right Turn 351 354 100.9% 15.7 1.6 B
Subtotal 433 441 101.9% 38.1 7.6 D
Left Turn 97 97 100.2% 46.5 5.4 D
Through 98 98 100.3% 42.3 5.8 D
Right Turn 3 3 96.7% 32.7 31.6 C
Subtotal 198 198 100.2% 44.6 4.7 D
Total 1,548 1,533 99.0% 43.5 6.2 D
108.5
Intersection 6 Richards Blvd/Olive Dr Signal
Demand Total Delay (sec/veh)
Direction Movement Volume (vph) Average Percent Average Std. Dev. LOS
Left Turn 504 504 99.9% 39.4 1.7 D
Through 587 568 96.7% 21.7 6.0 C
Right Turn 83 77 93.1% 6.3 1.2 A
Subtotal 1,174 1,148 97.8% 28.1 2.8 C
Left Turn 20 22 111.5% 77.1 24.2 E
Through 513 515 100.4% 43.0 7.1 D
Right Turn 84 77 92.0% 39.5 8.5 D
Subtotal 617 615 99.6% 43.3 6.7 D
Left Turn 42 45 107.4% 65.4 14.2 E
Through 41 39 94.1% 33.1 10.4 C
Right Turn 133 133 99.8% 10.3 2.5 B
Subtotal 216 217 100.2% 27.0 4.8 C
Left Turn 383 374 97.6% 166.0 79.3 F
Through 90 85 94.1% 131.9 95.8 F
Right Turn 107 97 90.2% 132.6 100.7 F
Subtotal 580 555 95.7% 155.5 84.3 F
Total 2,587 2,535 98.0% 59.8 17.7 E
113.8
WB
Served Volume (vph)
NB
SB
EB
WB
Served Volume (vph)
NB
SB
EB
Fehr & Peers 12/3/2016

Vissim Post-Processor Richards Blvd - Olive Dr Circulation
Average Results from 10 Runs L St Extension with Lincoln 40 - Cumulative Conditions
Volume and Delay by Movement AM Peak Hour
Intersection 7 Richards Blvd/I-80 WB Ramps Signal
Demand Total Delay (sec/veh)
Direction Movement Volume (vph) Average Percent Average Std. Dev. LOS
Left Turn 598 563 94.2% 40.1 4.2 D
Through 636 619 97.3% 7.8 1.8 A
Right Turn
Subtotal 1,234 1,182 95.8% 22.5 2.9 C
Left Turn
Through 701 701 99.9% 14.8 2.2 B
Right Turn 332 323 97.2% 8.6 1.3 A
Subtotal 1,033 1,023 99.0% 12.9 1.7 B
Left Turn
Through
Right Turn
Subtotal
Left Turn 163 162 99.1% 41.0 4.9 D
Through
Right Turn 532 533 100.2% 14.6 1.9 B
Subtotal 695 694 99.9% 21.2 1.0 C
Total 2,962 2,899 97.9% 18.6 1.2 B
41.1
Intersection 8 Richards Blvd/I-80 EB Ramps Signal
Demand Total Delay (sec/veh)
Direction Movement Volume (vph) Average Percent Average Std. Dev. LOS
Left Turn
Through 1,022 971 95.0% 21.7 1.7 C
Right Turn 147 142 96.5% 20.6 3.6 C
Subtotal 1,169 1,113 95.2% 21.6 1.8 C
Left Turn 340 334 98.1% 36.2 5.7 D
Through 524 517 98.7% 22.9 9.8 C
Right Turn
Subtotal 864 851 98.5% 28.2 6.2 C
Left Turn
Through
Right Turn
Subtotal
Left Turn 718 705 98.1% 66.8 56.5 E
Through
Right Turn 212 212 99.8% 27.0 29.4 C
Subtotal 930 916 98.5% 57.8 50.2 E
Total 2,963 2,880 97.2% 35.8 18.7 D
34.9
NB
SB
EB
WB
Served Volume (vph)
NB
SB
EB
WB
Served Volume (vph)
Fehr & Peers 12/3/2016

Vissim Post-Processor Richards Blvd - Olive Dr Circulation
Average Results from 10 Runs L St Extension with Lincoln 40 - Cumulative Conditions
Volume and Delay by Movement AM Peak Hour
Intersection 9 Research Park Dr/Richards Blvd Signal
Demand Total Delay (sec/veh)
Direction Movement Volume (vph) Average Percent Average Std. Dev. LOS
Left Turn 85 86 100.7% 71.7 10.1 E
Through 7 7 105.7% 38.6 39.9 D
Right Turn 40 39 97.0% 5.9 2.0 A
Subtotal 132 132 99.8% 50.2 12.7 D
Left Turn 31 32 102.9% 60.3 18.0 E
Through 21 23 107.1% 41.1 15.1 D
Right Turn 147 145 98.3% 16.6 7.6 B
Subtotal 199 199 99.9% 26.4 8.7 C
Left Turn 424 409 96.3% 84.8 19.8 F
Through 684 679 99.2% 21.4 2.2 C
Right Turn 134 131 97.9% 20.5 5.3 C
Subtotal 1,242 1,218 98.1% 43.1 6.6 D
Left Turn 67 56 83.7% 128.0 30.7 F
Through 902 834 92.5% 71.5 21.1 E
Right Turn 20 18 90.0% 46.0 32.7 D
Subtotal 989 908 91.8% 74.6 21.5 E
Total 2,562 2,457 95.9% 54.1 9.9 D
97.9
Served Volume (vph)
NB
SB
EB
WB
Fehr & Peers 12/3/2016

Vissim Post-Processor Richards Blvd - Olive Dr Circulation
Average Results from 10 Runs L St Extension with Lincoln 40 - Cumulative Conditions
Volume and Delay by Movement PM Peak Hour
Intersection 1 K St/3rd St Signal
Demand Total Delay (sec/veh)
Direction Movement Volume (vph) Average Percent Average Std. Dev. LOS
Left Turn 234 240 102.6% 32.2 5.1 C
Through 4 3 62.5% 28.9 24.8 C
Right Turn 249 246 98.9% 13.5 4.0 B
Subtotal 487 489 100.3% 23.2 4.1 C
Left Turn 57 56 98.4% 34.3 5.6 C
Through 4 5 115.0% 36.5 24.9 D
Right Turn 12 12 100.8% 9.0 5.0 A
Subtotal 73 73 99.7% 32.1 5.4 C
Left Turn 13 11 84.6% 171.8 14.2 F
Through 179 149 83.1% 141.7 8.5 F
Right Turn 268 235 87.6% 128.8 8.1 F
Subtotal 460 395 85.8% 134.9 7.8 F
Left Turn 434 393 90.5% 27.1 1.6 C
Through 351 333 94.8% 5.0 1.4 A
Right Turn 51 46 90.8% 2.7 0.7 A
Subtotal 836 772 92.3% 16.4 1.5 B
Total 1,856 1,728 93.1% 45.3 2.1 D
159.7
Intersection 2 L St/3rd St Signal
Demand Total Delay (sec/veh)
Direction Movement Volume (vph) Average Percent Average Std. Dev. LOS
Left Turn 372 365 98.1% 53.5 7.5 D
Through 498 486 97.6% 27.0 5.3 C
Right Turn
Subtotal 870 851 97.8% 38.5 6.7 D
Left Turn
Through 215 171 79.6% 80.4 7.4 F
Right Turn 464 406 87.4% 74.0 7.3 E
Subtotal 679 577 84.9% 76.0 6.7 E
Left Turn 212 211 99.3% 30.9 4.4 C
Through
Right Turn 273 241 88.3% 9.6 1.9 A
Subtotal 485 452 93.1% 19.8 2.5 B
Left Turn
Through
Right Turn
Subtotal
Total 2,034 1,879 92.4% 45.4 3.2 D
74.3
NB
SB
EB
WB
Served Volume (vph)
NB
SB
EB
WB
Served Volume (vph)
Fehr & Peers 12/13/2016

Vissim Post-Processor Richards Blvd - Olive Dr Circulation
Average Results from 10 Runs L St Extension with Lincoln 40 - Cumulative Conditions
Volume and Delay by Movement PM Peak Hour
Intersection 3 L St/Olive Dr Signal
Demand Total Delay (sec/veh)
Direction Movement Volume (vph) Average Percent Average Std. Dev. LOS
Left Turn
Through
Right Turn
Subtotal
Left Turn
Through
Right Turn 488 413 84.7% 23.6 13.4 C
Subtotal 488 413 84.7% 23.6 13.4 C
Left Turn 378 378 100.1% 146.8 66.9 F
Through
Right Turn
Subtotal 378 378 100.1% 146.8 66.9 F
Left Turn
Through 161 159 98.9% 129.2 85.1 F
Right Turn 492 472 95.9% 127.0 81.9 F
Subtotal 653 631 96.6% 127.5 82.7 F
Total 1,519 1,423 93.7% 103.1 53.6 F
74.4
Intersection 4 D St/1st St Signal
Demand Total Delay (sec/veh)
Direction Movement Volume (vph) Average Percent Average Std. Dev. LOS
Left Turn 30 28 93.7% 31.9 13.4 C
Through 45 46 101.1% 40.0 7.4 D
Right Turn 64 66 102.5% 28.5 14.1 C
Subtotal 139 139 100.1% 33.8 6.6 C
Left Turn 204 119 58.1% 429.0 137.0 F
Through 41 24 58.8% 375.7 119.9 F
Right Turn 34 21 60.3% 368.8 116.8 F
Subtotal 279 163 58.5% 415.5 120.9 F
Left Turn 45 42 92.7% 197.2 53.3 F
Through 411 401 97.6% 168.6 66.3 F
Right Turn 59 56 95.3% 173.4 77.4 F
Subtotal 515 499 96.9% 171.2 65.3 F
Left Turn 78 78 100.0% 82.3 27.6 F
Through 419 423 101.0% 15.4 4.4 B
Right Turn 49 46 93.5% 3.1 1.9 A
Subtotal 546 547 100.2% 24.7 6.2 C
Total 1,479 1,348 91.2% 117.2 15.3 F
282.6
EB
WB
Served Volume (vph)
NB
SB
Served Volume (vph)
NB
SB
EB
WB
Fehr & Peers 12/13/2016

Vissim Post-Processor Richards Blvd - Olive Dr Circulation
Average Results from 10 Runs L St Extension with Lincoln 40 - Cumulative Conditions
Volume and Delay by Movement PM Peak Hour
Intersection 5 E St-Richards Blvd/1st St Signal
Demand Total Delay (sec/veh)
Direction Movement Volume (vph) Average Percent Average Std. Dev. LOS
Left Turn 371 375 100.9% 36.6 9.7 D
Through 200 206 103.0% 40.6 9.3 D
Right Turn 102 103 101.4% 16.5 5.9 B
Subtotal 673 684 101.6% 34.8 9.0 C
Left Turn 6 7 110.0% 27.7 20.7 C
Through 159 158 99.2% 40.8 5.1 D
Right Turn 23 22 94.3% 20.5 9.0 C
Subtotal 188 186 99.0% 38.7 5.7 D
Left Turn 10 7 74.0% 70.4 51.9 E
Through 98 99 101.4% 109.5 16.5 F
Right Turn 571 484 84.8% 22.6 3.4 C
Subtotal 679 591 87.0% 41.7 8.1 D
Left Turn 116 117 100.6% 42.1 6.0 D
Through 152 148 97.1% 43.7 10.6 D
Right Turn 7 7 100.0% 38.6 20.7 D
Subtotal 275 271 98.7% 43.1 6.9 D
Total 1,815 1,732 95.4% 38.7 5.2 D
111.0
Intersection 6 Richards Blvd/Olive Dr Signal
Demand Total Delay (sec/veh)
Direction Movement Volume (vph) Average Percent Average Std. Dev. LOS
Left Turn 157 155 98.7% 50.6 5.3 D
Through 523 530 101.4% 25.7 7.3 C
Right Turn 208 195 93.8% 8.0 2.1 A
Subtotal 888 880 99.1% 26.3 5.9 C
Left Turn 30 23 75.0% 86.6 14.7 F
Through 763 699 91.6% 39.5 5.9 D
Right Turn 53 42 80.0% 42.2 6.6 D
Subtotal 846 764 90.3% 41.2 5.3 D
Left Turn 43 43 100.9% 61.4 22.4 E
Through 85 83 98.0% 38.4 8.2 D
Right Turn 409 410 100.3% 14.8 2.4 B
Subtotal 537 537 100.0% 22.3 2.5 C
Left Turn 393 352 89.7% 120.5 52.7 F
Through 80 72 89.8% 66.7 36.5 E
Right Turn 107 106 98.6% 54.1 34.8 D
Subtotal 580 530 91.3% 100.4 45.3 F
Total 2,851 2,711 95.1% 43.9 10.8 D
74.3
WB
Served Volume (vph)
NB
SB
EB
WB
Served Volume (vph)
NB
SB
EB
Fehr & Peers 12/13/2016
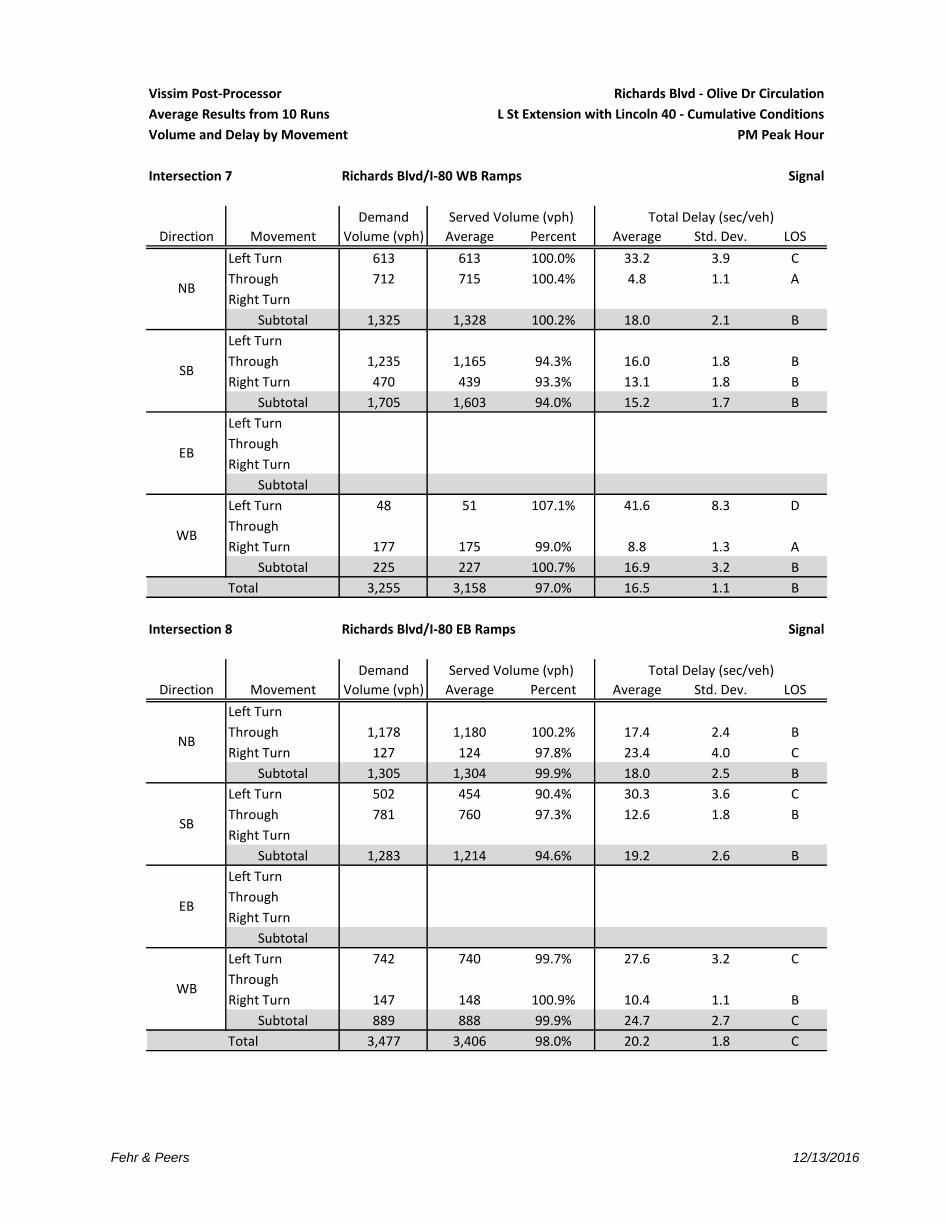
Vissim Post-Processor Richards Blvd - Olive Dr Circulation
Average Results from 10 Runs L St Extension with Lincoln 40 - Cumulative Conditions
Volume and Delay by Movement PM Peak Hour
Intersection 7 Richards Blvd/I-80 WB Ramps Signal
Demand Total Delay (sec/veh)
Direction Movement Volume (vph) Average Percent Average Std. Dev. LOS
Left Turn 613 613 100.0% 33.2 3.9 C
Through 712 715 100.4% 4.8 1.1 A
Right Turn
Subtotal 1,325 1,328 100.2% 18.0 2.1 B
Left Turn
Through 1,235 1,165 94.3% 16.0 1.8 B
Right Turn 470 439 93.3% 13.1 1.8 B
Subtotal 1,705 1,603 94.0% 15.2 1.7 B
Left Turn
Through
Right Turn
Subtotal
Left Turn 48 51 107.1% 41.6 8.3 D
Through
Right Turn 177 175 99.0% 8.8 1.3 A
Subtotal 225 227 100.7% 16.9 3.2 B
Total 3,255 3,158 97.0% 16.5 1.1 B
41.6
Intersection 8 Richards Blvd/I-80 EB Ramps Signal
Demand Total Delay (sec/veh)
Direction Movement Volume (vph) Average Percent Average Std. Dev. LOS
Left Turn
Through 1,178 1,180 100.2% 17.4 2.4 B
Right Turn 127 124 97.8% 23.4 4.0 C
Subtotal 1,305 1,304 99.9% 18.0 2.5 B
Left Turn 502 454 90.4% 30.3 3.6 C
Through 781 760 97.3% 12.6 1.8 B
Right Turn
Subtotal 1,283 1,214 94.6% 19.2 2.6 B
Left Turn
Through
Right Turn
Subtotal
Left Turn 742 740 99.7% 27.6 3.2 C
Through
Right Turn 147 148 100.9% 10.4 1.1 B
Subtotal 889 888 99.9% 24.7 2.7 C
Total 3,477 3,406 98.0% 20.2 1.8 C
31.2
NB
SB
EB
WB
Served Volume (vph)
NB
SB
EB
WB
Served Volume (vph)
Fehr & Peers 12/13/2016

Vissim Post-Processor Richards Blvd - Olive Dr Circulation
Average Results from 10 Runs L St Extension with Lincoln 40 - Cumulative Conditions
Volume and Delay by Movement PM Peak Hour
Intersection 9 Research Park Dr/Richards Blvd Signal
Demand Total Delay (sec/veh)
Direction Movement Volume (vph) Average Percent Average Std. Dev. LOS
Left Turn 107 105 97.8% 74.7 9.2 E
Through 25 24 95.6% 34.1 7.4 C
Right Turn 48 50 104.2% 11.4 3.8 B
Subtotal 180 179 99.2% 53.4 7.2 D
Left Turn 44 43 98.6% 78.9 18.3 E
Through 16 17 106.3% 72.4 30.5 E
Right Turn 462 460 99.5% 54.4 20.2 D
Subtotal 522 520 99.6% 57.0 19.9 E
Left Turn 404 390 96.6% 62.3 10.3 E
Through 1,051 1,045 99.4% 24.2 1.3 C
Right Turn 68 67 98.5% 23.0 5.6 C
Subtotal 1,523 1,502 98.6% 34.2 3.6 C
Left Turn 32 32 98.8% 70.1 17.9 E
Through 652 647 99.2% 47.6 5.3 D
Right Turn 59 58 97.8% 19.0 5.7 B
Subtotal 743 736 99.1% 46.2 5.4 D
Total 2,968 2,937 98.9% 42.8 5.5 D
69.7
SB
EB
WB
Served Volume (vph)
NB
Fehr & Peers 12/13/2016

Vissim Post‐Processor Richards Blvd ‐ Olive Dr Circulation
Average Results from 10 Runs Olive Dr Off‐Ramp Closure with Lincoln 40 ‐ Cumulative Conditions
Volume and Delay by Movement AM Peak Hour
Intersection 1 K St/Third St Side‐street Stop
Demand Total Delay (sec/veh)
Direction Movement Volume (vph) Average Percent Average Std. Dev. LOS
Left Turn 3 2 56.7% 1.1 2.2 A
Through 1 1 50.0% 0.0 0.1 A
Right Turn 2 2 90.0% 0.5 0.5 A
Subtotal 6 4 66.7% 1.3 1.5 A
Left Turn 22 20 89.5% 12.2 2.0 B
Through 1 1 140.0% 6.7 7.5 A
Right Turn 77 78 101.3% 7.3 1.2 A
Subtotal 100 99 99.1% 8.5 1.1 A
Left Turn 18 17 94.4% 1.9 1.3 A
Through 267 283 105.8% 4.9 5.2 A
Right Turn 4 4 100.0% 1.8 4.3 A
Subtotal 289 304 105.1% 4.7 4.9 A
Left Turn 2 3 140.0% 3.4 7.2 A
Through 298 291 97.5% 0.2 0.1 A
Right Turn 3 3 106.7% 0.5 0.7 A
Subtotal 303 297 97.9% 0.3 0.1 A
Total 698 703 100.7% 3.4 2.2 A
12.4
Intersection 2 L St/Third St Side‐street Stop
Demand Total Delay (sec/veh)
Direction Movement Volume (vph) Average Percent Average Std. Dev. LOS
Left Turn 221 216 97.5% 1.9 0.5 A
Through 191 197 103.3% 0.8 0.3 A
Right Turn
Subtotal 412 413 100.2% 1.3 0.3 A
Left Turn
Through 223 224 100.3% 0.1 0.1 A
Right Turn 82 81 98.8% 0.9 0.1 A
Subtotal 305 305 99.9% 0.3 0.1 A
Left Turn 112 123 110.1% 22.0 5.3 C
Through
Right Turn 179 180 100.6% 19.4 4.9 C
Subtotal 291 303 104.2% 20.5 5.0 C
Left Turn
Through
Right Turn
Subtotal
Total 1,008 1,021 101.3% 6.7 1.6 A
18.3
NB
SB
EB
WB
Served Volume (vph)
NB
SB
EB
WB
Served Volume (vph)
Fehr & Peers 12/8/2016

Vissim Post‐Processor Richards Blvd ‐ Olive Dr Circulation
Average Results from 10 Runs Olive Dr Off‐Ramp Closure with Lincoln 40 ‐ Cumulative Conditions
Volume and Delay by Movement AM Peak Hour
Intersection 3 Arbor Apts Dwy (East)/Olive Dr Side‐street Stop
Demand Total Delay (sec/veh)
Direction Movement Volume (vph) Average Percent Average Std. Dev. LOS
Left Turn 23 21 89.6% 5.1 0.4 A
Through
Right Turn
Subtotal 23 21 89.6% 5.1 0.4 A
Left Turn
Through
Right Turn
Subtotal
Left Turn
Through 24 17 68.8% 1.4 1.3 A
Right Turn 13 13 102.3% 2.3 2.3 A
Subtotal 37 30 80.5% 1.8 1.6 A
Left Turn
Through 3 0 0.0% 0.0 0.0 A
Right Turn
Subtotal 3 0 0.0% 0.0 0.0 A
Total 63 50 80.0% 3.2 0.9 A
5.1
Intersection 4 D St/First St Signal
Demand Total Delay (sec/veh)
Direction Movement Volume (vph) Average Percent Average Std. Dev. LOS
Left Turn 14 14 100.0% 47.6 16.3 D
Through 17 16 96.5% 40.7 17.4 D
Right Turn 31 32 103.5% 9.3 5.4 A
Subtotal 62 63 100.8% 25.2 8.8 C
Left Turn 85 88 103.4% 98.3 77.4 F
Through 29 28 95.5% 88.8 65.8 F
Right Turn 68 67 98.4% 52.2 65.8 D
Subtotal 182 183 100.3% 80.2 71.5 F
Left Turn 28 27 96.4% 70.0 19.7 E
Through 229 236 102.9% 17.7 7.8 B
Right Turn 32 30 92.8% 11.8 8.8 B
Subtotal 289 292 101.1% 21.4 7.0 C
Left Turn 33 22 65.2% 62.1 12.4 E
Through 484 508 105.0% 7.6 2.6 A
Right Turn 51 15 30.2% 8.3 7.3 A
Subtotal 568 545 96.0% 10.0 2.3 A
Total 1,101 1,082 98.3% 26.7 15.3 C
61.9
EB
WB
Served Volume (vph)
NB
SB
Served Volume (vph)
NB
SB
EB
WB
Fehr & Peers 12/8/2016
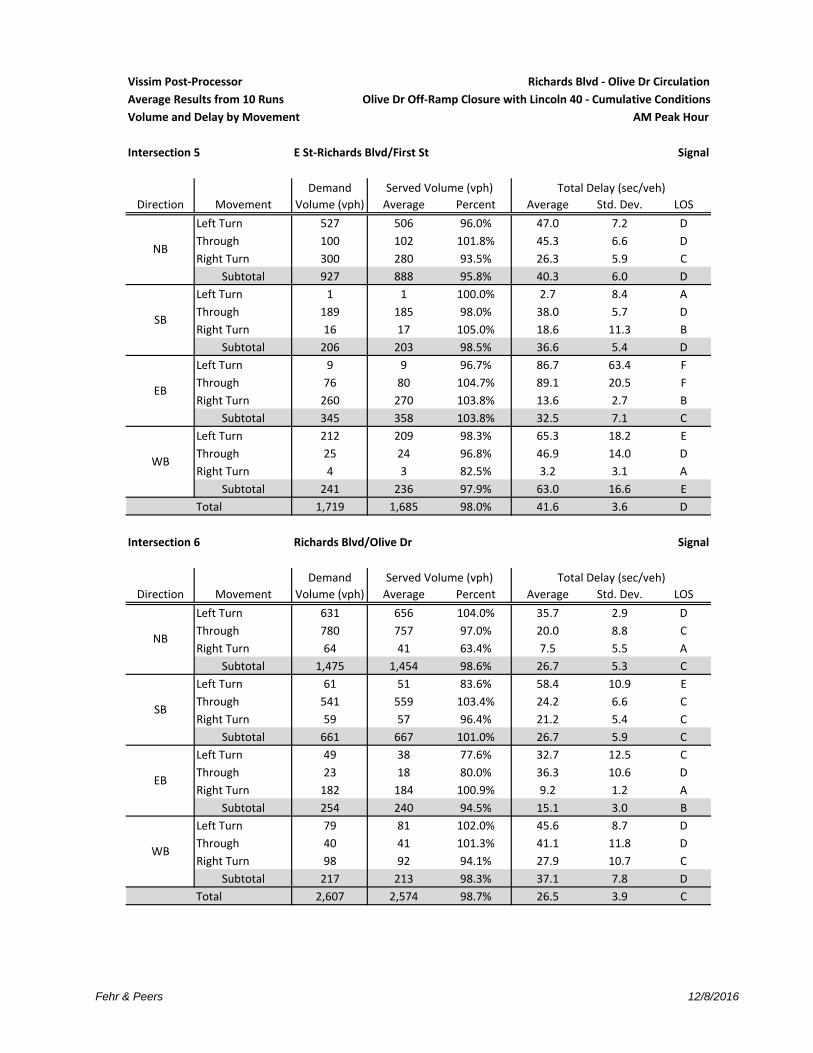
Vissim Post‐Processor Richards Blvd ‐ Olive Dr Circulation
Average Results from 10 Runs Olive Dr Off‐Ramp Closure with Lincoln 40 ‐ Cumulative Conditions
Volume and Delay by Movement AM Peak Hour
Intersection 5 E St‐Richards Blvd/First St Signal
Demand Total Delay (sec/veh)
Direction Movement Volume (vph) Average Percent Average Std. Dev. LOS
Left Turn 527 506 96.0% 47.0 7.2 D
Through 100 102 101.8% 45.3 6.6 D
Right Turn 300 280 93.5% 26.3 5.9 C
Subtotal 927 888 95.8% 40.3 6.0 D
Left Turn 1 1 100.0% 2.7 8.4 A
Through 189 185 98.0% 38.0 5.7 D
Right Turn 16 17 105.0% 18.6 11.3 B
Subtotal 206 203 98.5% 36.6 5.4 D
Left Turn 9 9 96.7% 86.7 63.4 F
Through 76 80 104.7% 89.1 20.5 F
Right Turn 260 270 103.8% 13.6 2.7 B
Subtotal 345 358 103.8% 32.5 7.1 C
Left Turn 212 209 98.3% 65.3 18.2 E
Through 25 24 96.8% 46.9 14.0 D
Right Turn 4 3 82.5% 3.2 3.1 A
Subtotal 241 236 97.9% 63.0 16.6 E
Total 1,719 1,685 98.0% 41.6 3.6 D
78.7
Intersection 6 Richards Blvd/Olive Dr Signal
Demand Total Delay (sec/veh)
Direction Movement Volume (vph) Average Percent Average Std. Dev. LOS
Left Turn 631 656 104.0% 35.7 2.9 D
Through 780 757 97.0% 20.0 8.8 C
Right Turn 64 41 63.4% 7.5 5.5 A
Subtotal 1,475 1,454 98.6% 26.7 5.3 C
Left Turn 61 51 83.6% 58.4 10.9 E
Through 541 559 103.4% 24.2 6.6 C
Right Turn 59 57 96.4% 21.2 5.4 C
Subtotal 661 667 101.0% 26.7 5.9 C
Left Turn 49 38 77.6% 32.7 12.5 C
Through 23 18 80.0% 36.3 10.6 D
Right Turn 182 184 100.9% 9.2 1.2 A
Subtotal 254 240 94.5% 15.1 3.0 B
Left Turn 79 81 102.0% 45.6 8.7 D
Through 40 41 101.3% 41.1 11.8 D
Right Turn 98 92 94.1% 27.9 10.7 C
Subtotal 217 213 98.3% 37.1 7.8 D
Total 2,607 2,574 98.7% 26.5 3.9 C
58.4
WB
Served Volume (vph)
NB
SB
EB
WB
Served Volume (vph)
NB
SB
EB
Fehr & Peers 12/8/2016
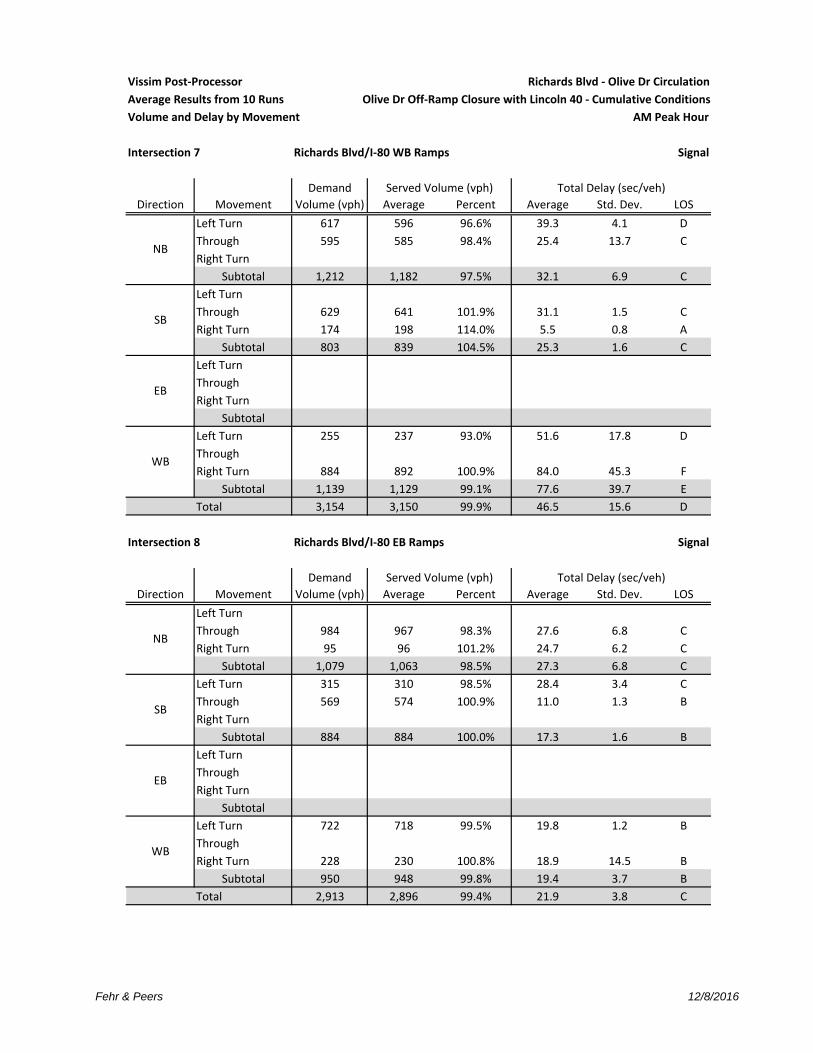
Vissim Post‐Processor Richards Blvd ‐ Olive Dr Circulation
Average Results from 10 Runs Olive Dr Off‐Ramp Closure with Lincoln 40 ‐ Cumulative Conditions
Volume and Delay by Movement AM Peak Hour
Intersection 7 Richards Blvd/I‐80 WB Ramps Signal
Demand Total Delay (sec/veh)
Direction Movement Volume (vph) Average Percent Average Std. Dev. LOS
Left Turn 617 596 96.6% 39.3 4.1 D
Through 595 585 98.4% 25.4 13.7 C
Right Turn
Subtotal 1,212 1,182 97.5% 32.1 6.9 C
Left Turn
Through 629 641 101.9% 31.1 1.5 C
Right Turn 174 198 114.0% 5.5 0.8 A
Subtotal 803 839 104.5% 25.3 1.6 C
Left Turn
Through
Right Turn
Subtotal
Left Turn 255 237 93.0% 51.6 17.8 D
Through
Right Turn 884 892 100.9% 84.0 45.3 F
Subtotal 1,139 1,129 99.1% 77.6 39.7 E
Total 3,154 3,150 99.9% 46.5 15.6 D
41.9
Intersection 8 Richards Blvd/I‐80 EB Ramps Signal
Demand Total Delay (sec/veh)
Direction Movement Volume (vph) Average Percent Average Std. Dev. LOS
Left Turn
Through 984 967 98.3% 27.6 6.8 C
Right Turn 95 96 101.2% 24.7 6.2 C
Subtotal 1,079 1,063 98.5% 27.3 6.8 C
Left Turn 315 310 98.5% 28.4 3.4 C
Through 569 574 100.9% 11.0 1.3 B
Right Turn
Subtotal 884 884 100.0% 17.3 1.6 B
Left Turn
Through
Right Turn
Subtotal
Left Turn 722 718 99.5% 19.8 1.2 B
Through
Right Turn 228 230 100.8% 18.9 14.5 B
Subtotal 950 948 99.8% 19.4 3.7 B
Total 2,913 2,896 99.4% 21.9 3.8 C
30.4
NB
SB
EB
WB
Served Volume (vph)
NB
SB
EB
WB
Served Volume (vph)
Fehr & Peers 12/8/2016
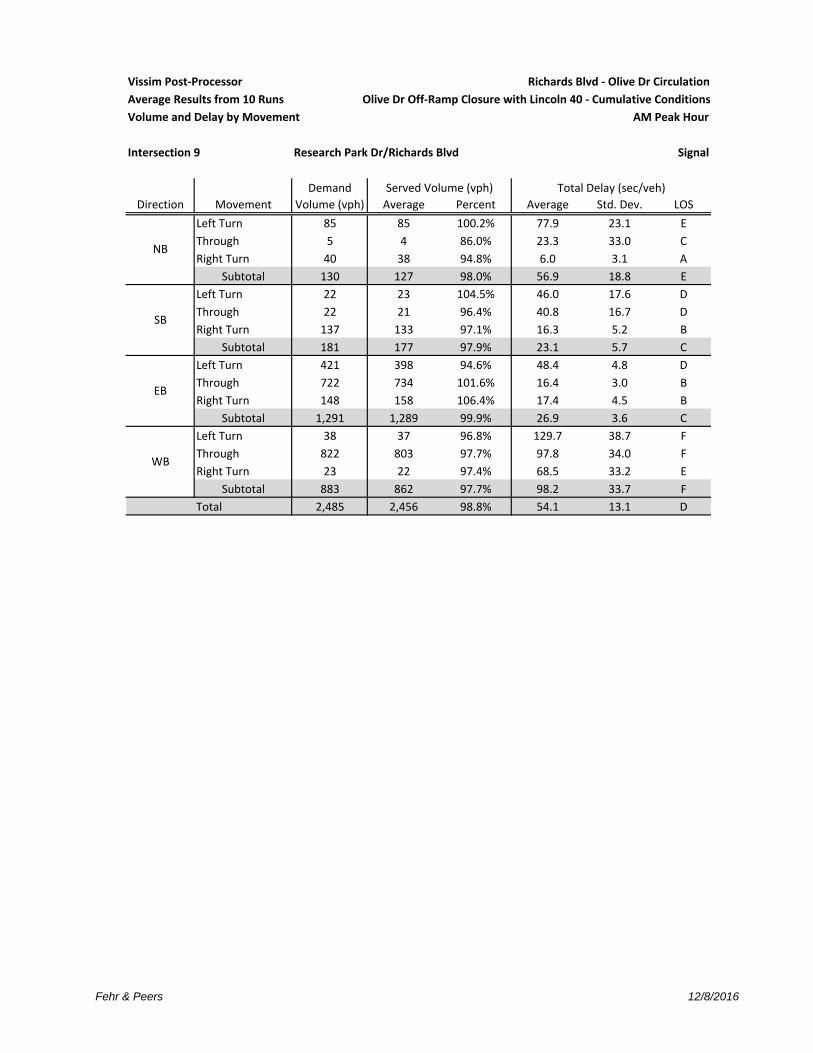
Vissim Post‐Processor Richards Blvd ‐ Olive Dr Circulation
Average Results from 10 Runs Olive Dr Off‐Ramp Closure with Lincoln 40 ‐ Cumulative Conditions
Volume and Delay by Movement AM Peak Hour
Intersection 9 Research Park Dr/Richards Blvd Signal
Demand Total Delay (sec/veh)
Direction Movement Volume (vph) Average Percent Average Std. Dev. LOS
Left Turn 85 85 100.2% 77.9 23.1 E
Through 5 4 86.0% 23.3 33.0 C
Right Turn 40 38 94.8% 6.0 3.1 A
Subtotal 130 127 98.0% 56.9 18.8 E
Left Turn 22 23 104.5% 46.0 17.6 D
Through 22 21 96.4% 40.8 16.7 D
Right Turn 137 133 97.1% 16.3 5.2 B
Subtotal 181 177 97.9% 23.1 5.7 C
Left Turn 421 398 94.6% 48.4 4.8 D
Through 722 734 101.6% 16.4 3.0 B
Right Turn 148 158 106.4% 17.4 4.5 B
Subtotal 1,291 1,289 99.9% 26.9 3.6 C
Left Turn 38 37 96.8% 129.7 38.7 F
Through 822 803 97.7% 97.8 34.0 F
Right Turn 23 22 97.4% 68.5 33.2 E
Subtotal 883 862 97.7% 98.2 33.7 F
Total 2,485 2,456 98.8% 54.1 13.1 D
104.7
SB
EB
WB
Served Volume (vph)
NB
Fehr & Peers 12/8/2016

Vissim Post-Processor Richards Blvd - Olive Dr Circulation
Average Results from 10 Runs Olive Dr Off-Ramp Closure with Lincoln 40 - Cumulative Conditions
Volume and Delay by Movement PM Peak Hour
Intersection 1 K St/Third St Side-street Stop
Demand Total Delay (sec/veh)
Direction Movement Volume (vph) Average Percent Average Std. Dev. LOS
Left Turn 4 3 85.0% 2.6 2.9 A
Through 2 2 110.0% 0.4 0.8 A
Right Turn 3 2 76.7% 2.2 3.1 A
Subtotal 9 8 87.8% 3.1 2.2 A
Left Turn 5 5 92.0% 17.2 10.8 C
Through 2 2 75.0% 3.9 5.3 A
Right Turn 16 15 93.1% 6.7 1.7 A
Subtotal 23 21 91.3% 10.3 4.9 B
Left Turn 12 10 85.8% 64.1 56.9 F
Through 361 349 96.6% 75.1 54.1 F
Right Turn 4 4 107.5% 34.3 42.2 D
Subtotal 377 363 96.3% 74.5 54.2 F
Left Turn 4 5 112.5% 3.4 4.9 A
Through 373 365 97.8% 0.3 0.1 A
Right Turn 24 25 104.2% 0.8 0.5 A
Subtotal 401 394 98.4% 0.3 0.2 A
Total 810 787 97.1% 36.7 26.1 E
41.0
Intersection 2 L St/Third St Side-street Stop
Demand Total Delay (sec/veh)
Direction Movement Volume (vph) Average Percent Average Std. Dev. LOS
Left Turn 269 265 98.6% 2.6 0.5 A
Through 247 251 101.6% 0.8 0.3 A
Right Turn
Subtotal 516 516 100.0% 1.8 0.4 A
Left Turn
Through 408 410 100.5% 0.2 0.0 A
Right Turn 132 128 97.3% 1.1 0.2 A
Subtotal 540 538 99.7% 0.4 0.1 A
Left Turn 95 95 99.9% 43.7 8.1 E
Through
Right Turn 274 260 95.0% 38.9 8.0 E
Subtotal 369 355 96.2% 40.0 7.8 E
Left Turn
Through
Right Turn
Subtotal
Total 1,425 1,410 98.9% 11.4 2.0 B
43.4
Served Volume (vph)
NB
SB
EB
WB
Served Volume (vph)
NB
SB
EB
WB
Fehr & Peers 12/3/2016
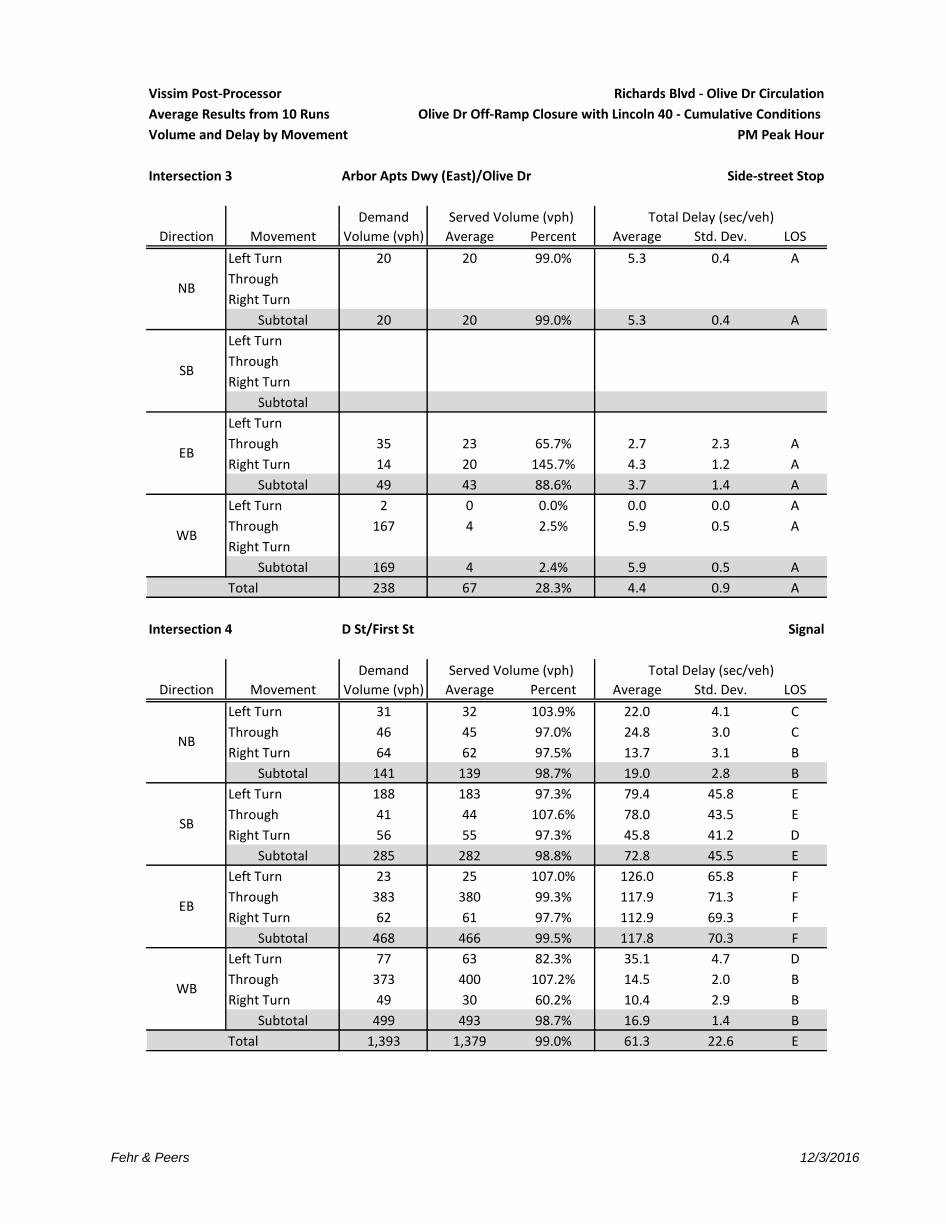
Vissim Post-Processor Richards Blvd - Olive Dr Circulation
Average Results from 10 Runs Olive Dr Off-Ramp Closure with Lincoln 40 - Cumulative Conditions
Volume and Delay by Movement PM Peak Hour
Intersection 3 Arbor Apts Dwy (East)/Olive Dr Side-street Stop
Demand Total Delay (sec/veh)
Direction Movement Volume (vph) Average Percent Average Std. Dev. LOS
Left Turn 20 20 99.0% 5.3 0.4 A
Through
Right Turn
Subtotal 20 20 99.0% 5.3 0.4 A
Left Turn
Through
Right Turn
Subtotal
Left Turn
Through 35 23 65.7% 2.7 2.3 A
Right Turn 14 20 145.7% 4.3 1.2 A
Subtotal 49 43 88.6% 3.7 1.4 A
Left Turn 2 0 0.0% 0.0 0.0 A
Through 167 4 2.5% 5.9 0.5 A
Right Turn
Subtotal 169 4 2.4% 5.9 0.5 A
Total 238 67 28.3% 4.4 0.9 A
5.2
Intersection 4 D St/First St Signal
Demand Total Delay (sec/veh)
Direction Movement Volume (vph) Average Percent Average Std. Dev. LOS
Left Turn 31 32 103.9% 22.0 4.1 C
Through 46 45 97.0% 24.8 3.0 C
Right Turn 64 62 97.5% 13.7 3.1 B
Subtotal 141 139 98.7% 19.0 2.8 B
Left Turn 188 183 97.3% 79.4 45.8 E
Through 41 44 107.6% 78.0 43.5 E
Right Turn 56 55 97.3% 45.8 41.2 D
Subtotal 285 282 98.8% 72.8 45.5 E
Left Turn 23 25 107.0% 126.0 65.8 F
Through 383 380 99.3% 117.9 71.3 F
Right Turn 62 61 97.7% 112.9 69.3 F
Subtotal 468 466 99.5% 117.8 70.3 F
Left Turn 77 63 82.3% 35.1 4.7 D
Through 373 400 107.2% 14.5 2.0 B
Right Turn 49 30 60.2% 10.4 2.9 B
Subtotal 499 493 98.7% 16.9 1.4 B
Total 1,393 1,379 99.0% 61.3 22.6 E
79.4
SB
EB
WB
Served Volume (vph)
NB
SB
Served Volume (vph)
NB
EB
WB
Fehr & Peers 12/3/2016

Vissim Post-Processor Richards Blvd - Olive Dr Circulation
Average Results from 10 Runs Olive Dr Off-Ramp Closure with Lincoln 40 - Cumulative Conditions
Volume and Delay by Movement PM Peak Hour
Intersection 5 E St-Richards Blvd/First St Signal
Demand Total Delay (sec/veh)
Direction Movement Volume (vph) Average Percent Average Std. Dev. LOS
Left Turn 315 310 98.5% 27.3 5.0 C
Through 187 204 109.3% 29.2 5.5 C
Right Turn 367 393 107.1% 11.9 2.7 B
Subtotal 869 907 104.4% 21.1 4.0 C
Left Turn 6 6 95.0% 57.8 41.2 E
Through 194 191 98.4% 58.6 32.5 E
Right Turn 27 27 98.1% 38.6 27.1 D
Subtotal 227 223 98.3% 56.6 31.7 E
Left Turn 10 9 85.0% 79.0 53.3 E
Through 53 52 97.4% 79.5 12.8 E
Right Turn 572 570 99.6% 18.9 2.8 B
Subtotal 635 630 99.2% 25.1 2.5 C
Left Turn 213 209 98.0% 68.6 27.0 E
Through 157 157 99.9% 46.5 9.9 D
Right Turn 10 10 104.0% 28.7 19.3 C
Subtotal 380 376 98.9% 59.5 17.7 E
Total 2,111 2,137 101.2% 33.5 6.5 C
73.3
Intersection 6 Richards Blvd/Olive Dr Signal
Demand Total Delay (sec/veh)
Direction Movement Volume (vph) Average Percent Average Std. Dev. LOS
Left Turn 217 243 112.0% 37.6 3.8 D
Through 631 743 117.8% 8.7 1.2 A
Right Turn 73 56 76.2% 2.3 1.5 A
Subtotal 921 1,042 113.1% 15.5 1.5 B
Left Turn 128 111 87.0% 72.5 6.2 E
Through 789 799 101.3% 17.3 3.8 B
Right Turn 62 61 98.9% 16.1 4.8 B
Subtotal 979 972 99.3% 24.1 4.9 C
Left Turn 38 16 43.2% 41.6 14.2 D
Through 42 23 54.3% 52.0 16.4 D
Right Turn 455 453 99.5% 16.3 1.6 B
Subtotal 535 492 91.9% 18.7 1.1 B
Left Turn 166 95 57.3% 48.0 6.3 D
Through 40 29 72.3% 48.6 16.8 D
Right Turn 200 144 72.1% 30.8 11.5 C
Subtotal 406 268 66.1% 38.5 9.2 D
Total 2,841 2,774 97.6% 21.3 2.3 C
65.7
WB
Served Volume (vph)
NB
SB
EB
WB
Served Volume (vph)
NB
SB
EB
Fehr & Peers 12/3/2016

Vissim Post-Processor Richards Blvd - Olive Dr Circulation
Average Results from 10 Runs Olive Dr Off-Ramp Closure with Lincoln 40 - Cumulative Conditions
Volume and Delay by Movement PM Peak Hour
Intersection 7 I-80 WB Ramps/Richards Blvd Signal
Demand Total Delay (sec/veh)
Direction Movement Volume (vph) Average Percent Average Std. Dev. LOS
Left Turn 776 776 100.0% 37.6 3.1 D
Through 602 596 99.0% 6.1 3.5 A
Right Turn
Subtotal 1,378 1,372 99.5% 24.3 3.1 C
Left Turn
Through 1,197 1,125 94.0% 22.3 1.9 C
Right Turn 374 375 100.4% 10.8 2.3 B
Subtotal 1,571 1,500 95.5% 19.4 1.6 B
Left Turn
Through
Right Turn
Subtotal
Left Turn 85 118 139.2% 40.2 5.9 D
Through
Right Turn 324 454 140.1% 14.2 4.1 B
Subtotal 409 572 139.9% 19.8 3.3 B
Total 3,358 3,444 102.6% 21.5 1.9 C
41.4
Intersection 8 I-80 EB Ramps/Richards Blvd Signal
Demand Total Delay (sec/veh)
Direction Movement Volume (vph) Average Percent Average Std. Dev. LOS
Left Turn
Through 1,202 1,203 100.1% 27.0 3.7 C
Right Turn 125 118 94.0% 30.7 4.8 C
Subtotal 1,327 1,320 99.5% 27.3 3.7 C
Left Turn 468 464 99.1% 45.8 9.3 D
Through 814 779 95.7% 12.9 4.8 B
Right Turn
Subtotal 1,282 1,243 97.0% 25.5 4.7 C
Left Turn
Through
Right Turn
Subtotal
Left Turn 800 803 100.3% 27.0 7.8 C
Through
Right Turn 176 171 97.0% 10.7 1.4 B
Subtotal 976 974 99.7% 24.2 6.7 C
Total 3,585 3,537 98.7% 25.9 2.4 C
37.9
NB
SB
EB
WB
Served Volume (vph)
NB
SB
EB
WB
Served Volume (vph)
Fehr & Peers 12/3/2016
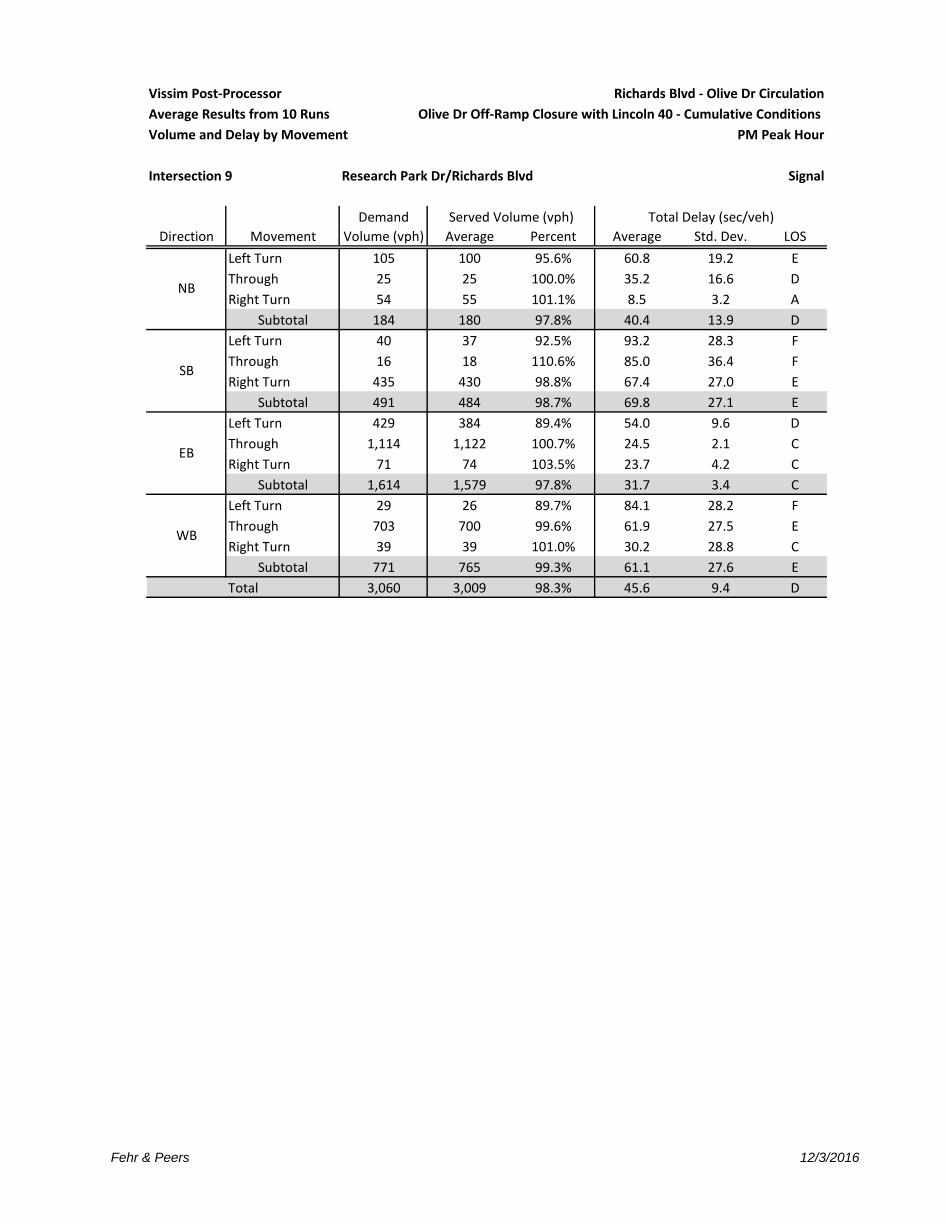
Vissim Post-Processor Richards Blvd - Olive Dr Circulation
Average Results from 10 Runs Olive Dr Off-Ramp Closure with Lincoln 40 - Cumulative Conditions
Volume and Delay by Movement PM Peak Hour
Intersection 9 Research Park Dr/Richards Blvd Signal
Demand Total Delay (sec/veh)
Direction Movement Volume (vph) Average Percent Average Std. Dev. LOS
Left Turn 105 100 95.6% 60.8 19.2 E
Through 25 25 100.0% 35.2 16.6 D
Right Turn 54 55 101.1% 8.5 3.2 A
Subtotal 184 180 97.8% 40.4 13.9 D
Left Turn 40 37 92.5% 93.2 28.3 F
Through 16 18 110.6% 85.0 36.4 F
Right Turn 435 430 98.8% 67.4 27.0 E
Subtotal 491 484 98.7% 69.8 27.1 E
Left Turn 429 384 89.4% 54.0 9.6 D
Through 1,114 1,122 100.7% 24.5 2.1 C
Right Turn 71 74 103.5% 23.7 4.2 C
Subtotal 1,614 1,579 97.8% 31.7 3.4 C
Left Turn 29 26 89.7% 84.1 28.2 F
Through 703 700 99.6% 61.9 27.5 E
Right Turn 39 39 101.0% 30.2 28.8 C
Subtotal 771 765 99.3% 61.1 27.6 E
Total 3,060 3,009 98.3% 45.6 9.4 D
71.9
Served Volume (vph)
NB
SB
EB
WB
Fehr & Peers 12/3/2016
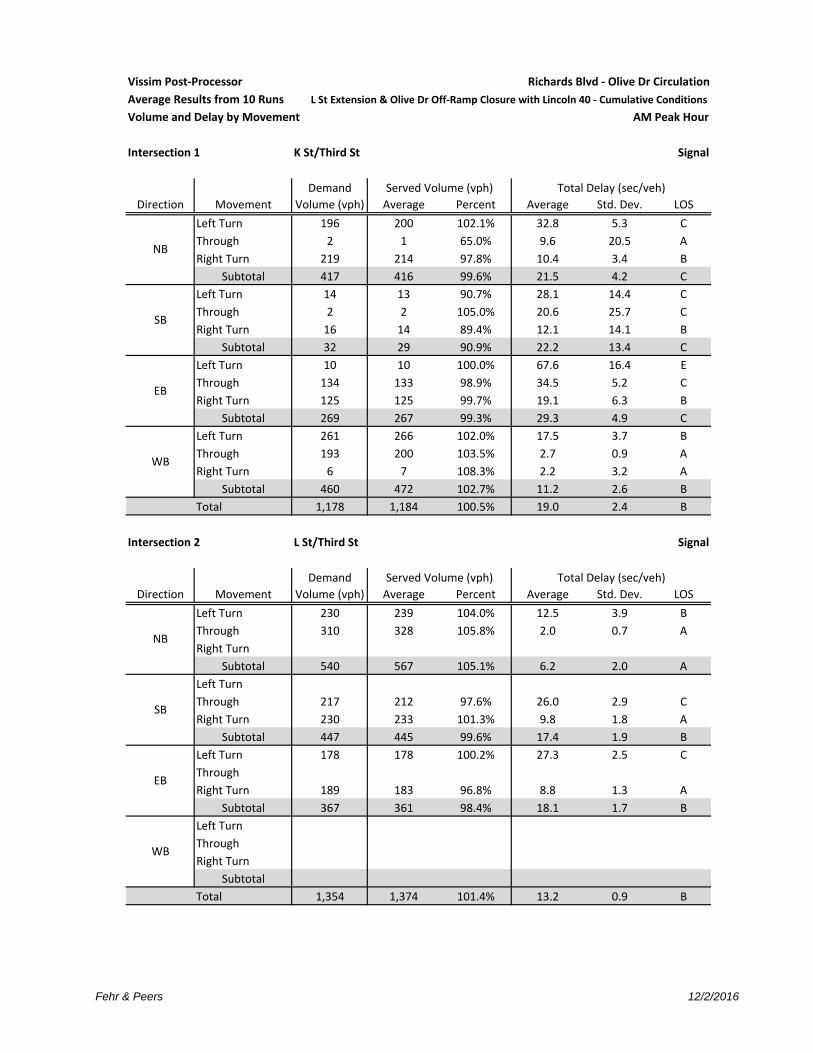
Vissim Post‐Processor Richards Blvd ‐ Olive Dr Circulation
Average Results from 10 Runs L St Extension & Olive Dr Off‐Ramp Closure with Lincoln 40 ‐ Cumulative Conditions
Volume and Delay by Movement AM Peak Hour
Intersection 1 K St/Third St Signal
Demand Total Delay (sec/veh)
Direction Movement Volume (vph) Average Percent Average Std. Dev. LOS
Left Turn 196 200 102.1% 32.8 5.3 C
Through 2 1 65.0% 9.6 20.5 A
Right Turn 219 214 97.8% 10.4 3.4 B
Subtotal 417 416 99.6% 21.5 4.2 C
Left Turn 14 13 90.7% 28.1 14.4 C
Through 2 2 105.0% 20.6 25.7 C
Right Turn 16 14 89.4% 12.1 14.1 B
Subtotal 32 29 90.9% 22.2 13.4 C
Left Turn 10 10 100.0% 67.6 16.4 E
Through 134 133 98.9% 34.5 5.2 C
Right Turn 125 125 99.7% 19.1 6.3 B
Subtotal 269 267 99.3% 29.3 4.9 C
Left Turn 261 266 102.0% 17.5 3.7 B
Through 193 200 103.5% 2.7 0.9 A
Right Turn 6 7 108.3% 2.2 3.2 A
Subtotal 460 472 102.7% 11.2 2.6 B
Total 1,178 1,184 100.5% 19.0 2.4 B
50.8
Intersection 2 L St/Third St Signal
Demand Total Delay (sec/veh)
Direction Movement Volume (vph) Average Percent Average Std. Dev. LOS
Left Turn 230 239 104.0% 12.5 3.9 B
Through 310 328 105.8% 2.0 0.7 A
Right Turn
Subtotal 540 567 105.1% 6.2 2.0 A
Left Turn
Through 217 212 97.6% 26.0 2.9 C
Right Turn 230 233 101.3% 9.8 1.8 A
Subtotal 447 445 99.6% 17.4 1.9 B
Left Turn 178 178 100.2% 27.3 2.5 C
Through
Right Turn 189 183 96.8% 8.8 1.3 A
Subtotal 367 361 98.4% 18.1 1.7 B
Left Turn
Through
Right Turn
Subtotal
Total 1,354 1,374 101.4% 13.2 0.9 B
25.2
Served Volume (vph)
NB
SB
EB
WB
Served Volume (vph)
NB
SB
EB
WB
Fehr & Peers 12/2/2016
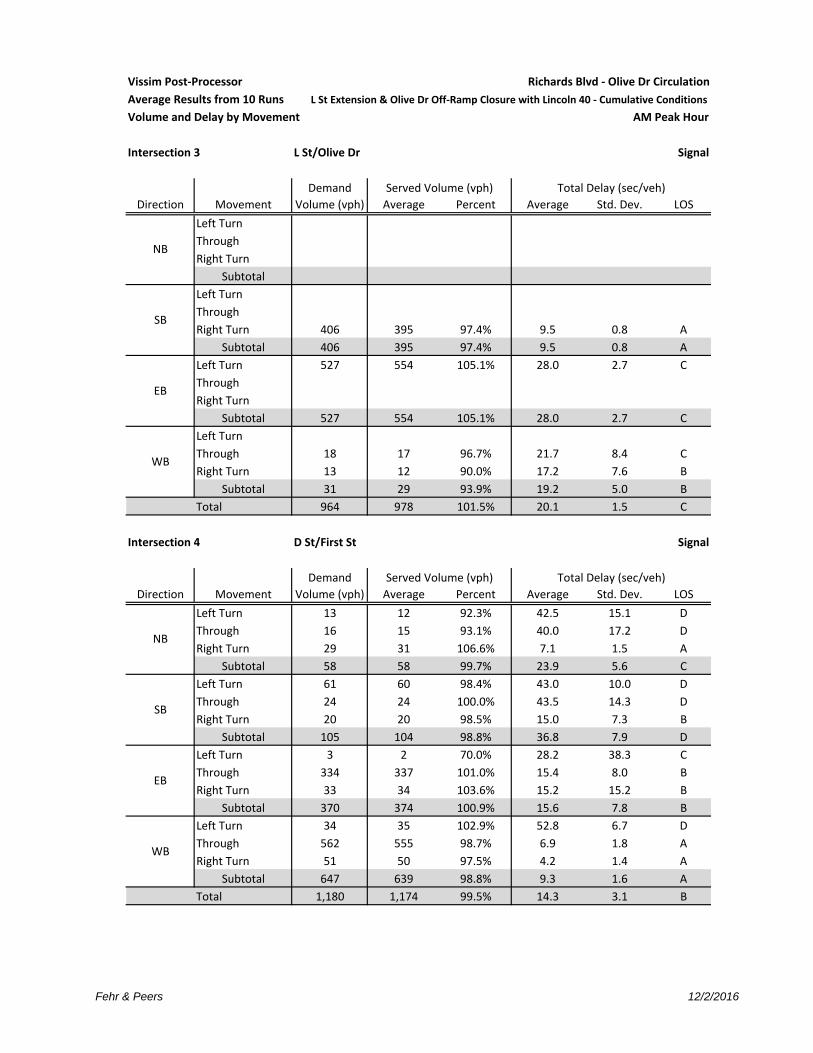
Vissim Post‐Processor Richards Blvd ‐ Olive Dr Circulation
Average Results from 10 Runs L St Extension & Olive Dr Off‐Ramp Closure with Lincoln 40 ‐ Cumulative Conditions
Volume and Delay by Movement AM Peak Hour
Intersection 3 L St/Olive Dr Signal
Demand Total Delay (sec/veh)
Direction Movement Volume (vph) Average Percent Average Std. Dev. LOS
Left Turn
Through
Right Turn
Subtotal
Left Turn
Through
Right Turn 406 395 97.4% 9.5 0.8 A
Subtotal 406 395 97.4% 9.5 0.8 A
Left Turn 527 554 105.1% 28.0 2.7 C
Through
Right Turn
Subtotal 527 554 105.1% 28.0 2.7 C
Left Turn
Through 18 17 96.7% 21.7 8.4 C
Right Turn 13 12 90.0% 17.2 7.6 B
Subtotal 31 29 93.9% 19.2 5.0 B
Total 964 978 101.5% 20.1 1.5 C
26.8
Intersection 4 D St/First St Signal
Demand Total Delay (sec/veh)
Direction Movement Volume (vph) Average Percent Average Std. Dev. LOS
Left Turn 13 12 92.3% 42.5 15.1 D
Through 16 15 93.1% 40.0 17.2 D
Right Turn 29 31 106.6% 7.1 1.5 A
Subtotal 58 58 99.7% 23.9 5.6 C
Left Turn 61 60 98.4% 43.0 10.0 D
Through 24 24 100.0% 43.5 14.3 D
Right Turn 20 20 98.5% 15.0 7.3 B
Subtotal 105 104 98.8% 36.8 7.9 D
Left Turn 3 2 70.0% 28.2 38.3 C
Through 334 337 101.0% 15.4 8.0 B
Right Turn 33 34 103.6% 15.2 15.2 B
Subtotal 370 374 100.9% 15.6 7.8 B
Left Turn 34 35 102.9% 52.8 6.7 D
Through 562 555 98.7% 6.9 1.8 A
Right Turn 51 50 97.5% 4.2 1.4 A
Subtotal 647 639 98.8% 9.3 1.6 A
Total 1,180 1,174 99.5% 14.3 3.1 B
52.8
SB
EB
WB
Served Volume (vph)
NB
SB
Served Volume (vph)
NB
EB
WB
Fehr & Peers 12/2/2016

Vissim Post‐Processor Richards Blvd ‐ Olive Dr Circulation
Average Results from 10 Runs L St Extension & Olive Dr Off‐Ramp Closure with Lincoln 40 ‐ Cumulative Conditions
Volume and Delay by Movement AM Peak Hour
Intersection 5 E St‐Richards Blvd/First St Signal
Demand Total Delay (sec/veh)
Direction Movement Volume (vph) Average Percent Average Std. Dev. LOS
Left Turn 542 531 97.9% 18.1 4.0 B
Through 165 166 100.5% 18.4 4.1 B
Right Turn 89 88 99.0% 9.2 2.6 A
Subtotal 796 785 98.6% 17.2 3.8 B
Left Turn 1 1 80.0% 9.6 21.9 A
Through 167 167 99.8% 37.9 6.6 D
Right Turn 11 14 127.3% 17.9 9.6 B
Subtotal 179 182 101.4% 36.6 5.9 D
Left Turn 9 11 116.7% 63.9 27.8 E
Through 62 62 99.2% 51.5 13.5 D
Right Turn 353 357 101.1% 11.1 2.7 B
Subtotal 424 429 101.2% 18.6 2.7 B
Left Turn 89 92 102.8% 36.8 5.6 D
Through 94 92 97.6% 37.4 6.5 D
Right Turn 3 3 103.3% 10.0 16.9 A
Subtotal 186 186 100.2% 37.2 3.7 D
Total 1,585 1,581 99.8% 22.4 2.1 C
54.2
Intersection 6 Richards Blvd/Olive Dr Signal
Demand Total Delay (sec/veh)
Direction Movement Volume (vph) Average Percent Average Std. Dev. LOS
Left Turn 475 485 102.0% 95.4 24.7 F
Through 741 727 98.1% 22.8 4.2 C
Right Turn 376 378 100.6% 10.7 2.6 B
Subtotal 1,592 1,590 99.9% 43.0 9.9 D
Left Turn 21 22 102.4% 52.7 7.4 D
Through 500 512 102.4% 26.4 3.2 C
Right Turn 88 83 94.4% 23.2 4.1 C
Subtotal 609 617 101.2% 26.8 2.7 C
Left Turn 42 44 104.3% 42.7 8.9 D
Through 62 60 96.6% 31.5 4.9 C
Right Turn 131 130 99.3% 9.6 0.9 A
Subtotal 235 234 99.5% 21.7 2.8 C
Left Turn 306 305 99.7% 54.1 8.8 D
Through 85 80 93.6% 30.9 5.8 C
Right Turn 13 17 129.2% 32.8 12.8 C
Subtotal 404 402 99.4% 48.7 7.5 D
Total 2,840 2,842 100.1% 38.8 5.1 D
53.5
WB
Served Volume (vph)
NB
SB
EB
WB
Served Volume (vph)
NB
SB
EB
Fehr & Peers 12/2/2016
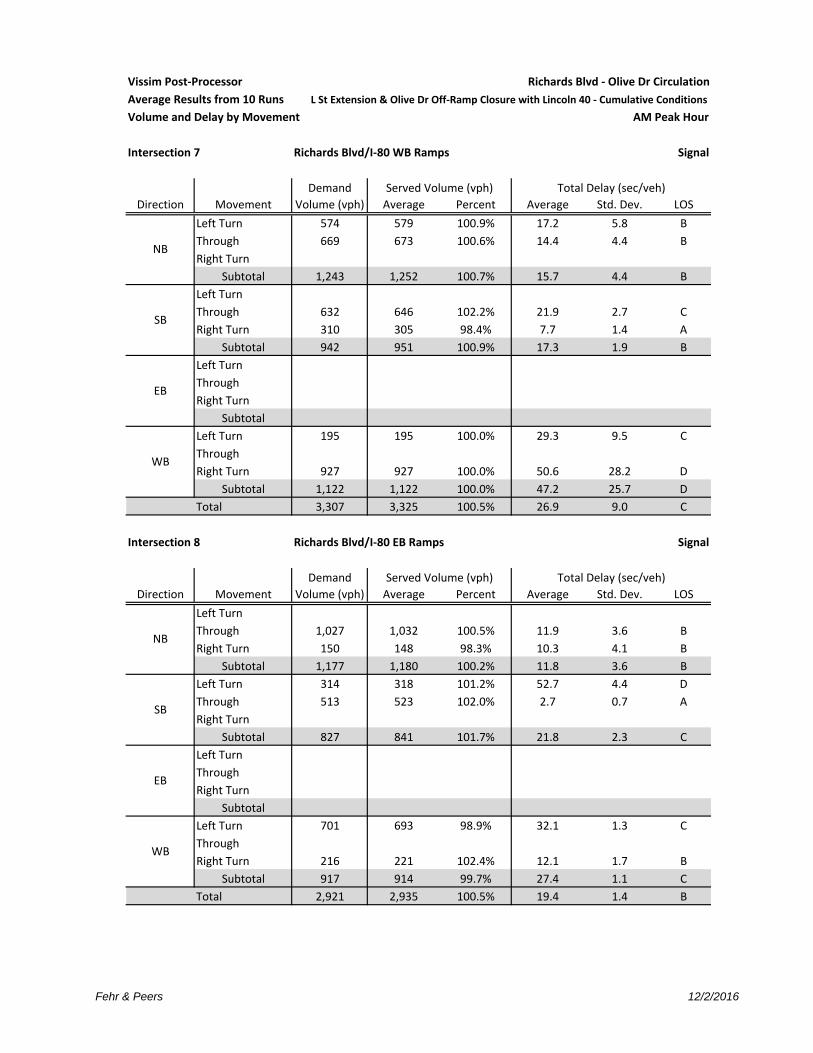
Vissim Post‐Processor Richards Blvd ‐ Olive Dr Circulation
Average Results from 10 Runs L St Extension & Olive Dr Off‐Ramp Closure with Lincoln 40 ‐ Cumulative Conditions
Volume and Delay by Movement AM Peak Hour
Intersection 7 Richards Blvd/I‐80 WB Ramps Signal
Demand Total Delay (sec/veh)
Direction Movement Volume (vph) Average Percent Average Std. Dev. LOS
Left Turn 574 579 100.9% 17.2 5.8 B
Through 669 673 100.6% 14.4 4.4 B
Right Turn
Subtotal 1,243 1,252 100.7% 15.7 4.4 B
Left Turn
Through 632 646 102.2% 21.9 2.7 C
Right Turn 310 305 98.4% 7.7 1.4 A
Subtotal 942 951 100.9% 17.3 1.9 B
Left Turn
Through
Right Turn
Subtotal
Left Turn 195 195 100.0% 29.3 9.5 C
Through
Right Turn 927 927 100.0% 50.6 28.2 D
Subtotal 1,122 1,122 100.0% 47.2 25.7 D
Total 3,307 3,325 100.5% 26.9 9.0 C
29.9
Intersection 8 Richards Blvd/I‐80 EB Ramps Signal
Demand Total Delay (sec/veh)
Direction Movement Volume (vph) Average Percent Average Std. Dev. LOS
Left Turn
Through 1,027 1,032 100.5% 11.9 3.6 B
Right Turn 150 148 98.3% 10.3 4.1 B
Subtotal 1,177 1,180 100.2% 11.8 3.6 B
Left Turn 314 318 101.2% 52.7 4.4 D
Through 513 523 102.0% 2.7 0.7 A
Right Turn
Subtotal 827 841 101.7% 21.8 2.3 C
Left Turn
Through
Right Turn
Subtotal
Left Turn 701 693 98.9% 32.1 1.3 C
Through
Right Turn 216 221 102.4% 12.1 1.7 B
Subtotal 917 914 99.7% 27.4 1.1 C
Total 2,921 2,935 100.5% 19.4 1.4 B
52.6
NB
SB
EB
WB
Served Volume (vph)
NB
SB
EB
WB
Served Volume (vph)
Fehr & Peers 12/2/2016

Vissim Post‐Processor Richards Blvd ‐ Olive Dr Circulation
Average Results from 10 Runs L St Extension & Olive Dr Off‐Ramp Closure with Lincoln 40 ‐ Cumulative Conditions
Volume and Delay by Movement AM Peak Hour
Intersection 9 Research Park Dr/Richards Blvd Signal
Demand Total Delay (sec/veh)
Direction Movement Volume (vph) Average Percent Average Std. Dev. LOS
Left Turn 89 85 96.0% 41.5 6.5 D
Through 5 5 108.0% 26.5 25.4 C
Right Turn 41 42 101.5% 5.7 1.1 A
Subtotal 135 132 98.1% 29.6 7.1 C
Left Turn 31 33 105.2% 40.7 9.5 D
Through 21 21 100.0% 31.0 13.1 C
Right Turn 159 157 98.5% 14.0 4.0 B
Subtotal 211 210 99.6% 19.5 4.6 B
Left Turn 359 361 100.5% 32.5 7.7 C
Through 719 723 100.5% 17.0 2.7 B
Right Turn 136 133 97.8% 19.7 3.6 B
Subtotal 1,214 1,216 100.2% 21.9 2.3 C
Left Turn 63 61 96.8% 94.8 13.7 F
Through 894 894 100.0% 78.2 17.2 E
Right Turn 70 63 89.9% 60.8 16.9 E
Subtotal 1,027 1,018 99.1% 78.2 16.9 E
Total 2,587 2,576 99.6% 44.9 6.0 D
75.0
Served Volume (vph)
NB
SB
EB
WB
Fehr & Peers 12/2/2016

Vissim Post‐Processor Richards Blvd ‐ Olive Dr Circulation
Average Results from 10 Runs L St Extension & Olive Dr Off‐Ramp Closure with Lincoln 40 ‐ Cumulative Conditions
Volume and Delay by Movement PM Peak Hour
Intersection 1 K St/Third St Signal
Demand Total Delay (sec/veh)
Direction Movement Volume (vph) Average Percent Average Std. Dev. LOS
Left Turn 258 267 103.5% 35.0 6.6 D
Through 4 3 82.5% 20.8 24.6 C
Right Turn 280 271 96.8% 14.8 4.0 B
Subtotal 542 541 99.9% 24.8 4.7 C
Left Turn 43 42 97.9% 35.3 8.2 D
Through 4 4 105.0% 35.1 19.9 D
Right Turn 13 12 92.3% 8.3 5.7 A
Subtotal 60 58 97.2% 29.5 7.0 C
Left Turn 11 11 99.1% 128.9 73.1 F
Through 179 161 89.8% 136.6 22.7 F
Right Turn 268 246 91.8% 123.0 19.0 F
Subtotal 458 418 91.2% 129.1 20.3 F
Left Turn 421 422 100.3% 28.3 3.1 C
Through 265 265 100.0% 3.8 0.9 A
Right Turn 5 4 80.0% 0.7 1.0 A
Subtotal 691 691 100.0% 18.5 2.3 B
Total 1,751 1,709 97.6% 47.0 3.8 D
136.6
Intersection 2 L St/Third St Signal
Demand Total Delay (sec/veh)
Direction Movement Volume (vph) Average Percent Average Std. Dev. LOS
Left Turn 242 239 98.8% 37.5 11.8 D
Through 441 437 99.0% 7.6 3.4 A
Right Turn
Subtotal 683 676 98.9% 18.3 7.2 B
Left Turn
Through 240 220 91.5% 58.6 10.4 E
Right Turn 449 452 100.7% 53.2 12.3 D
Subtotal 689 672 97.5% 55.1 11.2 E
Left Turn 236 233 98.7% 31.1 4.2 C
Through
Right Turn 266 243 91.3% 10.9 2.6 B
Subtotal 502 476 94.8% 20.6 3.2 C
Left Turn
Through
Right Turn
Subtotal
Total 1,874 1,823 97.3% 31.9 2.9 C
43.4
NB
SB
EB
WB
Served Volume (vph)
NB
SB
EB
WB
Served Volume (vph)
Fehr & Peers 12/2/2016

Vissim Post‐Processor Richards Blvd ‐ Olive Dr Circulation
Average Results from 10 Runs L St Extension & Olive Dr Off‐Ramp Closure with Lincoln 40 ‐ Cumulative Conditions
Volume and Delay by Movement PM Peak Hour
Intersection 3 L St/Olive Dr Signal
Demand Total Delay (sec/veh)
Direction Movement Volume (vph) Average Percent Average Std. Dev. LOS
Left Turn
Through
Right Turn
Subtotal
Left Turn
Through
Right Turn 506 463 91.4% 5.9 0.8 A
Subtotal 506 463 91.4% 5.9 0.8 A
Left Turn 666 662 99.4% 15.2 4.6 B
Through
Right Turn
Subtotal 666 662 99.4% 15.2 4.6 B
Left Turn
Through 22 18 79.5% 37.4 10.5 D
Right Turn 17 14 82.9% 14.0 5.6 B
Subtotal 39 32 81.0% 28.4 9.2 C
Total 1,211 1,156 95.5% 11.9 3.1 B
51.4
Intersection 4 D St/First St Signal
Demand Total Delay (sec/veh)
Direction Movement Volume (vph) Average Percent Average Std. Dev. LOS
Left Turn 31 28 91.6% 46.4 23.4 D
Through 44 44 99.8% 56.4 17.3 E
Right Turn 64 68 106.4% 25.2 11.9 C
Subtotal 139 140 101.0% 39.1 14.5 D
Left Turn 177 120 68.0% 386.5 69.9 F
Through 39 25 64.9% 379.6 108.9 F
Right Turn 32 22 68.1% 321.2 50.8 F
Subtotal 248 168 67.5% 375.9 68.1 F
Left Turn 22 21 95.5% 185.7 75.8 F
Through 445 428 96.3% 177.2 52.0 F
Right Turn 61 55 90.8% 167.4 37.6 F
Subtotal 528 505 95.6% 177.9 49.5 F
Left Turn 78 77 98.3% 48.8 6.1 D
Through 428 426 99.6% 10.7 2.7 B
Right Turn 49 47 96.1% 6.5 3.0 A
Subtotal 555 550 99.1% 15.6 3.1 B
Total 1,470 1,363 92.7% 120.5 17.5 F
264.7
EB
WB
Served Volume (vph)
NB
SB
Served Volume (vph)
NB
SB
EB
WB
Fehr & Peers 12/2/2016
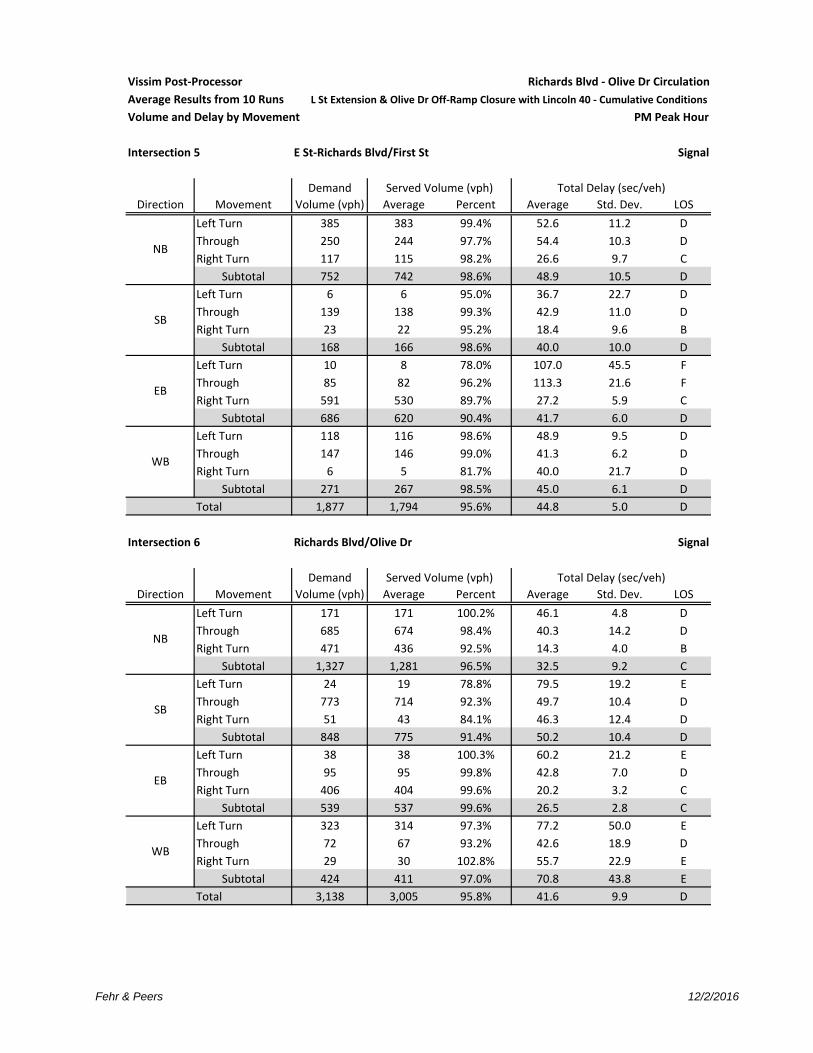
Vissim Post‐Processor Richards Blvd ‐ Olive Dr Circulation
Average Results from 10 Runs L St Extension & Olive Dr Off‐Ramp Closure with Lincoln 40 ‐ Cumulative Conditions
Volume and Delay by Movement PM Peak Hour
Intersection 5 E St‐Richards Blvd/First St Signal
Demand Total Delay (sec/veh)
Direction Movement Volume (vph) Average Percent Average Std. Dev. LOS
Left Turn 385 383 99.4% 52.6 11.2 D
Through 250 244 97.7% 54.4 10.3 D
Right Turn 117 115 98.2% 26.6 9.7 C
Subtotal 752 742 98.6% 48.9 10.5 D
Left Turn 6 6 95.0% 36.7 22.7 D
Through 139 138 99.3% 42.9 11.0 D
Right Turn 23 22 95.2% 18.4 9.6 B
Subtotal 168 166 98.6% 40.0 10.0 D
Left Turn 10 8 78.0% 107.0 45.5 F
Through 85 82 96.2% 113.3 21.6 F
Right Turn 591 530 89.7% 27.2 5.9 C
Subtotal 686 620 90.4% 41.7 6.0 D
Left Turn 118 116 98.6% 48.9 9.5 D
Through 147 146 99.0% 41.3 6.2 D
Right Turn 6 5 81.7% 40.0 21.7 D
Subtotal 271 267 98.5% 45.0 6.1 D
Total 1,877 1,794 95.6% 44.8 5.0 D
107.4
Intersection 6 Richards Blvd/Olive Dr Signal
Demand Total Delay (sec/veh)
Direction Movement Volume (vph) Average Percent Average Std. Dev. LOS
Left Turn 171 171 100.2% 46.1 4.8 D
Through 685 674 98.4% 40.3 14.2 D
Right Turn 471 436 92.5% 14.3 4.0 B
Subtotal 1,327 1,281 96.5% 32.5 9.2 C
Left Turn 24 19 78.8% 79.5 19.2 E
Through 773 714 92.3% 49.7 10.4 D
Right Turn 51 43 84.1% 46.3 12.4 D
Subtotal 848 775 91.4% 50.2 10.4 D
Left Turn 38 38 100.3% 60.2 21.2 E
Through 95 95 99.8% 42.8 7.0 D
Right Turn 406 404 99.6% 20.2 3.2 C
Subtotal 539 537 99.6% 26.5 2.8 C
Left Turn 323 314 97.3% 77.2 50.0 E
Through 72 67 93.2% 42.6 18.9 D
Right Turn 29 30 102.8% 55.7 22.9 E
Subtotal 424 411 97.0% 70.8 43.8 E
Total 3,138 3,005 95.8% 41.6 9.9 D
65.3
WB
Served Volume (vph)
NB
SB
EB
WB
Served Volume (vph)
NB
SB
EB
Fehr & Peers 12/2/2016

Vissim Post‐Processor Richards Blvd ‐ Olive Dr Circulation
Average Results from 10 Runs L St Extension & Olive Dr Off‐Ramp Closure with Lincoln 40 ‐ Cumulative Conditions
Volume and Delay by Movement PM Peak Hour
Intersection 7 Richards Blvd/I‐80 WB Ramps Signal
Demand Total Delay (sec/veh)
Direction Movement Volume (vph) Average Percent Average Std. Dev. LOS
Left Turn 595 579 97.2% 32.7 7.4 C
Through 841 801 95.3% 32.8 31.3 C
Right Turn
Subtotal 1,436 1,380 96.1% 32.9 19.4 C
Left Turn
Through 1,164 1,107 95.1% 32.5 7.2 C
Right Turn 478 460 96.3% 16.3 5.6 B
Subtotal 1,642 1,568 95.5% 27.6 6.8 C
Left Turn
Through
Right Turn
Subtotal
Left Turn 112 115 102.6% 29.3 3.5 C
Through
Right Turn 506 502 99.2% 29.3 9.9 C
Subtotal 618 617 99.8% 29.2 7.5 C
Total 3,696 3,564 96.4% 29.7 7.7 C
30.3
Intersection 8 Richards Blvd/I‐80 EB Ramps Signal
Demand Total Delay (sec/veh)
Direction Movement Volume (vph) Average Percent Average Std. Dev. LOS
Left Turn
Through 1,289 1,234 95.8% 27.6 15.2 C
Right Turn 136 131 96.0% 32.8 15.8 C
Subtotal 1,425 1,365 95.8% 28.1 15.2 C
Left Turn 476 438 92.1% 47.8 3.1 D
Through 800 783 97.8% 7.6 1.7 A
Right Turn
Subtotal 1,276 1,221 95.7% 22.5 2.0 C
Left Turn
Through
Right Turn
Subtotal
Left Turn 703 700 99.5% 33.4 1.7 C
Through
Right Turn 147 147 100.1% 30.1 30.1 C
Subtotal 850 847 99.6% 33.0 6.3 C
Total 3,551 3,433 96.7% 27.3 7.0 C
47.9
NB
SB
EB
WB
Served Volume (vph)
NB
SB
EB
WB
Served Volume (vph)
Fehr & Peers 12/2/2016
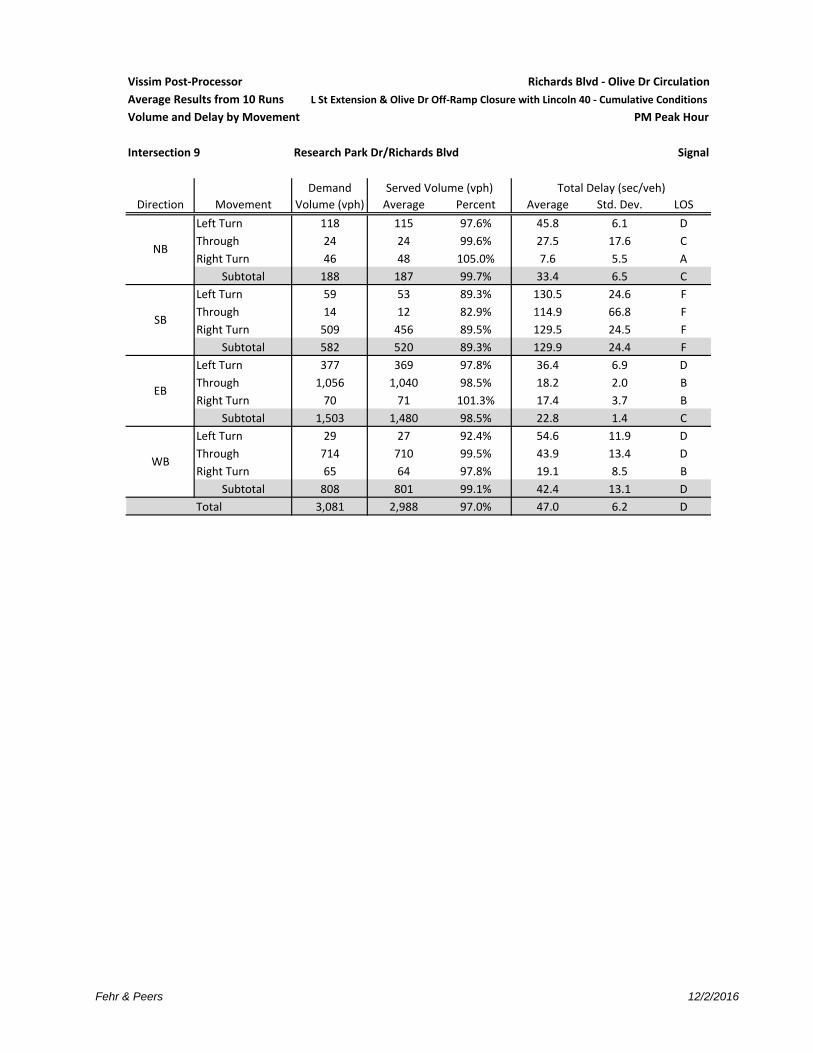
Vissim Post‐Processor Richards Blvd ‐ Olive Dr Circulation
Average Results from 10 Runs L St Extension & Olive Dr Off‐Ramp Closure with Lincoln 40 ‐ Cumulative Conditions
Volume and Delay by Movement PM Peak Hour
Intersection 9 Research Park Dr/Richards Blvd Signal
Demand Total Delay (sec/veh)
Direction Movement Volume (vph) Average Percent Average Std. Dev. LOS
Left Turn 118 115 97.6% 45.8 6.1 D
Through 24 24 99.6% 27.5 17.6 C
Right Turn 46 48 105.0% 7.6 5.5 A
Subtotal 188 187 99.7% 33.4 6.5 C
Left Turn 59 53 89.3% 130.5 24.6 F
Through 14 12 82.9% 114.9 66.8 F
Right Turn 509 456 89.5% 129.5 24.5 F
Subtotal 582 520 89.3% 129.9 24.4 F
Left Turn 377 369 97.8% 36.4 6.9 D
Through 1,056 1,040 98.5% 18.2 2.0 B
Right Turn 70 71 101.3% 17.4 3.7 B
Subtotal 1,503 1,480 98.5% 22.8 1.4 C
Left Turn 29 27 92.4% 54.6 11.9 D
Through 714 710 99.5% 43.9 13.4 D
Right Turn 65 64 97.8% 19.1 8.5 B
Subtotal 808 801 99.1% 42.4 13.1 D
Total 3,081 2,988 97.0% 47.0 6.2 D
90.0
SB
EB
WB
Served Volume (vph)
NB
Fehr & Peers 12/2/2016

Vissim Post-Processor Richards Blvd - Olive Dr Circulation
Average Results from 10 Runs No Build with Lincoln 40 - Cumulative Conditions
Queue Length AM Peak Hour
Intersection 1 K St/Third St Side-street Stop
Storage Average Queue (ft) Maximum Queue (ft) Exceeds
Direction Movement (ft) Average Std. Dev. Minimum Maximum Average Std. Dev. Minimum Maximum Storage?
U Turn
Second Left
Left Turn 360 0 0 0 0 9 11 0 23 NO
Through 360 0 0 0 0 9 11 0 23 NO
Right Turn 360 0 0 0 0 2 7 0 21 NO
Second Right
U Turn
Second Left
Left Turn 420 3 1 2 4 73 16 51 91 NO
Through 3,700 3 1 2 4 73 16 51 91 NO
Right Turn 420 3 1 2 4 73 16 51 91 NO
Second Right
U Turn
Second Left
Left Turn 250 1 1 0 3 50 45 0 137 NO
Through 250 0 0 0 0 0 0 0 0 NO
Right Turn 250 1 1 0 3 53 47 0 142 NO
Second Right
U Turn
Second Left
Left Turn 250 0 0 0 0 28 17 0 48 NO
Through 250 0 0 0 0 68 5 65 81 NO
Right Turn 250 0 0 0 0 39 18 0 59 NO
Second Right
NB
SB
EB
WB
Fehr & Peers 12/1/2016

Vissim Post-Processor Richards Blvd - Olive Dr Circulation
Average Results from 10 Runs No Build with Lincoln 40 - Cumulative Conditions
Queue Length AM Peak Hour
Intersection 2 L St/Third St Side-street Stop
Storage Average Queue (ft) Maximum Queue (ft) Exceeds
Direction Movement (ft) Average Std. Dev. Minimum Maximum Average Std. Dev. Minimum Maximum Storage?
U Turn
Second Left
Left Turn 360 0 0 0 1 62 14 47 86 NO
Through 360 0 0 0 0 0 0 0 0 NO
Right Turn
Second Right
U Turn
Second Left
Left Turn
Through 420 0 0 0 0 0 0 0 0 NO
Right Turn 420 0 0 0 0 9 27 0 86 NO
Second Right
U Turn
Second Left
Left Turn 250 29 7 20 43 225 87 146 412 NO
Through
Right Turn 250 29 7 20 43 225 87 146 412 NO
Second Right
U Turn
Second Left
Left Turn
Through
Right Turn
Second Right
NB
SB
EB
WB
Fehr & Peers 12/1/2016

Vissim Post-Processor Richards Blvd - Olive Dr Circulation
Average Results from 10 Runs No Build with Lincoln 40 - Cumulative Conditions
Queue Length AM Peak Hour
Intersection 3 Arbor Apts Dwy (East)/Olive Dr Side-street Stop
Storage Average Queue (ft) Maximum Queue (ft) Exceeds
Direction Movement (ft) Average Std. Dev. Minimum Maximum Average Std. Dev. Minimum Maximum Storage?
U Turn
Second Left
Left Turn 460 1 1 0 2 34 15 22 59 NO
Through
Right Turn
Second Right
U Turn
Second Left
Left Turn
Through
Right Turn
Second Right
U Turn
Second Left
Left Turn
Through 2,000 31 56 0 142 154 199 0 406 NO
Right Turn 2,000 0 0 0 0 2 8 0 25 NO
Second Right
U Turn
Second Left
Left Turn 1,400 2 7 0 21 38 122 0 385 NO
Through 1,400 0 0 0 0 0 0 0 0 NO
Right Turn
Second Right
SB
EB
WB
NB
Fehr & Peers 12/1/2016
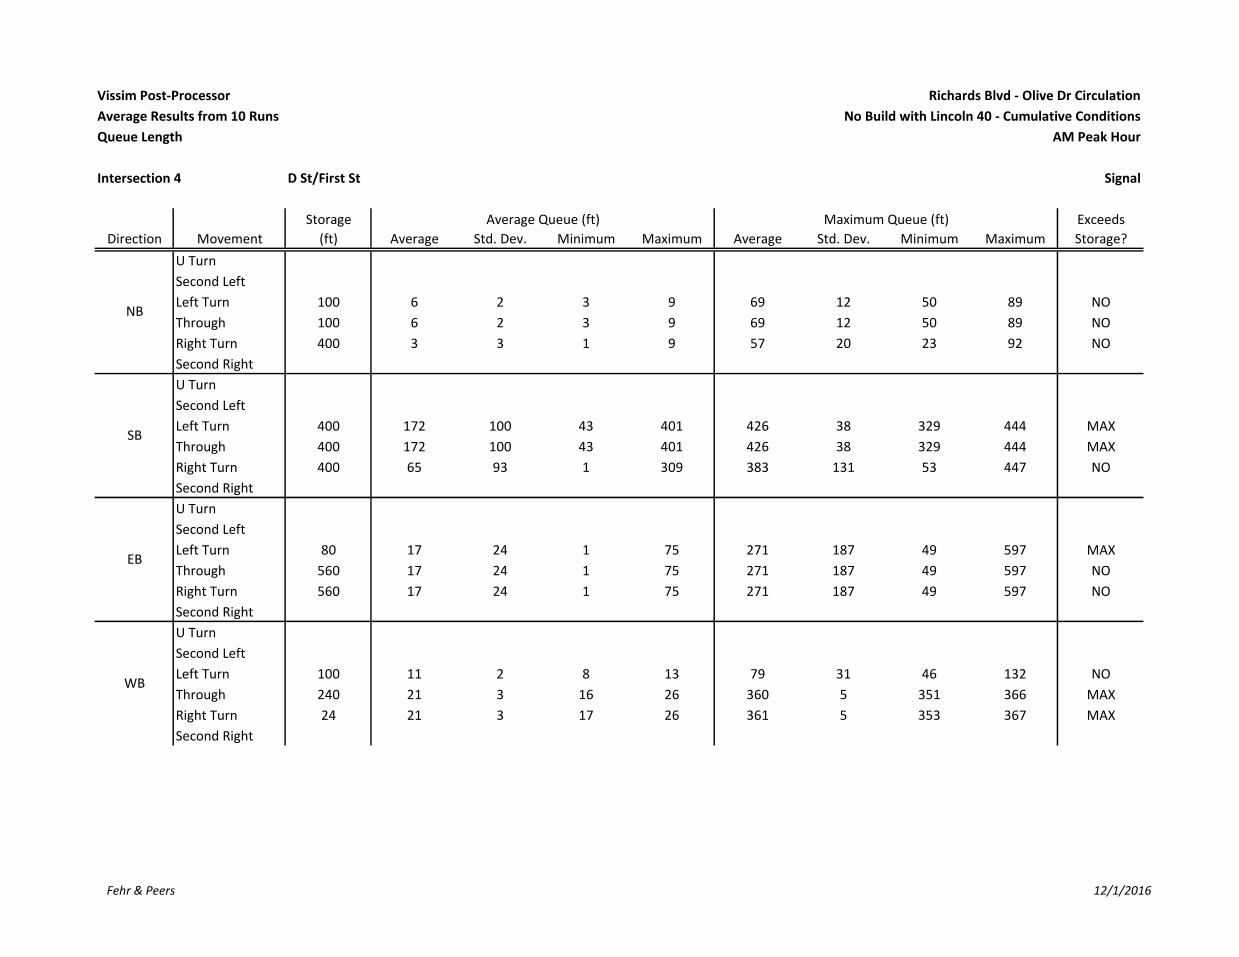
Vissim Post-Processor Richards Blvd - Olive Dr Circulation
Average Results from 10 Runs No Build with Lincoln 40 - Cumulative Conditions
Queue Length AM Peak Hour
Intersection 4 D St/First St Signal
Storage Average Queue (ft) Maximum Queue (ft) Exceeds
Direction Movement (ft) Average Std. Dev. Minimum Maximum Average Std. Dev. Minimum Maximum Storage?
U Turn
Second Left
Left Turn 100 6 2 3 9 69 12 50 89 NO
Through 100 6 2 3 9 69 12 50 89 NO
Right Turn 400 3 3 1 9 57 20 23 92 NO
Second Right
U Turn
Second Left
Left Turn 400 172 100 43 401 426 38 329 444 MAX
Through 400 172 100 43 401 426 38 329 444 MAX
Right Turn 400 65 93 1 309 383 131 53 447 NO
Second Right
U Turn
Second Left
Left Turn 80 17 24 1 75 271 187 49 597 MAX
Through 560 17 24 1 75 271 187 49 597 NO
Right Turn 560 17 24 1 75 271 187 49 597 NO
Second Right
U Turn
Second Left
Left Turn 100 11 2 8 13 79 31 46 132 NO
Through 240 21 3 16 26 360 5 351 366 MAX
Right Turn 24 21 3 17 26 361 5 353 367 MAX
Second Right
NB
SB
EB
WB
Fehr & Peers 12/1/2016
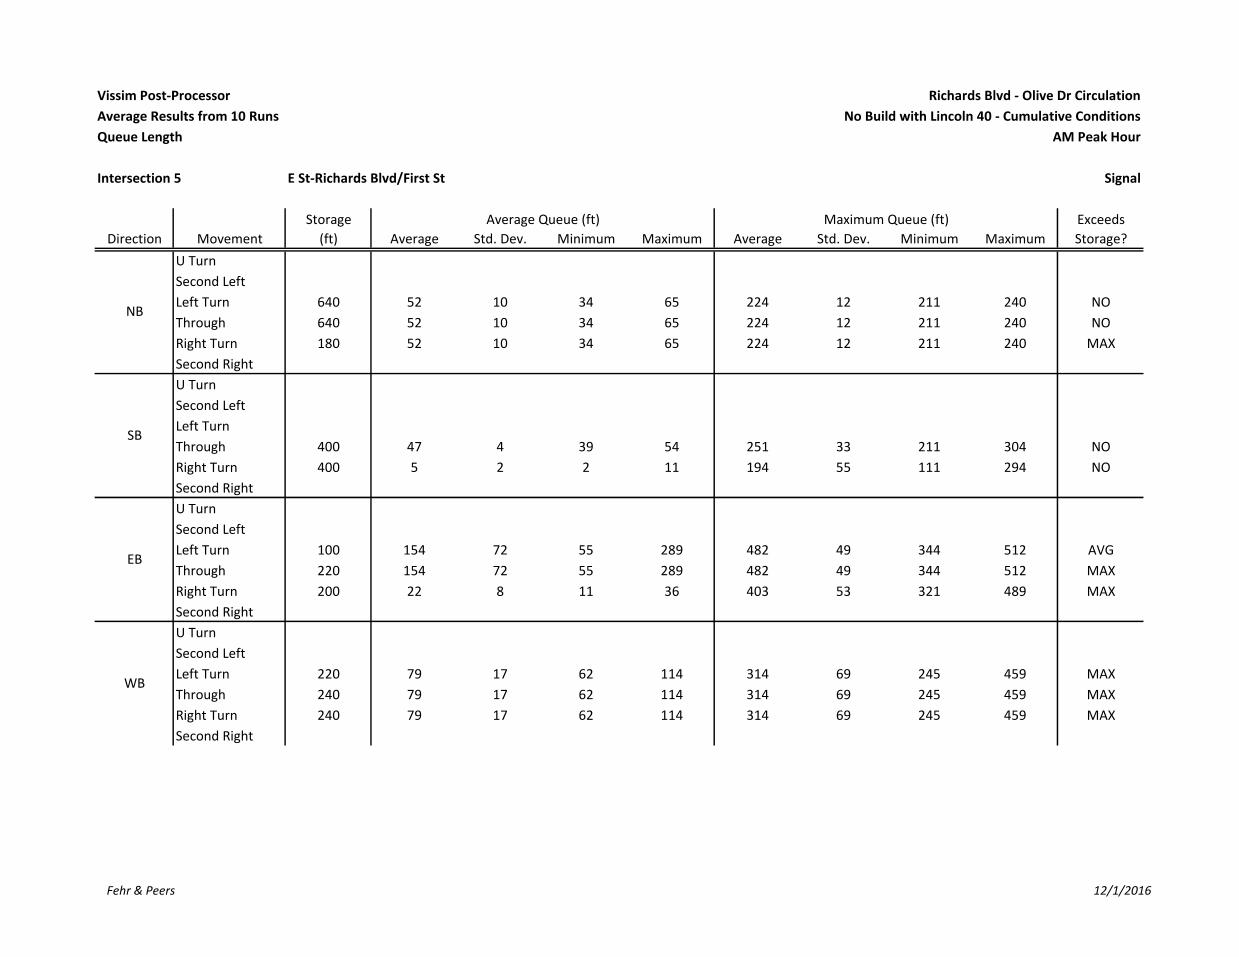
Vissim Post-Processor Richards Blvd - Olive Dr Circulation
Average Results from 10 Runs No Build with Lincoln 40 - Cumulative Conditions
Queue Length AM Peak Hour
Intersection 5 E St-Richards Blvd/First St Signal
Storage Average Queue (ft) Maximum Queue (ft) Exceeds
Direction Movement (ft) Average Std. Dev. Minimum Maximum Average Std. Dev. Minimum Maximum Storage?
U Turn
Second Left
Left Turn 640 52 10 34 65 224 12 211 240 NO
Through 640 52 10 34 65 224 12 211 240 NO
Right Turn 180 52 10 34 65 224 12 211 240 MAX
Second Right
U Turn
Second Left
Left Turn
Through 400 47 4 39 54 251 33 211 304 NO
Right Turn 400 5 2 2 11 194 55 111 294 NO
Second Right
U Turn
Second Left
Left Turn 100 154 72 55 289 482 49 344 512 AVG
Through 220 154 72 55 289 482 49 344 512 MAX
Right Turn 200 22 8 11 36 403 53 321 489 MAX
Second Right
U Turn
Second Left
Left Turn 220 79 17 62 114 314 69 245 459 MAX
Through 240 79 17 62 114 314 69 245 459 MAX
Right Turn 240 79 17 62 114 314 69 245 459 MAX
Second Right
NB
SB
EB
WB
Fehr & Peers 12/1/2016

Vissim Post-Processor Richards Blvd - Olive Dr Circulation
Average Results from 10 Runs No Build with Lincoln 40 - Cumulative Conditions
Queue Length AM Peak Hour
Intersection 6 Richards Blvd/Olive Dr Signal
Storage Average Queue (ft) Maximum Queue (ft) Exceeds
Direction Movement (ft) Average Std. Dev. Minimum Maximum Average Std. Dev. Minimum Maximum Storage?
U Turn
Second Left
Left Turn 100 252 44 189 306 573 10 566 592 AVG
Through 1,540 237 52 155 300 565 10 558 585 NO
Right Turn 100 0 0 0 0 25 10 17 45 NO
Second Right
U Turn
Second Left
Left Turn 590 21 3 17 25 465 166 141 739 NO
Through 590 100 18 81 139 711 52 605 748 MAX
Right Turn 250 7 4 2 16 288 52 183 326 MAX
Second Right
U Turn
Second Left
Left Turn 225 9 3 6 13 83 18 64 113 NO
Through 600 8 1 7 10 77 15 54 96 NO
Right Turn 225 9 1 8 11 78 15 56 97 NO
Second Right
U Turn
Second Left
Left Turn 200 396 303 23 975 1,019 400 415 1,639 AVG
Through 2,000 396 303 23 975 1,019 400 415 1,639 NO
Right Turn 2,000 396 303 23 975 1,019 400 415 1,639 NO
Second Right
NB
SB
EB
WB
Fehr & Peers 12/1/2016

Vissim Post-Processor Richards Blvd - Olive Dr Circulation
Average Results from 10 Runs No Build with Lincoln 40 - Cumulative Conditions
Queue Length AM Peak Hour
Intersection 7 Richards Blvd/I-80 WB Ramps Signal
Storage Average Queue (ft) Maximum Queue (ft) Exceeds
Direction Movement (ft) Average Std. Dev. Minimum Maximum Average Std. Dev. Minimum Maximum Storage?
U Turn
Second Left
Left Turn 800 80 4 73 84 309 12 296 340 NO
Through 800 88 29 34 123 347 15 323 362 NO
Right Turn
Second Right
U Turn
Second Left
Left Turn
Through 590 66 2 63 69 348 43 303 447 NO
Right Turn 200 1 1 0 2 114 43 68 212 NO
Second Right
U Turn
Second Left
Left Turn
Through
Right Turn
Second Right
U Turn
Second Left
Left Turn 400 42 4 38 48 250 44 199 314 NO
Through
Right Turn 1,200 172 102 63 398 777 325 307 1,253 NO
Second Right
NB
SB
EB
WB
Fehr & Peers 12/1/2016

Vissim Post-Processor Richards Blvd - Olive Dr Circulation
Average Results from 10 Runs No Build with Lincoln 40 - Cumulative Conditions
Queue Length AM Peak Hour
Intersection 8 Richards Blvd/I-80 EB Ramps Signal
Storage Average Queue (ft) Maximum Queue (ft) Exceeds
Direction Movement (ft) Average Std. Dev. Minimum Maximum Average Std. Dev. Minimum Maximum Storage?
U Turn
Second Left
Left Turn
Through 500 108 32 72 165 501 67 374 580 MAX
Right Turn 500 89 30 56 144 471 67 344 550 NO
Second Right
U Turn
Second Left
Left Turn 360 29 4 24 34 177 23 138 208 NO
Through 1,300 14 2 12 18 180 36 132 235 NO
Right Turn
Second Right
U Turn
Second Left
Left Turn
Through
Right Turn
Second Right
U Turn
Second Left
Left Turn 160 68 61 39 232 482 432 215 1,267 MAX
Through
Right Turn 1,260 84 74 10 229 747 517 99 1,283 NO
Second Right
SB
EB
WB
NB
Fehr & Peers 12/1/2016

Vissim Post-Processor Richards Blvd - Olive Dr Circulation
Average Results from 10 Runs No Build with Lincoln 40 - Cumulative Conditions
Queue Length AM Peak Hour
Intersection 9 Research Park Dr/Richards Blvd Signal
Storage Average Queue (ft) Maximum Queue (ft) Exceeds
Direction Movement (ft) Average Std. Dev. Minimum Maximum Average Std. Dev. Minimum Maximum Storage?
U Turn
Second Left
Left Turn 100 29 6 21 39 138 34 109 224 MAX
Through 620 1 1 0 3 57 21 28 89 NO
Right Turn
Second Right
U Turn
Second Left
Left Turn 120 6 1 5 7 61 10 45 73 NO
Through 3,940 16 8 8 36 205 112 117 426 NO
Right Turn
Second Right
U Turn 440 137 16 113 170 530 22 474 555 MAX
Second Left
Left Turn 440 137 16 113 170 530 22 474 555 MAX
Through 440 45 5 38 54 322 31 269 361 NO
Right Turn
Second Right
U Turn
Second Left
Left Turn 80 36 28 17 90 480 470 72 1,163 MAX
Through 180 441 131 255 584 1,143 14 1,128 1,163 AVG
Right Turn
Second Right
WB
NB
SB
EB
Fehr & Peers 12/1/2016
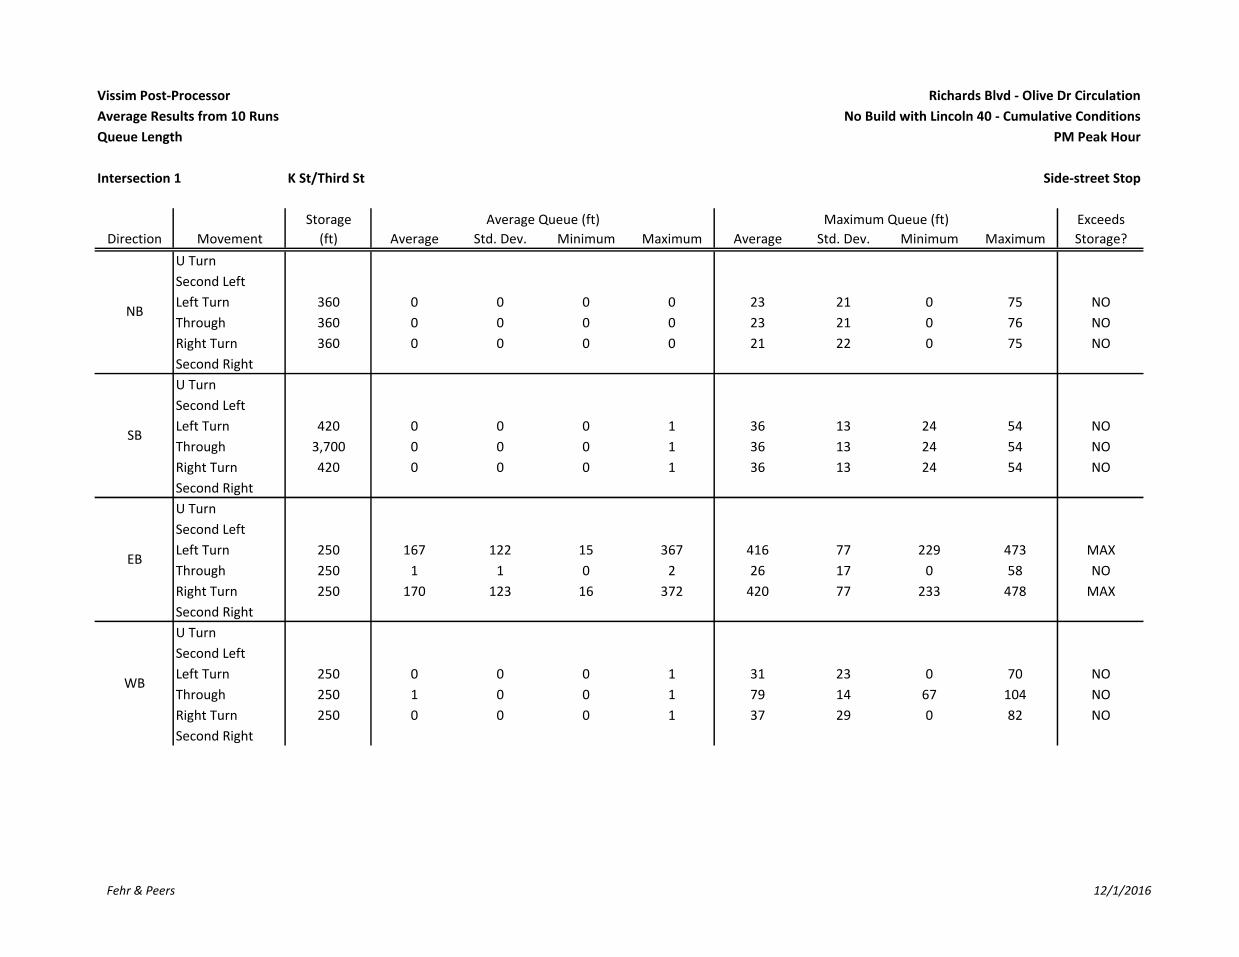
Vissim Post-Processor Richards Blvd - Olive Dr Circulation
Average Results from 10 Runs No Build with Lincoln 40 - Cumulative Conditions
Queue Length PM Peak Hour
Intersection 1 K St/Third St Side-street Stop
Storage Average Queue (ft) Maximum Queue (ft) Exceeds
Direction Movement (ft) Average Std. Dev. Minimum Maximum Average Std. Dev. Minimum Maximum Storage?
U Turn
Second Left
Left Turn 360 0 0 0 0 23 21 0 75 NO
Through 360 0 0 0 0 23 21 0 76 NO
Right Turn 360 0 0 0 0 21 22 0 75 NO
Second Right
U Turn
Second Left
Left Turn 420 0 0 0 1 36 13 24 54 NO
Through 3,700 0 0 0 1 36 13 24 54 NO
Right Turn 420 0 0 0 1 36 13 24 54 NO
Second Right
U Turn
Second Left
Left Turn 250 167 122 15 367 416 77 229 473 MAX
Through 250 1 1 0 2 26 17 0 58 NO
Right Turn 250 170 123 16 372 420 77 233 478 MAX
Second Right
U Turn
Second Left
Left Turn 250 0 0 0 1 31 23 0 70 NO
Through 250 1 0 0 1 79 14 67 104 NO
Right Turn 250 0 0 0 1 37 29 0 82 NO
Second Right
NB
SB
EB
WB
Fehr & Peers 12/1/2016
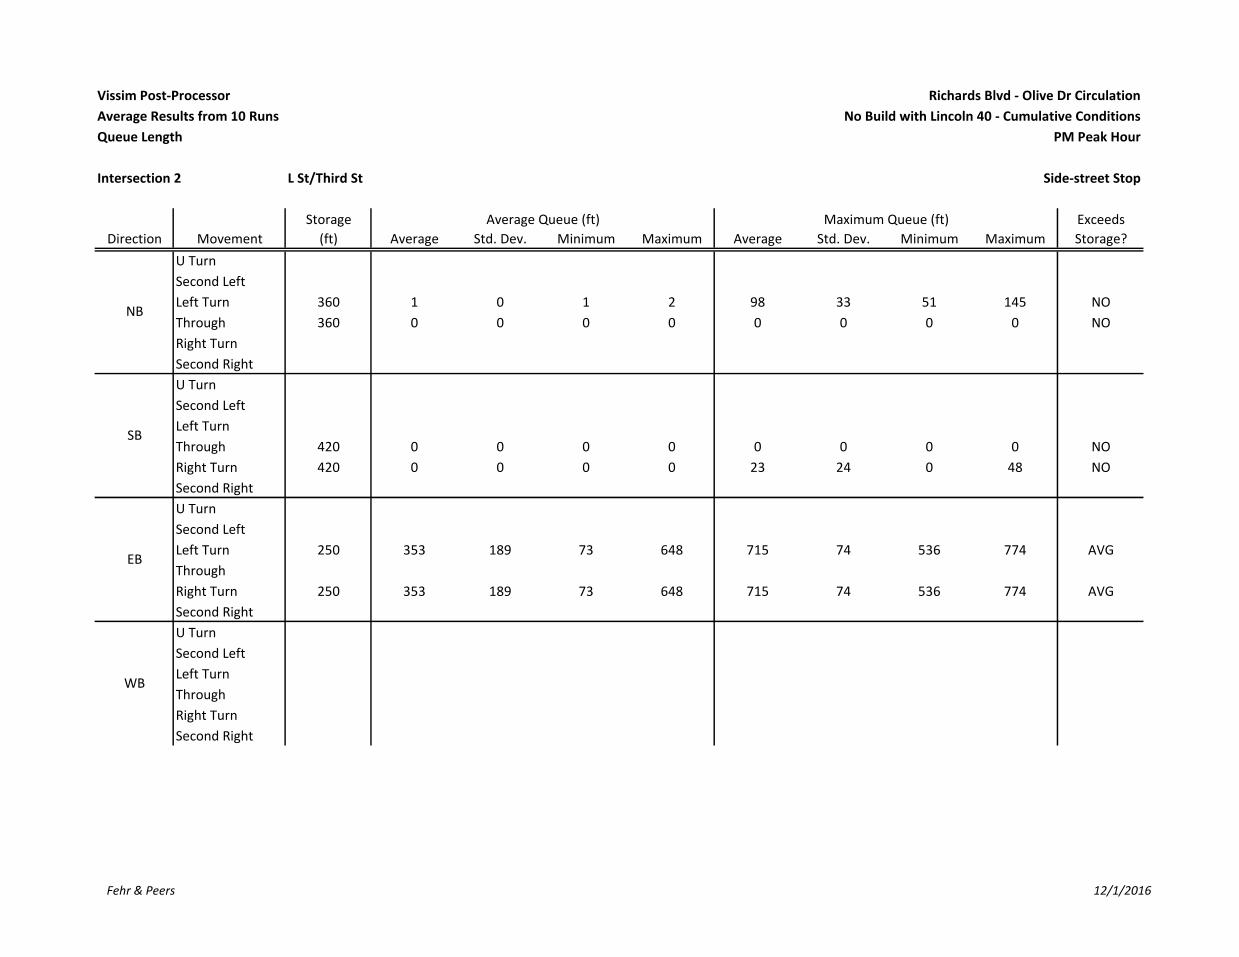
Vissim Post-Processor Richards Blvd - Olive Dr Circulation
Average Results from 10 Runs No Build with Lincoln 40 - Cumulative Conditions
Queue Length PM Peak Hour
Intersection 2 L St/Third St Side-street Stop
Storage Average Queue (ft) Maximum Queue (ft) Exceeds
Direction Movement (ft) Average Std. Dev. Minimum Maximum Average Std. Dev. Minimum Maximum Storage?
U Turn
Second Left
Left Turn 360 1 0 1 2 98 33 51 145 NO
Through 360 0 0 0 0 0 0 0 0 NO
Right Turn
Second Right
U Turn
Second Left
Left Turn
Through 420 0 0 0 0 0 0 0 0 NO
Right Turn 420 0 0 0 0 23 24 0 48 NO
Second Right
U Turn
Second Left
Left Turn 250 353 189 73 648 715 74 536 774 AVG
Through
Right Turn 250 353 189 73 648 715 74 536 774 AVG
Second Right
U Turn
Second Left
Left Turn
Through
Right Turn
Second Right
NB
SB
EB
WB
Fehr & Peers 12/1/2016
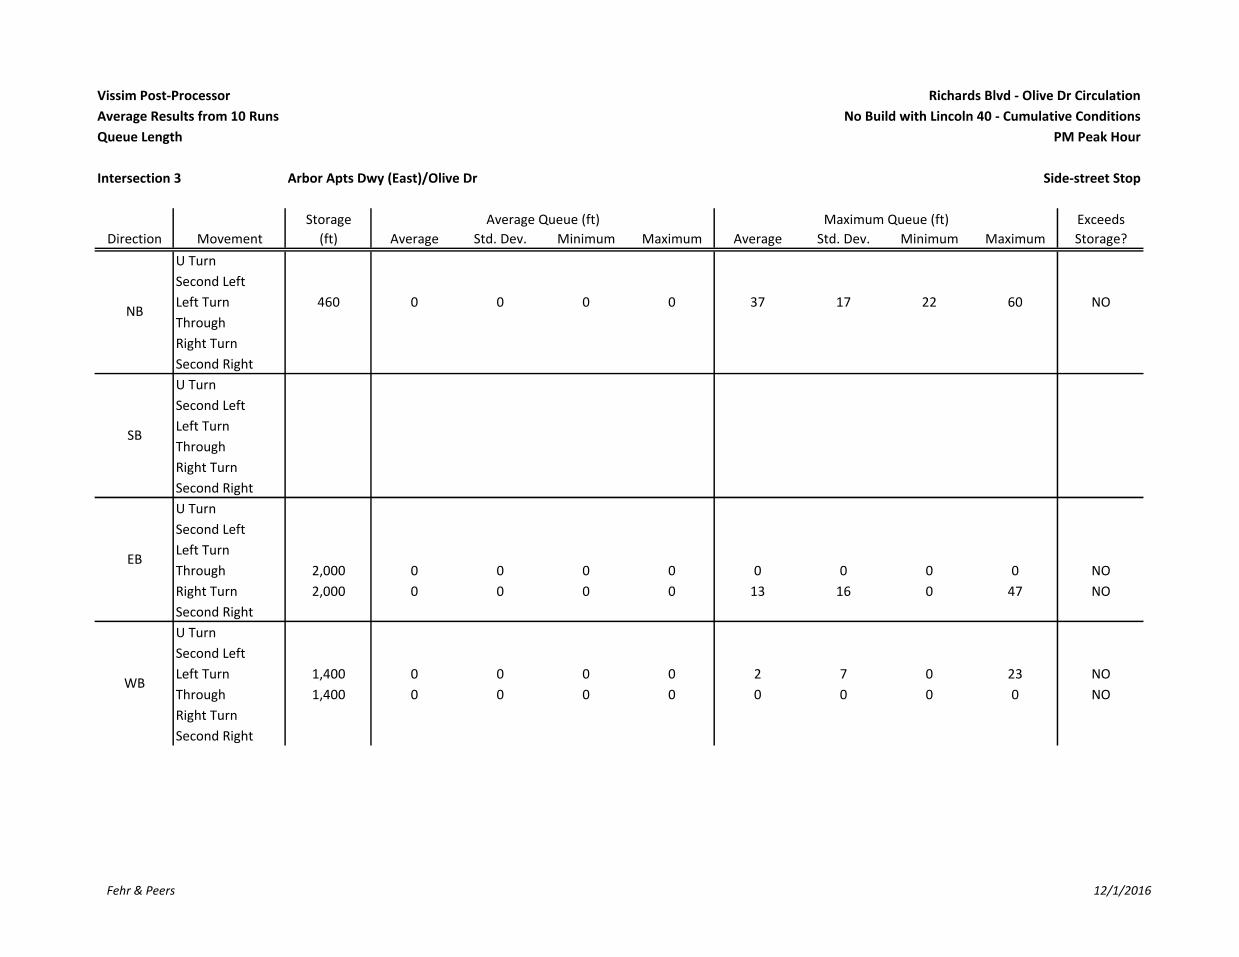
Vissim Post-Processor Richards Blvd - Olive Dr Circulation
Average Results from 10 Runs No Build with Lincoln 40 - Cumulative Conditions
Queue Length PM Peak Hour
Intersection 3 Arbor Apts Dwy (East)/Olive Dr Side-street Stop
Storage Average Queue (ft) Maximum Queue (ft) Exceeds
Direction Movement (ft) Average Std. Dev. Minimum Maximum Average Std. Dev. Minimum Maximum Storage?
U Turn
Second Left
Left Turn 460 0 0 0 0 37 17 22 60 NO
Through
Right Turn
Second Right
U Turn
Second Left
Left Turn
Through
Right Turn
Second Right
U Turn
Second Left
Left Turn
Through 2,000 0 0 0 0 0 0 0 0 NO
Right Turn 2,000 0 0 0 0 13 16 0 47 NO
Second Right
U Turn
Second Left
Left Turn 1,400 0 0 0 0 2 7 0 23 NO
Through 1,400 0 0 0 0 0 0 0 0 NO
Right Turn
Second Right
NB
SB
EB
WB
Fehr & Peers 12/1/2016

Vissim Post-Processor Richards Blvd - Olive Dr Circulation
Average Results from 10 Runs No Build with Lincoln 40 - Cumulative Conditions
Queue Length PM Peak Hour
Intersection 4 D St/First St Signal
Storage Average Queue (ft) Maximum Queue (ft) Exceeds
Direction Movement (ft) Average Std. Dev. Minimum Maximum Average Std. Dev. Minimum Maximum Storage?
U Turn
Second Left
Left Turn 100 10 2 8 13 112 26 73 156 MAX
Through 100 10 2 8 13 112 26 73 156 MAX
Right Turn 400 2 1 1 4 76 32 48 162 NO
Second Right
U Turn
Second Left
Left Turn 400 165 55 61 242 435 44 311 472 MAX
Through 400 165 55 61 242 435 44 311 472 MAX
Right Turn 400 54 32 10 125 419 62 297 476 MAX
Second Right
U Turn
Second Left
Left Turn 80 114 88 44 254 685 169 399 845 AVG
Through 560 114 88 44 254 685 169 399 845 MAX
Right Turn 560 114 88 44 254 685 169 399 845 MAX
Second Right
U Turn
Second Left
Left Turn 100 15 4 11 24 181 96 89 355 MAX
Through 240 30 8 20 47 329 37 251 356 MAX
Right Turn 24 31 8 21 47 331 37 253 357 AVG
Second Right
NB
SB
EB
WB
Fehr & Peers 12/1/2016
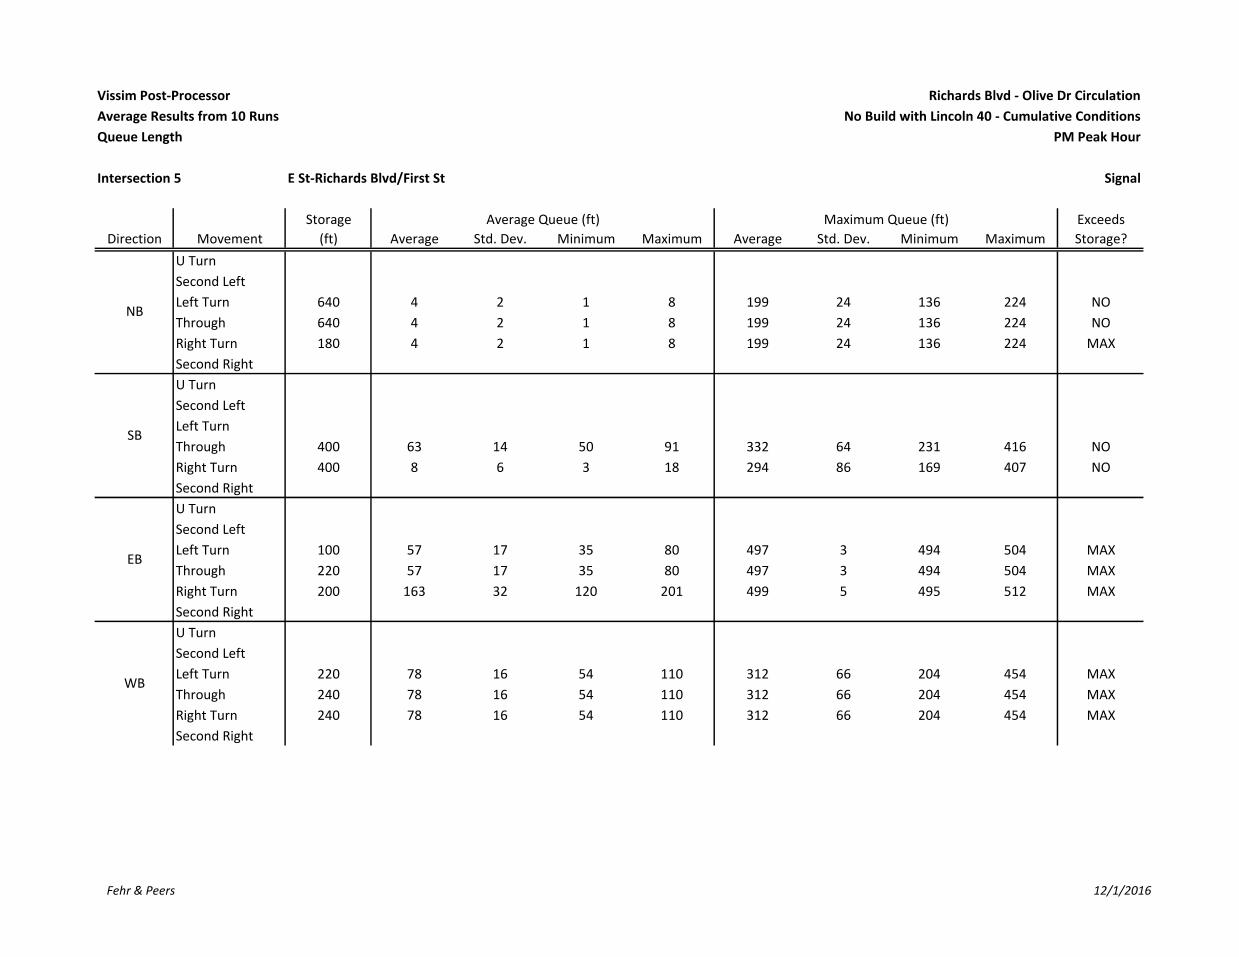
Vissim Post-Processor Richards Blvd - Olive Dr Circulation
Average Results from 10 Runs No Build with Lincoln 40 - Cumulative Conditions
Queue Length PM Peak Hour
Intersection 5 E St-Richards Blvd/First St Signal
Storage Average Queue (ft) Maximum Queue (ft) Exceeds
Direction Movement (ft) Average Std. Dev. Minimum Maximum Average Std. Dev. Minimum Maximum Storage?
U Turn
Second Left
Left Turn 640 4 2 1 8 199 24 136 224 NO
Through 640 4 2 1 8 199 24 136 224 NO
Right Turn 180 4 2 1 8 199 24 136 224 MAX
Second Right
U Turn
Second Left
Left Turn
Through 400 63 14 50 91 332 64 231 416 NO
Right Turn 400 8 6 3 18 294 86 169 407 NO
Second Right
U Turn
Second Left
Left Turn 100 57 17 35 80 497 3 494 504 MAX
Through 220 57 17 35 80 497 3 494 504 MAX
Right Turn 200 163 32 120 201 499 5 495 512 MAX
Second Right
U Turn
Second Left
Left Turn 220 78 16 54 110 312 66 204 454 MAX
Through 240 78 16 54 110 312 66 204 454 MAX
Right Turn 240 78 16 54 110 312 66 204 454 MAX
Second Right
NB
SB
EB
WB
Fehr & Peers 12/1/2016

Vissim Post-Processor Richards Blvd - Olive Dr Circulation
Average Results from 10 Runs No Build with Lincoln 40 - Cumulative Conditions
Queue Length PM Peak Hour
Intersection 6 Richards Blvd/Olive Dr Signal
Storage Average Queue (ft) Maximum Queue (ft) Exceeds
Direction Movement (ft) Average Std. Dev. Minimum Maximum Average Std. Dev. Minimum Maximum Storage?
U Turn
Second Left
Left Turn 100 68 10 54 85 437 71 316 530 MAX
Through 1,540 53 8 41 67 435 72 309 534 NO
Right Turn 100 0 0 0 1 44 12 23 61 NO
Second Right
U Turn
Second Left
Left Turn 590 88 33 41 148 709 64 541 754 MAX
Through 590 59 13 32 75 688 95 488 761 MAX
Right Turn 250 13 9 3 31 307 33 239 332 MAX
Second Right
U Turn
Second Left
Left Turn 225 3 1 2 5 53 12 38 73 NO
Through 600 28 3 23 33 160 30 115 203 NO
Right Turn 225 29 3 25 35 161 30 116 204 NO
Second Right
U Turn
Second Left
Left Turn 200 30 40 1 114 377 279 113 885 MAX
Through 2,000 30 40 1 114 377 279 113 885 NO
Right Turn 2,000 30 40 1 114 377 279 113 885 NO
Second Right
WB
NB
SB
EB
Fehr & Peers 12/1/2016

Vissim Post-Processor Richards Blvd - Olive Dr Circulation
Average Results from 10 Runs No Build with Lincoln 40 - Cumulative Conditions
Queue Length PM Peak Hour
Intersection 7 I-80 WB Ramps/Richards Blvd Signal
Storage Average Queue (ft) Maximum Queue (ft) Exceeds
Direction Movement (ft) Average Std. Dev. Minimum Maximum Average Std. Dev. Minimum Maximum Storage?
U Turn
Second Left
Left Turn 800 89 3 84 94 311 6 301 326 NO
Through 800 7 1 6 9 257 48 176 322 NO
Right Turn
Second Right
U Turn
Second Left
Left Turn
Through 590 86 8 76 104 503 34 455 546 NO
Right Turn 200 10 3 7 17 290 40 223 335 MAX
Second Right
U Turn
Second Left
Left Turn
Through
Right Turn
Second Right
U Turn
Second Left
Left Turn 400 20 3 18 24 132 25 92 185 NO
Through
Right Turn
Second Right
NB
SB
EB
WB
Fehr & Peers 12/1/2016
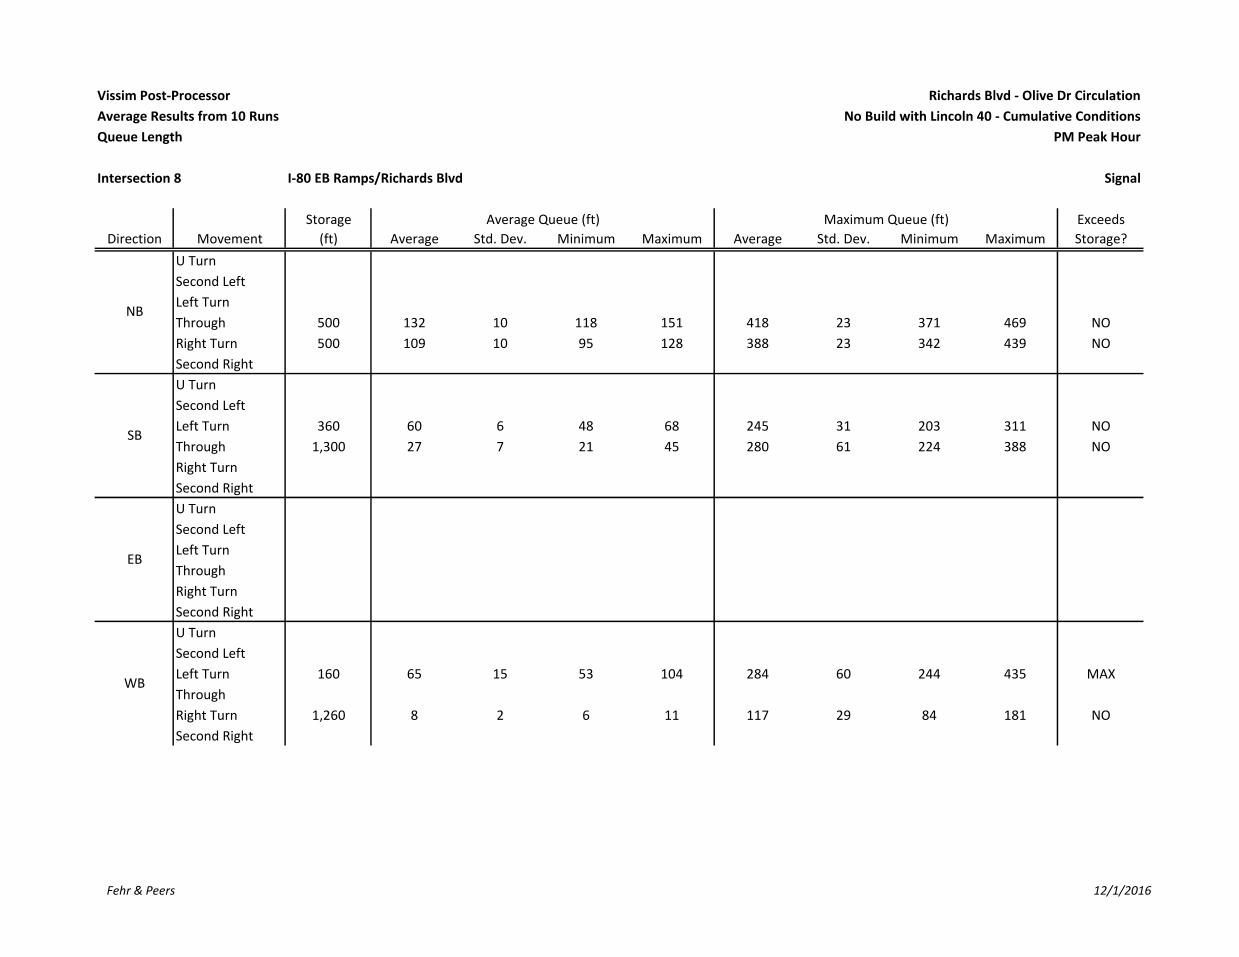
Vissim Post-Processor Richards Blvd - Olive Dr Circulation
Average Results from 10 Runs No Build with Lincoln 40 - Cumulative Conditions
Queue Length PM Peak Hour
Intersection 8 I-80 EB Ramps/Richards Blvd Signal
Storage Average Queue (ft) Maximum Queue (ft) Exceeds
Direction Movement (ft) Average Std. Dev. Minimum Maximum Average Std. Dev. Minimum Maximum Storage?
U Turn
Second Left
Left Turn
Through 500 132 10 118 151 418 23 371 469 NO
Right Turn 500 109 10 95 128 388 23 342 439 NO
Second Right
U Turn
Second Left
Left Turn 360 60 6 48 68 245 31 203 311 NO
Through 1,300 27 7 21 45 280 61 224 388 NO
Right Turn
Second Right
U Turn
Second Left
Left Turn
Through
Right Turn
Second Right
U Turn
Second Left
Left Turn 160 65 15 53 104 284 60 244 435 MAX
Through
Right Turn 1,260 8 2 6 11 117 29 84 181 NO
Second Right
NB
SB
EB
WB
Fehr & Peers 12/1/2016

Vissim Post-Processor Richards Blvd - Olive Dr Circulation
Average Results from 10 Runs No Build with Lincoln 40 - Cumulative Conditions
Queue Length PM Peak Hour
Intersection 9 Research Park Dr/Richards Blvd Signal
Storage Average Queue (ft) Maximum Queue (ft) Exceeds
Direction Movement (ft) Average Std. Dev. Minimum Maximum Average Std. Dev. Minimum Maximum Storage?
U Turn
Second Left
Left Turn 100 31 3 26 36 137 48 93 249 MAX
Through 620 5 1 3 7 94 18 63 119 NO
Right Turn
Second Right
U Turn
Second Left
Left Turn 120 14 9 7 38 156 181 48 635 MAX
Through 3,940 194 89 100 385 617 41 506 650 NO
Right Turn
Second Right
U Turn 440 186 46 141 286 556 6 548 570 MAX
Second Left
Left Turn 440 186 46 141 286 556 6 548 570 MAX
Through 440 102 9 88 120 554 8 537 559 MAX
Right Turn
Second Right
U Turn
Second Left
Left Turn 80 11 3 7 17 164 186 46 667 MAX
Through 180 202 77 107 350 898 219 591 1,135 AVG
Right Turn
Second Right
EB
WB
NB
SB
Fehr & Peers 12/1/2016

Vissim Post-Processor Richards Blvd - Olive Dr Circulation
Average Results from 10 Runs L St Extension with Lincoln 40 - Cumulative Conditions
Queue Length AM Peak Hour
Intersection 1 K St/Third St Signal
Storage Average Queue (ft) Maximum Queue (ft) Exceeds
Direction Movement (ft) Average Std. Dev. Minimum Maximum Average Std. Dev. Minimum Maximum Storage?
U Turn
Second Left
Left Turn 420 33 4 24 39 245 63 134 365 NO
Through 420 33 4 24 39 245 63 134 365 NO
Right Turn 150 34 4 25 40 246 63 135 367 MAX
Second Right
U Turn
Second Left
Left Turn 420 4 1 3 6 73 17 48 113 NO
Through 3,700 4 1 3 6 73 17 48 113 NO
Right Turn 420 4 1 3 6 75 17 50 115 NO
Second Right
U Turn
Second Left
Left Turn 100 1 1 0 2 84 31 36 127 NO
Through 250 1 1 0 2 84 31 36 127 NO
Right Turn 250 1 1 0 2 84 31 36 127 NO
Second Right
U Turn
Second Left
Left Turn 100 1 1 0 4 133 59 48 187 MAX
Through 250 1 1 0 4 133 59 48 187 NO
Right Turn 250 1 1 0 4 133 59 48 187 NO
Second Right
NB
SB
EB
WB
Fehr & Peers 12/3/2016

Vissim Post-Processor Richards Blvd - Olive Dr Circulation
Average Results from 10 Runs L St Extension with Lincoln 40 - Cumulative Conditions
Queue Length AM Peak Hour
Intersection 2 L St/Third St Signal
Storage Average Queue (ft) Maximum Queue (ft) Exceeds
Direction Movement (ft) Average Std. Dev. Minimum Maximum Average Std. Dev. Minimum Maximum Storage?
U Turn
Second Left
Left Turn 150 98 20 70 128 506 5 501 519 MAX
Through 490 98 20 70 128 506 5 501 519 MAX
Right Turn
Second Right
U Turn
Second Left
Left Turn
Through 420 36 13 17 58 374 78 240 444 NO
Right Turn 420 41 55 6 195 311 64 138 342 NO
Second Right
U Turn
Second Left
Left Turn 125 24 2 22 28 230 48 161 300 MAX
Through
Right Turn 250 25 2 23 29 230 48 162 301 NO
Second Right
U Turn
Second Left
Left Turn
Through
Right Turn
Second Right
NB
SB
EB
WB
Fehr & Peers 12/3/2016

Vissim Post-Processor Richards Blvd - Olive Dr Circulation
Average Results from 10 Runs L St Extension with Lincoln 40 - Cumulative Conditions
Queue Length AM Peak Hour
Intersection 3 L St/Olive Dr Signal
Storage Average Queue (ft) Maximum Queue (ft) Exceeds
Direction Movement (ft) Average Std. Dev. Minimum Maximum Average Std. Dev. Minimum Maximum Storage?
U Turn
Second Left
Left Turn
Through
Right Turn
Second Right
U Turn
Second Left
Left Turn
Through
Right Turn 375 71 20 37 103 406 92 273 528 MAX
Second Right
U Turn
Second Left
Left Turn 750 38 5 30 44 231 33 180 275 NO
Through
Right Turn
Second Right
U Turn
Second Left
Left Turn
Through 1,400 866 292 227 1,220 1,648 89 1,400 1,695 MAX
Right Turn 1,400 870 291 231 1,223 1,649 86 1,407 1,695 MAX
Second Right
NB
SB
EB
WB
Fehr & Peers 12/3/2016

Vissim Post-Processor Richards Blvd - Olive Dr Circulation
Average Results from 10 Runs L St Extension with Lincoln 40 - Cumulative Conditions
Queue Length AM Peak Hour
Intersection 4 D St/First St Signal
Storage Average Queue (ft) Maximum Queue (ft) Exceeds
Direction Movement (ft) Average Std. Dev. Minimum Maximum Average Std. Dev. Minimum Maximum Storage?
U Turn
Second Left
Left Turn 100 5 1 4 7 63 22 43 113 NO
Through 100 5 1 4 7 63 22 43 113 NO
Right Turn 400 1 1 0 3 52 9 44 74 NO
Second Right
U Turn
Second Left
Left Turn 400 50 34 22 118 257 112 145 443 NO
Through 400 50 34 22 118 257 112 145 443 NO
Right Turn 400 3 7 0 22 94 78 24 285 NO
Second Right
U Turn
Second Left
Left Turn 80 12 19 1 65 342 191 119 786 MAX
Through 560 12 19 1 65 342 191 119 786 NO
Right Turn 560 12 19 1 65 342 191 119 786 NO
Second Right
U Turn
Second Left
Left Turn 100 12 2 9 16 95 25 66 145 NO
Through 240 30 10 18 50 362 3 356 365 MAX
Right Turn 24 30 10 18 50 364 3 357 367 AVG
Second Right
NB
SB
EB
WB
Fehr & Peers 12/3/2016

Vissim Post-Processor Richards Blvd - Olive Dr Circulation
Average Results from 10 Runs L St Extension with Lincoln 40 - Cumulative Conditions
Queue Length AM Peak Hour
Intersection 5 E St-Richards Blvd/First St Signal
Storage Average Queue (ft) Maximum Queue (ft) Exceeds
Direction Movement (ft) Average Std. Dev. Minimum Maximum Average Std. Dev. Minimum Maximum Storage?
U Turn
Second Left
Left Turn 640 11 8 5 32 198 29 125 240 NO
Through 640 11 8 5 32 198 29 125 240 NO
Right Turn 180 11 8 5 32 198 29 125 240 MAX
Second Right
U Turn
Second Left
Left Turn
Through 400 46 10 37 71 281 59 217 416 NO
Right Turn 400 7 9 1 33 231 95 112 420 NO
Second Right
U Turn
Second Left
Left Turn 100 90 20 60 123 515 10 489 526 MAX
Through 220 90 20 60 123 515 10 489 526 MAX
Right Turn 200 50 14 31 71 482 23 419 497 MAX
Second Right
U Turn
Second Left
Left Turn 220 31 3 26 35 164 26 125 210 NO
Through 240 31 3 26 35 164 26 125 210 NO
Right Turn 240 31 3 26 35 164 26 125 210 NO
Second Right
NB
SB
EB
WB
Fehr & Peers 12/3/2016
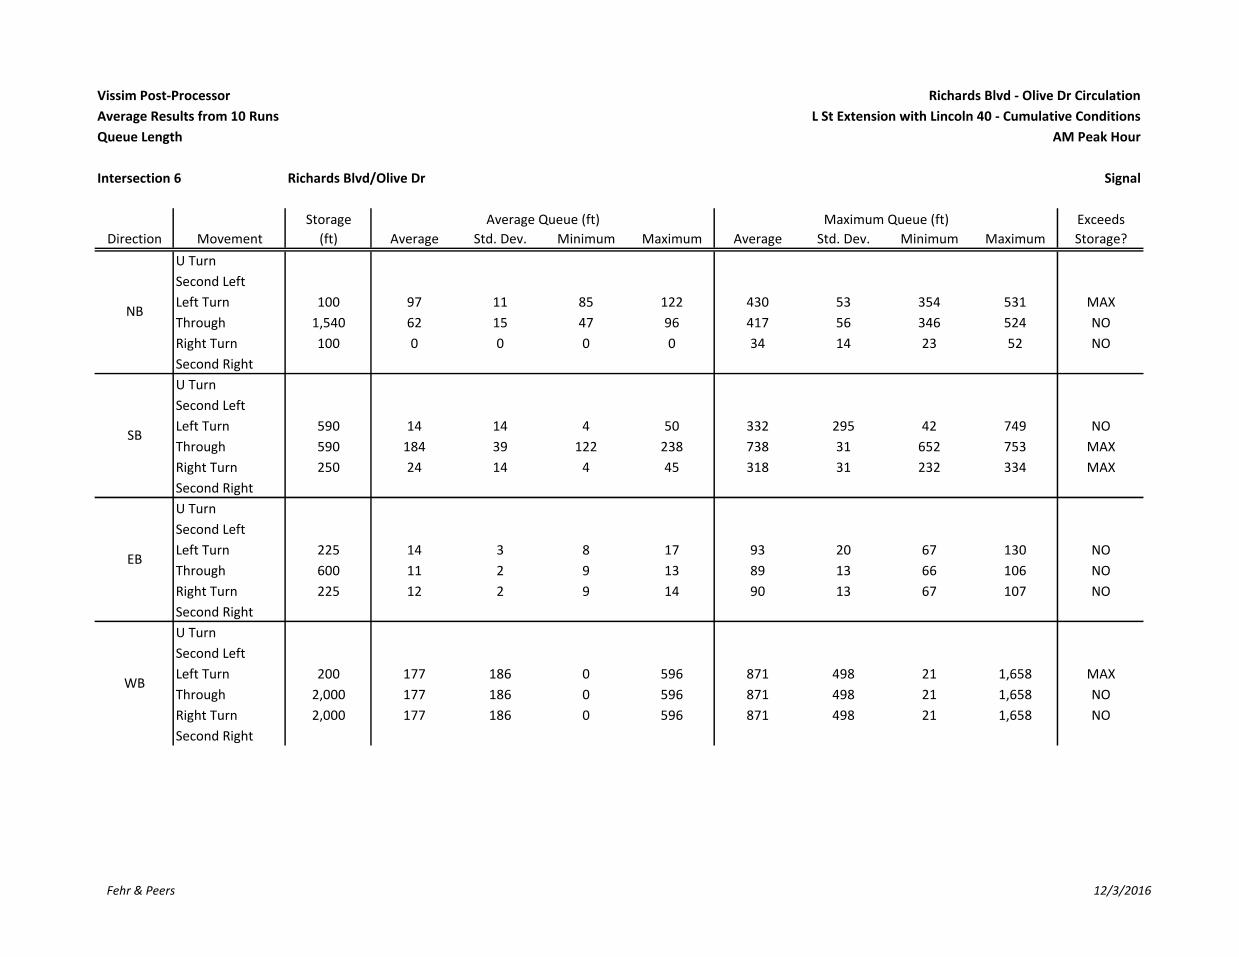
Vissim Post-Processor Richards Blvd - Olive Dr Circulation
Average Results from 10 Runs L St Extension with Lincoln 40 - Cumulative Conditions
Queue Length AM Peak Hour
Intersection 6 Richards Blvd/Olive Dr Signal
Storage Average Queue (ft) Maximum Queue (ft) Exceeds
Direction Movement (ft) Average Std. Dev. Minimum Maximum Average Std. Dev. Minimum Maximum Storage?
U Turn
Second Left
Left Turn 100 97 11 85 122 430 53 354 531 MAX
Through 1,540 62 15 47 96 417 56 346 524 NO
Right Turn 100 0 0 0 0 34 14 23 52 NO
Second Right
U Turn
Second Left
Left Turn 590 14 14 4 50 332 295 42 749 NO
Through 590 184 39 122 238 738 31 652 753 MAX
Right Turn 250 24 14 4 45 318 31 232 334 MAX
Second Right
U Turn
Second Left
Left Turn 225 14 3 8 17 93 20 67 130 NO
Through 600 11 2 9 13 89 13 66 106 NO
Right Turn 225 12 2 9 14 90 13 67 107 NO
Second Right
U Turn
Second Left
Left Turn 200 177 186 0 596 871 498 21 1,658 MAX
Through 2,000 177 186 0 596 871 498 21 1,658 NO
Right Turn 2,000 177 186 0 596 871 498 21 1,658 NO
Second Right
WB
NB
SB
EB
Fehr & Peers 12/3/2016

Vissim Post-Processor Richards Blvd - Olive Dr Circulation
Average Results from 10 Runs L St Extension with Lincoln 40 - Cumulative Conditions
Queue Length AM Peak Hour
Intersection 7 Richards Blvd/I-80 WB Ramps Signal
Storage Average Queue (ft) Maximum Queue (ft) Exceeds
Direction Movement (ft) Average Std. Dev. Minimum Maximum Average Std. Dev. Minimum Maximum Storage?
U Turn
Second Left
Left Turn 800 69 6 61 78 316 39 276 393 NO
Through 800 14 3 10 18 358 80 250 480 NO
Right Turn
Second Right
U Turn
Second Left
Left Turn
Through 590 31 3 26 37 349 81 246 459 NO
Right Turn 200 3 1 2 6 174 33 131 224 NO
Second Right
U Turn
Second Left
Left Turn
Through
Right Turn
Second Right
U Turn
Second Left
Left Turn 400 36 3 30 40 217 25 176 250 NO
Through
Right Turn 1,200 25 3 21 31 163 32 124 212 NO
Second Right
NB
SB
EB
WB
Fehr & Peers 12/3/2016

Vissim Post-Processor Richards Blvd - Olive Dr Circulation
Average Results from 10 Runs L St Extension with Lincoln 40 - Cumulative Conditions
Queue Length AM Peak Hour
Intersection 8 Richards Blvd/I-80 EB Ramps Signal
Storage Average Queue (ft) Maximum Queue (ft) Exceeds
Direction Movement (ft) Average Std. Dev. Minimum Maximum Average Std. Dev. Minimum Maximum Storage?
U Turn
Second Left
Left Turn
Through 500 78 5 69 84 435 41 369 490 NO
Right Turn 500 62 5 53 67 406 41 340 460 NO
Second Right
U Turn
Second Left
Left Turn 360 34 3 30 41 178 12 157 196 NO
Through 1,300 18 7 10 30 199 59 139 332 NO
Right Turn
Second Right
U Turn
Second Left
Left Turn
Through
Right Turn
Second Right
U Turn
Second Left
Left Turn 160 123 100 53 368 588 404 223 1,266 MAX
Through
Right Turn 1,260 20 19 9 71 384 378 118 1,281 NO
Second Right
NB
SB
EB
WB
Fehr & Peers 12/3/2016

Vissim Post-Processor Richards Blvd - Olive Dr Circulation
Average Results from 10 Runs L St Extension with Lincoln 40 - Cumulative Conditions
Queue Length AM Peak Hour
Intersection 9 Research Park Dr/Richards Blvd Signal
Storage Average Queue (ft) Maximum Queue (ft) Exceeds
Direction Movement (ft) Average Std. Dev. Minimum Maximum Average Std. Dev. Minimum Maximum Storage?
U Turn
Second Left
Left Turn 100 29 4 24 35 132 33 91 205 MAX
Through 620 2 1 0 3 67 18 47 94 NO
Right Turn
Second Right
U Turn
Second Left
Left Turn 120 10 1 9 12 87 14 65 113 NO
Through 3,940 14 5 6 24 203 58 111 311 NO
Right Turn
Second Right
U Turn 440 282 65 190 365 565 15 551 594 MAX
Second Left
Left Turn 440 282 65 190 365 565 15 551 594 MAX
Through 440 52 12 43 84 428 114 311 577 NO
Right Turn
Second Right
U Turn
Second Left
Left Turn 80 121 71 41 311 1,037 186 587 1,163 AVG
Through 180 281 82 147 385 1,091 101 878 1,163 AVG
Right Turn
Second Right
EB
WB
NB
SB
Fehr & Peers 12/3/2016
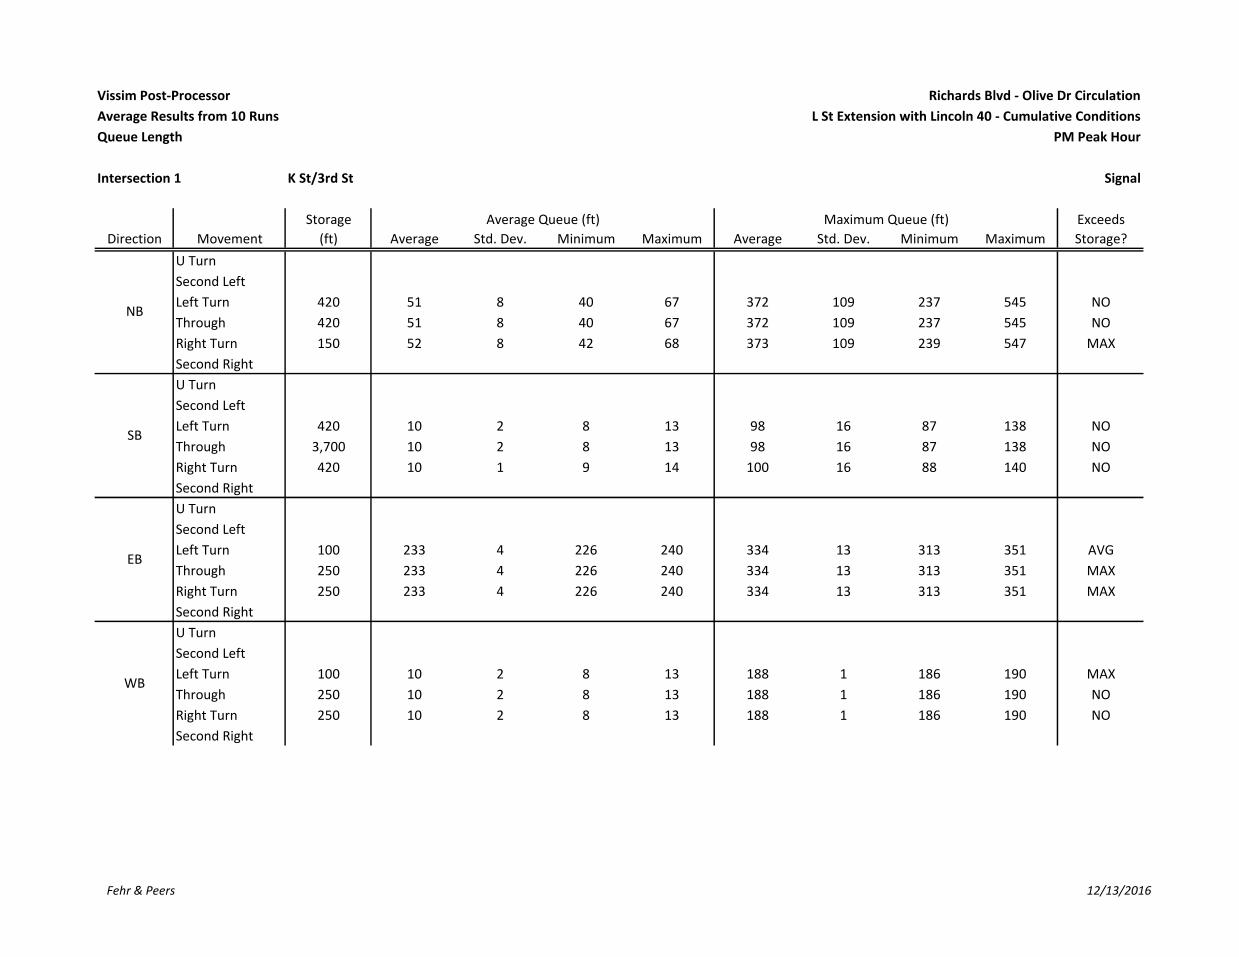
Vissim Post-Processor Richards Blvd - Olive Dr Circulation
Average Results from 10 Runs L St Extension with Lincoln 40 - Cumulative Conditions
Queue Length PM Peak Hour
Intersection 1 K St/3rd St Signal
Storage Average Queue (ft) Maximum Queue (ft) Exceeds
Direction Movement (ft) Average Std. Dev. Minimum Maximum Average Std. Dev. Minimum Maximum Storage?
U Turn
Second Left
Left Turn 420 51 8 40 67 372 109 237 545 NO
Through 420 51 8 40 67 372 109 237 545 NO
Right Turn 150 52 8 42 68 373 109 239 547 MAX
Second Right
U Turn
Second Left
Left Turn 420 10 2 8 13 98 16 87 138 NO
Through 3,700 10 2 8 13 98 16 87 138 NO
Right Turn 420 10 1 9 14 100 16 88 140 NO
Second Right
U Turn
Second Left
Left Turn 100 233 4 226 240 334 13 313 351 AVG
Through 250 233 4 226 240 334 13 313 351 MAX
Right Turn 250 233 4 226 240 334 13 313 351 MAX
Second Right
U Turn
Second Left
Left Turn 100 10 2 8 13 188 1 186 190 MAX
Through 250 10 2 8 13 188 1 186 190 NO
Right Turn 250 10 2 8 13 188 1 186 190 NO
Second Right
NB
SB
EB
WB
Fehr & Peers 12/13/2016

Vissim Post-Processor Richards Blvd - Olive Dr Circulation
Average Results from 10 Runs L St Extension with Lincoln 40 - Cumulative Conditions
Queue Length PM Peak Hour
Intersection 2 L St/3rd St Signal
Storage Average Queue (ft) Maximum Queue (ft) Exceeds
Direction Movement (ft) Average Std. Dev. Minimum Maximum Average Std. Dev. Minimum Maximum Storage?
U Turn
Second Left
Left Turn 150 130 17 105 158 509 6 504 520 MAX
Through 490 130 17 105 158 509 6 504 520 MAX
Right Turn
Second Right
U Turn
Second Left
Left Turn
Through 420 146 21 115 175 448 9 442 471 MAX
Right Turn 420 225 5 218 232 349 9 342 369 NO
Second Right
U Turn
Second Left
Left Turn 125 44 6 35 56 329 11 301 337 MAX
Through
Right Turn 250 44 6 36 57 330 11 302 338 MAX
Second Right
U Turn
Second Left
Left Turn
Through
Right Turn
Second Right
NB
SB
EB
WB
Fehr & Peers 12/13/2016

Vissim Post-Processor Richards Blvd - Olive Dr Circulation
Average Results from 10 Runs L St Extension with Lincoln 40 - Cumulative Conditions
Queue Length PM Peak Hour
Intersection 3 L St/Olive Dr Signal
Storage Average Queue (ft) Maximum Queue (ft) Exceeds
Direction Movement (ft) Average Std. Dev. Minimum Maximum Average Std. Dev. Minimum Maximum Storage?
U Turn
Second Left
Left Turn
Through
Right Turn
Second Right
U Turn
Second Left
Left Turn
Through
Right Turn 375 59 20 37 99 397 115 253 542 MAX
Second Right
U Turn
Second Left
Left Turn 750 298 149 143 603 845 368 480 1,656 MAX
Through
Right Turn
Second Right
U Turn
Second Left
Left Turn
Through 1,400 475 309 128 910 1,310 423 692 1,695 NO
Right Turn 1,400 480 309 133 913 1,313 419 700 1,695 NO
Second Right
SB
EB
WB
NB
Fehr & Peers 12/13/2016

Vissim Post-Processor Richards Blvd - Olive Dr Circulation
Average Results from 10 Runs L St Extension with Lincoln 40 - Cumulative Conditions
Queue Length PM Peak Hour
Intersection 4 D St/1st St Signal
Storage Average Queue (ft) Maximum Queue (ft) Exceeds
Direction Movement (ft) Average Std. Dev. Minimum Maximum Average Std. Dev. Minimum Maximum Storage?
U Turn
Second Left
Left Turn 100 16 2 13 20 183 75 111 310 MAX
Through 100 16 2 13 20 183 75 111 310 MAX
Right Turn 400 5 2 3 9 91 31 68 155 NO
Second Right
U Turn
Second Left
Left Turn 400 374 26 323 402 451 14 443 482 MAX
Through 400 374 26 323 402 451 14 443 482 MAX
Right Turn 400 54 49 0 147 369 165 23 448 NO
Second Right
U Turn
Second Left
Left Turn 80 216 100 84 342 811 21 786 839 AVG
Through 560 216 100 84 342 811 21 786 839 MAX
Right Turn 560 216 100 84 342 811 21 786 839 MAX
Second Right
U Turn
Second Left
Left Turn 100 44 18 28 86 200 96 90 365 MAX
Through 240 33 9 20 47 303 81 149 354 MAX
Right Turn 24 34 9 21 48 305 81 151 356 AVG
Second Right
NB
SB
EB
WB
Fehr & Peers 12/13/2016

Vissim Post-Processor Richards Blvd - Olive Dr Circulation
Average Results from 10 Runs L St Extension with Lincoln 40 - Cumulative Conditions
Queue Length PM Peak Hour
Intersection 5 E St-Richards Blvd/1st St Signal
Storage Average Queue (ft) Maximum Queue (ft) Exceeds
Direction Movement (ft) Average Std. Dev. Minimum Maximum Average Std. Dev. Minimum Maximum Storage?
U Turn
Second Left
Left Turn 640 8 5 2 16 210 16 197 249 NO
Through 640 8 5 2 16 210 16 197 249 NO
Right Turn 180 8 5 2 16 210 16 197 249 MAX
Second Right
U Turn
Second Left
Left Turn
Through 400 37 3 32 43 222 29 182 270 NO
Right Turn 400 3 2 1 6 160 40 98 206 NO
Second Right
U Turn
Second Left
Left Turn 100 182 11 170 208 534 13 524 554 AVG
Through 220 182 11 170 208 534 13 524 554 MAX
Right Turn 200 155 25 119 196 506 13 495 526 MAX
Second Right
U Turn
Second Left
Left Turn 220 38 4 32 46 227 51 159 328 MAX
Through 240 38 4 32 46 227 51 159 328 NO
Right Turn 240 38 4 32 46 227 51 159 328 NO
Second Right
NB
SB
EB
WB
Fehr & Peers 12/13/2016
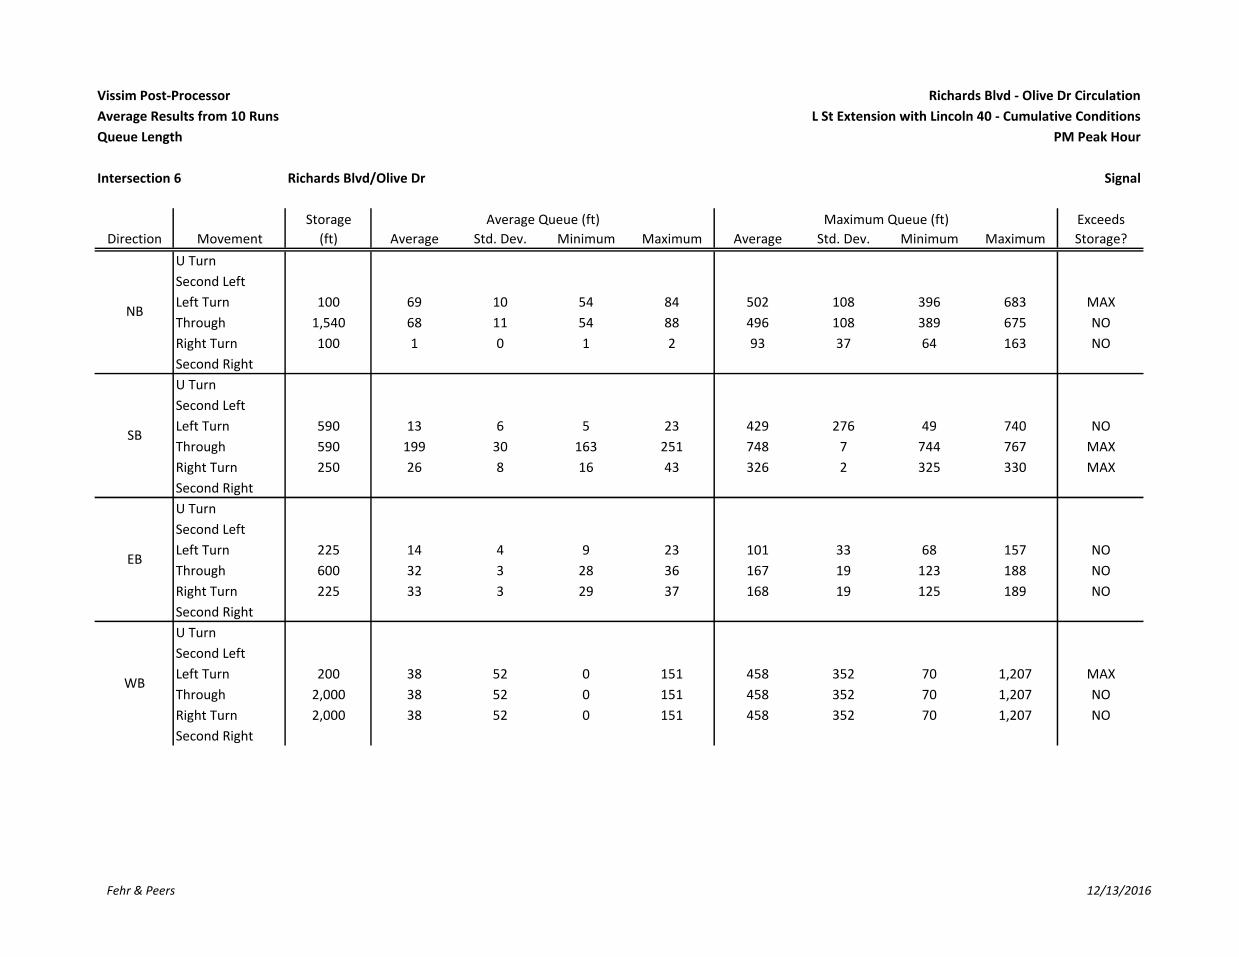
Vissim Post-Processor Richards Blvd - Olive Dr Circulation
Average Results from 10 Runs L St Extension with Lincoln 40 - Cumulative Conditions
Queue Length PM Peak Hour
Intersection 6 Richards Blvd/Olive Dr Signal
Storage Average Queue (ft) Maximum Queue (ft) Exceeds
Direction Movement (ft) Average Std. Dev. Minimum Maximum Average Std. Dev. Minimum Maximum Storage?
U Turn
Second Left
Left Turn 100 69 10 54 84 502 108 396 683 MAX
Through 1,540 68 11 54 88 496 108 389 675 NO
Right Turn 100 1 0 1 2 93 37 64 163 NO
Second Right
U Turn
Second Left
Left Turn 590 13 6 5 23 429 276 49 740 NO
Through 590 199 30 163 251 748 7 744 767 MAX
Right Turn 250 26 8 16 43 326 2 325 330 MAX
Second Right
U Turn
Second Left
Left Turn 225 14 4 9 23 101 33 68 157 NO
Through 600 32 3 28 36 167 19 123 188 NO
Right Turn 225 33 3 29 37 168 19 125 189 NO
Second Right
U Turn
Second Left
Left Turn 200 38 52 0 151 458 352 70 1,207 MAX
Through 2,000 38 52 0 151 458 352 70 1,207 NO
Right Turn 2,000 38 52 0 151 458 352 70 1,207 NO
Second Right
NB
SB
EB
WB
Fehr & Peers 12/13/2016
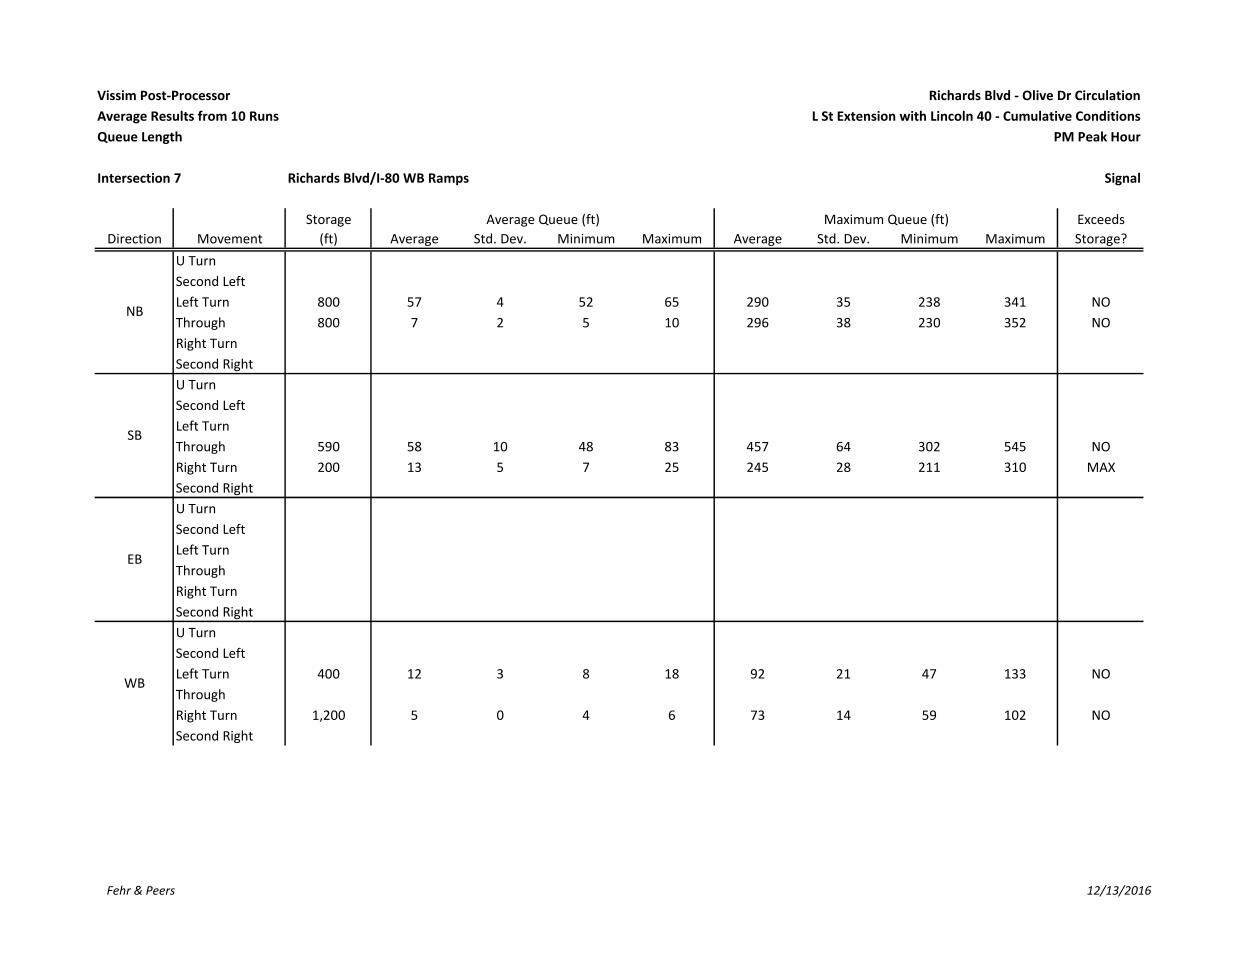
Vissim Post-Processor Richards Blvd - Olive Dr Circulation
Average Results from 10 Runs L St Extension with Lincoln 40 - Cumulative Conditions
Queue Length PM Peak Hour
Intersection 7 Richards Blvd/I-80 WB Ramps Signal
Storage Average Queue (ft) Maximum Queue (ft) Exceeds
Direction Movement (ft) Average Std. Dev. Minimum Maximum Average Std. Dev. Minimum Maximum Storage?
U Turn
Second Left
Left Turn 800 57 4 52 65 290 35 238 341 NO
Through 800 7 2 5 10 296 38 230 352 NO
Right Turn
Second Right
U Turn
Second Left
Left Turn
Through 590 58 10 48 83 457 64 302 545 NO
Right Turn 200 13 5 7 25 245 28 211 310 MAX
Second Right
U Turn
Second Left
Left Turn
Through
Right Turn
Second Right
U Turn
Second Left
Left Turn 400 12 3 8 18 92 21 47 133 NO
Through
Right Turn 1,200 5 0 4 6 73 14 59 102 NO
Second Right
NB
SB
EB
WB
Fehr & Peers 12/13/2016
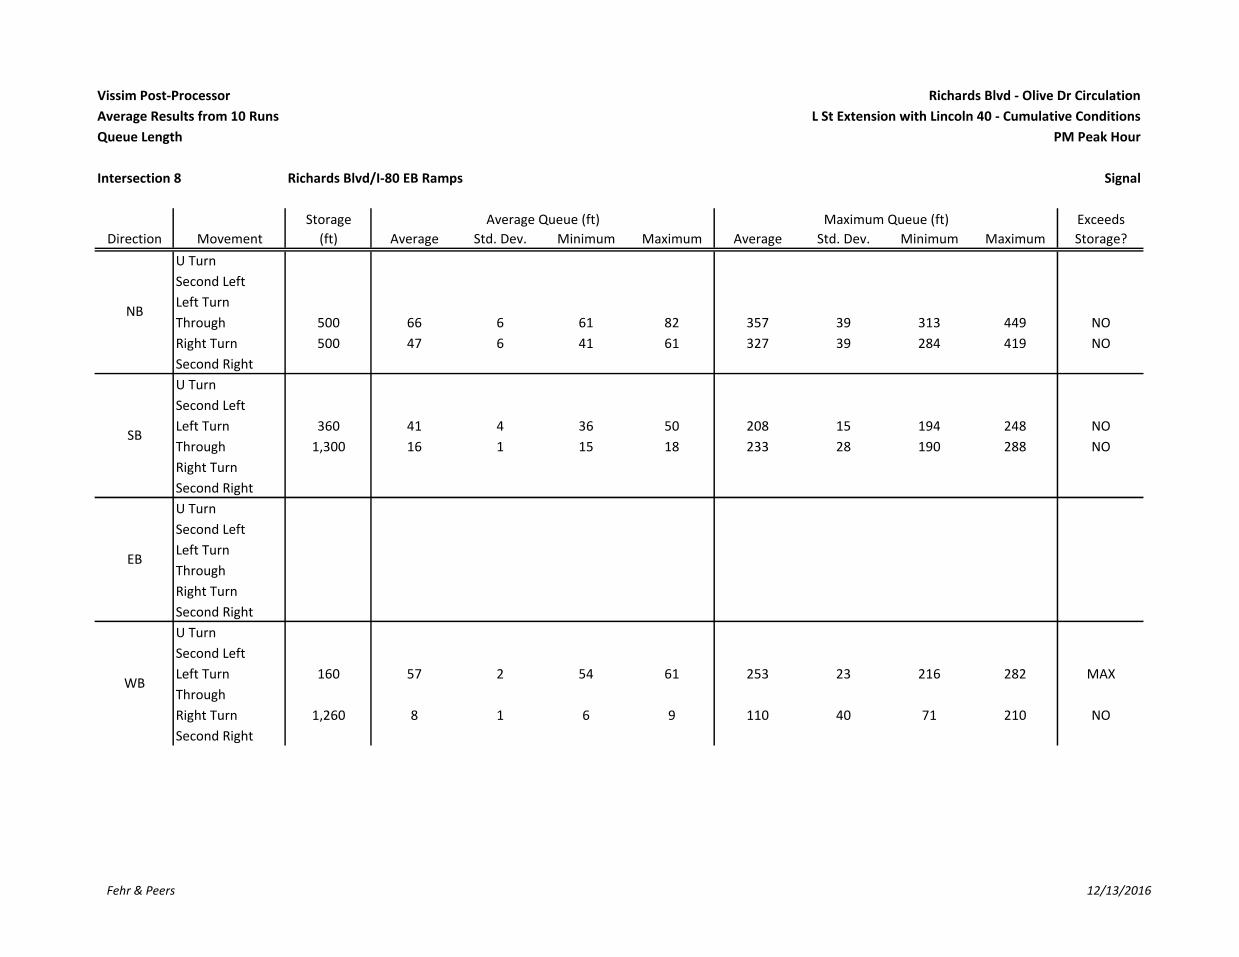
Vissim Post-Processor Richards Blvd - Olive Dr Circulation
Average Results from 10 Runs L St Extension with Lincoln 40 - Cumulative Conditions
Queue Length PM Peak Hour
Intersection 8 Richards Blvd/I-80 EB Ramps Signal
Storage Average Queue (ft) Maximum Queue (ft) Exceeds
Direction Movement (ft) Average Std. Dev. Minimum Maximum Average Std. Dev. Minimum Maximum Storage?
U Turn
Second Left
Left Turn
Through 500 66 6 61 82 357 39 313 449 NO
Right Turn 500 47 6 41 61 327 39 284 419 NO
Second Right
U Turn
Second Left
Left Turn 360 41 4 36 50 208 15 194 248 NO
Through 1,300 16 1 15 18 233 28 190 288 NO
Right Turn
Second Right
U Turn
Second Left
Left Turn
Through
Right Turn
Second Right
U Turn
Second Left
Left Turn 160 57 2 54 61 253 23 216 282 MAX
Through
Right Turn 1,260 8 1 6 9 110 40 71 210 NO
Second Right
SB
EB
WB
NB
Fehr & Peers 12/13/2016

Vissim Post-Processor Richards Blvd - Olive Dr Circulation
Average Results from 10 Runs L St Extension with Lincoln 40 - Cumulative Conditions
Queue Length PM Peak Hour
Intersection 9 Research Park Dr/Richards Blvd Signal
Storage Average Queue (ft) Maximum Queue (ft) Exceeds
Direction Movement (ft) Average Std. Dev. Minimum Maximum Average Std. Dev. Minimum Maximum Storage?
U Turn
Second Left
Left Turn 100 36 5 27 42 137 19 109 166 MAX
Through 620 5 2 3 8 105 27 71 159 NO
Right Turn
Second Right
U Turn
Second Left
Left Turn 120 14 4 10 23 171 126 85 382 MAX
Through 3,940 138 29 112 205 617 43 496 636 NO
Right Turn
Second Right
U Turn 440 154 24 128 193 512 48 423 557 MAX
Second Left
Left Turn 440 154 24 128 193 512 48 423 557 MAX
Through 440 84 6 72 96 526 27 460 557 MAX
Right Turn
Second Right
U Turn
Second Left
Left Turn 80 11 3 9 18 164 115 65 396 MAX
Through 180 112 15 93 142 688 155 471 913 MAX
Right Turn
Second Right
WB
NB
SB
EB
Fehr & Peers 12/13/2016

Vissim Post‐Processor Richards Blvd ‐ Olive Dr Circulation
Average Results from 10 Runs Olive Dr Off‐Ramp Closure with Lincoln 40 ‐ Cumulative Conditions
Queue Length AM Peak Hour
Intersection 1 K St/Third St Side‐street Stop
Storage Average Queue (ft) Maximum Queue (ft) Exceeds
Direction Movement (ft) Average Std. Dev. Minimum Maximum Average Std. Dev. Minimum Maximum Storage?
U Turn
Second Left
Left Turn 360 0 0 0 0 9 11 0 23 NO
Through 360 0 0 0 0 9 11 0 23 NO
Right Turn 360 0 0 0 0 2 7 0 21 NO
Second Right
U Turn
Second Left
Left Turn 420 3 1 2 4 69 16 50 91 NO
Through 3,700 3 1 2 4 69 16 50 91 NO
Right Turn 420 3 1 2 4 69 16 50 91 NO
Second Right
U Turn
Second Left
Left Turn 250 1 1 0 3 45 48 0 137 NO
Through 250 0 0 0 0 0 0 0 0 NO
Right Turn 250 1 1 0 3 47 50 0 142 NO
Second Right
U Turn
Second Left
Left Turn 250 0 0 0 0 23 18 0 48 NO
Through 250 0 0 0 0 71 12 65 104 NO
Right Turn 250 0 0 0 0 34 21 0 59 NO
Second Right
NB
SB
EB
WB
Fehr & Peers 12/8/2016
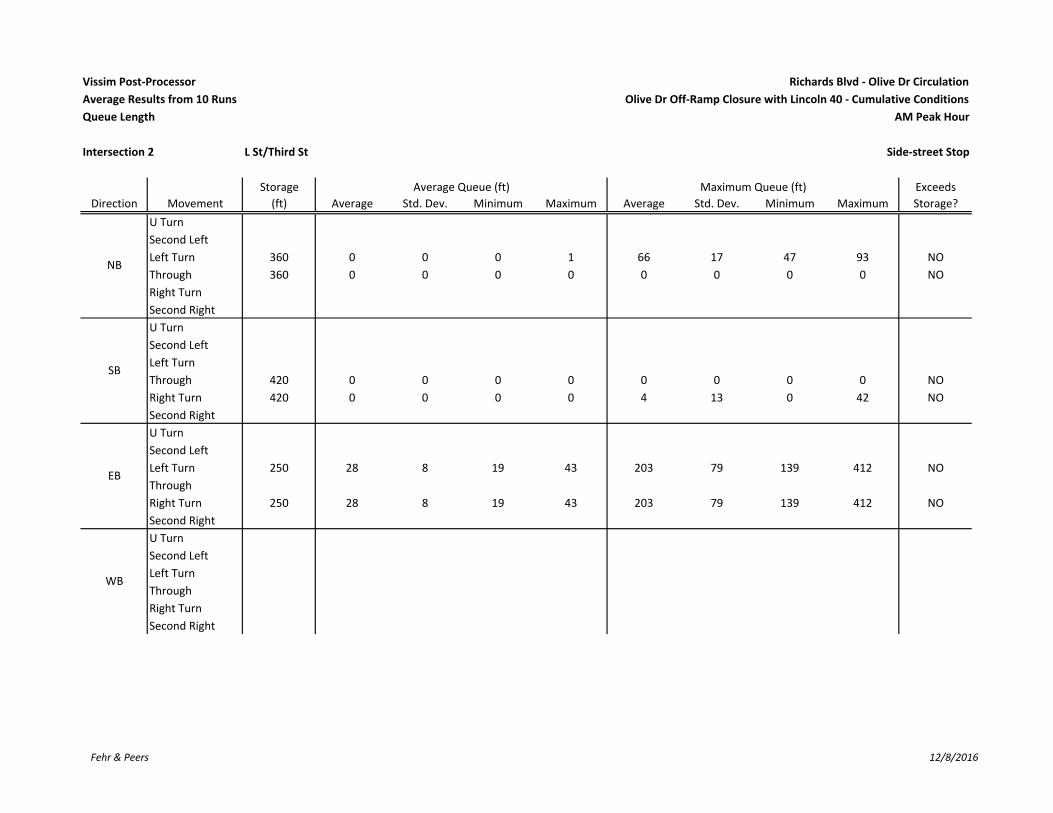
Vissim Post‐Processor Richards Blvd ‐ Olive Dr Circulation
Average Results from 10 Runs Olive Dr Off‐Ramp Closure with Lincoln 40 ‐ Cumulative Conditions
Queue Length AM Peak Hour
Intersection 2 L St/Third St Side‐street Stop
Storage Average Queue (ft) Maximum Queue (ft) Exceeds
Direction Movement (ft) Average Std. Dev. Minimum Maximum Average Std. Dev. Minimum Maximum Storage?
U Turn
Second Left
Left Turn 360 0 0 0 1 66 17 47 93 NO
Through 360 0 0 0 0 0 0 0 0 NO
Right Turn
Second Right
U Turn
Second Left
Left Turn
Through 420 0 0 0 0 0 0 0 0 NO
Right Turn 420 0 0 0 0 4 13 0 42 NO
Second Right
U Turn
Second Left
Left Turn 250 28 8 19 43 203 79 139 412 NO
Through
Right Turn 250 28 8 19 43 203 79 139 412 NO
Second Right
U Turn
Second Left
Left Turn
Through
Right Turn
Second Right
NB
SB
EB
WB
Fehr & Peers 12/8/2016

Vissim Post‐Processor Richards Blvd ‐ Olive Dr Circulation
Average Results from 10 Runs Olive Dr Off‐Ramp Closure with Lincoln 40 ‐ Cumulative Conditions
Queue Length AM Peak Hour
Intersection 3 Arbor Apts Dwy (East)/Olive Dr Side‐street Stop
Storage Average Queue (ft) Maximum Queue (ft) Exceeds
Direction Movement (ft) Average Std. Dev. Minimum Maximum Average Std. Dev. Minimum Maximum Storage?
U Turn
Second Left
Left Turn 460 0 0 0 0 32 15 22 59 NO
Through
Right Turn
Second Right
U Turn
Second Left
Left Turn
Through
Right Turn
Second Right
U Turn
Second Left
Left Turn
Through 2,000 0 0 0 0 0 0 0 0 NO
Right Turn 2,000 0 0 0 0 9 11 0 25 NO
Second Right
U Turn
Second Left
Left Turn
Through 1,400 0 0 0 0 0 0 0 0 NO
Right Turn
Second Right
SB
EB
WB
NB
Fehr & Peers 12/8/2016
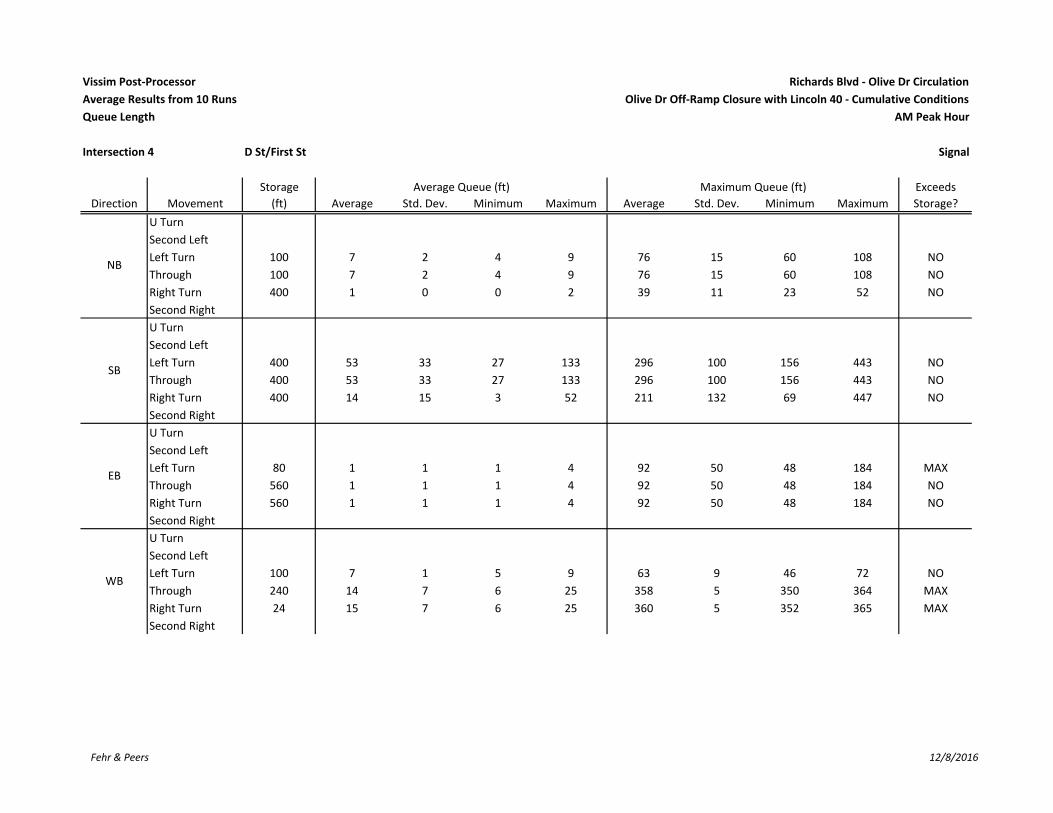
Vissim Post‐Processor Richards Blvd ‐ Olive Dr Circulation
Average Results from 10 Runs Olive Dr Off‐Ramp Closure with Lincoln 40 ‐ Cumulative Conditions
Queue Length AM Peak Hour
Intersection 4 D St/First St Signal
Storage Average Queue (ft) Maximum Queue (ft) Exceeds
Direction Movement (ft) Average Std. Dev. Minimum Maximum Average Std. Dev. Minimum Maximum Storage?
U Turn
Second Left
Left Turn 100 7 2 4 9 76 15 60 108 NO
Through 100 7 2 4 9 76 15 60 108 NO
Right Turn 400 1 0 0 2 39 11 23 52 NO
Second Right
U Turn
Second Left
Left Turn 400 53 33 27 133 296 100 156 443 NO
Through 400 53 33 27 133 296 100 156 443 NO
Right Turn 400 14 15 3 52 211 132 69 447 NO
Second Right
U Turn
Second Left
Left Turn 80 1 1 1 4 92 50 48 184 MAX
Through 560 1 1 1 4 92 50 48 184 NO
Right Turn 560 1 1 1 4 92 50 48 184 NO
Second Right
U Turn
Second Left
Left Turn 100 7 1 5 9 63 9 46 72 NO
Through 240 14 7 6 25 358 5 350 364 MAX
Right Turn 24 15 7 6 25 360 5 352 365 MAX
Second Right
NB
SB
EB
WB
Fehr & Peers 12/8/2016
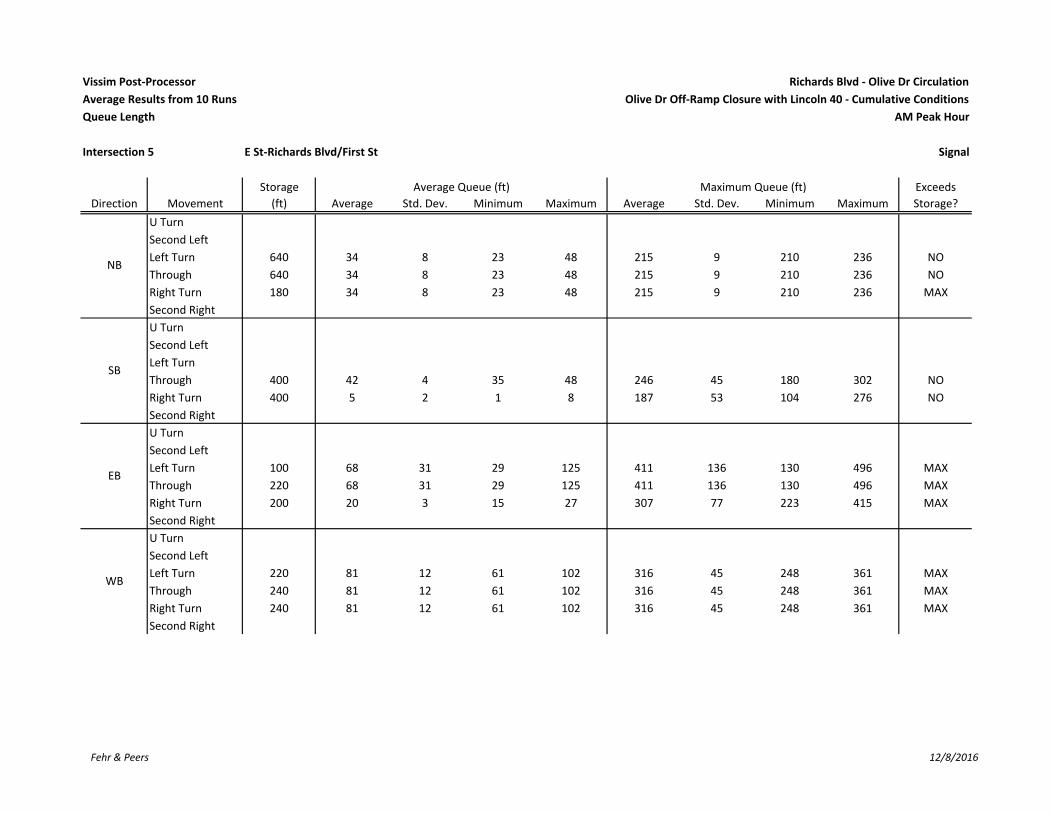
Vissim Post‐Processor Richards Blvd ‐ Olive Dr Circulation
Average Results from 10 Runs Olive Dr Off‐Ramp Closure with Lincoln 40 ‐ Cumulative Conditions
Queue Length AM Peak Hour
Intersection 5 E St‐Richards Blvd/First St Signal
Storage Average Queue (ft) Maximum Queue (ft) Exceeds
Direction Movement (ft) Average Std. Dev. Minimum Maximum Average Std. Dev. Minimum Maximum Storage?
U Turn
Second Left
Left Turn 640 34 8 23 48 215 9 210 236 NO
Through 640 34 8 23 48 215 9 210 236 NO
Right Turn 180 34 8 23 48 215 9 210 236 MAX
Second Right
U Turn
Second Left
Left Turn
Through 400 42 4 35 48 246 45 180 302 NO
Right Turn 400 5 2 1 8 187 53 104 276 NO
Second Right
U Turn
Second Left
Left Turn 100 68 31 29 125 411 136 130 496 MAX
Through 220 68 31 29 125 411 136 130 496 MAX
Right Turn 200 20 3 15 27 307 77 223 415 MAX
Second Right
U Turn
Second Left
Left Turn 220 81 12 61 102 316 45 248 361 MAX
Through 240 81 12 61 102 316 45 248 361 MAX
Right Turn 240 81 12 61 102 316 45 248 361 MAX
Second Right
NB
SB
EB
WB
Fehr & Peers 12/8/2016

Vissim Post‐Processor Richards Blvd ‐ Olive Dr Circulation
Average Results from 10 Runs Olive Dr Off‐Ramp Closure with Lincoln 40 ‐ Cumulative Conditions
Queue Length AM Peak Hour
Intersection 6 Richards Blvd/Olive Dr Signal
Storage Average Queue (ft) Maximum Queue (ft) Exceeds
Direction Movement (ft) Average Std. Dev. Minimum Maximum Average Std. Dev. Minimum Maximum Storage?
U Turn
Second Left
Left Turn 100 220 27 174 260 569 9 565 596 AVG
Through 1,540 181 27 138 233 562 9 558 588 NO
Right Turn 160 0 0 0 0 28 21 0 78 NO
Second Right
U Turn
Second Left
Left Turn 590 17 5 11 30 339 234 90 646 NO
Through 590 100 15 78 123 653 66 551 748 MAX
Right Turn 250 5 3 1 13 231 66 129 326 NO
Second Right
U Turn
Second Left
Left Turn 225 8 1 6 10 85 16 68 113 NO
Through 600 8 1 7 9 79 12 63 94 NO
Right Turn 225 9 1 7 9 80 12 64 96 NO
Second Right
U Turn
Second Left
Left Turn 200 16 3 13 21 137 25 108 172 NO
Through 2,000 44 19 20 75 285 107 139 479 NO
Right Turn 2,000 50 19 26 82 294 107 148 488 NO
Second Right
NB
SB
EB
WB
Fehr & Peers 12/8/2016

Vissim Post‐Processor Richards Blvd ‐ Olive Dr Circulation
Average Results from 10 Runs Olive Dr Off‐Ramp Closure with Lincoln 40 ‐ Cumulative Conditions
Queue Length AM Peak Hour
Intersection 7 Richards Blvd/I‐80 WB Ramps Signal
Storage Average Queue (ft) Maximum Queue (ft) Exceeds
Direction Movement (ft) Average Std. Dev. Minimum Maximum Average Std. Dev. Minimum Maximum Storage?
U Turn
Second Left
Left Turn 800 82 4 76 88 299 11 276 312 NO
Through 800 54 24 29 107 329 9 321 345 NO
Right Turn
Second Right
U Turn
Second Left
Left Turn
Through 590 71 2 67 74 340 22 298 375 NO
Right Turn 200 1 1 0 2 118 21 86 153 NO
Second Right
U Turn
Second Left
Left Turn
Through
Right Turn
Second Right
U Turn
Second Left
Left Turn 400 48 4 39 56 270 25 228 313 NO
Through
Right Turn 1,200 176 72 93 272 849 429 340 1,263 NO
Second Right
NB
SB
EB
WB
Fehr & Peers 12/8/2016
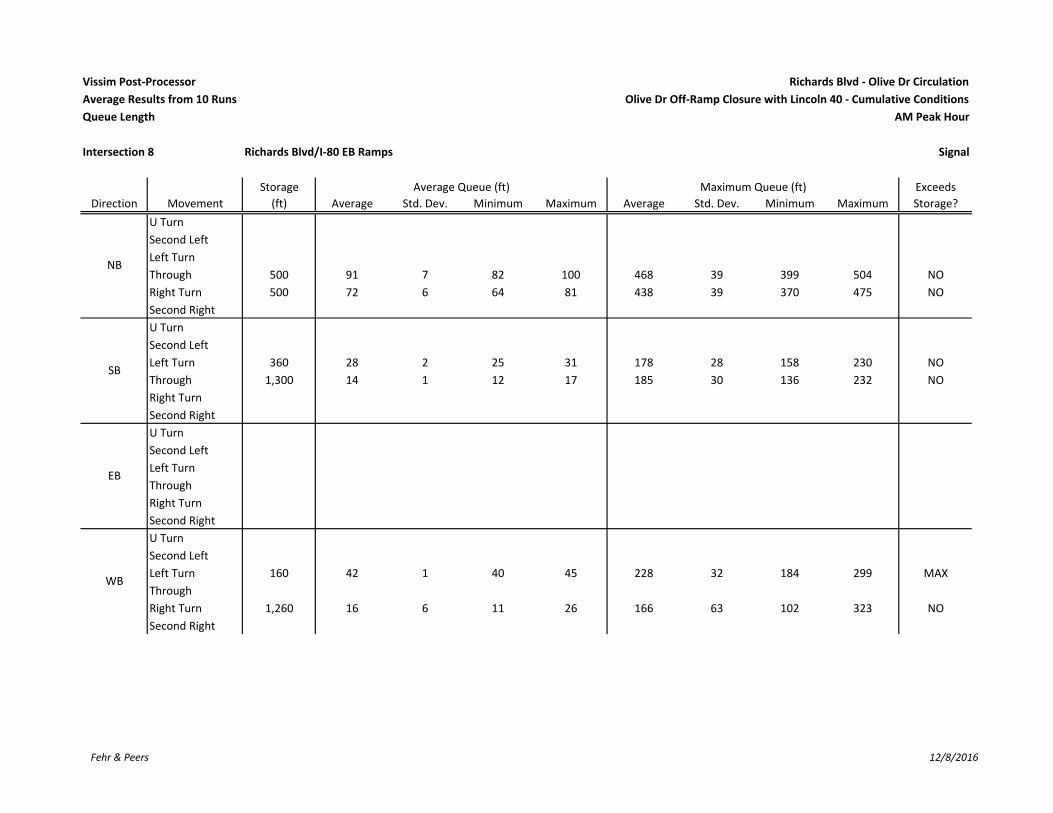
Vissim Post‐Processor Richards Blvd ‐ Olive Dr Circulation
Average Results from 10 Runs Olive Dr Off‐Ramp Closure with Lincoln 40 ‐ Cumulative Conditions
Queue Length AM Peak Hour
Intersection 8 Richards Blvd/I‐80 EB Ramps Signal
Storage Average Queue (ft) Maximum Queue (ft) Exceeds
Direction Movement (ft) Average Std. Dev. Minimum Maximum Average Std. Dev. Minimum Maximum Storage?
U Turn
Second Left
Left Turn
Through 500 91 7 82 100 468 39 399 504 NO
Right Turn 500 72 6 64 81 438 39 370 475 NO
Second Right
U Turn
Second Left
Left Turn 360 28 2 25 31 178 28 158 230 NO
Through 1,300 14 1 12 17 185 30 136 232 NO
Right Turn
Second Right
U Turn
Second Left
Left Turn
Through
Right Turn
Second Right
U Turn
Second Left
Left Turn 160 42 1 40 45 228 32 184 299 MAX
Through
Right Turn 1,260 16 6 11 26 166 63 102 323 NO
Second Right
SB
EB
WB
NB
Fehr & Peers 12/8/2016

Vissim Post‐Processor Richards Blvd ‐ Olive Dr Circulation
Average Results from 10 Runs Olive Dr Off‐Ramp Closure with Lincoln 40 ‐ Cumulative Conditions
Queue Length AM Peak Hour
Intersection 9 Research Park Dr/Richards Blvd Signal
Storage Average Queue (ft) Maximum Queue (ft) Exceeds
Direction Movement (ft) Average Std. Dev. Minimum Maximum Average Std. Dev. Minimum Maximum Storage?
U Turn
Second Left
Left Turn 100 29 5 20 39 137 42 109 245 MAX
Through 620 1 1 0 3 49 17 25 71 NO
Right Turn
Second Right
U Turn
Second Left
Left Turn 120 6 1 5 9 64 8 46 73 NO
Through 3,940 14 4 10 19 160 27 132 206 NO
Right Turn
Second Right
U Turn 440 128 15 113 153 511 28 455 554 MAX
Second Left
Left Turn 440 128 15 113 153 511 28 455 554 MAX
Through 440 48 6 38 58 389 83 299 534 NO
Right Turn
Second Right
U Turn
Second Left
Left Turn 80 29 11 16 44 531 449 74 1,133 MAX
Through 180 411 127 233 584 1,143 11 1,129 1,163 AVG
Right Turn
Second Right
WB
NB
SB
EB
Fehr & Peers 12/8/2016
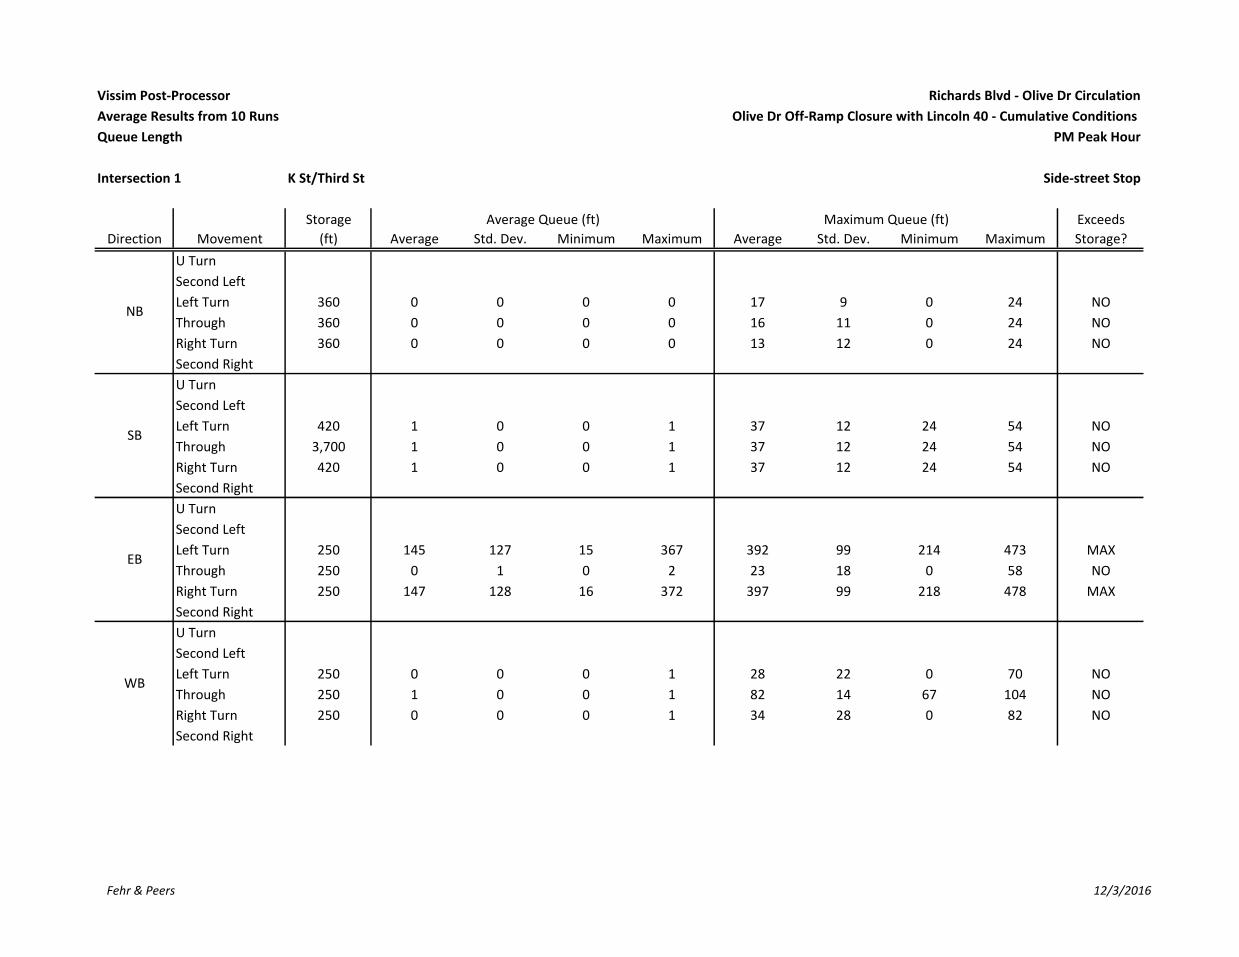
Vissim Post-Processor Richards Blvd - Olive Dr Circulation
Average Results from 10 Runs Olive Dr Off-Ramp Closure with Lincoln 40 - Cumulative Conditions
Queue Length PM Peak Hour
Intersection 1 K St/Third St Side-street Stop
Storage Average Queue (ft) Maximum Queue (ft) Exceeds
Direction Movement (ft) Average Std. Dev. Minimum Maximum Average Std. Dev. Minimum Maximum Storage?
U Turn
Second Left
Left Turn 360 0 0 0 0 17 9 0 24 NO
Through 360 0 0 0 0 16 11 0 24 NO
Right Turn 360 0 0 0 0 13 12 0 24 NO
Second Right
U Turn
Second Left
Left Turn 420 1 0 0 1 37 12 24 54 NO
Through 3,700 1 0 0 1 37 12 24 54 NO
Right Turn 420 1 0 0 1 37 12 24 54 NO
Second Right
U Turn
Second Left
Left Turn 250 145 127 15 367 392 99 214 473 MAX
Through 250 0 1 0 2 23 18 0 58 NO
Right Turn 250 147 128 16 372 397 99 218 478 MAX
Second Right
U Turn
Second Left
Left Turn 250 0 0 0 1 28 22 0 70 NO
Through 250 1 0 0 1 82 14 67 104 NO
Right Turn 250 0 0 0 1 34 28 0 82 NO
Second Right
NB
SB
EB
WB
Fehr & Peers 12/3/2016

Vissim Post-Processor Richards Blvd - Olive Dr Circulation
Average Results from 10 Runs Olive Dr Off-Ramp Closure with Lincoln 40 - Cumulative Conditions
Queue Length PM Peak Hour
Intersection 2 L St/Third St Side-street Stop
Storage Average Queue (ft) Maximum Queue (ft) Exceeds
Direction Movement (ft) Average Std. Dev. Minimum Maximum Average Std. Dev. Minimum Maximum Storage?
U Turn
Second Left
Left Turn 360 1 0 1 2 99 33 51 145 NO
Through 360 0 0 0 0 0 0 0 0 NO
Right Turn
Second Right
U Turn
Second Left
Left Turn
Through 420 0 0 0 0 0 0 0 0 NO
Right Turn 420 0 0 0 0 23 24 0 48 NO
Second Right
U Turn
Second Left
Left Turn 250 311 201 73 648 683 119 416 774 AVG
Through
Right Turn 250 311 201 73 648 683 119 416 774 AVG
Second Right
U Turn
Second Left
Left Turn
Through
Right Turn
Second Right
NB
SB
EB
WB
Fehr & Peers 12/3/2016
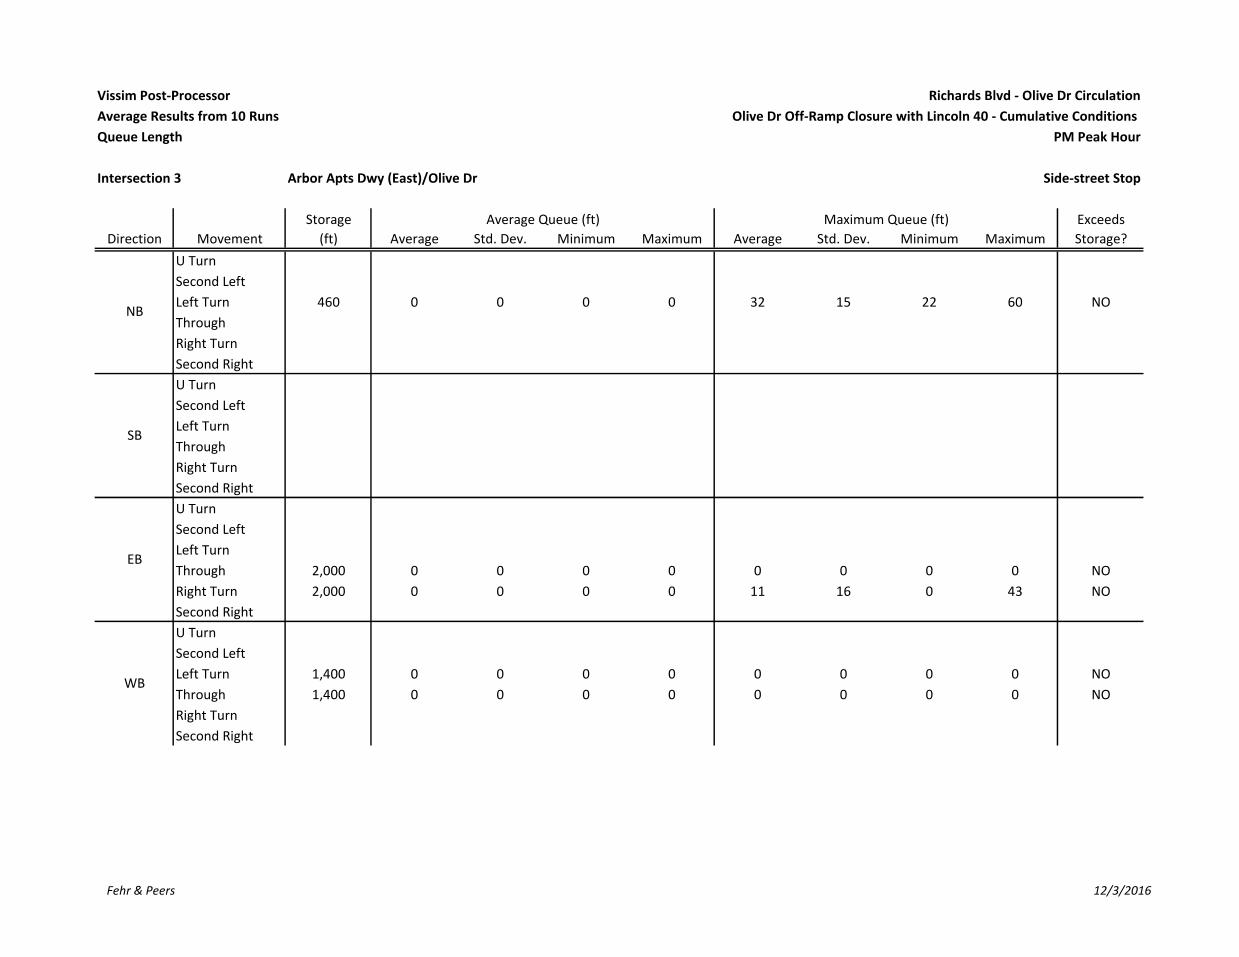
Vissim Post-Processor Richards Blvd - Olive Dr Circulation
Average Results from 10 Runs Olive Dr Off-Ramp Closure with Lincoln 40 - Cumulative Conditions
Queue Length PM Peak Hour
Intersection 3 Arbor Apts Dwy (East)/Olive Dr Side-street Stop
Storage Average Queue (ft) Maximum Queue (ft) Exceeds
Direction Movement (ft) Average Std. Dev. Minimum Maximum Average Std. Dev. Minimum Maximum Storage?
U Turn
Second Left
Left Turn 460 0 0 0 0 32 15 22 60 NO
Through
Right Turn
Second Right
U Turn
Second Left
Left Turn
Through
Right Turn
Second Right
U Turn
Second Left
Left Turn
Through 2,000 0 0 0 0 0 0 0 0 NO
Right Turn 2,000 0 0 0 0 11 16 0 43 NO
Second Right
U Turn
Second Left
Left Turn 1,400 0 0 0 0 0 0 0 0 NO
Through 1,400 0 0 0 0 0 0 0 0 NO
Right Turn
Second Right
NB
SB
EB
WB
Fehr & Peers 12/3/2016
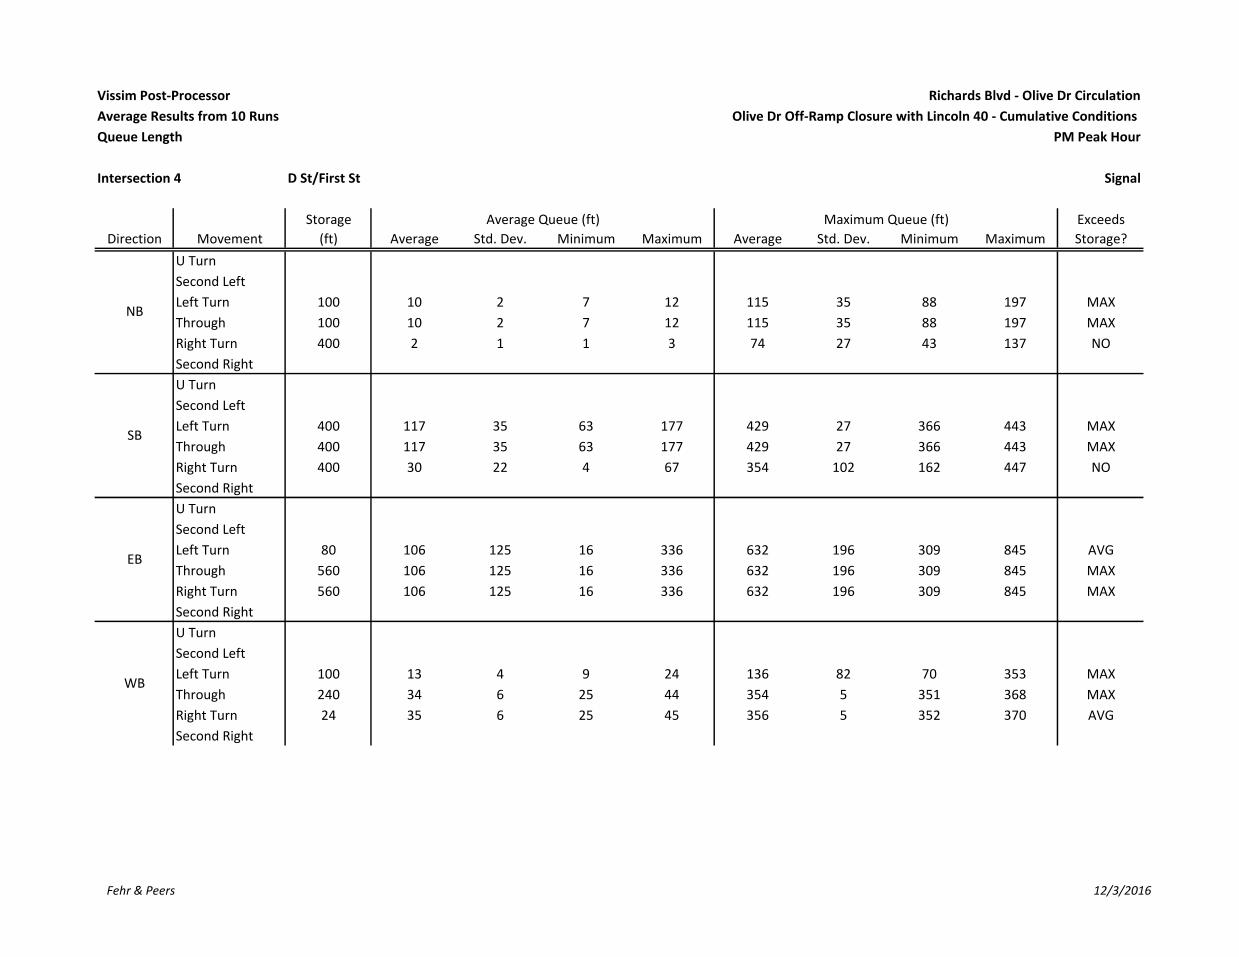
Vissim Post-Processor Richards Blvd - Olive Dr Circulation
Average Results from 10 Runs Olive Dr Off-Ramp Closure with Lincoln 40 - Cumulative Conditions
Queue Length PM Peak Hour
Intersection 4 D St/First St Signal
Storage Average Queue (ft) Maximum Queue (ft) Exceeds
Direction Movement (ft) Average Std. Dev. Minimum Maximum Average Std. Dev. Minimum Maximum Storage?
U Turn
Second Left
Left Turn 100 10 2 7 12 115 35 88 197 MAX
Through 100 10 2 7 12 115 35 88 197 MAX
Right Turn 400 2 1 1 3 74 27 43 137 NO
Second Right
U Turn
Second Left
Left Turn 400 117 35 63 177 429 27 366 443 MAX
Through 400 117 35 63 177 429 27 366 443 MAX
Right Turn 400 30 22 4 67 354 102 162 447 NO
Second Right
U Turn
Second Left
Left Turn 80 106 125 16 336 632 196 309 845 AVG
Through 560 106 125 16 336 632 196 309 845 MAX
Right Turn 560 106 125 16 336 632 196 309 845 MAX
Second Right
U Turn
Second Left
Left Turn 100 13 4 9 24 136 82 70 353 MAX
Through 240 34 6 25 44 354 5 351 368 MAX
Right Turn 24 35 6 25 45 356 5 352 370 AVG
Second Right
NB
SB
EB
WB
Fehr & Peers 12/3/2016

Vissim Post-Processor Richards Blvd - Olive Dr Circulation
Average Results from 10 Runs Olive Dr Off-Ramp Closure with Lincoln 40 - Cumulative Conditions
Queue Length PM Peak Hour
Intersection 5 E St-Richards Blvd/First St Signal
Storage Average Queue (ft) Maximum Queue (ft) Exceeds
Direction Movement (ft) Average Std. Dev. Minimum Maximum Average Std. Dev. Minimum Maximum Storage?
U Turn
Second Left
Left Turn 640 7 3 3 12 205 5 199 211 NO
Through 640 7 3 3 12 205 5 199 211 NO
Right Turn 180 7 3 3 12 205 5 199 211 MAX
Second Right
U Turn
Second Left
Left Turn
Through 400 63 29 47 142 314 60 231 415 NO
Right Turn 400 8 10 1 34 258 81 162 418 NO
Second Right
U Turn
Second Left
Left Turn 100 51 15 33 79 500 11 491 526 MAX
Through 220 51 15 33 79 500 11 491 526 MAX
Right Turn 200 152 32 104 198 501 7 496 512 MAX
Second Right
U Turn
Second Left
Left Turn 220 75 13 54 99 298 54 204 379 MAX
Through 240 75 13 54 99 298 54 204 379 MAX
Right Turn 240 75 13 54 99 298 54 204 379 MAX
Second Right
NB
SB
EB
WB
Fehr & Peers 12/3/2016

Vissim Post-Processor Richards Blvd - Olive Dr Circulation
Average Results from 10 Runs Olive Dr Off-Ramp Closure with Lincoln 40 - Cumulative Conditions
Queue Length PM Peak Hour
Intersection 6 Richards Blvd/Olive Dr Signal
Storage Average Queue (ft) Maximum Queue (ft) Exceeds
Direction Movement (ft) Average Std. Dev. Minimum Maximum Average Std. Dev. Minimum Maximum Storage?
U Turn
Second Left
Left Turn 100 90 13 70 109 525 45 460 566 MAX
Through 1,540 72 15 53 94 518 45 452 558 NO
Right Turn 100 1 0 0 1 55 17 25 86 NO
Second Right
U Turn
Second Left
Left Turn 590 79 26 38 124 706 72 511 748 MAX
Through 590 57 10 42 73 684 71 556 748 MAX
Right Turn 250 10 7 2 23 293 48 173 326 MAX
Second Right
U Turn
Second Left
Left Turn 225 4 1 2 5 53 17 24 77 NO
Through 600 27 2 24 30 155 19 128 188 NO
Right Turn 225 28 2 25 31 157 19 130 189 NO
Second Right
U Turn
Second Left
Left Turn 200 25 5 20 37 166 31 112 210 NO
Through 2,000 23 5 13 31 201 49 136 297 NO
Right Turn 2,000 29 6 18 37 210 49 145 307 NO
Second Right
WB
NB
SB
EB
Fehr & Peers 12/3/2016

Vissim Post-Processor Richards Blvd - Olive Dr Circulation
Average Results from 10 Runs Olive Dr Off-Ramp Closure with Lincoln 40 - Cumulative Conditions
Queue Length PM Peak Hour
Intersection 7 I-80 WB Ramps/Richards Blvd Signal
Storage Average Queue (ft) Maximum Queue (ft) Exceeds
Direction Movement (ft) Average Std. Dev. Minimum Maximum Average Std. Dev. Minimum Maximum Storage?
U Turn
Second Left
Left Turn 800 95 3 90 99 313 7 307 329 NO
Through 800 12 3 9 20 277 42 229 323 NO
Right Turn
Second Right
U Turn
Second Left
Left Turn
Through 590 93 7 80 107 529 33 479 581 NO
Right Turn 200 11 3 7 18 293 33 244 346 MAX
Second Right
U Turn
Second Left
Left Turn
Through
Right Turn
Second Right
U Turn
Second Left
Left Turn 400 28 4 23 35 179 40 117 249 NO
Through
Right Turn
Second Right
NB
SB
EB
WB
Fehr & Peers 12/3/2016

Vissim Post-Processor Richards Blvd - Olive Dr Circulation
Average Results from 10 Runs Olive Dr Off-Ramp Closure with Lincoln 40 - Cumulative Conditions
Queue Length PM Peak Hour
Intersection 8 I-80 EB Ramps/Richards Blvd Signal
Storage Average Queue (ft) Maximum Queue (ft) Exceeds
Direction Movement (ft) Average Std. Dev. Minimum Maximum Average Std. Dev. Minimum Maximum Storage?
U Turn
Second Left
Left Turn
Through 500 120 11 106 135 423 37 374 475 NO
Right Turn 500 97 10 84 111 394 37 344 446 NO
Second Right
U Turn
Second Left
Left Turn 360 60 7 51 70 249 40 198 314 NO
Through 1,300 20 3 15 26 251 41 172 299 NO
Right Turn
Second Right
U Turn
Second Left
Left Turn
Through
Right Turn
Second Right
U Turn
Second Left
Left Turn 160 58 6 51 74 268 58 235 424 MAX
Through
Right Turn 1,260 9 2 7 11 115 27 88 166 NO
Second Right
NB
SB
EB
WB
Fehr & Peers 12/3/2016

Vissim Post-Processor Richards Blvd - Olive Dr Circulation
Average Results from 10 Runs Olive Dr Off-Ramp Closure with Lincoln 40 - Cumulative Conditions
Queue Length PM Peak Hour
Intersection 9 Research Park Dr/Richards Blvd Signal
Storage Average Queue (ft) Maximum Queue (ft) Exceeds
Direction Movement (ft) Average Std. Dev. Minimum Maximum Average Std. Dev. Minimum Maximum Storage?
U Turn
Second Left
Left Turn 100 31 4 26 36 131 49 91 249 MAX
Through 620 5 1 4 7 88 17 63 119 NO
Right Turn
Second Right
U Turn
Second Left
Left Turn 120 12 4 6 16 105 46 49 190 NO
Through 3,940 135 46 82 233 560 72 450 636 NO
Right Turn
Second Right
U Turn 440 126 29 91 197 536 36 448 571 MAX
Second Left
Left Turn 440 126 29 91 197 536 36 448 571 MAX
Through 440 101 10 91 122 554 10 535 573 MAX
Right Turn
Second Right
U Turn
Second Left
Left Turn 80 11 3 7 16 83 28 45 144 MAX
Through 180 163 75 96 307 802 201 515 1,163 MAX
Right Turn
Second Right
EB
WB
NB
SB
Fehr & Peers 12/3/2016

Vissim Post‐Processor Richards Blvd ‐ Olive Dr Circulation
Average Results from 10 Runs L St Extension & Olive Dr Off‐Ramp Closure with Lincoln 40 ‐ Cumulative Conditions
Queue Length AM Peak Hour
Intersection 1 K St/Third St Signal
Storage Average Queue (ft) Maximum Queue (ft) Exceeds
Direction Movement (ft) Average Std. Dev. Minimum Maximum Average Std. Dev. Minimum Maximum Storage?
U Turn
Second Left
Left Turn 420 40 5 32 45 260 57 203 362 NO
Through 420 40 5 32 45 260 57 203 362 NO
Right Turn 150 41 5 33 46 262 57 204 364 MAX
Second Right
U Turn
Second Left
Left Turn 420 2 1 1 4 52 13 23 68 NO
Through 3,700 2 1 1 4 52 13 23 68 NO
Right Turn 420 2 1 1 5 54 13 25 70 NO
Second Right
U Turn
Second Left
Left Turn 100 2 1 1 4 118 23 84 163 MAX
Through 250 2 1 1 4 118 23 84 163 NO
Right Turn 250 2 1 1 4 118 23 84 163 NO
Second Right
U Turn
Second Left
Left Turn 100 1 1 0 3 126 60 50 188 MAX
Through 250 1 1 0 3 126 60 50 188 NO
Right Turn 250 1 1 0 3 126 60 50 188 NO
Second Right
NB
SB
EB
WB
Fehr & Peers 12/2/2016

Vissim Post‐Processor Richards Blvd ‐ Olive Dr Circulation
Average Results from 10 Runs L St Extension & Olive Dr Off‐Ramp Closure with Lincoln 40 ‐ Cumulative Conditions
Queue Length AM Peak Hour
Intersection 2 L St/Third St Signal
Storage Average Queue (ft) Maximum Queue (ft) Exceeds
Direction Movement (ft) Average Std. Dev. Minimum Maximum Average Std. Dev. Minimum Maximum Storage?
U Turn
Second Left
Left Turn 150 8 3 3 15 265 136 139 521 MAX
Through 490 8 3 3 15 265 136 139 521 NO
Right Turn
Second Right
U Turn
Second Left
Left Turn
Through 420 31 5 22 39 282 54 206 358 NO
Right Turn 420 4 2 2 7 211 59 115 336 NO
Second Right
U Turn
Second Left
Left Turn 125 27 2 25 30 253 44 202 307 MAX
Through
Right Turn 250 28 2 26 31 254 44 203 308 MAX
Second Right
U Turn
Second Left
Left Turn
Through
Right Turn
Second Right
NB
SB
EB
WB
Fehr & Peers 12/2/2016

Vissim Post‐Processor Richards Blvd ‐ Olive Dr Circulation
Average Results from 10 Runs L St Extension & Olive Dr Off‐Ramp Closure with Lincoln 40 ‐ Cumulative Conditions
Queue Length AM Peak Hour
Intersection 3 L St/Olive Dr Signal
Storage Average Queue (ft) Maximum Queue (ft) Exceeds
Direction Movement (ft) Average Std. Dev. Minimum Maximum Average Std. Dev. Minimum Maximum Storage?
U Turn
Second Left
Left Turn
Through
Right Turn
Second Right
U Turn
Second Left
Left Turn
Through
Right Turn 375 8 1 7 10 211 41 166 275 NO
Second Right
U Turn
Second Left
Left Turn 750 63 5 58 72 440 93 318 636 NO
Through
Right Turn
Second Right
U Turn
Second Left
Left Turn
Through 1,400 1 0 1 2 51 23 22 86 NO
Right Turn 1,400 2 1 1 3 59 23 29 94 NO
Second Right
NB
SB
EB
WB
Fehr & Peers 12/2/2016

Vissim Post‐Processor Richards Blvd ‐ Olive Dr Circulation
Average Results from 10 Runs L St Extension & Olive Dr Off‐Ramp Closure with Lincoln 40 ‐ Cumulative Conditions
Queue Length AM Peak Hour
Intersection 4 D St/First St Signal
Storage Average Queue (ft) Maximum Queue (ft) Exceeds
Direction Movement (ft) Average Std. Dev. Minimum Maximum Average Std. Dev. Minimum Maximum Storage?
U Turn
Second Left
Left Turn 100 5 1 3 8 67 24 45 113 NO
Through 100 5 1 3 8 67 24 45 113 NO
Right Turn 400 0 0 0 1 45 10 23 61 NO
Second Right
U Turn
Second Left
Left Turn 400 19 2 15 24 147 21 117 182 NO
Through 400 19 2 15 24 147 21 117 182 NO
Right Turn 400 1 1 1 3 64 44 24 137 NO
Second Right
U Turn
Second Left
Left Turn 80 1 0 1 2 100 52 48 205 MAX
Through 560 1 0 1 2 100 52 48 205 NO
Right Turn 560 1 0 1 2 100 52 48 205 NO
Second Right
U Turn
Second Left
Left Turn 100 11 3 7 16 86 22 46 115 NO
Through 240 4 1 3 5 233 109 121 364 NO
Right Turn 24 4 1 3 6 235 109 123 365 MAX
Second Right
NB
SB
EB
WB
Fehr & Peers 12/2/2016
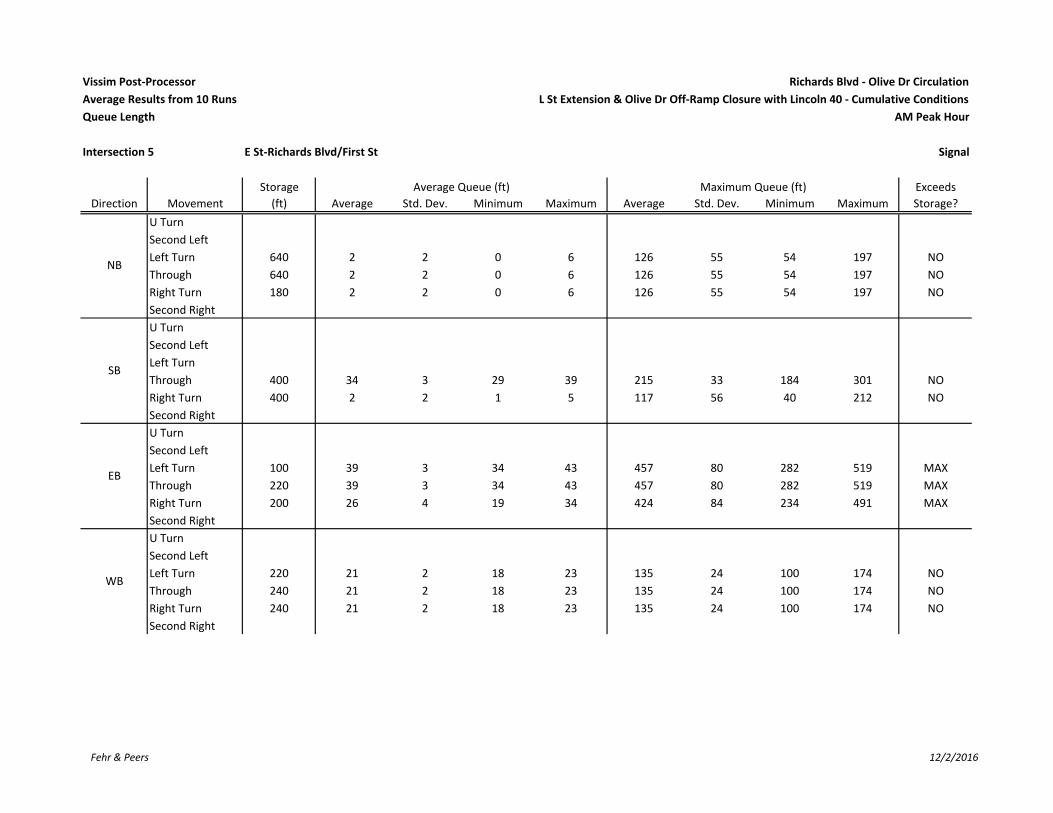
Vissim Post‐Processor Richards Blvd ‐ Olive Dr Circulation
Average Results from 10 Runs L St Extension & Olive Dr Off‐Ramp Closure with Lincoln 40 ‐ Cumulative Conditions
Queue Length AM Peak Hour
Intersection 5 E St‐Richards Blvd/First St Signal
Storage Average Queue (ft) Maximum Queue (ft) Exceeds
Direction Movement (ft) Average Std. Dev. Minimum Maximum Average Std. Dev. Minimum Maximum Storage?
U Turn
Second Left
Left Turn 640 2 2 0 6 126 55 54 197 NO
Through 640 2 2 0 6 126 55 54 197 NO
Right Turn 180 2 2 0 6 126 55 54 197 NO
Second Right
U Turn
Second Left
Left Turn
Through 400 34 3 29 39 215 33 184 301 NO
Right Turn 400 2 2 1 5 117 56 40 212 NO
Second Right
U Turn
Second Left
Left Turn 100 39 3 34 43 457 80 282 519 MAX
Through 220 39 3 34 43 457 80 282 519 MAX
Right Turn 200 26 4 19 34 424 84 234 491 MAX
Second Right
U Turn
Second Left
Left Turn 220 21 2 18 23 135 24 100 174 NO
Through 240 21 2 18 23 135 24 100 174 NO
Right Turn 240 21 2 18 23 135 24 100 174 NO
Second Right
NB
SB
EB
WB
Fehr & Peers 12/2/2016

Vissim Post‐Processor Richards Blvd ‐ Olive Dr Circulation
Average Results from 10 Runs L St Extension & Olive Dr Off‐Ramp Closure with Lincoln 40 ‐ Cumulative Conditions
Queue Length AM Peak Hour
Intersection 6 Richards Blvd/Olive Dr Signal
Storage Average Queue (ft) Maximum Queue (ft) Exceeds
Direction Movement (ft) Average Std. Dev. Minimum Maximum Average Std. Dev. Minimum Maximum Storage?
U Turn
Second Left
Left Turn 100 188 37 146 253 683 1 681 686 AVG
Through 1,540 108 25 81 152 675 1 673 679 NO
Right Turn 100 1 0 1 2 102 34 68 145 MAX
Second Right
U Turn
Second Left
Left Turn 640 6 2 3 8 127 94 45 306 NO
Through 640 98 17 75 123 677 103 491 746 MAX
Right Turn 640 5 4 0 9 247 99 71 325 NO
Second Right
U Turn
Second Left
Left Turn 600 11 3 7 16 80 17 53 114 NO
Through 600 13 2 10 15 122 18 92 143 NO
Right Turn 600 14 2 10 16 123 18 94 144 NO
Second Right
U Turn
Second Left
Left Turn 200 0 0 0 0 31 14 21 56 NO
Through 4,000 0 0 0 0 31 14 21 56 NO
Right Turn 4,000 0 0 0 0 31 14 21 56 NO
Second Right
WB
NB
SB
EB
Fehr & Peers 12/2/2016

Vissim Post‐Processor Richards Blvd ‐ Olive Dr Circulation
Average Results from 10 Runs L St Extension & Olive Dr Off‐Ramp Closure with Lincoln 40 ‐ Cumulative Conditions
Queue Length AM Peak Hour
Intersection 7 Richards Blvd/I‐80 WB Ramps Signal
Storage Average Queue (ft) Maximum Queue (ft) Exceeds
Direction Movement (ft) Average Std. Dev. Minimum Maximum Average Std. Dev. Minimum Maximum Storage?
U Turn
Second Left
Left Turn 800 24 4 20 31 254 43 196 322 NO
Through 800 24 10 16 49 400 120 299 685 NO
Right Turn
Second Right
U Turn
Second Left
Left Turn
Through 590 50 4 43 54 234 36 180 278 NO
Right Turn 200 2 1 1 2 112 23 87 165 NO
Second Right
U Turn
Second Left
Left Turn
Through
Right Turn
Second Right
U Turn
Second Left
Left Turn 400 28 2 26 32 200 38 160 294 NO
Through
Right Turn 1,200 133 57 93 289 519 303 324 1,241 NO
Second Right
NB
SB
EB
WB
Fehr & Peers 12/2/2016

Vissim Post‐Processor Richards Blvd ‐ Olive Dr Circulation
Average Results from 10 Runs L St Extension & Olive Dr Off‐Ramp Closure with Lincoln 40 ‐ Cumulative Conditions
Queue Length AM Peak Hour
Intersection 8 Richards Blvd/I‐80 EB Ramps Signal
Storage Average Queue (ft) Maximum Queue (ft) Exceeds
Direction Movement (ft) Average Std. Dev. Minimum Maximum Average Std. Dev. Minimum Maximum Storage?
U Turn
Second Left
Left Turn
Through 500 37 5 31 45 473 39 400 527 NO
Right Turn 500 23 4 17 29 443 39 370 498 NO
Second Right
U Turn
Second Left
Left Turn 360 54 3 51 58 170 27 138 212 NO
Through 1,300 2 0 1 2 65 25 25 95 NO
Right Turn
Second Right
U Turn
Second Left
Left Turn
Through
Right Turn
Second Right
U Turn
Second Left
Left Turn 160 73 2 70 76 332 40 275 375 MAX
Through
Right Turn 1,260 13 2 11 18 143 28 101 186 NO
Second Right
NB
SB
EB
WB
Fehr & Peers 12/2/2016

Vissim Post‐Processor Richards Blvd ‐ Olive Dr Circulation
Average Results from 10 Runs L St Extension & Olive Dr Off‐Ramp Closure with Lincoln 40 ‐ Cumulative Conditions
Queue Length AM Peak Hour
Intersection 9 Research Park Dr/Richards Blvd Signal
Storage Average Queue (ft) Maximum Queue (ft) Exceeds
Direction Movement (ft) Average Std. Dev. Minimum Maximum Average Std. Dev. Minimum Maximum Storage?
U Turn
Second Left
Left Turn 100 18 2 16 21 107 19 82 139 MAX
Through 620 1 0 0 2 53 10 44 76 NO
Right Turn
Second Right
U Turn
Second Left
Left Turn 120 7 1 6 9 72 20 53 122 NO
Through 3,940 10 1 8 13 157 31 117 228 NO
Right Turn
Second Right
U Turn 440 66 8 56 81 440 56 351 519 MAX
Second Left
Left Turn 440 66 8 56 81 440 56 351 519 MAX
Through 440 43 5 36 51 327 67 253 479 NO
Right Turn
Second Right
U Turn
Second Left
Left Turn 80 75 51 18 150 923 348 270 1,135 MAX
Through 180 386 86 261 521 1,139 10 1,133 1,163 AVG
Right Turn
Second Right
EB
WB
NB
SB
Fehr & Peers 12/2/2016

Vissim Post‐Processor Richards Blvd ‐ Olive Dr Circulation
Average Results from 10 Runs L St Extension & Olive Dr Off‐Ramp Closure with Lincoln 40 ‐ Cumulative Conditions
Queue Length PM Peak Hour
Intersection 1 K St/Third St Signal
Storage Average Queue (ft) Maximum Queue (ft) Exceeds
Direction Movement (ft) Average Std. Dev. Minimum Maximum Average Std. Dev. Minimum Maximum Storage?
U Turn
Second Left
Left Turn 420 60 9 47 72 385 75 296 510 NO
Through 420 60 9 47 72 385 75 296 510 NO
Right Turn 150 61 9 49 73 386 75 297 511 MAX
Second Right
U Turn
Second Left
Left Turn 420 7 1 5 9 86 19 62 117 NO
Through 3,700 7 1 5 9 86 19 62 117 NO
Right Turn 420 8 1 6 10 88 19 64 118 NO
Second Right
U Turn
Second Left
Left Turn 100 224 10 200 233 325 14 313 351 AVG
Through 250 224 10 200 233 325 14 313 351 MAX
Right Turn 250 224 10 200 233 325 14 313 351 MAX
Second Right
U Turn
Second Left
Left Turn 100 20 5 8 25 187 2 181 190 MAX
Through 250 20 5 8 25 187 2 181 190 NO
Right Turn 250 20 5 8 25 187 2 181 190 NO
Second Right
NB
SB
EB
WB
Fehr & Peers 12/2/2016

Vissim Post‐Processor Richards Blvd ‐ Olive Dr Circulation
Average Results from 10 Runs L St Extension & Olive Dr Off‐Ramp Closure with Lincoln 40 ‐ Cumulative Conditions
Queue Length PM Peak Hour
Intersection 2 L St/Third St Signal
Storage Average Queue (ft) Maximum Queue (ft) Exceeds
Direction Movement (ft) Average Std. Dev. Minimum Maximum Average Std. Dev. Minimum Maximum Storage?
U Turn
Second Left
Left Turn 150 24 7 16 41 348 131 204 528 MAX
Through 490 24 7 16 41 348 131 204 528 NO
Right Turn
Second Right
U Turn
Second Left
Left Turn
Through 420 78 20 61 131 446 6 442 461 MAX
Right Turn 420 130 46 53 185 345 6 340 359 NO
Second Right
U Turn
Second Left
Left Turn 125 52 6 41 62 331 4 324 336 MAX
Through
Right Turn 250 52 6 41 63 332 4 325 337 MAX
Second Right
U Turn
Second Left
Left Turn
Through
Right Turn
Second Right
NB
SB
EB
WB
Fehr & Peers 12/2/2016

Vissim Post‐Processor Richards Blvd ‐ Olive Dr Circulation
Average Results from 10 Runs L St Extension & Olive Dr Off‐Ramp Closure with Lincoln 40 ‐ Cumulative Conditions
Queue Length PM Peak Hour
Intersection 3 L St/Olive Dr Signal
Storage Average Queue (ft) Maximum Queue (ft) Exceeds
Direction Movement (ft) Average Std. Dev. Minimum Maximum Average Std. Dev. Minimum Maximum Storage?
U Turn
Second Left
Left Turn
Through
Right Turn
Second Right
U Turn
Second Left
Left Turn
Through
Right Turn 375 5 1 3 7 207 39 130 271 NO
Second Right
U Turn
Second Left
Left Turn 750 6 2 3 11 267 142 142 558 NO
Through
Right Turn
Second Right
U Turn
Second Left
Left Turn
Through 1,400 4 1 3 5 59 14 44 91 NO
Right Turn 1,400 5 1 4 7 66 14 52 98 NO
Second Right
SB
EB
WB
NB
Fehr & Peers 12/2/2016

Vissim Post‐Processor Richards Blvd ‐ Olive Dr Circulation
Average Results from 10 Runs L St Extension & Olive Dr Off‐Ramp Closure with Lincoln 40 ‐ Cumulative Conditions
Queue Length PM Peak Hour
Intersection 4 D St/First St Signal
Storage Average Queue (ft) Maximum Queue (ft) Exceeds
Direction Movement (ft) Average Std. Dev. Minimum Maximum Average Std. Dev. Minimum Maximum Storage?
U Turn
Second Left
Left Turn 100 26 6 15 33 191 60 122 298 MAX
Through 100 26 6 15 33 191 60 122 298 MAX
Right Turn 400 5 2 3 8 114 71 64 304 NO
Second Right
U Turn
Second Left
Left Turn 400 384 16 345 402 446 5 444 461 MAX
Through 400 384 16 345 402 446 5 444 461 MAX
Right Turn 400 183 72 51 279 448 1 447 449 MAX
Second Right
U Turn
Second Left
Left Turn 80 242 61 149 358 817 15 788 840 AVG
Through 560 242 61 149 358 817 15 788 840 MAX
Right Turn 560 242 61 149 358 817 15 788 840 MAX
Second Right
U Turn
Second Left
Left Turn 100 21 2 17 23 143 61 97 312 MAX
Through 240 31 7 19 39 350 17 302 364 MAX
Right Turn 24 31 7 19 39 352 17 304 366 AVG
Second Right
NB
SB
EB
WB
Fehr & Peers 12/2/2016

Vissim Post‐Processor Richards Blvd ‐ Olive Dr Circulation
Average Results from 10 Runs L St Extension & Olive Dr Off‐Ramp Closure with Lincoln 40 ‐ Cumulative Conditions
Queue Length PM Peak Hour
Intersection 5 E St‐Richards Blvd/First St Signal
Storage Average Queue (ft) Maximum Queue (ft) Exceeds
Direction Movement (ft) Average Std. Dev. Minimum Maximum Average Std. Dev. Minimum Maximum Storage?
U Turn
Second Left
Left Turn 640 22 8 6 35 208 7 199 224 NO
Through 640 22 8 6 35 208 7 199 224 NO
Right Turn 180 22 8 6 35 208 7 199 224 MAX
Second Right
U Turn
Second Left
Left Turn
Through 400 37 10 29 63 222 51 177 343 NO
Right Turn 400 3 3 1 11 150 42 80 200 NO
Second Right
U Turn
Second Left
Left Turn 100 196 12 176 213 535 13 525 554 AVG
Through 220 196 12 176 213 535 13 525 554 MAX
Right Turn 200 208 18 189 247 506 13 497 525 AVG
Second Right
U Turn
Second Left
Left Turn 220 40 4 36 49 185 21 145 222 NO
Through 240 40 4 36 49 185 21 145 222 NO
Right Turn 240 40 4 36 49 185 21 145 222 NO
Second Right
NB
SB
EB
WB
Fehr & Peers 12/2/2016

Vissim Post‐Processor Richards Blvd ‐ Olive Dr Circulation
Average Results from 10 Runs L St Extension & Olive Dr Off‐Ramp Closure with Lincoln 40 ‐ Cumulative Conditions
Queue Length PM Peak Hour
Intersection 6 Richards Blvd/Olive Dr Signal
Storage Average Queue (ft) Maximum Queue (ft) Exceeds
Direction Movement (ft) Average Std. Dev. Minimum Maximum Average Std. Dev. Minimum Maximum Storage?
U Turn
Second Left
Left Turn 100 177 63 79 284 693 15 682 722 AVG
Through 1,540 195 73 88 313 687 14 674 714 NO
Right Turn 100 4 2 2 7 201 67 135 331 MAX
Second Right
U Turn
Second Left
Left Turn 640 7 3 4 14 204 252 42 682 NO
Through 640 285 45 227 363 759 9 747 780 MAX
Right Turn 640 55 18 29 89 338 8 327 355 NO
Second Right
U Turn
Second Left
Left Turn 600 10 2 8 14 83 18 65 123 NO
Through 600 38 2 34 41 200 29 167 253 NO
Right Turn 600 39 2 35 43 201 29 168 254 NO
Second Right
U Turn
Second Left
Left Turn 200 7 21 0 67 97 184 0 608 NO
Through 4,000 7 21 0 67 97 184 0 608 NO
Right Turn 4,000 7 21 0 67 97 184 0 608 NO
Second Right
NB
SB
EB
WB
Fehr & Peers 12/2/2016

Vissim Post‐Processor Richards Blvd ‐ Olive Dr Circulation
Average Results from 10 Runs L St Extension & Olive Dr Off‐Ramp Closure with Lincoln 40 ‐ Cumulative Conditions
Queue Length PM Peak Hour
Intersection 7 Richards Blvd/I‐80 WB Ramps Signal
Storage Average Queue (ft) Maximum Queue (ft) Exceeds
Direction Movement (ft) Average Std. Dev. Minimum Maximum Average Std. Dev. Minimum Maximum Storage?
U Turn
Second Left
Left Turn 800 46 7 39 62 276 47 231 375 NO
Through 800 113 113 12 359 781 176 360 914 NO
Right Turn
Second Right
U Turn
Second Left
Left Turn
Through 590 120 16 94 151 580 85 471 699 NO
Right Turn 200 23 10 10 45 348 81 235 464 MAX
Second Right
U Turn
Second Left
Left Turn
Through
Right Turn
Second Right
U Turn
Second Left
Left Turn 400 19 3 16 26 136 22 92 168 NO
Through
Right Turn 1,200 51 9 41 72 214 24 178 251 NO
Second Right
NB
SB
EB
WB
Fehr & Peers 12/2/2016
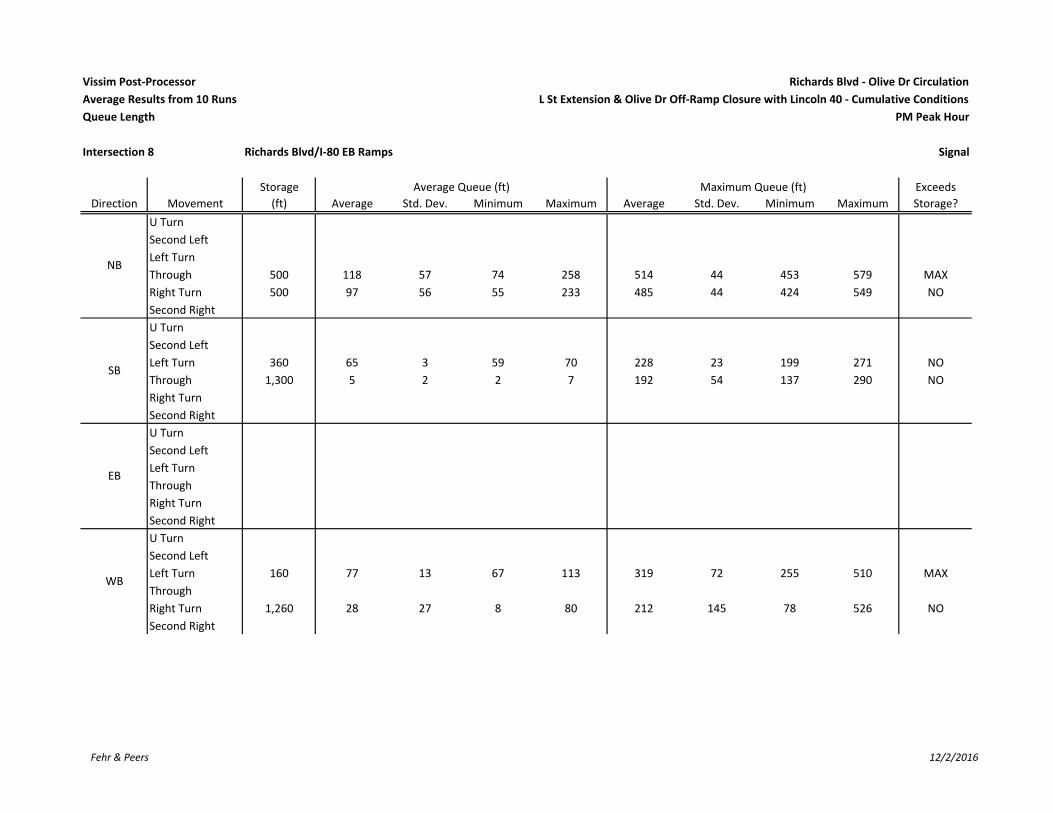
Vissim Post‐Processor Richards Blvd ‐ Olive Dr Circulation
Average Results from 10 Runs L St Extension & Olive Dr Off‐Ramp Closure with Lincoln 40 ‐ Cumulative Conditions
Queue Length PM Peak Hour
Intersection 8 Richards Blvd/I‐80 EB Ramps Signal
Storage Average Queue (ft) Maximum Queue (ft) Exceeds
Direction Movement (ft) Average Std. Dev. Minimum Maximum Average Std. Dev. Minimum Maximum Storage?
U Turn
Second Left
Left Turn
Through 500 118 57 74 258 514 44 453 579 MAX
Right Turn 500 97 56 55 233 485 44 424 549 NO
Second Right
U Turn
Second Left
Left Turn 360 65 3 59 70 228 23 199 271 NO
Through 1,300 5 2 2 7 192 54 137 290 NO
Right Turn
Second Right
U Turn
Second Left
Left Turn
Through
Right Turn
Second Right
U Turn
Second Left
Left Turn 160 77 13 67 113 319 72 255 510 MAX
Through
Right Turn 1,260 28 27 8 80 212 145 78 526 NO
Second Right
SB
EB
WB
NB
Fehr & Peers 12/2/2016

Vissim Post‐Processor Richards Blvd ‐ Olive Dr Circulation
Average Results from 10 Runs L St Extension & Olive Dr Off‐Ramp Closure with Lincoln 40 ‐ Cumulative Conditions
Queue Length PM Peak Hour
Intersection 9 Research Park Dr/Richards Blvd Signal
Storage Average Queue (ft) Maximum Queue (ft) Exceeds
Direction Movement (ft) Average Std. Dev. Minimum Maximum Average Std. Dev. Minimum Maximum Storage?
U Turn
Second Left
Left Turn 100 25 3 21 29 117 20 87 154 MAX
Through 620 4 1 3 6 82 20 66 133 NO
Right Turn
Second Right
U Turn
Second Left
Left Turn 120 15 7 10 32 195 180 69 637 MAX
Through 3,940 403 48 335 465 650 16 634 673 NO
Right Turn
Second Right
U Turn 440 84 18 62 129 446 73 362 548 MAX
Second Left
Left Turn 440 84 18 62 129 446 73 362 548 MAX
Through 440 63 6 56 73 463 72 351 548 MAX
Right Turn
Second Right
U Turn
Second Left
Left Turn 80 6 1 5 9 70 15 48 92 NO
Through 180 107 33 76 180 671 208 428 1,028 MAX
Right Turn
Second Right
WB
NB
SB
EB
Fehr & Peers 12/2/2016

Vissim Post-Processor Richards Blvd - Olive Dr Circulation
Average Results from 10 Runs Cumulative Conditions w/ L St Extension w/o I-80 IC Improvements
Volume and Delay by Movement AM Peak Hour
Intersection 1 K St/3rd St Signal
Demand Total Delay (sec/veh)
Direction Movement Volume (vph) Average Percent Average Std. Dev. LOS
Left Turn 159 161 101.3% 30.5 3.3 C
Through 2 2 75.0% 9.8 21.3 A
Right Turn 240 237 98.8% 9.0 1.4 A
Subtotal 401 400 99.7% 17.8 2.3 B
Left Turn 26 26 99.6% 30.1 7.9 C
Through 2 2 80.0% 10.2 21.8 B
Right Turn 17 18 103.5% 10.0 3.9 B
Subtotal 45 45 100.2% 22.5 6.6 C
Left Turn 20 21 105.0% 51.4 21.1 D
Through 94 94 99.9% 32.6 4.8 C
Right Turn 125 125 99.7% 17.7 6.4 B
Subtotal 239 240 100.2% 25.9 5.6 C
Left Turn 228 222 97.1% 19.9 3.8 B
Through 510 514 100.7% 3.4 1.4 A
Right Turn 12 9 71.7% 2.4 2.8 A
Subtotal 750 744 99.1% 8.6 2.7 A
Total 1,435 1,428 99.5% 14.7 2.2 B
53.4
Intersection 2 L St/3rd St Signal
Demand Total Delay (sec/veh)
Direction Movement Volume (vph) Average Percent Average Std. Dev. LOS
Left Turn 462 460 99.5% 37.2 5.6 D
Through 432 430 99.6% 11.3 1.9 B
Right Turn
Subtotal 894 890 99.6% 24.5 4.1 C
Left Turn
Through 194 197 101.6% 32.1 5.4 C
Right Turn 288 284 98.6% 18.6 3.0 B
Subtotal 482 481 99.8% 24.2 3.2 C
Left Turn 154 156 101.2% 26.5 3.4 C
Through
Right Turn 206 202 98.0% 9.6 2.5 A
Subtotal 360 358 99.3% 16.8 2.2 B
Left Turn
Through
Right Turn
Subtotal
Total 1,736 1,729 99.6% 22.7 2.2 C
30.1
NB
SB
EB
WB
Served Volume (vph)
NB
SB
EB
WB
Served Volume (vph)
Fehr & Peers 12/2/2016

Vissim Post-Processor Richards Blvd - Olive Dr Circulation
Average Results from 10 Runs Cumulative Conditions w/ L St Extension w/o I-80 IC Improvements
Volume and Delay by Movement AM Peak Hour
Intersection 3 L St/Olive Dr Signal
Demand Total Delay (sec/veh)
Direction Movement Volume (vph) Average Percent Average Std. Dev. LOS
Left Turn
Through
Right Turn
Subtotal
Left Turn
Through
Right Turn 400 398 99.5% 33.5 12.0 C
Subtotal 400 398 99.5% 33.5 12.0 C
Left Turn 178 179 100.4% 36.4 3.4 D
Through
Right Turn
Subtotal 178 179 100.4% 36.4 3.4 D
Left Turn
Through 173 170 98.0% 103.8 37.2 F
Right Turn 716 712 99.4% 102.7 38.4 F
Subtotal 889 881 99.1% 102.9 38.1 F
Total 1,467 1,458 99.4% 76.7 21.3 E
34.4
Intersection 4 D St/1st St Signal
Demand Total Delay (sec/veh)
Direction Movement Volume (vph) Average Percent Average Std. Dev. LOS
Left Turn 14 12 87.1% 34.8 17.0 C
Through 15 14 95.3% 38.4 13.6 D
Right Turn 29 31 107.6% 17.7 14.7 B
Subtotal 58 58 99.5% 28.3 9.9 C
Left Turn 75 74 99.1% 78.9 66.5 E
Through 22 22 97.7% 78.3 73.3 E
Right Turn 16 16 100.6% 41.8 70.0 D
Subtotal 113 112 99.0% 73.4 66.5 E
Left Turn 5 5 94.0% 60.8 67.3 E
Through 329 334 101.6% 43.7 54.2 D
Right Turn 33 35 104.8% 37.7 50.9 D
Subtotal 367 373 101.7% 43.8 53.6 D
Left Turn 36 39 109.4% 63.3 10.4 E
Through 537 532 99.0% 9.3 1.6 A
Right Turn 51 49 96.5% 9.4 5.8 A
Subtotal 624 620 99.4% 12.3 1.4 B
Total 1,162 1,163 100.1% 30.0 25.3 C
68.3
EB
WB
Served Volume (vph)
NB
SB
Served Volume (vph)
NB
SB
EB
WB
Fehr & Peers 12/2/2016

Vissim Post-Processor Richards Blvd - Olive Dr Circulation
Average Results from 10 Runs Cumulative Conditions w/ L St Extension w/o I-80 IC Improvements
Volume and Delay by Movement AM Peak Hour
Intersection 5 E St-Richards Blvd/1st St Signal
Demand Total Delay (sec/veh)
Direction Movement Volume (vph) Average Percent Average Std. Dev. LOS
Left Turn 515 506 98.3% 53.9 7.9 D
Through 63 62 98.9% 53.7 6.5 D
Right Turn 154 149 96.9% 24.4 6.8 C
Subtotal 732 718 98.1% 47.7 7.7 D
Left Turn 1 1 80.0% 7.5 23.7 A
Through 169 163 96.3% 39.2 6.9 D
Right Turn 11 13 121.8% 16.5 11.8 B
Subtotal 181 177 97.8% 37.7 6.8 D
Left Turn 9 11 120.0% 109.7 46.1 F
Through 73 74 101.9% 114.4 27.2 F
Right Turn 351 355 101.3% 15.6 1.8 B
Subtotal 433 441 101.8% 35.1 7.1 D
Left Turn 97 98 100.5% 45.1 6.4 D
Through 98 98 100.2% 42.8 6.7 D
Right Turn 3 3 100.0% 32.7 31.6 C
Subtotal 198 199 100.4% 44.2 6.1 D
Total 1,544 1,534 99.4% 42.6 5.6 D
113.4
Intersection 6 Richards Blvd/Olive Dr Signal
Demand Total Delay (sec/veh)
Direction Movement Volume (vph) Average Percent Average Std. Dev. LOS
Left Turn 504 489 97.0% 38.4 2.4 D
Through 587 567 96.6% 16.0 5.2 B
Right Turn 80 74 92.9% 3.2 0.8 A
Subtotal 1,171 1,130 96.5% 24.5 3.2 C
Left Turn 20 22 111.5% 70.0 20.9 E
Through 513 516 100.5% 38.1 8.3 D
Right Turn 84 78 92.3% 40.8 8.9 D
Subtotal 617 615 99.7% 39.3 7.8 D
Left Turn 42 45 107.4% 63.9 19.4 E
Through 40 39 98.3% 32.4 11.0 C
Right Turn 133 131 98.7% 11.6 1.7 B
Subtotal 215 216 100.3% 27.9 4.1 C
Left Turn 369 371 100.5% 108.6 57.2 F
Through 87 88 100.6% 81.3 43.7 F
Right Turn 103 98 94.9% 74.6 44.1 E
Subtotal 559 556 99.5% 99.1 51.3 F
Total 2,562 2,518 98.3% 45.4 10.8 D
93.3
WB
Served Volume (vph)
NB
SB
EB
WB
Served Volume (vph)
NB
SB
EB
Fehr & Peers 12/2/2016

Vissim Post-Processor Richards Blvd - Olive Dr Circulation
Average Results from 10 Runs Cumulative Conditions w/ L St Extension w/o I-80 IC Improvements
Volume and Delay by Movement AM Peak Hour
Intersection 7 Richards Blvd/I-80 WB Ramps Uncontrolled
Demand Total Delay (sec/veh)
Direction Movement Volume (vph) Average Percent Average Std. Dev. LOS
Left Turn
Through 632 595 94.1% 6.4 1.6 A
Right Turn 598 565 94.5% 5.6 1.1 A
Subtotal 1,230 1,160 94.3% 6.0 1.3 A
Left Turn
Through 692 692 99.9% 0.8 0.2 A
Right Turn 327 325 99.4% 1.7 0.2 A
Subtotal 1,019 1,017 99.8% 1.1 0.2 A
Left Turn
Through
Right Turn 163 163 99.9% 1.7 0.9 A
Subtotal 163 163 99.9% 1.7 0.9 A
Left Turn
Through
Right Turn 532 537 100.8% 30.0 16.0 D
Subtotal 532 537 100.8% 30.0 16.0 D
Total 2,944 2,876 97.7% 8.6 3.0 A
19.5
Intersection 8 Richards Blvd/I-80 EB Ramps Signal
Demand Total Delay (sec/veh)
Direction Movement Volume (vph) Average Percent Average Std. Dev. LOS
Left Turn
Through 1,020 968 94.9% 29.8 6.3 C
Right Turn 147 142 96.5% 29.0 6.4 C
Subtotal 1,167 1,110 95.1% 29.7 6.1 C
Left Turn 337 335 99.3% 38.1 8.9 D
Through 518 513 99.1% 13.7 4.7 B
Right Turn
Subtotal 855 848 99.2% 23.6 3.9 C
Left Turn
Through
Right Turn
Subtotal
Left Turn 718 656 91.3% 135.2 40.5 F
Through
Right Turn 211 193 91.7% 108.4 26.3 F
Subtotal 929 849 91.4% 129.2 37.6 F
Total 2,951 2,807 95.1% 56.9 7.7 E
84.1
NB
SB
EB
WB
Served Volume (vph)
NB
SB
EB
WB
Served Volume (vph)
Fehr & Peers 12/2/2016
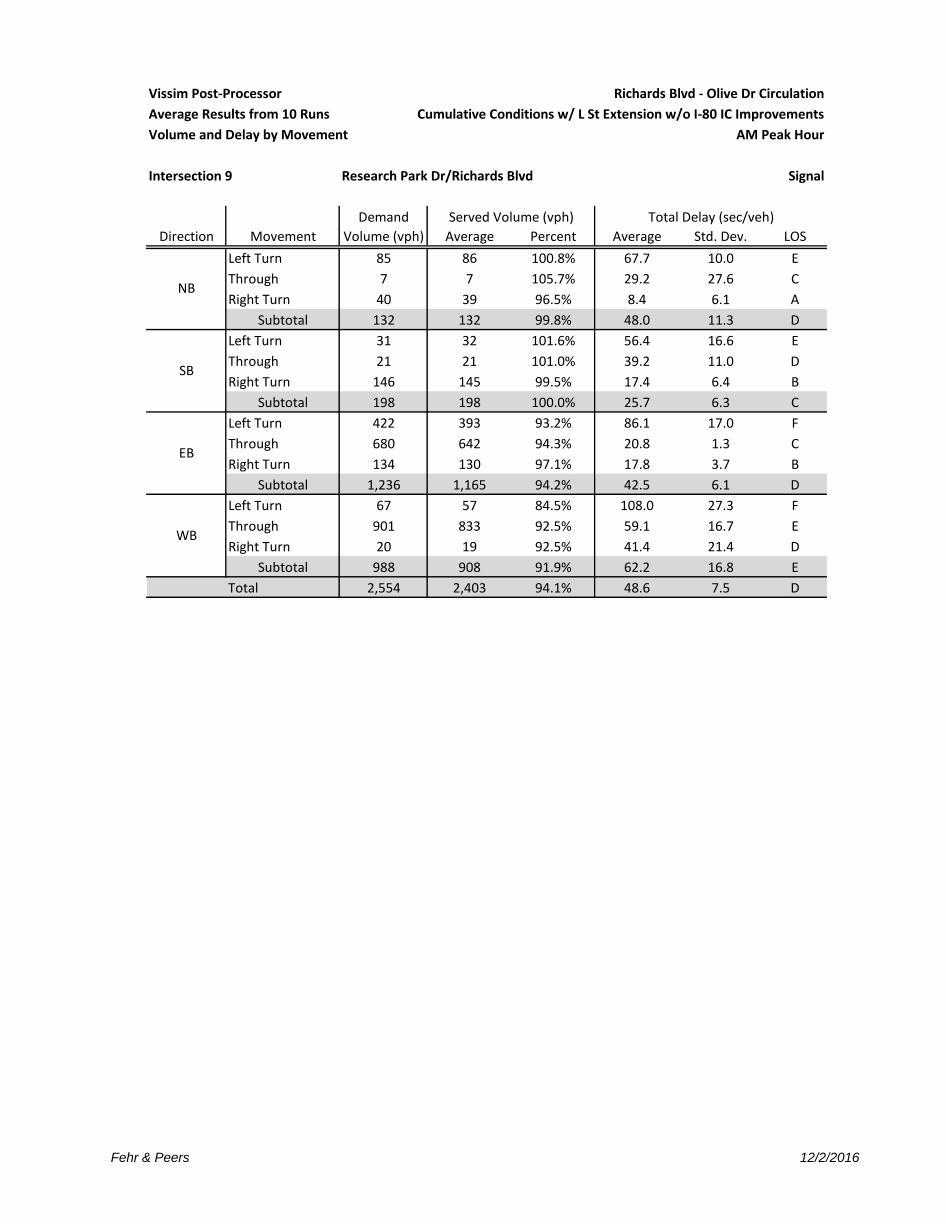
Vissim Post-Processor Richards Blvd - Olive Dr Circulation
Average Results from 10 Runs Cumulative Conditions w/ L St Extension w/o I-80 IC Improvements
Volume and Delay by Movement AM Peak Hour
Intersection 9 Research Park Dr/Richards Blvd Signal
Demand Total Delay (sec/veh)
Direction Movement Volume (vph) Average Percent Average Std. Dev. LOS
Left Turn 85 86 100.8% 67.7 10.0 E
Through 7 7 105.7% 29.2 27.6 C
Right Turn 40 39 96.5% 8.4 6.1 A
Subtotal 132 132 99.8% 48.0 11.3 D
Left Turn 31 32 101.6% 56.4 16.6 E
Through 21 21 101.0% 39.2 11.0 D
Right Turn 146 145 99.5% 17.4 6.4 B
Subtotal 198 198 100.0% 25.7 6.3 C
Left Turn 422 393 93.2% 86.1 17.0 F
Through 680 642 94.3% 20.8 1.3 C
Right Turn 134 130 97.1% 17.8 3.7 B
Subtotal 1,236 1,165 94.2% 42.5 6.1 D
Left Turn 67 57 84.5% 108.0 27.3 F
Through 901 833 92.5% 59.1 16.7 E
Right Turn 20 19 92.5% 41.4 21.4 D
Subtotal 988 908 91.9% 62.2 16.8 E
Total 2,554 2,403 94.1% 48.6 7.5 D
92.6
SB
EB
WB
Served Volume (vph)
NB
Fehr & Peers 12/2/2016

Vissim Post-Processor Richards Blvd - Olive Dr Circulation
Average Results from 10 Runs Cumulative Conditions w/ L St Extension w/o I-80 IC Improvements
Volume and Delay by Movement PM Peak Hour
Intersection 1 K St/3rd St Signal
Demand Total Delay (sec/veh)
Direction Movement Volume (vph) Average Percent Average Std. Dev. LOS
Left Turn 234 238 101.5% 34.3 5.7 C
Through 4 3 70.0% 22.4 22.5 C
Right Turn 243 242 99.5% 17.2 7.9 B
Subtotal 481 482 100.2% 25.6 6.5 C
Left Turn 57 57 100.5% 36.7 13.9 D
Through 4 4 107.5% 17.0 18.8 B
Right Turn 12 11 94.2% 10.5 10.6 B
Subtotal 73 73 99.9% 33.3 14.8 C
Left Turn 13 12 90.8% 156.9 45.1 F
Through 169 155 91.9% 123.4 21.1 F
Right Turn 268 252 94.1% 108.7 19.8 F
Subtotal 450 419 93.2% 115.4 19.8 F
Left Turn 430 413 96.1% 29.2 2.0 C
Through 351 346 98.5% 5.5 1.4 A
Right Turn 51 47 92.5% 3.5 1.7 A
Subtotal 832 806 96.9% 17.6 1.4 B
Total 1,836 1,780 97.0% 43.4 4.0 D
165.6
Intersection 2 L St/3rd St Signal
Demand Total Delay (sec/veh)
Direction Movement Volume (vph) Average Percent Average Std. Dev. LOS
Left Turn 368 368 99.9% 50.7 11.6 D
Through 498 480 96.4% 17.7 4.2 B
Right Turn
Subtotal 866 848 97.9% 32.5 7.9 C
Left Turn
Through 203 195 95.9% 73.3 6.9 E
Right Turn 464 437 94.3% 64.0 7.2 E
Subtotal 667 632 94.8% 67.1 6.6 E
Left Turn 212 209 98.7% 27.6 3.9 C
Through
Right Turn 257 246 95.9% 10.0 2.3 B
Subtotal 469 456 97.1% 18.5 2.6 B
Left Turn
Through
Right Turn
Subtotal
Total 2,002 1,935 96.7% 40.2 3.5 D
53.8
Served Volume (vph)
NB
SB
EB
WB
Served Volume (vph)
NB
SB
EB
WB
Fehr & Peers 12/3/2016

Vissim Post-Processor Richards Blvd - Olive Dr Circulation
Average Results from 10 Runs Cumulative Conditions w/ L St Extension w/o I-80 IC Improvements
Volume and Delay by Movement PM Peak Hour
Intersection 3 L St/Olive Dr Signal
Demand Total Delay (sec/veh)
Direction Movement Volume (vph) Average Percent Average Std. Dev. LOS
Left Turn
Through
Right Turn
Subtotal
Left Turn
Through
Right Turn 460 441 95.8% 31.1 10.9 C
Subtotal 460 441 95.8% 31.1 10.9 C
Left Turn 374 362 96.7% 107.6 62.1 F
Through
Right Turn
Subtotal 374 362 96.7% 107.6 62.1 F
Left Turn
Through 158 164 103.7% 62.1 52.5 E
Right Turn 492 485 98.6% 59.7 48.8 E
Subtotal 650 649 99.8% 60.4 49.9 E
Total 1,484 1,451 97.8% 64.0 35.3 E
61.8
Intersection 4 D St/1st St Signal
Demand Total Delay (sec/veh)
Direction Movement Volume (vph) Average Percent Average Std. Dev. LOS
Left Turn 30 28 94.0% 38.0 10.0 D
Through 45 45 99.8% 52.3 12.9 D
Right Turn 64 65 101.4% 19.1 4.4 B
Subtotal 139 138 99.3% 33.6 7.0 C
Left Turn 204 202 99.2% 153.1 59.6 F
Through 41 40 97.3% 146.2 61.4 F
Right Turn 34 31 89.7% 128.4 59.1 F
Subtotal 279 273 97.8% 148.9 57.9 F
Left Turn 45 34 75.3% 323.7 67.7 F
Through 410 312 76.2% 285.0 30.8 F
Right Turn 59 44 73.9% 294.4 72.8 F
Subtotal 514 390 75.9% 289.3 36.9 F
Left Turn 78 67 85.4% 72.1 23.8 E
Through 418 405 96.9% 18.3 3.9 B
Right Turn 49 45 92.2% 11.9 4.2 B
Subtotal 545 517 94.9% 24.7 6.9 C
Total 1,477 1,318 89.2% 128.1 13.7 F
219.7
SB
EB
WB
Served Volume (vph)
NB
SB
Served Volume (vph)
NB
EB
WB
Fehr & Peers 12/3/2016

Vissim Post-Processor Richards Blvd - Olive Dr Circulation
Average Results from 10 Runs Cumulative Conditions w/ L St Extension w/o I-80 IC Improvements
Volume and Delay by Movement PM Peak Hour
Intersection 5 E St-Richards Blvd/1st St Signal
Demand Total Delay (sec/veh)
Direction Movement Volume (vph) Average Percent Average Std. Dev. LOS
Left Turn 370 347 93.8% 85.4 12.7 F
Through 199 197 98.8% 83.0 9.3 F
Right Turn 101 99 98.4% 50.0 8.7 D
Subtotal 670 643 96.0% 79.4 10.8 E
Left Turn 6 6 105.0% 18.6 20.6 B
Through 159 159 99.9% 33.1 4.5 C
Right Turn 23 22 96.1% 24.8 9.6 C
Subtotal 188 187 99.6% 31.9 5.0 C
Left Turn 10 9 91.0% 93.9 36.2 F
Through 98 85 86.8% 110.5 29.9 F
Right Turn 570 486 85.3% 24.3 4.9 C
Subtotal 678 580 85.6% 38.5 5.7 D
Left Turn 116 122 104.7% 37.5 8.5 D
Through 152 146 95.8% 48.4 12.8 D
Right Turn 7 6 85.7% 12.4 18.6 B
Subtotal 275 273 99.3% 43.3 9.2 D
Total 1,811 1,684 93.0% 54.1 5.8 D
116.3
Intersection 6 Richards Blvd/Olive Dr Signal
Demand Total Delay (sec/veh)
Direction Movement Volume (vph) Average Percent Average Std. Dev. LOS
Left Turn 157 131 83.4% 47.7 5.7 D
Through 523 506 96.7% 42.0 11.3 D
Right Turn 199 181 91.1% 3.7 1.7 A
Subtotal 879 818 93.1% 34.7 6.9 C
Left Turn 29 26 90.7% 76.5 23.0 E
Through 763 696 91.2% 36.7 7.4 D
Right Turn 53 48 90.8% 35.5 9.3 D
Subtotal 845 770 91.1% 38.1 7.5 D
Left Turn 43 41 94.7% 118.7 41.6 F
Through 82 80 97.3% 38.2 7.2 D
Right Turn 409 412 100.7% 15.4 2.4 B
Subtotal 534 532 99.7% 26.2 4.2 C
Left Turn 382 360 94.2% 134.7 66.1 F
Through 78 73 93.2% 119.7 65.5 F
Right Turn 104 100 95.9% 123.4 70.8 F
Subtotal 564 532 94.3% 131.5 62.4 F
Total 2,822 2,653 94.0% 52.7 12.8 D
73.5
WB
Served Volume (vph)
NB
SB
EB
WB
Served Volume (vph)
NB
SB
EB
Fehr & Peers 12/3/2016

Vissim Post-Processor Richards Blvd - Olive Dr Circulation
Average Results from 10 Runs Cumulative Conditions w/ L St Extension w/o I-80 IC Improvements
Volume and Delay by Movement PM Peak Hour
Intersection 7 Richards Blvd/I-80 WB Ramps Uncontrolled
Demand Total Delay (sec/veh)
Direction Movement Volume (vph) Average Percent Average Std. Dev. LOS
Left Turn
Through 704 664 94.2% 21.6 9.8 C
Right Turn 613 611 99.7% 7.0 1.4 A
Subtotal 1,317 1,275 96.8% 14.7 5.7 B
Left Turn
Through 1,228 1,169 95.2% 1.7 0.3 A
Right Turn 466 439 94.1% 2.3 0.5 A
Subtotal 1,694 1,608 94.9% 1.9 0.3 A
Left Turn
Through
Right Turn 48 51 106.9% 3.2 1.0 A
Subtotal 48 51 106.9% 3.2 1.0 A
Left Turn
Through
Right Turn 177 167 94.1% 146.3 151.9 F
Subtotal 177 167 94.1% 146.3 151.9 F
Total 3,236 3,100 95.8% 13.5 7.8 B
23.3
Intersection 8 Richards Blvd/I-80 WB Ramps Signal
Demand Total Delay (sec/veh)
Direction Movement Volume (vph) Average Percent Average Std. Dev. LOS
Left Turn
Through 1,173 1,174 100.1% 15.9 2.0 B
Right Turn 127 123 96.8% 21.3 3.4 C
Subtotal 1,300 1,297 99.7% 16.4 2.0 B
Left Turn 500 444 88.8% 28.9 1.9 C
Through 776 769 99.1% 7.9 1.1 A
Right Turn
Subtotal 1,276 1,213 95.1% 15.5 1.2 B
Left Turn
Through
Right Turn
Subtotal
Left Turn 742 520 70.0% 200.0 9.4 F
Through
Right Turn 143 102 71.0% 164.3 9.1 F
Subtotal 885 621 70.2% 194.1 9.7 F
Total 3,461 3,131 90.5% 52.6 2.3 D
200.8
NB
SB
EB
WB
Served Volume (vph)
NB
SB
EB
WB
Served Volume (vph)
Fehr & Peers 12/3/2016
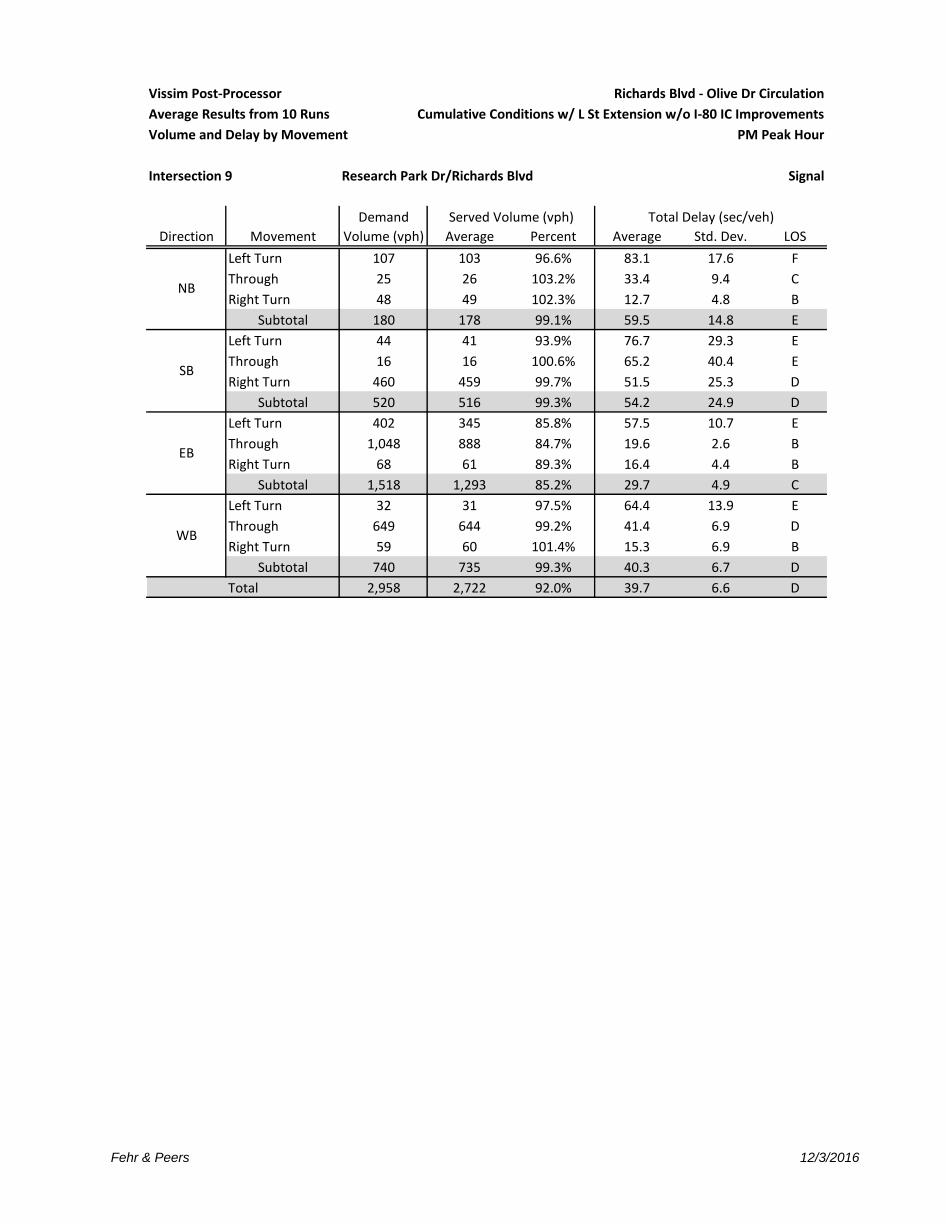
Vissim Post-Processor Richards Blvd - Olive Dr Circulation
Average Results from 10 Runs Cumulative Conditions w/ L St Extension w/o I-80 IC Improvements
Volume and Delay by Movement PM Peak Hour
Intersection 9 Research Park Dr/Richards Blvd Signal
Demand Total Delay (sec/veh)
Direction Movement Volume (vph) Average Percent Average Std. Dev. LOS
Left Turn 107 103 96.6% 83.1 17.6 F
Through 25 26 103.2% 33.4 9.4 C
Right Turn 48 49 102.3% 12.7 4.8 B
Subtotal 180 178 99.1% 59.5 14.8 E
Left Turn 44 41 93.9% 76.7 29.3 E
Through 16 16 100.6% 65.2 40.4 E
Right Turn 460 459 99.7% 51.5 25.3 D
Subtotal 520 516 99.3% 54.2 24.9 D
Left Turn 402 345 85.8% 57.5 10.7 E
Through 1,048 888 84.7% 19.6 2.6 B
Right Turn 68 61 89.3% 16.4 4.4 B
Subtotal 1,518 1,293 85.2% 29.7 4.9 C
Left Turn 32 31 97.5% 64.4 13.9 E
Through 649 644 99.2% 41.4 6.9 D
Right Turn 59 60 101.4% 15.3 6.9 B
Subtotal 740 735 99.3% 40.3 6.7 D
Total 2,958 2,722 92.0% 39.7 6.6 D
65.3
Served Volume (vph)
NB
SB
EB
WB
Fehr & Peers 12/3/2016

Vissim Post-Processor Richards Blvd - Olive Dr Circulation
Average Results from 10 Runs Cumulative Conditions w/ L St Extension w/o I-80 IC Improvements
Queue Length AM Peak Hour
Intersection 1 K St/3rd St Signal
Storage Average Queue (ft) Maximum Queue (ft) Exceeds
Direction Movement (ft) Average Std. Dev. Minimum Maximum Average Std. Dev. Minimum Maximum Storage?
U Turn
Second Left
Left Turn 420 32 4 24 38 236 68 161 394 NO
Through 420 32 4 24 38 236 68 161 394 NO
Right Turn 150 33 4 25 39 237 68 162 395 MAX
Second Right
U Turn
Second Left
Left Turn 420 4 1 2 6 72 19 45 113 NO
Through 3,700 4 1 2 6 72 19 45 113 NO
Right Turn 420 5 1 3 6 73 19 47 115 NO
Second Right
U Turn
Second Left
Left Turn 100 1 1 0 2 88 29 59 138 NO
Through 250 1 1 0 2 88 29 59 138 NO
Right Turn 250 1 1 0 2 88 29 59 138 NO
Second Right
U Turn
Second Left
Left Turn 100 2 1 0 5 136 63 40 188 MAX
Through 250 2 1 0 5 136 63 40 188 NO
Right Turn 250 2 1 0 5 136 63 40 188 NO
Second Right
NB
SB
EB
WB
Fehr & Peers 12/2/2016

Vissim Post-Processor Richards Blvd - Olive Dr Circulation
Average Results from 10 Runs Cumulative Conditions w/ L St Extension w/o I-80 IC Improvements
Queue Length AM Peak Hour
Intersection 2 L St/3rd St Signal
Storage Average Queue (ft) Maximum Queue (ft) Exceeds
Direction Movement (ft) Average Std. Dev. Minimum Maximum Average Std. Dev. Minimum Maximum Storage?
U Turn
Second Left
Left Turn 150 77 11 64 91 506 4 503 516 MAX
Through 490 77 11 64 91 506 4 503 516 MAX
Right Turn
Second Right
U Turn
Second Left
Left Turn
Through 420 34 8 21 46 340 76 236 444 NO
Right Turn 420 12 4 5 19 282 57 184 342 NO
Second Right
U Turn
Second Left
Left Turn 125 25 3 22 31 222 58 155 300 MAX
Through
Right Turn 250 26 3 23 32 223 58 156 300 NO
Second Right
U Turn
Second Left
Left Turn
Through
Right Turn
Second Right
NB
SB
EB
WB
Fehr & Peers 12/2/2016

Vissim Post-Processor Richards Blvd - Olive Dr Circulation
Average Results from 10 Runs Cumulative Conditions w/ L St Extension w/o I-80 IC Improvements
Queue Length AM Peak Hour
Intersection 3 L St/Olive Dr Signal
Storage Average Queue (ft) Maximum Queue (ft) Exceeds
Direction Movement (ft) Average Std. Dev. Minimum Maximum Average Std. Dev. Minimum Maximum Storage?
U Turn
Second Left
Left Turn
Through
Right Turn
Second Right
U Turn
Second Left
Left Turn
Through
Right Turn 375 77 15 46 97 436 96 289 567 MAX
Second Right
U Turn
Second Left
Left Turn 750 31 4 24 36 190 20 160 229 NO
Through
Right Turn
Second Right
U Turn
Second Left
Left Turn
Through 1,400 485 224 127 878 1,605 150 1,195 1,695 MAX
Right Turn 1,400 490 224 132 882 1,603 146 1,203 1,695 MAX
Second Right
SB
EB
WB
NB
Fehr & Peers 12/2/2016

Vissim Post-Processor Richards Blvd - Olive Dr Circulation
Average Results from 10 Runs Cumulative Conditions w/ L St Extension w/o I-80 IC Improvements
Queue Length AM Peak Hour
Intersection 4 D St/1st St Signal
Storage Average Queue (ft) Maximum Queue (ft) Exceeds
Direction Movement (ft) Average Std. Dev. Minimum Maximum Average Std. Dev. Minimum Maximum Storage?
U Turn
Second Left
Left Turn 100 5 1 4 7 64 21 43 113 NO
Through 100 5 1 4 7 64 21 43 113 NO
Right Turn 400 1 1 0 4 50 5 45 61 NO
Second Right
U Turn
Second Left
Left Turn 400 47 26 22 102 268 124 145 443 NO
Through 400 47 26 22 102 268 124 145 443 NO
Right Turn 400 1 2 0 5 60 55 24 204 NO
Second Right
U Turn
Second Left
Left Turn 80 12 18 1 61 339 186 119 778 MAX
Through 560 12 18 1 61 339 186 119 778 NO
Right Turn 560 12 18 1 61 339 186 119 778 NO
Second Right
U Turn
Second Left
Left Turn 100 13 2 10 16 89 26 63 146 NO
Through 240 31 9 21 50 362 7 354 376 MAX
Right Turn 24 31 9 21 50 363 7 355 378 AVG
Second Right
NB
SB
EB
WB
Fehr & Peers 12/2/2016

Vissim Post-Processor Richards Blvd - Olive Dr Circulation
Average Results from 10 Runs Cumulative Conditions w/ L St Extension w/o I-80 IC Improvements
Queue Length AM Peak Hour
Intersection 5 E St-Richards Blvd/1st St Signal
Storage Average Queue (ft) Maximum Queue (ft) Exceeds
Direction Movement (ft) Average Std. Dev. Minimum Maximum Average Std. Dev. Minimum Maximum Storage?
U Turn
Second Left
Left Turn 640 11 5 5 21 200 5 191 212 NO
Through 640 11 5 5 21 200 5 191 212 NO
Right Turn 180 11 5 5 21 200 5 191 212 MAX
Second Right
U Turn
Second Left
Left Turn
Through 400 40 3 35 45 254 38 202 323 NO
Right Turn 400 5 3 1 9 195 56 89 282 NO
Second Right
U Turn
Second Left
Left Turn 100 85 17 61 108 509 25 443 525 MAX
Through 220 85 17 61 108 509 25 443 525 MAX
Right Turn 200 49 14 32 72 469 49 346 497 MAX
Second Right
U Turn
Second Left
Left Turn 220 30 3 26 34 165 26 125 210 NO
Through 240 30 3 26 34 165 26 125 210 NO
Right Turn 240 30 3 26 34 165 26 125 210 NO
Second Right
NB
SB
EB
WB
Fehr & Peers 12/2/2016

Vissim Post-Processor Richards Blvd - Olive Dr Circulation
Average Results from 10 Runs Cumulative Conditions w/ L St Extension w/o I-80 IC Improvements
Queue Length AM Peak Hour
Intersection 6 Richards Blvd/Olive Dr Signal
Storage Average Queue (ft) Maximum Queue (ft) Exceeds
Direction Movement (ft) Average Std. Dev. Minimum Maximum Average Std. Dev. Minimum Maximum Storage?
U Turn
Second Left
Left Turn 100 92 6 86 108 351 47 279 442 MAX
Through 1,540 57 8 48 77 340 46 272 434 NO
Right Turn 100 0 0 0 0 30 13 21 50 NO
Second Right
U Turn
Second Left
Left Turn 590 9 6 4 24 196 199 43 640 NO
Through 590 145 21 104 168 730 43 622 777 MAX
Right Turn 250 12 6 2 21 303 45 201 356 MAX
Second Right
U Turn
Second Left
Left Turn 225 13 2 10 17 83 15 65 110 NO
Through 600 12 1 11 13 93 11 78 118 NO
Right Turn 225 12 1 12 14 95 11 80 119 NO
Second Right
U Turn
Second Left
Left Turn 200 60 75 7 209 564 303 182 1,126 MAX
Through 2,000 60 75 7 209 564 303 182 1,126 NO
Right Turn 2,000 60 75 7 209 564 303 182 1,126 NO
Second Right
NB
SB
EB
WB
Fehr & Peers 12/2/2016

Vissim Post-Processor Richards Blvd - Olive Dr Circulation
Average Results from 10 Runs Cumulative Conditions w/ L St Extension w/o I-80 IC Improvements
Queue Length AM Peak Hour
Intersection 7 Richards Blvd/I-80 WB Ramps Uncontrolled
Storage Average Queue (ft) Maximum Queue (ft) Exceeds
Direction Movement (ft) Average Std. Dev. Minimum Maximum Average Std. Dev. Minimum Maximum Storage?
U Turn
Second Left
Left Turn
Through 900 2 1 1 3 112 40 58 170 NO
Right Turn
Second Right
U Turn
Second Left
Left Turn
Through 250 1 0 0 1 78 22 34 112 NO
Right Turn
Second Right
U Turn
Second Left
Left Turn
Through
Right Turn 600 0 0 0 0 21 24 0 63 NO
Second Right
U Turn
Second Left
Left Turn
Through
Right Turn 1,400 80 45 41 183 646 292 431 1,224 NO
Second Right
NB
SB
EB
WB
Fehr & Peers 12/2/2016

Vissim Post-Processor Richards Blvd - Olive Dr Circulation
Average Results from 10 Runs Cumulative Conditions w/ L St Extension w/o I-80 IC Improvements
Queue Length AM Peak Hour
Intersection 8 Richards Blvd/I-80 EB Ramps Signal
Storage Average Queue (ft) Maximum Queue (ft) Exceeds
Direction Movement (ft) Average Std. Dev. Minimum Maximum Average Std. Dev. Minimum Maximum Storage?
U Turn
Second Left
Left Turn
Through 500 116 14 97 135 461 48 399 523 NO
Right Turn 500 94 13 76 112 432 48 369 493 NO
Second Right
U Turn
Second Left
Left Turn 360 45 8 37 60 190 36 138 248 NO
Through 1,300 17 2 15 21 175 16 139 196 NO
Right Turn
Second Right
U Turn
Second Left
Left Turn
Through
Right Turn
Second Right
U Turn
Second Left
Left Turn 160 896 90 717 1,000 1,284 12 1,266 1,304 AVG
Through
Right Turn 1,260 13 1 10 15 165 31 121 204 NO
Second Right
SB
EB
WB
NB
Fehr & Peers 12/2/2016

Vissim Post-Processor Richards Blvd - Olive Dr Circulation
Average Results from 10 Runs Cumulative Conditions w/ L St Extension w/o I-80 IC Improvements
Queue Length AM Peak Hour
Intersection 9 Research Park Dr/Richards Blvd Signal
Storage Average Queue (ft) Maximum Queue (ft) Exceeds
Direction Movement (ft) Average Std. Dev. Minimum Maximum Average Std. Dev. Minimum Maximum Storage?
U Turn
Second Left
Left Turn 100 29 4 23 35 131 35 91 205 MAX
Through 620 2 1 0 3 69 17 47 94 NO
Right Turn
Second Right
U Turn
Second Left
Left Turn 120 9 1 7 12 81 16 65 113 NO
Through 3,940 13 4 6 22 188 59 111 311 NO
Right Turn
Second Right
U Turn 440 223 27 194 274 564 12 550 586 MAX
Second Left
Left Turn 440 223 27 194 274 564 12 550 586 MAX
Through 440 48 3 41 52 297 73 249 502 NO
Right Turn
Second Right
U Turn
Second Left
Left Turn 80 103 72 40 272 992 243 430 1,145 AVG
Through 180 250 74 134 347 1,065 140 764 1,145 AVG
Right Turn
Second Right
WB
NB
SB
EB
Fehr & Peers 12/2/2016

Vissim Post-Processor Richards Blvd - Olive Dr Circulation
Average Results from 10 Runs Cumulative Conditions w/ L St Extension w/o I-80 IC Improvements
Queue Length PM Peak Hour
Intersection 1 K St/3rd St Signal
Storage Average Queue (ft) Maximum Queue (ft) Exceeds
Direction Movement (ft) Average Std. Dev. Minimum Maximum Average Std. Dev. Minimum Maximum Storage?
U Turn
Second Left
Left Turn 420 52 8 46 70 383 105 264 601 NO
Through 420 52 8 46 70 383 105 264 601 NO
Right Turn 150 53 8 47 71 384 105 265 602 MAX
Second Right
U Turn
Second Left
Left Turn 420 10 1 8 12 101 16 87 138 NO
Through 3,700 10 1 8 12 101 16 87 138 NO
Right Turn 420 10 1 8 12 102 16 88 140 NO
Second Right
U Turn
Second Left
Left Turn 100 210 15 177 226 320 10 313 338 AVG
Through 250 210 15 177 226 320 10 313 338 MAX
Right Turn 250 210 15 177 226 320 10 313 338 MAX
Second Right
U Turn
Second Left
Left Turn 100 20 2 17 23 191 7 187 211 MAX
Through 250 20 2 17 23 191 7 187 211 NO
Right Turn 250 20 2 17 23 191 7 187 211 NO
Second Right
NB
SB
EB
WB
Fehr & Peers 12/3/2016

Vissim Post-Processor Richards Blvd - Olive Dr Circulation
Average Results from 10 Runs Cumulative Conditions w/ L St Extension w/o I-80 IC Improvements
Queue Length PM Peak Hour
Intersection 2 L St/3rd St Signal
Storage Average Queue (ft) Maximum Queue (ft) Exceeds
Direction Movement (ft) Average Std. Dev. Minimum Maximum Average Std. Dev. Minimum Maximum Storage?
U Turn
Second Left
Left Turn 150 93 19 71 121 515 11 504 528 MAX
Through 490 93 19 71 121 515 11 504 528 MAX
Right Turn
Second Right
U Turn
Second Left
Left Turn
Through 420 99 14 74 123 451 10 442 469 MAX
Right Turn 420 178 16 150 202 355 10 342 369 NO
Second Right
U Turn
Second Left
Left Turn 125 42 10 33 65 326 16 300 355 MAX
Through
Right Turn 250 42 10 34 66 327 16 301 356 MAX
Second Right
U Turn
Second Left
Left Turn
Through
Right Turn
Second Right
NB
SB
EB
WB
Fehr & Peers 12/3/2016

Vissim Post-Processor Richards Blvd - Olive Dr Circulation
Average Results from 10 Runs Cumulative Conditions w/ L St Extension w/o I-80 IC Improvements
Queue Length PM Peak Hour
Intersection 3 L St/Olive Dr Signal
Storage Average Queue (ft) Maximum Queue (ft) Exceeds
Direction Movement (ft) Average Std. Dev. Minimum Maximum Average Std. Dev. Minimum Maximum Storage?
U Turn
Second Left
Left Turn
Through
Right Turn
Second Right
U Turn
Second Left
Left Turn
Through
Right Turn 375 89 23 57 126 432 89 327 573 MAX
Second Right
U Turn
Second Left
Left Turn 750 207 107 101 482 705 295 443 1,314 NO
Through
Right Turn
Second Right
U Turn
Second Left
Left Turn
Through 1,400 163 149 42 556 896 327 485 1,658 NO
Right Turn 1,400 167 149 46 561 903 326 492 1,658 NO
Second Right
NB
SB
EB
WB
Fehr & Peers 12/3/2016

Vissim Post-Processor Richards Blvd - Olive Dr Circulation
Average Results from 10 Runs Cumulative Conditions w/ L St Extension w/o I-80 IC Improvements
Queue Length PM Peak Hour
Intersection 4 D St/1st St Signal
Storage Average Queue (ft) Maximum Queue (ft) Exceeds
Direction Movement (ft) Average Std. Dev. Minimum Maximum Average Std. Dev. Minimum Maximum Storage?
U Turn
Second Left
Left Turn 100 17 2 13 20 144 23 100 178 MAX
Through 100 17 2 13 20 144 23 100 178 MAX
Right Turn 400 4 1 2 6 75 20 47 120 NO
Second Right
U Turn
Second Left
Left Turn 400 219 63 123 300 449 12 443 481 MAX
Through 400 219 63 123 300 449 12 443 481 MAX
Right Turn 400 32 23 1 65 368 126 146 447 NO
Second Right
U Turn
Second Left
Left Turn 80 348 38 291 407 823 16 786 845 AVG
Through 560 348 38 291 407 823 16 786 845 MAX
Right Turn 560 348 38 291 407 823 16 786 845 MAX
Second Right
U Turn
Second Left
Left Turn 100 28 7 19 37 232 115 107 358 MAX
Through 240 76 20 39 104 356 7 351 373 MAX
Right Turn 24 77 20 39 105 358 7 353 374 AVG
Second Right
NB
SB
EB
WB
Fehr & Peers 12/3/2016

Vissim Post-Processor Richards Blvd - Olive Dr Circulation
Average Results from 10 Runs Cumulative Conditions w/ L St Extension w/o I-80 IC Improvements
Queue Length PM Peak Hour
Intersection 5 E St-Richards Blvd/1st St Signal
Storage Average Queue (ft) Maximum Queue (ft) Exceeds
Direction Movement (ft) Average Std. Dev. Minimum Maximum Average Std. Dev. Minimum Maximum Storage?
U Turn
Second Left
Left Turn 640 38 17 6 67 212 10 202 235 NO
Through 640 38 17 6 67 212 10 202 235 NO
Right Turn 180 38 17 6 67 212 10 202 235 MAX
Second Right
U Turn
Second Left
Left Turn
Through 400 29 3 25 33 205 34 160 276 NO
Right Turn 400 3 1 1 4 149 39 92 204 NO
Second Right
U Turn
Second Left
Left Turn 100 219 17 178 238 532 11 525 553 AVG
Through 220 219 17 178 238 532 11 525 553 MAX
Right Turn 200 228 34 169 267 504 11 497 525 AVG
Second Right
U Turn
Second Left
Left Turn 220 32 3 27 38 200 44 152 298 NO
Through 240 32 3 27 38 200 44 152 298 NO
Right Turn 240 32 3 27 38 200 44 152 298 NO
Second Right
NB
SB
EB
WB
Fehr & Peers 12/3/2016

Vissim Post-Processor Richards Blvd - Olive Dr Circulation
Average Results from 10 Runs Cumulative Conditions w/ L St Extension w/o I-80 IC Improvements
Queue Length PM Peak Hour
Intersection 6 Richards Blvd/Olive Dr Signal
Storage Average Queue (ft) Maximum Queue (ft) Exceeds
Direction Movement (ft) Average Std. Dev. Minimum Maximum Average Std. Dev. Minimum Maximum Storage?
U Turn
Second Left
Left Turn 100 101 35 60 159 541 151 353 736 AVG
Through 1,540 129 47 58 204 561 147 346 729 NO
Right Turn 100 1 0 1 2 90 52 49 197 NO
Second Right
U Turn
Second Left
Left Turn 590 13 4 5 19 342 227 45 749 NO
Through 590 177 24 149 217 749 7 743 763 MAX
Right Turn 250 21 8 12 35 328 8 314 342 MAX
Second Right
U Turn
Second Left
Left Turn 225 19 5 9 25 108 40 68 202 NO
Through 600 32 2 30 35 180 32 134 234 NO
Right Turn 225 33 2 31 36 181 32 135 235 NO
Second Right
U Turn
Second Left
Left Turn 200 82 107 4 338 646 453 195 1,283 MAX
Through 2,000 82 107 4 338 646 453 195 1,283 NO
Right Turn 2,000 82 107 4 338 646 453 195 1,283 NO
Second Right
WB
NB
SB
EB
Fehr & Peers 12/3/2016
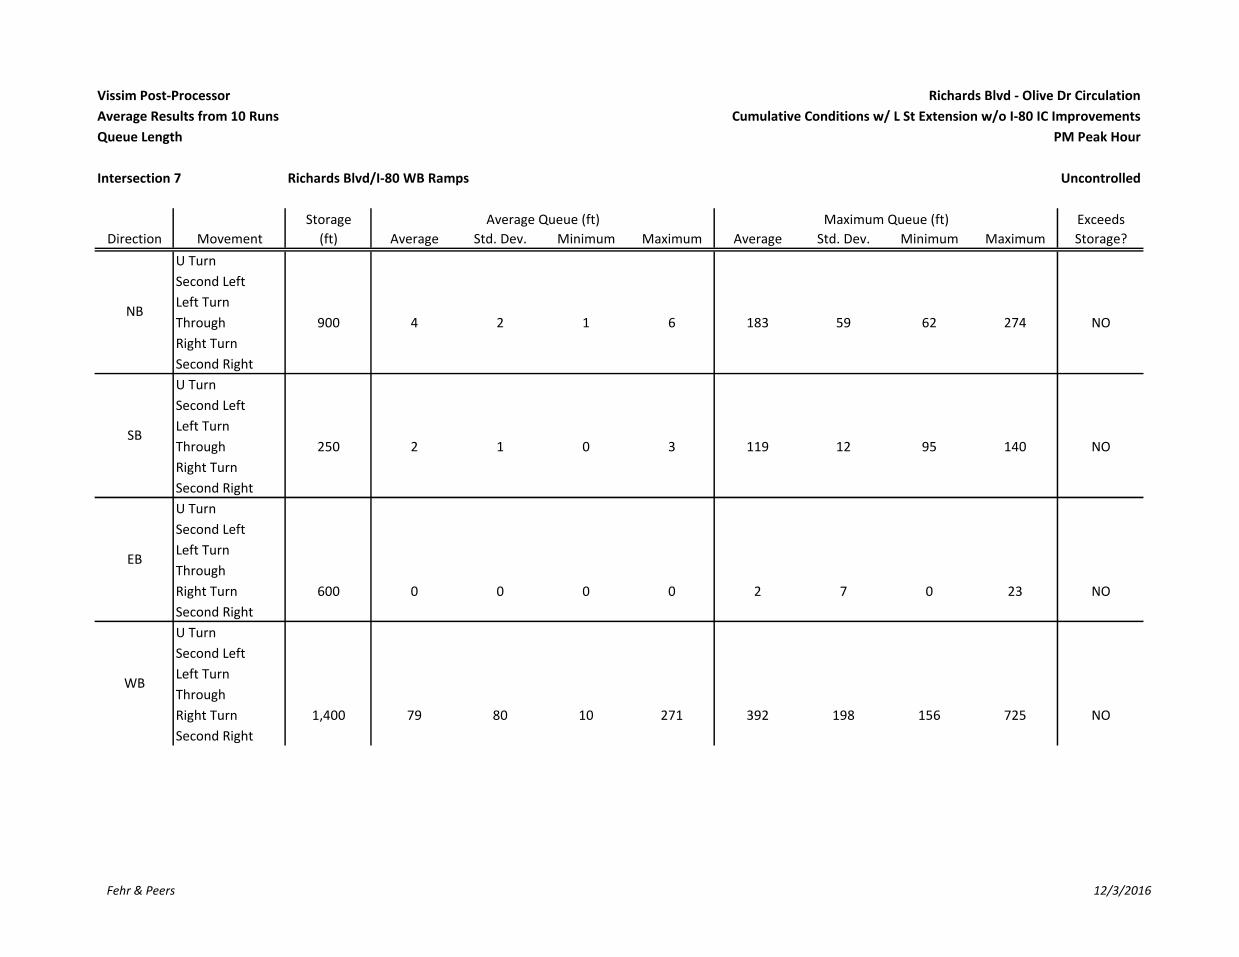
Vissim Post-Processor Richards Blvd - Olive Dr Circulation
Average Results from 10 Runs Cumulative Conditions w/ L St Extension w/o I-80 IC Improvements
Queue Length PM Peak Hour
Intersection 7 Richards Blvd/I-80 WB Ramps Uncontrolled
Storage Average Queue (ft) Maximum Queue (ft) Exceeds
Direction Movement (ft) Average Std. Dev. Minimum Maximum Average Std. Dev. Minimum Maximum Storage?
U Turn
Second Left
Left Turn
Through 900 4 2 1 6 183 59 62 274 NO
Right Turn
Second Right
U Turn
Second Left
Left Turn
Through 250 2 1 0 3 119 12 95 140 NO
Right Turn
Second Right
U Turn
Second Left
Left Turn
Through
Right Turn 600 0 0 0 0 2 7 0 23 NO
Second Right
U Turn
Second Left
Left Turn
Through
Right Turn 1,400 79 80 10 271 392 198 156 725 NO
Second Right
NB
SB
EB
WB
Fehr & Peers 12/3/2016
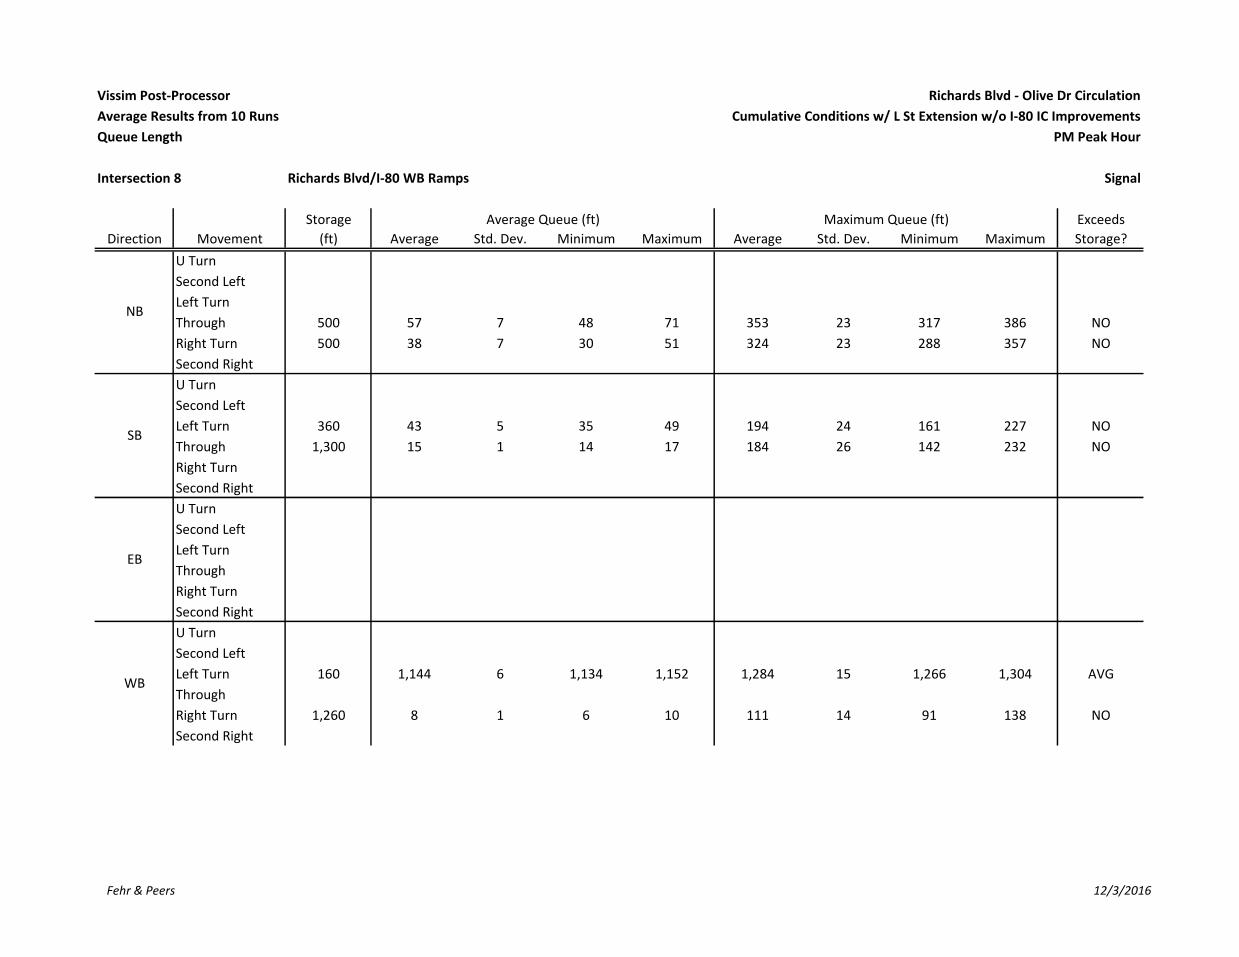
Vissim Post-Processor Richards Blvd - Olive Dr Circulation
Average Results from 10 Runs Cumulative Conditions w/ L St Extension w/o I-80 IC Improvements
Queue Length PM Peak Hour
Intersection 8 Richards Blvd/I-80 WB Ramps Signal
Storage Average Queue (ft) Maximum Queue (ft) Exceeds
Direction Movement (ft) Average Std. Dev. Minimum Maximum Average Std. Dev. Minimum Maximum Storage?
U Turn
Second Left
Left Turn
Through 500 57 7 48 71 353 23 317 386 NO
Right Turn 500 38 7 30 51 324 23 288 357 NO
Second Right
U Turn
Second Left
Left Turn 360 43 5 35 49 194 24 161 227 NO
Through 1,300 15 1 14 17 184 26 142 232 NO
Right Turn
Second Right
U Turn
Second Left
Left Turn
Through
Right Turn
Second Right
U Turn
Second Left
Left Turn 160 1,144 6 1,134 1,152 1,284 15 1,266 1,304 AVG
Through
Right Turn 1,260 8 1 6 10 111 14 91 138 NO
Second Right
NB
SB
EB
WB
Fehr & Peers 12/3/2016

Vissim Post-Processor Richards Blvd - Olive Dr Circulation
Average Results from 10 Runs Cumulative Conditions w/ L St Extension w/o I-80 IC Improvements
Queue Length PM Peak Hour
Intersection 9 Research Park Dr/Richards Blvd Signal
Storage Average Queue (ft) Maximum Queue (ft) Exceeds
Direction Movement (ft) Average Std. Dev. Minimum Maximum Average Std. Dev. Minimum Maximum Storage?
U Turn
Second Left
Left Turn 100 36 6 28 45 142 26 109 187 MAX
Through 620 6 2 4 8 109 30 66 159 NO
Right Turn
Second Right
U Turn
Second Left
Left Turn 120 14 4 8 23 142 100 68 355 MAX
Through 3,940 133 42 83 220 626 13 600 636 NO
Right Turn
Second Right
U Turn 440 123 13 111 144 490 52 432 556 MAX
Second Left
Left Turn 440 123 13 111 144 490 52 432 556 MAX
Through 440 58 4 51 66 330 21 294 351 NO
Right Turn
Second Right
U Turn
Second Left
Left Turn 80 11 2 8 15 99 65 58 272 MAX
Through 180 102 31 83 179 614 202 477 1,125 MAX
Right Turn
Second Right
EB
WB
NB
SB
Fehr & Peers 12/3/2016
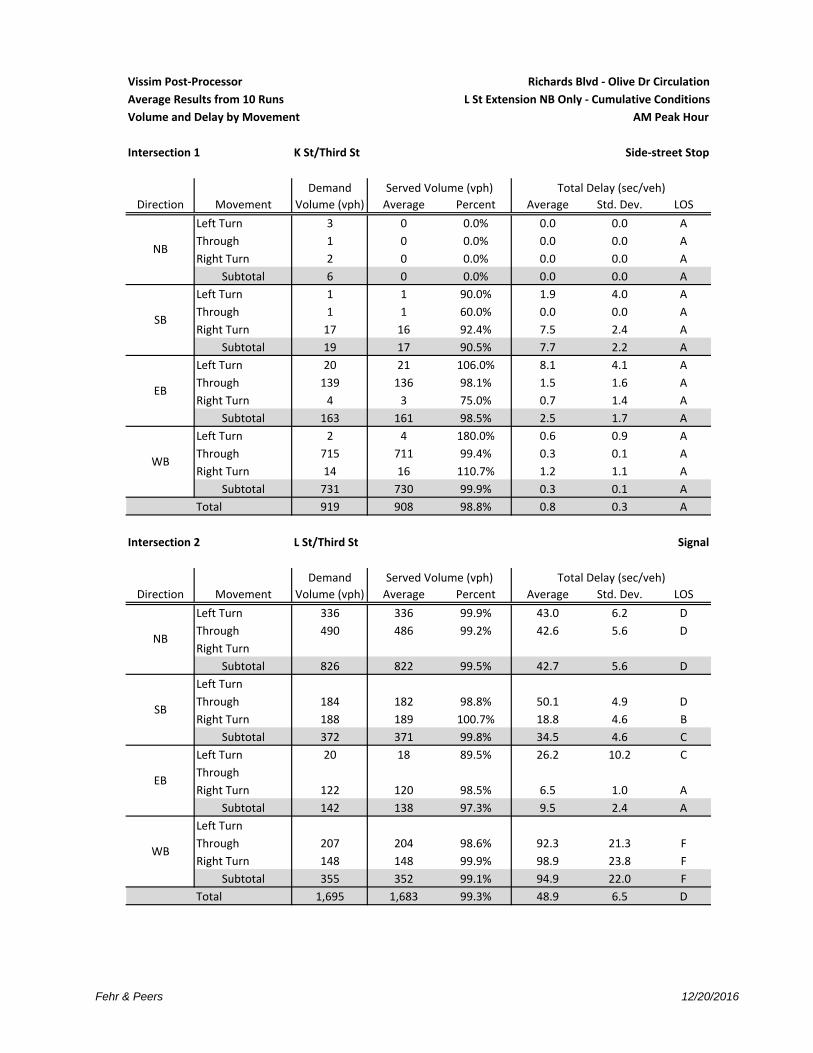
Vissim Post‐Processor Richards Blvd ‐ Olive Dr Circulation
Average Results from 10 Runs L St Extension NB Only ‐ Cumulative Conditions
Volume and Delay by Movement AM Peak Hour
Intersection 1 K St/Third St Side‐street Stop
Demand Total Delay (sec/veh)
Direction Movement Volume (vph) Average Percent Average Std. Dev. LOS
Left Turn 3 0 0.0% 0.0 0.0 A
Through 1 0 0.0% 0.0 0.0 A
Right Turn 2 0 0.0% 0.0 0.0 A
Subtotal 6 0 0.0% 0.0 0.0 A
Left Turn 1 1 90.0% 1.9 4.0 A
Through 1 1 60.0% 0.0 0.0 A
Right Turn 17 16 92.4% 7.5 2.4 A
Subtotal 19 17 90.5% 7.7 2.2 A
Left Turn 20 21 106.0% 8.1 4.1 A
Through 139 136 98.1% 1.5 1.6 A
Right Turn 4 3 75.0% 0.7 1.4 A
Subtotal 163 161 98.5% 2.5 1.7 A
Left Turn 2 4 180.0% 0.6 0.9 A
Through 715 711 99.4% 0.3 0.1 A
Right Turn 14 16 110.7% 1.2 1.1 A
Subtotal 731 730 99.9% 0.3 0.1 A
Total 919 908 98.8% 0.8 0.3 A
7.5
Intersection 2 L St/Third St Signal
Demand Total Delay (sec/veh)
Direction Movement Volume (vph) Average Percent Average Std. Dev. LOS
Left Turn 336 336 99.9% 43.0 6.2 D
Through 490 486 99.2% 42.6 5.6 D
Right Turn
Subtotal 826 822 99.5% 42.7 5.6 D
Left Turn
Through 184 182 98.8% 50.1 4.9 D
Right Turn 188 189 100.7% 18.8 4.6 B
Subtotal 372 371 99.8% 34.5 4.6 C
Left Turn 20 18 89.5% 26.2 10.2 C
Through
Right Turn 122 120 98.5% 6.5 1.0 A
Subtotal 142 138 97.3% 9.5 2.4 A
Left Turn
Through 207 204 98.6% 92.3 21.3 F
Right Turn 148 148 99.9% 98.9 23.8 F
Subtotal 355 352 99.1% 94.9 22.0 F
Total 1,695 1,683 99.3% 48.9 6.5 D
66.8
Served Volume (vph)
NB
SB
EB
WB
Served Volume (vph)
NB
SB
EB
WB
Fehr & Peers 12/20/2016

Vissim Post‐Processor Richards Blvd ‐ Olive Dr Circulation
Average Results from 10 Runs L St Extension NB Only ‐ Cumulative Conditions
Volume and Delay by Movement AM Peak Hour
Intersection 3 L St/Olive Dr Signal
Demand Total Delay (sec/veh)
Direction Movement Volume (vph) Average Percent Average Std. Dev. LOS
Left Turn
Through
Right Turn
Subtotal
Left Turn
Through
Right Turn
Subtotal
Left Turn 149 152 101.8% 36.3 7.0 D
Through
Right Turn
Subtotal 149 152 101.8% 36.3 7.0 D
Left Turn
Through
Right Turn 677 670 98.9% 80.9 49.0 F
Subtotal 677 670 98.9% 80.9 49.0 F
Total 826 821 99.4% 72.6 39.8 E
26.4
Intersection 4 D St/First St Signal
Demand Total Delay (sec/veh)
Direction Movement Volume (vph) Average Percent Average Std. Dev. LOS
Left Turn 15 14 96.0% 34.5 11.8 C
Through 16 16 96.9% 41.8 19.3 D
Right Turn 27 29 105.9% 12.5 8.3 B
Subtotal 58 59 100.9% 25.1 7.4 C
Left Turn 111 114 102.7% 158.2 76.0 F
Through 29 27 93.4% 174.5 118.0 F
Right Turn 50 50 99.6% 104.1 66.4 F
Subtotal 190 191 100.5% 144.6 71.7 F
Left Turn 9 11 125.6% 51.4 35.8 D
Through 272 272 99.9% 21.0 7.9 C
Right Turn 31 31 100.6% 19.3 10.4 B
Subtotal 312 314 100.7% 21.9 7.3 C
Left Turn 36 34 94.4% 67.2 11.6 E
Through 464 462 99.6% 5.7 1.4 A
Right Turn 51 44 86.1% 4.7 1.7 A
Subtotal 551 540 98.0% 10.2 2.4 B
Total 1,111 1,104 99.4% 40.1 16.9 D
76.6
SB
EB
WB
Served Volume (vph)
NB
SB
Served Volume (vph)
NB
EB
WB
Fehr & Peers 12/20/2016
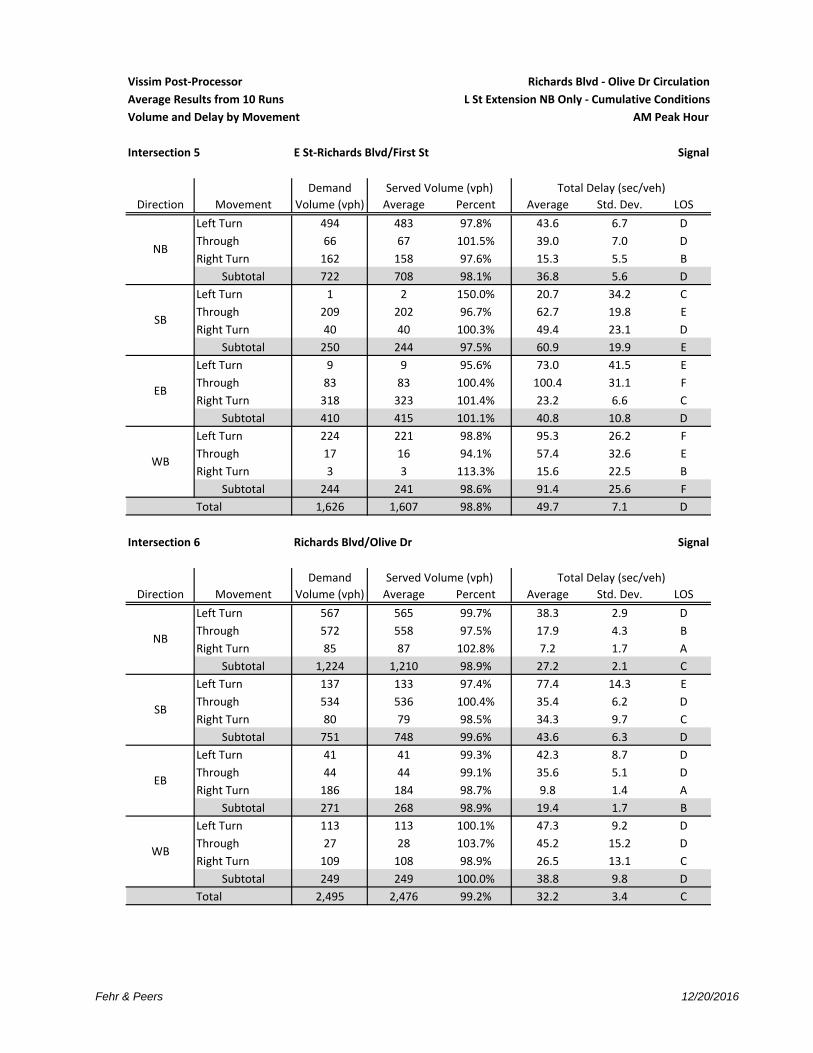
Vissim Post‐Processor Richards Blvd ‐ Olive Dr Circulation
Average Results from 10 Runs L St Extension NB Only ‐ Cumulative Conditions
Volume and Delay by Movement AM Peak Hour
Intersection 5 E St‐Richards Blvd/First St Signal
Demand Total Delay (sec/veh)
Direction Movement Volume (vph) Average Percent Average Std. Dev. LOS
Left Turn 494 483 97.8% 43.6 6.7 D
Through 66 67 101.5% 39.0 7.0 D
Right Turn 162 158 97.6% 15.3 5.5 B
Subtotal 722 708 98.1% 36.8 5.6 D
Left Turn 1 2 150.0% 20.7 34.2 C
Through 209 202 96.7% 62.7 19.8 E
Right Turn 40 40 100.3% 49.4 23.1 D
Subtotal 250 244 97.5% 60.9 19.9 E
Left Turn 9 9 95.6% 73.0 41.5 E
Through 83 83 100.4% 100.4 31.1 F
Right Turn 318 323 101.4% 23.2 6.6 C
Subtotal 410 415 101.1% 40.8 10.8 D
Left Turn 224 221 98.8% 95.3 26.2 F
Through 17 16 94.1% 57.4 32.6 E
Right Turn 3 3 113.3% 15.6 22.5 B
Subtotal 244 241 98.6% 91.4 25.6 F
Total 1,626 1,607 98.8% 49.7 7.1 D
100.3
Intersection 6 Richards Blvd/Olive Dr Signal
Demand Total Delay (sec/veh)
Direction Movement Volume (vph) Average Percent Average Std. Dev. LOS
Left Turn 567 565 99.7% 38.3 2.9 D
Through 572 558 97.5% 17.9 4.3 B
Right Turn 85 87 102.8% 7.2 1.7 A
Subtotal 1,224 1,210 98.9% 27.2 2.1 C
Left Turn 137 133 97.4% 77.4 14.3 E
Through 534 536 100.4% 35.4 6.2 D
Right Turn 80 79 98.5% 34.3 9.7 C
Subtotal 751 748 99.6% 43.6 6.3 D
Left Turn 41 41 99.3% 42.3 8.7 D
Through 44 44 99.1% 35.6 5.1 D
Right Turn 186 184 98.7% 9.8 1.4 A
Subtotal 271 268 98.9% 19.4 1.7 B
Left Turn 113 113 100.1% 47.3 9.2 D
Through 27 28 103.7% 45.2 15.2 D
Right Turn 109 108 98.9% 26.5 13.1 C
Subtotal 249 249 100.0% 38.8 9.8 D
Total 2,495 2,476 99.2% 32.2 3.4 C
66.8
WB
Served Volume (vph)
NB
SB
EB
WB
Served Volume (vph)
NB
SB
EB
Fehr & Peers 12/20/2016

Vissim Post‐Processor Richards Blvd ‐ Olive Dr Circulation
Average Results from 10 Runs L St Extension NB Only ‐ Cumulative Conditions
Volume and Delay by Movement AM Peak Hour
Intersection 7 Richards Blvd/I‐80 WB Ramps Signal
Demand Total Delay (sec/veh)
Direction Movement Volume (vph) Average Percent Average Std. Dev. LOS
Left Turn 585 582 99.4% 43.8 2.1 D
Through 670 654 97.6% 8.8 1.7 A
Right Turn
Subtotal 1,255 1,236 98.5% 25.8 1.2 C
Left Turn
Through 662 653 98.6% 27.5 2.1 C
Right Turn 196 196 100.0% 7.2 1.3 A
Subtotal 858 849 98.9% 22.7 1.6 C
Left Turn
Through
Right Turn
Subtotal
Left Turn 191 192 100.3% 38.1 3.4 D
Through
Right Turn 555 562 101.3% 16.0 2.9 B
Subtotal 746 754 101.0% 21.7 2.4 C
Total 2,859 2,838 99.3% 23.8 0.7 C
45.6
Intersection 8 Richards Blvd/I‐80 EB Ramps Signal
Demand Total Delay (sec/veh)
Direction Movement Volume (vph) Average Percent Average Std. Dev. LOS
Left Turn
Through 1,005 981 97.7% 24.1 3.2 C
Right Turn 92 80 86.8% 27.3 5.5 C
Subtotal 1,097 1,061 96.7% 24.4 3.2 C
Left Turn 301 300 99.7% 31.1 4.1 C
Through 552 546 98.9% 13.3 1.3 B
Right Turn
Subtotal 853 846 99.2% 19.6 2.6 B
Left Turn
Through
Right Turn
Subtotal
Left Turn 734 725 98.8% 19.0 1.2 B
Through
Right Turn 250 257 102.6% 12.8 2.5 B
Subtotal 984 982 99.8% 17.4 1.1 B
Total 2,934 2,890 98.5% 20.7 1.3 C
29.5
NB
SB
EB
WB
Served Volume (vph)
NB
SB
EB
WB
Served Volume (vph)
Fehr & Peers 12/20/2016

Vissim Post‐Processor Richards Blvd ‐ Olive Dr Circulation
Average Results from 10 Runs L St Extension NB Only ‐ Cumulative Conditions
Volume and Delay by Movement AM Peak Hour
Intersection 9 Research Park Dr/Richards Blvd Signal
Demand Total Delay (sec/veh)
Direction Movement Volume (vph) Average Percent Average Std. Dev. LOS
Left Turn 92 90 97.8% 69.2 15.4 E
Through 6 6 100.0% 16.8 18.8 B
Right Turn 44 45 101.1% 5.4 2.1 A
Subtotal 142 141 98.9% 45.7 12.0 D
Left Turn 26 25 97.7% 53.1 13.0 D
Through 23 21 92.6% 36.5 18.1 D
Right Turn 144 143 99.2% 14.7 2.7 B
Subtotal 193 190 98.2% 22.0 4.1 C
Left Turn 386 369 95.7% 48.2 5.8 D
Through 755 756 100.1% 14.5 2.7 B
Right Turn 145 143 98.4% 16.6 3.7 B
Subtotal 1,286 1,268 98.6% 24.6 2.0 C
Left Turn 40 35 88.0% 135.7 22.2 F
Through 826 815 98.6% 92.5 17.0 F
Right Turn 27 27 100.4% 70.2 21.6 E
Subtotal 893 877 98.2% 93.3 16.4 F
Total 2,514 2,475 98.4% 51.6 5.8 D
91.3
Served Volume (vph)
NB
SB
EB
WB
Fehr & Peers 12/20/2016

Vissim Post‐Processor Richards Blvd ‐ Olive Dr Circulation
Average Results from 10 Runs L St Extension NB Only ‐ Cumulative Conditions
Volume and Delay by Movement PM Peak Hour
Intersection 1 K St/Third St Signal
Demand Total Delay (sec/veh)
Direction Movement Volume (vph) Average Percent Average Std. Dev. LOS
Left Turn 4 2 47.5% 2.2 3.7 A
Through 2 4 180.0% 8.5 5.3 A
Right Turn 3 3 83.3% 3.3 3.6 A
Subtotal 9 8 88.9% 9.0 2.7 A
Left Turn 2 1 70.0% 4.0 5.6 A
Through 2 2 75.0% 6.1 11.2 A
Right Turn 19 18 96.3% 6.9 2.9 A
Subtotal 23 21 92.2% 8.0 3.0 A
Left Turn 1 1 60.0% 0.0 0.0 A
Through 367 364 99.1% 2.5 1.5 A
Right Turn 4 5 122.5% 0.8 1.0 A
Subtotal 372 369 99.2% 2.5 1.5 A
Left Turn 4 3 82.5% 3.8 4.5 A
Through 594 516 86.8% 0.4 0.1 A
Right Turn 78 62 80.0% 1.5 0.5 A
Subtotal 676 582 86.0% 0.5 0.1 A
Total 1,080 980 90.7% 1.5 0.6 A
13.8
Intersection 2 L St/Third St‐Second St Signal
Demand Total Delay (sec/veh)
Direction Movement Volume (vph) Average Percent Average Std. Dev. LOS
Left Turn 239 195 81.6% 66.1 4.1 E
Through 561 470 83.8% 67.9 3.8 E
Right Turn
Subtotal 800 665 83.2% 67.4 3.6 E
Left Turn
Through 370 319 86.3% 125.4 10.9 F
Right Turn 141 121 85.9% 96.8 12.8 F
Subtotal 511 440 86.2% 117.4 9.7 F
Left Turn 104 103 99.3% 56.4 12.9 E
Through
Right Turn 268 267 99.6% 14.0 3.4 B
Subtotal 372 370 99.5% 26.9 7.4 C
Left Turn
Through 296 264 89.2% 175.7 11.9 F
Right Turn 164 144 87.7% 171.9 11.8 F
Subtotal 460 408 88.7% 174.3 11.1 F
Total 2,143 1,884 87.9% 94.0 3.0 F
156.4
NB
SB
EB
WB
Served Volume (vph)
NB
SB
EB
WB
Served Volume (vph)
Fehr & Peers 12/20/2016

Vissim Post‐Processor Richards Blvd ‐ Olive Dr Circulation
Average Results from 10 Runs L St Extension NB Only ‐ Cumulative Conditions
Volume and Delay by Movement PM Peak Hour
Intersection 3 L St/Olive Dr Signal
Demand Total Delay (sec/veh)
Direction Movement Volume (vph) Average Percent Average Std. Dev. LOS
Left Turn
Through
Right Turn
Subtotal
Left Turn
Through
Right Turn
Subtotal
Left Turn 289 255 88.3% 385.1 92.4 F
Through
Right Turn
Subtotal 289 255 88.3% 385.1 92.4 F
Left Turn
Through
Right Turn 511 412 80.6% 382.6 31.6 F
Subtotal 511 412 80.6% 382.6 31.6 F
Total 800 667 83.4% 381.4 35.1 F
108.5
Intersection 4 D St/First St Signal
Demand Total Delay (sec/veh)
Direction Movement Volume (vph) Average Percent Average Std. Dev. LOS
Left Turn 32 28 87.8% 23.5 12.4 C
Through 43 42 97.2% 26.3 6.0 C
Right Turn 63 66 104.1% 18.2 6.0 B
Subtotal 138 136 98.2% 22.2 3.6 C
Left Turn 180 175 97.2% 161.5 66.4 F
Through 41 38 93.7% 160.2 59.6 F
Right Turn 35 35 100.6% 123.2 63.7 F
Subtotal 256 249 97.1% 156.4 63.7 F
Left Turn 25 23 92.4% 242.6 55.4 F
Through 397 347 87.3% 233.9 27.6 F
Right Turn 61 49 80.8% 226.5 37.4 F
Subtotal 483 419 86.7% 233.4 26.9 F
Left Turn 77 73 94.4% 30.1 5.9 C
Through 416 413 99.3% 14.1 3.4 B
Right Turn 49 43 86.9% 12.3 3.1 B
Subtotal 542 528 97.5% 16.1 2.7 B
Total 1,419 1,331 93.8% 111.6 14.1 F
168.0
EB
WB
Served Volume (vph)
NB
SB
Served Volume (vph)
NB
SB
EB
WB
Fehr & Peers 12/20/2016

Vissim Post‐Processor Richards Blvd ‐ Olive Dr Circulation
Average Results from 10 Runs L St Extension NB Only ‐ Cumulative Conditions
Volume and Delay by Movement PM Peak Hour
Intersection 5 E St‐Richards Blvd/First St Signal
Demand Total Delay (sec/veh)
Direction Movement Volume (vph) Average Percent Average Std. Dev. LOS
Left Turn 377 364 96.6% 37.3 10.4 D
Through 223 228 102.1% 37.8 9.7 D
Right Turn 89 89 99.8% 16.6 5.9 B
Subtotal 689 681 98.8% 34.9 9.6 C
Left Turn 6 6 93.3% 112.2 129.9 F
Through 199 185 92.8% 179.2 87.6 F
Right Turn 23 21 91.7% 135.1 93.1 F
Subtotal 228 211 92.7% 174.2 87.1 F
Left Turn 10 10 101.0% 91.9 40.3 F
Through 62 56 90.5% 102.3 22.5 F
Right Turn 568 527 92.7% 30.4 5.3 C
Subtotal 640 593 92.7% 37.7 6.5 D
Left Turn 220 207 94.1% 149.7 85.2 F
Through 142 142 100.3% 86.7 63.3 F
Right Turn 6 6 95.0% 58.0 60.7 E
Subtotal 368 355 96.5% 123.5 77.3 F
Total 1,925 1,840 95.6% 68.4 21.5 E
117.7
Intersection 6 Richards Blvd/Olive Dr Signal
Demand Total Delay (sec/veh)
Direction Movement Volume (vph) Average Percent Average Std. Dev. LOS
Left Turn 174 171 98.4% 47.1 4.6 D
Through 536 532 99.2% 20.9 7.3 C
Right Turn 197 194 98.2% 12.5 5.9 B
Subtotal 907 897 98.9% 23.8 4.8 C
Left Turn 163 152 93.3% 105.4 8.1 F
Through 752 700 93.1% 32.1 6.9 C
Right Turn 72 64 88.5% 25.1 10.2 C
Subtotal 987 916 92.8% 44.5 8.1 D
Left Turn 38 39 101.6% 36.6 11.1 D
Through 86 87 101.4% 51.2 9.9 D
Right Turn 439 436 99.2% 16.1 4.0 B
Subtotal 563 561 99.7% 22.6 4.4 C
Left Turn 147 131 89.2% 97.0 52.5 F
Through 28 23 80.7% 75.2 35.7 E
Right Turn 115 108 93.5% 54.6 36.4 D
Subtotal 290 261 90.1% 77.8 43.2 E
Total 2,747 2,635 95.9% 36.0 5.1 D
101.2
WB
Served Volume (vph)
NB
SB
EB
WB
Served Volume (vph)
NB
SB
EB
Fehr & Peers 12/20/2016

Vissim Post‐Processor Richards Blvd ‐ Olive Dr Circulation
Average Results from 10 Runs L St Extension NB Only ‐ Cumulative Conditions
Volume and Delay by Movement PM Peak Hour
Intersection 7 Richards Blvd/I‐80 WB Ramps Signal
Demand Total Delay (sec/veh)
Direction Movement Volume (vph) Average Percent Average Std. Dev. LOS
Left Turn 664 657 98.9% 37.9 2.2 D
Through 719 717 99.7% 5.4 1.3 A
Right Turn
Subtotal 1,383 1,374 99.3% 21.3 0.9 C
Left Turn
Through 1,168 1,100 94.1% 20.9 2.7 C
Right Turn 325 318 97.8% 11.4 1.1 B
Subtotal 1,493 1,418 94.9% 18.7 2.1 B
Left Turn
Through
Right Turn
Subtotal
Left Turn 86 90 104.4% 46.4 10.7 D
Through
Right Turn 191 190 99.4% 9.7 1.5 A
Subtotal 277 280 100.9% 21.5 4.2 C
Total 3,153 3,071 97.4% 20.2 1.2 C
44.4
Intersection 8 Richards Blvd/I‐80 EB Ramps Signal
Demand Total Delay (sec/veh)
Direction Movement Volume (vph) Average Percent Average Std. Dev. LOS
Left Turn
Through 1,219 1,203 98.7% 29.4 2.1 C
Right Turn 121 119 98.4% 36.3 6.2 D
Subtotal 1,340 1,322 98.7% 30.0 2.2 C
Left Turn 480 445 92.7% 44.0 9.3 D
Through 774 747 96.5% 14.6 1.7 B
Right Turn
Subtotal 1,254 1,192 95.0% 25.4 4.0 C
Left Turn
Through
Right Turn
Subtotal
Left Turn 824 817 99.1% 27.2 3.0 C
Through
Right Turn 164 169 102.9% 11.7 1.8 B
Subtotal 988 986 99.8% 24.5 2.7 C
Total 3,582 3,499 97.7% 26.9 2.4 C
44.7
NB
SB
EB
WB
Served Volume (vph)
NB
SB
EB
WB
Served Volume (vph)
Fehr & Peers 12/20/2016

Vissim Post‐Processor Richards Blvd ‐ Olive Dr Circulation
Average Results from 10 Runs L St Extension NB Only ‐ Cumulative Conditions
Volume and Delay by Movement PM Peak Hour
Intersection 9 Research Park Dr/Richards Blvd Signal
Demand Total Delay (sec/veh)
Direction Movement Volume (vph) Average Percent Average Std. Dev. LOS
Left Turn 106 102 96.2% 59.5 8.2 E
Through 24 23 96.7% 29.0 16.2 C
Right Turn 52 54 103.5% 8.4 3.8 A
Subtotal 182 179 98.4% 40.4 7.0 D
Left Turn 60 61 101.7% 87.8 30.4 F
Through 11 11 100.0% 70.3 31.1 E
Right Turn 388 383 98.8% 52.8 33.6 D
Subtotal 459 455 99.2% 58.4 32.0 E
Left Turn 417 403 96.6% 51.7 7.2 D
Through 1,110 1,091 98.3% 24.6 2.9 C
Right Turn 71 71 99.3% 23.5 6.5 C
Subtotal 1,598 1,564 97.9% 31.5 3.4 C
Left Turn 33 34 101.5% 133.1 38.3 F
Through 762 747 98.0% 100.8 31.6 F
Right Turn 72 65 90.7% 65.6 22.1 E
Subtotal 867 845 97.5% 99.5 31.4 F
Total 3,106 3,044 98.0% 54.6 11.3 D
84.3
SB
EB
WB
Served Volume (vph)
NB
Fehr & Peers 12/20/2016

Vissim Post‐Processor Richards Blvd ‐ Olive Dr Circulation
Average Results from 10 Runs L St Extension NB Only ‐ Cumulative Conditions
Queue Length AM Peak Hour
Intersection 1 K St/Third St Side‐street Stop
Storage Average Queue (ft) Maximum Queue (ft) Exceeds
Direction Movement (ft) Average Std. Dev. Minimum Maximum Average Std. Dev. Minimum Maximum Storage?
U Turn
Second Left
Left Turn 420 0 0 0 0 0 0 0 0 NO
Through 420 0 0 0 0 0 0 0 0 NO
Right Turn 420 0 0 0 0 0 0 0 0 NO
Second Right
U Turn
Second Left
Left Turn 420 0 0 0 1 40 13 24 55 NO
Through 3,700 0 0 0 1 40 13 24 55 NO
Right Turn 420 0 0 0 1 39 13 24 55 NO
Second Right
U Turn
Second Left
Left Turn 250 1 1 0 2 81 25 27 123 NO
Through 250 0 0 0 0 0 0 0 0 NO
Right Turn 250 1 0 0 1 64 28 0 107 NO
Second Right
U Turn
Second Left
Left Turn 250 0 0 0 0 34 38 0 103 NO
Through 250 1 0 0 1 104 10 81 115 NO
Right Turn 250 0 0 0 0 26 27 0 82 NO
Second Right
NB
SB
EB
WB
Fehr & Peers 12/20/2016

Vissim Post‐Processor Richards Blvd ‐ Olive Dr Circulation
Average Results from 10 Runs L St Extension NB Only ‐ Cumulative Conditions
Queue Length AM Peak Hour
Intersection 2 L St/Third St Signal
Storage Average Queue (ft) Maximum Queue (ft) Exceeds
Direction Movement (ft) Average Std. Dev. Minimum Maximum Average Std. Dev. Minimum Maximum Storage?
U Turn
Second Left
Left Turn 150 180 20 154 200 524 6 520 538 AVG
Through 490 180 20 154 200 524 6 520 538 MAX
Right Turn
Second Right
U Turn
Second Left
Left Turn
Through 420 59 10 48 84 385 64 296 444 NO
Right Turn 420 16 6 11 32 283 64 194 342 NO
Second Right
U Turn
Second Left
Left Turn 125 6 1 4 7 77 17 57 110 NO
Through
Right Turn 250 #VALUE! #VALUE! #VALUE! #VALUE! #VALUE! #VALUE! #VALUE! #VALUE! #VALUE!
Second Right
U Turn
Second Left
Left Turn
Through 1,000 193 27 145 230 600 24 549 613 NO
Right Turn 1,000 193 27 145 230 600 24 549 613 NO
Second Right
NB
SB
EB
WB
Fehr & Peers 12/20/2016
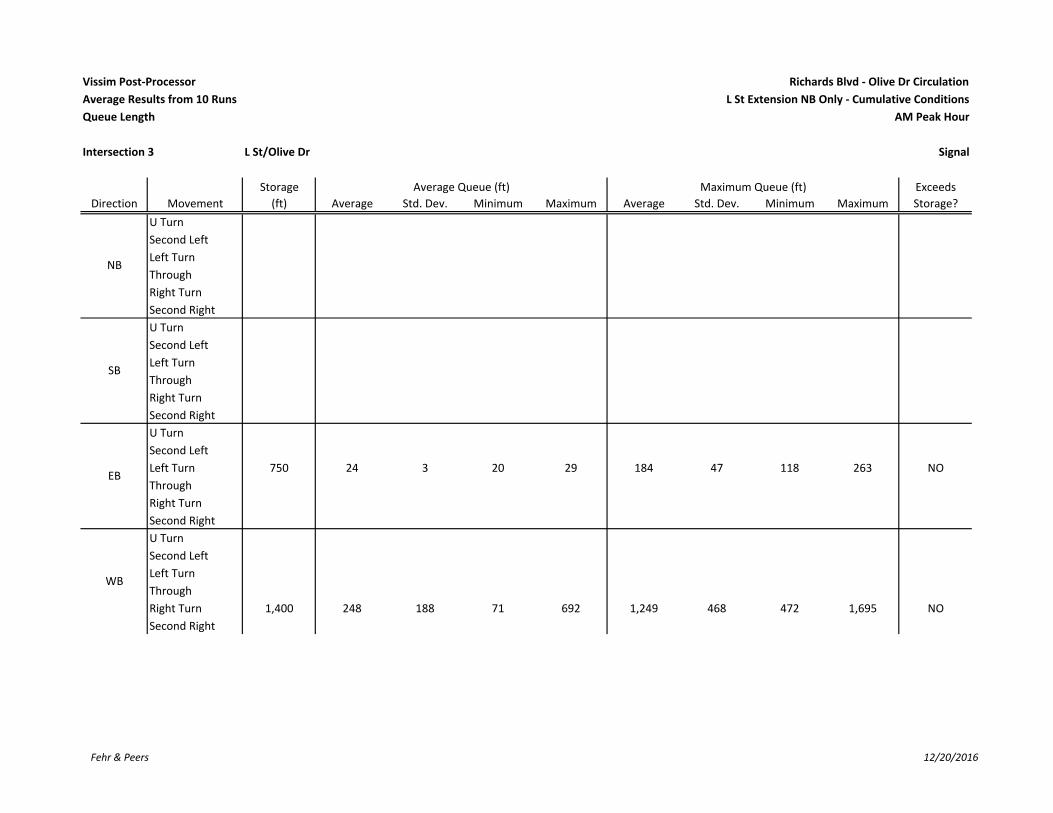
Vissim Post‐Processor Richards Blvd ‐ Olive Dr Circulation
Average Results from 10 Runs L St Extension NB Only ‐ Cumulative Conditions
Queue Length AM Peak Hour
Intersection 3 L St/Olive Dr Signal
Storage Average Queue (ft) Maximum Queue (ft) Exceeds
Direction Movement (ft) Average Std. Dev. Minimum Maximum Average Std. Dev. Minimum Maximum Storage?
U Turn
Second Left
Left Turn
Through
Right Turn
Second Right
U Turn
Second Left
Left Turn
Through
Right Turn
Second Right
U Turn
Second Left
Left Turn 750 24 3 20 29 184 47 118 263 NO
Through
Right Turn
Second Right
U Turn
Second Left
Left Turn
Through
Right Turn 1,400 248 188 71 692 1,249 468 472 1,695 NO
Second Right
NB
SB
EB
WB
Fehr & Peers 12/20/2016

Vissim Post‐Processor Richards Blvd ‐ Olive Dr Circulation
Average Results from 10 Runs L St Extension NB Only ‐ Cumulative Conditions
Queue Length AM Peak Hour
Intersection 4 D St/First St Signal
Storage Average Queue (ft) Maximum Queue (ft) Exceeds
Direction Movement (ft) Average Std. Dev. Minimum Maximum Average Std. Dev. Minimum Maximum Storage?
U Turn
Second Left
Left Turn 100 6 1 5 7 75 23 46 113 NO
Through 100 6 1 5 7 75 23 46 113 NO
Right Turn 400 1 0 0 2 49 13 24 75 NO
Second Right
U Turn
Second Left
Left Turn 400 107 49 58 212 376 67 267 444 NO
Through 400 107 49 58 212 376 67 267 444 NO
Right Turn 400 31 40 1 122 332 117 91 449 NO
Second Right
U Turn
Second Left
Left Turn 80 4 5 1 15 161 83 49 286 MAX
Through 560 4 5 1 15 161 83 49 286 NO
Right Turn 560 4 5 1 15 161 83 49 286 NO
Second Right
U Turn
Second Left
Left Turn 100 12 2 8 17 87 25 46 136 NO
Through 240 17 4 9 23 355 20 298 364 MAX
Right Turn 24 18 4 9 24 357 20 300 366 MAX
Second Right
NB
SB
EB
WB
Fehr & Peers 12/20/2016

Vissim Post‐Processor Richards Blvd ‐ Olive Dr Circulation
Average Results from 10 Runs L St Extension NB Only ‐ Cumulative Conditions
Queue Length AM Peak Hour
Intersection 5 E St‐Richards Blvd/First St Signal
Storage Average Queue (ft) Maximum Queue (ft) Exceeds
Direction Movement (ft) Average Std. Dev. Minimum Maximum Average Std. Dev. Minimum Maximum Storage?
U Turn
Second Left
Left Turn 640 10 8 3 27 202 3 200 210 NO
Through 640 10 8 3 27 202 3 200 210 NO
Right Turn 180 10 8 3 27 202 3 200 210 MAX
Second Right
U Turn
Second Left
Left Turn
Through 400 66 5 60 79 358 61 263 415 NO
Right Turn 400 14 10 4 37 302 101 184 420 NO
Second Right
U Turn
Second Left
Left Turn 100 83 19 54 119 501 14 485 524 MAX
Through 220 83 19 54 119 501 14 485 524 MAX
Right Turn 200 44 11 29 61 444 38 393 495 MAX
Second Right
U Turn
Second Left
Left Turn 220 104 16 72 124 399 130 246 686 MAX
Through 240 104 16 72 124 399 130 246 686 MAX
Right Turn 240 104 16 72 124 399 130 246 686 MAX
Second Right
NB
SB
EB
WB
Fehr & Peers 12/20/2016

Vissim Post‐Processor Richards Blvd ‐ Olive Dr Circulation
Average Results from 10 Runs L St Extension NB Only ‐ Cumulative Conditions
Queue Length AM Peak Hour
Intersection 6 Richards Blvd/Olive Dr Signal
Storage Average Queue (ft) Maximum Queue (ft) Exceeds
Direction Movement (ft) Average Std. Dev. Minimum Maximum Average Std. Dev. Minimum Maximum Storage?
U Turn
Second Left
Left Turn 100 103 19 85 145 498 117 322 681 AVG
Through 1,540 56 24 39 111 461 126 314 674 NO
Right Turn 100 0 0 0 1 46 16 24 77 NO
Second Right
U Turn
Second Left
Left Turn 590 126 34 79 196 739 15 698 755 MAX
Through 590 127 31 87 200 738 29 659 762 MAX
Right Turn 250 127 31 87 199 738 29 658 761 MAX
Second Right
U Turn
Second Left
Left Turn 225 9 2 5 11 83 19 46 109 NO
Through 600 14 1 12 16 97 22 70 130 NO
Right Turn 225 14 1 13 16 98 22 71 131 NO
Second Right
U Turn
Second Left
Left Turn 200 0 0 0 0 33 18 21 67 NO
Through 2,000 0 0 0 0 33 18 21 67 NO
Right Turn 2,000 0 0 0 0 33 18 21 67 NO
Second Right
WB
NB
SB
EB
Fehr & Peers 12/20/2016

Vissim Post‐Processor Richards Blvd ‐ Olive Dr Circulation
Average Results from 10 Runs L St Extension NB Only ‐ Cumulative Conditions
Queue Length AM Peak Hour
Intersection 7 Richards Blvd/I‐80 WB Ramps Signal
Storage Average Queue (ft) Maximum Queue (ft) Exceeds
Direction Movement (ft) Average Std. Dev. Minimum Maximum Average Std. Dev. Minimum Maximum Storage?
U Turn
Second Left
Left Turn 800 78 4 71 85 312 27 274 362 NO
Through 800 17 4 13 23 323 56 243 424 NO
Right Turn
Second Right
U Turn
Second Left
Left Turn
Through 590 56 4 51 64 299 42 248 370 NO
Right Turn 200 1 0 0 1 87 27 58 135 NO
Second Right
U Turn
Second Left
Left Turn
Through
Right Turn
Second Right
U Turn
Second Left
Left Turn 400 41 4 37 49 240 57 176 377 NO
Through
Right Turn 1,200 29 4 24 35 176 35 136 264 NO
Second Right
NB
SB
EB
WB
Fehr & Peers 12/20/2016

Vissim Post‐Processor Richards Blvd ‐ Olive Dr Circulation
Average Results from 10 Runs L St Extension NB Only ‐ Cumulative Conditions
Queue Length AM Peak Hour
Intersection 8 Richards Blvd/I‐80 EB Ramps Signal
Storage Average Queue (ft) Maximum Queue (ft) Exceeds
Direction Movement (ft) Average Std. Dev. Minimum Maximum Average Std. Dev. Minimum Maximum Storage?
U Turn
Second Left
Left Turn
Through 500 77 6 67 84 458 39 411 529 NO
Right Turn 500 59 5 49 66 428 39 382 500 NO
Second Right
U Turn
Second Left
Left Turn 360 26 3 23 31 166 27 131 218 NO
Through 1,300 16 2 13 20 200 29 156 268 NO
Right Turn
Second Right
U Turn
Second Left
Left Turn
Through
Right Turn
Second Right
U Turn
Second Left
Left Turn 160 42 2 40 47 224 25 199 286 MAX
Through
Right Turn 1,260 17 2 14 19 172 42 112 231 NO
Second Right
NB
SB
EB
WB
Fehr & Peers 12/20/2016
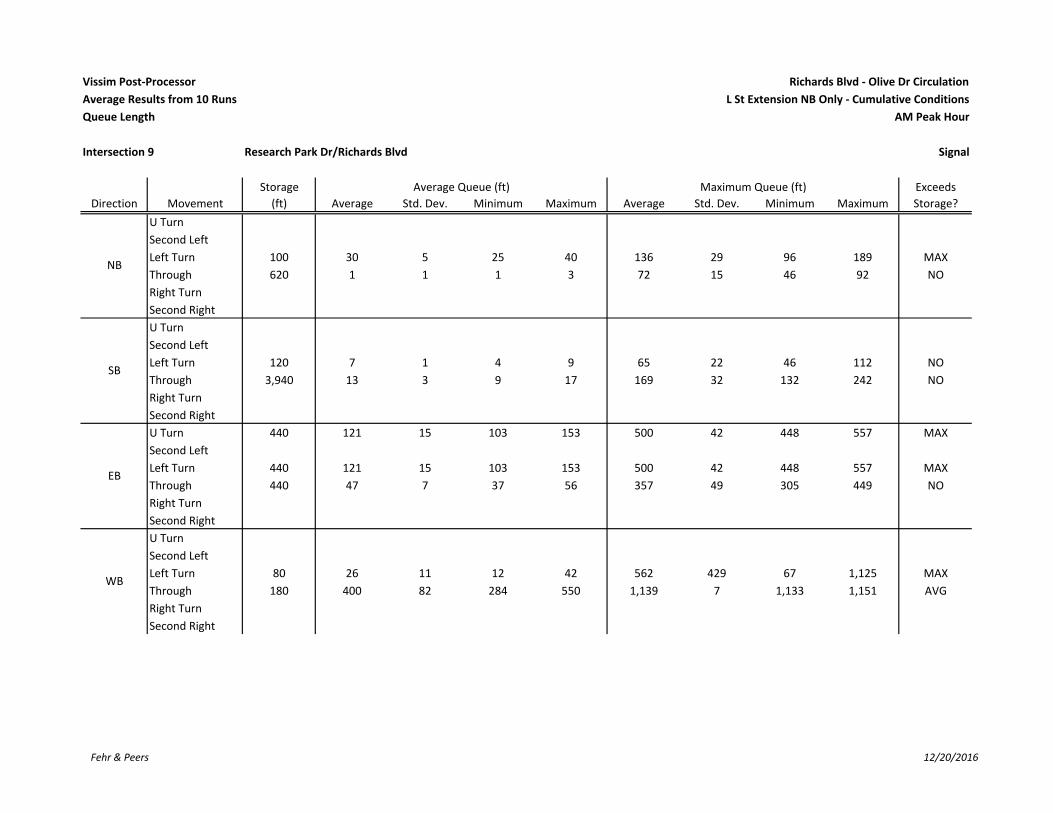
Vissim Post‐Processor Richards Blvd ‐ Olive Dr Circulation
Average Results from 10 Runs L St Extension NB Only ‐ Cumulative Conditions
Queue Length AM Peak Hour
Intersection 9 Research Park Dr/Richards Blvd Signal
Storage Average Queue (ft) Maximum Queue (ft) Exceeds
Direction Movement (ft) Average Std. Dev. Minimum Maximum Average Std. Dev. Minimum Maximum Storage?
U Turn
Second Left
Left Turn 100 30 5 25 40 136 29 96 189 MAX
Through 620 1 1 1 3 72 15 46 92 NO
Right Turn
Second Right
U Turn
Second Left
Left Turn 120 7 1 4 9 65 22 46 112 NO
Through 3,940 13 3 9 17 169 32 132 242 NO
Right Turn
Second Right
U Turn 440 121 15 103 153 500 42 448 557 MAX
Second Left
Left Turn 440 121 15 103 153 500 42 448 557 MAX
Through 440 47 7 37 56 357 49 305 449 NO
Right Turn
Second Right
U Turn
Second Left
Left Turn 80 26 11 12 42 562 429 67 1,125 MAX
Through 180 400 82 284 550 1,139 7 1,133 1,151 AVG
Right Turn
Second Right
EB
WB
NB
SB
Fehr & Peers 12/20/2016

Vissim Post‐Processor Richards Blvd ‐ Olive Dr Circulation
Average Results from 10 Runs L St Extension NB Only ‐ Cumulative Conditions
Queue Length AM Peak Hour
Intersection 0 Side‐street Stop
Storage Average Queue (ft) Maximum Queue (ft) Exceeds
Direction Movement (ft) Average Std. Dev. Minimum Maximum Average Std. Dev. Minimum Maximum Storage?
U Turn
Second Left
Left Turn
Through
Right Turn
Second Right
U Turn
Second Left
Left Turn
Through
Right Turn
Second Right
U Turn
Second Left
Left Turn
Through
Right Turn
Second Right
U Turn
Second Left
Left Turn
Through
Right Turn
Second Right
EB
WB
NB
SB
Fehr & Peers 12/20/2016

Vissim Post‐Processor Richards Blvd ‐ Olive Dr Circulation
Average Results from 10 Runs L St Extension NB Only ‐ Cumulative Conditions
Queue Length AM Peak Hour
Intersection 0 // Signal
Storage Average Queue (ft) Maximum Queue (ft) Exceeds
Direction Movement (ft) Average Std. Dev. Minimum Maximum Average Std. Dev. Minimum Maximum Storage?
U Turn
Second Left
Left Turn
Through
Right Turn
Second Right
U Turn
Second Left
Left Turn
Through
Right Turn
Second Right
U Turn
Second Left
Left Turn
Through
Right Turn
Second Right
U Turn
Second Left
Left Turn
Through
Right Turn
Second Right
U Turn
Second Left
Left Turn
Through
Right Turn
Second Right
NB
SB
SE
EB
WB
Fehr & Peers 12/20/2016

Vissim Post‐Processor Richards Blvd ‐ Olive Dr Circulation
Average Results from 10 Runs L St Extension NB Only ‐ Cumulative Conditions
Queue Length PM Peak Hour
Intersection 1 K St/Third St Signal
Storage Average Queue (ft) Maximum Queue (ft) Exceeds
Direction Movement (ft) Average Std. Dev. Minimum Maximum Average Std. Dev. Minimum Maximum Storage?
U Turn
Second Left
Left Turn 420 0 0 0 1 22 1 21 24 NO
Through 420 0 0 0 1 22 1 21 24 NO
Right Turn 150 0 0 0 0 22 1 20 23 NO
Second Right
U Turn
Second Left
Left Turn 420 1 0 0 1 38 13 25 56 NO
Through 3,700 1 0 0 1 38 13 25 56 NO
Right Turn 420 1 0 0 1 37 13 24 55 NO
Second Right
U Turn
Second Left
Left Turn 100 1 1 0 1 89 65 0 183 NO
Through 250 0 0 0 0 0 0 0 0 NO
Right Turn 250 0 0 0 1 74 63 0 168 NO
Second Right
U Turn
Second Left
Left Turn 100 0 0 0 0 67 28 27 122 NO
Through 250 0 0 0 0 82 16 69 108 NO
Right Turn 250 0 0 0 0 48 27 0 101 NO
Second Right
NB
SB
EB
WB
Fehr & Peers 12/20/2016

Vissim Post‐Processor Richards Blvd ‐ Olive Dr Circulation
Average Results from 10 Runs L St Extension NB Only ‐ Cumulative Conditions
Queue Length PM Peak Hour
Intersection 2 L St/Third St‐Second St Signal
Storage Average Queue (ft) Maximum Queue (ft) Exceeds
Direction Movement (ft) Average Std. Dev. Minimum Maximum Average Std. Dev. Minimum Maximum Storage?
U Turn
Second Left
Left Turn 150 312 7 298 320 531 14 521 560 AVG
Through 490 312 7 298 320 531 14 521 560 MAX
Right Turn
Second Right
U Turn
Second Left
Left Turn
Through 420 323 6 314 332 449 8 443 464 MAX
Right Turn 420 239 5 226 245 347 8 341 362 NO
Second Right
U Turn
Second Left
Left Turn 125 46 8 38 55 340 100 204 469 MAX
Through
Right Turn 250 47 8 39 56 340 100 205 470 MAX
Second Right
U Turn
Second Left
Left Turn
Through 1,000 486 20 446 506 622 10 613 641 NO
Right Turn 1,000 486 20 446 506 622 10 613 641 NO
Second Right
NB
SB
EB
WB
Fehr & Peers 12/20/2016

Vissim Post‐Processor Richards Blvd ‐ Olive Dr Circulation
Average Results from 10 Runs L St Extension NB Only ‐ Cumulative Conditions
Queue Length PM Peak Hour
Intersection 3 L St/Olive Dr Signal
Storage Average Queue (ft) Maximum Queue (ft) Exceeds
Direction Movement (ft) Average Std. Dev. Minimum Maximum Average Std. Dev. Minimum Maximum Storage?
U Turn
Second Left
Left Turn
Through
Right Turn
Second Right
U Turn
Second Left
Left Turn
Through
Right Turn
Second Right
U Turn
Second Left
Left Turn 750 554 218 297 988 1,312 310 920 1,658 MAX
Through
Right Turn
Second Right
U Turn
Second Left
Left Turn
Through
Right Turn 1,400 1,201 95 1,113 1,375 1,684 12 1,658 1,695 MAX
Second Right
SB
EB
WB
NB
Fehr & Peers 12/20/2016
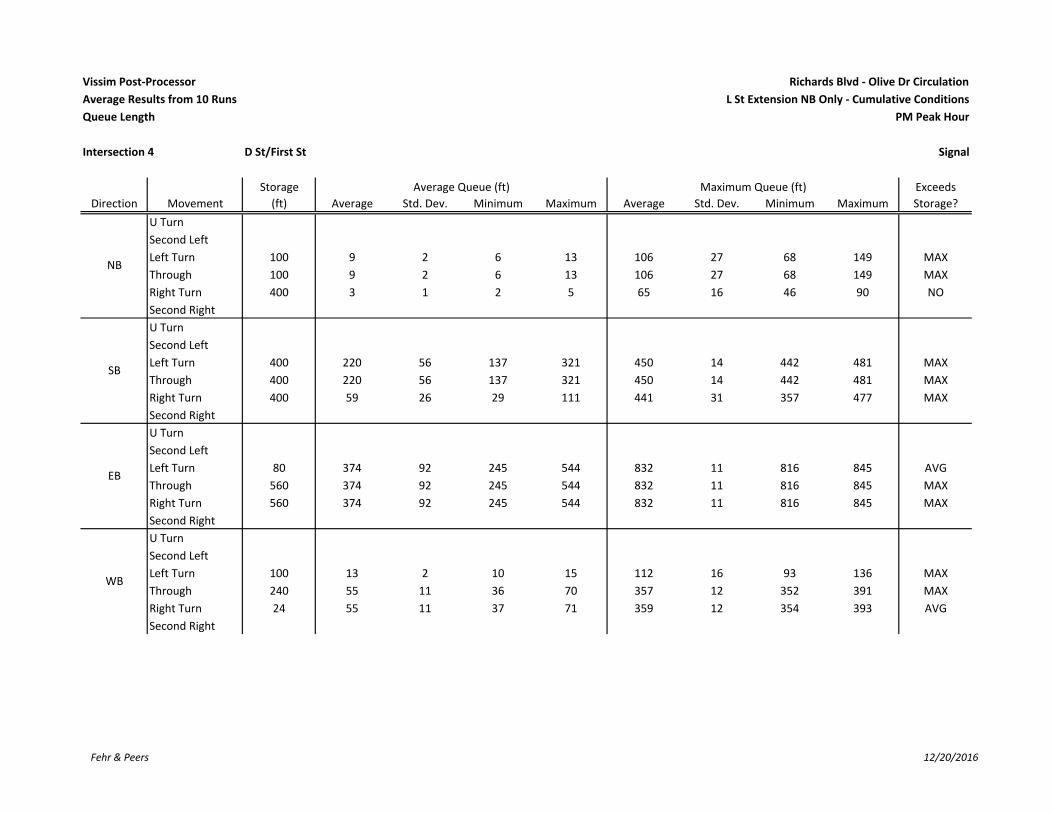
Vissim Post‐Processor Richards Blvd ‐ Olive Dr Circulation
Average Results from 10 Runs L St Extension NB Only ‐ Cumulative Conditions
Queue Length PM Peak Hour
Intersection 4 D St/First St Signal
Storage Average Queue (ft) Maximum Queue (ft) Exceeds
Direction Movement (ft) Average Std. Dev. Minimum Maximum Average Std. Dev. Minimum Maximum Storage?
U Turn
Second Left
Left Turn 100 9 2 6 13 106 27 68 149 MAX
Through 100 9 2 6 13 106 27 68 149 MAX
Right Turn 400 3 1 2 5 65 16 46 90 NO
Second Right
U Turn
Second Left
Left Turn 400 220 56 137 321 450 14 442 481 MAX
Through 400 220 56 137 321 450 14 442 481 MAX
Right Turn 400 59 26 29 111 441 31 357 477 MAX
Second Right
U Turn
Second Left
Left Turn 80 374 92 245 544 832 11 816 845 AVG
Through 560 374 92 245 544 832 11 816 845 MAX
Right Turn 560 374 92 245 544 832 11 816 845 MAX
Second Right
U Turn
Second Left
Left Turn 100 13 2 10 15 112 16 93 136 MAX
Through 240 55 11 36 70 357 12 352 391 MAX
Right Turn 24 55 11 37 71 359 12 354 393 AVG
Second Right
NB
SB
EB
WB
Fehr & Peers 12/20/2016
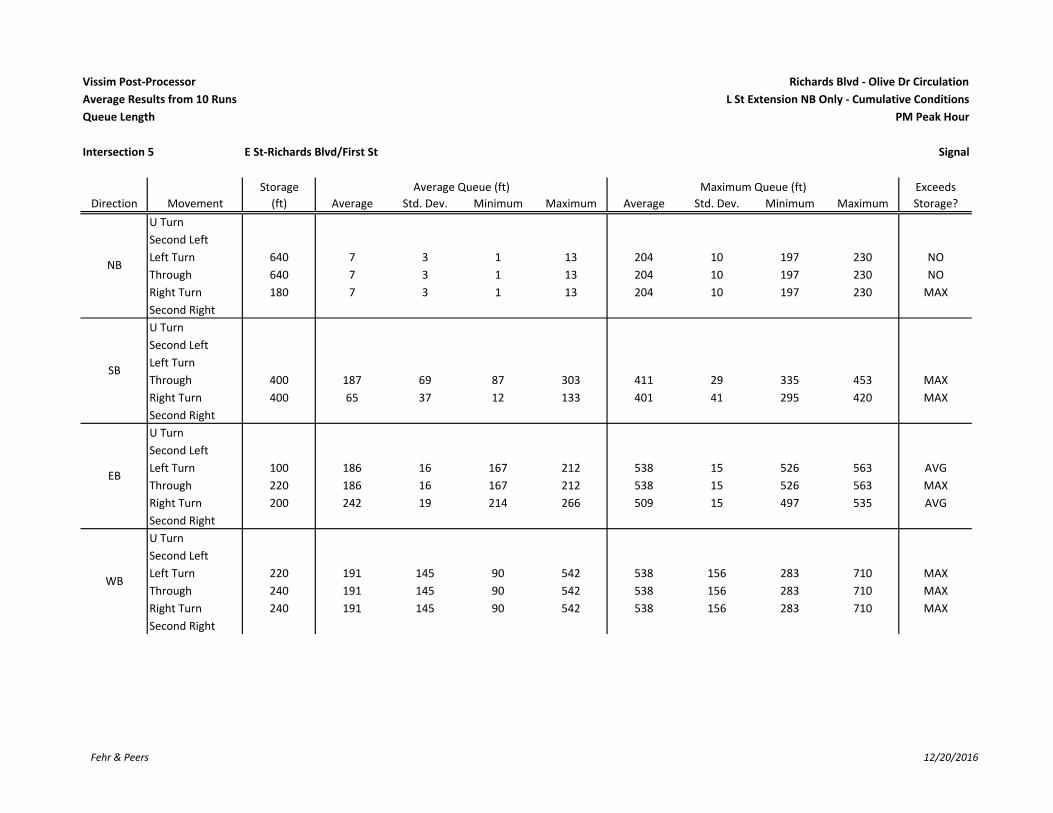
Vissim Post‐Processor Richards Blvd ‐ Olive Dr Circulation
Average Results from 10 Runs L St Extension NB Only ‐ Cumulative Conditions
Queue Length PM Peak Hour
Intersection 5 E St‐Richards Blvd/First St Signal
Storage Average Queue (ft) Maximum Queue (ft) Exceeds
Direction Movement (ft) Average Std. Dev. Minimum Maximum Average Std. Dev. Minimum Maximum Storage?
U Turn
Second Left
Left Turn 640 7 3 1 13 204 10 197 230 NO
Through 640 7 3 1 13 204 10 197 230 NO
Right Turn 180 7 3 1 13 204 10 197 230 MAX
Second Right
U Turn
Second Left
Left Turn
Through 400 187 69 87 303 411 29 335 453 MAX
Right Turn 400 65 37 12 133 401 41 295 420 MAX
Second Right
U Turn
Second Left
Left Turn 100 186 16 167 212 538 15 526 563 AVG
Through 220 186 16 167 212 538 15 526 563 MAX
Right Turn 200 242 19 214 266 509 15 497 535 AVG
Second Right
U Turn
Second Left
Left Turn 220 191 145 90 542 538 156 283 710 MAX
Through 240 191 145 90 542 538 156 283 710 MAX
Right Turn 240 191 145 90 542 538 156 283 710 MAX
Second Right
NB
SB
EB
WB
Fehr & Peers 12/20/2016
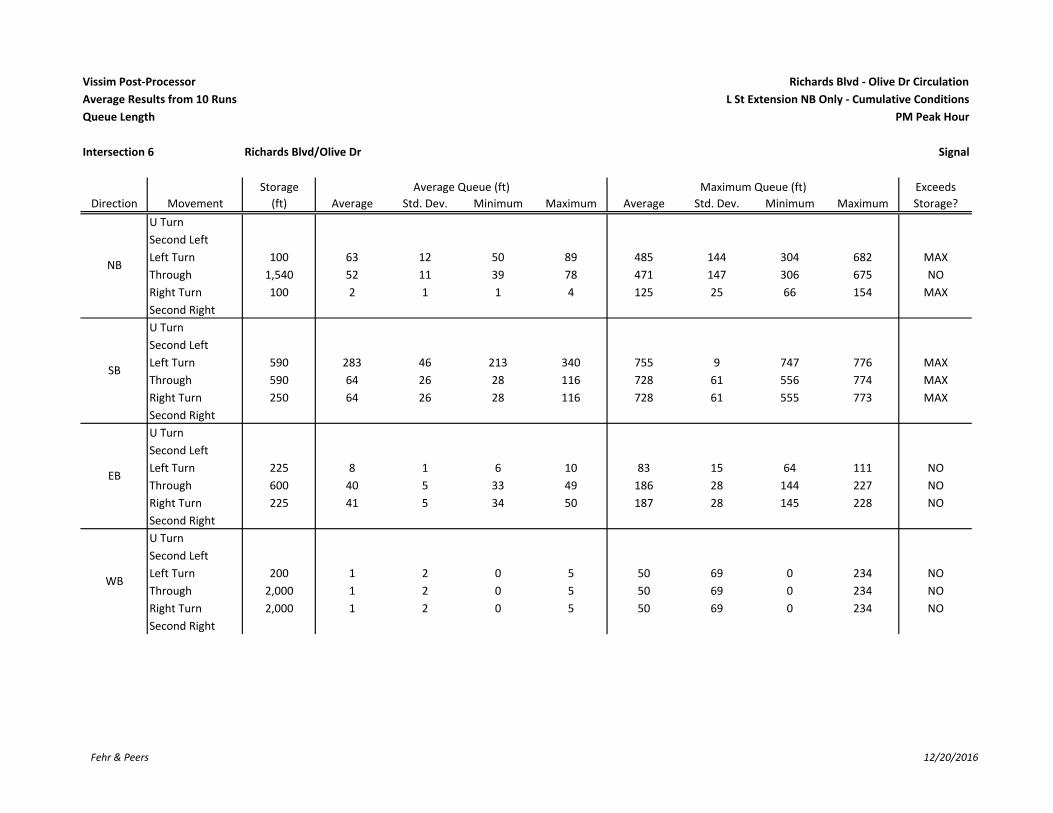
Vissim Post‐Processor Richards Blvd ‐ Olive Dr Circulation
Average Results from 10 Runs L St Extension NB Only ‐ Cumulative Conditions
Queue Length PM Peak Hour
Intersection 6 Richards Blvd/Olive Dr Signal
Storage Average Queue (ft) Maximum Queue (ft) Exceeds
Direction Movement (ft) Average Std. Dev. Minimum Maximum Average Std. Dev. Minimum Maximum Storage?
U Turn
Second Left
Left Turn 100 63 12 50 89 485 144 304 682 MAX
Through 1,540 52 11 39 78 471 147 306 675 NO
Right Turn 100 2 1 1 4 125 25 66 154 MAX
Second Right
U Turn
Second Left
Left Turn 590 283 46 213 340 755 9 747 776 MAX
Through 590 64 26 28 116 728 61 556 774 MAX
Right Turn 250 64 26 28 116 728 61 555 773 MAX
Second Right
U Turn
Second Left
Left Turn 225 8 1 6 10 83 15 64 111 NO
Through 600 40 5 33 49 186 28 144 227 NO
Right Turn 225 41 5 34 50 187 28 145 228 NO
Second Right
U Turn
Second Left
Left Turn 200 1 2 0 5 50 69 0 234 NO
Through 2,000 1 2 0 5 50 69 0 234 NO
Right Turn 2,000 1 2 0 5 50 69 0 234 NO
Second Right
NB
SB
EB
WB
Fehr & Peers 12/20/2016

Vissim Post‐Processor Richards Blvd ‐ Olive Dr Circulation
Average Results from 10 Runs L St Extension NB Only ‐ Cumulative Conditions
Queue Length PM Peak Hour
Intersection 7 Richards Blvd/I‐80 WB Ramps Signal
Storage Average Queue (ft) Maximum Queue (ft) Exceeds
Direction Movement (ft) Average Std. Dev. Minimum Maximum Average Std. Dev. Minimum Maximum Storage?
U Turn
Second Left
Left Turn 800 76 3 71 83 321 26 287 364 NO
Through 800 8 2 6 12 262 55 183 335 NO
Right Turn
Second Right
U Turn
Second Left
Left Turn
Through 590 72 6 62 83 475 27 448 523 NO
Right Turn 200 7 2 4 10 240 27 213 288 MAX
Second Right
U Turn
Second Left
Left Turn
Through
Right Turn
Second Right
U Turn
Second Left
Left Turn 400 23 3 19 29 141 32 98 208 NO
Through
Right Turn 1,200 6 1 5 7 79 12 60 96 NO
Second Right
NB
SB
EB
WB
Fehr & Peers 12/20/2016

Vissim Post‐Processor Richards Blvd ‐ Olive Dr Circulation
Average Results from 10 Runs L St Extension NB Only ‐ Cumulative Conditions
Queue Length PM Peak Hour
Intersection 8 Richards Blvd/I‐80 EB Ramps Signal
Storage Average Queue (ft) Maximum Queue (ft) Exceeds
Direction Movement (ft) Average Std. Dev. Minimum Maximum Average Std. Dev. Minimum Maximum Storage?
U Turn
Second Left
Left Turn
Through 500 140 20 120 182 465 55 402 557 NO
Right Turn 500 117 19 97 158 435 55 373 527 NO
Second Right
U Turn
Second Left
Left Turn 360 58 7 46 69 244 33 187 277 NO
Through 1,300 20 2 17 22 247 35 201 312 NO
Right Turn
Second Right
U Turn
Second Left
Left Turn
Through
Right Turn
Second Right
U Turn
Second Left
Left Turn 160 58 2 54 63 272 38 222 356 MAX
Through
Right Turn 1,260 9 2 7 11 115 25 87 164 NO
Second Right
SB
EB
WB
NB
Fehr & Peers 12/20/2016

Vissim Post‐Processor Richards Blvd ‐ Olive Dr Circulation
Average Results from 10 Runs L St Extension NB Only ‐ Cumulative Conditions
Queue Length PM Peak Hour
Intersection 9 Research Park Dr/Richards Blvd Signal
Storage Average Queue (ft) Maximum Queue (ft) Exceeds
Direction Movement (ft) Average Std. Dev. Minimum Maximum Average Std. Dev. Minimum Maximum Storage?
U Turn
Second Left
Left Turn 100 30 3 25 36 129 17 109 158 MAX
Through 620 5 1 3 7 85 19 67 114 NO
Right Turn
Second Right
U Turn
Second Left
Left Turn 120 26 13 18 56 223 178 93 635 MAX
Through 3,940 94 37 48 165 552 135 268 636 NO
Right Turn
Second Right
U Turn 440 140 19 109 171 542 27 473 571 MAX
Second Left
Left Turn 440 140 19 109 171 542 27 473 571 MAX
Through 440 91 8 69 97 540 42 423 573 MAX
Right Turn
Second Right
U Turn
Second Left
Left Turn 80 18 8 9 31 418 438 68 1,122 MAX
Through 180 412 123 283 597 1,134 6 1,120 1,145 AVG
Right Turn
Second Right
WB
NB
SB
EB
Fehr & Peers 12/20/2016
Vissim Post‐Processor Richards Blvd ‐ Olive Dr Circulation
Average Results from 10 Runs L St Extension NB Only ‐ Cumulative Conditions
Queue Length PM Peak Hour
Intersection 0 Side‐street Stop
Storage Average Queue (ft) Maximum Queue (ft) Exceeds
Direction Movement (ft) Average Std. Dev. Minimum Maximum Average Std. Dev. Minimum Maximum Storage?
U Turn
Second Left
Left Turn
Through
Right Turn
Second Right
U Turn
Second Left
Left Turn
Through
Right Turn
Second Right
U Turn
Second Left
Left Turn
Through
Right Turn
Second Right
U Turn
Second Left
Left Turn
Through
Right Turn
Second Right
NB
SB
EB
WB
Fehr & Peers 12/20/2016

Vissim Post‐Processor Richards Blvd ‐ Olive Dr Circulation
Average Results from 10 Runs L St Extension NB Only ‐ Cumulative Conditions
Queue Length PM Peak Hour
Intersection 0 // Signal
Storage Average Queue (ft) Maximum Queue (ft) Exceeds
Direction Movement (ft) Average Std. Dev. Minimum Maximum Average Std. Dev. Minimum Maximum Storage?
U Turn
Second Left
Left Turn
Through
Right Turn
Second Right
U Turn
Second Left
Left Turn
Through
Right Turn
Second Right
U Turn
Second Left
Left Turn
Through
Right Turn
Second Right
U Turn
Second Left
Left Turn
Through
Right Turn
Second Right
U Turn
Second Left
Left Turn
Through
Right Turn
Second Right
NB
SB
SE
EB
WB
Fehr & Peers 12/20/2016