Embed Size (px)
Citation preview

Rice Outlook and
Baseline Projections
University of Arkansas Webinar Series February 13, 2015
Nathan Childs,
Economic Research Service,
USDA
PART 1
THE GLOBAL RICE MARKET
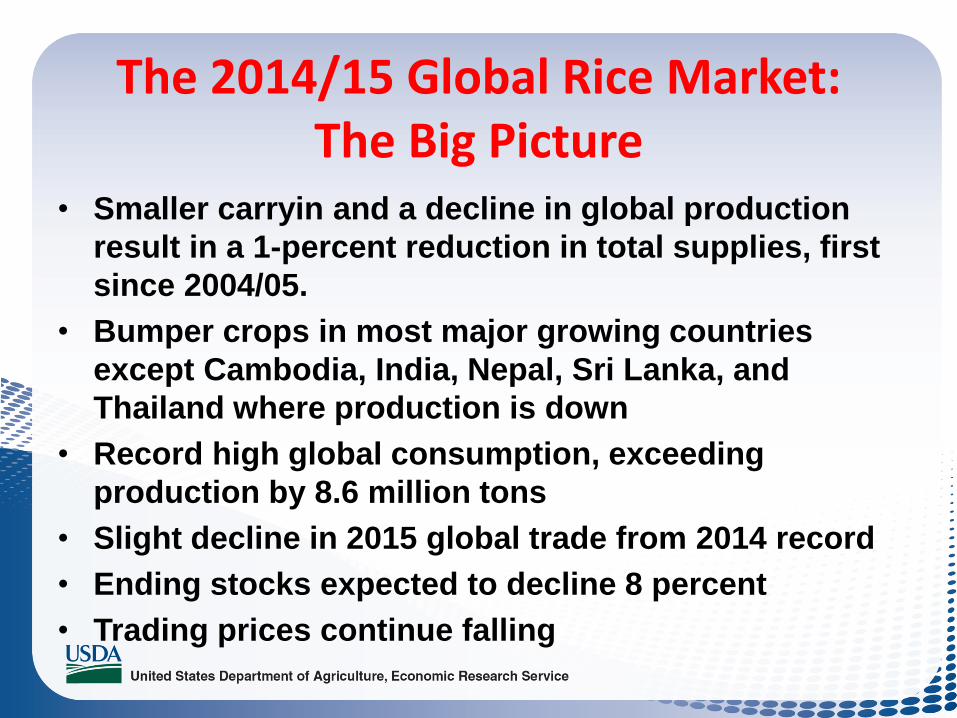
The 2014/15 Global Rice Market: The Big Picture
• Smaller carryin and a decline in global production
result in a 1-percent reduction in total supplies, first
since 2004/05.
• Bumper crops in most major growing countries
except Cambodia, India, Nepal, Sri Lanka, and
Thailand where production is down
• Record high global consumption, exceeding
production by 8.6 million tons
• Slight decline in 2015 global trade from 2014 record
• Ending stocks expected to decline 8 percent
• Trading prices continue falling

The 2014/15 Global Rice Market: Weaker Trading Prices
• Driving factors:
– Stronger dollar
– Much lower fuel prices
– Bumper crops in several major importing
countries—Philippines, Indonesia, Malaysia
– Continued release of large stocks of rice held by
the Government of Thailand
– Lower overall commodity prices

Global Trading Prices
Continue to Decline
U.S. LONG GRAIN, NO. 2, 4%
THAI 100 PERCENT B
February 2015 preliminary. All prices quoted “free-on-board” vessel at local port. Sources: Thai
quotes, U.S. Ag Counselor, Bangkok; U.S. and Vietnam quotes, Creed Rice Market Report.
$/TON
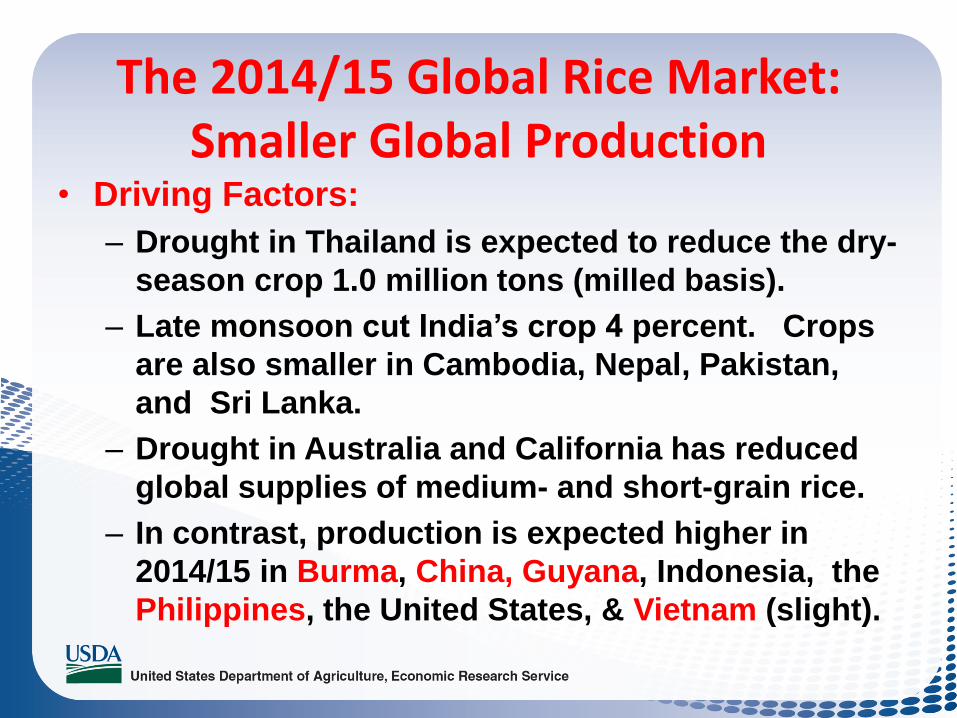
The 2014/15 Global Rice Market: Smaller Global Production
• Driving Factors:
– Drought in Thailand is expected to reduce the dry-
season crop 1.0 million tons (milled basis).
– Late monsoon cut India’s crop 4 percent. Crops
are also smaller in Cambodia, Nepal, Pakistan,
and Sri Lanka.
– Drought in Australia and California has reduced
global supplies of medium- and short-grain rice.
– In contrast, production is expected higher in
2014/15 in Burma, China, Guyana, Indonesia, the
Philippines, the United States, & Vietnam (slight).

Global rice supplies are projected to decline 1 percent in 2014/15
0
100
200
300
400
500
600
700
90/91 95/96 00/01 05/06 09/10 14/15
Production Carryin
Milled basis. 2014/15 are forecasts. Source: Production, Supply, and Distribution database,
Foreign Agricultural Service, USDA, http://www.fas.usda.gov/psd.
MIL. TONS

The Global Rice Market: Near-record 2015 Imports
• Driving factors:
– Another year of record imports by China and Sub-
Saharan Africa, the largest global buyers
– Continued strong purchases by the Philippines
– Abundant exportable supplies in Asia and the
Western Hemisphere
– Declining trading prices for long-grain and
medium-grain.
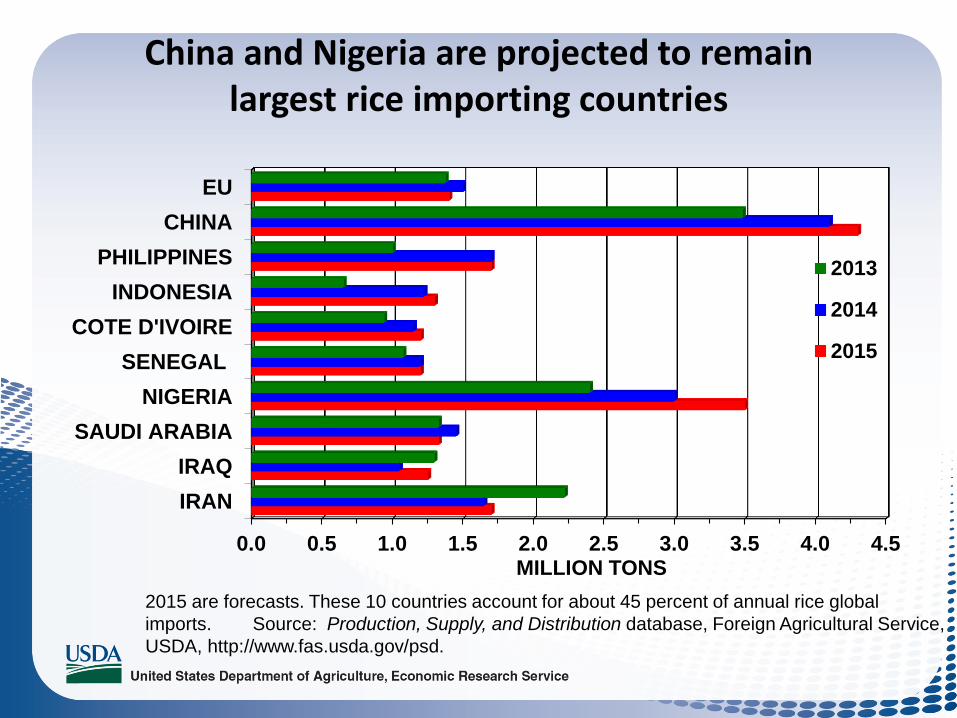
China and Nigeria are projected to remain largest rice importing countries
0.0 0.5 1.0 1.5 2.0 2.5 3.0 3.5 4.0 4.5
IRAN
IRAQ
SAUDI ARABIA
NIGERIA
SENEGAL
COTE D'IVOIRE
INDONESIA
PHILIPPINES
CHINA
EU
MILLION TONS
2013
2014
2015
2015 are forecasts. These 10 countries account for about 45 percent of annual rice global
imports. Source: Production, Supply, and Distribution database, Foreign Agricultural Service,
USDA, http://www.fas.usda.gov/psd.
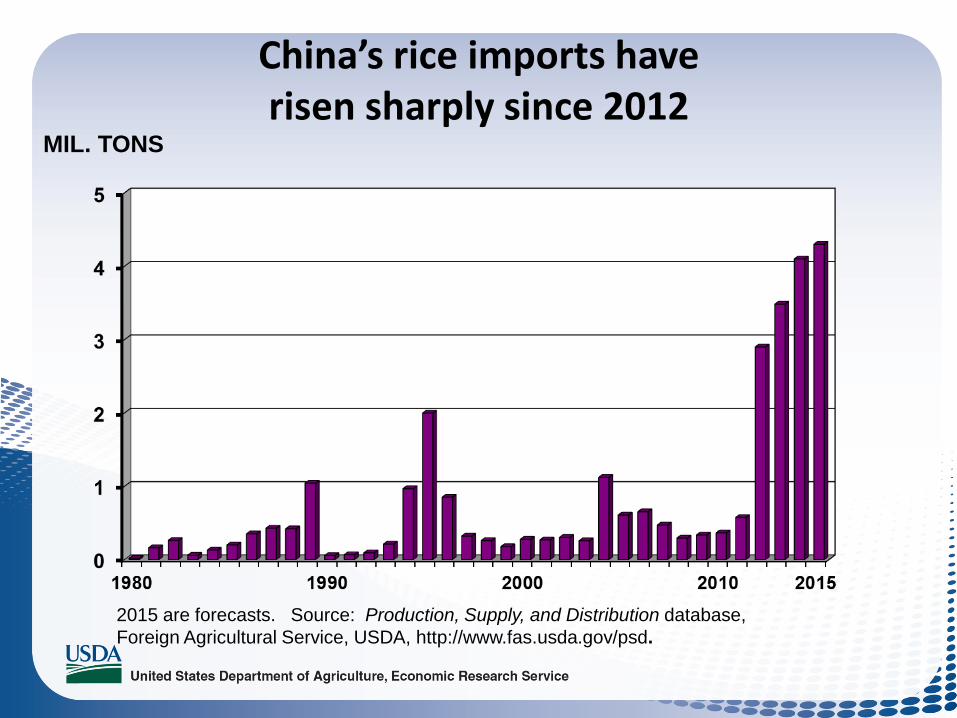
China’s rice imports have risen sharply since 2012
2015 are forecasts. Source: Production, Supply, and Distribution database,
Foreign Agricultural Service, USDA, http://www.fas.usda.gov/psd.
MIL. TONS
The Global Rice Market: 2015 Global Exports
• Driving factors
– A 19-percent drop in India’s exports…
– ….plus smaller declines in shipments from
Australia, Egypt and Brazil…
– …are expected to slightly offset stronger exports
from Cambodia, Pakistan, Thailand (slight
increase), the United States, and Vietnam.
– Despite the projected 1.6-percent decline in global
rice trade, global exports in 2015 are projected to
be the second highest on record.
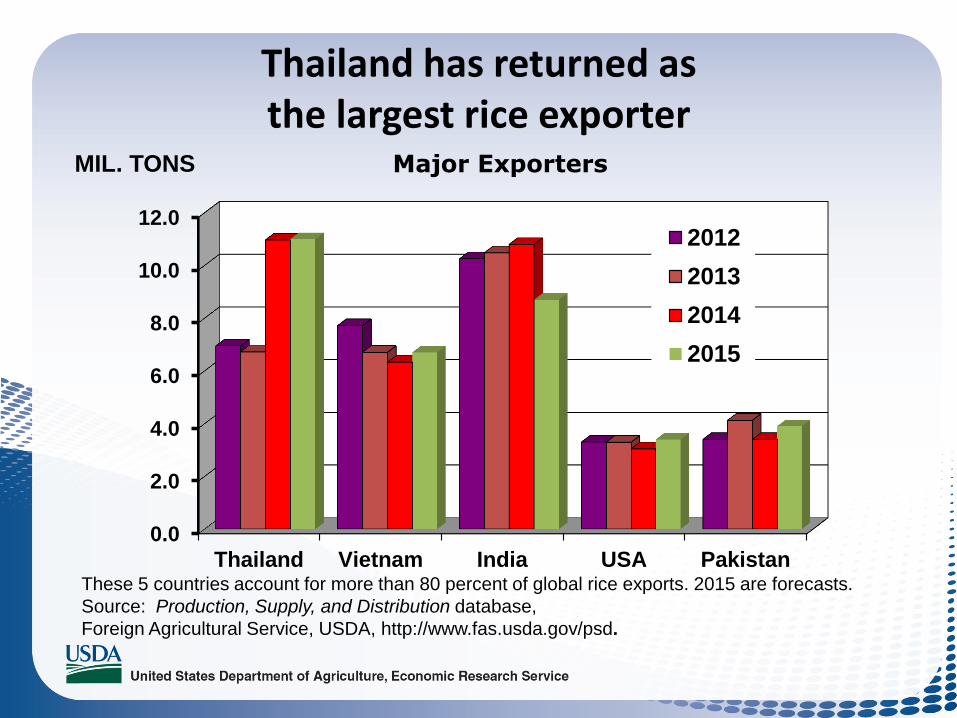
Thailand has returned as the largest rice exporter
0.0
2.0
4.0
6.0
8.0
10.0
12.0
Thailand Vietnam India USA Pakistan
2012
2013
2014
2015
These 5 countries account for more than 80 percent of global rice exports. 2015 are forecasts.
Source: Production, Supply, and Distribution database,
Foreign Agricultural Service, USDA, http://www.fas.usda.gov/psd.
MIL. TONS Major Exporters
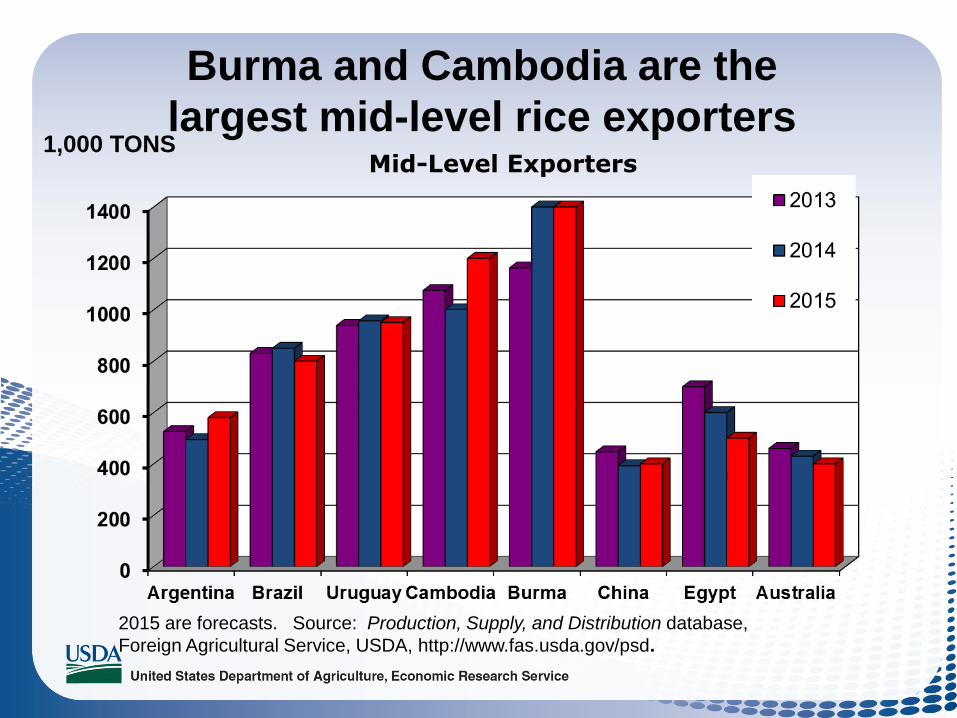
Burma and Cambodia are the
largest mid-level rice exporters
2015 are forecasts. Source: Production, Supply, and Distribution database,
Foreign Agricultural Service, USDA, http://www.fas.usda.gov/psd.
1,000 TONS Mid-Level Exporters
The 2014/15 Global Rice Market: Record Domestic and Residual Use
• Driving factors
– Record use in China, Bangladesh, Southeast Asia,
and Sub-Saharan Africa
– Near-record use in the United States and India
• Reasons:
– Population growth and rising incomes in some
developing countries, particularly in Sub-Saharan
Africa.
– While use continues to decline in South Korea
and Japan due to diet diversification.
The 2014/15 Global Rice Market: Global Ending Stocks
• Analysis and driving factors
– Global stocks are projected to decline 8 percent
and will be the smallest since 2009/10.
– Thailand, India, and Indonesia account for most of
the decline in global stocks.
– Thailand continues to sell its stocks purchased
under its Paddy Pledging Scheme.
– India’s production has not matched its record
pace of exports and near-record consumption.
– At 20.4 percent, the global stocks-to-use ratio is
the lowest since 2007/08.
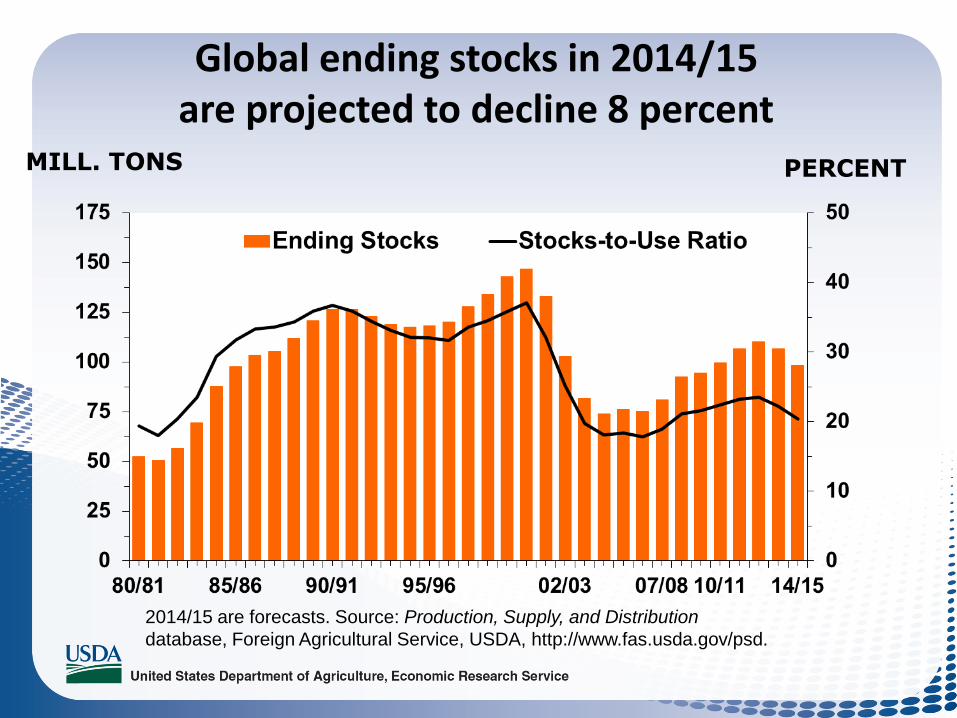
Global ending stocks in 2014/15 are projected to decline 8 percent
2014/15 are forecasts. Source: Production, Supply, and Distribution
database, Foreign Agricultural Service, USDA, http://www.fas.usda.gov/psd.
MILL. TONS PERCENT
USDA’s Global Rice Baseline Forecasts
– Assumptions
• Projections made as of the November 2014 World
Agricultural Supply and Demand Estimates.
• Assumes normal weather throughout the 10-year
forecast period.
• Assumes current policies and programs remain in
effect.
• Is a multi-agency modelling effort involving
analysts from FAS, FSA, the WAOB, and ERS.

USDA’s Global Rice Baseline Forecasts
– 2015/16
• Small increase in global area.
• Slightly higher average global yield.
• Results in a record global rice crop.
• Record total use, with total use again exceeding
production and…
• …pulling global ending stocks down.
• Increased global trade
Global Rice 10-Year Baseline Trade Forecasts
– IMPORTERS
• Global rice trade is projected to grow 1.8 percent
per year from 2015/16 to 2024/25, reaching 49.5
million tons, up 41 percent or 14.5 million tons
from the previous decade average.
• China, West Africa (especially Nigeria), Southeast
Asia, and the Middle East remain the top markets.
• Although China’s imports trend down, China
remains the world’s largest importing country
throughout the baseline, purchasing most of its
rice from Southeast Asia.
Global Rice 10-Year Baseline Trade Forecasts
– IMPORTERS
• Nigeria remains the second largest importer.
• Trade as a share of consumption increases from
the current 8.6 percent to 9.5 percent.
• The next largest importers are Indonesia, Iran,
and the Philippines, each taking 1.9-2.2 million
tons a year by 2024/25. For all three countries,
production growth cannot keep pace with rising
use.
Global Rice 10-Year Baseline Trade Forecasts
– IMPORTERS
• Bangladesh’s imports rise rapidly from 0.6 million
tons in 2015/16 to almost 1.5 million tons by
2024/25. The average annual growth rate exceeds
10 percent, a result of strong population growth
and limited ability to expand area.
• Other major importing countries— Iraq and Saudi
Arabia—each take more than 1.5 million tons and
South Africa and Malaysia each import more than
1 million tons a year.

Global Rice 10-Year Baseline Trade Forecasts
– IMPORTERS
• In Canada and the United States, immigration
continues to support slightly higher per capita
consumption and modest import growth, with
aromatics accounting for bulk of U.S. imports.
Global Rice 10-Year Baseline Trade Forecasts
– EXPORTERS—LONG-GRAIN AND AROMATIC
• Thailand and Vietnam, typically the largest
exporters, account for 45 percent of world rice
exports and for 60 percent of the projected trade
growth in the coming decade.
• India remains the second largest exporter through
2016/17, then drops to number three behind
Vietnam. India’s exports increase after 2017/18,
but never exceed 8.3 million tons.
• Pakistan’s exports increase slightly over the next
decade. Pakistan maintains market share and is
the world’s fourth largest exporter and United
States is the fifth-largest exporter.
•

India’s rice exports are projected to decline from current highs
0
2
4
6
8
10
12
1990 1995 2000 2005 2010 2015 2020 2025
Source: USDA’s Agricultural Baseline Projections, http://www.ers.usda.gov/topics/farm-
economy/agricultural-baseline-projections.aspx
MIL. TONS
Global Rice 10-Year Baseline Trade Forecasts
– EXPORTERS—LONG GRAIN
• U.S. exports post a modest increase of 1 percent
a year, but the U.S. market share declines.
• Burma and Cambodia are projected to expand
exports over the entire baseline, returning as
major rice exporters, largely due to rising
production. Exports are projected to be about 1.7
million tons by 2024/25 for both countries.
• Exports from South America—primarily
Argentina, Brazil, Guyana, Paraguay, and
Uruguay—expand over the next decade and
account for almost 11 percent of global trade.
Global Rice 10-Year Baseline Trade Forecasts
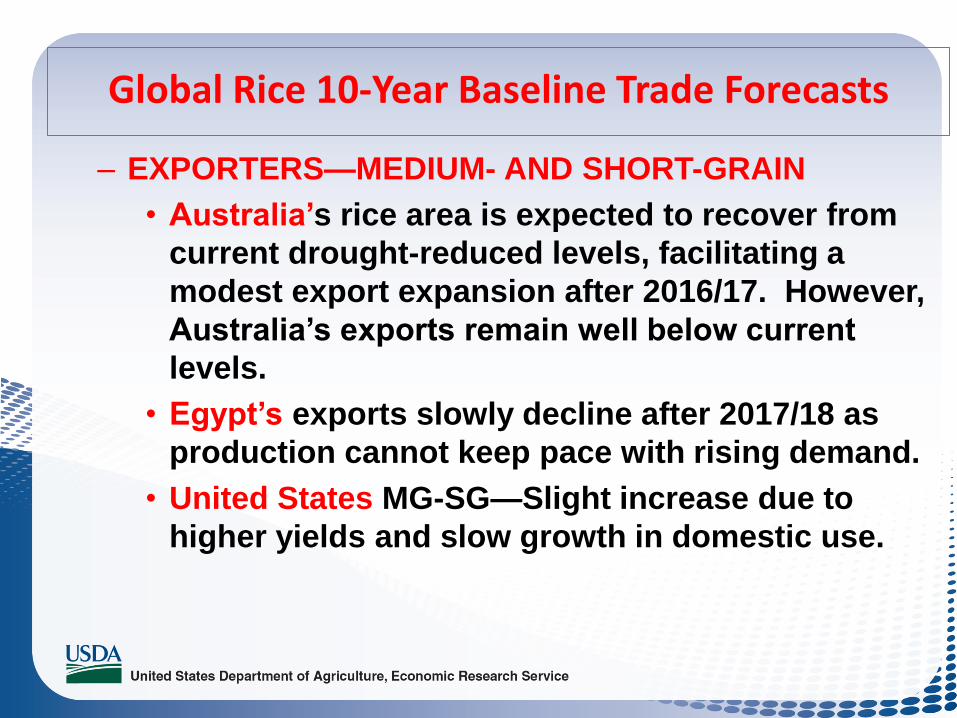
– EXPORTERS—MEDIUM- AND SHORT-GRAIN
• Australia’s rice area is expected to recover from
current drought-reduced levels, facilitating a
modest export expansion after 2016/17. However,
Australia’s exports remain well below current
levels.
• Egypt’s exports slowly decline after 2017/18 as
production cannot keep pace with rising demand.
• United States MG-SG—Slight increase due to
higher yields and slow growth in domestic use.
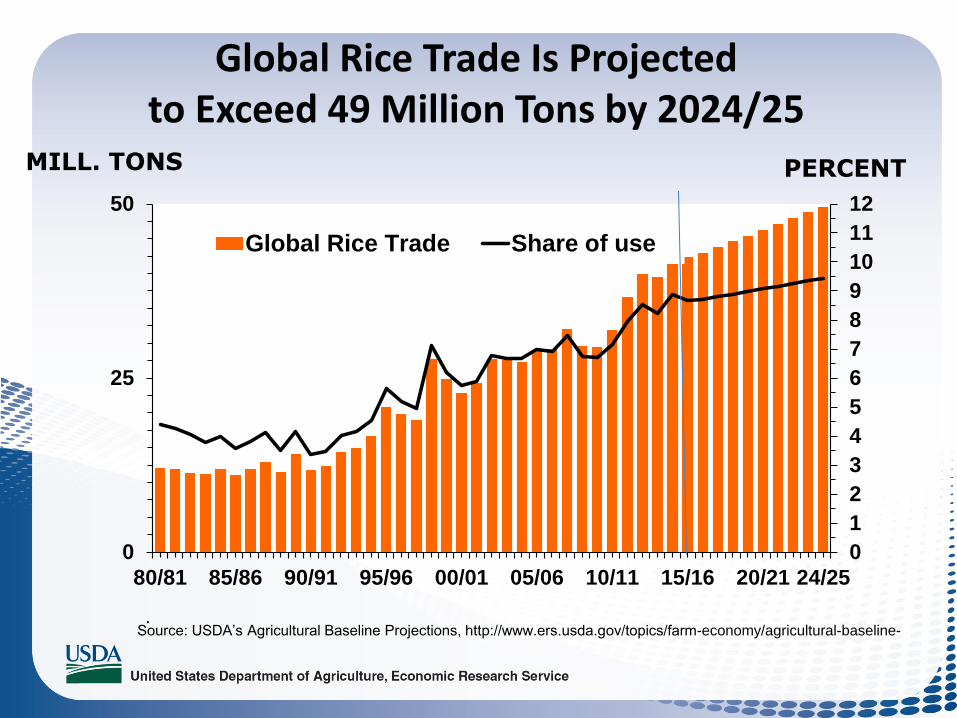
Global Rice Trade Is Projected to Exceed 49 Million Tons by 2024/25
0
1
2
3
4
5
6
7
8
9
10
11
12
0
25
50
80/81 85/86 90/91 95/96 00/01 05/06 10/11 15/16 20/21 24/25
Global Rice Trade Share of use
Source: USDA’s Agricultural Baseline Projections, http://www.ers.usda.gov/topics/farm-economy/agricultural-baseline-.
MILL. TONS PERCENT

PART 2
THE U.S. RICE MARKET
OUTLOOK AND BASELINE
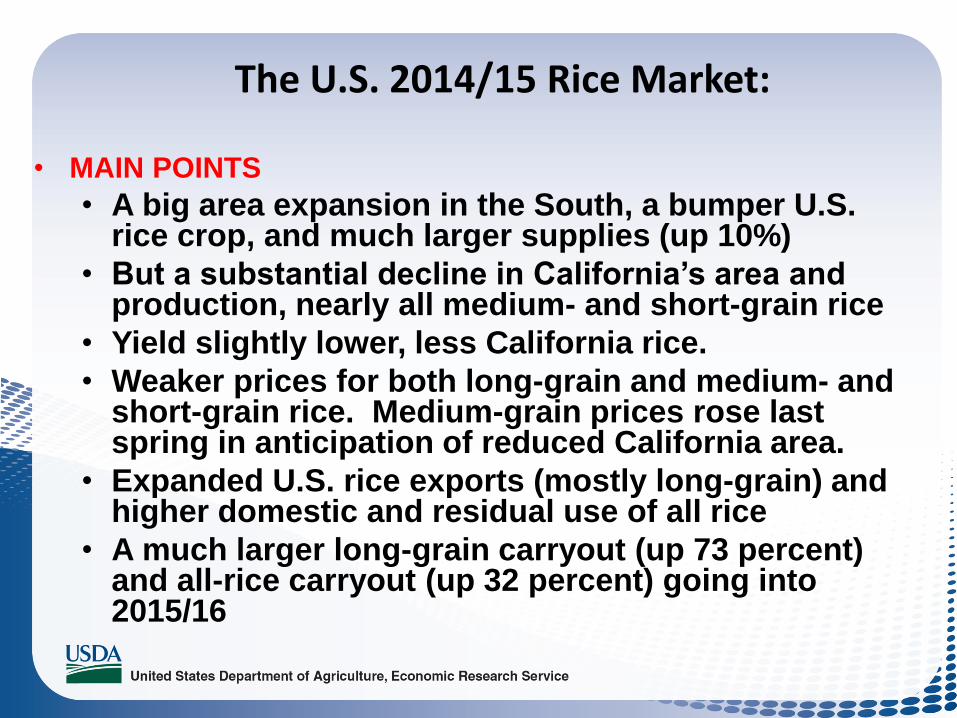
The U.S. 2014/15 Rice Market:
• MAIN POINTS
• A big area expansion in the South, a bumper U.S. rice crop, and much larger supplies (up 10%)
• But a substantial decline in California’s area and production, nearly all medium- and short-grain rice
• Yield slightly lower, less California rice.
• Weaker prices for both long-grain and medium- and short-grain rice. Medium-grain prices rose last spring in anticipation of reduced California area.
• Expanded U.S. rice exports (mostly long-grain) and higher domestic and residual use of all rice
• A much larger long-grain carryout (up 73 percent) and all-rice carryout (up 32 percent) going into 2015/16

The 2014/15 U.S. Rice Market: Exports
– Total U.S. exports
– Projected 11 percent higher than last year.
– U.S. long-grain exports
– Up 14 percent. WHY?
– Larger U.S. supplies and more competitive prices
– Expanded sales to core markets in Latin America
– U.S. medium- and short-grain exports
– Up 4 percent from 2013/14. WHY?
– Tighter supplies in Egypt and Australia, major
competitors of the United States.
– Big increase in Southern medium-grain area

The U.S. 2014/15 Rice Market:
• Current U.S. Export Situation
• Long-grain rough-rice commercial exports and sales, nearly all to Latin America, are 15 percent ahead of a year earlier.
• In contrast, medium- and short-grain milled exports are 27.5 percent behind last year, especially to Northeast Asia, the top market.
• Commercial sales and shipments to Sub-Saharan Africa—all long-grain milled rice—are 39 percent behind a year ago.
• Shipments to the Middle East are ahead of a year earlier, especially to Iraq and Turkey.

U.S. exports & sales were ahead of year
earlier to Colombia, Iraq, Venezuela, & Turkey
0 100 200 300 400 500 600
MEXICO
VENEZUELA
COLOMBIA
HAITI
CENTRAL AMERICA
IRAQ
TURKEY
SAUDI ARABIA
1,000 tons (product-weight)
January 30, 2014
January 29, 2015
Source: U.S. Export Sales, Foreign Agricultural Service, U.S. Department of Agriculture, http://apps.fas.usda.gov/export-sales/esrd1.html
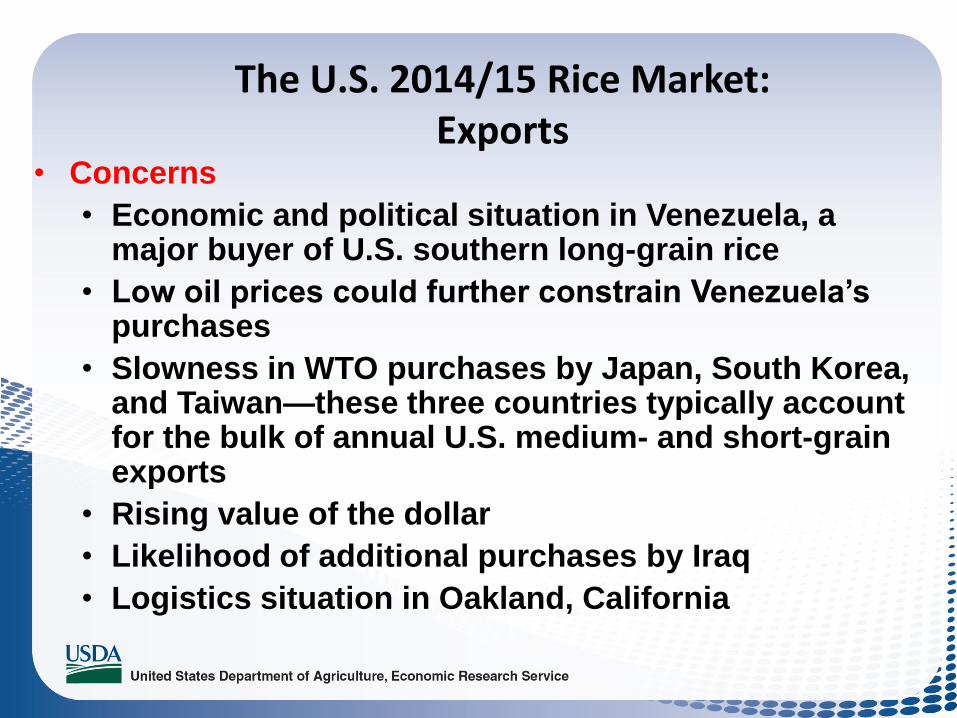
The U.S. 2014/15 Rice Market: Exports
• Concerns
• Economic and political situation in Venezuela, a major buyer of U.S. southern long-grain rice
• Low oil prices could further constrain Venezuela’s purchases
• Slowness in WTO purchases by Japan, South Korea, and Taiwan—these three countries typically account for the bulk of annual U.S. medium- and short-grain exports
• Rising value of the dollar
• Likelihood of additional purchases by Iraq
• Logistics situation in Oakland, California
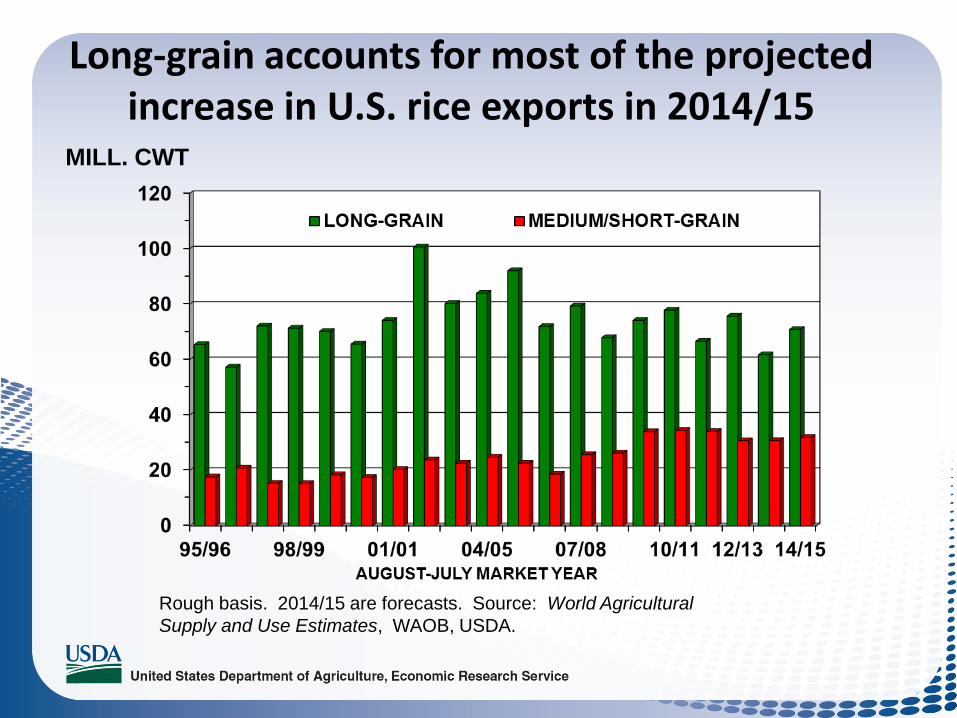
Long-grain accounts for most of the projected increase in U.S. rice exports in 2014/15
Rough basis. 2014/15 are forecasts. Source: World Agricultural
Supply and Use Estimates, WAOB, USDA.
MILL. CWT
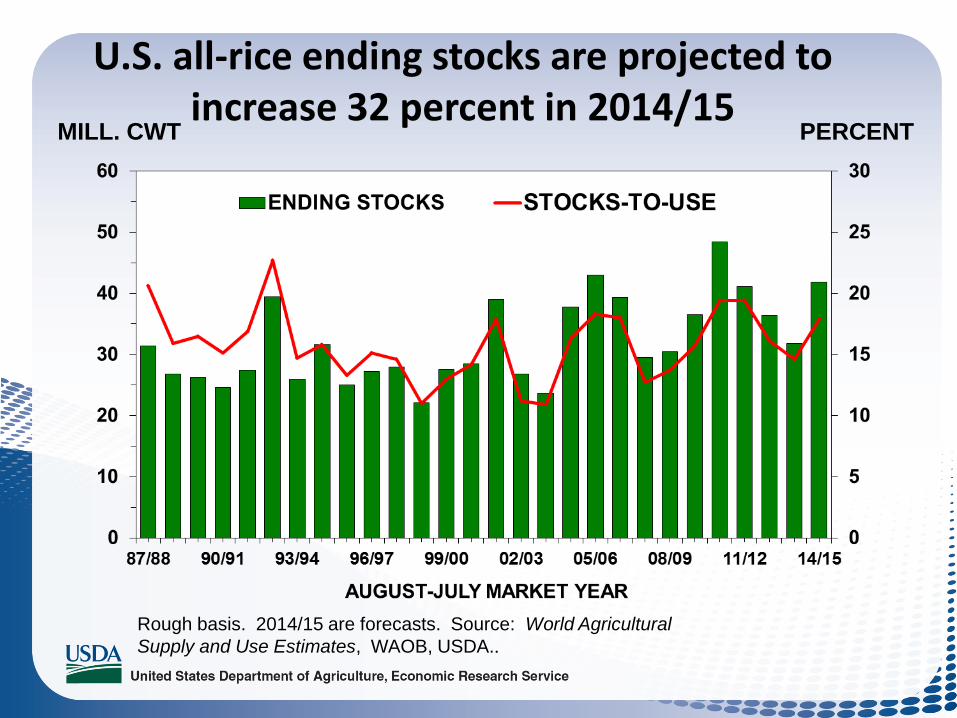
U.S. all-rice ending stocks are projected to increase 32 percent in 2014/15
Rough basis. 2014/15 are forecasts. Source: World Agricultural
Supply and Use Estimates, WAOB, USDA..
MILL. CWT PERCENT
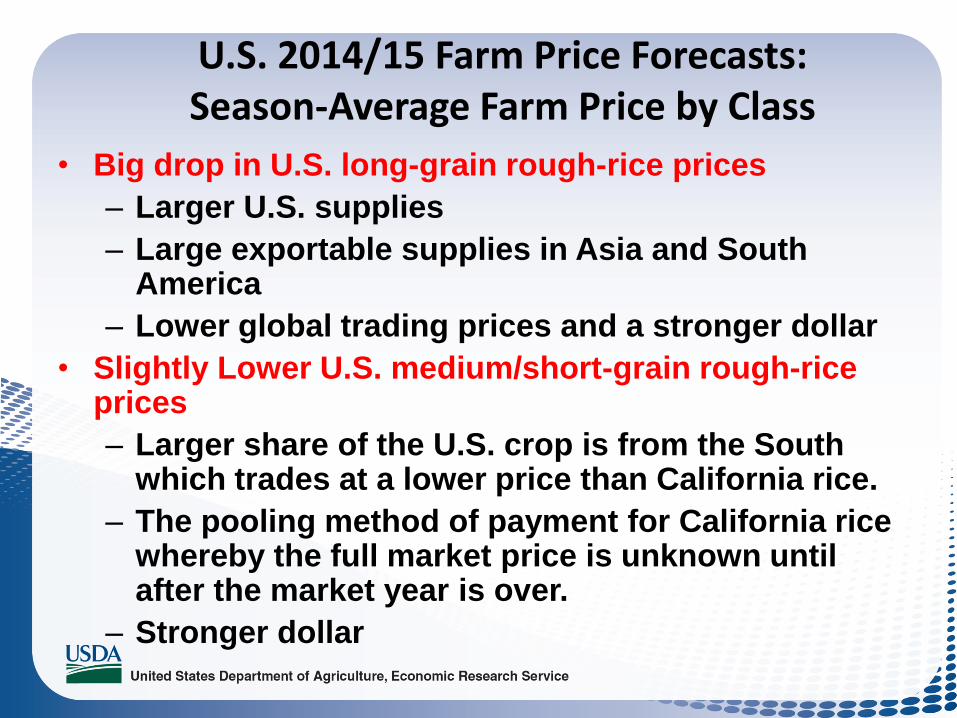
U.S. 2014/15 Farm Price Forecasts: Season-Average Farm Price by Class
• Big drop in U.S. long-grain rough-rice prices
– Larger U.S. supplies
– Large exportable supplies in Asia and South America
– Lower global trading prices and a stronger dollar
• Slightly Lower U.S. medium/short-grain rough-rice prices
– Larger share of the U.S. crop is from the South which trades at a lower price than California rice.
– The pooling method of payment for California rice whereby the full market price is unknown until after the market year is over.
– Stronger dollar
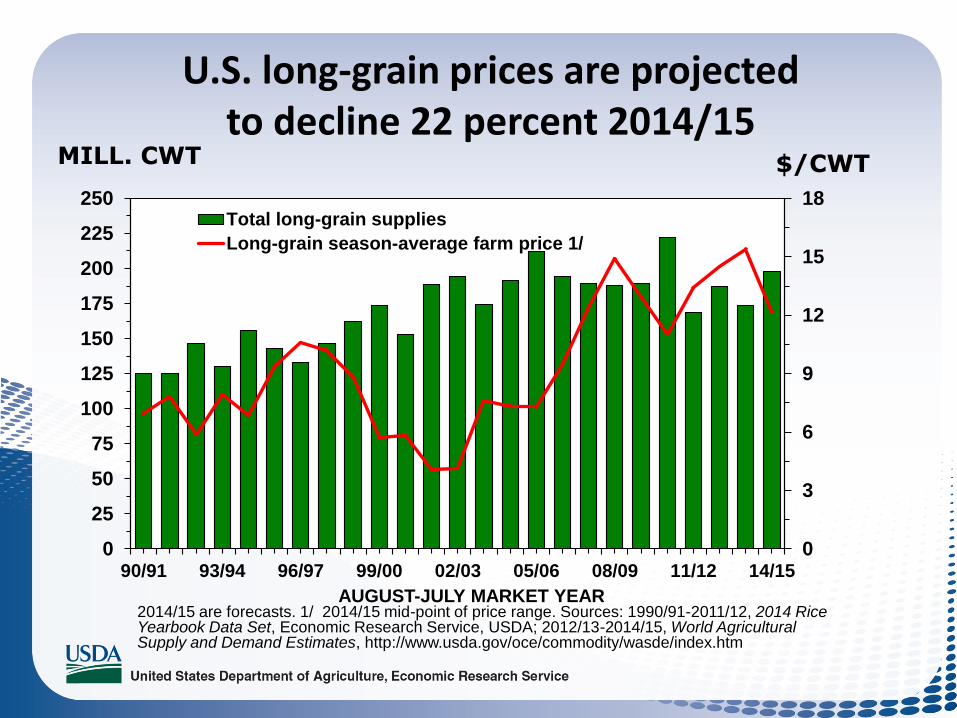
U.S. long-grain prices are projected
to decline 22 percent 2014/15
0
3
6
9
12
15
18
0
25
50
75
100
125
150
175
200
225
250
90/91 93/94 96/97 99/00 02/03 05/06 08/09 11/12 14/15
AUGUST-JULY MARKET YEAR
Total long-grain supplies
Long-grain season-average farm price 1/
2014/15 are forecasts. 1/ 2014/15 mid-point of price range. Sources: 1990/91-2011/12, 2014 Rice Yearbook Data Set, Economic Research Service, USDA; 2012/13-2014/15, World Agricultural Supply and Demand Estimates, http://www.usda.gov/oce/commodity/wasde/index.htm
MILL. CWT $/CWT

U.S. medium- and short-grain rough-rice prices
are projected to decline 5 percent 2014/15
2014/15 are forecasts. 1/ 2014/15 mid-point of price range. Sources: 1990/91-2011/12, 2014 Rice Yearbook Data Set, Economic Research Service, USDA; 2012/13-2014/15, World Agricultural Supply and Demand Estimates, http://www.usda.gov/oce/commodity/wasde/index.htm
MILL. CWT $/CWT
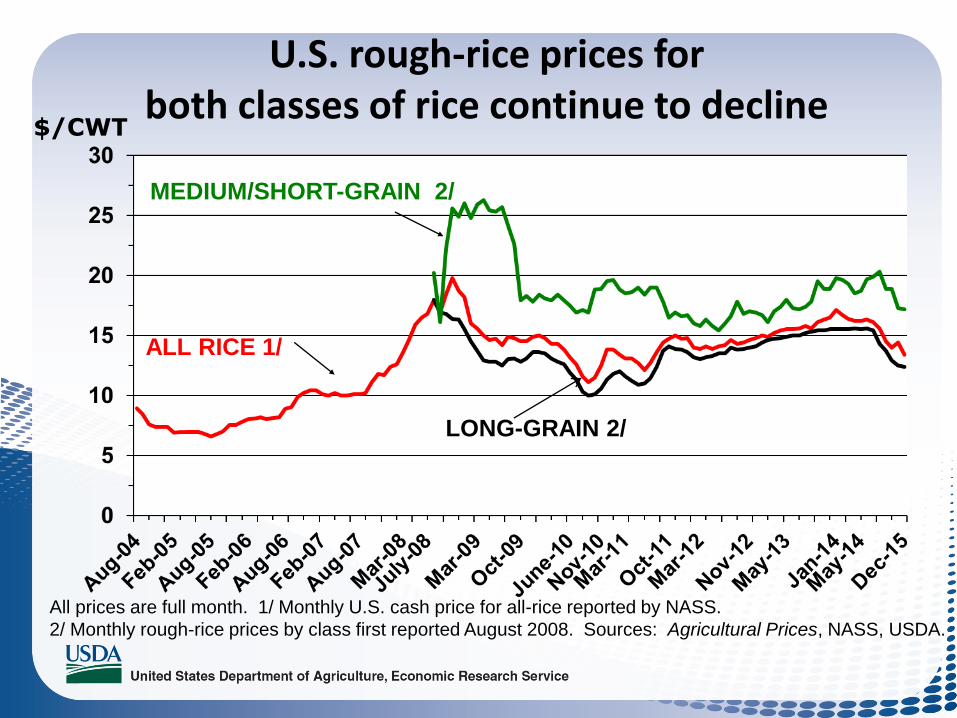
U.S. rough-rice prices for both classes of rice continue to decline
All prices are full month. 1/ Monthly U.S. cash price for all-rice reported by NASS.
2/ Monthly rough-rice prices by class first reported August 2008. Sources: Agricultural Prices, NASS, USDA.
ALL RICE 1/
LONG-GRAIN 2/
MEDIUM/SHORT-GRAIN 2/
$/CWT
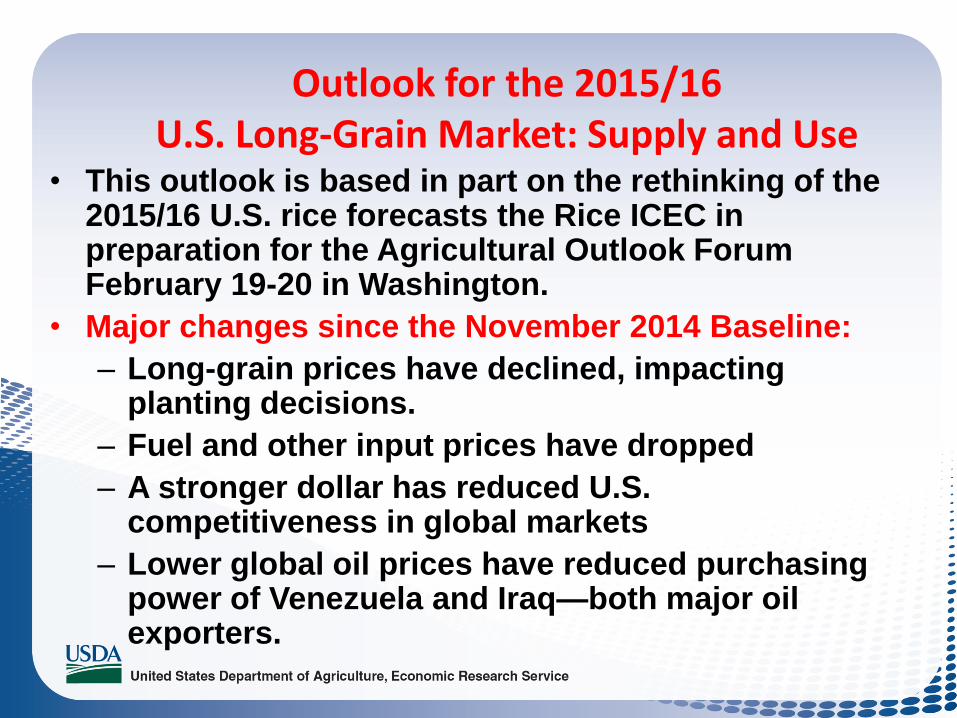
Outlook for the 2015/16 U.S. Long-Grain Market: Supply and Use
• This outlook is based in part on the rethinking of the 2015/16 U.S. rice forecasts the Rice ICEC in preparation for the Agricultural Outlook Forum February 19-20 in Washington.
• Major changes since the November 2014 Baseline:
– Long-grain prices have declined, impacting planting decisions.
– Fuel and other input prices have dropped
– A stronger dollar has reduced U.S. competitiveness in global markets
– Lower global oil prices have reduced purchasing power of Venezuela and Iraq—both major oil exporters.

Outlook for the 2015/16 U.S. Long-Grain Market: Supply and Use
• Much larger carryin
• A small area decline and a long-term trend yield result in slightly smaller crop.
• Nearly steady imports and mostly aromatic rice from Asia
• Larger total long-grain supplies
• Expanded total use, with long-grain exports accounting for most of the expected increase
• Little change in ending stocks
• Weaker long-grain rough-prices
• A 2015/16 SAFP for long-grain rice well below the $14.00 per cwt reference price

Market changes since November that impact the 2015/16 U.S. Medium- and Short-grain forecasts
• U.S. medium- and short-grain rough-rice prices have declined, resulting in lower forecasts for the 2014/15 market year.
• U.S. sales have been slow to Northeast Asia, the largest market for U.S. medium- and short-grain rice.
• The dollar has strengthened, reducing U.S. competitiveness.
• U.S. milled rice prices for medium-grain rice have declined as well.
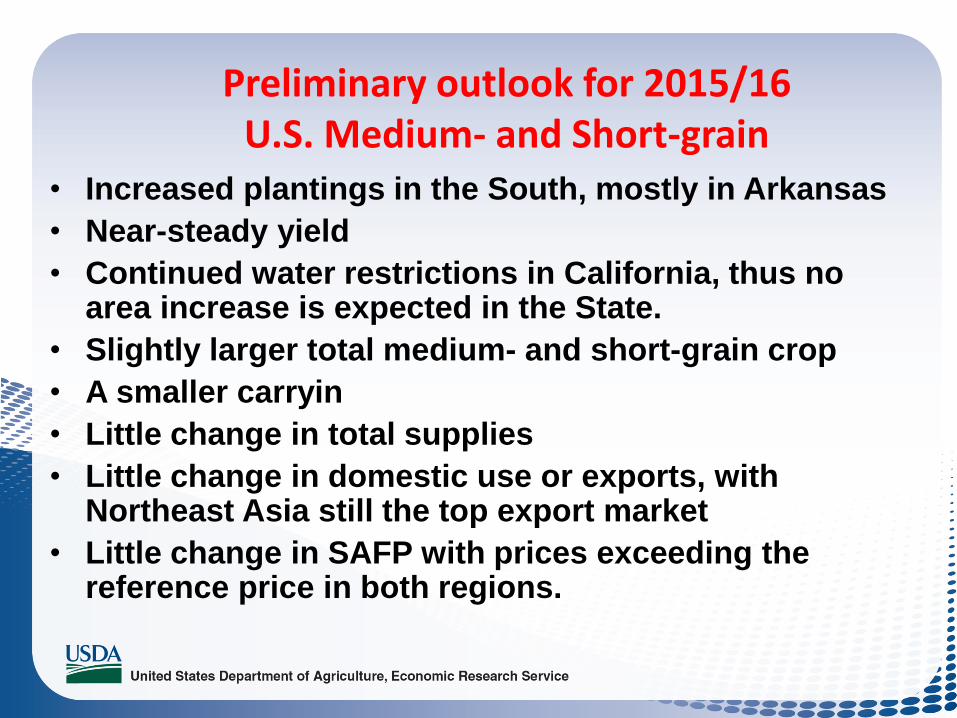
Preliminary outlook for 2015/16 U.S. Medium- and Short-grain
• Increased plantings in the South, mostly in Arkansas
• Near-steady yield
• Continued water restrictions in California, thus no area increase is expected in the State.
• Slightly larger total medium- and short-grain crop
• A smaller carryin
• Little change in total supplies
• Little change in domestic use or exports, with Northeast Asia still the top export market
• Little change in SAFP with prices exceeding the reference price in both regions.
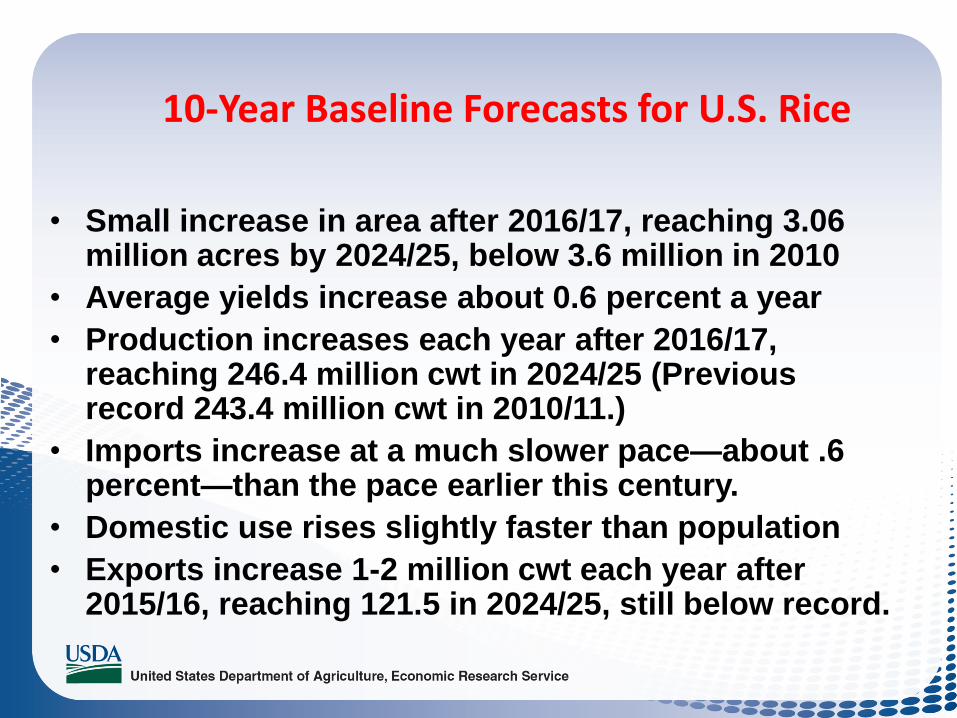
10-Year Baseline Forecasts for U.S. Rice
• Small increase in area after 2016/17, reaching 3.06 million acres by 2024/25, below 3.6 million in 2010
• Average yields increase about 0.6 percent a year
• Production increases each year after 2016/17, reaching 246.4 million cwt in 2024/25 (Previous record 243.4 million cwt in 2010/11.)
• Imports increase at a much slower pace—about .6 percent—than the pace earlier this century.
• Domestic use rises slightly faster than population
• Exports increase 1-2 million cwt each year after 2015/16, reaching 121.5 in 2024/25, still below record.
10-Year Baseline Forecasts for U.S. Rice
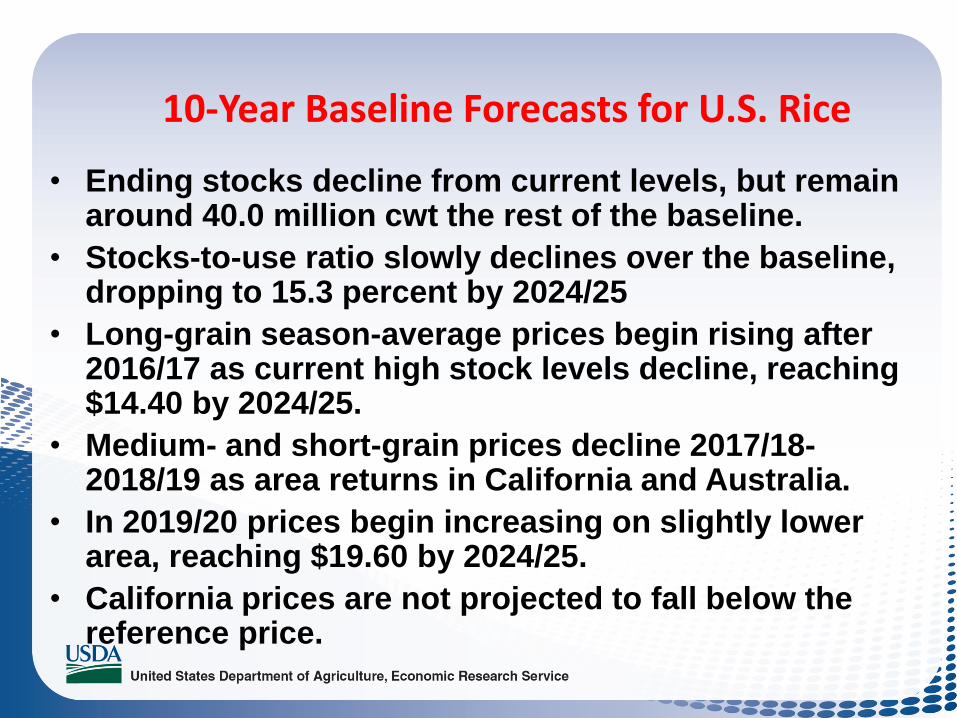
• Ending stocks decline from current levels, but remain around 40.0 million cwt the rest of the baseline.
• Stocks-to-use ratio slowly declines over the baseline, dropping to 15.3 percent by 2024/25
• Long-grain season-average prices begin rising after 2016/17 as current high stock levels decline, reaching $14.40 by 2024/25.
• Medium- and short-grain prices decline 2017/18-2018/19 as area returns in California and Australia.
• In 2019/20 prices begin increasing on slightly lower area, reaching $19.60 by 2024/25.
• California prices are not projected to fall below the reference price.
For More Information, Please Go To:
• The Economic Research Service Home Page http://ers.usda.gov/
• The Rice Topics Page http://www.ers.usda.gov/topics/crops/rice.aspx
• The Agricultural Baseline forecasts http://www.ers.usda.gov/topics/farm-economy/agricultural-baseline-projections.aspx