Embed Size (px)
Citation preview

RIAN LE ROUX
SAVINGS & GROWTH GROWTH & SAVINGS

RESEARCH UPDATE EDITION 9
WHO SAVES AND WHY?
• Saving = HH’s +
Co’s + Govt
• If Saving < Investment, we rely on foreigners to plug the gap
or investment suffers
• Saving = tax
revenue > current spending
• Excess tax revenues finance physical & social
infrastructure investment
• Savings =
undistributed profits
• These retained profits used to finance
replacement & expansion
• Foregoing
current consumption to enhance future consumption
• i.e. HH’s save to
finance future big expenses & retirement
I f we save too l i t t le? I n v e s t m e n t i s a k e y d r i v e r o f g r o w t h
Households Companies Government As a Nation
1

RESEARCH UPDATE EDITION 9
A FEW IMPORTANT REMINDERS
Saving and investment
interplay
• Sufficient saving is a necessary, but not a
sufficient, prerequisite for investment
• Or, without savings, investment cannot occur (or little saving = little investment)
• But, sufficient savings do not
guarantee that investment will occur
For investment to occur, macro-
conditions must be conducive, e.g:
• Good macro-economic conditions and prospects
• A business-friendly environment, incl policy certainty
and predictability (at macro and industry levels), good infrastructure, bureaucratic efficiency, political stability, entrenched property rights, etc, etc
Excess savings over investment will
either seek a home elsewhere (abroad)
or be returned to shareholders
2

RESEARCH UPDATE EDITION 9
JULY 2014: SA’S NATIONAL INVESTMENT & SAVINGS TROUBLE HAS ARRIVED
Gap required
from foreigners
Saving/investment gap is also equal to the current account balance
Investment as % of GDP
Saving as % of GDP
Source: MacroSolutions

RESEARCH UPDATE EDITION 9
1 Current account deficit
(how will it narrow?)
2 Portfolio flows
(at risk from Fed ‘tapering’)
3 Budget deficit
(slow growth = another year of slippage?)
4 Growth
(slow & slowing)
5 Labour troubles
(more of 2012?)
6 Electricity shortages
(a short term risk and a long term bind)
7 Employment
(where will the jobs come from?)
8 Inflation
(risks from the ZAR?)
9 Politics & policy
(policy paralysis as 2014 election nears?)
10 SARB policy reaction function
(what if inflation spikes?)
JULY 2013: WHY ARE FOREIGNERS CONCERNED ABOUT SA? TALK ABOUT A PERFECT STORM…
(ZAR HAD MOVED FROM R8.25/$ TO R10.00 OVER 1 YEAR…
4

RESEARCH UPDATE EDITION 9
1 Current account deficit
Little improvement, strike(s) still to hit
2 Portfolio flows
Still positive, but slower, volatile & at risk
3 Budget deficit
Another year of slippage now very likely
4 Growth
2014 now set to be slower than 2013
5 Labour troubles
Worse, far worse, than 2012/13
6 Electricity shortages
Major blackouts avoided, bind remains
7 Employment
Weak growth & strikes = even less hope
8 Inflation
Surprisingly muted, but pressures building
9 Politics & policy
Hopes remain, but expectations are low
10 SARB policy reaction function
SARB’s position getting more difficult
WHY ARE FOREIGNERS CONCERNED ABOUT SA? ALL REMAINED BAD OR GOT WORSE OVER THE PAST YEAR, TRIGGERING A GENERAL
CONFIDENCE SLUMP AND RATINGS DOWNGRADES…
5

RESEARCH UPDATE EDITION 9
1
• All three above harm economic role
players’ ability & willingness to save
• As a lack of saving can harm investment, a self-feeding vicious circle can occur
2
• C/A financing may not always be available, forcing investment & growth lower
• Current-spending driven fiscal deficit implies:
• limited room for infrastructure
expansion
• risks crowding out private
investment
• raising Govt saving through
higher taxes will lower private
sector saving ability/willingness
• The results of both above may be same as in 1
3
• Both these are bad for growth & saving (the
latter will flee abroad)
• Yet again, the risk of a vicious circle occurs
WHAT DO THE “10 CONCERNS” HAVE TO DO WITH SAVINGS? 10 INDIVIDUAL CONCERNS BOIL DOWN TO 3 BROAD ONES…
6
Slow growth trap,
little employment,
heavy government
dependency
Big deficits Social and/or fiscal
stability at risk?

RESEARCH UPDATE EDITION 9
7
SA SEEKING A GROWTH MODEL; POTENTIAL STUCK AT LESS THAN 3% P.A. SA DID ENJOY FAST GROWTH IN THE 1950/60’S AND AGAIN IN 2003/7
0
2
4
6
8
0
2
4
6
8
50 55 60 65 70 75 80 85 90 95 00 05 10 15 20
Annual GDP growth
5 year moving average
Source: MacroSolutions

RESEARCH UPDATE EDITION 9
WHY DID THE ECONOMY GROW SO FAST IN THE 1950’S & 1960’S? BOOMING MINING STIMULATES INDUSTRY, INFRASTRUCTURE AND TRADE
Mining GDP 1950 – 1971: 5.0 % p.a
Manufacturing GDP 1950 – 1971: 7½% p.a
Construction GDP 1950 – 1971: 6% % p.a 1960 – 1975: 10% p.a.
Trade GDP 1950 – 1970: 5½% p.a.
8
Source: MacroSolutions

RESEARCH UPDATE EDITION 9
9
SA SEEKING A GROWTH MODEL POTENTIAL STUCK AT LESS THAN 3% P.A.
0
2
4
6
8
0
2
4
6
8
50 55 60 65 70 75 80 85 90 95 00 05 10 15 20
Annual GDP growth
5 year moving average
2003/7: What happened here?
1950’/60’s: Mining, Infrastructure & Manufacturing booms
Source: MacroSolutions
RESEARCH UPDATE EDITION 9
10
SA SEEKING A GROWTH MODEL POTENTIAL STUCK AT LESS THAN 3% P.A.
0
2
4
6
8
0
2
4
6
8
50 55 60 65 70 75 80 85 90 95 00 05 10 15 20
Annual GDP growth
5 year moving average
2003/7: Global, Infrastructure & Consumer Credit booms
1950’/60’s: Mining, Infrastructure & Manufacturing booms
Source: MacroSolutions

RESEARCH UPDATE EDITION 9
11
PERHAPS 3% P.A. GDP GROWTH IS NOT AS BAD AS WE THINK…
0
2
4
6
8
0
2
4
6
8
50 55 60 65 70 75 80 85 90 95 00 05 10 15 20
Annual GDP growth
5 year moving average
Annual population growth
3% GDP growth with 1% population growth is as good as 5% GDP growth with 3% population growth
Source: MacroSolutions

RESEARCH UPDATE EDITION 9
12
SO, REAL DISPOSABLE INCOME PER CAPITA HAS RISEN SOLIDLY
SINCE 1995 AND AT THE SAME PACE AS IN THE 1950’S & ‘60’S
12500
15000
17500
21000
10000
25500
12500
15000
17500
21000
10000
25500
50 60 70 80 90 00 10 20
Up 44% since 1995, or some 2% p.a.,
same as in the period 1950’s to early-’70’s
3% GDP growth with 1% population growth
is as good as 5% GDP growth with 3% population growth
Source: MacroSolutions
RESEARCH UPDATE EDITION 9
13
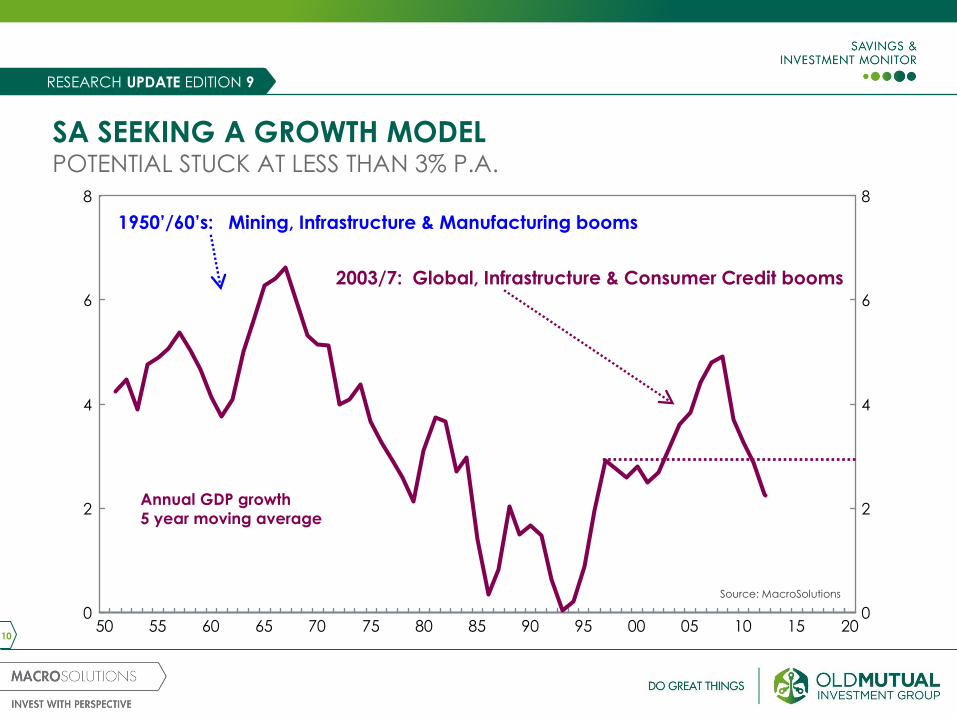
BUT A HUGE BACKLOG HAS OPENED UP DURING 2 DECADES
OF STAGNATION
14000
17500
25000
35000
10000
45000
17500
25000
35000
10000
45000
Had we continued to grow at the rate of the 1950’s & ‘60’s,
overall living standards would have been 50% higher today
and unemployment likely a lot lower
Failure to close the gap risks social-,
financial, fiscal- & policy instability
14000
50 60 70 80 90 00 10 20
Source: MacroSolutions

RESEARCH UPDATE EDITION 9
14
AND, WE HAVE MADE NO PROGRESS WITH UNEMPLOYMENT…
Unemployment rate 4.6m cannot find work
40
35
30
25
20
15
40
35
30
25
20
15 07 08 09 10 11 12 13 14
‘Expanded’ unemployment rate A further 2.2m have given up trying
Source: MacroSolutions

RESEARCH UPDATE EDITION 9
15
…ESPECIALLY YOUTH UNEMPLOYMENT BETTER MATRIC PASS RATES HAVE DONE ZERO FOR THE YOUTH UNEMPLOYMENT RATE
40
50
60
70
30
80
40
50
60
70
30
80
90 92 94 96 98 00 02 04 06 08 10 12 14
Matric pass rate
Unemployment rate for 15 – 24 year-olds
Source: MacroSolutions

RESEARCH UPDATE EDITION 9
OUR JOB SEEKERS FACE HUGE OBSTACLES…
16
SA’s
troublesome
labour
environment
is a huge
obstacle to
job seekers
Labour relations are keeping the
unemployed outsiders out
IMF:
“SA does not
exhibit the
characteristics of
fast job-creating
countries”
Higher quantitative
pass rates, YES
Better qualitative
supply of skills, NO Few get tertiary
education admission (lots then drop out too)
For the rest finding meaningful employment is very, very hard

RESEARCH UPDATE EDITION 9
…AS INCREASING MECHANISATION CLEARLY DEMONSTRATES…
17
100
120
140
160
100
180
120
140
160
180
70 75 80 85 90 95 00 05 10 15
Source: Macquarie Securities
Capital : labour ratio Units of capital per unit of labour used
in all production processes

RESEARCH UPDATE EDITION 9
PRIVATE SECTOR EMPLOYMENT IS INDEED WEAK
18
Source: SA Reserve Bank

RESEARCH UPDATE EDITION 9
SA is a constitutional democracy, politically stable, entrenched property
rights, contract enforcement is high, independent judiciary & high tax compliance
Macro-economic institutions
have credibility & macro
policy generally conservative
Huge mineral wealth,
huge tourism potential & proximity
to Africa are key strengths
Young population with a rapidly growing
middle class & well-developed social security system
are sources of growth & stability
Strong financial sector with sound
regulatory oversight & deep
capital markets
Many world class companies, a solid culture of
entrepreneurship
SA economy generally flexible
(‘survived’ many, many crises)
SA’S MANY STRENGTHS SUGGEST A HIGH GROWTH POTENTIAL
19
RESEARCH UPDATE EDITION 9
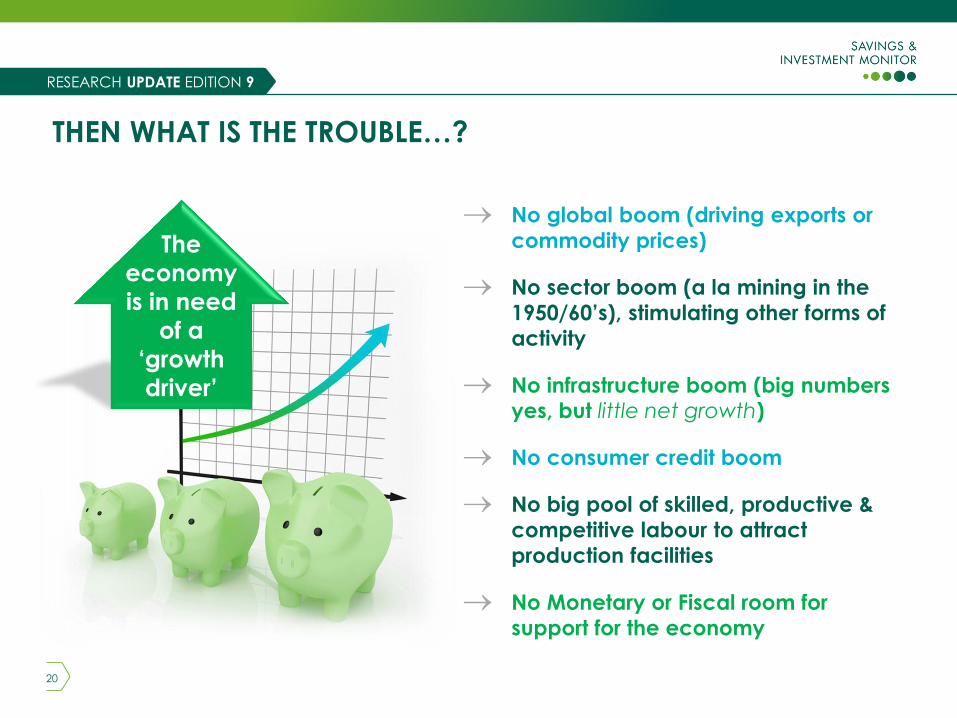
THEN WHAT IS THE TROUBLE…?
20
The
economy
is in need
of a
‘growth
driver’
No global boom (driving exports or
commodity prices)
No sector boom (a la mining in the
1950/60’s), stimulating other forms of
activity
No infrastructure boom (big numbers yes, but little net growth)
No consumer credit boom
No big pool of skilled, productive &
competitive labour to attract
production facilities
No Monetary or Fiscal room for
support for the economy

RESEARCH UPDATE EDITION 9
WHAT NEEDS TO BE DONE…?
21
Address cyclical problems:
Current account & fiscal
deficits & inflation pressures
Address the deep distrust
between Govt, Labour and
Business
Create greater policy
certainty, both on a macro
and sectoral level
Address SA’s highly
problematic labour relations
(may include elements of
labour law)
Speed up social &
economic infrastructure
spend (still many
bottlenecks)
Aggressively address
underperforming areas in
the public service (incl
education)
Ensure the more competitive
ZAR is not undermined by
higher inflation
Targeted support for key
industries

RESEARCH UPDATE EDITION 9
CAN, AND WILL, IT BE DONE…?
22
Confidence remains
generally very depressed
and expectations low
• Rating Agencies & analysts
skeptical over Govt’s
willingness to effect the right
reforms
• So, fears of little more than lip-
service to the NDP, despite
Govt’s contrary comments
• India: optimism surges as a
strong, reform-minded
government is elected
Still, an opportunity exists
• Govt bombarded with calls for
growth-enhancing reforms
(sense of crisis is building)
• A good plan is on the table
and Govt has committed to it
• Politics will give 5 years
breathing space (but political
will is still required)
• The Rand is more competitive
• The SARB has shown it will
protect the ZAR’s new-found
competitiveness
• The world economy is looking
better Failure to reform & grow faster risks social,
fiscal & financial instability

RESEARCH UPDATE EDITION 9
Only 2 things
drive savings
1. Ability to save
i.e. need sufficient
income
2. Willingness to save
income available,
choose to save
or not
SA situation • Many simply do not have
ability to save: will rely on
Govt/ family aid
• Many do have ability to
save, but choose not to or
simply fail to realise that
they need to save more
SA HOUSEHOLDS AND SAVINGS
23
RESEARCH UPDATE EDITION 9
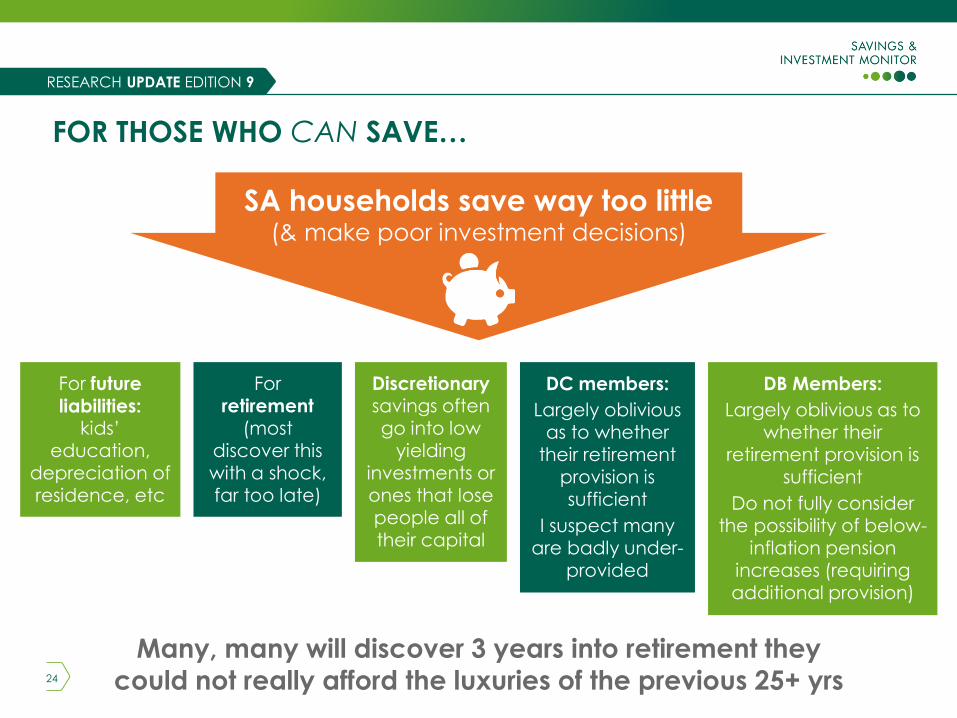
SA households save way too little (& make poor investment decisions)
Many, many will discover 3 years into retirement they
could not really afford the luxuries of the previous 25+ yrs
For future
liabilities: kids’
education,
depreciation of residence, etc
For retirement
(most discover this
with a shock, far too late)
DC members:
Largely oblivious as to whether
their retirement
provision is sufficient
I suspect many are badly under-
provided
Discretionary savings often go into low
yielding
investments or ones that lose people all of their capital
DB Members:
Largely oblivious as to whether their
retirement provision is
sufficient
Do not fully consider the possibility of below-
inflation pension increases (requiring
additional provision)
FOR THOSE WHO CAN SAVE…
24

RESEARCH UPDATE EDITION 9
AVERAGE TOTAL RETURNS (% P.A.) 1960 – MAY 2014
25
Sector
10
years
60-69
(%)
10
years
70-79
(%)
10
years
80-89
(%)
10
years
90-99
(%)
15
years
00-14*
(%)
55
years
60-14*
(%)
What we
expect*
(%)
Shares 15.8 21.3 26.7 16.6 18.1 19.6 11.0
LT Gilts 4.5 6.8 11.8 19.5 13.7 11.5 7.5
Cash 4.4 8.2 14.8 16.2 8.6 10.3 6.5
Inflation 2.5 10.3 14.7 9.4 6.2 8.4 5.5
* Our estimates over the longer term
Balanced Fund of 60:30:10
Over 53 years: 16.2% vs 8.4% inflation = 7.8% real
Going forward: 9.6% vs 5½% inflation = 4.1% real

RESEARCH UPDATE EDITION 9
3 5 y e a r s w o r k e d
% saved Inv. Return % of
pension taken
Pension as
% of last salary
13 9.0 6.5 32
30 9.0 6.5 75
13 13.5 6.5 75
13 9.0 15.0 75
17.5 12.0 6.5 75
All examples above assume 9% p.a. salary gain & 6% p.a. inflation
Realistic overall Investment Returns going forward ± 8% - 10% p.a.
(vs 17½% previous 14 years)
Message? Can’t rely on high investment returns to build your capital,
people will have to save far more
HOW MUCH MUST YOU SAVE? – A GUIDE
26

RESEARCH UPDATE EDITION 9
SA’ans
save too little & often make
poor
investment
decisions
So,
many are
ill-prepared for retirement,
without
knowing it
It will be
very difficult
to rectify
Remember:
In retirement
you need
a growing
income
•Ability to save inhibited by
various factors
• Investment returns will be lower
• Large percentage of people
already ‘far behind’
SUMMARY AND CONCLUSIONS
27

RESEARCH UPDATE EDITION 9
The biggest present you
can give your children
is to never become
dependent on them
(retirement provision)
The biggest present you
can give yourself is to
make your children
independent of you
(education)
SOME WISE WORDS SOMEONE ONCE TOLD ME…
28

RESEARCH UPDATE EDITION 9
FULLY understand
your retirement
provisioning
FULLY understand your future liabilities
FULLY consider ALL the risks you
face
Get a consultant to advise you as to
how much you must
save
Stick with renowned institutions
when entrust- ing your
savings for investment
• retirement
• ‘big asset’
replacements
• health
• children’s studies
• caring for parents
and/or children
• inflation
• etc
REMEMBER: Time is your best friend when it comes to capital building
WHAT SHOULD PEOPLE DO NOW? A FEW THINGS...
29

RESEARCH UPDATE EDITION 9
REGULATORY INFORMATION
30
Old Mutual Investment Group (Pty) Limited
Physical Address: Mutualpark, Jan Smuts Drive, Pinelands, 7405
Telephone number: +27 21 509 5022
Old Mutual Investment Group (Pty) Limited (Reg No 1993/003023/07) is a licensed financial services provider, FSP 604, approved by the Registrar of Financial Services Providers (www.fsb.co.za) to provide intermediary services and advice in terms of the Financial Advisory and Intermediary Services Act 37 of 2002. Market fluctuations and changes in rates of exchange or taxation may have an effect on the value, price or income of investments. Since the performance of financial markets fluctuates, an investor may not get back the full amount invested. Past performance is not necessarily a guide to future investment performance. The investment portfolios may be market-linked or policy based. Investors’ rights and obligations are set out in the relevant contracts. In respect of pooled, life wrapped products, the underlying assets are owned by Old Mutual Life Assurance Company (South Africa) Limited who may elect to exercise any votes on these underlying assets independently of Old Mutual Investment Group. In respect of these products, no fees or charges will be deducted if the policy is terminated within the first 30 days. Returns on these products depend on the performance of the underlying assets. Disclosures: Personal trading by staff is restricted to ensure that there is no conflict of interest. All directors and those staff who are likely to have access to price sensitive and unpublished information in relation to the Old Mutual Group are further restricted in their dealings in Old Mutual shares. All employees of the Old Mutual Investment Group are remunerated with salaries and standard incentives. Unless disclosed to the client, no commission or incentives are paid by the Old Mutual Investment Group to any persons other than its representatives. All inter-group transactions are done on an arms length basis. We outsource investment administration of our local funds to Curo Fund Services (Pty) Ltd, 50% of which is owned by the Old Mutual Investment Group. Disclaimer: The contents of this document and, to the extent applicable, the comments by presenters do not constitute advice as defined in FAIS. Although due care has been taken in compiling this document, Old Mutual Investment Group does not warrant the accuracy of the information contained herein and therefore does not accept any liability in respect of any loss you may suffer as a result of your reliance thereon. The processes, policies and business practices described may change from time to time and Old Mutual Investment Group specifically excludes any obligation to communicate such changes to the recipient of this document. Old Mutual Investment Group has comprehensive crime and professional indemnity insurance. For more detail, as well as for information on how to contact us and on how to access information please visit www.oldmutualinvest.com.

THANK YOU
Old Mutual is a Licensed Financial Services Provider
THANK YOU