Embed Size (px)
Citation preview

400Les
Sources
300Le Granit
410Le
Haut-Saint-François
420Le
Val-Saint-François
43027Sherbrooke
450Memphrémagog
440Coaticook
Direction des solutions technologiqueset des services aux utilisateurs, avril 2020
© Gouvernement du Québec
0 10 20 305 km
Région administrative 05 : Estrie
Frontière internationaleRégion administrativeMRC ou territoire équivalentVille exerçant certainescompétences de MRC
Code Territoire (2020)Population
terrestre (km²)Superficie
300 MRC du Granit 21 461 2 731,02400 MRC des Sources 14 291 785,39410 MRC du Haut-Saint-François 22 738 2 272,12420 MRC du Val-Saint-François 31 300 1 397,1143027 Ville de Sherbrooke 169 136 353,53440 MRC de Coaticook 18 700 1 338,78450 MRC de Memphrémagog 52 121 1 317,28
Total : 329 747 10 195,23 Sources: Découpage administratif MERN, janvier 2020Superficies compilées par le MERN, mars 2019Décret de population (1214-2019)
Service Layer Credits: Sources: Esri, Airbus DS, USGS,NGA, NASA, CGIAR, N Robinson, NCEAS, NLS, OS,NMA, Geodatastyrelsen, Rijkswaterstaat, GSA, Geoland,FEMA, Intermap and the GIS user community

161
112
161
Stratford, CT
Stornoway, M
Saint-Romain, M
Lambton, MCourcelles, M
Saint-Sébastien, M
Lac-Drolet, M Saint-Ludger, M
Saint-Ludger, M
Saint-Robert-Bellarmin, M
Audet, M
Sainte-Cécile-de-Whitton, M
Nantes, M
Milan, M
Marston, CT
Lac-Mégantic, V
Frontenac, M
Piopolis, MVal-Racine, M
Notre-Dame-des-
Bois, M Saint-Augustin-de-Woburn, P
0 10 205 km
Direction des solutions technologiqueset des services aux utilisateurs, avril 2020
© Gouvernement du Québec
Population par municipalité(décret 2020)
0 - 1 999 h.2 000 h. - 9 999 h.
Limites administrativesFrontière internationaleRégion administrativeMRC
Réseau routierRoute nationaleRoute régionale
Service Layer Credits: Sources: Esri, Airbus DS, USGS, NGA, NASA, CGIAR, N Robinson, NCEAS, NLS,OS, NMA, Geodatastyrelsen, Rijkswaterstaat, GSA, Geoland, FEMA, Intermap and the GIS user community
300 - MRC du GranitCode Municipalité
Dési-gnation (2020)
Populationterrestre(km²)
SuperficieCode Municipalité
Dési-gnation (2020)
Populationterrestre(km²)
Superficie
30005 Saint-Augustin-de-Woburn P 696 281,6130010 Notre-Dame-des-Bois M 960 191,1730015 Val-Racine M 167 117,5630020 Piopolis M 348 103,0130025 Frontenac M 1 763 224,8030030 Lac-Mégantic V 5 601 21,7630035 Marston CT 720 70,9930040 Milan M 312 129,6630045 Nantes M 1 413 119,2530050 Sainte-Cécile-de-Whitton M 865 146,6530055 Audet M 757 133,3030070 Saint-Robert-Bellarmin M 568 236,6230072 Saint-Ludger M 1 045 127,4030080 Lac-Drolet M 1 033 124,3330085 Saint-Sébastien M 651 90,87
30090 Courcelles M 782 90,8530095 Lambton M 1 607 108,2330100 Saint-Romain M 713 112,0830105 Stornoway M 527 179,8430110 Stratford CT 933 121,04
Total : 21 461 2 731,02
Sources: Découpage administratif MERN, janvier 2020Superficies compilées par le MERN, mars 2019Décret de population (1214-2019)
161
112
116
55
Danville, V
Asbestos, V
Saint-Georges-de-Windsor, M
Saint-Camille, CT
Wotton, M
Saint-Adrien, M
Ham-Sud, M
0 105 km
Direction des solutions technologiqueset des services aux utilisateurs, avril 2020
© Gouvernement du Québec
Population par municipalité(décret 2020)
0 - 1 999 h.2 000 h. - 9 999 h.
Limites administrativesRégion administrativeMRC
Réseau routierAutorouteRoute nationaleRoute régionale
Service Layer Credits: Sources: Esri, Airbus DS, USGS, NGA, NASA, CGIAR, N Robinson, NCEAS, NLS,OS, NMA, Geodatastyrelsen, Rijkswaterstaat, GSA, Geoland, FEMA, Intermap and the GIS user community
400 - MRC des SourcesCode Municipalité
Dési-gnation (2020)
Populationterrestre(km²)
Superficie
40005 Ham-Sud M 232 151,3840010 Saint-Adrien M 515 98,3840017 Wotton M 1 380 143,3740025 Saint-Camille CT 536 83,3540032 Saint-Georges-de-Windsor M 958 126,9140043 Asbestos V 6 837 30,2540047 Danville V 3 833 151,75
Total : 14 291 785,39
Sources: Découpage administratif MERN, janvier 2020Superficies compilées par le MERN, mars 2019Décret de population (1214-2019)
161
112
610
55
410
Dudswell, M
Weedon, M
Lingwick, CT
Scotstown, V
Hampden, CT
Bury, M
Westbury, CTEast Angus, V
AscotCorner, M
Cookshire-Eaton, V Newport, M
La Patrie, M
Chartierville, MSaint-Isidore-de-Clifton, M
0 10 205 km
Direction des solutions technologiqueset des services aux utilisateurs, avril 2020
© Gouvernement du Québec
Population par municipalité(décret 2020)
0 - 1 999 h.2 000 h. - 9 999 h.
Limites administrativesFrontière internationaleRégion administrativeMRC
Réseau routierAutorouteRoute nationaleRoute régionale
Service Layer Credits: Sources: Esri, Airbus DS, USGS, NGA, NASA, CGIAR, N Robinson, NCEAS, NLS,OS, NMA, Geodatastyrelsen, Rijkswaterstaat, GSA, Geoland, FEMA, Intermap and the GIS user community
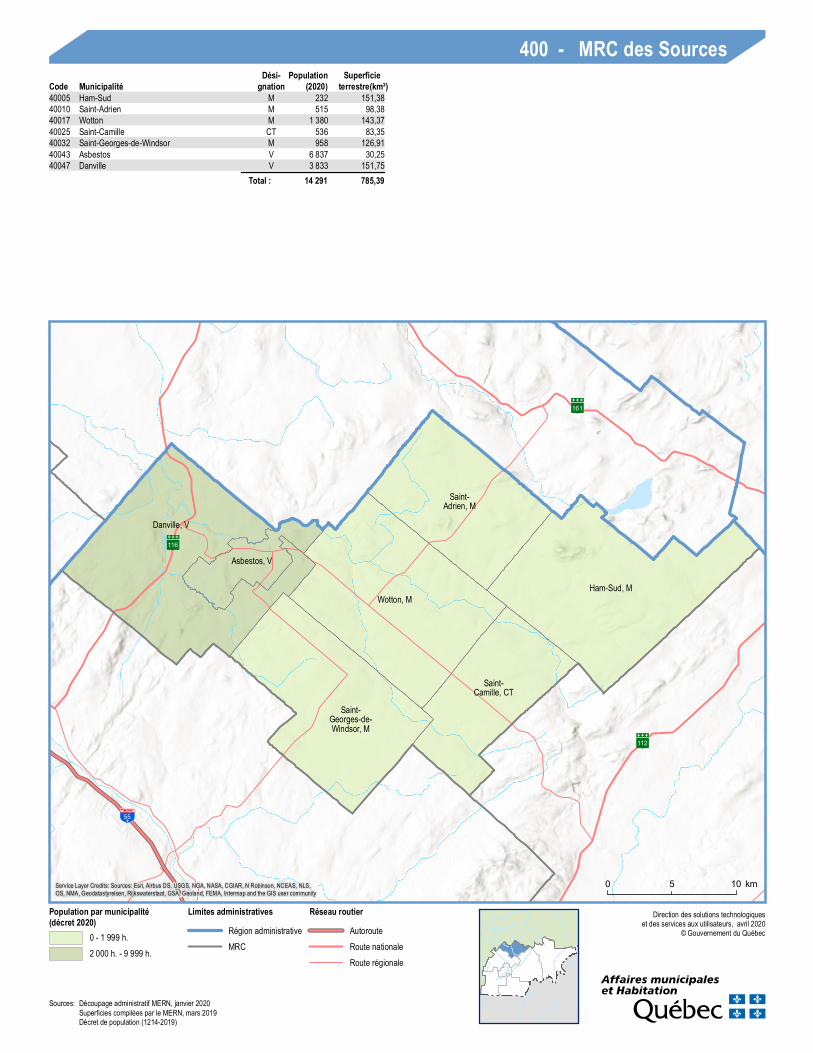
410 - MRC du Haut-Saint-FrançoisCode Municipalité
Dési-gnation (2020)
Populationterrestre(km²)
Superficie
41012 Saint-Isidore-de-Clifton M 666 177,1941020 Chartierville M 282 141,5741027 La Patrie M 793 205,3941037 Newport M 743 270,3541038 Cookshire-Eaton V 5 432 296,1941055 Ascot Corner M 3 255 84,0841060 East Angus V 3 826 7,8441065 Westbury CT 1 055 56,2641070 Bury M 1 139 233,9941075 Hampden CT 181 111,2941080 Scotstown V 479 11,5841085 Lingwick CT 456 241,7841098 Weedon M 2 637 215,8541117 Dudswell M 1 794 218,76
Total : 22 738 2 272,12
Sources: Découpage administratif MERN, janvier 2020Superficies compilées par le MERN, mars 2019Décret de population (1214-2019)

112
116
112
116
10
610
410
55
Cleveland, CT
Saint-Claude, M
Richmond, V
Val-Joli, MWindsor, V
Ulverton, M
Melbourne, CT
Kingsbury, VLMaricourt, M
Valcourt, CTValcourt, V
Sainte-Anne-de-la-Rochelle, M
Lawrenceville, VL
Bonsecours, M
Racine, M
Saint-Denis-de-
Brompton, M
Saint-François-Xavier-de-
Brompton, M
Stoke, M
0 105 km
Direction des solutions technologiqueset des services aux utilisateurs, avril 2020
© Gouvernement du Québec
Population par municipalité(décret 2020)
0 - 1 999 h.2 000 h. - 9 999 h.
Limites administrativesRégion administrativeMRC
Réseau routierAutorouteRoute nationaleRoute régionale
Service Layer Credits: Sources: Esri, Airbus DS, USGS, NGA, NASA, CGIAR, N Robinson, NCEAS, NLS,OS, NMA, Geodatastyrelsen, Rijkswaterstaat, GSA, Geoland, FEMA, Intermap and the GIS user community
420 - MRC du Val-Saint-FrançoisCode Municipalité
Dési-gnation (2020)
Populationterrestre(km²)
SuperficieCode Municipalité
Dési-gnation (2020)
Populationterrestre(km²)
Superficie
42005 Stoke M 3 057 250,9842020 Saint-François-Xavier-de-Brompton M 2 387 97,4742025 Saint-Denis-de-Brompton M 4 385 70,2942032 Racine M 1 372 104,7042040 Bonsecours M 624 60,2542045 Lawrenceville VL 632 17,1742050 Sainte-Anne-de-la-Rochelle M 632 61,6342055 Valcourt V 2 142 5,4442060 Valcourt CT 1 034 80,2542065 Maricourt M 430 61,8942070 Kingsbury VL 139 6,8842075 Melbourne CT 1 064 172,9642078 Ulverton M 418 51,3542088 Windsor V 5 323 14,3742095 Val-Joli M 1 654 91,92
42098 Richmond V 3 265 6,9642100 Saint-Claude M 1 190 119,3742110 Cleveland CT 1 552 123,23
Total : 31 300 1 397,11
Sources: Découpage administratif MERN, janvier 2020Superficies compilées par le MERN, mars 2019Décret de population (1214-2019)

112
55
610
410
10
Sherbrooke, V
0 84 km
Direction des solutions technologiqueset des services aux utilisateurs, avril 2020
© Gouvernement du Québec
Population par municipalité(décret 2020)
100 000 h. - 2 000 000 h.
Limites administrativesMRC
Réseau routierAutorouteRoute nationaleRoute régionale
Service Layer Credits: Sources: Esri, Airbus DS, USGS, NGA, NASA, CGIAR, N Robinson, NCEAS, NLS,OS, NMA, Geodatastyrelsen, Rijkswaterstaat, GSA, Geoland, FEMA, Intermap and the GIS user community
43027 - Ville de SherbrookeCode Municipalité
Dési-gnation (2020)
Populationterrestre(km²)
Superficie
43027 Sherbrooke V 169 136 353,53 Total : 169 136 353,53
Sources: Découpage administratif MERN, janvier 2020Superficies compilées par le MERN, mars 2019Décret de population (1214-2019)

141
147
410
55
10
Waterville, V
Compton, M
Martinville, M
Sainte-Edwidge-de-Clifton, CT
Stanstead-Est, M Barnston-
Ouest, M
Coaticook, V
Dixville, M
Saint-Herménégilde, M
East Hereford, M
Saint-Venant-de-Paquette, M
Saint-Malo, M
0 105 km
Direction des solutions technologiqueset des services aux utilisateurs, avril 2020
© Gouvernement du Québec
Population par municipalité(décret 2020)
0 - 1 999 h.2 000 h. - 9 999 h.
Limites administrativesFrontière internationaleMRC
Réseau routierAutorouteRoute nationaleRoute régionale
Service Layer Credits: Sources: Esri, Airbus DS, USGS, NGA, NASA, CGIAR, N Robinson, NCEAS, NLS,OS, NMA, Geodatastyrelsen, Rijkswaterstaat, GSA, Geoland, FEMA, Intermap and the GIS user community
440 - MRC de CoaticookCode Municipalité
Dési-gnation (2020)
Populationterrestre(km²)
Superficie
44003 Saint-Malo M 480 131,7244005 Saint-Venant-de-Paquette M 96 58,6744010 East Hereford M 264 72,7144015 Saint-Herménégilde M 704 165,9944023 Dixville M 714 76,4044037 Coaticook V 8 909 219,5144045 Barnston-Ouest M 554 99,4644050 Stanstead-Est M 605 114,1844055 Sainte-Edwidge-de-Clifton CT 542 101,8044060 Martinville M 445 47,7144071 Compton M 3 174 206,5744080 Waterville V 2 213 44,06
Total : 18 700 1 338,78
Sources: Découpage administratif MERN, janvier 2020Superficies compilées par le MERN, mars 2019Décret de population (1214-2019)

141
112
147
112
610
55
410
10
Bolton-Est, M
Eastman, M
Austin, M
Saint-Benoît-
du-Lac, M
Magog, VSainte-
Catherine-de-Hatley, M
Hatley, CTNorth
Hatley, VL
Hatley, M
Ayer'sCliff, VL
Potton, CT
Stanstead, CT
Ogden, M
Stanstead, V
Orford, CTStukely-Sud, VL
Saint-Étienne-de-Bolton, M
0 105 km
Direction des solutions technologiqueset des services aux utilisateurs, avril 2020
© Gouvernement du Québec
Population par municipalité(décret 2020)
0 - 1 999 h.2 000 h. - 9 999 h.10 000 h. - 49 999 h.
Limites administrativesFrontière internationaleRégion administrativeMRC
Réseau routierAutorouteRoute nationaleRoute régionale
Service Layer Credits: Sources: Esri, Airbus DS, USGS, NGA, NASA, CGIAR, N Robinson, NCEAS, NLS,OS, NMA, Geodatastyrelsen, Rijkswaterstaat, GSA, Geoland, FEMA, Intermap and the GIS user community
450 - MRC de MemphrémagogCode Municipalité
Dési-gnation (2020)
Populationterrestre(km²)
SuperficieCode Municipalité
Dési-gnation (2020)
Populationterrestre(km²)
Superficie
45008 Stanstead V 2 788 22,0345020 Ogden M 736 74,7545025 Stanstead CT 963 113,2045030 Potton CT 1 817 260,1045035 Ayer's Cliff VL 1 131 5,5145043 Hatley M 689 60,4145050 North Hatley VL 651 3,1645055 Hatley CT 2 188 71,9045060 Sainte-Catherine-de-Hatley M 2 588 86,3645072 Magog V 27 354 144,2645080 Saint-Benoît-du-Lac M 30 2,1845085 Austin M 1 577 73,9545093 Eastman M 2 069 73,1545095 Bolton-Est M 1 028 78,3545100 Saint-Étienne-de-Bolton M 735 47,78
45105 Stukely-Sud VL 1 111 63,2345115 Orford CT 4 666 136,96
Total : 52 121 1 317,28
Sources: Découpage administratif MERN, janvier 2020Superficies compilées par le MERN, mars 2019Décret de population (1214-2019)