Embed Size (px)
Citation preview

PRODU
BRAND
MODE
CLIEN
DATEO
STAND
REPOR
A
CAUTIOThis replaborato
UCTDESIG
DNAME
ELNAME
T
OFISSUE
DARD(S)
RTVERSIO
Attestat
ON: port shall nory and sha
RF
Rep
GNATION
ON
tion of G
not be reproall not be q
FTe
port No.:
: IP Pho
: ATCOM
: A68W,
: ATCOM
: May 2
: EN 30
V1.0
Global C
oduced excquoted out o
estR
AGC0118
one
M
W, A48W
M TECHNO
3, 2016
0 328 V1.9
Complia
cept in full wof context.
Rep
80160501
OLOGY CO.,
9.1 (2015‐0
ance (Sh
without the
ort
1EE06
LIMITED
02)
henzhen
e written p
n) Co., L
permission
Page 1 o
Ltd
of the test
of 59

Report No.: AGC01180160501EE06 Page 2 of 59
Report Revise Record
Report Version Revise Time Issued Date Valid Version Notes
V1.0 / May 23, 2016 Valid Original Report

Report No.: AGC01180160501EE06 Page 3 of 59
TABLE OF CONTENTS
1. TEST REPORT CERTIFICATION .............................................................................................................. 4 2. GENERAL INFORMATION ........................................................................................................................ 5
2.1. DESCRIPTION OF EUT...................................................................................................................... 5
2.2. OBJECTIVE ........................................................................................................................................ 5
2.3. TEST STANDARDS AND RESULTS ................................................................................................... 5
2.4. TEST ITEMS AND THE RESULTS ..................................................................................................... 6
2.5. ENVIRONMENTAL CONDITIONS ...................................................................................................... 6
3. MEASUREMENT UNCERTAINTY ............................................................................................................. 7 4. IDENTIFICATION OF THE RESPONSIBLE TESTING LOCATION .......................................................... 8 5. ETSI EN 300 328 REQUIREMENTS .......................................................................................................... 9
5.1. RF OUTPUT POWER ......................................................................................................................... 9
5.2. POWER SPECTRAL DENSITY ........................................................................................................ 12
5.3. ADAPTIVITY AND RECEIVER BLOCKING ...................................................................................... 18
5.4. OCCUPIED CHANNEL BANDWIDTH ............................................................................................... 23
5.5. TRANSMITTER UNWANTED EMISSIONS IN THE OUT-OF-BAND DOMAIN ................................. 28
5.6. TRANSMITTER UNWANTED EMISSIONS IN THE SPURIOUS DOMAIN ....................................... 31
5.7. RECEIVER UNWANTED EMISSIONS IN THE SPURIOUS DOMAIN .............................................. 40
APPENDIX A: PHOTOGRAPHS OF EUT .................................................................................................... 47

Report No.: AGC01180160501EE06 Page 4 of 59
1. TEST REPORT CERTIFICATION Applicant ATCOM TECHNOLOGY CO., LIMITED
Address FL2, Block3, Huangguan Industry Park #21 Tai Ran 9th Rd, Futian, Shenzhen City, China
Manufacturer ATCOM TECHNOLOGY CO., LIMITED
Address FL2, Block3, Huangguan Industry Park #21 Tai Ran 9th Rd, Futian, Shenzhen City, China
Product Designation IP Phone
Brand Name ATCOM
Test Model A68W
Series Model A48W
Model Difference A68W and A48W have the same main board, but different on keypad and LCD.
Date of test May 17, 2016 to May 21, 2016
Deviation None
Condition of Test Sample Normal
Test Result Pass
Report Template AGCRT-EC-BGN/RF
We, Attestation of Global Compliance (Shenzhen) Co., Ltd., for compliance with the requirements set forth in the European Standard ETSI EN 300 328 V1.9.1. The results of testing in this report apply to the product /system which was tested only. Other similar equipment will not necessarily produce the same results due to production tolerance and measurement uncertainties.
Tested by
Max Zhang(Zhang Yi) May 23, 2016
Reviewed by
Rock Huang(Huang Dinglue) May 23, 2016
Approved by
Solger Zhang(Zhang Hongyi)Authorized Officer
May 23, 2016

Report No.: AGC01180160501EE06 Page 5 of 59
2. GENERAL INFORMATION 2.1. DESCRIPTION OF EUT Note: the following data is based on the information by the applicant.
Hardware Version V12
Software Version A68W-1.0.6.e6661, A48W-1.0.6.e6661
Operating Frequency(WIFI) 2412MHz-2472MHz
Support Channels(WIFI) 13 Channels (IEEE802.11b/g/n)
Modulation(WIFI) DBPCK/DQPSK/CCK/BPSK/QPSK/16QAM/64QAM/802.11B/G/N
Antenna Type Integral antenna
Antenna Gain 1.5dBi
Power Supply DC 5V by adapter
Channels Frequency
01: 2412MHZ 02: 2417MHZ 03: 2422MHZ 04: 2427MHZ 05: 2432MHZ 06: 2437MHZ 07: 2442MHZ
08: 2447MHZ 09: 2452MHZ 10: 2457MHZ 11: 2462MHZ 12: 2467MHZ 13: 2472MHZ
Note: 1. For 802.11b, 802.11g, 802.11n 20MHZ bandwidth system use Channel 1 to Channel 13. 2. For 802.11n 40MHZ bandwidth system use Channel 3 to Channel 11. 3. Please refer to Appendix Ⅰ for the photographs of the EUT. For more details, please refer to the User’s
manual of the EUT. 2.2. OBJECTIVE Perform Radio Spectrum tests for CE Marking according to the provisions of article 3.2 of the R&TTE Directive (1999/5/EC) for the Bluetooth function of the EUT. 2.3. TEST STANDARDS AND RESULTS The EUT has been tested according to ETSI EN 300 328 V1.9.1
ETSI EN 300 328 V1.9.1 (2015-02)
Electromagnetic compatibility and Radio spectrum Matters (ERM); Wideband Transmission systems; Data transmission equipment operating in the 2.4GHz ISM band and using spread spectrum modulation techniques: Part 2: Harmonized EN covering essential requirements under article 3.2 of the R&TTE Directive.

Report No.: AGC01180160501EE06 Page 6 of 59
2.4. TEST ITEMS AND THE RESULTS No. Basic Standard Test Type Result
1 ETSI EN 300 328 4.3.2.1 RF Output Power Pass
2 ETSI EN 300 328 4.3.2.2 Power Spectral Density Pass
3 ETSI EN 300 328 4.3.2.3 Duty Cycle, Tx-sequence, Tx-gap N/A
4 ETSI EN 300 328 4.3.2.4 Medium Utilisation(MU) factor N/A
5 ETSI EN 300 328 4.3.2.5 Adaptivity Pass
6 ETSI EN 300 328 4.3.2.6 Occupied Channel Bandwidth Pass
7 ETSI EN 300 328 4.3.2.7 Transmitter unwanted emissions in the out-of-band domain Pass
8 ETSI EN 300 328 4.3.2.8 Transmitter unwanted emissions in the spurious domain Pass
9 ETSI EN 300 328 4.3.2.9 Receiver spurious emissions Pass
10 ETSI EN 300 328 4.3.2.10 Receiver Blocking Pass
Note: 1. N/A- Not Applicable. 2. The latest versions of basic standards are applied. 2.5. ENVIRONMENTAL CONDITIONS
- Temperature: -20-55ºC - Humidity: 30-60 % - Atmospheric pressure: 86-106 kPa

Report No.: AGC01180160501EE06 Page 7 of 59
3. MEASUREMENT UNCERTAINTY The uncertainty is calculated using the methods suggested in the “Guide to the Expression of Uncertainty in Measurement” (GUM) published by ISO.
- Uncertainty of Radio Frequency, Uc=±1 x 10⁻⁷ - Uncertainty of total RF power, conducted, Uc = ±0.8dB - Uncertainty of RF power density, conducted, Uc = ±2.6dB - Uncertainty of spurious emissions, conducted, Uc = ±2.7dB - Uncertainty of spurious emissions, radiated, Uc = ±5.4dB - Uncertainty of Temperature: ±0.5°C - Uncertainty of Humidity: ±1 % - Uncertainty of DC and low frequency voltages: ±2%

Report No.: AGC01180160501EE06 Page 8 of 59
4. IDENTIFICATION OF THE RESPONSIBLE TESTING LOCATION
LIST OF EQUIPMENTS USED
Description Manufacturer Model No. Calibration
Date Calibration
Due. MXG X-Series Vector
Signal Generator Agilent N5182B 2015.10.24 2016.10.23
RF Analog Signal Generator
Agilent N5171B 2015.10.21 2016.10.20
EXA Signal Analyzer Agilent N9010A 2015.10.24 2016.10.23
USB Wideband Power Sensor
Agilent U2021XA 2015.10.24 2016.10.23
USB Wideband Power Sensor
Agilent U2021XA 2015.10.24 2016.10.23
USB Wideband Power Sensor
Agilent U2021XA 2015.10.24 2016.10.23
USB Wideband Power Sensor
Agilent U2021XA 2015.10.24 2016.10.23
RF cable Harbour 1G-26GHz 2016.03.01 2018.02.28
2.4G Band Fliter MICRO TRONICS BRM50702 2015.10.24 2016.10.23
H & T Chamber EXPERY TN-400 2015.07.14 2016.07.13
AMPLIFIER EM EM30180 2016.03.01 2018.02.28 ANTENNA A.H. SAS-521-4 2016.03.01 2018.02.28 ANTENNA Schwarzbeck 9168 2016.03.01 2018.02.28
HORN ANTENNA E.M. EM-AH-10180 2016.03.01 2018.02.28 HORN ANTENNA ETS 3117 2016.03.01 2018.02.28
RF Cable SUIRONG 30MHz-26GHz 2016.03.01 2018.02.28
Site Attestation of Global Compliance (Shenzhen) Co., Ltd.
Location B112-B113, Building 12, Baoan Building Materials Center, No.1 of Xixiang Inner Ring Road, Baoan District, Shenzhen, Guangdong, P.R.China

Report No.: AGC01180160501EE06 Page 9 of 59
5. ETSI EN 300 328 REQUIREMENTS 5.1. RF OUTPUT POWER 5.1.1 LIMIT RF Output Power <= 100mW (20dBm) over Normal and Extreme conditions. 5.1.2 MEASUREMENT PROCEDURE 1) Use a fast power sensor and set the samples speed 1MS/s or faster. 2) Connect one power sensor to each transmit port, Trigger the power sensors so that they start sampling at the
same time. For each instant in time, sum the power of the individual samples of all ports and store them. Use these stored samples in all following steps.
3) Find the start and stop times of each burst in the stored measurement samples. 4) Between the start and stop times of each individual burst calculate the RMS power over the burst. Save
these Pburst values, as well as the start and stop times for each burst. 5) The highest of all Pburst values (Value “A” in dBm) will be used for maximum e.i.r.p calculations. 6) The cable loss and attenuator factor shall be considered to the value “A”. 6) Add the (stated) antenna assembly gain “G” in dBi of the individual antenna. If applicable, add the additional
beamforming gain “Y” in dB. 7) The RF output power (P) shall be calculated using the formula: P=A+G+Y 5.1.3 TEST CONFIGURATION Temperature and Voltage Measurement (under normal and extreme test conditions)

Report No.: AGC01180160501EE06 Page 10 of 59
5.1.4 MEASUREMENT RESULTS Operation Mode TX Test Date May 20, 2016
Temperature 25oC Tested by Max
Humidity 55 % RH Polarity --
Antenna assembly Gain = 1.5dBi
Cable Loss =1.0dB
Beamforming gain =0dB
EIRP = P+ Gain+Y
Measurement uncertainty + 0.28dB / - 0.30dB
TEST CONDITIONS IEEE 802.11b TRANSMITTER POWER (dBm)
Temp (25)°C Temp (-20)°C Temp (55)°C CH 01 EIRP 12.37 11.43 12.57
CH 07 EIRP 12.85 12.42 12.61
CH 13 EIRP 12.42 12.51 12.43
Limit 20dBm
TEST CONDITIONS IEEE 802.11g TRANSMITTER POWER (dBm)
Temp (25)°C Temp (-20)°C Temp (55)°C
CH 01 EIRP 11.28 11.43 11.56
CH 07 EIRP 11.02 11.25 11.61
CH 13 EIRP 11.35 11.42 11.38
Limit 20dBm
TEST CONDITIONS IEEE 802.11n(20) TRANSMITTER POWER (dBm)
Temp (25)°C Temp (-20)°C Temp (55)°C
CH 01 EIRP 11.04 10.84 10.97
CH 07 EIRP 11.12 11.06 11.25
CH 13 EIRP 11.03 10.98 11.18
Limit 20dBm

Report No.: AGC01180160501EE06 Page 11 of 59
TEST CONDITIONS IEEE 802.11n(40) TRANSMITTER POWER (dBm)
Temp (25)°C Temp (-20)°C Temp (55)°C
CH 03 EIRP 8.42 8.42 8.37
CH 07 EIRP 8.34 8.33 8.26
CH 11 EIRP 8.51 8.42 8.33
Limit 20dBm
Conclusion: PASS

Report No.: AGC01180160501EE06 Page 12 of 59
5.2. POWER SPECTRAL DENSITY 5.2.1 LIMIT For non-adaptive equipment using wide band modulations other than FHSS, The maximum Power spectral density is limited to 10mW Per MHz 5.2.2 TEST PROCEDURE 1) Set the frequency from 2400MHz to 2483.5MHz, use 10kHz RBW and 30kHz VBW for pre-scan. The
number of sweep points shall be more than 8350. Wait for the trace to be completed and save the (trace) data set to a file.
2) Add up the values for amplitude (power) for all the samples in the file. 3) Normalize the individual values for amplitude so that the sum is equal to the RF Output Power(e.i.r.p)
measured in 5.1. 4)Starting from the first sample in the file (lowest frequency), add up the power of the following samples
representing a 1MHz segment and record the results for power and position (i.e. sample #1 to #100). This is the Power Spectral Density (e.i.r.p) for the first 1MHz segment which shall be recorded.
5) Shift the start point of the samples added up in step 5 by 1 sample and repeat the procedure in step 4(i.e. sample #2 to #101).
6) Repeat step 5 until the end of the data set and record the radiated power spectral Density values for each of the 1MHz segments.
7) The cable loss and attenuator factor shall be considered to the test result. 8) The highest value shall be recorded in the test report. 5.2.3 TEST CONFIGURATION

Report No.: AGC01180160501EE06 Page 13 of 59
5.2.4 TEST RESULTS
IEEE 802.11b Power Spectral Density
Channel Tested Power Density (dBm/MHz)
Test Limit (dBm/MHz) Pass / Fail
CH 01 2.53 10 Pass
CH 07 2.68 10 Pass
CH 13 2.47 10 Pass
IEEE 802.11g Power Spectral Density
Channel Tested Power Density (dBm/MHz)
Test Limit (dBm/MHz) Pass / Fail
CH 01 0.59 10 Pass
CH 07 0.93 10 Pass
CH 13 0.66 10 Pass
IEEE 802.11n(20) Power Spectral Density
Channel Tested Power Density (dBm/MHz)
Test Limit (dBm/MHz) Pass / Fail
CH 01 -0.24 10 Pass
CH 07 -0.17 10 Pass
CH 13 -0.11 10 Pass
IEEE 802.11n(40) Power Spectral Density
Channel Tested Power Density (dBm/MHz)
Test Limit (dBm/MHz) Pass / Fail
CH 03 -3.96 10 Pass
CH 07 -3.47 10 Pass
CH 11 -3.61 10 Pass

Report No.: AGC01180160501EE06 Page 14 of 59
Graphs
11B/LCH
11B/MCH
11B/HCH

Report No.: AGC01180160501EE06 Page 15 of 59
11G/LCH
11G/MCH
11G/HCH

Report No.: AGC01180160501EE06 Page 16 of 59
11N20SISO/LCH
11N20SISO/MCH
11N20SISO/HCH

Report No.: AGC01180160501EE06 Page 17 of 59
11N40SISO/LCH
11N40SISO/MCH
11N40SISO/HCH

Report No.: AGC01180160501EE06 Page 18 of 59
5.3. ADAPTIVITY AND RECEIVER BLOCKING The method of adaptivity is using LBT based DAA 5.3.1 LIMIT The Channel Occupancy Time shall be less than 13ms. If implemented, Short Control Signalling Transmissions of adaptive equipment using wide band modulations other than FHSS shall have a maximum duty cycle of 10 % within an observation period of 50 ms.
5.3.2 TEST PROCEDURE 1) The EuT connect to a companion device during the test. Adjust the received signal level at the EuT to the
value of -50dBm/MHz. 2) The analyzer shall be set as below: - RBW: use next available RBW setting below the measured Occupied Channel Bandwidth - Filter type: Channel Filter - VBW: ≥ RBW - Detector Mode: RMS - Span: 0 Hz - Centre Frequency: Equal to the hopping frequency to be tested - Sweep time: > Channel Occupancy Time of the UUT. If the Channel Occupancy Time is non-contiguous
(non-LBT based equipment), the sweep time shall be sufficient to cover the period over which the Channel Occupancy Time is spread out.
- Trace Mode: Clear/Write - Trigger Mode: Video 3) Configure the EuT for normal transmission with a sufficiently high payload to allow demonstration of
compliance of the adaptive mechanism on the channel being tested. 4) Adding the interference signal and blocking signal. 5) Record the data. 5.3.3 TEST CONFIGURATION

Report No.: AGC01180160501EE06 Page 19 of 59
5.3.4 TEST RESULTS IEEE802.11b Low Channel Threshold Level (dBm/MHz) 62.37
Blocking Interference Level (dBm) -35
Max COT Time (ms) 0.84
Minimum Idle Time (ms) 0.18
Duty Cycle (%) 0.00 Pulse Width (ms) 0.00

Report No.: AGC01180160501EE06 Page 20 of 59
Blocking Measurement

Report No.: AGC01180160501EE06 Page 21 of 59
IEEE802.11b High Channel Threshold Level (dBm/MHz) 62.42
Blocking Interference Level (dBm) -35
Max COT Time (ms) 1.14
Minimum Idle Time (ms) 0.18
Duty Cycle (%) 0.00 Pulse Width (ms) 0.00

Report No.: AGC01180160501EE06 Page 22 of 59
Blocking Measurement
Note: 1 ) All the modes had been tested, but only the worst data recorded in the report. 2) When removal of the interference and blocking signal the UUT will be transmitting again on this channel.
Conclusion: PASS

Report No.: AGC01180160501EE06 Page 23 of 59
5.4. OCCUPIED CHANNEL BANDWIDTH 5.4.1 LIMIT The Occupied Channel Bandwidth shall fall completely within the band 2400MHz to 2483.5MHz. 5.4.2 TEST PROCEDURE 1) The spectrum analyser shall be used the following settings: Centre Frequency: The centre frequency of the channel under test Resolution BW: ~1% of the span without going below 1% Video BW: 3×RBW Span: 2×OBW Detector: RMS Trace mode: Max Hold 2) Wait until the trace is completed, find the peak value of the trace and place the analyser marker on this peak. 3) Use the 99 % bandwidth function of the spectrum analyser to measure the Occupied Channel Bandwidth of
the UUT. This value shall be recorded.
5.4.3 TEST CONFIGURATION

5 T
T
.4.4 TEST R
TEST ITEM
TEST MODE
Applicab
2400MHz-2
RESULTS
E
ble Limits
2483.5MHz
99%
802
L
Lo
H
% BANDWID
.11b with da
LIMITS AND
T
ow Channel
igh Channe
DTH
ata rate 11
D MEASURE
Test Data (M
l
l
EMENT RES
Applicable
MHz)
15.13
15.14
Report
SULT
e Limits
36
47
No.: AGC011
C
180160501EPage 24 o
Criteria
PASS
PASS
EE06 of 59

T
T
TEST ITEM
TEST MODE
Applicab
2400MHz-2
E
ble Limits
2483.5MHz
99%
802
L
Lo
H
% BANDWID
.11g with da
LIMITS AND
T
ow Channel
igh Channe
DTH
ata rate 54
D MEASURE
Test Data (M
l
l
EMENT RES
Applicable
MHz)
16.65
16.65
Report
SULT
e Limits
51
50
No.: AGC011
C
180160501EPage 25 o
Criteria
PASS
PASS
EE06 of 59

T
T
TEST ITEM
TEST MODE
Applicab
2400MHz-2
E
ble Limits
2483.5MHz
99%
802
L
Lo
H
% BANDWID
.11n(20) wit
LIMITS AND
T
ow Channel
igh Channe
DTH
th data rate
D MEASURE
Test Data (M
l
l
65
EMENT RES
Applicable
MHz)
17.80
17.79
Report
SULT
e Limits
01
99
No.: AGC011
C
180160501EPage 26 o
Criteria
PASS
PASS
EE06 of 59

T
T
TEST ITEM
TEST MODE
Applicab
2400MHz-2
E
ble Limits
2483.5MHz
99%
802
L
Lo
H
% BANDWID
.11n(40) wit
LIMITS AND
T
ow Channel
igh Channe
DTH
th data rate
D MEASURE
Test Data (M
l
l
65
EMENT RES
Applicable
MHz)
36.23
36.25
Report
SULT
e Limits
38
57
No.: AGC011
C
180160501EPage 27 o
Criteria
PASS
PASS
EE06 of 59

Report No.: AGC01180160501EE06 Page 28 of 59
5.5. TRANSMITTER UNWANTED EMISSIONS IN THE OUT-OF-BAND DOMAIN 5.5.1 LIMIT The transmitter unwanted emissions in the out-of-band domain but outside the allocated band, shall not exceed the values provided by the mask. 5.5.2 TEST PROCEDURE 1) The spectrum analyser shall be used the following settings: Centre Frequency: 2484MHz
Resolution BW: 1MHz; Video BW: 3MHz; Span: 0Hz; Detector: RMS Trace mode: Max Hold; Sweep Points: 5000 2) (segment 2 483.5 MHz to 2 483.5 MHz + BW)
Adjust the trigger level to select the transmissions with the highest power level. Increase the centre frequency in steps of 1 MHz and repeat this measurement for every 1 MHz segment
within the range 2 483.5 MHz to 2 483.5 MHz + BW. 3) Segment 2 483.5 MHz + BW to 2 483.5 MHz + 2BW
Change the centre frequency of the analyser to 2 484 MHz + BW and perform the measurement for the first 1 MHz segment within range 2 483.5 MHz + BW to 2 483.5 MHz + 2BW. Increase the centre frequency in 1 MHz steps and repeat the measurements to cover this whole range. The centre frequency of the last 1 MHz segment shall be set to 2 483,5 MHz + 2 BW – 0.5 MHz.
4) Segment 2 400 MHz - BW to 2 400 MHz Change the centre frequency of the analyser to 2 399.5 MHz and perform the measurement for the first 1
MHz segment within range 2 400 MHz - BW to 2 400 MHz Reduce the centre frequency in 1 MHz steps and repeat the measurements to cover this whole range. The centre frequency of the last 1 MHz segment shall be set to 2 400 MHz - 2BW + 0.5 MHz.
5) Segment 2 400 MHz - 2BW to 2 400 MHz - BW Change the centre frequency of the analyser to 2 399,5 MHz - BW and perform the measurement for the first
1 MHz segment within range 2 400 MHz - 2BW to 2 400 MHz - BW. Reduce the centre frequency in 1 MHz steps and repeat the measurements to cover this whole range. The centre frequency of the last 1 MHz segment shall be set to 2 400 MHz - 2BW + 0.5 MHz.
6) The cable loss and attenuator factor shall be considered to the test result. 5.5.3 TEST CONFIGURATION

Report No.: AGC01180160501EE06 Page 29 of 59
5.5.4 TEST RESULT
TEST CONDITIONS IEEE 802.11b OUT-OF-BAND DOMAIN
Temp (25)°C Temp (-20)°C Temp (55)°C
Low channel PASS PASS PASS
High channel PASS PASS PASS
TEST CONDITIONS IEEE 802.11g OUT-OF-BAND DOMAIN
Temp (25)°C Temp (-20)°C Temp (55)°C
Low channel PASS PASS PASS
High channel PASS PASS PASS
TEST CONDITIONS IEEE 802.11n(20) OUT-OF-BAND DOMAIN
Temp (25)°C Temp (-20)°C Temp (55)°C
Low channel PASS PASS PASS
High channel PASS PASS PASS
TEST CONDITIONS IEEE 802.11(40) OUT-OF-BAND DOMAIN
Temp (25)°C Temp (-20)°C Temp (55)°C
Low channel PASS PASS PASS
High channel PASS PASS PASS

Report No.: AGC01180160501EE06 Page 30 of 59
CH Low-2412(802.11b)
CH High-2472(802.11b)
Note: All the modes had been tested, but only the worst data recorded in the report.

Report No.: AGC01180160501EE06 Page 31 of 59
5.6. TRANSMITTER UNWANTED EMISSIONS IN THE SPURIOUS DOMAIN 5.6.1 LIMIT
5.6.2 TEST PROCEDURE 1) The emissions over the range 30 MHz to 1 000 MHz shall be identified. 2) Spectrum analyzer settings:
Resolution bandwidth: 100 kHz Video bandwidth: 300 kHz Detector mode: Peak
Sweep Points: ≥ 19 400 Trace Mode: Max Hold
3) Allow the trace to stabilize. Any emissions identified during the sweeps above and that fall within the 6 dB range below the applicable limit or above, shall be individually measured using RMS detector and compared to the limits given in ETSI EN 300 328 (V1.9.1) clause 4.3.2.9.3.
4) The emissions over the range 1 GHz to 12,75 GHz shall be identified. 5) Resolution bandwidth: 1 MHz Video bandwidth: 3 MHz Detector mode: Peak Trace Mode: Max Hold Sweep Points: ≥ 23 500 6) Allow the trace to stabilize. Any emissions identified during the sweeps above and that fall within the 6 dB
range below the applicable limit or above, shall be individually measured using RMS detector and compared to the limits given in ETSI EN 300 328 (V1.9.1) clause 4.3.2.9.3.
Report No.: AGC01180160501EE06 Page 32 of 59
5.6.3 TEST CONFIGURATION
Conducted Method
Below 1GHz
Spectrum analyzer
3m
4m
1m Turntable
EUT
1.5m
Antenna tower
Reference ground plane
Bi-log or Loop antenna
2.4G Reject

Report No.: AGC01180160501EE06 Page 33 of 59
Above 1GHz
Spectrumanalyzer
Horn antenna
3m
4m
1m Turntable
EUT
1.5m
Antenna tower
Pre-amp
Radiated Method

5(W
.6.4 TEST RWorst Case
RESULT e: Low channnel, 11B)
Report No.: AGC011180160501EPage 34 o
EE06 of 59

(W
N
Worst Case
Note: 1. All th
2.The 2
e: High chan
he modes ha
2.4G fundam
nnel, 11B)
ad been tes
mental frequ
st but only th
ency is filter
he worst data
red out.
a record in t
Report
the report.
No.: AGC011180160501EPage 35 o
EE06 of 59
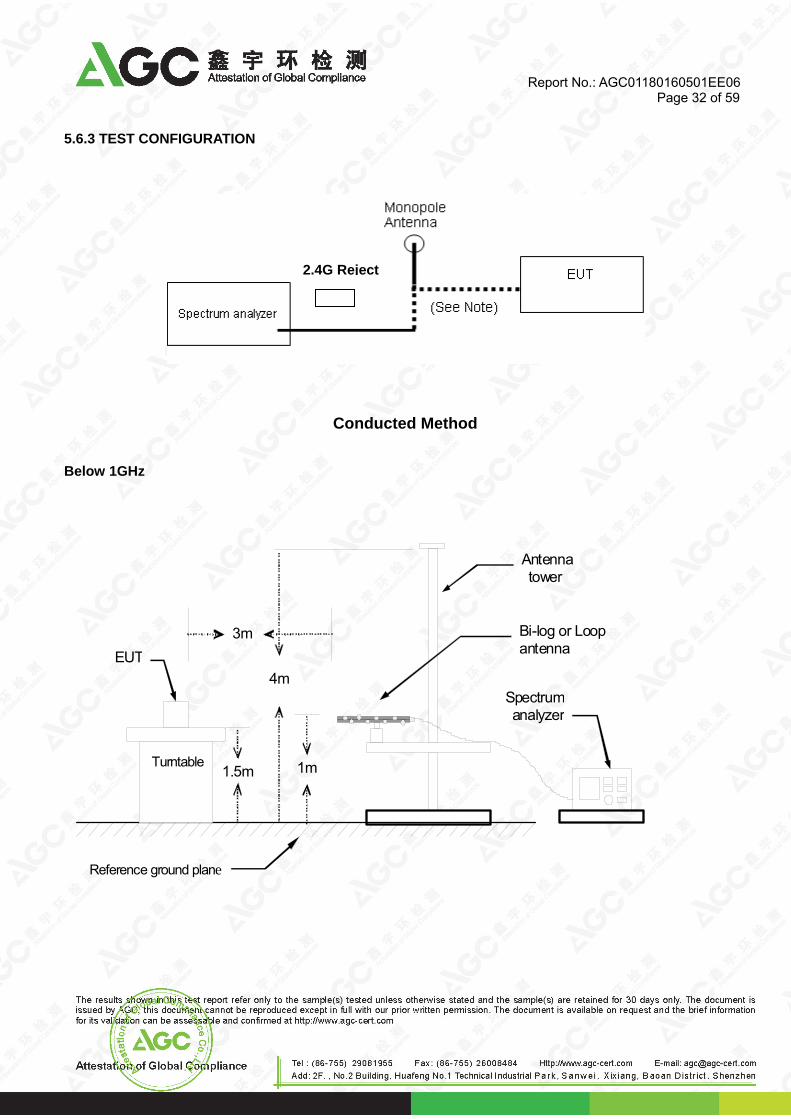
Report No.: AGC01180160501EE06 Page 36 of 59
Radiated Method: (Worst Case: Low channel, 11B) Transmitter Spurious Emission below 1GHz (30MHz-1GHz)
Frequency Reading Level Antenna S.G.
Cable Loss
Ant.Gain Emission Level Limit Margin
(MHz) (dBuv/m) Polarization
(dBm) (dB) (dBi) (dBm) (dBm) (dB)
102.31 31.26 V -60.82 0.04 1.10 -59.76 -54.00 5.76
187.95 30.58 V -64.93 0.07 4.62 -60.38 -54.00 6.38
298.44 30.74 V -69.34 0.18 7.10 -62.43 -36.00 26.43
406.35 30.64 V -67.96 0.31 6.72 -61.55 -36.00 25.55
597.88 29.84 V -68.08 0.49 6.41 -62.16 -54.00 8.16
660.74 27.22 V -71.08 0.54 7.10 -64.52 -54.00 10.52
83.56 30.41 H -61.20 0.04 0.38 -60.86 -36.00 24.86
142.08 30.64 H -60.60 0.05 0.12 -60.53 -36.00 24.53
294.58 28.74 H -70.47 0.18 6.72 -63.93 -36.00 27.93
309.43 29.02 H -68.03 0.20 6.49 -61.74 -36.00 25.74
565.07 30.15 H -68.27 0.47 6.85 -61.89 -54.00 7.89
684.22 32.04 H -66.97 0.55 6.44 -61.09 -54.00 7.09

Report No.: AGC01180160501EE06 Page 37 of 59
Transmitter Spurious Emission above 1GHz (1GHz-12.75GHz)
Frequency Reading Level Antenna S.G.
Cable Loss
Ant.Gain Emission Level Limit Margin
(MHz) (dBuv) Polarizati
on (dBm) (dB) (dBi) (dBm) (dBm) (dB)
4824.00 50.11 V -48.24 2.65 9.34 -41.55 -30.00 11.55
7236.00 44.85 V -56.25 3.13 11.32 -48.06 -30.00 18.06
-- -- V -- -- -- -- -- --
4824.00 52.24 H -44.19 2.65 9.34 -37.50 -30.00 7.50
7236.00 47.88 H -50.28 3.13 11.32 -42.09 -30.00 12.09
-- -- H -- -- -- -- -- --
Note: 1.The margins of the other spectrum are not exceeding the minimum value of margin, and this part of the
results without recording in the test report. 2. Measurements above show only up to 6 maximum emissions noted, or would be lesser, with “--” remark, if no specific emission from the EUT are recorded (ie: margin>20dB from the applicable limit) and considered that’s already beyond the background noise floor.

Report No.: AGC01180160501EE06 Page 38 of 59
(Worst Case: High channel, 11B) Transmitter Spurious Emission below 1GHz (30MHz-1GHz)
Frequency Reading Level Antenna S.G.
Cable Loss
Ant.Gain Emission Level Limit Margin
(MHz) (dBuv/m) Polarization
(dBm) (dB) (dBi) (dBm) (dBm) (dB)
76.25 31.62 V -60.29 0.04 -0.90 -61.23 -36.00 25.23
143.26 30.25 V -62.44 0.05 0.18 -62.31 -36.00 26.31
258.94 32.26 V -64.90 0.14 7.24 -57.80 -36.00 21.80
374.19 30.48 V -65.30 0.27 6.56 -59.01 -36.00 23.01
454.88 27.84 V -69.92 0.37 6.52 -63.77 -36.00 27.77
602.33 28.91 V -68.78 0.49 6.50 -62.78 -54.00 8.78
152.04 30.18 H -60.14 0.06 0.70 -59.50 -36.00 23.50
294.56 27.95 H -71.20 0.18 6.72 -64.66 -36.00 28.66
374.12 28.12 H -70.14 0.27 6.56 -63.85 -36.00 27.85
442.41 28.66 H -68.03 0.35 6.24 -62.14 -36.00 26.14
598.74 30.47 H -66.58 0.49 6.44 -60.63 -54.00 6.63
720.55 30.87 H -67.27 0.58 6.30 -61.55 -54.00 7.55

Report No.: AGC01180160501EE06 Page 39 of 59
Transmitter Spurious Emission above 1GHz (1GHz-12.75GHz)
Frequency Reading Level Antenna S.G.
Cable Loss
Ant.Gain Emission Level Limit Margin
(MHz) (dBuv) Polarizati
on (dBm) (dB) (dBi) (dBm) (dBm) (dB)
4944.00 52.23 V -46.04 2.74 9.58 -39.20 -30.00 9.20
7416.00 46.95 V -52.16 3.09 11.57 -43.68 -30.00 13.68
-- -- V -- -- -- -- -- --
4944.00 50.32 H -47.68 2.74 9.58 -40.83 -30.00 10.83
7416.00 48.81 H -51.46 3.09 11.57 -42.98 -30.00 12.98
-- -- H -- -- -- -- -- --
Note: 1.The margins of the other spectrum are not exceeding the minimum value of margin, and this part of the
results without recording in the test report. 2. Measurements above show only up to 6 maximum emissions noted, or would be lesser, with “--” remark, if no
specific emission from the EUT are recorded (ie: margin>20dB from the applicable limit) and considered that’s
already beyond the background noise floor.
Conclusion: PASS
Report No.: AGC01180160501EE06 Page 40 of 59
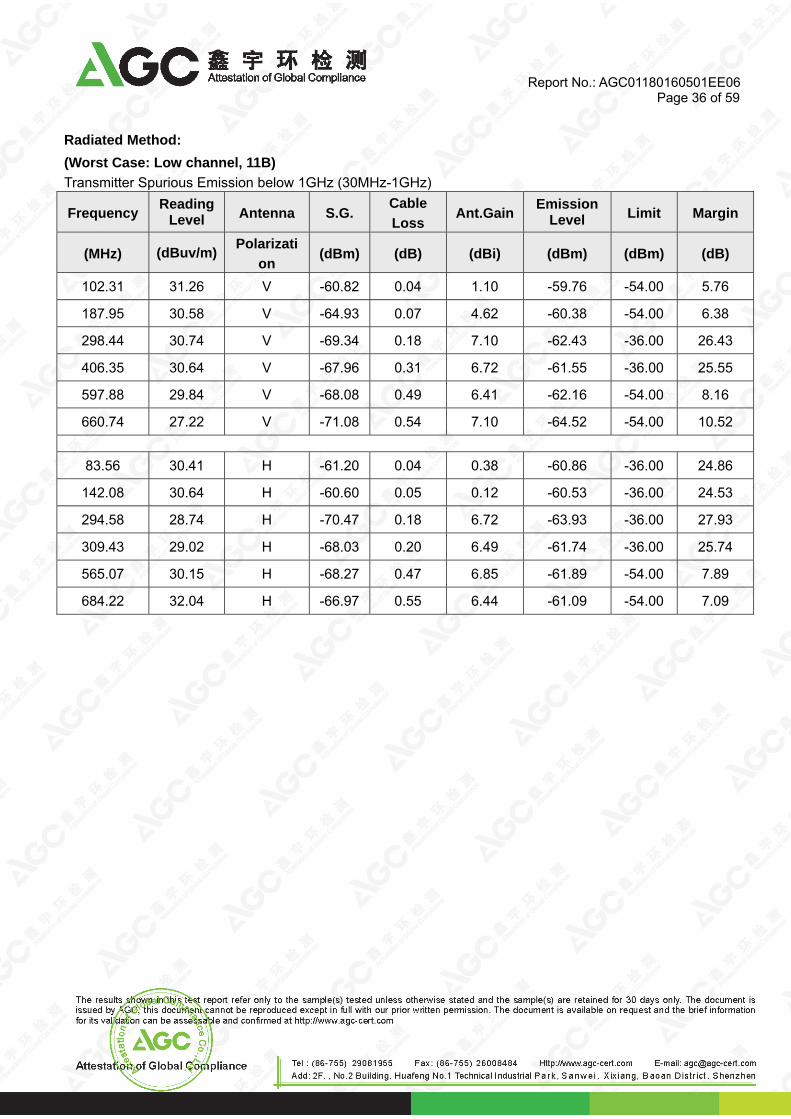
5.7. RECEIVER UNWANTED EMISSIONS IN THE SPURIOUS DOMAIN 5.7.1 LIMIT
5.7.2 TEST PROCEDURE 1) The emissions over the range 30 MHz to 1 000 MHz shall be identified. 2) Spectrum analyzer settings:
Resolution bandwidth: 100 kHz Video bandwidth: 300 kHz Detector mode: Peak
Sweep Points: ≥ 19 400 Trace Mode: Max Hold
3) Allow the trace to stabilize. Any emissions identified during the sweeps above and that fall within the 6 dB range below the applicable limit or above, shall be individually measured using RMS detector and compared to the limits given in 5.7.1.
4) The emissions over the range 1 GHz to 12.75 GHz shall be identified. 5) Resolution bandwidth: 1 MHz Video bandwidth: 3 MHz Detector mode: Peak Trace Mode: Max Hold Sweep Points: ≥ 23 200 6) Allow the trace to stabilize. Any emissions identified during the sweeps above and that fall within the 6 dB
range below the applicable limit or above, shall be individually measured using RMS detector and compared to the limits given in 5.7.1.
5.7.3 TEST CONFIGURATION Refer to 5.6.3

5(W
.7.4 TEST RWorst Case
RESULT e: Low channnel, 11B)
Report No.: AGC011180160501EPage 41 o
EE06 of 59

(W
N
Worst Case
Note: 1. All th
e: High chan
he modes ha
nnel, 11B)
ad been tes
st but only thhe worst dataa record in t
Report
the report.
No.: AGC011180160501EPage 42 o
EE06 of 59

Report No.: AGC01180160501EE06 Page 43 of 59
Radiated Method: (Worst Case: Low channel, 11B) Receiver Spurious Emission below 1GHz (30MHz-1GHz)
Frequency Reading Level Antenna S.G.
Cable Loss
Ant.Gain Emission Level Limit Margin
(MHz) (dBuv/m) Polarization
(dBm) (dB) (dBi) (dBm) (dBm) (dB)
78.45 25.62 V -65.84 0.04 -0.50 -66.38 -57.00 9.38
201.34 24.31 V -73.94 0.07 6.82 -67.19 -57.00 10.19
348.71 25.94 V -72.54 0.24 5.54 -67.24 -57.00 10.24
548.01 26.34 V -72.37 0.46 6.80 -66.02 -57.00 9.02
689.75 25.80 V -72.00 0.56 6.49 -66.07 -57.00 9.07
803.56 23.54 V -73.41 0.64 6.54 -67.51 -57.00 10.51
163.25 26.35 H -64.36 0.06 1.44 -62.98 -57.00 5.98
254.32 25.84 H -73.17 0.13 7.26 -66.04 -57.00 9.04
368.74 25.01 H -73.00 0.27 6.64 -66.63 -57.00 9.63
482.09 26.84 H -71.46 0.40 6.94 -64.92 -57.00 7.92
598.15 27.84 H -70.31 0.49 6.44 -64.37 -57.00 7.37
784.15 26.94 H -70.33 0.63 6.58 -64.38 -57.00 7.38

Report No.: AGC01180160501EE06 Page 44 of 59
Receiver Spurious Emission above 1GHz (1GHz-12.75GHz)
Frequency Reading Level Antenna S.G.
Cable Loss
Ant.Gain Emission Level Limit Margin
(MHz) (dBuv) Polarizati
on (dBm) (dB) (dBi) (dBm) (dBm) (dB)
1875.48 31.27 V -65.66 1.28 7.33 -59.61 -47.00 12.61
-- -- V -- -- -- -- -- --
-- -- V -- -- -- -- -- --
1956.32 30.94 H -65.86 1.33 7.68 -59.51 -47.00 12.51
-- -- H -- -- -- -- -- --
-- -- H -- -- -- -- -- --
Note: 1.The margins of the other spectrum are not exceeding the minimum value of margin, and this part of the
results without recording in the test report. 2. Measurements above show only up to 6 maximum emissions noted, or would be lesser, with “--” remark, if no specific emission from the EUT are recorded (ie: margin>20dB from the applicable limit) and considered that’s already beyond the background noise floor.

Report No.: AGC01180160501EE06 Page 45 of 59
(Worst Case: High channel, 11B) Receiver Spurious Emission below 1GHz (30MHz-1GHz)
Frequency Reading Level Antenna S.G.
Cable Loss
Ant.Gain Emission Level Limit Margin
(MHz) (dBuv/m) Polarization
(dBm) (dB) (dBi) (dBm) (dBm) (dB)
98.65 25.41 V -65.48 0.04 1.50 -64.02 -57.00 7.02
132.98 24.32 V -66.50 0.05 0.06 -66.49 -57.00 9.49
258.74 25.78 V -72.56 0.14 7.24 -65.46 -57.00 8.46
364.15 26.11 V -69.99 0.26 6.72 -63.53 -57.00 6.53
505.22 24.75 V -71.78 0.42 6.85 -65.36 -57.00 8.36
718.69 25.33 V -72.60 0.58 6.14 -67.04 -57.00 10.04
132.05 26.54 H -63.40 0.05 0.06 -63.39 -57.00 6.39
269.84 25.45 H -72.11 0.15 6.88 -65.38 -57.00 8.38
405.36 26.37 H -71.15 0.31 6.70 -64.76 -57.00 7.76
581.09 27.94 H -68.01 0.48 6.20 -62.29 -57.00 5.29
662.36 24.33 H -74.77 0.54 7.04 -68.27 -57.00 11.27
784.59 25.17 H -70.89 0.63 6.58 -64.94 -57.00 7.94

Report No.: AGC01180160501EE06 Page 46 of 59
Receiver Spurious Emission above 1GHz (1GHz-12.75GHz)
Frequency Reading Level Antenna S.G.
Cable Loss
Ant.Gain Emission Level Limit Margin
(MHz) (dBuv) Polarizati
on (dBm) (dB) (dBi) (dBm) (dBm) (dB)
1854.26 32.23 V -63.22 1.27 7.24 -57.25 -47.00 10.25
-- -- V -- -- -- -- -- --
-- -- V -- -- -- -- -- --
1984.05 29.84 H -66.12 1.35 7.81 -59.65 -47.00 12.65
-- -- H -- -- -- -- -- --
-- -- H -- -- -- -- -- --
Note: 1.The margins of the other spectrum are not exceeding the minimum value of margin, and this part of the
results without recording in the test report. 2. Measurements above show only up to 6 maximum emissions noted, or would be lesser, with “--” remark, if no
specific emission from the EUT are recorded (ie: margin>20dB from the applicable limit) and considered that’s
already beyond the background noise floor. Conclusion: PASS

Report No.: AGC01180160501EE06 Page 47 of 59
APPENDIX A: PHOTOGRAPHS OF EUT ALL VIEW OF EUT
A68W
TOP VIEW OF EUT

Report No.: AGC01180160501EE06 Page 48 of 59
BOTTOM VIEW OF EUT
FRONT VIEW OF EUT

Report No.: AGC01180160501EE06 Page 49 of 59
BACK VIEW OF EUT
LEFT VIEW OF EUT

Report No.: AGC01180160501EE06 Page 50 of 59
RIGHT VIEW OF EUT
OPEN VIEW OF EUT
Antenna

Report No.: AGC01180160501EE06 Page 51 of 59
INTERNAL VIEW OF EUT-1
INTERNAL VIEW OF EUT-2

Report No.: AGC01180160501EE06 Page 52 of 59
INTERNAL VIEW OF EUT-3
INTERNAL VIEW OF EUT-4

Report No.: AGC01180160501EE06 Page 53 of 59
INTERNAL VIEW OF EUT-5
A48W
TOP VIEW OF EUT

Report No.: AGC01180160501EE06 Page 54 of 59
BOTTOM VIEW OF EUT
FRONT VIEW OF EUT

Report No.: AGC01180160501EE06 Page 55 of 59
BACK VIEW OF EUT
LEFT VIEW OF EUT

Report No.: AGC01180160501EE06 Page 56 of 59
RIGHT VIEW OF EUT
OPEN VIEW OF EUT
Antenna

Report No.: AGC01180160501EE06 Page 57 of 59
INTERNAL VIEW OF EUT-1
INTERNAL VIEW OF EUT-2

Report No.: AGC01180160501EE06 Page 58 of 59
INTERNAL VIEW OF EUT-3
INTERNAL VIEW OF EUT-4

Report No.: AGC01180160501EE06 Page 59 of 59
INTERNAL VIEW OF EUT-5
----END OF REPORT----


![Smart Home WiFi Outdoor Camera Manual - Yale Store · 2019-01-30 · 0 WiFi +50-10 DC 12V Outdoor 0 +50-40 Less than 95% RH Frequency / Band WiFi 2400MHz~2483.5MHz EIRP [dBm] 10 -](https://img.dokumen.tips/doc/110x75/5f366eb59627065158430bbe/smart-home-wifi-outdoor-camera-manual-yale-store-2019-01-30-0-wifi-50-10-dc.jpg)