Embed Size (px)
Citation preview
RF Insertion Loss Repeatability Testing of RF300 and RF303Relays
THE PRODUCTRF300 and RF303 high signal repeatability, double pole double throw (DPDT), ultraminiature,
RF TO-5 relay.
KEY FEATUREThe RF300 and RF303 have a characterized bandwidth to an impressive 3 GHz and provide
improved RF signal repeatability of ±0.1dB or better over the entire bandwidth. They are idealfor low level RF and DC signal switching.
APPLICATIONSAttenuators, tuning and precision measurement circuits, filters and amplifiers.

METHODOLOGY FOR DETERMINING REPEATABILITY IN A SWITCHABLEATTENUATOR CIRCUIT
RF REPEATABILITY TEST
Thirty-six (36) RF300-12 relays were tested to develop repeatability data for one million cycles of opera-tion. The relays were tested as described below over a frequency range of 0.3 MHz to 3 GHz.RELAY UNDER TEST
RF300-12 relays were soldered to .031 inch thick, two sided, copper clad, PTFE test boards. Theperiphery of the header and cover flanges were soldered to the ground plane of the circuit board. Themoving contacts (terminals 2 and 8) were connected to SMA connectors serving as input/ output ports.The normally closed contacts (terminals 4 and 6) were connected in series. The normally open contacts(terminals 3 and 7) were connected to a 20 dB attentuator, p (pi) resistor network, as shown in Figure 1.
Figure 1Repeatability Test Board for Relay Under Test (RUT)
Figure 2Test Set Up
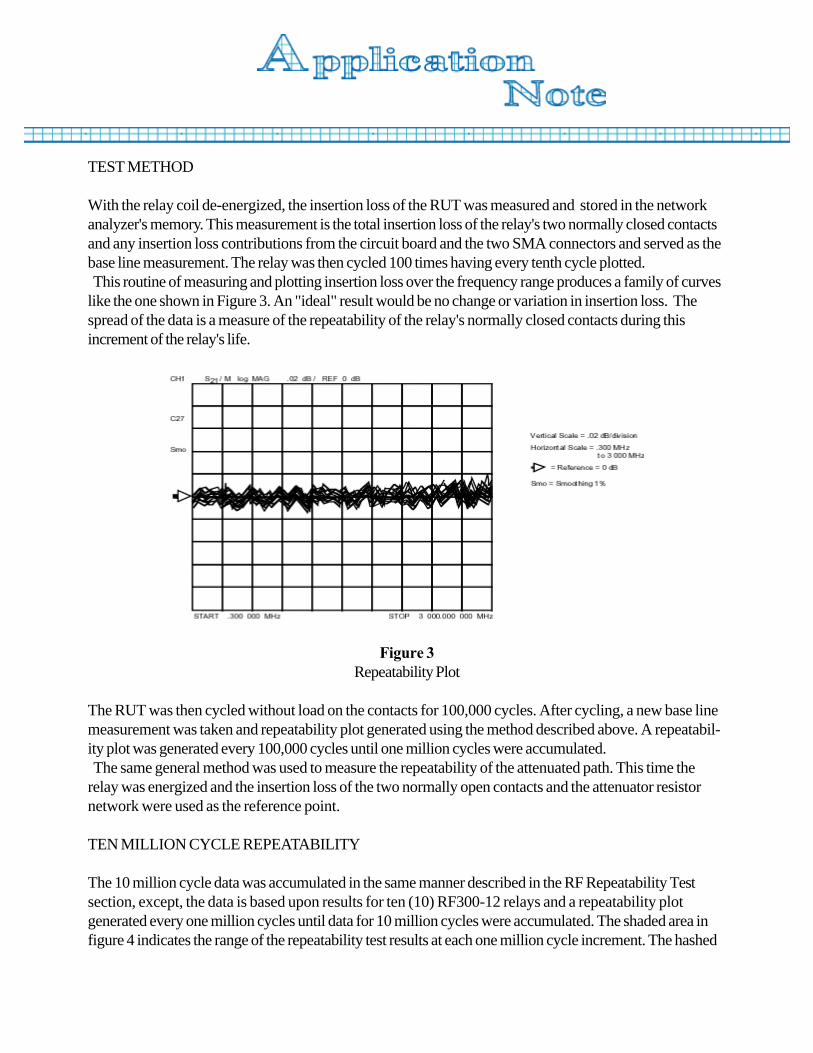
TEST METHOD
With the relay coil de-energized, the insertion loss of the RUT was measured and stored in the networkanalyzer's memory. This measurement is the total insertion loss of the relay's two normally closed contactsand any insertion loss contributions from the circuit board and the two SMA connectors and served as thebase line measurement. The relay was then cycled 100 times having every tenth cycle plotted. This routine of measuring and plotting insertion loss over the frequency range produces a family of curveslike the one shown in Figure 3. An "ideal" result would be no change or variation in insertion loss. Thespread of the data is a measure of the repeatability of the relay's normally closed contacts during thisincrement of the relay's life.
Figure 3Repeatability Plot
The RUT was then cycled without load on the contacts for 100,000 cycles. After cycling, a new base linemeasurement was taken and repeatability plot generated using the method described above. A repeatabil-ity plot was generated every 100,000 cycles until one million cycles were accumulated. The same general method was used to measure the repeatability of the attenuated path. This time therelay was energized and the insertion loss of the two normally open contacts and the attenuator resistornetwork were used as the reference point.
TEN MILLION CYCLE REPEATABILITY
The 10 million cycle data was accumulated in the same manner described in the RF Repeatability Testsection, except, the data is based upon results for ten (10) RF300-12 relays and a repeatability plotgenerated every one million cycles until data for 10 million cycles were accumulated. The shaded area infigure 4 indicates the range of the repeatability test results at each one million cycle increment. The hashed

line running through the center of the shaded area ( x ) is the average repeatability.
Figure 4Ten Million Cycle Repeatability
METHODOLOGY FOR DETERMINING RF PERFORMANCE
RF PERFORMANCE CURVES
The RF performance curves (insertion loss, isolation across contacts, isolation across poles, return loss orVSWR) were generated using a HP8753B Network Analyzer and HP85047A S-Parameter Test Set. Thetests were performed using 0.031 inch thick, two sided, copper clad, PTFE circuit boards, as shown inFigure 5. The periphery of the relay header and cover flanges were not soldered to the ground plane of thecircuit board. RF performance characteristics were measured for each pole, except the for the isolationacross poles measurement. 50 ohm termination loads were attached to the SMA connectors for thosecontacts not being measured. Plotted typical values shown in Figure 6 are the average readings from thetwo poles of five (5) RF300-12 relay samples. The matrix shown in Table 1 identifies the specific test points of the RF performance tests.

Figure 5RF performance Test Board for Relay Under Test
Figure 6Typical RF Performance
IMPROVING RF PERFORMANCE
The typical RF performance curves were obtained while the relay case was seated on but not soldered tothe ground plane. Grounding the case by soldering it to circuit ground will result in some parametricimprovement. The relay header flange and leads may be soldered using soldering iron, vapor phase or infrared solderingtechniques.

NOTES ON RF INSERTION LOSS REPEATABILITY DATA AND RF PERFORMANCECHARACTERISTICS
The Rf insertion loss repeatability data and RF characteristics presented in this profile are represetativevalues and are not intended as specification limits. Insertion loss and VSWR characteristics represent oneclosed contact set only.

Coi
l Pow
er
Pol
e 1
Mov
ing
Con
act
Pol
e 1
Nor
mal
ly O
pen
Con
tact
Pol
e 1
Nor
mal
ly C
lose
d C
onta
ct
Pol
e 2
Mov
ing
Con
tact
Pol
e 2
Nor
mal
ly O
pen
Con
tact
Pol
e 2
Nor
mal
ly C
lose
d C
onta
ct
1&9 2 3 4 6 7 8
Isolation (De-energized) OFF IN OUT 50 50 50 50
Isolation (Energized) ON IN 50 OUT 50 50 50
Insertion Loss (De-energized) OFF IN 50 OUT 50 50 50
Insertion Loss (Energized) ON IN OUT 50 50 50 50
VSWR (De-energized) OFF IN/OUT 50 50 50 50 50
VSWR (Energized) ON IN/OUT 50 50 50 50 50
Isolation (De-energized) OFF 50 50 50 50 OUT IN
Isolation (Energized) ON 50 50 50 OUT 50 IN
Insertion Loss (De-energized) OFF 50 50 50 OUT 50 IN
Insertion Loss (Energized) ON 50 50 50 50 OUT IN
VSWR (De-energized) OFF 50 50 50 50 50 IN/OUT
VSWR (Energized) ON 50 50 50 50 50 IN/OUT
Isolation (De-energized) OFF IN 50 50 50 50 OUT
Isolation (Energized) ON IN 50 50 50 50 OUT
Pol
e 2
Pol
e to
P
ole
Table 1
RF PERFORMANCE CHARACTERISTICS TEST MATRIX
Terminals as viewed from the bottom of the relay
Terminal number
Pol
e 1


![Gauge & R&R [Repeatability & Reproducibility] Analysis](https://img.dokumen.tips/doc/110x75/54becf3e4a7959a67f8b4696/gauge-rr-repeatability-reproducibility-analysis.jpg)