Embed Size (px)
Citation preview
Revista Română de Statistică - Supliment nr. 2 / 2014
SUMAR / CONTENTS 2/2014REVISTA ROMÂNĂ DE STATISTICĂ SUPLIMENT
ANALIZA SERIILOR INTERDEPENDENTE PRIN METODA CORELAŢIEI 3
THE ANALYSIS OF INTERDEPENDENT SERIES BY CORRELATION METHOD 9
Prof.univ.dr. Angelica CĂRBUNARU-BĂCESCU Lector univ.dr. Monica CONDRUZ-BĂCESCU Academia de Studii Economice - Bucureşti
INTEGRAREA ROMÂNIEI ÎN UNIUNEA EUROPEANĂ, SURPRINSĂ ÎN INDICATORII STATISTICI AI MEDIULUI 15
ROMANIA’S INTEGRATION IN THE EUROPEAN UNION, IN TERMS OF ENVIRONMENT STATISTICAL INDICATORS 24
Conf.univ. dr. Gheorghe SĂVOIU Conf. univ dr. Constantin MANEA Prof. univ. dr. Ion Iorga SIMĂN Universitatea din Piteşti
COMPLICAŢII GENERALE APĂRUTE ÎN CABINETUL STOMATOLOGIC ÎN TIMPUL TRATAMENTELOR ODONTALE UZUALE – ANALIZĂ STATISTICĂ 33
GENERAL COMPLICATIONS OCCURRED IN THE DENTAL OFFICE DURING COMMON ODONTAL THERAPY – STATISTICAL ANALYSIS 45
Conf. univ. Dana Cristina BODNAR Conf. univ. Mihai BURLIBAŞA Conf. univ. Ileana IONESCU Conf. univ. Ioana SUCIU Universitatea de Medicină şi Farmacie „Carol Davila” Bucureşti
COOPERATE SOCIAL RESPONSIBILITY AND SUSTAINABLE DEVELOPMENT: A CASE STUDY OF ENGRO FERTILIZER DHAHRKI-SINDH-PAKISTAN 57
Assistant Professor Dr. Asad Raza ABIDI Assistant Professor Dr. Fayyaz Raza CHANDIO Assistant Professor Ali Hassan HALEPOTO SALU-Khairpur Mirs Assistant Professor Faiz M. SHAIKH SZABAC-Dokri-Larkana-Sindh-Pakistan
PRINCIPIILE FUNDAMENTALE ÎN STATISTICA OFICIALĂ
www.revistadestatistica.ro/supliment

Romanian Statistical Review - Supplement nr. 2 / 20142
Revista Română de Statistică, editată de Institutul Naţional de Statistică, este unica publicaţie de specialitate din ţara noastră, în domeniul teoriei şi practicii statistice. Articolele publicate se adresează oamenilor de ştiinţă, cercetătorilor, precum şi utilizatorilor de date şi informaţii statistice interesaţi în lărgirea şi aprofundarea orizontului cunoaşterii prin asimilarea noţiunilor de specialitate, abordarea de noi lucrări şi studii de referinţă pe care să le aplice ulterior în domeniul în care îşi desfăşoară activitatea. Prin prezentarea unor lucrări ştiinţifi ce şi de promovare a culturii statistice, necesară în economia de piaţă funcţională, revista se doreşte a fi un spaţiu propice schimbului de idei şi, totodată, o provocare. Orice studiu sau opinie care poate contribui la dezvoltarea gradului de înţelegere a statisticii ca ştiinţă este binevenit.
The Romanian Statistical Review, issued by the National Institute of Statistics, is in our country specialising in the fi eld of statistical theory and practice. The articles published are addressed to the scientists, researchers and statistical data and information users interested in broadening and deepening their horizon of knowledge by acquiring specialised notions and coming into contact with new papers and reference studies they can later apply in their own fi eld. Through the presentation of papers that are scientifi c in nature and that promote statistical culture, which is necessary in a functional market economy, the Review aims to be a favourable space for exchange of ideas and a challenge at the same time. Any study or opinion that can contribute to the development of the degree understanding statistics as a science is welcome.
La Revue Roumaine de Statistique, éditée par l’Institut National de la Statistique, est la seule publication de spécialité de notre pays dans le domaine de la théorie et de la pratique statistique. Les articles y étant publiés s’adressent aux scientifi ques, aux chercheurs, ainsi qu’aux utilisateurs de données et d’informations statistiques, intéressés d’élargir leur horizon de connaissances avec des notions de spécialité et de nouveaux travaux et études de référence qu’ils peuvent appliquer ultérieurement dans leurs domaines d’activité. Par la présentation de certains ouvrages scientifi ques et de promotion de la culture statistique nécessaires dans l’économie de marché fonctionnelle, la Revue se veut être un espace propice à l’échange d’idées et en même temps une provocation. Toute étude et opinion qui pourraient contribuer au développement du degré de compréhension de la statistique en tant que science sont bienvenues.

Revista Română de Statistică - Supliment nr. 2 / 2014 3
Analiza seriilor interdependente prin metoda corelaţiei Prof.univ.dr. Angelica CĂRBUNARU-BĂCESCU Lector univ.dr. Monica CONDRUZ-BĂCESCU Academia de Studii Economice - Bucureşti
Abstract
Prin metoda corelaţiei putem măsura gradul de interdependenţă dintre două sau mai multe existenţa unei cauze comune care le infl uenţează pe amândouă. Ca atare, ne propunem să examinăm pe scurt problema corelaţiei multiple dintre o variabilă dependentă şi două sau chiar mai multe variabile independente. Cuvinte cheie: analiza corelaţiei, relaţie funcţională (lege matematică), coefi cientul (intensitatea) corelaţiei, corelaţia, corelaţia multifactorială (multiplă), corelaţia multiplă totală, corelaţia multiplă parţială, legături multifactoriale, modelul liniar.
***
Esenţa metodei corelaţiei
În cercetarea statistică întâlnim adeseori repartiţii în care fi ecărei unităţi a populaţiei considerate îi corespund simultan două sau mai multe caracteristici de aceeaşi natură sau de natură diferită. Exemple pot fi găsite în cele mai multe domenii: înălţimea şi greutatea oamenilor, cantitatea precipitaţiilor şi recoltele, înzestrarea tehnică şi productivitatea muncii, etc. Asemenea repartiţii, numite bidimensionale, ne sugerează existenţa unor relaţii între caracteristicile respective. Analiza corelaţiei ţinteşte, pe de altă parte, la măsurarea gradului interdependenţei dintre două sau mai multe variabile. Ea nu poate însă dovedi o legătură cauzală, o legătură de la cauză la efect, între variabile. Interdependenţa poate fi însă funcţională. Prin relaţie funcţională înţelegem acea relaţie care poate fi exprimată printr-o formulă sau prin ceea ce matematicienii numesc o lege matematică, ca de pildă formula relaţiei liniare. Faptul că două

Romanian Statistical Review - Supplement nr. 2 / 20144
variabile tind să fi e asociate, în sensul că creşterea valorilor uneia dintre ele tinde să fi e însoţită de creşterea celei de-a doua şi viceversa, nu dovedeşte că prima infl uenţează sau are un efect direct asupra celei de-a doua sau invers. Dar faptul asocierii nu dovedeşte nici contrariul. Analiza calitativă pe baza cunoaşterii aprofundate a naturii variabilelor este neapărat necesară pentru interpretarea justă a coefi cientului sau intensităţii corelaţiei. Corelaţia celor două variabile se poate explica prin existenţa unei cauze comune care le infl uenţează pe amândouă. Creşterea veniturilor poate cauza atât creşterea variabilei disponibilităţii băneşti a populaţiei, cât şi a variabilei creşterea înzestrării populaţiei cu frigidere. Dar nu se poate spune că prima variabilă este cauza celei de-a doua, ci doar că amândouă sunt determinate de creşterea veniturilor populaţiei. Stabilirea existenţei relaţiilor dintre două variabile dă naştere întrebării: cât de strânse, cât de intense sunt aceste relaţii şi, în consecinţă, cât de mult pot varia estimările sau predicţiile făcute pe baza analizei de regresie. După cum media nu poate fi interpretată cum trebuie fără o măsură a împrăştierii sau variabilităţii datelor din care a rezultat (şi cea mai obişnuită măsură este abaterea pătratică medie sau abaterea standard), tot aşa estimările sau predicţiile ce rezultă din analiza de regresie impun găsirea unei măsuri a variabilităţii lor. Vom lua în considerare ca măsuri ale variabilităţii estimărilor făcute pe baza analizei de regresie, eroarea standard a estimării şi coefi cientul de corelaţie. În acest scop, ne vom referi mai întâi la un exemplu ipotetic constând din cinci perechi de valori asociate.
x y xy x2 y y-Y (y-Y)2
12345
12435
14121225
1491625
1,22,13,03,94,8
-0,2-0,11,0-0,90,2
0,040,011,000,810,04
TOTALURI 15 15 54 55 15,0 0,0 1,90

Revista Română de Statistică - Supliment nr. 2 / 2014 5
Valorile lui a şi b le obţinem cu ajutorul următoarelor formule:
Nx
x
Nyx
xyb 2
2
şi
22
2
xNx
xyxyxa
ceea ce prin înlocuire dă:
9,0
51555
51515542b
3,05551555155415
2a
Ecuaţia dreptei cel mai bine ajustată va fi : y=a+bx
Ecuaţia de regresie este aşadar: xY 9,03,0 +=
Observăm că suma algebrică a diferenţelor (y-Y) este egală cu zero. Dacă ne amintim că prima proprietate algebrică a mediei aritmetice este aceea că suma abaterilor în jurul mediei este egală cu zero, vom trage concluzia că linia de regresie este o linie a mediilor. Ne mai amintim că linia de regresie trebuie să treacă printr-un punct având coordonatele (x, y) şi acesta este cazul şi ecuaţiei noastre deoarece şi linia de regresie va trece prin punctul respectiv.

Romanian Statistical Review - Supplement nr. 2 / 20146
Corelaţia multifactorială multiplă
Vom examina doar pe scurt problema corelaţiei multiple, adică problema corelaţiei dintre o variabilă dependentă şi două sau chiar mai multe variabile independente. De exemplu, putem dori să afl ăm coefi cientul corelaţiei nu numai dintre productivitatea muncii şi numărul muncitorilor, ci şi dintre numărul muncitorilor şi înzestrarea energetică a acestora. Sau am putea dori să afl ăm coefi cientul de corelaţie nu numai dintre randamentul la hectar şi aplicarea unor îngrăşăminte azotoase, ci şi dintre randamentul muncii şi aplicarea unor îngrăşăminte azotoase şi a unor îngrăşăminte fosfatice. Introducerea unei variabile independente sau explicative în plus într-o problemă de regresie are drept rezultat reducerea erorii standard în estimarea lui r, cu alte cuvinte, valoarea coefi cientului de corelaţie va creşte. Se poate concepe ca prin introducerea unor variabile explicative suplimentare coefi cientul de corelaţie să fi e astfel ridicat, încât aproape întreaga variaţie să fi e explicată. Dar greutăţile ce vor apare astfel în calcularea coefi cientului de corelaţie vor fi mai mari decât folosul ce-l vom obţine de pe urma lor. Corelaţia multiplă poate fi parţială sau totală. În timp ce corelaţia multiplă totală măsoară infl uenţa variabilelor independente combinate, corelaţia multiplă parţială măsoară infl uenţa câte uneia din variaţiile variabilelor independente când cealaltă sau celelalte sunt considerate constante. Coefi cientul corelaţiei parţiale arată însemnătatea relativă a fi ecărei variabile independente. M.Ezechiel, un statistician american care a pus bazele unor metode de calculare a corelaţiei multiple totale şi parţiale, a dat următorul exemplu pentru ilustrarea acestor metode. El s-a referit la relaţiile dintre creşterea benefi ciilor unei ferme şi întinderea acesteia, numărul bovinelor şi a muncitorilor. Considerând numai întinderea şi numărul bovinelor el a calculat un coefi cient de corelaţie de 0,904. Introducând şi a treia variabilă independentă, numărul muncitorilor, coefi cientul de corelaţie a crescut la 0,915. Transformând aceşti coefi cienţi de corelaţie în coefi cienţi de determinare, primele două variabile independente explică 81,8% din creşterea benefi ciilor , iar toate trei variabilele independente 83,7%. Introducerea celei de-a treia variabile independente a mărit explicarea variaţiei benefi ciilor fermei cu diferenţa dintre 83,7% şi 81,8%, deci cu 2%. Dacă însemnătatea acestor creşteri a explicaţiei este determinată prin raportarea ei la variaţia neexplicată înainte de introducerea celei de-a treia variabilă independentă (numărul muncitorilor), vom găsi că 2,0/18,3 adică 10,93 procente din variaţia ce a rămas neexplicată când am luat în considerare doar întinderea şi numărul bovinelor, a putut fi asociată cu numărul muncitorilor. Dacă extragem rădăcina pătrată din 0,1093 vom afl a coefi cientul de corelaţie parţială 0,33.

Revista Română de Statistică - Supliment nr. 2 / 2014 7
Legăturile multifactoriale se pot exprima cu ajutorul ecuaţiei de regresie multiplă:
( )+= pxxxfY ..., 21 în care:
pxxx ..., 21 reprezintă caracteristicile independente sau factoriale. = o variabilă reziduu, cu dispersia constantă şi media nulă.
Aşa cum am arătat mai sus, variabilele factoriale incluse în model trebuie să exprime factorii cu infl uenţă esenţială asupra fenomenului cercetat. Modelul cel mai utilizat de regresie multifactorială este modelul liniar exprimat astfel:
pp xaxaxaaY ++++= ...22110 în care: a0 = un coefi cient care exprimă infl uenţa factorilor neincluşi în model considerat cu acţiune constantă, ai (i=1, 2 …p) sunt coefi cienţi de regresie multiplă şi arată ponderea cu care infl uenţează fi ecare caracteristică factorială xi asupra caracteristicii factoriale y. Calculul parametrilor a0, a1 …ap se face pornind de la cunoscuta metodă a celor mai mici pătrate exprimată astfel:
2
22110 ... pp xaxaxaay = minim
Prin derivare se obţine un sistem de ecuaţii normale cu p variabile factoriale şi p+1 parametrii, astfel:
⎪⎪⎪
⎩
⎪⎪⎪
⎨
⎧
=++++
=++++
=++++
=++++
∑ ∑ ∑ ∑∑
∑ ∑ ∑ ∑ ∑∑ ∑ ∑ ∑∑
∑ ∑ ∑ ∑
yxxapxapxaxa
yxxxaxaxxaxa
yxxxaxxaxaxa
yxaxaxana
pppp
pp
pp
pp
222112
2222221120
1121221110
22110
..............................................................................................
...
...
...
Coefi cienţii de regresie ai pot avea fi e semn pozitiv fi e semn negativ şi arată tipul de legătură (directă sau inversă) dinte variabila factorială xi şi variabila rezultativă y.

Romanian Statistical Review - Supplement nr. 2 / 20148
Concluzii
Verifi carea existenţei sau neexistenţei, precum şi a intensităţii acestor relaţii formează obiectul analizei seriilor interdependente. Ea presupune analiza simultană a două variabile şi foloseşte două tipuri de metode statistice: regresia şi corelaţia. Dacă una din cele două variabile este considerată ca variabilă explicativă sau „independentă”, iar cealaltă numită rezultativă sau „dependentă” prezintă modifi cări în cazul unei variaţii a celei dintâi, vom folosi metoda regresiei pentru analiza relaţiilor dintre ele.
Bibliografi e selectivă 1. Andrei, T., (2003), Statistică şi econometrie, Editura Economică, Bucureşti 2. Angelache, C., (2008), Tratat de statistică teoretică şi economică, Editura Economică, Bucureşti 3. Băcescu-Cărbunaru, A. (2009), Statistică – Bazele statisticii, Ed. Universitară, Bucureşti 4. Mark, L. Berenson, David, M. Levine, Timothy, C. Krehbiel, (2012), Basic Business statistics: concepts and applications, twelfth edition, Pearson 5. Prodan, L., (2012), Corelaţia dintre produsul intern brut/locuitor şi rata de ocupare a populaţiei – model econometric de analiză, Revista Română de Statistică nr. 12 6. Tiţan, E., Ghiţă, S., Cărbunaru-Băcescu, A., (2000), Bazele statisticii, Editura Meteora Press, Bucureşti 7. Vătui, M., Voineagu, V., Lilea, E., Goschin, Z., Isaic-Maniu, I., Danciu, A., Todose, D., (2006), Statistică- Teorie şi aplicaţii, Editura A.S.E., Bucureşti

Revista Română de Statistică - Supliment nr. 2 / 2014 9
The Analysis of Interdependent Series by Correlation Method PhD Professor Angelica BĂCESCU - CĂRBUNARU PhD Lecturer Monica CONDRUZ - BĂCESCU Bucharest University of Economic Studies
Abstract
By the correlation method we can measure the degree of interdependence between two or more variables. Qualitative analysis, on the basis of knowing the type of variables, could explain the existence of a common cause that infl uence both of them. As such, we propose to consider briefl y the problem of multiple correlation between a dependent variable and two or more independent variables. Keywords: correlation analysis, functional relationship ( mathematics law), the coeffi cient (intensity) of correlation, correlation, multifactorial (multiple) correlation, total multiple correlation, multiple partial correlation.
***
The essence of correlation method
In statistical research we often encounter distributions where, to each unit of considered population, corresponds simultaneously two or more features of the same kind or of different nature. Examples can be found in most areas : people’s height and weight, the amount of rainfall and harvests, technical equipment and labor productivity, etc. Such distributions, called two-dimensional, suggest the existence of relationships between those features. The correlation analysis measures the degree of interdependence between two or more variables. It can not prove a causal relationship, a relationship of cause and effect between variables. Interdependence can however be functional. By functional relationship we understand the relationship that can be expressed by a formula or by what mathematicians call a mathematics law, such as linear relationship formula. The fact that the two variables tend to be related, meaning that one of them increased levels tend to be accompanied by an increase of the second and vice versa, it doesn’t turn out that the fi rst has a direct infl uence on the second or vice versa. But that association does not

Romanian Statistical Review - Supplement nr. 2 / 201410
prove the opposite either. Qualitative analysis based on a thorough knowledge of the nature of the variables is necessarily required for correct interpretation of the correlation or intensity coeffi cient. The correlation of the two variables can be explained by the existence of common causes that affect both. Revenue growth can cause both increased variable of population cash availability and variable growth of population endowment with refrigerators. But we cannot say that the fi rst variable is the cause of the second, but that both are caused by increasing incomes of population. Determination of relationship between two variables raises the question: how close, how intense are these relationships and, consequently, how much can vary estimates or predictions made on the basis of regression analysis. As the average can not be properly interpreted without a measure of the dispersion or variability of the data from which it resulted (and the most common measure is the average square deviation or standard deviation), so estimates or predictions resulting from the regression analysis require fi nding a measure of their variability. We will consider as measures of estimations variability based on regression analysis, the standard error of estimation and correlation coeffi cient. To this end, we will fi rst refer to a hypothetical example consisting of fi ve pairs of associated values.
x y xy x2 y y-Y (y-Y)2
12345
12435
14121225
1491625
1,22,13,03,94,8
-0,2-0,11,0-0,90,2
0,040,011,000,810,04
TOTALS 15 15 54 55 15,0 0,0 1,90 The values of a and b are obtained with the help of the following formulas:
Nx
x
Nyx
xyb 2
2

Revista Română de Statistică - Supliment nr. 2 / 2014 11
and
22
2
xNx
xyxyxa
which gives by replacement:
9,0
51555
51515542b
3,05551555155415
2a
The best adjusted equation of the right will be: y=a+bx
The regression equation is thus: xY 9,03,0 += We note that the algebraic sum of the differences (y-Y) is equal to zero. If we remember that the fi rst algebraic property of arithmetic average is that the sum of deviations around the average is equal to zero, we conclude that the regression line is a line of averages. We mention that the regression line must pass through a point with coordinates (x, y) and this is the case of our equation for the regression line will pass through that respective point.
The multiple multifactorial correlation
We will only briefl y examine the problem of multiple correlation, ie, the problem of correlation between a dependent variable and two or more independent variables. For example, we want to know not only the correlation coeffi cient between labor productivity and the number of workers, but also between the number of workers and their energy endowment. Or we may want to know the correlation coeffi cient not only between the yield per hectare and application of nitrogenous fertilizers, but also of work output and application of nitrogenous fertilizers and certain phosphate fertilizers. The introduction of a further independent or explanatory variables in a problem of regression results in less standard error in the estimation of r,

Romanian Statistical Review - Supplement nr. 2 / 201412
namely, the value of correlation coeffi cient will increase. It may be conceived that by the introduction of additional explanatory variables, the correlation coeffi cient to be so high, that almost all the variation to be explained. But the diffi culties that will thus appear in the calculation of the correlation coeffi cient will be greater than the benefi t that we will get from them. The multiple correlation may be partial or total. While the overall multiple correlation measures the infl uence of combined independent variables, multiple partial correlation measures the infl uence of each independent variables variations when the other one or the other ones are considered constant. Partial correlation coeffi cient shows the relative importance of each independent variable. M.Ezechiel, an American statistician who founded methods of calculating multiple and partial correlation, gave the following example to illustrate these methods. He referred to the relationship between the increase in the benefi ts of a farm and its size, the number of cattle and workers. Considering only the extent and number of cattle, he calculated a correlation coeffi cient of 0.904. Introducing a third independent variable, the number of workers, the correlation coeffi cient increased to 0.915. Transforming these correlation coeffi cients in coeffi cients of determination, the fi rst two independent variables explain 81.8 % of the increase in benefi ts, and all three independent variables 83.7%. The introduction of the third independent variable incresed the explanation of farm benefi ts variation with the difference between 83.7% and 81.8 %, therefore with 2%. If the explanation of the signifi cance of these increases is determined by comparing them to the unexplained variation before the introduction of the third independent variable (the number of workers ), we fi nd that 2.0 / 18.3 namely 10.93 percent of the variation that remained unexplained when we considered only the extent and number of cattle, could be associated with the number of workers. If you take the square root of 0.1093 we fi nd the partial correlation coeffi cient 0.33. Multifactorial links can be expressed with the help of multiple regression equation:
( )+= pxxxfY ..., 21 where:
pxxx ..., 21 represent the independent or factorial characteristics. = o residue variable with zero average and constant variance.
As noted above, the factorial variables included in the model should express key factors infl uencing the phenomenon investigated. The most widely used model of multifactorial regression is the linear model expressed as follows:

Revista Română de Statistică - Supliment nr. 2 / 2014 13
pp xaxaxaaY ++++= ...22110 where: a0 = a coeffi cient expressing the infl uence of not included factors in the model considered with constant action, ai (i=1, 2 …p) are multiple regression coeffi cients and show the share of each characteristic factor xi infl uencing the characteristic factor y.
Calculation of the parameters a0, a1 …ap is made starting from the well known method of the smallest squares expressed as:
2
22110 ... pp xaxaxaay = minimum
By derivation is obtained a normal equation system with p factorial variables and p +1 parameters, as follows:
⎪⎪⎪
⎩
⎪⎪⎪
⎨
⎧
=++++
=++++
=++++
=++++
∑ ∑ ∑ ∑∑
∑ ∑ ∑ ∑ ∑∑ ∑ ∑ ∑∑
∑ ∑ ∑ ∑
yxxapxapxaxa
yxxxaxaxxaxa
yxxxaxxaxaxa
yxaxaxana
pppp
pp
pp
pp
222112
2222221120
1121221110
22110
..............................................................................................
...
...
...
Regression coeffi cients ai can have either a positive sign either a negative sign and show the type of connection (direct or inverse) between the factorial variable xi and the resultant variable y.
Conclusions
Checking the existence or non-existence and the intensity of these relations is the object of interdependent series analysis. It involves the simultaneous analysis of two variables and uses two types of statistical methods: regression and correlation. If one of the two variables is considered as explanatory variable or “independent”, and the other called resultant or “dependent”, present changes in the case of a variation of the fi rst, we will use the regression method to analyze the relationships between them.

Romanian Statistical Review - Supplement nr. 2 / 201414
Bibliography
1. Andrei, T., (2003), Statistică şi econometrie, Editura Economică, Bucureşti 2. Angelache, C., (2008), Tratat de statistică teoretică şi economică, Editura Economică, Bucureşti 3. Băcescu-Cărbunaru, A. (2009), Statistică – Bazele statisticii, Ed. Universitară, Bucureşti 4. Mark, L. Berenson, David, M. Levine, Timothy, C. Krehbiel, (2012), Basic Business statistics: concepts and applications, twelfth edition, Pearson 5. Prodan, L., (2012), Corelaţia dintre produsul intern brut/locuitor şi rata de ocupare a populaţiei – model econometric de analiză, Revista Română de Statistică nr. 12 6. Tiţan, E., Ghiţă, S., Cărbunaru-Băcescu, A., (2000), Bazele statisticii, Editura Meteora Press, Bucureşti 7. Vătui, M., Voineagu, V., Lilea, E., Goschin, Z., Isaic-Maniu, I., Danciu, A., Todose, D., (2006), Statistică- Teorie şi aplicaţii, Editura A.S.E., Bucureşti

Revista Română de Statistică - Supliment nr. 2 / 2014 15
Integrarea României în Uniunea Europeană, surprinsă în indicatorii statistici ai mediului Conf.univ. dr. Gheorghe SĂVOIU conf. univ dr. Constantin MANEA prof. univ. dr. Ion Iorga SIMĂN Universitatea din Piteşti
Abstract
După aderarea României la Uniunea Europeană, întregul sistem de indicatori statistici şi implicit cel referitor la protecţia mediului înconjurător este permanent confruntat statistic cu media EU-27 (EU-28, după 1 ianuarie 2014), a dinamicilor, nivelurilor şi structurilor acestor indicatori. Articolul descrie în tabele statistice relevante, de o manieră distinctă şi succintă realităţi post integrare în EU, ale protecţiei mediului în plan naţional, redefi nind decalaje şi tendinţe. Convergenţa la UE şi dezvoltarea durabilă a economiei româneşti impun pe termen mediu şi lung similitudini nivel, dinamică şi structură, în raport cu media europeană şi la această categorie de indicatori. Cuvinte cheie: indicator de mediu, EU-27, confruntare statistică, deşeuri, reciclare
***1. Introducere
Sistemul european de indicatori statistici de mediu delimitează patru domenii principale de evaluare a mediului înconjurător: a) schimbările climatice; b) natura şi biodiversitate; c) mediul, sănătatea şi calitatea vieţii; d) resursele naturale şi deşeurile. La nivel intern, colectarea, validarea şi diseminarea datelor de mediu pentru realizarea de indicatori statistici aparţin instituţiei specializate a Uniunii Europene pentru statistică (Eurostat), dar sunt organizate concret în

Romanian Statistical Review - Supplement nr. 2 / 201416
cadrul centrelor de date de mediu (EDCs) vizând capitolele resurse naturale, produse şi deşeuri. La nivel internaţional, Eurostat asigură armonizarea statisticilor şi metodologiilor referitoare la mediu, prin Intersecretariatul Grupului de lucru privind statisticile mediului (IWG-ENV) şi la Conturile de mediu prin Grupul de la Londra şi Comitetul de experţi pentru probleme economice şi de contabilitatea mediului al Naţiunilor Unite (UNCEEA). Statistica deşeurilor şi substanţelor periculoase – Centrul de date “Deşeuri” se axează pe dezvoltarea şi menţinerea indicatorilor privind generarea, recuperarea şi eliminarea deşeurilor, dar şi managementul deşeurilor pentru susţinerea politicii comunitare în domeniul deşeurilor. Statistica apei, aerului şi schimbărilor climatice – Centrul de date Protocolul de la Kyoto asigură indicatorii statistici privind colectarea datelor armonizate privind resursele de apă, utilizarea apei şi tratarea apelor reziduale, asigurarea calităţii datelor privind emisiile de gaze cu efect de seră şi alţi poluanţi ai aerului. Conturi de mediu şi statistica cheltuielilor de protecţia mediului – Centrele de date de mediu “Resurse naturale” şi “Produse” dezvoltă un set integrat de conturi satelit pentru a analiza interacţiunilor dintre economie şi mediu: a) contul fl uxurilor de materiale/resurse naturale; b) emisii în aer; c) energie; d) apă; e) deşeuri; f) statistici privind cheltuielile de mediu, impozite şi eco-industria. Managementul şi raportarea integrată a bazelor de date privind mediul, statisticile regionale de mediu, Medstat colectează date prin chestionarele specifi ce ale Eurostat / OECD. În România, s-au constata unele progrese realizate în sistemul de monitorizare a mediului şi în asigurarea cadrului de raportare a datelor, dar există încă mari probleme în satisfacerea cerinţelor politice şi asigurarea unui raport cost / efi cienţă în ceea ce priveşte colectarea datelor şi informaţiilor de mediu. Coexistă multe suprapuneri de date şi indicatori ceea ce creează şi ambiguitate şi neîncredere relativă uneori. La nivelul producătorului de informaţii statistice la nivel naţional, respectiv Institutul Naţional de Statistică (INS) se structurează trei aspecte majore ce se soluţionează în prezent: a) creşterea calităţii şi comparabilităţii indicatorilor; b) majorarea accesului şi simplifi carea procedurilor de asigurare promptă a indicatorilor; c) selectarea şi utilizarea indicatorilor relevanţi. Toate aceste aspecte au impus: a) dezvoltarea unei infrastructuri efi ciente pentru îmbunătăţirea diseminării cercetărilor şi prelucrării datelor şi indicatorilor de mediu; b) revizuirea cerinţelor pentru crearea unui sistem coerent şi unic de indicatori; c) îmbunătăţirea calităţii şi comparabilităţii indicatorilor; d) disponibilitatea metodologiilor şi serviciilor de informaţii privind indicatorii de mediu; e) interoperabilitatea politicilor de producere a indicatorilor de mediu şi monitorizare. Sistemul naţional de indicatori statistici de mediu creat de INS acoperă

Revista Română de Statistică - Supliment nr. 2 / 2014 17
domeniile: deşeuri, apă, emisii în aer, cheltuieli pentru protecţia mediului, dezvoltare durabilă cu referinţă la mediu, conturi de mediu în conformitate cu normele şi standardele U.E. şi valorifi că cele trei abordări specifi ce statisticilor de mediu: abordarea pe elemente (aer, apă, sol, biodiversitate etc), abordarea economică (măsurarea surselor şi nivelului impactului activităţilor umane susceptibile de degradarea mediului, evaluarea reacţiei mediului sau a calităţii mediului şi cuantifi carea răspunsului societăţii-protecţia mediului) şi reprezentarea geografi că (reunind aspectele cu impact la nivel global de la emisii de gaze cu efect de seră, la diminuarea stratului de ozon, cu aspectele continentale sau europene de la emisii transfrontaliere diverse la substanţe acidifi ante, respectiv cu aspecte regionale sau locale, de la acumulări de nutrienţi, la metale grele şi compuşi persistenţi organici în sol sau apa subterană, de la zgomot, la ameninţarea locală a biodiversităţii). Statisticile naţionale ale mediului reunesc date cantitative privind mai întâi mediul fi zic, de la potenţialul resurselor naturale, structura acestora după anumite caracteristici şi modul de utilizare, concentraţii de poluanţi în aer, apă şi sol, la măsurarea biodiversităţii, apoi întregesc imaginea dezechilibrului fi zic concret cu aspecte economico-fi nanciare, de la cheltuielile entităţilor economice şi gospodăriilor pentru instalaţii şi echipamente de combatere a poluării, la costurile operaţiilor de epurare, la valoarea comercială a pământului, a pădurilor, a peştilor din ape şi a altor resurse naturale.
2.România şi Uniunea Europeană într-o confruntare statistică a indicatorilor de mediu
După aderarea României la Uniunea Europeană, întregul sistem de indicatori statistici şi implicit cel referitor la protecţia mediului înconjurător este permanent confruntat statistic cu media europeană a indicatorilor naţionali, a dinamicilor, nivelurilor şi structurilor acestora, respectiv cu indicatori EU-27 (deşi aparent EU - 28 ar fi fost mult mai adecvat realităţii din 2014, datele disponibile ale U.E. pe http://appsso.eurostat.ec.europa.eu/ deţin ca ultim an disponibil 2011, ceea ce schimbă doar formal analiza, neasigurând profunzimea şi promptitudinea specifi că analizei statistice în general). În acest sens o analiză de confruntare a indicatorilor esenţiali de mediu în EU-27 şi România poate clarifi ca acest tip de abordare conferind un caracter emergent implicit. Altfel, conform statisticilor naţionale analizate izolat şi neconfruntate în arealul european, conform evaluărilor Băncii Mondiale, situaţia la României pare şi poate fi declarată favorabilă, folosind ca exemplifi care cazul emisiilor de CO2 destul de relevant ca trend favorabil şi impact tot mai redus.

Romanian Statistical Review - Supplement nr. 2 / 201418
Evoluţia emisiilor de CO2 în România între 1989 şi 2010Tabel nr. 1
Schimbări absolute şi relative în emisiile de CO2
din 1989 în 2000
din 2000 în 2008
din 1989 în 2008 în 2009 în
2010Emisiile de CO2 193.309,5 95.306,7 110.860,4 80,307 78,745
Schimbări în emisiile de CO2 - % -50,7 16,3 -42,7 * -2,0
Variaţia anuală în emisii de CO2-% -6,2 1,9 -2,9 * -2,0
Sursa: http://data.worldbank.org/indicator/EN.ATM.CO2E.KT Notă: *irelevant
Acest tip de evaluare singulară, în afara unor convenţii şi tratate dar mai ales în afara reglementărilor şi obiectivelor europene devine însă lipsit de conţinut, fi ind necesară şi o confruntare cu ţintele U.E. pe termen mediu sau lung şi cu nivelul mediu al unui proces în plan european. Situaţia de comparare continuă ce este descrisă în indicatorii României şi U.E. este redată în paralel, indicatorul de mediu naţional şi cel din UE-27 (accesibile pe http://appsso.eurostat.ec.europa.eu/) sau EU-15 redând în esenţă tendinţe similare, dar şi semnifi cativ diferite ca nivel, între România şi comunitatea economică, socială şi politică din care aceasta face parte integrantă după 1 ianuarie 2007. Câteva astfel de exemple comparative sunt edifi catorii, uneori prin decalaje favorabile ca nivel şi intensitate:
Emisii de gaze cu efect de seră* în EU – 15 şi România, după 2007Anul 1997 (semnarea protocolului de Kyoto) = 100 % Tabel nr. 2
2007 2008 2009 2010 2011**
EU - 15 95,73 93,75 87,19 89,03 -
România 54 52,72 44,35 43,62 -*Notă: Fără aviaţia internaţională şi conform protocolului de la Kyoto (Acordul semnat la Kyoto prevede o reducere a emisiilor poluante cu 5,2% între 2008 şi 2012) **Notă de redactare=lipsa date

Revista Română de Statistică - Supliment nr. 2 / 2014 19
alteori numai ca nivel:
Emisii de gaze cu efect de seră** în EU – 27 şi România, după 2007Anul 1990 = 100 % Tabel nr. 3
2007 2008 2009 2010 2011
EU - 27 92,16 90,29 83,74 85,72 83,03
România 58,36 57,48 49,24 47,76 50,46Sursa: http://epp.eurostat.ec.europa.eu/portal/page/portal/statistics/search_database** Notă: Include aviaţia internaţională
sau chiar defavorabile ori alternative ca nivel
Expunerea populaţiei urbane la poluarea aerului în EU-27 şi RomâniaTabel nr. 4
Expunerea populaţiei urbane la
poluarea aerului cu particule materiale -PM10 (micrograme per m³)
Expunerea populaţiei urbane la poluarea aerului cu ozon (micrograme
per m³)
2007 2008 2009 2010 2011 2007 2008 2009 2010 2011EU-27 28 26 26 26 27 3611 3580 3648 3368 3706Romania 46 40 30 35 39 3752 3376 4496 1329 2013 Sursa: http://epp.eurostat.ec.europa.eu/portal/page/portal/statistics/search_database
Abordarea procentuală a energiei electrice din surse regenerabile în totalul energiei electrice poziţionează aparent mai bine România decât media europeană:
Ponderea energiei electrice din surse regenerabile în totalul energiei electrice
Tabel nr. 5%
2007 2008 2009 2010 2011
EU – 27 15,02 16,25 18,18 19,74 20,54
România 26,86 28,37 27,91 34,18 27,1Sursa: http://epp.eurostat.ec.europa.eu/portal/page/portal/statistics/search_database

Romanian Statistical Review - Supplement nr. 2 / 201420
similar ca nivel favorabil României cu cota de energice recuperabilă din consumul fi nal brut de energie, dar trendul diferă semnifi cativ până în 2020:
Cota de energie recuperabilă din consumul fi nal brut de energieTabel nr. 6
% 2007 2008 2009 2010 2011 … Program 2020
EU - 27 9,7 10,4 11,6 12,5 13,0 … 20Romania 18,4 20,3 22,3 23,4 21,4 … 24 Sursa: http://epp.eurostat.ec.europa.eu/portal/page/portal/statistics/search_database Adevărul statistic relativ descris anterior este însă contestat de consumul intern de energie raportat la PIB, unde decalajele sunt foarte mari şi astfel se poate observa cu uşurinţă risipa specifi că economiilor mai slab dezvoltate:
Intensitatea energetică a economiei (consumul intern de energie raportat la PIB) în EU-27 şi în România
Tabel nr. 7- kg. de petrol echivalent per 1000 euro -
2007 2008 2009 2010 2011EU – 27 152,9 151,6 150,1 152,0 144,3România 443,3 412,2 386,8 393,0 392,0
Sursa: http://epp.eurostat.ec.europa.eu/portal/page/portal/statistics/search_database
Întreaga concepţie de protejare a mediului natural axată pe refolosire, reciclare şi recuperare dezvăluie prin indicatori statistici o distanţa destul de lungă în ani între economia României şi economia abstractă medie europeană:
Refolosirea, reciclarea şi recuperarea autovehiculelor Tabel nr. 8
- mii bucăţi -2007 2008 2009 2010 2011
EU – 27 6030 5940 8370 7200 6710România 32,01 44,03 48,42 162,28 110,04
Sursa: http://epp.eurostat.ec.europa.eu/portal/page/portal/statistics/search_database

Revista Română de Statistică - Supliment nr. 2 / 2014 21
fi e că se face referire la reciclarea deşeurilor de ambalaje:
Ratele de reciclare pentru deşeurile de ambalajeTabel nr. 9
% 2007 2008 2009 2010 2011
EU – 27 59,2 60,5 62,5 63,3 63,6România 30,6 33,5 40,5 43,4 50
Sursa: http://epp.eurostat.ec.europa.eu/portal/page/portal/statistics/search_database
fi e la recuperarea acestora:
Ratele de recuperare a deşeurilor de ambalajeTabel nr. 10
% 2007 2008 2009 2010 2011
EU – 27 72,6 72,8 74,6 76,2 77,3România 36,6 40,7 46,7 48,3 54,4
Sursa: http://epp.eurostat.ec.europa.eu/portal/page/portal/statistics/search_database
Decalajul de dezvoltare nu mai este atât de mare la generarea de deşeuri municipale, între EU - 27 si România:
Deşeuri municipale colectate, pe locuitor Tabel nr.11
- kg/locuitor -2007 2008 2009 2010 2011
EU – 27 522 519 509 505 500România 379 392 362 365 365
Sursa: http://epp.eurostat.ec.europa.eu/portal/page/portal/statistics/search_database
Din păcate rata de reciclare a deşeurilor municipale este extrem de redusă în România, cu mult sub media europeană, deşi a crescut de peste şapte ori în ultimii cinci ani. În Europa au fost reciclate, în 2010, 35% din deşeurile municipale, ceea ce înseamnă o îmbunătăţire semnifi cativă comparativ cu numai 23% în 2001.

Romanian Statistical Review - Supplement nr. 2 / 201422
Rata de reciclare a deşeurilor municipale (%)Tabel nr. 12
%2007 2008 2009 2010 2011
România 1,06 1,10 2 6 7 Sursa: http://epp.eurostat.ec.europa.eu/portal/page/portal/statistics/search_database
Aparent veniturile fi scale din taxa de mediu sunt apropiate de media europeană.
Valoarea veniturilor fi scale din taxe de mediu în cadrul PIBTabel nr. 13
%2007 2008 2009 2010 2011
EU – 27 2,39 2,32 2,39 2,38 2,39România 2,06 1,78 1,87 2,02 1,82
Sursa: http://epp.eurostat.ec.europa.eu/portal/page/portal/statistics/search_database
la cheltuieli situaţia este mult mai relevantă statistic şi fi nanciar. Apar sau există fi resc şi situaţii de neconformitate care pot fi uşor rezolvate prin dublă abordare statistică a indicatorilor de mediu, ca în cazul cheltuielilor pentru protecţia mediului, exemplul raportării la cheltuielile efective fi ind revelator în esenţă:
Cheltuielile bugetului de stat (sectorului public) pentru protecţia mediului
Tabel nr. 14%
2001 2002 2003 2004 2005 2006 2007 2008* 2009* 2010* 2011* 2012*
România 0,13 0,2 0,13 0,22 0,23 0,54 0,59 0,51 0,54 0,68 0,92 1,3
*Notă: Procente calculate ca raport între cheltuielile de mediu şi total cheltuieli ale bugetului de statSursa: https://statistici.insse.ro/shop/index.jsp?page=tempo3&lang=ro&ind=FIN101B
Totul poate fi completat cu confruntarea internă a unor indicatori colaterali, de exemplu taxa de mediu medie la nivelul UE – 27 este de 2,3 - 2,4% iar în România sub 2%, în timp ce taxa de poluare de 0,1% din PIB în UE–27 şi numai 0,01% în România. Indiferent de nivelul agregativ al abordării există aspecte câteva aspecte specifi ce ale indicatorilor statistici de mediu cu impact în înţelegerea fenomenului în ansamblu.

Revista Română de Statistică - Supliment nr. 2 / 2014 23
3. Câteva remarci fi nale
În raport cu mulţi alţi indicatori statistici, indicatorul statistic de mediu este caracterizat de complexitate şi un grad mai mare de acoperire, sintetic în datele componente, simultan calitativ şi agregativ de la descrierea nivelului regional către cel naţional şi unional, de un grad de incertitudine cauzală mai mare. Indicatorul statistic de mediu este mult mai evaziv cauzal şi corelativ. Unele consecinţe descrise prin indicator pot avea cauze plasate cu mult timp în trecut şi ceea ce se poate face astăzi nu refl ectă un aspect corelat integral, un impact imediat, dar poate deveni un alt factor explicativ al proiecţiei pe termen mediu şi lung. Confruntarea statistică prin indicatori de mediu a României cu Uniunea Europeană după 1 ianuarie 2007, conform datelor Eurostat, relevă unele aspecte favorabile cauzate de nivelul mai redus de dezvoltare şi implicit de poluare, dar şi numeroase aspecte negative asociate aceleiaşi cauze. Convergenţa la UE şi dezvoltarea durabilă a economiei româneşti impun pe termen mediu şi lung similitudini nivel, dinamică şi structură, în raport cu media europeană şi la această categorie de indicatori cu impact de durată şi cu importanţă decizională tot mai mare la nivel macroeconomic.
Bibliografi e - Ghereş, Marinela, Săvoiu Gheorghe, (2010), Economia mediului. Tratat, Ed. Universitară, Bucureşti. - Săvoiu Gheorghe (2006), Populaţia lumii între explozie şi implozie demografi că, Ed. International University Press, Bucureşti. - Săvoiu, Gheorghe, (2010), Gândirea statistică aplicată. Sisteme de indicatori rezultaţi din documente şi situaţii statistice fi nanciar contabile, Ed. Universitară, Bucuresti. - Săvoiu Gheorghe, (2011), Sisteme contemporane de indicatori statistici privind protecţia mediului, Revista Română de Statistică, Supliment nr. 3/2011, pag. 45-52. - Săvoiu Gheorghe, Manea Constantin, (2011), Enviromental statistics and human ecology, Revista Română de Statistică, nr 9/ 2011, pag. 75-101. - Săvoiu Gheorghe, Butnariu Mihaela, (2013), Statistical analysis of collecting and recycling sports waste in Romania, using a representative focus group of sportsmen and possible prospects, Journal of Physical Education and Sport (JPES), Vol 13 issue 2, pp. 166 – 169. - Săvoiu Gheorghe, Iorga Siman Ion, Manea Constantin, Mladen Čudanov, (2012), Methodological Rigors in the Statistical Research on Urban Household Waste, Romanian Statistical Review Supplement, vol. 60(3), pag. 25-33. - Ştefănescu I., Iorga-Simăn I., Săvoiu G., Manea C., (2009). Life quality and human ecology-Interferences in academic education and in scientifi c research, Progress of Cryogenics and Isotopes Separation, vol 12(23-24), pag.117-128 - Ţaicu M., Săvoiu G., Ciprian A., (2011). Environmental management accounting, eco-performance and human ecology of modern companies, The Eco-Economic Challenges for XXI Century, Ed.Tehnopress, pag.81-89.
Romanian Statistical Review - Supplement nr. 2 / 201424
Romania’s Integration in the European Union, in terms of environmentstatistical indicators PhD Senior Lecturer Gheorghe SĂVOIU PhD Senior Lecturer Constantin MANEA PhDProfessor Ion Iorga SIMĂN University of Piteşti
Abstract
After Romania joined the European Union, the whole system of statistical indicators, and implicitly the system of environmental protection has been constantly confronted, in statistical terms, with the EU-27 average (EU-28, after the 1st of January, 2014), namely the dynamics, the levels and structures of those indicators. The paper describes, in relevant statistical tables and in a clear, succinct manner, post-EU-integration realities concerning environmental protection in Romania, redefi ning some gaps and trends. EU convergence and the sustainable development of the Romanian economy in the medium and long term require similarity of level, dynamics and structure in relation to the European average in this category of indicators, too. Keywords: environmental indicator, EU -27, statistical confrontation, waste, recycling. JEL code: Q01, Q51, Q53, Q57.
1. Introduction
The European system of environmental statistical indicators delimits four main areas of environmental assessment: a) climate change; b) nature and biodiversity; c) the environment, health and life quality; d) natural resources and waste. At the domestic level, environment data collection, validation and dissemination meant to establish statistical indicators are the province of the EU specialized agency for statistics (Eurostat), but are organized within specifi c environmental data centres (EDCs) aiming at the following chapters: natural resources, products and waste. Internationally, Eurostat provides harmonization of environmental statistics and methodologies, through the Intersecretariat of the Working Group for Environment Statistics (IWG-ENV),

Revista Română de Statistică - Supliment nr. 2 / 2014 25
and, for environmental accounts, by the London Group and the Committee of UN Experts for Economic and environmental accounting (UNCEEA). The statistics of waste and hazardous substances – the Data Center for “waste” focuses on developing and maintaining the indicators on the generation, recovery and disposal of waste, as well as waste management to support Community policy on waste. The statistics of water, air and climate change – the Kyoto Protocol Data Centre provides statistical indicators concerning harmonized data collection on water resources, water use and wastewater treatment, ensuring quality of data on greenhouse gas emissions and other air pollutants. Environmental accounts and environmental expenditure statistics – the “Natural Resources” and “Products” Environmental Data Centres develop an integrated set of satellite accounts to analyze the interactions between the economy and the environment: a) account for material fl ows / natural resources; b) emissions in the air; c) energy; d) water; e) waste; f) statistics on environmental expenditure, taxes and eco-industry. Management and integrated reporting of environmental data bases on the environment, regional environmental statistics, Medstat collects data through specifi c questionnaires of Eurostat / OECD. In Romania, some progress has been noted in the environmental monitoring system and providing the scope and framework of data reporting, but there are still major problems in meeting policy requirements and providing a good cost / effi ciency ratio in terms of data collection and information on the environment. There is much overlapping of data and indicators, which generates ambiguity, and sometimes relative confi dence. At the level of the producer of national statistical information, i.e. the National Institute of Statistics (INS), three major issues are perceivable, which are being solved now: a) improving the quality and comparability of indicators; b) increasing access and simplifying procedures to provide timely indicators; c) selecting and using relevant indicators. All the above issues have naturally triggered: a) developing an effective infrastructure intended to improve the dissemination of research and processing environmental data and indicators; b) reviewing the requirements for creating a coherent and unique system of indicators; c) improving the quality and comparability of indicators; d) availability of methodologies and information services concerning environmental indicators; e) interoperability of the policies that produce environmental indicators and monitoring. The national system of environmental statistical indicators set up by INS encompasses the following fi elds: waste, water, air emissions, environmental costs, environmental sustainable development with reference to the environment,

Romanian Statistical Review - Supplement nr. 2 / 201426
environmental accounts in accordance with EU standards, and capitalizes on the three approaches specifi c to environmental statistics: considering the elements (air, water, land, biodiversity, etc.), addressing the economic aspects (measuring the sources and the level of the impact of the human activities likely to cause degradation of the environment, assessing environmental response or environmental quality, and quantifying society’s response (protection of the environment), and geographical representation (bringing together issues of global impact, from emissions of greenhouse gases to the ozone depletion, and continental or European aspects, from various trans-border emissions to acidifying substances, and, respectively, regional or local issues, from accumulations of nutrients to heavy metals and persistent organic compounds in soil or groundwater, from noise to threats to local biodiversity). The national environmental statistics bring together quantitative data concerning fi rst the physical environment, from the potential of natural resources, their structure in keeping with certain features and their use, concentrations of pollutants in air, water and soil, to measuring biodiversity, then complete the image of the actual physical imbalance by providing economic and fi nancial aspects such as expenditure of economic entities and households for devices and equipment to combat pollution, the cost of treatment operations, the commercial value of the land, the forests, the fi sh in the water, and other natural resources.
2. Romania and the European Union, in a confrontation of environmentstatistical indicators
After Romania joined the European Union, the whole system of statistical indicators, and implicitly the system of environmental protection, has been constantly confronted with the statistical average of the European national indicators, the dynamics, their levels and structure, i.e. EU-27 indicators (although apparently EU-28 would have been more appropriate for the reality in 2014; the data of EU http://appsso.eurostat.ec.europa.eu/ have 2011 as the latest available year, which changes the analysis only in so far as form is concerned, while failing to provide the depth and timeliness specifi c to statistical analysis in general). In this regard, an analysis meant to confront the key environmental indicators in EU-27 and Romania can clarify this approach, conferring it an implicitly emergent nature. Thus, according to national statistics analyzed in isolation and non-confronted in the European zone, according to the World Bank’s assessment, Romania’s situation seems, and can be declared favourable, using as an example the case of CO2 emissions, which is quite relevant as more favourable in trend and ever lower impact.

Revista Română de Statistică - Supliment nr. 2 / 2014 27
Evolution of CO2 emissions in Romania between 1989 and 2010Table no. 1
Absolute and relative changes in CO2 emissions
from 1989 to 2000
from 2000 to 2008
from 1989 to 2008 in 2009 in
2010
CO2 emissions 193,309.5 95,306.7 110,860.4 80,307 78,745
Changes in CO2 emissions – % -50,7 16,3 -42,7 * -2,0
Annual variation in CO2 emissions % -6,2 1,9 -2,9 * -2,0
Source: http://data.worldbank.org/indicator/EN.ATM.CO2E.KT Note: *irrelevant
However, this type of singular evaluation, placed outside of conventions and treaties, and especially outside the European regulations and targets, turns out to be shallow, so a confrontation is needed with EU medium or long-term targets and the average level of a European process. The continuous comparison situation, described in Romania’s and EU’s indicators, is shown in parallel. The national and the EU-27 environment indicator (available on http://appsso.eurostat.ec.europa.eu/) or EU-15 essentially show similar trends, which are nevertheless signifi cantly different in level, between Romania and the economic, social and political community it has become an integral part of since 1 January 2007. Some comparative examples are convincing, sometimes by gaps that are favourable in both level and intensity:
Emissions of greenhouse gases* in EU-15 and Romania, after 2007Table no. 2
The year 1997 (signing of the Kyoto Protocol) = 100%2007 2008 2009 2010 2011**
EU-15 95.73 93.75 87.19 89.03 -Romania 54 52.72 44.35 43.62 -*Note: Without world aviation and in keeping with the Kyoto Protocol (The agreement signed in Kyoto stipulates a decrease in pollutant emissions by 5.2% between 2008 and 2012) **Note: missing data

Romanian Statistical Review - Supplement nr. 2 / 201428
and at other times only in point of level:
Emissions of greenhouse gases* in EU-27 and Romania, after 2007Table no. 3
The year 1990 = 100 %2007 2008 2009 2010 2011
EU-27 92.16 90.29 83.74 85.72 83.03
Romania 58.36 57.48 49.24 47.76 50.46Source: http://epp.eurostat.ec.europa.eu/portal/page/portal/statistics/search_database** Note: including international aviation
or even unfavourable, or alternating in point of level
Exposure of urban population in EU-27 and RomaniaTable no. 4
Exposure of urban population to air pollution with particulate matter -
PM10 (micrograms per m³)
Exposure of urban population to air pollution with ozone (micrograms per m³)
2007 2008 2009 2010 2011 2007 2008 2009 2010 2011EU-27 28 26 26 26 27 3611 3580 3648 3368 3706Romania 46 40 30 35 39 3752 3376 4496 1329 2013 Source: http://epp.eurostat.ec.europa.eu/portal/page/portal/statistics/search_database As far as the percentage of electricity from renewable sources in total electricity is concerned, Romania is seemingly better positioned than the EU average:
The share of electricity from renewable sources in total electricityTable no. 5
% 2007 2008 2009 2010 2011
EU-27 15.02 16.25 18.18 19.74 20.54Romania 26.86 28.37 27.91 34.18 27.1 Source: http://epp.eurostat.ec.europa.eu/portal/page/portal/statistics/search_database
similar, as a favourable level, to Romania’s renewable energy share of the gross fi nal consumption of energy, though the trend is signifi cantly different till 2020:

Revista Română de Statistică - Supliment nr. 2 / 2014 29
The share of renewable energy in gross fi nal energy consumptionTable no. 6
% 2007 2008 2009 2010 2011 … Program 2020
EU-27 9.7 10.4 11.6 12.5 13.0 … 20Romania 18.4 20.3 22.3 23.4 21.4 … 24 Source: http://epp.eurostat.ec.europa.eu/portal/page/portal/statistics/search_database However, the relative statistical truth described above is challenged by domestic energy consumption to GDP, where the gaps are very large, and thus one can easily notice the waste specifi c to less developed economies:
Energy intensity of the economy (domestic consumption of energy relative to GDP) in the EU-27 and in Romania
Table no. 7– kg. oil equivalent per 1,000 euro -
2007 2008 2009 2010 2011EU-27 152.9 151.6 150.1 152.0 144.3
Romania 443.3 412.2 386.8 393.0 392.0 Source: http://epp.eurostat.ec.europa.eu/portal/page/portal/statistics/search_database
The whole concept of protecting the natural environment, which is focused on reusing, recycling and recovery, reveals, through the statistical indicators, a rather substantial time gap, expressed in years, between the Romanian economy and the average abstract European economy:
Reuse, recycling and recovery of vehicles Table no. 8
– thousand units – 2007 2008 2009 2010 2011
EU-27 6030 5940 8370 7200 6710Romania 32.01 44.03 48.42 162.28 110.04
Source: http://epp.eurostat.ec.europa.eu/portal/page/portal/statistics/search_database
whether it refers to recycling of packaging waste:

Romanian Statistical Review - Supplement nr. 2 / 201430
Recycling rates for packaging wasteTable no. 9
% 2007 2008 2009 2010 2011
EU-27 59.2 60.5 62.5 63.3 63.6Romania 30.6 33.5 40.5 43.4 50
Source: http://epp.eurostat.ec.europa.eu/portal/page/portal/statistics/search_database
or to their recovery:
Recovery rates of waste packagingTable no. 10
% 2007 2008 2009 2010 2011
EU-27 72.6 72.8 74.6 76.2 77.3Romania 36.6 40.7 46.7 48.3 54.4
Source: http://epp.eurostat.ec.europa.eu/portal/page/portal/statistics/search_database
The development gap between EU-27 and Romania is not so great as far as generating municipal waste is concerned:
Municipal waste collected per capitaTable no.11
- kg/capita – 2007 2008 2009 2010 2011
EU-27 522 519 509 505 500Romania 379 392 362 365 365
Source: http://epp.eurostat.ec.europa.eu/portal/page/portal/statistics/search_database
Unfortunately, municipal waste recycling rate is extremely low in Romania, far below the European average, although it has increased more than seven times over the last fi ve years. In Europe 35 % of municipal waste was recycled in 2010, which is a signifi cant improvement, if compared with a mere 23 % in 2001.

Revista Română de Statistică - Supliment nr. 2 / 2014 31
Municipal waste recycling rate (%)Table no. 12
% 2007 2008 2009 2010 2011
Romania 1.06 1.10 2 6 7 Source: http://epp.eurostat.ec.europa.eu/portal/page/portal/statistics/search_database
Apparently, the revenues ensuing from environmental taxes are close to the European average.
The amount of revenues from environmental taxes in GDPTable no. 13
% 2007 2008 2009 2010 2011
EU-27 2.39 2.32 2.39 2.38 2.39Romania 2.06 1.78 1.87 2.02 1.82
Source: http://epp.eurostat.ec.europa.eu/portal/page/portal/statistics/search_database
The expenditure situation is more relevant, both statistically and fi nancially. There are naturally, or situations of non-conformity may occur there, which can be easily solved by means of a double statistical approach to environmental indicators, as with environmental costs; the example of the comparison with the actual expenditures is essentially revealing:
State budget (public sector) expenditures for environmental protectionTable no. 14
% 2001 2002 2003 2004 2005 2006 2007 2008* 2009* 2010* 2011* 2012*
Romania 0.13 0.2 0.13 0.22 0.23 0.54 0.59 0.51 0.54 0.68 0.92 1.3*Note: Percentages calculated as the ratio between environmental costs and total state budget expendituresSource: https://statistici.insse.ro/shop/index.jsp?page=tempo3&lang=ro&ind=FIN101B
The whole image can be completed by the internal confrontation as a number of collateral indicators; for instance, the EU-27 average environmental tax 2.3% to 2.4%, compared to Romania’s less than 2%, while the EU-27 pollution tax is 0.1% of GDP, and only 0.01% in Romania. Regardless of the aggregate level of the approach, there are several specifi c aspects of the environmental statistical indicators that impact on the overall understanding of the phenomenon.

Romanian Statistical Review - Supplement nr. 2 / 201432
3. Some fi nal remarks
Compared to several other statistical indicators, the environmental statistical indicator is characterized by complexity and high coverage, synthetic by its component data, simultaneously qualitative and quantitative aggregative from the regional to the national and union description, of a much higher degree of causal uncertainty. The environmental statistical indicator is much more elusive causatively and correlatively. Some consequences described by the indicator may have causes that are placed long before in the past, and what can be done today does not refl ect an entirely related aspect, an immediate impact, but may become another explanatory factor of medium and long-term projections. Confronting the environmental statistical indicators of Romania and the European Union since 1 January 2007, according to Eurostat data, reveals some positive aspects due to the lower level of development, and hence pollution level and also many negative aspects associated with the same cause. The process of convergence to the EU and the sustainable development of the Romanian economy require, in the medium and long-term perspective, similarity of level, dynamics and structure in relation to the European average in this category of indicators too, as they have a lasting impact and a growing decision-making signifi cance at the macroeconomic level.
References - Ghereş, Marinela, Săvoiu Gheorghe, (2010), Economia mediului. Tratat,Ed. Universitară, Bucureşti. - Săvoiu Gheorghe (2006), Populaţia lumii între explozie şi implozie demografi că, Ed. International University Press, Bucureşti. - Săvoiu, Gheorghe, (2010), Gândirea statistică aplicată. Sisteme de indicatori rezultaţi din documente şi situaţii statistice fi nanciar contabile,Ed. Universitară, Bucuresti. - Săvoiu Gheorghe, (2011), Sisteme contemporane de indicatori statistici privind protecţia mediului, Revista Română de Statistică, Supliment nr. 3/2011, pag. 45-52. - Săvoiu Gheorghe, Manea Constantin, (2011), Enviromental statistics and human ecology, Revista Română de Statistică, nr 9/ 2011, pag. 75-101. - Săvoiu Gheorghe, Butnariu Mihaela, (2013), Statistical analysis of collecting and recycling sports waste in Romania, using a representative focus group of sportsmen and possible prospects,Journal of Physical Education and Sport (JPES), Vol 13 issue 2, pp. 166 – 169. - Săvoiu Gheorghe, Iorga Siman Ion, Manea Constantin, Mladen Čudanov, (2012), Methodological Rigors in the Statistical Research on Urban Household Waste, Romanian Statistical Review Supplement, vol. 60(3), pag. 25-33. - Ştefănescu I., Iorga-Simăn I., Săvoiu G., Manea C., (2009). Life quality and human ecology-Interferences in academic education and in scientifi c research, Progress of Cryogenics and Isotopes Separation, vol 12(23-24), pag.117-128 - Ţaicu M., Săvoiu G., Ciprian A., (2011). Environmental management accounting, eco-performance and human ecology of modern companies, The Eco-Economic Challenges for XXI Century, Ed.Tehnopress, pag.81-89.

Revista Română de Statistică - Supliment nr. 2 / 2014 33
Complicaţii generale apărute în cabinetul stomatologic în timpul tratamentelor odontale uzuale – analiză statistică Conf. univ. Dana Cristina BODNAR Conf. univ. Mihai BURLIBAŞA ([email protected]) Conf. univ. Ileana IONESCU Conf. univ. Ioana SUCIU Universitatea de Medicină şi Farmacie „Carol Davila” Bucureşti
Abstract
Orice îngrijire stomatologică reprezintă un caracter traumatic, chiar pentru un pacient clinic sănătos şi cu atât mai mult când vorbim de pacienţi cu un teren tarat sau în condiţii particulare (copii, bătrâni, femei gravide). Evaluarea riscului la pacientul cu afecţiuni stomatologice este de cea mai mare importanţă în practica uzuală din cabinet. Scopul lucrării noastre a fost de a evalua riscul apariţiei unor accidente generale înaintea, în timpul sau după efectuarea unui tratament odontal uzual, lucru difi cil de realizat, din cauza multitudinii de factori, care trebuie luaţi în considerare. Materialul de lucru a fost reprezentat de un lot de 200 pacienţi evaluaţi clinic şi anamnestic, cu vârste cuprinse între 20 şi peste 60 de ani, de sexe diferite, dintre care 157 au fost socotiţi clinic sănătoşi, iar 43 au prezentat antecedente personale patologice, 111 femei şi 89 bărbaţi. Am urmărit comportamentul acestora în cabinetul dentar şi rezultatele au arătat un număr de 18 (9%) accidente minore diferite ca manifestare şi gravitate în timpul tratamentului odontal uzulal, din care 10 (5%) la pacienţi sănătoşi clinic şi 8 (4%) la cei cu antecedente patologice. Discuţiile au evidenţiat cele mai frecvente urgenţe medicale întâlnite şi probabila lor cauzalitate. În concluzie, urgenţele generale în cabinetul dentar nu au o frecvenţă foarte mare, dar se pot produce oricând şi reacţia corectă şi rapidă a medicului poate şi trebuie să permită gestionarea profesională a acestora şi de aceea, este necesară o pregătire corespunzătoare a medicului dentist şi cunoaştere corespunzătoare a pacientului. Responsabilitatea deciziilor şi a consecinţelor în aceste cazuri revine medicului, care are obligaţia profesională, morală şi medico-legală de a preveni urgenţa, de a

Romanian Statistical Review - Supplement nr. 2 / 201434
o recunoaşte şi trata corespunzător, de a şti ce poate face şi ce nu trebuie să facă în aceste cazuri. Cuvinte cheie: urgenţe medicale, multidisciplinaritate, responsabilitate profesională.
*** Introducere
Între ramurile medicale, medicina dentară ocupă un loc bine defi nit, cu o importanţă semnifi cativă ca volum de muncă, de timp şi valoare a rezultatelor obţinute, cu încadrare logică în sfera mai extinsă a stării de sănătate generală a pacienţilor, de aceea apare normală şi necesară scoaterea manoperelor terapeutice specifi ce acestui domeniu din zona aleatoriului şi a empiricului, urmată de fundamentarea lor amănunţită şi riguroasă pe baze ştiinţifi ce moderne (3) Prin lucrarea de faţă încercăm să atragem atenţia asupra a două dintre problemele a căror rezolvare contează, adesea decisiv, pentru rezultatul fi nal al acestei practici medicale (3): • necesitatea individualizării planului de tratament stomatologic,
în raport cu afecţiunile medicale generale ale pacientului, a căror prezenţă poate fi stabilită utilizând date pe care medicul le poate obţine printr-o anamneză judicioasă şi un riguros examen clinic obiectiv, complex şi complet;
• necesitatea abordării terapeutice multidisciplinare, de lucru în echipă medicală, de delegare a anumitor responsabilităţi unui personal special instruit şi competent, de colaborare cu medicul de medicină generală şi de alte specialităţi (după caz), care gestionează evoluţia afecţiunilor generale ale pacienţilor. Adesea, doar astfel pot fi evitate unele dintre accidentele sau complicaţii la care poate fi expus un pacient compromis medical, la efectuarea de manopere terapeutice stomatologice uzuale.
Medicul are menirea de a tămădui suferinţele umane, de a preveni îmbolnăvirea, este cel care prin atitudinea şi gesturile sale, prin vocabularul utilizat, prin circumstanţele cu care anunţă un diagnostic, prin superfi cialitate examenului clinic şi alegerea unei conduite terapeutice insufi cient documentată, poate deveni declanşator de boală. Să nu uităm că stabilirea diagnosticului necesită trei etape importante: cunoaşterea pacientului, cunoaşterea patologiei medicale a acestuia şi încadrarea sa într-un cadru nosologic precis. „În diagnostic nu putem evita riscul de omisiune şi confuzie, după cum nici în tratament nu putem exclude riscul iatrogen sau eşecul” afi rma Dumitrescu D.,

Revista Română de Statistică - Supliment nr. 2 / 2014 35
cu privire la decizia şi responsabilitatea actului medical. (8) Varietatea pacienţilor, care ni se adresează pentru realizarea unui tratament de specialitate este foarte mare, vârsta, sexul, gradul de instruire medicală, obiceiurile alimentare, profesia, patologia generală pe care o prezintă, fi ind doar câteva dintre aceste variabile. Fiecare pacient este o entitate specifi că, iar caracterul permanent de reînnoire a cunoştinţelor din domeniul medical, biologic, farmacologic, al metodologei de tratament în schimbare rapidă şi permanentă, implicaţiile locale şi generale ale acesteia, starea fi zică şi biologică a pacientului, comportamentul său individualizat, conform educaţiei sale şi a altor variabile, face necesar un management individualizat. (3, 9) Ca în orice ramură a medicinei, şi în medicina dentară primul contact cu pacientul este defi nitoriu pentru stabilirea relaţiei medic-pacient; acesta trebuie să ofere medicului prilejul culegerii unui bogat material informaţional, care să-i permită cunoaşterea individualităţii acestuia, conduita optimă în relaţia sa cu pacientul, informaţii utile privind atitudinea terapeutică specifi că. Această primă întâlnire este importantă şi pentru pacient, pentru încrederea sa că medicul va fi capabil să managerieze cu competenţă problemele sale de sănătate orală. (2, 11) O anamneză bine condusă, cu atenţie deosebită la problemele de sănătate ale pacientului şi particularităţilor sale, o atitudine adecvată tiparului său psihologic, sunt câteva dintre condiţiile unui tratament de calitate. Starea de sănătate a pacientului corelaţă cu calitatea vieţii sale, prezintă un rol major la nivel personal, asupra deciziei privind planul de tratament, reprezintă un instrument de înţelegere şi conturare a practicii clinice şi succesului actului terapeutic. (3, 7, 10). Tratamentul odontal al unui pacient pare a fi un lucru banal, ca de altfel şi diagnosticarea majorităţii afecţiunilor orale prezentate de el, în realitate însă orice pacient, cu atât mai mult cei cu nevoi speciale, pacientul vârstnic, anxios, cu devieri comportamentale etc., poate deveni oricând victima unor incidente, accidente, complicaţii ale tratamentului, dacă medicul dentist ignoră aspectul individualizat al comportamentului său în raport cu pacientul. Prevenirea oricăror neplăceri în timpul tratamentului devine o necesitate realizabilă prin examen clinic minuţios, făcut cu tact şi inteligenţă, printr-un ansamblu de întrebări cât mai simple şi explicite, capabile să pună în evidenţă eventuale probleme de sănătate ale pacientului şi să permită diagnosticul corect al afecţiunii. (2, 3, 11) Activitatea cotidiană a medicului dentist se efectuează pe pacienţi care vin adesea direct de la locul de muncă, obosiţi, cu orarul meselor neregulat, slab investigaţi din punct de vedere al constantelor biologice, cu un teren deosebit de refl exogen datorită prezenţei nervului trigemen sau a sinusului

Romanian Statistical Review - Supplement nr. 2 / 201436
carotidian în teritoriul oro-maxilo-facial. Datorită acestor particularităţi, există riscul potenţial al declanşării urgenţelor în cabinetul dentar, ceea ce impune cunoaşterea şi profi laxia lor. (13) Urgenţa în stomatologie survine ca o stare imprevizibilă, neaşteptată în manifestări şi durată, susceptibilă să compromită în unele cazuri prognosticul funcţional şi vital al pacientului. Medicul dentist este cel căruia, în cazul apariţiei unei urgenţe în cabinetul dentar, îi revine responsabilitatea deciziilor şi a consecinţelor sale. Acestea îl implică total pe medicul practician care trebuie să aibă o judecată rapidă, refl exe vii, capacitate de acţiune competentă, în funcţie de cerinţele de moment ale pacientului. (13) Toate cele amintite ne-au făcut să efectuăm un studiu clinico-statistic, care să ne permită decelarea celor mai frecvente urgenţe medicale ce pot să apară în cabinetul stomatologic în timpul unor intervenţii odontale obişnuite, în raport cu starea de sănătate generală a pacientului, precum şi de alte variabile.
Material şi metodă de lucru
Cercetarea efectuată de noi a constat într-un studiu clinico-statistic pe un lot de 200 pacienţi, care s-au prezentat pentru tratamente odontale la Disciplina de Odontoterapie Restauratoare a Facultăţii de Medicină Dentară, Universitatea de Medicină şi Farmacie „Carol Davila” Bucureşti. Alegerea pacienţilor a fost aleatorie, în ordinea prezentării lor pentru tratamente odontale sau pentru varii motive. Înaintea tratamentului, pacienţilor li s-a efectuat o anamneză şi o examinare clinică amănunţită, iar pentru uniformizarea rezultatelor, datele au fost trecute pe o fi şă individuală tip care, pe lângă datele de identitate, a cuprins relatarea pacienţilor cu privire la starea de sănătate generală prezentă, observaţii ale medicului privind comportamentul pacientului în cabinetul dentar, experienţele anterioare ale pacientului în domeniul tratamentelor odontale. După vârstă şi sex, pacienţii au fost repartizaţi astfel (fi g. 1):

Revista Română de Statistică - Supliment nr. 2 / 2014 37
Repartizare pacienţi după sex şi vârstăFigura 1
32 22 23 17 12
111
19 38,6 2614 8
89
0
50
100
150
200
250
20-30 ani 31-40 ani 41-50 ani 51-60 ani peste 61ani
Total
femei bărbaţi
Conform anamnezei efectuate de examinator, din totalul pacienţilor, un număr de 157 au acuzat o stare de sănătate optimă şi 43 au relatat afecţiuni generale afl ate sub supraveghere şi tratament, repartizate după sex, aşa cum se observă în fi gura 2
Repartizarea pacienţilor după sex şi starea de sănătate generalăFigura 2
8770
2419
11189
020406080
100120
F rAPP
Cu APP total
Femei B rba i

Romanian Statistical Review - Supplement nr. 2 / 201438
La pacienţi cu stare de sănătate bună, am remarcat un număr de 10 (6,36%) urgenţe medicale din totalul de 157 pacienţi, ceea ce reprezintă 4 (5,71%) din totalul de 70 pacienţi bărbaţi şi 6 (6,89%) din totalul de 87 femei (fi g. 3)
Repartizarea accidentelor la pacienţii fără antecedente personale patologice
Fig. 3
21
21
6
03
10
4
02468
1012
Alergice Lipotimie Agitaţie Isterie Total
Femei Bărbaţi .
Pacienţi care au relatat în anamneză afecţiuni generale afl ate sub tratament, au fost repartizaţi după sex, astfel: 24 femei şi 19 bărbaţi, şi după relatările pacienţilor, aceste afecţiuni au fost (fi g. 4): • 12 cardiopatii ischemice; • 10 pacienţi cu hipertensiune arterială (HTA); • 3 pacienţi au prezentat diabet zaharat tip II (DZII); • 2 pacienţi au prezentat hepatită cronică; • 3 pacienţi au prezentat hipocalcemie; • 2 pacienţi au prezentat epilepsie; • 4 pacienţi au prezentat stări depresive sau de panică; • 2 pacienţi au prezentat afecţiuni neoplazice în stare stabilizată; • 3 pacienţi au prezentat în antecedente infarct miocardic; • 1 pacient a prezentat maladie Parkinson; • 1 pacient a prezentat tulburări respiratorii.
În raport cu vârsa, 8 din afecţiuni au fost prezente la pacienţi cu vârste cuprinse între 20-30 ani, 4 la pacienţi cu vârste cuprinse între 31-40 ani, 10 la pacienţi cu vârste cuprinse între 41-50 de ani, 15 la pacienşi cu vârste cuprinse între 51-60 ani şi 6 la pacienţi după vârsta de 60 de ani (fi g. 5).

Revista Română de Statistică - Supliment nr. 2 / 2014 39
Repartizare pacienţilor cu afecţiuni generale după sex şi afecţiuneFigura 4
64
2 13
13 2 1 0 0
23
6 6
1 1 0 1 1 02 1 1
20
0
5
10
15
20
25
Card is
chHTA
DZ II
Hep cr
.
hipoc
alcem
epile
psie
tulb p
sihice
neop
lazii
Infarc
t mio.
Parki
nson
tulb r
esp total
femei bărbaţi
Repartizare afecţiuni generale după vârstăFigura 5
8; 9%4; 5%
10; 12%
15; 17%
6; 7%
43; 50%
20-30 ani
31-40 ani
41-50 ani
51-60 ani
peste 60ani
total
Pacienţii cu antecedente personale patologice au fost examinaţi cu multă atenţie şi din anamneza efectuată am încercat să ne asigurăm, dacă au urmat tratamentul medicamentos pentru afecţiunea de bază după indicaţiile medicului curant şi starea prezentă. După anamneza minuţioasă efectuată, am amânat tratamentul odontal la 1 pacient cu hepatită cronică, care a întrerupt tratamentul medicamentos de 8 luni şi la 1 pacient care a prezentat logoree şi

Romanian Statistical Review - Supplement nr. 2 / 201440
agitaţie psiho-motoria exagerată, dirijându-i pentru un control al constantelor biologice şi aviz medical specialistului, care îi avea sub observaţie. Am acordat în schimb o atenţie deosebită modului de comportament al pacienţilor, starea lor de anxietate faţă de manoperele ce urmau a fi efectuate, eventuali factori de stres etc. Astfel, pacienţii cu diabet zaharat II au fost programaţi la prima oră, după micul dejun şi timpul de tratament al acestora a fost limitat la ½ h . Atunci când am considerat necesar, am indicat unor pacienţi, după caz, o medicaţie cu efect uşor sedativ. Din cei 43 pacienţi, în 8 cazuri au apărut mici incidente înainte, în timpul sau imediat după actul terapeutic efectuat în cabinet, ei benefi ciind de un tratament, conform protocoalelor indicate în astfel de cazuri. Aceşti pacienţi sunt prezentaţi după grupa de vârstă, în fi gura 6:
Repartizarea cazurilor de accidente la pacienţii cuafecţiuni generale în antecedente, după vârstă
Figura 6
2 2 21 1
8
012345678
20-30ani
31-40ani
41-50ani
51-60ani
peste60
Total
Situaţia acestor în raport cu urgenţa medicală prezentată, este ilustrată în fi g. 7.

Revista Română de Statistică - Supliment nr. 2 / 2014 41
Urgenţele medicale prezente la pacienţii cu antecedente personale patologice, după sex.
Figura 7
1 0 1 1 1 0
40 1
1 0 11
4
0
24
68
10
Lipotimie Tetanie HTA Angin.pac Agitaţie Epilepsie total
Bărbaţi Femei
Făcând bilanţul celor 200 pacienţi examinaţi, putem aprecia că numărul urgenţelor medicale prezentate de aceştia înaintea, în timpul sau după tratament au fost 18 (9%), din care 10 (5%) la pacienţi clinic sănătoşi şi 8 (4%) la pacienţi cu probleme de sănătate în antecedente (fi g. 8).
Repartizare după grupa de vârstă a cazurilor de urgenţe medicale apărute la pacienţi sănătoşi clinic sau cu afecţiuni generale
Figura 8
52
7
2
3
52
1
3
1
1
2
1
0
1
0 5 10 15 20
Fără APP
Cu APP
Total
21-30 ani 31-40 ani 41-50 ani
51-50 ani peste 60ani

Romanian Statistical Review - Supplement nr. 2 / 201442
Discuţii
Studiul ne-a permis o primă apreciere asupra prevalenţei urgenţelor medicale care pot apare în cabinetul dentar, în timpul derulării unor tratamente odontale obişnuite. Acestea reprezintă, după estimările noastre, o cotă rezonabilă de 9% (18 cazuri) din totalul de 200 pacienţi examinaţi şi pot apare atât la pacienţi sănătoşi clinic, cât şi la cei cu afecţiuni generale, procentul acestora fi ind de 5% în primul caz şi de 4% în al doilea caz. Cele mai frecvente accidente întâlnite au fost lipotimiile, care au reprezentat 5 din cele 18 cazuri (27,7%), cu frecvenţă mai mare la vârste cuprinse între 20-40 ani. Conform literaturii de specialitate, lipotimiile au cauză vasculară, sunt urmarea unor reacţii vaso-vagale şi consecinţa unei hipoxii acute cerebrale de scurtă durată. Factorii declanşatori sunt variaţi, dar frecvent incriminată pare a fi frica de actul terapeutic, ce urmează a fi efectuat pacientului şi despre care, de regulă, nu are informaţii directe sau are informaţii anterioare neplăcute. Dacă la frică se adaugă durerea, mirosul substanţelor medicamentoase, zgomotul pregătirilor preoperatorii sau al aparatului cu turaţie înaltă, stări fi ziologice deosebite (pubertate, climax), starea „à jeun”, oboseala provocată de una sau mai multe nopţi nedormite, există probabilitatea ca o intervenţie terapeutică minoră să declanşeze o lipotimie tranzitorie, fără importanţă majoră, dacă se instituie tratamentul imediat, corect şi bine condus. Orice prelungire a sa şi asocierea cu o afecţiune generală gravă, poate duce uneori la necesitatea apelării serviciului de urgenţă. (2, 13) Crizele de tetanie hipocalcemică este specifi că vârstelor tinere şi îmbracă uneori aspecte clinice impresionante prin contracturile musculare necontrolate, rigiditatea cefei, pierderea cunoştinţei, semănând uneori cu o criză epileptică minoră. La pacienţii sănătoşi clinic, dar mai cu seamă la cei cu probleme psihice în antecedente, stările de agitaţie psiho-motorie pot apare cu o frecvenţă ridicată şi sunt cauzate de creşterea exagerată a emotivităţii, frecventă la ambele sexe. Aceşti pacienţi pot fi depistaţi cu uşurinţă din timpul fazei de anamneză ei prezentând logoree, agitaţie psihomotorie, fi ind recalcitranţi, necooperanţi, cu tendinţa de a indica medicului un anumit tip de tratament şi mergând uneori până la a refuza orice tratament, care nu este agreat de ei. (1, 4, 6, 9, 12) Puseele de hipertensiune arterială, cu senzaţie de uşoară greaţă şi vărsătură pot apare la pacientul cu hipertensiune arterială în antecedente şi pot fi determinate de starea de teama faţă de tratamentul dentar, pe care medicul trebuie să-l efectueze. (6) Un pacient cunoscut cu crize de epilepsie, cu un tratament bine condus de medicul curant, este mai puţin probabil să declanşeze o astfel de criză în

Revista Română de Statistică - Supliment nr. 2 / 2014 43
cabinetul dentar, în cazul când pacientul nu benefi ciază de un tratament sau acesta nu este bine gestionat, un simplu zgomot produs de instrumentarul dentar specifi c sau de vederea unei seringi pregătită pentru o anestezie, poate produce declanşarea unei crize de epilepsie. În acest caz, tratamentul de urgenţă trebuie să fi e conform protocolului. (3, 5, 6, 9) Pacientul cu diabet zaharat tip II, dacă este bine controlat, poate benefi cia de tratament stomatologice fără precauţii speciale, dar cu atenţie la factorii de risc asociaţi şi la complicaţiile pe care eventual acesta le-a produs. Pacientul cu diabet insulino-dependent poate şi el benefi cia de tratament în condiţii normale, dacă boala este bine controlată şi tratată. Pentru evitarea unor crize de hipoglicemie, aceşti pacienţi trebuie programaţi la prima oră, după administrarea dozei de insulină şi după micul dejun, durata tratamentului să fi e de scurtă durată, iar în cabinet să există o sursă de glucoză, care să poată fi administrată la nevoie. (3) Atunci când anamneza a fost bine condusă, medicul a explicat cu răbdare pacientului ceea ce urma să i se efectueze, când pacientul a urmat corect tratamentul pentru boala de bază şi a avut o colaborare bună cu medicul dentist, un grad de instruire şi educaţie medicală corespunzătoare, au putut fi evitate urgenţe medicale în cabinetul dentar. Medicul dentist poate fi un excelent profesionist, nu este însă sufi cient ca el să se concentreze strict asupra afecţiunii dentare şi să scape din vedere adesea esenţialul, rădăcinile bolii. Acest tip de medicină nu mai este sufi cientă. Medicul trebuie să privească complex şi complet pacientul, să-şi însuşească un mod de abordare integral a cazurilor clinice. El posedă sau ar trebui să posede cunoştinţe din toate domeniile medicale şi să dirijeze procesul de elaborare a soluţiei terapeutice, pe care starea de sănătate generală a pacientului o permite, să ţină seama de categoria populaţională căreia i se adresează. (3, 9) În practica de medicină dentară, aproape în orice intervenţie terapeutică este posibilă apariţia unor urgenţe medicale, care trebuie rezolvate imediat, cu competenţă maximă, dar este necesar în egală măsură ca medicul să poată anticipa eventuala lor apariţie, prin corelarea diagnosticului stomatologic cu patologia generală a pacientului. Se pune întrebarea: „medicul dentist este capabil să facă faţă tuturor situaţiilor pe care starea de sănătate generală a pacientului le impune? Este clar că acest lucru nu este totdeauna posibil”. În acest context, apare fi resc ideea de muncă în echipă, de colaborare medicală interdisciplinară cu medicul, care are bolnavul sub urmărire şi tratament, doar astfel vor putea fi evitate accidentele şi complicaţiile posibile în timpul terapiei odontale uzuale din cabinetul stomatologic. (3, 13)
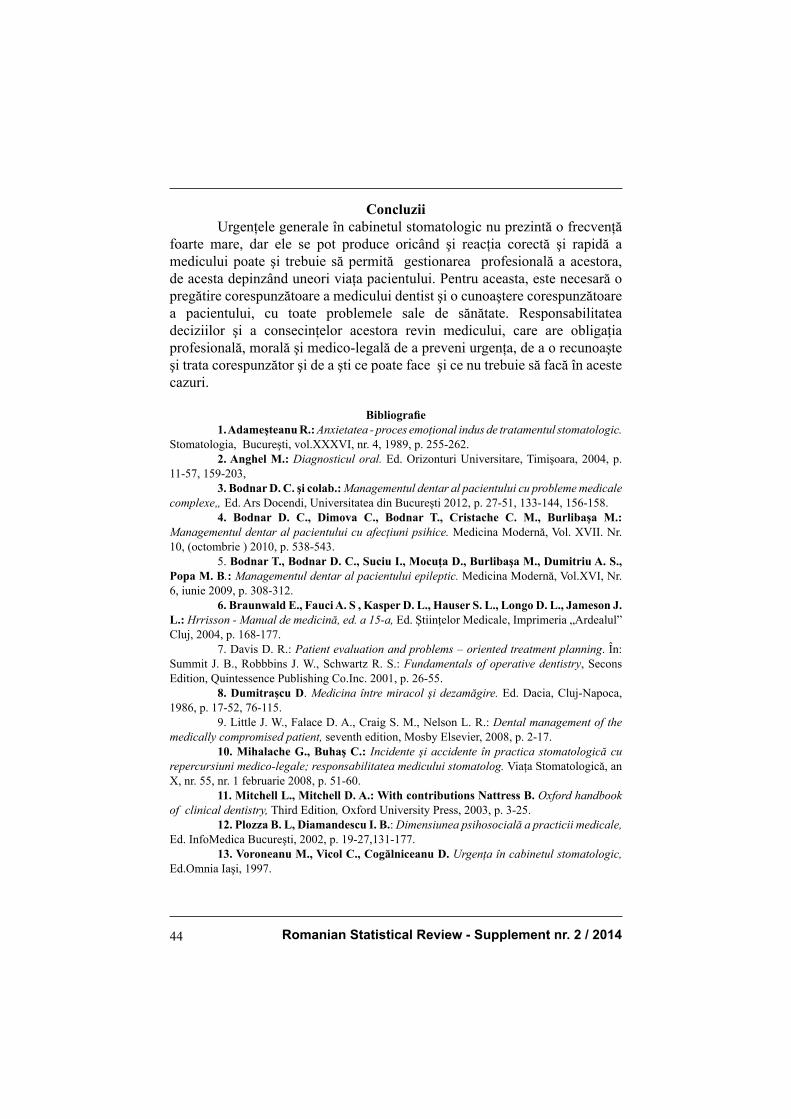
Romanian Statistical Review - Supplement nr. 2 / 201444
Concluzii Urgenţele generale în cabinetul stomatologic nu prezintă o frecvenţă foarte mare, dar ele se pot produce oricând şi reacţia corectă şi rapidă a medicului poate şi trebuie să permită gestionarea profesională a acestora, de acesta depinzând uneori viaţa pacientului. Pentru aceasta, este necesară o pregătire corespunzătoare a medicului dentist şi o cunoaştere corespunzătoare a pacientului, cu toate problemele sale de sănătate. Responsabilitatea deciziilor şi a consecinţelor acestora revin medicului, care are obligaţia profesională, morală şi medico-legală de a preveni urgenţa, de a o recunoaşte şi trata corespunzător şi de a şti ce poate face şi ce nu trebuie să facă în aceste cazuri.
Bibliografi e 1. Adameşteanu R.: Anxietatea - proces emoţional indus de tratamentul stomatologic. Stomatologia, Bucureşti, vol.XXXVI, nr. 4, 1989, p. 255-262. 2. Anghel M.: Diagnosticul oral. Ed. Orizonturi Universitare, Timişoara, 2004, p. 11-57, 159-203, 3. Bodnar D. C. şi colab.: Managementul dentar al pacientului cu probleme medicale complexe„ Ed. Ars Docendi, Universitatea din Bucureşti 2012, p. 27-51, 133-144, 156-158. 4. Bodnar D. C., Dimova C., Bodnar T., Cristache C. M., Burlibaşa M.: Managementul dentar al pacientului cu afecţiuni psihice. Medicina Modernă, Vol. XVII. Nr. 10, (octombrie ) 2010, p. 538-543. 5. Bodnar T., Bodnar D. C., Suciu I., Mocuţa D., Burlibaşa M., Dumitriu A. S., Popa M. B.: Managementul dentar al pacientului epileptic. Medicina Modernă, Vol.XVI, Nr. 6, iunie 2009, p. 308-312. 6. Braunwald E., Fauci A. S , Kasper D. L., Hauser S. L., Longo D. L., Jameson J. L.: Hrrisson - Manual de medicină, ed. a 15-a, Ed. Ştiinţelor Medicale, Imprimeria „Ardealul” Cluj, 2004, p. 168-177. 7. Davis D. R.: Patient evaluation and problems – oriented treatment planning. În: Summit J. B., Robbbins J. W., Schwartz R. S.: Fundamentals of operative dentistry, Secons Edition, Quintessence Publishing Co.Inc. 2001, p. 26-55. 8. Dumitraşcu D. Medicina între miracol şi dezamăgire. Ed. Dacia, Cluj-Napoca, 1986, p. 17-52, 76-115. 9. Little J. W., Falace D. A., Craig S. M., Nelson L. R.: Dental management of the medically compromised patient, seventh edition, Mosby Elsevier, 2008, p. 2-17. 10. Mihalache G., Buhaş C.: Incidente şi accidente în practica stomatologică cu repercursiuni medico-legale; responsabilitatea medicului stomatolog. Viaţa Stomatologică, an X, nr. 55, nr. 1 februarie 2008, p. 51-60. 11. Mitchell L., Mitchell D. A.: With contributions Nattress B. Oxford handbook of clinical dentistry, Third Edition, Oxford University Press, 2003, p. 3-25. 12. Plozza B. L, Diamandescu I. B.: Dimensiunea psihosocială a practicii medicale, Ed. InfoMedica Bucureşti, 2002, p. 19-27,131-177. 13. Voroneanu M., Vicol C., Cogălniceanu D. Urgenţa în cabinetul stomatologic, Ed.Omnia Iaşi, 1997.

Revista Română de Statistică - Supliment nr. 2 / 2014 45
General Complications Occurred in the Dental Offi ce During Common Odontal Therapy – Statistical Analysis PhD Senior Lecturer Dana Cristina BODNAR PhD Senior Lecturer Mihai BURLIBAŞA ([email protected]) PhD Senior LecturerIleana IONESCU PhD Senior Lecturer Ioana SUCIU University of Medicine and Pharmacy „Carol Davila” Bucharest
Abstract Introduction. Any dental treatment has a traumatic character, even for clinically healthy patients, and especially for sensitive patients or the ones in special conditions (children, the elderly, pregnant women). Therefore, risk assessment in patients with dental disorders is very important in the usual practice in the dental offi ce. The purpose of our paper is to present the results of a study conducted by us to assess the overall risk before, during or after a common dental treatment, which is rather diffi cult, considering the multitude of factors involved. The material was represented by a cohort of 200 patients, 111 women and 89 men, aged between 20 and 60 plus, clinically and anamnestically assessed. 157 of them were considered clinically healthy and 43 had a pathological personal history. Their behaviour in the dental offi ce was observed during the study and the results showed a total of 18 (9%) minor accidents, different in manifestation and severity, during the common dental treatment, i.e. 10 (5%) in clinically healthy patients and 8 (4%) in those having medical history. The discussions highlight the most frequent medical emergencies encountered as well as their probable causes. In conclusion, the frequency of general medical emergencies in the dental offi ce is not too high. However, they may occur at any time, and the correct and rapid medical response can and should allow for their professional management. Therefore, it is necessary that the dental practitioner should be properly trained in this regard and should know the patient medical history. The responsibility for the decisions made and their consequences lies with the doctor, who has the professional, moral, and legal obligation to prevent medical emergencies, to recognise and address them appropriately, to know what can be done and what should not be done in such cases. Keywords: medical emergencies, multidisciplinarity, professional responsibility.

Romanian Statistical Review - Supplement nr. 2 / 201446
Introduction
Among medical branches, dental medicine has a well defi ned place and signifi cant importance in terms of workload, time and value of outcomes. It is logically included in the larger area of the patient overall health. Therefore, it is normal and necessary that the branch-related specifi c therapeutic manoeuvres should not be random and empirical but thoroughly and rigorously grounded on modern scientifi c bases. (3) In the present paper we try to draw attention to two of the problems whose solutions infl uence, sometimes decisively, the fi nal outcomes of this medical practice (3): • the necessity to individualise the dental treatment plan in relation
to the patient general medical conditions, whose presence can be determined using data that can be obtained by the dental practitioner through a judicious anamnesis and a rigorous, objective, complex and thorough clinical exam;
• the necessity for multidisciplinary therapeutic approach, medical teamwork, delegation of some responsibilities to specially trained and competent personnel, as well as for collaboration with the general practitioners and other specialists (if it is the case) who manage the general medical conditions of the patients. It is often in this way that some of the accidents and complications a patient who undergoes common dental treatment may be exposed to can be avoided.
The doctor aims to cure human suffering and prevent illness. However, he/she is the one who, through the attitude and gestures, the vocabulary used, the circumstances in which he/she announces a diagnosis, the superfi cial clinical examination, and the choice of a poorly documented therapeutic behaviour, can trigger disease. We should remember that the diagnosis entails three stages: the knowledge of the patient, the knowledge of his/her medical history, and his/her inclusion in a precise nosologic framework. “In the diagnosis we cannot avoid the risk of omission and confusion, as in the treatment we cannot exclude the iatrogenic risk or the failure”, says D. Dumitraşcu relating to the decision and responsibility in health care. (8) The patients who come to the dental offi ce to undergo specialised treatment are very different in terms of age, gender, medical knowledge, eating habits, profession, pathological personal history, and many other variables. Each patient is a specifi c entity and, considering the permanent changes related to the progress in medicine, biology, pharmacology, treatment methods with their local and general implications, the patient physical and biological

Revista Română de Statistică - Supliment nr. 2 / 2014 47
condition, as well as the patient particular behaviour, depending on education and other variables, individualised management is necessary. (3, 9) In dental medicine, as in any other branch of medicine, the fi rst contact with the patient is very important to establish the doctor-patient relationship. The fi rst meeting should provide the dental practitioner with the opportunity to collect important information that allows for the knowledge of the patient, the optimal behaviour in the relationship with the patient, and the specifi c therapeutic attitude. The fi rst meting is also useful for the patient, as he/she can become confi dent in the doctor’s ability to competently manage the oral health problems. (2, 11) A well conducted anamnesis, paying attention to the patient health problems and peculiarities, and an attitude adapted to the patient psychological pattern are some of the terms of a quality treatment. The patient health status correlated with his/her quality of life plays a major role in the decision on the treatment plan, representing a tool for understanding and shaping clinical practice and therapeutic success. (3, 7, 10) The odontal treatment of a patient as well as the diagnosis of the majority of oral disorders seems to be a commonplace but, in reality, any patient, and especially those having special needs, i.e. the old, anxious, deviant behaviour ones, may become victims of injuries, accidents, treatment-associated complications, if the dental practitioner ignores the individual aspect of behaviour in the relationship with the patient. The prevention of any discomfort during the treatment becomes a necessity that can be met by a thorough clinical examination, conducted with tact and intelligence, asking simple and explicit questions, able to evince the possible health problems of the patient and to allow for the correct diagnosis of the disorder. (2, 3, 11) The dental practitioner daily work is performed on patients who often come straight from work, being tired, who have irregular meals, and who are poorly investigated as far as biological constants are concerned, who are particularly sensitive due to the presence of the trigeminal nerve or the carotid sinus in the oromaxillofacial area. Because of these factors, there is the potential risk of medical emergencies in the dental offi ce. That is why they should be known and prevented. (13) A medical emergency in the dental offi ce is an unpredictable condition, unexpected in terms of manifestation and duration, which can sometimes compromise the patient functional and vital prognosis. The dental practitioner is the one who, in the event of an emergency in the dental offi ce, has the responsibility for the decisions made and their consequences. The practitioner is totally involved in such cases. That is why he/she should prove quick judgment and refl exes and competent action capacity to meet the patient present needs. (13)

Romanian Statistical Review - Supplement nr. 2 / 201448
All the mentioned facts have made us conduct a clinical-statistical study to allow us to detect the most common medical emergencies that may occur in the dental offi ce during regular odontal interventions in relation to the overall health of the patient and other variables.
Material and Method
The research carried out by us consisted of a clinical-statistical study on a cohort of 200 patients who asked for odontal treatment at the Department of Restorative Odontotherapy of the Faculty of Dental Medicine, “Carol Davila” University of Medicine and Pharmacy in Bucharest. The patients were chosen randomly. Before treatment, the patients underwent thorough anamnesis and clinical examination. To standardise the results, the data were stored in a standard individual fi le comprising, besides the identifi cation data, the data provided by the patients relating to their current health status, the observations of the dental practitioner on the patients behaviour in the dental offi ce, the patients previous experience in the fi eld of dental treatments. Based on age and gender, the patients were distributed as follows (fi g. 1):
Distribution of patients by gender and ageFigure 1
32 22 23 17 12
111
19 38.6 2614 8
89
0
50
100
150
200
250
20-30 31-40 41-50 51-60 61 plus Total
Women Men

Revista Română de Statistică - Supliment nr. 2 / 2014 49
According to the anamnesis conducted by the examiner, out of the total of patients, 157 reported a state of optimal health and 43 reported general conditions under observation and treatment, distributed by gender as shown in fi gure 2.
Distribution of patients by gender and general health statusFigure 2
8770
2419
11189
020406080
100120
-PPH +PPH Total Women Men
In patients in good health, we noticed a number of 10 (6.36%) medical emergencies of the total 157 patients, representing 4 (5.71%) of 70 male patients and 6 (6.89 %) of 87 female patients (fi g. 3).

Romanian Statistical Review - Supplement nr. 2 / 201450
Distribution of accidents in the patients without pathological personal history
Figure 3
2 1 2 1
6
03 1
0
4
02468
1012
Allergy
Lipothy
mia
Agitati
on
Hysteri
aTota
l
Women Men .
The patients who, during anamnesis, reported general medical conditions under treatment were distributed by gender as follows: 24 women and 19 men. According to the patients reports the conditions were (fi g. 4): • 12 patients with ischemic heart disease; • 10 patients with high blood pressure (HBP); • 3 patients with diabetes mellitus type II (DMII); • 2 patients with chronic hepatitis; • 3 patients with hypocalcaemia; • 2 patients with epilepsy; • 4 patients with depression or panic disorder; • 2 patients with stabilised neoplastic diseases; • 3 patients with a history of myocardial infarction; • 1 patient with Parkinson disease; • 1 patient with respiratory disorders.
In relation to age, 8 disorders were present in the patients in the 20-30 age bracket, 4 in the patients in the 31-40 age bracket, 10 in the patients in the 41-50 age bracket, 15 in the patients in the 51-60 age bracket, and 6 in the patients 60 plus years of age (fi g. 5).

Revista Română de Statistică - Supliment nr. 2 / 2014 51
Distribution of patients having general medical conditions by gender and condition
Figure 4
64
2 13
13 2 1 0 0
23
6 6
1 1 0 1 1 02 1 1
20
0
5
10
15
20
25
Isch.
dis HBPDM II
Chr. he
p.
Hypoc
alc.
Epilep
sy
Psyc
h dis
Neopl
dis
Infarc
tion
Parki
nson
Resp. d
is.Tota
l
Women Men
Distribution of general medical conditions by ageFigure 5
8, 9%4, 5%
10, 12%
15, 17%
6, 7%
43, 50%
20-30
31-40
41-50
51-60
60 plus
Total
The patients with pathological personal history were thoroughly examined. By the conducted anamnesis we tried to fi nd out if the patients underwent medical treatment for the basic medical condition in accordance with the physician indications and the present state. Following the thorough

Romanian Statistical Review - Supplement nr. 2 / 201452
anamnesis, we postponed the dental treatment in 1 patient with chronic hepatitis who discontinued medication for 8 months and in 1 patient who presented logorrhoea and exaggerated psychomotor agitation, recommending that the patients should have the biological constants checked and ask for the medical opinion of the specialist who had them under observation. On the other hand, we paid special attention to the behaviour of patients, their anxiety related to the manoeuvres that were to be carried out, possible stressors and other aspects. The patients with diabetes mellitus type II were scheduled early in the morning, after breakfast, and their treatment was limited to ½ h. When we considered necessary and appropriate, we indicated medication having slightly sedative effect. Out of the 43 patients, in 8 cases small incidents occurred before, during or after the treatment carried out in the dental offi ce. In those cases, the patients benefi tted from treatment according to the protocol indicated in such cases. The age bracket of these patients is presented in fi gure 6.
Distribution of accidents in patients having pathological personal history, by age
Figure 6.
2 2 21 1
8
012345678
20-30 31-40 41-50 51-60 60 + Total
Their situation in relation to the presented medical emergency is shown in fi gure 7.

Revista Română de Statistică - Supliment nr. 2 / 2014 53
Medical emergencies in the patients having pathological personal history, by gender
Figure 7
1 0 1 1 1 04
0 11 0 1
1
4
02468
10
Lipothy
mia
Tetany HBP
Angin.
pec
Agitati
on
Epilep
syTota
l
Men Women
Balancing the 200 examined patients, we can state that the number of medical emergencies presented by them before, during or after treatment was 18 (9%), of which 10 (5%) in clinically healthy patients and 8 (4%) in patients with pathological personal history (fi g. 8).
The age bracket of medical emergencies occurred in clinically healthy patients and in those having pathological personal history
Figure 8
52
7
2
3
52
1
3
1
1
2
1
0
1
0 5 10 15 20
-PPH
+PPH
Total
21-30 31-40 41-50 51-50 60 plus

Romanian Statistical Review - Supplement nr. 2 / 201454
Discussions
The study allowed us to assess the prevalence of medical emergencies that may occur in the dental offi ce during the course of common odontal treatment. They represent, according to our estimates, a reasonable share of 9% (18 cases) of the total of 200 patients examined and they can occur in clinically healthy patients as well as in those with general medical conditions, the percentage being 5% and 4% respectively. The most common accidents were represented by lipothymia, which accounted for 5 of the 18 cases (27.7 %), more frequently in the 20-40 age bracket. According to the literature, lipothymia has vascular causes, being the result of vasovagal reaction and the consequence of acute brain hypoxia of short duration. The triggers are varied, fear of the therapy that is to be performed being frequently incriminated, as the patient has no direct information or he/she has previous unpleasant experience related to therapy. If fear is added to pain, medicinal substances odour, noise during preoperative preparations or treatment, physiological characteristics (puberty, climax), “à jeun” state, fatigue caused by one or more sleepless nights, a minor therapeutic intervention may trigger transient lipothymia, without major importance, if immediate, correct and well conducted treatment is established. If it persists or it is associated with a severe general medical condition, it may sometimes become necessary to call the emergency service. (2, 13) The hypocalcemic tetany seizure is specifi c to the young age and it is sometimes impressive because of the uncontrolled muscle contracture, neck stiffness,loss of consciousness, sometimes resembling a minor epileptic seizure. In clinically healthy patients, but especially in those with psychiatric history, psychomotor agitation may occur with high frequency, being caused by oversensitivity, common to both genders. These patients can be easily detected during the anamnesis, as they present logorrhoea, psychomotor agitation, they are recalcitrant, uncooperative, tending to indicate some type of medical treatment and sometimes going so far as to refuse any treatment that is not approved by them. (1, 4, 6, 9, 12) The bouts of high blood pressure, with a feeling of slight nausea and vomiting may occur in patients with a history of high blood pressure and may be determined by the state of fear of the dental treatment the dental practitioner performs. (6) A patient known as epileptic who undergoes appropriate treatment is less likely to have an epileptic seizure in the dental offi ce than a patient who

Revista Română de Statistică - Supliment nr. 2 / 2014 55
receives inappropriate or no treatment. In such cases, a simple noise made by the specifi c dental instruments or the sight of a syringe ready for anaesthesia may result in the onset of an epileptic seizure. In this case, the emergency treatment should meet the protocol requirements. (3, 5, 6, 9) Patients with diabetes mellitus type II, if properly controlled, can receive dental treatment without special precautions. However, attention should be paid to the associated risk factors and possible complications. Patients with insulin-dependent diabetes can be treated under normal conditions when the disease is well controlled and treated. In order to avoid hypoglycaemia seizures, these patients have to be scheduled early in the morning, after the administration of insulin and after breakfast, and the treatment should last a short period of time. Moreover, in the dental offi ce, there should be a source of glucose that can be administered if needed. (3) When the anamnesis was well conducted, the dental practitioner patiently explained the treatment that was to be carried out, the patient underwent correct treatment for the basic medical condition, cooperating well with the dental practitioner and having appropriate medical education in relation to the condition, medical emergencies in the dental offi ce could be avoided. The dental practitioner can be an excellent professional, but it is not enough for him/her to focus strictly on the dental disorder and often overlook the essential roots of the disorders. This type of medicine is no longer suffi cient. The dental practitioner should consider the patient in a complex and complete manner, adopting an integrated approach to the clinical cases. He/She has or should have knowledge in all medical fi elds and guide the development of therapeutic approaches that are appropriate to the patient overall health, considering the population category the patient belongs to. (3, 9) In dental practice, during almost every therapeutic intervention, some medical emergencies may occur. They need to be resolved immediately, with maximum competency, but it is equally necessary that the dental practitioner should be able to anticipate their possible occurrence, correlating the dental diagnosis with the patient general pathology. Thus the following question arises: “Is the dental practitioner able to cope with all the situations generated by the patient overall health? It is clear that this is not always possible”. In this context, the idea of teamwork becomes natural, entailing the medical interdisciplinary collaboration, between the dental practitioner and the other specialists who have patients under observation and treatment, so that the accidents and possible complications that may occur when common odontal treatment is performed in the dental offi ce can be avoided. (3, 13)

Romanian Statistical Review - Supplement nr. 2 / 201456
Conclusions
The medical emergencies in the dental offi ce are not very frequent, but they can occur at any time, and the correct and rapid response of the dental practitioner can and should facilitate their professional management, as sometimes the patient’s life depends on it. Therefore, the dental practitioner should be properly trained in this regard and the patient health problems should be known. The responsibility for the decisions made and their consequences lies with the dental practitioner who has the professional, moral and legal obligation to prevent the medical emergency, to recognise and address it appropriately, and to know what it can and should be done as well as what it should not be done in the event it occurs.
Bibliography 1. Adameşteanu R.: Anxiety – An Emotional Process Induced by the Dental Treatment. Dentistry, Bucharest, vol. XXXVI, no. 4, 1989, pp. 255-262. 2. Anghel M.: Oral Diagnosis. University Horizons Publishing, Timişoara, 2004, pp. 11-57, 159-203. 3. Bodnar D. C. et al: Dental Management of the Patient with Complex Medical Problems, Ars Docendi Publishing, University of Bucharest, 2012, pp. 27-51, 133-144, 156-158. 4. Bodnar D. C., Dimova C., Bodnar T., Cristache C. M., Burlibaşa M.: Dental Management of the Patient with Psychic Disorders. Modern Medicine, Vol. XVII. No.10, (October) 2010, pp. 538-543. 5. Bodnar T., Bodnar D. C., Suciu I., Mocuţa D., Burlibaşa M., Dumitriu A. S., Popa M. B.: Dental Management of the Patient with Epilepsy. Modern Medicine, Vol. XVI, No. 6, June 2009, pp. 308-312. 6. Braunwald E., Fauci A. S , Kasper D. L., Hauser S. L., Longo D. L., Jameson J. L.: Harrison’s Principles of Internal Medicine, 17th ed., Medical Sciences Press, “Ardealul” Printing House, Cluj, 2004, pp. 168-177. 7. Davis D. R.: Patient Evaluation and Problem – Oriented Treatment Planning. In: Summit J. B., Robbins J. W., Schwartz R. S.: Fundamentals of Operative Dentistry, Second Edition, Quintessence Publishing, Co. Inc., 2001, pp. 26-55. 8. Dumitraşcu D.: Medicine between Miracle and Disappointment. Dacia Press, Cluj-Napoca, 1986, pp. 17-52, 76-115. 9. Little J. W., Falace D. A., Craig S. M., Nelson L. R.: Dental Management of the Medically Compromised Patient, seventh edition, Mosby Elsevier, 2008, pp. 2-17. 10. Mihalache G., Buhaş C.: Incidents and Accidents in Dental Practice Having Forensic Consequences; Dental Practitioner Responsibility. Dental Practice Life, year X, no.55, no. 1, February, 2008, pp. 51-60. 11. Mitchell L., Mitchell D. A., Nattress B.: Oxford Handbook of Clinical Dentistry, third edition, Oxford University Press, 2003, pp. 3-25. 12. Plozza B. L, Diamandescu I. B.: Psychosocial Dimension of Medical Practice, InfoMedica Press, Bucharest, 2002, pp. 19-27,131-177. 13. Vorvoreanu M., Vicol C., Cogălniceanu D.: Emergency in the Dental Offi ce, Omnia Press, Iaşi, 1997.

Revista Română de Statistică - Supliment nr. 2 / 2014 57
Cooperate Social Responsibility and SustainableDevelopment: A Case Study of Engro Fertilizer Dhahrki-Sindh-Pakistan Assistant Professor Dr.Asad Raza Abidi Assistant Professor Dr.Fayyaz Raza Chandio Assistant Professor Ali Hassan Halepoto SALU-Khairpur Mirs Assistant Professor Faiz M.Shaikh ([email protected]) SZABAC-Dokri-Larkana-Sindh-Pakistan
Abstract
Coperative Social responsibility is of great signifi cance for the sustainable development of the whole society as well as every enterprise. Data were collected from 200 stake holders and 500 local people from Dhahrki and their vicinity. Structural questionnaire were developed for the reliability and validity of the data. It was revealed that Engro fertilizer has established school, hospital and other facilitiers for the local people for the betterment. It was further revealed that importance on the interests of employees, consumers as well as the whole society, hence promoting the sustainable development of our enterprises and the harmonious progress of our society. Keywords: Social responsibility, Private enterprise, Sustainable development
***
Defi nition and Features of Corporate Social Responsibility
Ever since the 1990s, the concept of corporate social responsibility has enjoyed increasing world reputation. World Bank defi nes corporate social responsibility as an aggregation including enterprises’ relationship with others close to them in interests, their values, conformity to laws and

Romanian Statistical Review - Supplement nr. 2 / 201458
regulations as well as some relevant policies and practice showing respect for human beings, community and environment. It is a responsibility taken up by enterprises for sustainable development in order to improve those interest-related people’s living quality. While, according to the European Union, it is defi ned as “enterprises’ efforts to integrate their concerns with society and environment in their operation as well as their interaction with those interest-related people based on their resources”. Besides, it is defi ned by Business for Social Responsibility as “achieving business success by showing respect for moral values as well as for human beings, community and environment”. According to all the above defi nitions, it is clear that in addition to their traditional economic roles, enterprises are also expected to play their social roles as “agents” in order to guarantee the sound operation of market economy. As the agents of social resources, enterprises should serve not only their shareholders, consumers and employees but also the whole society. Therefore, its general connotation refers to enterprises’ responsibility in many ways to guarantee social welfare, stability and development, which includes (1) enterprises’ responsibility for their owners by guaranteeing profi t and development, (2) enterprises’ responsibility for their consumers by providing good and cheap goods, (3) enterprises’ responsibility for creditors by paying off debt on time, (4) enterprises’ responsibility for employees, including good salary, favorable working conditions, opportunities for training and promotion, (5) enterprises’ responsibility for government and community by paying taxes, profi ts, fees legally and providing equal employment opportunities in order to improve social and political stability and economic prosperity, (6) enterprises’ responsibility for social environment mainly by protecting and treating environment in order to provide a better living place for residents. According to the above detailed analysis, there are two layers of features in corporate social responsibility. First is the social responsibility imposed by laws and regulations, such as safe production, environmental protection, product quality, after-sale service and so on. This kind of responsibility is normally imposed by force by relevant laws, regulations and industry standards. Second is the spontaneous social responsibility required by morality and values, such as higher environmental protection standards, higher quality standards and charity and so on. This is based on the recognition of the harmony among human beings, nature and society in our corporate culture, refl ecting entrepreneurs’ humanistic quality and values with the former as the premise and base for enterprises’ survival and the latter as an important factor for enterprises’ constant profi t. Therefore, a socially-responsible entrepreneur should realize that First, in the aspect of its development course, the development

Revista Română de Statistică - Supliment nr. 2 / 2014 59
of private economy should be attributed to the policies made by CPC and government as well as the support of the whole society. Therefore, benefi ting most from reform and opening, private enterprises are expected to hold their social responsibilities, develop their production, create great wealth, hand in taxes, provide more jobs, satisfy people’s material and cultural demands and hence to contribute for social stability and harmonious society in addition to enjoying better environment for their development created by government and the whole society. Second, in the aspect of consumer protection, it is benefi cial for the sustainable development of enterprises as well as the harmony of the whole society. As small or medium-sized enterprises, most private enterprises in China deal with dispersed and mobile clients, so it is hard to be known among clients whether they stick to responsible operation. Furthermore, due to their changeable business ranges, enterprises put little importance on the comments they receive from others, hence resulting in some irresponsible actions, such as manufacturing fake and inferior commodities. Their irresponsibility for consumers has created a very bad impression on the whole society and consequently, has damaged their own images as well as hindered their own development. Seen from the above, it is benefi cial for enterprises themselves to establish a strong sense of social responsibility in order to achieve recognition and supports among consumers. Engro Fertilizers Limited is a wholly owned subsidiary of Engro Corporation and a renowned name in Pakistan’s fertilizer industry. Engro holds a vast, nationwide production and marketing infrastructure and produces leading fertilizer brands optimized for local cultivation needs and demand. Engro is also a leading importer and seller of Phosphate products, which are marketed extensively across Pakistan as phospatic fertilizers. Our extensive market development activities have ensured a sustained pull for our primary and secondary fertilizer products and sellout productions since launch. Engro Fertilizers Limited enjoys loyal customer base across Pakistan owing to its trusted fertilizer brands and continual farmer assistance in training and education. Engro Fertilizers Limited was incorporated in June 2009, following a decision to demerge fertilizer concern from its parent company Engro Chemical Pakistan Limited. The continual expansions and diversifi cations in its enterprises necessitated a broad restructuring in Engro Chemical operations and management. To facilitate better oversight, Engro Chemical Pakistan was converted into a holding company named Engro Corporation, and its fertilizer business was subsequently demerged to a newly formed Engro subsidiary –Engro Fertilizers Limited.

Romanian Statistical Review - Supplement nr. 2 / 201460
Engro’s fertilizer manufacturing facility at Daharki has been experiencing ongoing expansion. This, coupled with distinct dynamics of highly nuanced fertilizer industry warranted an independent and dedicated business entity and approach. The demerger of fertilizer concern was approved by High Court of Sind on December 9th, 2009, making it effective as of January 1st 2010. Engro Fertilizers is poised to become the leading urea manufacturer in the country following major upgrading of its manufacturing capabilities. ENVEN 1.3–a tremendous expansion in Engro’s urea manufacturing facility went into production in November 2010 and looks set to end Pakistan’s near-term urea imports, leading to benefi ts of an expanded local urea base and savings in national exchequer. Engro is a dynamic company driven by a vision to improve productivity and lifestyle for thousands of farmers across Pakistan. Engro Fertilizers Limited has earned itself a distinguished name by continually striving to uphold its tradition and trust of its loyal consumer base.
Sustainability
Since inception, Engro has recognized that a positive relationship with key stakeholders guarantees long-term success for any enterprise. We base our relationships on trust and equity, capturing the essence of what sustainability means to Engro and its partners. Today Engro is renowned as a successful and conscientious company which gives due regards to high ethical standards and community empowerment. We continually work to soften our environmental impact, create viable opportunities for our workforce, evolve more effi cient and effective work processes and engage in socially responsible initiatives. At Engro, we believe in sharing the fruits of our successes with our partners, stakeholders and human resource equitably. Engro has long believed in its commitments to society and national fabric. Our endeavors towards diversifi cation and enterprising new business ventures are fi rmly rooted in our corporate citizenship goals and realization of social responsibilities. As community development emerges into a mainstream management consideration, Engro fi nds itself at an advantage owing to its rich history of shaping positive changes in its surrounding environment. Literature Review The fundamental idea of CSR is that business corporations have an obligation to work towards meeting the needs of a wider array of stakeholders (Clarkson, M.: 1995). Corporate social responsibility is the notion that

Revista Română de Statistică - Supliment nr. 2 / 2014 61
corporations have an obligation to constituent groups in society other than stockholders and beyond that prescribed by law and union contract. Jones, T.M. (1980). CSR as essential for successful business operations and as an opportunity for business to look beyond narrow economic returns and take the wider social concern into consideration (Jackson, I. and J. Nelson: 2004). CSR is a set of management practices that ensures the company maximizes the positive impacts of its operations on society or ‘‘operating in a manner that meets and even exceeds the legal, ethical, commercial and public expectations that society has of business’’ (Business for Social Responsibility: 2001. CSR is about how companies manage the business processes to produce an overall positive impact on society. Baker, M. (2003). The management approach of CSR is more or less implicitly about meeting the demands of (primary or key) stakeholders today in order to secure resources, which are vital for the company’s performance in the near future (Frooman, J.: 1999). On the contrary, CSR initially put emphasis on social issues like human rights and working conditions. As the environmental movement gained momentum, environmental issues were increasingly embraced as social issues in a broader sense (Marrewijk, M.van: 2003). Keith Davis argued that social responsibility referred to ‘businessmen’s decisions and actions taken for reasons at least partially beyond the fi rm’s direct economic or Technical interest’ (Davis, K. (1960). William C. Frederick argued that businesses’ resources should also be used for broad social goals Frederick, W.C. (1960). Social responsibility urges corporations to assume certain responsibilities to society which extend beyond their economic and legal obligations. (McGuire, J. (1963). Eells and Walton, in 1961 (Frederick, 1994), argued as follows: When people talk about corporate social responsibilities they are thinking in terms of the problems that arise when corporate enterprise casts its shadow on the social scene, and of the ethical principles that ought to govern the relationships between the Corporation and society. World Business Council as “The continuing commitment by business to behave ethically and contribute to economic development while improving the quality of life of the workforce and their families as well as of the local community and society at large”. Being socially responsible means not only fulfi lling legal expectations, but also going beyond compliance and investing more into human capital, the environment and relations with stakeholders (Commission of European Communities, 2004). Corporate Social Responsibility is the way in which a company manages and improves its social and environmental impact to generate value for both its shareholders and its stakeholders by innovating its strategy, organization and operations ;CSR Europe (2003). CSR can be thus be simply defi ned as the additional commitment by businesses to improve the

Romanian Statistical Review - Supplement nr. 2 / 201462
social and economic status of various stakeholders involved while complying with all legal and economic requirements, Warhust, A. (2001). Reinhardt et al (2008) and Bénabou & Tirole (2009 adopted a simple standard defi nition of CSR originally Offered by Elhauge (2005) that is: sacrifi cing profi ts in the social interest. For there, to be a sacrifi ce, the fi rm must go beyond its legal and contractual obligations, on a voluntary basis. According to Hopkins (2004) and Abd Rahim, et al (2011) CSR can be defi ned as treating the stakeholders of the fi rm ethically or in a responsible manner (Hopkins, Michael (2004). Koestoer (2007) offered defi nition of CSR in the following words: Ways of companies in addressing various social issues in their operating areas, individually or collectively, are known as Corporate Social Responsibility (CSR). Sriramesh et al (2007 and Ismail (2011) reported that Bowen (1953) identifi ed as the pioneer in providing the modern literature on CSR, offered one of the earliest defi nitions seeing CSR as the “obligations of businessmen to pursue those policies, to make those decisions, or to follow those lines of action which are desirable in terms of the objectives and values of our society”. Kim, (2011) asserted by quoting many studies ((Friedman, 1970; Jensen, 2000; Davis, 1967; Donaldson & Dunfee, 1999) that since Bowen (1953) defi ned CSR as a method employed by corporations to pursue policies, decisions, and actions for the social purpose and value. Mahlouji and Anaraki (2009) referred a defi nition by David Waldman et al. (2006) who defi ned CSR as actions on the part of the fi rm that appear to advance, or acquiesce in the promotion of some social good, beyond the immediate interests of the fi rm and its shareholders, which is required by law. Such actions may result in a company embodying socially responsible attributes in their products. Corporations should transition from a state of mere compliance to a mode of engagement, from harm minimization to value creation (Luetkenhorst, W.: 2004).
Data Collection Methodology
Data were collected from 200 stake holders and 500 local people from Dhahrki and their vicinity. Structural questionnaire were developed for the reliability and validity of the data
Results
In our effort to better realize our social responsibilities as a corporate entity and icon, corporate philanthropy is but one element of a broader and more cohort effort. We highlight our citizenship performance and sustainability

Revista Română de Statistică - Supliment nr. 2 / 2014 63
initiatives with objective performance data –data points, metrics, actions and progress made. Engro Foundation’s major social investments are in education, health, water and sanitation, and other welfare activities. The Foundation’s main geographical areas of focus are communities around our manufacturing sites and supply chains.
Health, water & sanitation and infrastructure
Engro Foundation is focused at creating access to basic services (health, water & sanitation, and infrastructure) in rural communities. Health interventions, especially those focused on women and children, are a priority area of Engro’s community investments. Engro supports numerous health facilities which include general OPD clinics and specialized clinics/centers in snakebite and thalassemia treatment, reproductive and maternal health, eye and kidney diseases. Only 40% of Pakistan’s population has access to ‘improved’ water sources and 20% have access to some form of sanitation. Engro Foundation is involved in projects aimed at improving basic community infrastructure for drinking water, brick paving, drainage and sanitation. Education Since lack of education is one of the biggest deterrents to social and economic empowerment, education is another major area of focus of the Foundation. One such major initiative comprises of adopting government schools in rural communities around our manufacturing sites. Support to these schools from Engro Foundation consists of two aspects: infrastructure investments such as construction and repair of classrooms, boundary walls, bathrooms, provision of furniture, text books, stationary items, and other teaching and learning materials; in addition to provision of teachers and teachers’ training.
Eelfare and Emergency Relief Activities
Engro Foundation provides support to various non-profi t/non-governmental organizations involved in eliminating social problems, promoting local arts and culture, and disaster and emergency relief activities. Such support includes donations in cash and kind. In case of natural and man made disasters, Engro Foundation seeks to provide cash and in-kind donations to organizations involved in emergency and relief activities.

Romanian Statistical Review - Supplement nr. 2 / 201464
The Construction of Social Responsibility in Pakistan
In what way will play Corporate social responsibility? First of all, they should provide high-quality products and services to earn profi t and to be responsible for their shareholders, which is their basic responsibility. In addition to that, they are expected to take responsibility for consumers, employees, environment and society. Therefore, their social responsibility should be constructed in four aspects including quality, employees, environment and public welfare. 1. Sticking to honest operation and providing high-quality products and services for consumers. With honesty as the basic principle of market economy, some dishonest or deceptive actions, such as fraud practice, producing fake or inferior products, breaking contracts, tax evasion as well as debt evasion, have spoiled the sound commercial atmosphere, infringed upon the public interests and damaged the images of the enterprises themselves. Accordingly, private enterprises should establish an “honesty-oriented” operation notion in which credit should be emphasized, quality should be based on and innovation should be relied on to improve enterprises’ management and provide high-quality products and services. Only in this way will they attract more consumers and survive in the fi erce market competition. 2. Emphasizing security responsibility construction and constructing harmonious labor relations.(1) Due to their poor bases, including facilities, management, employee quality labor protection treatment as well as medical treatment, private enterprises are lacking in security guarantee. With the dropout of public economy from some areas and the development of private enterprises in more areas of our national economy, private enterprises are playing a more and more important role in safe production. Therefore, it is critical to strengthen their security supervision to enable them to improve laborers’ working environment and living conditions and guarantee their employees’ safety and health. (2) With Pakistan becoming the world manufacturing center gradually, are faced with more fi erce international competition; therefore, a highly-qualifi ed, skilled and energetic staff team seems to be particularly important. Private enterprises should realize the function and value of employees, show respect for them, protect and develop their legal rights and interests. By establishing perfect systems related to wages and welfare as well as staff training and promotion, harmonious labor relations can be created, the cohesion in the whole enterprise will be strengthened and therefore, their competitiveness at the international market will be improved. 3. Putting more importance on private enterprises’ economic growth quality and improving their sense of effective. Resource utility and environmental protection. In Pakistan, economic growth quality is more important than

Revista Română de Statistică - Supliment nr. 2 / 2014 65
the growth itself, which is refl ected in decreasing resource consumption. Accordingly, it is quite essential for them to convert their “high consumption and low production” extensive growth pattern, rely on technological reform to reduce resource consumption and pollution, develop their recycling technology to construct circular economy in order to protect limited resources and ecological environment as well as to promote the sustainable development of economy and society. 4. Establishing right undertaking sense and trying to fulfi lling employment demands. After earning great wealth through long-term hardship, private entrepreneurs are expected to establish right sense of wealth and undertaking to provide more jobs for the whole society through investment, production expansion especially by developing some labor-intensive industries and the tertiary industry. This will help to shorten the wealth disparity in Pakistan and relieve the severe employment pressure of the whole society. 5. Keeping an eye on charity and making contribution for harmonious society. With private enterprises as one part of the modern society, its harmonious development will, of course, play a very important role in the constant development of these enterprises. In the aspect of morality, private enterprises should pay more attention to charity activities and take their responsibilities for public interests, especially those disadvantaged groups. They can include donation in their corporate strategies and standardize their donation plans, operation systems and encouragement measures. In this way, the relations among different classes of the whole society will be improved and therefore a better environment will be created for these enterprises to develop themselves. What’s more important, good effects can be achieved in the development of China’s economy and the harmony and stability of the whole society.
Conclusion
Corporate social responsibility? First of all, they should provide high-quality products and services to earn profi t and to be responsible for their shareholders, which is their basic responsibility. In addition to that, they are expected to take responsibility for consumers, employees, environment and society. Therefore, their social responsibility should be constructed in four aspects including quality, employees, environment and public welfare. private entrepreneurs are expected to establish right sense of wealth and undertaking to provide more jobs for the whole society through investment, production expansion especially by developing some labor-intensive industries and the tertiary industry. This will help to shorten the wealth disparity in Pakistan and relieve the severe employment pressure of the whole society.

Romanian Statistical Review - Supplement nr. 2 / 201466
References
- Amnesty International-Business Group (UK) (2003) Why do Human Rights Matter to Business?, Available at http://www.amnesty.org.uk/business/why.shtml (accessed on December 27, 2003). - Baker, M. (2003) Corporate Social Responsibility – What does it mean?, available at http://www.mallenbaker.net/csr/CSRfi les/defi nition.html (accessed on December 27, 2003). - Bowen, H.R. (1953) Social Responsibilities of the Businessman, New York: Harper and Row. - BORZA Mioara (2011) “Some Considerations Regarding the Corporate Social Responsibility Models in Romania”, International Journal of Business and Management Studies Vol. 3, No 2, 2011, pp. 191-200). - Bryan W. Husted and José de Jesus Salazar, Taking Friedman Seriously: Maximizing Profi ts and Social Performance, Journal of Management Studies, January 2006. - Bénabou, Roland and Tirole, Jean (2009) “Individual and Corporate Social Responsibility” WP, 09-109, Research Group: Behavioral and Experimental Economics November 11, 2009, Toulouse School of Economics. - BORZA Mioara (2011) “Some Considerations Regarding the Corporate Social Responsibility Models in Romania”, International Journal of Business and Management Studies Vol. 3, No 2, 2011, pp. 191-200). - Business for Social Responsibility: 2001, Introduction to Corporate Social Responsibility. [Online] available: http://www.bsr.org/bsrresources/WhitePapers_Issue- Area.cfm. - CSR Europe (2003) What is Corporate Social Responsibility?, Available at http://www.csreurope. org/about us/FAQ/#csr (accessed on December 27, 2003). - Carroll, A.B. (1999) ‘Corporate social responsibility’, Business and Society, Vol. 38, Iss. No. 3, pp.268–295. - Carroll, A.B. (1991). The pyramid of corporate social responsibility: toward the moral management of organizational stakeholders. Business Horizons, July–August, pp. 39–48. - Clarkson, M. B. E.: 1998, A Stakeholder Framework for Analyzing and Evaluating Corporate Social Performance, in M. B. E. Clarkson (ed.), The Corporation and its Stakeholders: Classic and Contemporary Readings. (University of Toronto Press, Toronto) 243–273. - Clarkson, M.: 1995, A Stakeholder Framework For Analyzing and Evaluating Corporate Social Responsibility , The Academy of Management Review 20(1), 92– 118. ; Waddock, S., C. Bodwell and S. Graves: 2002, Responsibility: The New Business Imperative, The Academy of Management Executive 16(2), 132–147.) - Carroll, A. B.: 1999, Corporate Social Responsibility: Evolution of a Defi nitional Construct, Business & Society 38(3), 268–295.), it does not go as far as in the context of SD. - Carroll, A.B. (1979) ‘A three-dimensional conceptual model of corporate performance’, Academy of Management Review, Vol. 4, No. 4, pp.497–505. - Davis, K. (1973) ‘The case for and against business assumption of social responsibilities’, Academy of Management Journal, Vol. 16, Iss. No. 2, pp.312–322. - Davis, K. (1973). The case for and against business assumption of social responsibilities. Academy of Management Journal, June, pp. 312–322 . - Davis, K. (1960). Can business afford to ignore social responsibilities? California Management Review, 2, pp. 70–76. - Dawkins, J. and S. Lewis: 2003, CSR in Stakeholder Expectations and their Implication for Company Strategy, Journal of Business Ethics 44(2–3), 185–193. ISO Advisory

Revista Română de Statistică - Supliment nr. 2 / 2014 67
Group on Social Responsibility: 2004, ‘Working Report on Social Responsibility’, www. iso.org/iso/en/info/Conferences/SRConferences/pdf /Working%20Report%20SR(Apr30).pdf. - Epstein, E. M.: 2002, “Religion and Business – The Critical Role of Religious Traditions in Management Education”, Journal of Business Ethics, Volume 38, 91-96. - European Commission.(2010).Corporate Social Responsibilty(CSR). Retrieved from http://ec.europa.eu/enterprise/policies/sustainable-business/corporate social responsibility/Index_en.htm. - European Commission: 2002, ‘Communication from the Commission concerning Corporate Social Responsibility: A Business Contribution to Sustainable Development’, http://europa.eu.int/comm/employment_ social/soc-dial/csr/csr2002_en.pdf). - European Commission: 2001, Promoting a European Framework for Corporate Social Responsibility. Green Paper. (Offi ce for Offi cial Publications of the European Communities, Luxembourg)http://europe. eu.int/comm/employment_social/soc-dial/csr/ csr2002_en.pdf., sub-heading of the communication; see also ISO Advisory Group on Social Responsibility: 2004, ‘Working Report on Social Responsibility’, www. iso.org/iso/en/info/Conferences/SRConferences/pdf /Working%20Report%20SR(Apr30).pdf. , closely intertwined with the concept of SRM. - Frederick, W.C. (1960). The growing concern over social responsibility. California Management Review, 2, pp. 54–61. - Friedman, M. (1962). The social responsibility of business is to increase its profi ts. New York Times, September, 126. - Freeman, J.: 1999, Stakeholder Infl uence Strategies, Academy of Management Review 24(2), 191–205. Figge, F. and S. Schaltegger: 2000, ‘What is ‘Stakeholder Value? Developing a catchphrase into a Benchmarking Tool’, http://www.sustainablevalue.com/Stakeholder %20Value%20%20Frank%20Figge%20and%20Stefan% 20Schaltegger%20(read%20only).pdf. ;). - Gambling, T., and Karim, R.: 1991, Business and Accounting Ethics in Islam, Mansell: London, p33. - Hayek, F.A. (1969). The corporation in a democratic society: in whose interest ought it and will it be run? In Ansoff, H. (ed.), Business Strategy. Harmondsworth: Penguin Books, p. 225. - Hasan, Zubair (1983). “Theory of Profi t: The Islamic Viewpoint”, Journal of Research in Islamic Economics, 1 (1), pp. 1-16. - Holme, R. and P. Watts: 2000, ‘Corporate Social Responsibility: Making Good Business Sense’ (WBCS), http://www.wbcsd.org/newscenter/reports /2000/csr2000.pdf. - Ma, Weihua. (2005). Entrepreneurs’ Mission in the Construction of Harmonious Society. [Online] http:// www.people.com.cn/ 4.11.

Romanian Statistical Review - Supplement nr. 2 / 201468
Principiile fundamentale în statistica ofi cială
La fi nele lunii ianuarie au fost aprobate de Adunarea Generală a Organizaţiei Naţiunilor Unite (ONU) Principiile Fundamentale de organizare şi functionare a Statisticii Ofi ciale, moment istoric pentru întreg sistemul statistic global.
Directorul Diviziei de Statistică ONU a mulţumit tuturor celor care au iniţiat şi sprijinit acest proces. În particular, au fost nominalizaţi: doamna Gabriella Vukovich, actualul preşedinte al Comisiei de Statistică, Misiunea Permanentă a Ungariei datorită faptului că a adus proiectul de rezoluţie în atenţia Adunării Generale a ONU, cei 48 de sponsori ai acţiunii, printre care s-a afl at şi România. Le-au fost aduse mulţumiri celor 10 vizionari care au elaborat cele zece Principii, cu mai bine de 20 de ani în urmă, care se bucură de faptul că rezultatul eforturilor lor a rezistat testului timpului. Între aceştia, se afl a şi colegul nostru, dl. Ilie Dumitrescu, consilierul preşedintelui INS, care în anii 1991-1992 a reprezentat România la grupul de lucru de iniţiativă care a concretizat această acţiune de mare anvergură.
29 ianuarie 2014 va marca o zi specială în cadrul comunităţii profesionale a statisticienilor lumii sărbătorită şi de conducătorii institutelor naţionale de statistică care folosesc ca instrument de lucru în activitatea zilnică cele zece Principii fundamentale şi care au depus eforturi pentru promovarea şi recunoaşterea acestora de societate.
Odată depăşit momentul aprobării, lumea statisticii ofi ciale îşi îndreaptă atenţia către implementarea Principiilor, în particular, în contextul global curent, în care statisticienii trebuie să răspundă continuu la noile provocări.
Divizia de Statistică ONU va organiza cu această ocazie un Forum la Nivel Înalt, ce va comemora a 20-a aniversare a Principiilor Fundamentale, eveniment ce va avea loc anul acesta la New York.
Aprobarea Principiilor Fundamentale de către Adunarea Generală a ONU reprezintă o realizare istorică şi arată cât de mult poate obţine comunitatea statistică globală atunci când lucrează împreună.
Informaţii furnizate de Direcţia de Afaceri Europene şi Cooperare Internaţională

Revista Română de Statistică - Supliment nr. 2 / 2014 69
Director: Cristina SACALĂEchipa logistică:
Oana NICOLAU, Nicolae IONESCU, Costin GOGONEA, Gheorghe VAIDA-MUNTEAN
Condiţii pentru prezentarea materialelor spre publicare
Lucrările ştiinţifi ce sau tehnice, originale, se pot prezenta redacţiei spre publicare fi e sub formă de articole, fi e sub formă de scurte comunicări în limba română şi în limba engleză (traducere integrală). Precizările privind condiţiile tehnice pentru predarea materialelor se afl ă pe site-ul www.revistadestatistica.ro, secţiunea „Procesul de recenzare”.
Conditions for the articles designated for the Romanian Statistical Review
The original scientifi c or technical works can be sent to be published either under article form or short communications in Romanian and English (complete translation). The technical conditions for the articles to be presented can be found at www.revistadestatistica.ro in the “Peer review” section.
ISSN 1018-046X
Reproducerea conţinutului articolelor fără acordul Institutului Naţional de Statistică este interzisă, iar utilizarea conţinutului acestei publicaţii, cu titlul explicativ sau justifi cativ, în diferite lucrări este autorizată numai cu precizarea clară a sursei.
Se precizează că punctele de vedere, datele şi informaţiile cuprinse în articolele publicate aparţin autorilor şi nu angajează răspunderea Institutului Naţional de Statistică