Embed Size (px)
Citation preview

Presented by:
Clayton Klenke, Executive Director and Jim Muschinske, Revenue Manager
Commission on Government Forecasting and Accountability
802 Stratton Office Building, Springfield, Illinois 62706
May 2021
Revised FY 2022 Economic Forecast and Revenue Estimate
and Updated FY 2021 Revenue Update
-2-
CGFA Commission Members
http://cgfa.ilga.gov
Senate
Senator David Koehler
Co-Chair
Senator Omar Aquino
Senator Darren Bailey
Senator Donald DeWitte
Senator Elgie Sims
Senator Dave Syverson
House of Representatives
Representative C.D. Davidsmeyer
Co-Chair
Representative Amy Elik
Representative Amy Grant
Representative Sonya Harper
Representative Elizabeth Hernandez
Representative Anna Moeller
Clayton Klenke
Executive Director
Laurie Eby
Deputy Director
Jim Muschinske
Revenue Manager

-3-
CGFA Background & Responsibilities
• Bi-Partisan, joint legislative commission, provides the General Assembly with information relevantto the Illinois economy, taxes and other sources of revenue and debt obligations of the State inaddition to providing objective policy research for legislators and legislative staff.
• Prepares annual revenue estimates with periodic updates;
• Reports monthly on the State’s financial and economic condition;
• Analyzes of the fiscal impact of revenue bills;
• Prepares State Debt Impact Notes;
• Periodically assesses capital programs;
• Annually estimates the liabilities of the State’s group health insurance program and approves contractrenewals promulgated by the Department of Central Management Services;
• Implements the provisions of the State Facilities Closure Act;
• Annually estimates public pension funding requirements and prepares pension impact notes;
• Provides non-partisan research for General Assembly Members and legislative staffs.

-4-
GENERAL FUNDS
REVENUE

Recent Revenue Performance and Updated
Economic Outlooks Result in Upward Revisions
-5-
On March 9th, the Commission presented its revenue forecast for FY 2022 as well as an update to the FY 2021 outlook. As we have moved
through the current fiscal year, significant adjustments have been made to account for actual events and/or incorporate actual receipt
experience as well as updated economic trajectories.
• In November 2020, the failed passage of the graduated tax initiative resulted in the removal of $1.274 billion from the enacted budget
picture. In addition, per the Administration’s view, $5 billion of “Federal Stabilization/Municipal Liquidity” and $150 million of interfund
borrowing was also removed from the State’s financial plan. A large amount of that downward movement was offset by an increased view
of base general funds revenues of $2.308 billion. As result, the Commission’s overall FY 2021 estimate was lowered by $4.116 billion.
• In early March 2021, after continued positive receipt performance throughout the first two-thirds of year, coupled with a view of an
accelerated economic rebound, base general funds revenues were further adjusted up $2.864 billion. In addition, $1.998 billion of actual
MLF borrowing proceeds served to increase overall available resources. As a result, the Commission’s outlook for FY 2021 improved by
$4.712 billion.
Since then, actual receipts for both March and April have been booked, and despite final payment deadlines for personal income tax being
slightly delayed, revenues have been interpreted to continue to significantly outpace expectations. As a result, as discussed in the following
revenue update, the Commission is making a revision for FY 2021, as revenues are expected to total $45.616 billion, or $2.025 billion
above the March projection.
It is important to note that the majority of those upward revisions will be contained within the FY 2021 estimate and should not be assumed to
repeat or be considered “baseable” for FY 2022 due to timing and historical receipt pattern disruptions brought about by the pandemic’s
impact. That said, there is a measure of base growth that can be expected to be carried forward from the FY 2021 adjustment, particularly as
it relates to continuation of underlying improvement of economic conditions as we distance ourselves from the worst of the pandemics impact.
Therefore, the Commission’s revised revenue forecast for FY 2022 improves to $41.188 billion. The updated outlook reflects $792
million in total upward adjustments.
While uncertainty is less heading into upcoming FY 2022 than last year, it still is much higher than normal. The unwinding of the various
stimulus programs such as direct stimulus payments, augmented unemployment benefits, rental assistance and other business and consumer
focused benefits, will likely create some headwinds related to growth rates. All that without mentioning the specter of the return of the virus in
the fall and/or variant strains. –CGFA April Revenue Briefing
*As the focus of this update is to provide updated revenue estimates, information pertaining to the national and State’s economy as well as
updated economic forecast information can be found in the Appendices.

FY 2021 General Funds Performance to Date
-6-

Revenues Year to Date [Thru April]
-7-
Excluding borrowing related activity, through the first
ten months of the fiscal year, base receipts are up
$4.920 billion. In addition to a surge in federal
sources, that growth also reflects the timing of income
tax receipts related to last year’s [2020] filing deadline
extension, as well as the positive trajectory of
underlying economic conditions. Through April,
combined net income tax receipts are up $3.406
billion. While approximately $1.3 billion of those
gains continue to be attributed to the shift of FY 2020
final payments into early FY 2021, stronger than
previously expected income tax performance continues
to impress. Also viewed positively is the continued
upward trend of sales tax receipt performance as net
receipts are up $557 million. Only now beginning to
compare against those months most impacted by the
economic shutdowns of a year ago, sales taxes seem
to be reflecting positive consumer reactions to
stimulus payments, an improving job picture, and
stronger consumer confidence.
Overall transfers are off considerably, down $833
million, reflecting the lack of riverboat gaming
transfers [$195 million] and significantly lower
Income Tax Refund transfer levels [$336 million] as
well as lower other miscellaneous transfers [$444
million]. Federal sources have experienced an
exceptional year of receipting as receipts are up
$1.774 billion.
$ %
Revenue Sources FY 2021 FY 2020 CHANGE CHANGE
State Taxes
Personal Income Tax $20,834 $18,183 $2,651 14.6%
Corporate Income Tax (regular) 3,491 2,111 1,380 65.4%
Sales Taxes 7,912 7,383 529 7.2%
Public Utility Taxes (regular) 641 716 (75) -10.5%
Cigarette Tax 234 227 7 3.1%
Liquor Gallonage Taxes 150 149 1 0.7%
Vehicle Use Tax 30 22 8 36.4%
Inheritance Tax 399 226 173 76.5%
Insurance Taxes and Fees 409 326 83 25.5%
Corporate Franchise Tax & Fees 278 192 86 44.8%
Interest on State Funds & Investments 48 122 (74) -60.7%
Cook County IGT 244 150 94 62.7%
Other Sources 180 467 (287) -61.5%
Subtotal $34,850 $30,274 $4,576 15.1%
Transfers
Lottery $631 $485 $146 30.1%
Riverboat transfers & receipts 0 195 (195) -100.0%
Proceeds from Sale of 10th license 6 10 (4) -40.0%
Refund Fund transfer 281 617 (336) -54.5%
Other 407 851 (444) -52.2%
Total State Sources $36,175 $32,432 $3,743 11.5%
Federal Sources $4,327 $2,553 $1,774 69.5%
Total Federal & State Sources $40,502 $34,985 $5,517 15.8%
Nongeneral Funds Distributions/Direct Receipts:
Refund Fund
Personal Income Tax ($1,875) ($1,728) ($147) 8.5%
Corporate Income Tax (489) (301) (188) 62.5%
LGDF--Direct from PIT (1,149) (947) (202) 21.3%
LGDF--Direct from CIT (206) (118) (88) 74.6%
Downstate Pub/Trans--Direct from Sales (324) (352) 28 -8.0%
Subtotal General Funds $36,459 $31,539 $4,920 15.6%
Treasurer's Investments $400 $400 $0 0.0%
Interfund Borrowing $0 $462 ($462) N/A
Short Term Borrowing $1,998 $0 $1,998 N/A
Total General Funds $38,857 $32,401 $6,456 19.9%
CGFA SOURCE: Office of the Comptroller: Some totals may not equal, due to rounding 7-May-21
GENERAL FUNDS RECEIPTS: YEAR TO DATEFY 2021 vs. FY 2020
($ million)

Updated FY 2021 CGFA Revenue Estimate
-8-
As shown in the table, the Commission’s updated FY 2021 base general funds estimate is $45.616 billion. The revised estimate
represents a $2.025 billion increase from CGFA’s March 2021 projection. The updated revenue outlook reflects continued
improvement, both in terms of actual receipts as well as economic conditions. Since the release of the March forecast, another
significant round of federal stimulus was passed (including additional direct payments), which should serve to boost consumer activity
in the near term, employment levels continue to improve, and most importantly the trajectory of the pandemic is going in the right
direction by most metrics. Highlights and discussion of the updated forecast are provided on the next pages.
Updated Difference
($ millions) CGFA Mar-21 CGFA May-21 from March-21
Personal Income Taxes [Net] $20,552 $21,745 $1,193
Corporate Income Taxes [Net] $2,769 $3,287 $518
Sales Tax [Net] $8,889 $9,189 $300
All Other State Sources $3,222 $3,236 $14
Transfers In $1,777 $1,777 $0
Federal Sources $4,384 $4,384 $0
Base General Funds $41,593 $43,618 $2,025
$ Change from Previous Estimate $2,025
Interfund Borrowing/Fund Reallocations $0 $0 $0
Federal Stabilization/Municipal Liquidity Facility $1,998 $1,998 $0
P.A 101-8 Net Income Taxes [SJRCA 1] $0 $0 $0
Total General Funds Revenues* $43,591 $45,616 $2,025
$ Change from Previous Estimate $2,025
*Table excludes $400m of Treasurer's Investment Borrowing Nov-20 expected to be repaid by end of FY'21
FY 2021 General Funds Revenue Estimates
CGFA March-21 vs Updated CGFA May-21
-9-
Updated FY 2021 CGFA Revenue Estimate (continued)
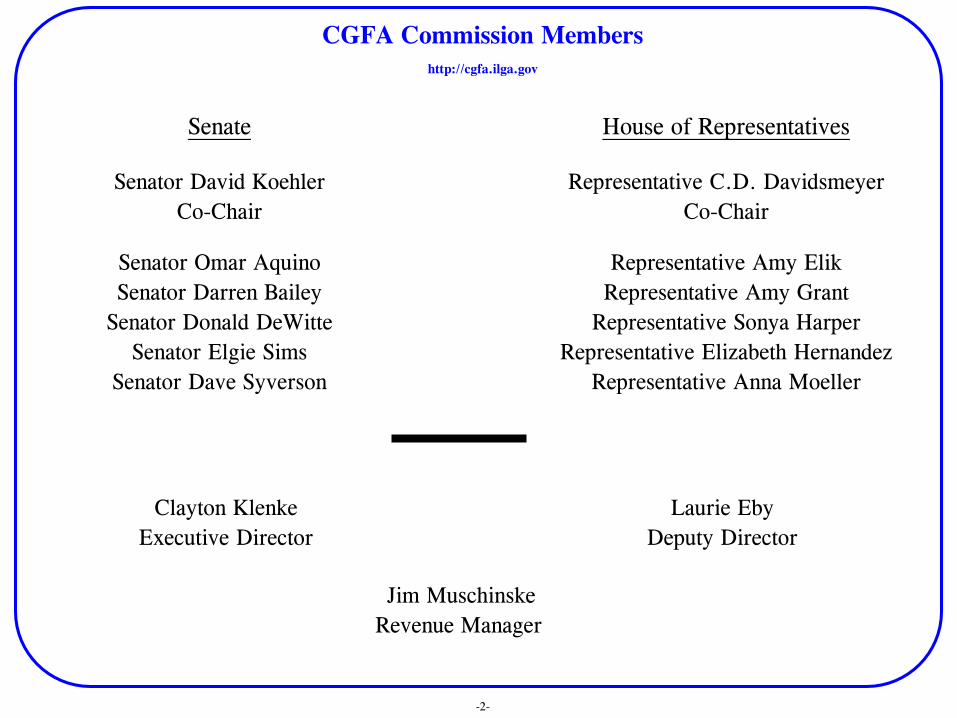
Personal Income Taxes- The estimate of personal income tax receipts is being revised up $1.193 billion on a net basis. The
increase represents continued improvement overall, both in terms of absolute receipting experienced in the two months since the last
projection, as well as expectations over the remainder of the fiscal year. While the deadline of April’s final payments was delayed
[as they were last year], the postponement was only until May 17th, meaning that final payments should still fall into FY 2021 as
expected. This short delay in final payments means the bulk of tax returns should be processed and receipted by the end of May—
whereas last year, approximately $1 billion of final payments slipped into July/August of FY 2021. To repeat from earlier
analyses, the timing of these historic receipt patterns resulted in FY 2021 having two periods of final payments [those that were
moved from April 2020 into July 2021] and then again this April/May. The consequence of that timing anomaly manifests in
reduced year-over-year comparisons as FY 2022 will revert back to one period of final payments.
Corporate Income Taxes- The estimate of corporate income tax receipts is being increased $518 million on a net basis. Utilizing
monthly component data, it appears that corporate taxpayers underpaid their estimated tax payments during the pandemic’s onset
early in tax year 2020 (FY 2020). Once 2020 tax year final figures were calculated this spring, businesses had to make up for these
underpayments via final payments being receipted in FY 2021. As a result, gross corporate income tax revenues for the month of
April 2021 reached a record $1.130 billion. To the extent corporate receipts were impacted by this reconciliation of underpaid
estimated payments, caution must be exercised not to assume future final payments will continue to reflect those higher levels.
Sales Taxes- The estimate of sales taxes has been adjusted upward by $300 million on a net basis. Strong performance over the past
couple of months, fueled in part by the latest stimulus checks combined with the expectation of continued consumer demand as the
economy continues to reopen, generates upside pressure on the previous estimate. Growth should continue at significant levels over
the remaining months as May/June sales tax receipts will be compared against those much weaker pandemic impacted months of last
year.
-10-
Updated FY 2021 CGFA Revenue Estimate (continued)
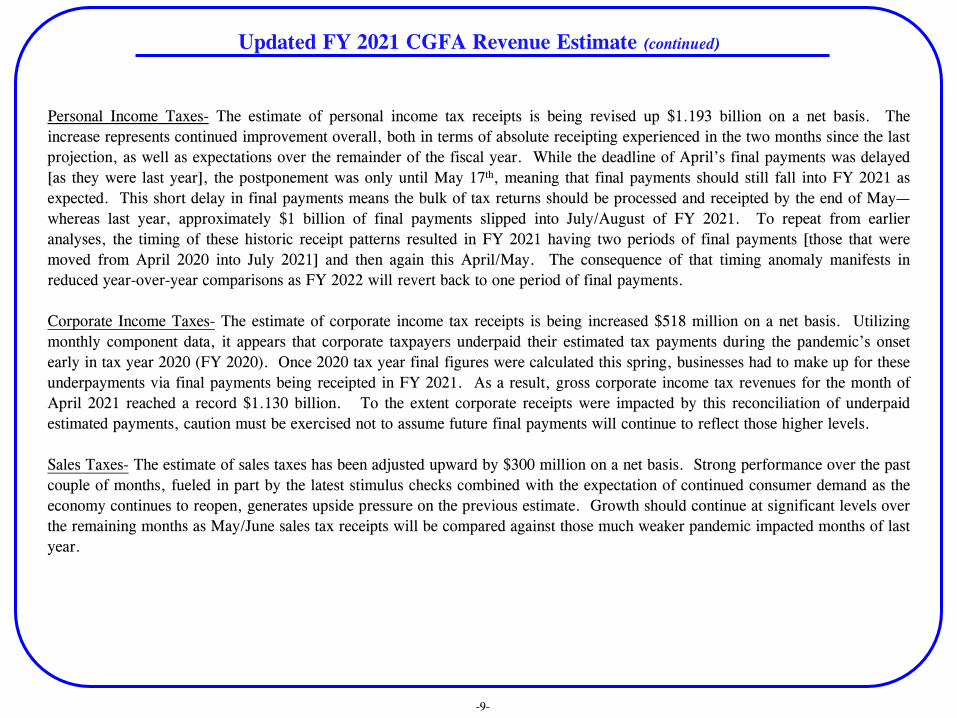
All Other Sources- The estimates of all other state
sources have been increased by a net $14 million to
$3.236 billion. While the overall change is very minor,
some adjustments are worth mentioning. For example,
the estimates of inheritance tax has been increased $55
million, while corporate franchise taxes is being upped
$43 million, with both adjustments reflecting actual
receipt performance. To offset much of those gains is a
$53 million downward revision in “other miscellaneous
sources”, $15 million less in expected interest earnings,
and a $13 million lowered estimate of public utility
receipts.
Federal Sources- No adjustments are being made to the
estimate of federal sources. However, with very little
federal receipts needed over the remaining two months to
reach the forecast, it is quite possible the current
estimate could be exceeded by several hundred million.
Federal sources are largely reliant on reimbursable
Medicaid spending, which is governed by appropriation
authority, available cash, vouchers processed for
payment, and ultimately payment decisions made at the
Comptroller’s office. Historically, federal sources
during the last couple months of a fiscal year has
demonstrated extreme volatility, hence the reluctance to
officially adopt a new forecast without official
confirmation via updated Administration financial plans.
It should be pointed out that should the current estimate
be measurably surpassed, that performance would not
translate into an improved outlook for next fiscal year.
In other words, it would not become “baseable”
revenue, as those aforementioned limiting factors would
continue to apply.
FY 2021 FY 2021 Difference
CGFA Revision CGFA Revision from
Revenue Sources March-21 May-21 March-21
State Taxes
Personal Income Tax $24,042 $25,437 $1,395
Corporate Income Tax (regular) $3,457 $4,103 $646
Sales Taxes $9,318 $9,623 $305
Public Utility (regular) $767 $754 ($13)
Cigarette Tax $280 $275 ($5)
Liquor Gallonage Taxes $178 $178 $0
Vehicle Use Tax $33 $35 $2
Inheritance Tax $385 $440 $55
Insurance Taxes & Fees $469 $469 $0
Corporate Franchise Tax & Fees $255 $298 $43
Interest on State Funds & Investments $70 $55 ($15)
Cook County Intergovernmental Transfer $244 $244 $0
Other Sources $541 $488 ($53)
Subtotal $40,039 $42,399 $2,360
Transfers
Lottery $745 $745 $0
Riverboat transfers and receipts $0 $0 $0
Proceeds from sale of 10th license $10 $10 $0
Refund Fund $281 $281 $0
Other $741 $741 $0
Total State Sources $41,816 $44,176 $2,360
Federal Sources [Base] $4,384 $4,384 $0
Subtotal Federal & State Sources $46,200 $48,560 $2,360
Nongeneral Funds Distribution:
Refund Fund
Personal Income Tax [9% '21] ($2,164) ($2,289) ($125)
Corporate Income Tax [14% '21] ($484) ($574) ($90)
Local Government Distributive Fund
Personal Income Tax ($1,326) ($1,403) ($77)
Corporate Income Tax ($204) ($242) ($38)
Sales Tax Distribution to the PTF and DPTF ($429) ($434) ($5)
Base General Funds $41,593 $43,618 $2,864
Interfund Borrowing/Fund Reallocations $0 $0 $0
Federal Stabilization/Municipal Liquidity Facility $1,998 $1,998 $0
P.A. 101-8 Net Income Taxes [SJRCA 1] $0 $0 $0
Total General Funds Revenues* $43,591 $45,616 $2,025
*Excludes $400m of Treasurer's Investment Borrowing Nov-20 expected to be repaid by end of FY'21
(millions)
FY 2021 General Funds Revenue Estimates
CGFA March-21 vs Updated CGFA May-21
Review of Improved FY 2021 Revenue Picture from Enactment to May Revision
-11-
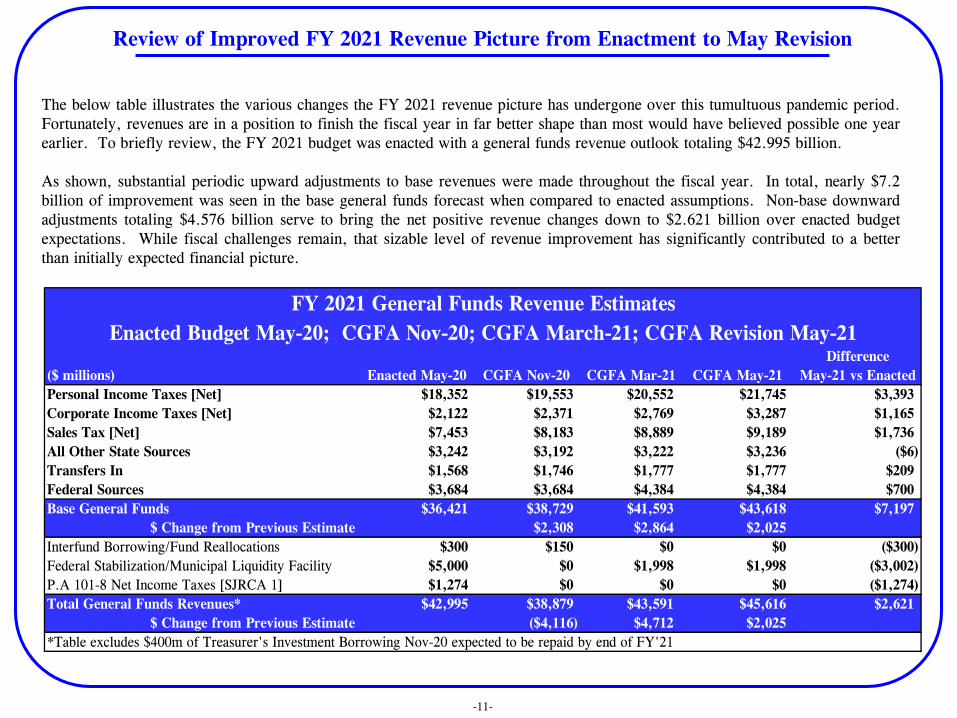
The below table illustrates the various changes the FY 2021 revenue picture has undergone over this tumultuous pandemic period.
Fortunately, revenues are in a position to finish the fiscal year in far better shape than most would have believed possible one year
earlier. To briefly review, the FY 2021 budget was enacted with a general funds revenue outlook totaling $42.995 billion.
As shown, substantial periodic upward adjustments to base revenues were made throughout the fiscal year. In total, nearly $7.2
billion of improvement was seen in the base general funds forecast when compared to enacted assumptions. Non-base downward
adjustments totaling $4.576 billion serve to bring the net positive revenue changes down to $2.621 billion over enacted budget
expectations. While fiscal challenges remain, that sizable level of revenue improvement has significantly contributed to a better
than initially expected financial picture.
Difference
($ millions) Enacted May-20 CGFA Nov-20 CGFA Mar-21 CGFA May-21 May-21 vs Enacted
Personal Income Taxes [Net] $18,352 $19,553 $20,552 $21,745 $3,393
Corporate Income Taxes [Net] $2,122 $2,371 $2,769 $3,287 $1,165
Sales Tax [Net] $7,453 $8,183 $8,889 $9,189 $1,736
All Other State Sources $3,242 $3,192 $3,222 $3,236 ($6)
Transfers In $1,568 $1,746 $1,777 $1,777 $209
Federal Sources $3,684 $3,684 $4,384 $4,384 $700
Base General Funds $36,421 $38,729 $41,593 $43,618 $7,197
$ Change from Previous Estimate $2,308 $2,864 $2,025
Interfund Borrowing/Fund Reallocations $300 $150 $0 $0 ($300)
Federal Stabilization/Municipal Liquidity Facility $5,000 $0 $1,998 $1,998 ($3,002)
P.A 101-8 Net Income Taxes [SJRCA 1] $1,274 $0 $0 $0 ($1,274)
Total General Funds Revenues* $42,995 $38,879 $43,591 $45,616 $2,621
$ Change from Previous Estimate ($4,116) $4,712 $2,025
*Table excludes $400m of Treasurer's Investment Borrowing Nov-20 expected to be repaid by end of FY'21
FY 2021 General Funds Revenue Estimates
Enacted Budget May-20; CGFA Nov-20; CGFA March-21; CGFA Revision May-21

Updated CGFA FY 2022 General Funds Forecast [per Current Law]
-12-
As shown, the Commission’s May revised FY 2022 base general funds estimate of $41.188 billion reflects an increase of $792
million from our March forecast. Unsurprisingly, most of the upward revision resides in the larger economically-related sources
such as income and sales. It should be noted that the upward revision for the upcoming fiscal year is comparatively much lower
than the adjustments undertaken in the revised outlook for FY 2021. While a limited incorporation of the previous year’s improved
base performance is utilized, the majority of FY 2021 revisions cannot be assumed to repeat or be considered “baseable” for FY
2022. This is in large part due to timing and historical receipt pattern disruptions brought about by the pandemic’s impact, as well
as year over year growth headwinds likely to result as the various stimulus packages begin to unwind. Highlights and discussion of
the updated FY 2022 forecast follow.
($ millions) March-21 May-21 Difference
Personal Income Taxes [Net] $20,106 $20,753 $647
Corporate Income Taxes [Net] $2,565 $2,647 $82
Sales Tax [Net] $9,018 $9,214 $196
All Other State Sources $3,051 $3,068 $17
Transfers In $1,685 $1,535 ($150)
Federal Sources $3,971 $3,971 $0
Base General Funds $40,396 $41,188 $792
Interfund Borrowing/Fund Reallocations $0 $0 $0
Federal Stabilization/Municipal Liquidity Facility $0 $0 $0
Total General Funds Revenues $40,396 $41,188 $792
Updated FY 2022 General Funds Revenue
CGFA Estimates [per Current Law]

Updated CGFA FY 2022 General Funds Forecast [per Current Law] (continued)
-13-
Personal Income Taxes- The FY 2022 estimate of personal income tax receipts is being revised up $647 million on a net
basis. While the updated forecast reflects a measurable improvement from the March estimate due to continued recovery
and lessening uncertainty, the gain is proportionately much less than the upward adjustment made to the FY 2021 outlook.
As mentioned earlier, receipt timing and deviations from historical receipt patterns are factors. Similar to corporate
income tax, some of the current year final payments are considered more of a “catch up” related to weaker estimated
payments made during the height of the spring 2020 [FY 2020] COVID-19 crisis. As a result, the higher than expected
final payments being made this spring cannot fully be extrapolated into next year’s base forecast. Another reason that FY
2022 is not expected to have the same level of improvement as the current year’s adjustment is due to the current
additional $300/wk unemployment benefits that are scheduled to sunset in early September. While an improved job picture
will serve to mitigate the overall effects on income taxes, some downward pressure on overall withholding growth is
expected to be felt as the enhanced benefits expire.
Corporate Income Taxes- The FY 2022 estimate of corporate income tax receipts is being increased $82 million on a net
basis, considerably less than the $667 million upward revision made to the current fiscal year’s forecast. To repeat earlier
comments, to the extent final FY 2021 corporate receipts were impacted by a reconciliation of underpaid estimated
payments made during the pandemics initial months dating back to the second half of FY 2020, a cautious view is utilized
extrapolating that over performance into next year’s tax base.
Sales Taxes- The FY 2022 estimate of sales taxes has been adjusted upward by $196 million on a net basis. Again, the
magnitude of upward adjustment is less than the $300 million revision being made to the FY 2021 forecast. The
proportionately more modest revision stems from the view that as the effects of the various stimulative policies begin to
wind down and work through the economy, a moderation in growth will occur as the fiscal year progresses.

Updated CGFA FY 2022 General Funds Forecast [per Current Law] (continued)
-14-
Transfers In- The FY 2022 estimate of
transfers into the general funds has been
reduced $150 million from the previous
outlook. The downward revision reflects the
elimination of $150 million of expected
transfers in FY 2022 from the Income Tax
Refund Fund. As a consequence of the recent
federal change in deductibility of $10k of
unemployment benefits made mid-final filing
season, increased refund liability from
amended returns will likely result. While the
net effect of that tax policy decision at the
federal level is not precisely known, the
IDoR’s preliminary estimate was
approximately the same magnitude [$150m].
All Other Sources- The estimates of all other
state sources have been increased by a modest
net $17 million. While there are some slight
changes to some of the individual revenue
lines, little overall change from the earlier
outlook is forecasted.
Federal Sources- No adjustments are being
made to the FY 2022 estimate of federal
sources. As mentioned, appropriation
authority, available cash, vouchers processed
for payment, and ultimately payment decisions
made at the Comptroller’s office will
determine federal source performance.
FY 2022 FY 2022
CGFA CGFA $
Revenue Sources March-21 May-21 Difference
State Taxes
Personal Income Tax $23,584 $24,344 $760
Corporate Income Tax (regular) $3,240 $3,343 $103
Sales Taxes $9,486 $9,692 $206
Public Utility (regular) $751 $748 ($3)
Cigarette Tax $272 $267 ($5)
Liquor Gallonage Taxes $179 $179 $0
Vehicle Use Tax $30 $30 $0
Inheritance Tax $325 $345 $20
Insurance Taxes & Fees $416 $416 $0
Corporate Franchise Tax & Fees $185 $205 $20
Interest on State Funds & Investments $70 $55 ($15)
Cook County Intergovernmental Transfer $244 $244 $0
Other Sources $579 $579 $0
Subtotal $39,361 $40,447 $1,086
Transfers
Lottery $755 $755 $0
Riverboat transfers and receipts $98 $98 $0
Proceeds from sale of 10th license $10 $10 $0
Refund Fund $150 $0 ($150)
Other $672 $672 $0
Total State Sources $41,046 $41,982 $936
Federal Sources [Base] $3,971 $3,971 $0
Subtotal Federal & State Sources $45,017 $45,953 $936
Nongeneral Funds Distribution:
Refund Fund
Personal Income Tax [9% '21; 9.25% '22] ($2,181) ($2,252) ($71)
Corporate Income Tax [14% '21; 15% '22] ($486) ($501) ($15)
Local Government Distributive Fund
Personal Income Tax ($1,297) ($1,339) ($42)
Corporate Income Tax ($189) ($195) ($6)
Sales Tax Distribution to the PTF and DPTF ($468) ($478) ($10)
Base General Funds $40,396 $41,188 $792
Interfund Borrowing/Fund Reallocations $0 $0 $0
Federal Stabilization/Municipal Liquidity Facility $0 $0 $0
Total General Funds Revenues $40,396 $41,188 $792
Updated FY 2022 General Funds Revenue
CGFA Estimates [per Current Law](millions)

-15-
Actual Actual Actual Actual Actual Actual Actual Actual Estimated Estimated
Receipts Receipts Receipts Receipts Receipts Receipts Receipts Receipts Receipts Receipts
Revenue Sources FY 2013 FY 2014 FY 2015 FY 2016 FY 2017 FY 2018 FY 2019 FY 2020 FY 2021 FY 2022
State Taxes
Personal Income Tax $18,323 $18,388 $17,682 $15,299 $15,385 $20,784 $22,604 $21,657 $25,437 $24,344
Corporate Income Tax (regular) 3,679 3,640 3,129 2,334 1,610 2,607 3,026 2,596 4,103 3,343
Sales Taxes 7,355 7,676 8,030 8,063 8,043 8,256 8,897 8,691 9,623 9,692
Public Utility Taxes (regular) 1,033 1,013 1,006 926 884 896 863 831 754 748
Cigarette Tax 353 353 353 353 353 344 361 267 275 267
Liquor Gallonage Taxes 165 165 167 170 171 172 172 177 178 179
Vehicle Use Tax 27 29 32 30 30 28 31 26 35 30
Inheritance Tax (Gross) 293 276 333 306 261 358 388 283 440 345
Insurance Taxes and Fees 334 333 353 398 391 432 396 361 469 416
Corporate Franchise Tax & Fees 205 203 211 207 207 207 247 210 298 205
Interest on State Funds & Investments 20 20 24 24 36 79 145 137 55 55
Cook County Intergovernmental Transfer 244 244 244 244 244 244 244 244 244 244
Other Sources 462 585 693 534 685 641 669 725 488 579
Subtotal $32,493 $32,925 $32,257 $28,888 $28,300 $35,048 $38,043 $36,205 $42,399 $40,447
Transfers
Lottery 656 668 679 677 720 719 731 630 745 755
Gaming Fund Transfer [and related] 360 331 302 287 280 282 279 205 10 108
Other 688 1,113 2,012 627 552 1,186 1,035 1,606 1,022 672
Total State Sources $34,197 $35,037 $35,250 $30,479 $29,852 $37,235 $40,088 $38,646 $44,176 $41,982
Federal Sources $4,154 $3,903 $3,330 $2,665 $2,483 $5,238 $3,600 $3,551 $4,384 $3,971
Total Federal & State Sources $38,351 $38,940 $38,580 $33,144 $32,335 $42,473 $43,688 $42,197 $48,560 $45,953
Nongeneral Funds Distribution:
Refund Funds/Direct Deposits
Personal Income Tax Refund Fund ($1,785) ($1,746) ($1,769) ($1,493) ($1,724) ($2,037) ($2,193) ($2,058) ($2,289) ($2,252)
Corporate Income Tax Refund Fund (502) (476) (439) (362) (278) (457) (470) (370) (574) (501)
Fund for Advancement of Education 0 0 (242) (458) (464) 0 0 0 0 0
Commitment to Human Services Fund 0 0 (242) (458) (464) 0 0 0 0 0
LGDF--Direct from PIT 0 0 0 0 0 (1,022) (1,175) (1,128) (1,403) (1,339)
LGDF--Direct from CIT 0 0 0 0 0 (133) (167) (145) (242) (195)
Downstate Pub/Trans--Direct from Sales 0 0 0 0 0 (446) (488) (436) (434) (478)
Subtotal General Funds $36,064 $36,718 $35,888 $30,373 $29,405 $38,378 $39,195 $38,060 $43,618 $41,188
Change from Prior Year $2,267 $654 ($830) ($5,515) ($968) $8,973 $817 ($1,135) $5,558 ($2,430)
Percent Change 6.7% 1.8% -2.3% -15.4% -3.2% 30.5% 2.1% -2.9% 14.6% -5.6%
Short-Term Borrowing/MLF $0 $0 $0 $0 $0 $0 $0 $1,198 $1,998 $0
Treasurer's Investments $0 $0 $0 $0 $0 $0 $750 $400 $400 $0
Interfund Borrowing $0 $0 $454 $0 $0 $533 $250 $462 $0 $0
Income Tax Bond Fund Transfer $0 $0 $0 $0 $0 $2,500 $0 $0 $0 $0
Transfer to Commitment Human Services $0 $0 $0 $0 $0 $40 $0 $0 $0 $0
FY'13/14 Backlog Payment Fund Transfer $264 $50 $0 $0 $0 $0 $0 $0 $0 $0
Budget Stabilization Fund Transfer $275 $275 $275 $125 $0 $0 $0 $0 $0 $0
Total General Funds $36,603 $37,043 $36,617 $30,498 $29,405 $41,451 $40,195 $40,120 $46,016 $41,188
Change from Prior Year $2,531 $440 ($426) ($6,119) ($1,093) $12,046 ($1,256) ($75) $5,896 ($4,828)
Percent Change 7.4% 1.2% -1.2% -16.7% -3.6% 41.0% -3.0% -0.2% 14.7% -10.5%
Detailed General Funds Revenue History FY 2013 - FY 2020 and Estimated FY 2021-22 [Current Law May-21]($ millions)

-16-

-17-
APPENDIX A
THE ECONOMY

-36.0-32.0-28.0-24.0-20.0-16.0-12.0-8.0-4.00.04.08.0
12.016.020.024.028.032.036.040.0
1 2 3 4 1 2 3 4 1 2 3 4 1 2 3 4 1 2 3 4 1 2 3 4 1 2 3 4 1 2 3 4 1 2 3 4 1 2 3 4 1 2 3 4 1 2 3 4 1 2 3 4 1 2 3 4
% C
hange
in R
eal G
DP
U.S. REAL GDP(Calendar Years)
| 08 | 09 | 10 | 11 | 12 | 13 | 14 | 15 | 16 | 17 | 18 | 19 | 20 | 21
U.S. Department of Commerce, Bureau of Economic Analysis
Q2 2020-31.4%
Q4 2008-8.4%
Q3 202033.4%
Change in Real GDP
-18-
• The economy declined -5.0% in
the first quarter of 2020 as the
economy began to erode as the
COVID-19 pandemic spread.
• The second quarter declined over
31% on an annualized basis,
which was the worst quarter for
real GDP since tracking began in
1947.
• Third quarter growth of 33.4%
reflected a rebound in GDP due
to the reopening of the economy
and the significantly smaller base
established in the 2nd quarter.
• 2020 ended with growth of 4.3%
in the fourth quarter.
• Preliminary results for the first
quarter of 2021 indicated a
strengthening economy with
growth of 6.4%.
• An aggregation of economic
forecasts has a mean estimate for
real GDP growth of 6.2% for
2021 and 4.1% for 2022.

20
30
40
50
60
70
80
MANUFACTURINGPURCHASING MANAGERS INDEX (PMI)
(Above 50 indicates expansion)
US
Chicago
Institute for Supply Management
Manufacturing PMI
-19-
• This chart shows the Purchasing
Managers Index (PMI) for the
manufacturing sector. A value of 50 or
more meaning expansion and below 50
a contraction.
• The Manufacturing PMI index is based
on five major indicators: new orders,
inventory levels, production, supplier
deliveries and the employment
environment.
• Similar to real GDP, the Manufacturing
PMI declined precipitously during the
spring of 2020 due to COVID-19.
• However, since May of 2020, the index
has been indicating expansion.
Currently, the Manufacturing PMI
stands at 60.7 that is a little below
March’s 64.7 which was the highest
level since the early 1980’s.
• Even at these levels, some issues still
remain. While demand for
manufacturing goods is up, the supply
of parts and materials is being
hampered by COVID-19 and associated
issues within supply chains (extended
lead times, wide-scale shortages of
basic materials, rising commodity
prices, and transportation difficulties).

30
35
40
45
50
55
60
65
70
SERVICES PURCHASING MANAGERS INDEX (PMI)
(Above 50 indicates expansion)
Institute for Supply Management
Services PMI
-20-
• The Services PMI (previously
known as the Non-Manufacturing
Index) is a composite index that
is calculated as an indicator of
the overall economic condition
for the non-manufacturing sector,
which is far larger than the
manufacturing sector
(representing over 80% of GDP).
• The Service PMI is a composite
index based on the diffusion
indexes for four of the indicators
with equal weights: business
activity, new orders, and
employment – all of which are
seasonally adjusted – and
supplier deliveries.
• Similar to the Manufacturing
PMI, the Services PMI saw a
large decline during the spring
due to COVID-19 but rebounded
over the summer.
• The Services PMI currently
stands at 62.7 which is just below
the all-time high of 63.7 in
March.

-3.0%
-2.0%
-1.0%
0.0%
1.0%
2.0%
3.0%
4.0%
5.0%
6.0%
Jan-0
9
Jul-
09
Jan-1
0
Jul-
10
Jan-1
1
Jul-
11
Jan-1
2
Jul-
12
Jan-1
3
Jul-
13
Jan-1
4
Jul-
14
Jan-1
5
Jul-
15
Jan-1
6
Jul-
16
Jan-1
7
Jul-
17
Jan-1
8
Jul-
18
Jan-1
9
Jul-
19
Jan-2
0
Jul-
20
Jan-2
1
Jul-
21
Jan-2
2
U.S. vs. ChicagoCPI-U
U.S. ChicagoBureau of Labor Statistics
-3.0%
-2.0%
-1.0%
0.0%
1.0%
2.0%
3.0%
4.0%
5.0%
6.0%
Jan-0
9
Jul-
09
Jan-1
0
Jul-
10
Jan-1
1
Jul-
11
Jan-1
2
Jul-
12
Jan-1
3
Jul-
13
Jan-1
4
Jul-
14
Jan-1
5
Jul-
15
Jan-1
6
Jul-
16
Jan-1
7
Jul-
17
Jan-1
8
Jul-
18
Jan-1
9
Jul-
19
Jan-2
0
Jul-
20
Jan-2
1
Jul-
21
Jan-2
2
U.S. Consumer Price Index (CPI-U)
CPI CPI less Food & EnergyBureau of Labor Statistics
Consumer Price Index (CPI)
-21-
• The Consumer Price Index (CPI) is a
measure of the average change over time in
the prices paid by urban consumers for a
market basket of consumer goods and
services.
• The first chart shows the CPI for the U.S.
as well as the CPI without food and energy
included, which are two of the more
volatile components of the index.
• While there was some price volatility
around the time of the Great Recession, it
was mostly steady between 1.5% to 2.0%
between 2012 and 2017, especially when
food and energy were removed.
• The growth of consumer prices slowed due
to COVID-19 but did not lead to actual
price declines in general. Both measures
rebounded but had remained below 2.0%.
• In March of 2021, CPI for the U.S. was
2.6% which was the highest level since
August of 2018. Core CPI, which excludes
food and energy, remained lower at 1.6%.
• Expectations are for inflation to continue to
increase in the short-term.

-20%
-15%
-10%
-5%
0%
5%
10%
15%
20%
Jan-0
9
Jul-
09
Jan-1
0
Jul-
10
Jan-1
1
Jul-
11
Jan-1
2
Jul-
12
Jan-1
3
Jul-
13
Jan-1
4
Jul-
14
Jan-1
5
Jul-
15
Jan-1
6
Jul-
16
Jan-1
7
Jul-
17
Jan-1
8
Jul-
18
Jan-1
9
Jul-
19
Jan-2
0
Jul-
20
Jan-2
1
Jul-
21
Jan-2
2
Producer Price Index (Dec. 1984 = 100)
Total Manufacturing Industries All CommoditiesBureau of Labor Statistics
Producer Price Index (PPI)
-22-
• The Producer Price Index (PPI)
measures the average change over
time in the selling prices received
by domestic producers for their
output. The prices included in the
PPI are from the first commercial
transaction for many products and
some services.
• Similar to the CPI, the PPI
showed some heightened inflation
pressure at the wholesale level in
the summer of 2018.
• Since that time, the PPI steadily
slowed with actual declines in
prices beginning in May of 2019.
• A small rebound in producer
prices seen in early 2020 was put
to an end by the effects of
COVID-19.
• After declining in the spring of
2020, producer prices have
rebounded in recent months to
levels not seen since 2011.

150,000
160,000
170,000
180,000
190,000
200,000
210,000
220,000
230,000
240,000
Jan-12 Jan-13 Jan-14 Jan-15 Jan-16 Jan-17 Jan-18 Jan-19 Jan-20 Jan-21 Jan-22
U.S. ADVANCE RETAIL AND FOOD SERVICES
SALESSeasonally-Adjusted, Millions of 1982-84 CPI Adjusted Dollars
U.S. Census Bureau/FRED
Retail Sales
-23-
• The U.S. Census Bureau conducts the
Advance Monthly Retail Trade and
Food Services Survey to provide an
early estimate of monthly sales by
kind of business for retail and food
service firms.
• Retail sales are sales by businesses
that sell goods in small quantities
directly to consumers.
• Based on the data, it shows that
consumer goods spending had a V-
shaped recovery.
• Consumer goods spending was likely
buoyed by financial support from the
federal government. This support
appears likely to continue in the near-
term.
• While consumer spending on goods
has rebounded, the rebound in
services, which is approximately
twice as large, has been slower.
Estimates from the Bureau of
Economic Analysis had consumer
spending about 3.1% below pre-
pandemic levels.

10-Year Treasury Rate
-24-
• The 10-year Treasury rate is a key rate tied to
many transactions, particularly home
mortgages, and is considered as an indicator of
investor sentiment about the U.S. economy.
• When the investors’ confidence in the economy
grows, investors tend to seek higher return
investments with higher risks than treasury
bonds. Then, the falling demand decreases the
prices and increases the yield (rate). It is the
opposite when the confidence falls.
• The 10-year treasury rate has been erratic. It
went up to 3.25% in 2018 and gradually
declined afterward. Prior to the COVID-19
recession that started in March of 2020, it was
between 1.5% and 2.0%.
• When the coronavirus pandemic hit the U.S.
economy, the rate sharply dropped to nearly as
low as 0.5% in March and fluctuated until the
fall.
• Since then, the treasury rate has increased as
the economy has improved, due in part to the
substantial COVID-19 relief packages and
improved expectations about the COVID-19
situation. As of end of April, it is now around
1.6%.
0.00
0.25
0.50
0.75
1.00
1.25
1.50
1.75
2.00
2.25
2.50
2.75
3.00
3.25
3.50
Percent
10-Year Treasury Rate(Not seasonally adjusted)
Source: Federal Reserve Economic Data (FRED)

Illinois Exports
-25-
• Illinois exports, while erratic, started to
reverse its downward slope in early 2016 and
began to grow.
• Illinois exports surprisingly reached its highest
peak since late 2014 at $5.92 billion in mid-
2018 despite uncertainties such as trade
conflicts between the U.S. and other
countries. Since then, it declined in a volatile
manner and went down further as the COVID-
19 outbreak began.
• It fell to its lowest monthly level since early
2010 at $3.69 billion in April of 2020. This
was 24% down from the previous month or a
30% drop compared to a year ago.
• After this steep decline, a rebound was seen
due in part to reopening of the economy.
Especially, the most recent data for March
2021, shows the strong exports of $5.62
billion, 16.5% up from the previous month, or
15.0% up from an year earlier.
• While the export demand from Illinois has
been damaged during the pandemic, Illinois
was able to improve to the 5th largest state in
exports from 6th as other states were
struggling as well.
3.5
4.0
4.5
5.0
5.5
6.0
6.5
7.0
Jan-1
5
Apr-
15
Jul-
15
Oct
-15
Jan-1
6
Apr-
16
Jul-
16
Oct
-16
Jan-1
7
Apr-
17
Jul-
17
Oct
-17
Jan-1
8
Apr-
18
Jul-
18
Oct
-18
Jan-1
9
Apr-
19
Jul-
19
Oct
-19
Jan-2
0
Apr-
20
Jul-
20
Oct
-20
Jan-2
1
Apr-
21
Jul-
21
Billions
Illinois Exports
U.S. Census

120
125
130
135
140
145
150
155
160
165
170
Jan-0
8
Jul-
08
Jan-0
9
Jul-
09
Jan-1
0
Jul-
10
Jan-1
1
Jul-
11
Jan-1
2
Jul-
12
Jan-1
3
Jul-
13
Jan-1
4
Jul-
14
Jan-1
5
Jul-
15
Jan-1
6
Jul-
16
Jan-1
7
Jul-
17
Jan-1
8
Jul-
18
Jan-1
9
Jul-
19
Jan-2
0
Jul-
20
Jan-2
1
Jul-
21
Millions
United States Employment(Seasonally-Adjusted)
U.S. Department of Labor, Bureau of Labor Statistics
United States Employment
-26-
• Since a low reached at the end of 2009,
United States employment had continuously
increased and finally recouped all the jobs
lost during the Great Recession in 5 years
and maintained the upward trend until
COVID-19 hurt the national economy.
• Due to social distancing and restrictions on
economic activities to contain the spread of
COVID-19, U.S. employment lost
approximately 20 to 22 million jobs in
April, the worst month since the Great
Depression.
• In the 3rd quarter of 2020, the U.S.
economy significantly rebounded, and thus
more than half of lost jobs were regained.
• With the substantial stimulus packages by
Congress and Fed’s monetary policies,
along with increasing the availability of
vaccinations, U.S. employment has further
improved. In March 2021, the U.S. added
916,000 jobs (Establishment Survey), which
was significantly higher than expected.
However, it is still below the pre-pandemic
levels.
Household Survey
Establishment Survey

4,800
5,000
5,200
5,400
5,600
5,800
6,000
6,200
6,400
6,600
6,800
Jan-0
8
Jul-
08
Jan-0
9
Jul-
09
Jan-1
0
Jul-
10
Jan-1
1
Jul-
11
Jan-1
2
Jul-
12
Jan-1
3
Jul-
13
Jan-1
4
Jul-
14
Jan-1
5
Jul-
15
Jan-1
6
Jul-
16
Jan-1
7
Jul-
17
Jan-1
8
Jul-
18
Jan-1
9
Jul-
19
Jan-2
0
Jul-
20
Jan-2
1
Jul-
21
Thousands
Illinois Employment(Seasonally-Adjusted)
Illinois Employment
-27-
• Like the U.S., Illinois employment
experienced a severe drop due to the
COVID-19 outbreak.
• The Establishment Survey showed the job
losses that Illinois employment
experienced during the 2007-2009
recessions finally recovered around mid-
2015. However, the improvement was
completely erased by the effects of
COVID-19 in early 2020.
• Illinois employment was hit hardest in
April, which synced with the sharp drop
in U.S. employment. Establishment
Survey and Household Survey showed
Illinois jobs declined by 13% and 18%,
respectively in April, which were the
biggest drops on record.
• Since then, it has rebounded as the Illinois
economy slowly reopened. However, it is
still significantly below where it was
previously.
Household Survey
Establishment Survey

Illinois Manufacturing Employment
-28-
• The weakness in Illinois employment has
centered in the manufacturing area. After
experiencing a severe loss during the
Great Recession, Illinois manufacturing
employment finally began to improve
around 2010. A few years later,
however, it leveled out, followed by a
decline in early 2019.
• Then, it significantly dropped further
after the pandemic hit. In April 2020, the
State lost approximately 45,800
manufacturing jobs over the previous
month, the largest monthly decline on
record.
• Since then, it quickly picked up again but
remains well below previous levels.
• IHS Markit projects that the State’s
manufacturing employment would slowly
improve beginning in mid-2021.
500
520
540
560
580
600
620
640
660
680
700
Jan-0
7
Jul-
07
Jan-0
8
Jul-
08
Jan-0
9
Jul-
09
Jan-1
0
Jul-
10
Jan-1
1
Jul-
11
Jan-1
2
Jul-
12
Jan-1
3
Jul-
13
Jan-1
4
Jul-
14
Jan-1
5
Jul-
15
Jan-1
6
Jul-
16
Jan-1
7
Jul-
17
Jan-1
8
Jul-
18
Jan-1
9
Jul-
19
Jan-2
0
Jul-
20
Jan-2
1
Jul-
21
Thousands
Illinois Manufacturing Employment(Seasonally-Adjusted)
U.S. Department of Labor, Bureau of Labor Statistics

Unemployment Rates
-29-
• As shown in the chart, the gap
between the nation’s unemployment
rate and that in Illinois has fluctuated
over time, but they usually move in the
same direction.
• As the U.S. economy was in its
longest expansion, unemployment rates
for both had declined as the recovery
from the Great Recession got
underway.
• However, the COVID-19 outbreak
caused severe damage to the economy,
both at the national and state levels. In
April, the unemployment rates for the
U.S. and the State surged to 14.8%
and 16.5% respectively, the highest
and largest monthly percentage
increase in the history of the data.
• As the economic activities picked up,
the rates went down as well. In March
2021, the unemployment rates for the
U.S. and Illinois stood at 6.0% and
7.1%, respectively.
0.0
2.0
4.0
6.0
8.0
10.0
12.0
14.0
16.0
18.0
Jan-0
8
Jul-
08
Jan-0
9
Jul-
09
Jan-1
0
Jul-
10
Jan-1
1
Jul-
11
Jan-1
2
Jul-
12
Jan-1
3
Jul-
13
Jan-1
4
Jul-
14
Jan-1
5
Jul-
15
Jan-1
6
Jul-
16
Jan-1
7
Jul-
17
Jan-1
8
Jul-
18
Jan-1
9
Jul-
19
Jan-2
0
Jul-
20
Jan-2
1
Jul-
21
Percent
Unemployment Rates
U.S. Department of Labor, Bureau of Labor Statistics
ILLINOIS
UNITED
STATES

Comparative Unemployment Rates
-30-
• The chart shows comparative
unemployment rates for the nation,
Midwest, and Illinois.
• In 2008, Midwest and Illinois rates were
similar and only slightly higher than the
nation. However, beginning in 2009, the
difference in the rates between Illinois and
the others widened. Since 2010,
unemployment in the Midwest fell below
or at the national level as resurgence in
several “rust belt” states from increased
energy production caused an employment
spurt.
• More than a decade after trying to catch
up with both the nation and Midwest,
Illinois finally succeeded to lessen the gap
until COVID-19 hit. The rates in April
were at least four times higher than where
they were prior to the pandemic.
• Since April 2020, the labor market has
improved nationwide. The recent data as
of March of 2021 had the national and
Midwest rate at 6.0% and 4.8%,
respectively, and the Illinois rate at 7.1%.
2008 2009 2010 2011 2012 2013 2014 2015 2016 2017 2018 2019 20202021
(Mar)
U.S. 7.3 9.9 9.3 8.5 7.9 6.7 5.6 5.0 4.7 4.1 3.9 3.6 6.7 6.0
Midwest 7.6 10.1 8.8 7.8 7.4 6.7 5.2 4.7 4.5 3.9 3.8 3.5 5.7 4.8
Illinois 7.9 11.4 9.7 9.5 9.1 8.6 6.2 6.1 5.4 4.7 4.5 3.5 8.0 7.1
0.0
2.0
4.0
6.0
8.0
10.0
12.0
Percent
Comparative Unemployment RatesYear End
U.S. Department of Labor, Bureau of Labor Statistics

-31-
Illinois Employment Performance By Subsector
-32-
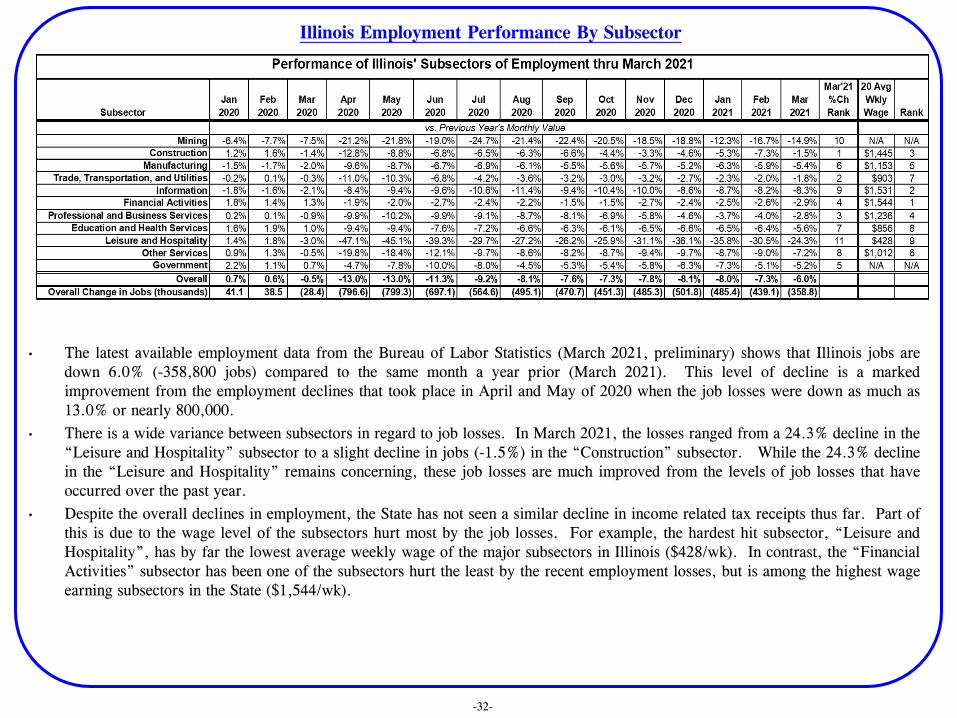
• The latest available employment data from the Bureau of Labor Statistics (March 2021, preliminary) shows that Illinois jobs are
down 6.0% (-358,800 jobs) compared to the same month a year prior (March 2021). This level of decline is a marked
improvement from the employment declines that took place in April and May of 2020 when the job losses were down as much as
13.0% or nearly 800,000.
• There is a wide variance between subsectors in regard to job losses. In March 2021, the losses ranged from a 24.3% decline in the
“Leisure and Hospitality” subsector to a slight decline in jobs (-1.5%) in the “Construction” subsector. While the 24.3% decline
in the “Leisure and Hospitality” remains concerning, these job losses are much improved from the levels of job losses that have
occurred over the past year.
• Despite the overall declines in employment, the State has not seen a similar decline in income related tax receipts thus far. Part of
this is due to the wage level of the subsectors hurt most by the job losses. For example, the hardest hit subsector, “Leisure and
Hospitality”, has by far the lowest average weekly wage of the major subsectors in Illinois ($428/wk). In contrast, the “Financial
Activities” subsector has been one of the subsectors hurt the least by the recent employment losses, but is among the highest wage
earning subsectors in the State ($1,544/wk).

Decline In Illinois Jobs
-33-
• The graph above displays the immediate impact that the COVID-19 pandemic has had on Illinois jobs, starting in April 2020.
It also shows how the falloff slowed from its initial decline, but worsened at the end of the year. State-imposed restrictions on
various businesses in response to the virus has contributed to this fluctuation.
• Also shown is the variance in the levels of declines by subsector. Here, the drastic impact on job levels in the lower-paying
“Leisure and Hospitality” subsector can clearly be seen. In March 2021, jobs in this subsector made up 7.8% of total Illinois
jobs. However, 39.4% of the lost jobs (as compared to a year ago) came from this sector of employment.

-34-
A contributing factor to why income tax revenues have continued to perform well, despite the declines in employment, is due to the tax
revenues received from unemployment benefits paid in Illinois, which skyrocketed after the pandemic began.
All of the unemployment benefits that a resident receives are subject to taxation (with the exception of the first $10k of 2020 benefits),
and are included on the Department of Revenue’s Form 941. As highlighted in the chart, between April 2019 and March 2020, income
tax revenues from Form 941 amounted to $454.5 million. During the virus-impacted months of April 2020 thru March 2021, the
amount grew to $1.197 billion, a 163.3% increase compared to the prior year. Comparatively, “regular” withholding (Form 501) only
increased 0.3% during this time frame.
When combined, total withholding receipts are up +4.5% for this time period. The bottom line is that, though unemployment has
escalated during the pandemic, the taxation of unemployment benefits has minimized the impact on Illinois’ tax revenues, acting like a
buoy and keeping withholding tax receipts at levels higher than otherwise would be expected given the jobs picture.
-35-
ECONOMIC FORECASTS
APPENDIX B

2018 2019 2020 2021 2022
Actual Actual Actual Forecast Forecast
Real GDP* 3.0% 2.2% -3.5% 6.2% 4.1%
Nominal GDP* 5.5% 4.0% -2.3% 8.5% 6.5%
Real Disposable Personal Income* 3.6% 2.2% 5.8% 3.0% -1.2%
Real Personal Consumption* 2.7% 2.4% -3.9% 7.1% 4.4%
Real Government Consumption and Investment* 1.8% 2.3% 1.1% 1.2% 1.7%
Real Business Investment* 6.9% 2.9% -4.0% 7.5% 5.9%
Nominal Pre-tax Profits* 6.1% 0.3% -5.8% 13.4% 5.7%
Consumer Prices* 2.4% 1.8% 1.2% 2.6% 2.3%
Core PCE Prices (excluding Food/Energy)* 2.0% 1.7% 1.4% 1.9% 2.1%
Producer Prices* 3.0% 0.8% -1.3% 4.1% 2.0%
Employment Costs* 2.8% 2.7% 2.6% 2.7% 2.7%
Auto & Light Truck Sales (inc. imports) mn 17.2 16.9 15.2 16.6 16.8
Housing Starts, mn units 1.25 1.30 1.40 1.54 1.54
Unemployment Rate (%) 3.9% 3.7% 8.1% 5.4% 4.2%
*average % change over previous calendar year
Source: Consensus Economics, April 2021
U.S. ECONOMIC FORECASTS
Economic Indicator
The forecasts presented are the mean forecast from 25 different economic forecasters.
Consensus Forecast
-36-
The Consensus Forecasts – USA report from Consensus Economics summarizes economic
outlooks for the United States from twenty-five different economic forecasters monthly.
These include:
• Econometric Firms (IHS Markit/Moody’s Analytics)
• Professional Business Associations (National Association of Home Builders)
• Academic Institutions (Univ. of Maryland/Georgia State Univ.)
• Individual Businesses (Eaton Corporation/Ford Motor Company)
The following table shows the economic forecasts along with historical data for relevant economic
indicators.

-40.0
-30.0
-20.0
-10.0
0.0
10.0
20.0
30.0
40.0
Q1-2
019
Q2-2
019
Q3-2
019
Q4-2
019
Q1-2
020
Q2-2
020
Q3-2
020
Q4-2
020
Q1-2
021
Q2-2
021
Q3-2
021
Q4-2
021
Q1-2
022
Q2-2
022
Q3-2
022
Q4-2
022
% C
hange
in R
eal G
DP
IHS MARKIT U.S. REAL GDP FORECASTS(Calendar Years)
Real GDP
Baseline (50%)
Pessimistic (25%)
Optimistic (25%)
U.S. Real GDP Forecast Scenarios
-37-
• The BASELINE shows the most
likely scenario with a 50% chance
of occurrence. Real GDP rebounds
6.6% in 2021 as growth marks a
5.3% annual rate in the first quarter,
accelerates to 7.9% in the second,
and 8.1% in the third. Prior peak
GDP is surpassed in May. Growth
slows to 2.7% in 2022 and 2.1% in
2023.
• A more PESSIMISTIC scenario
with a 25% probability has the
recovery stumbling as consumers
hunker down amid a fourth wave.
Real GDP rises 3.6% in 2021 and
only passes the pre-pandemic peak
in the fourth quarter. Growth picks
up to 4.1% in 2022 and slips back to
3.0% in 2023.
• A final 25% likely OPTIMISTIC
scenario has the easing of
containment measures, accelerating
vaccines and still more stimulus
driving a faster recovery. Real
GDP surges 8.0% in 2021, flying
past its previous peak in the second
quarter. GDP rises 3.0% in 2022
and 2.3% in 2023.
IHS MARKIT – APRIL 2021
Baseline (50%) Pessimistic (25%) Optimistic (25%)
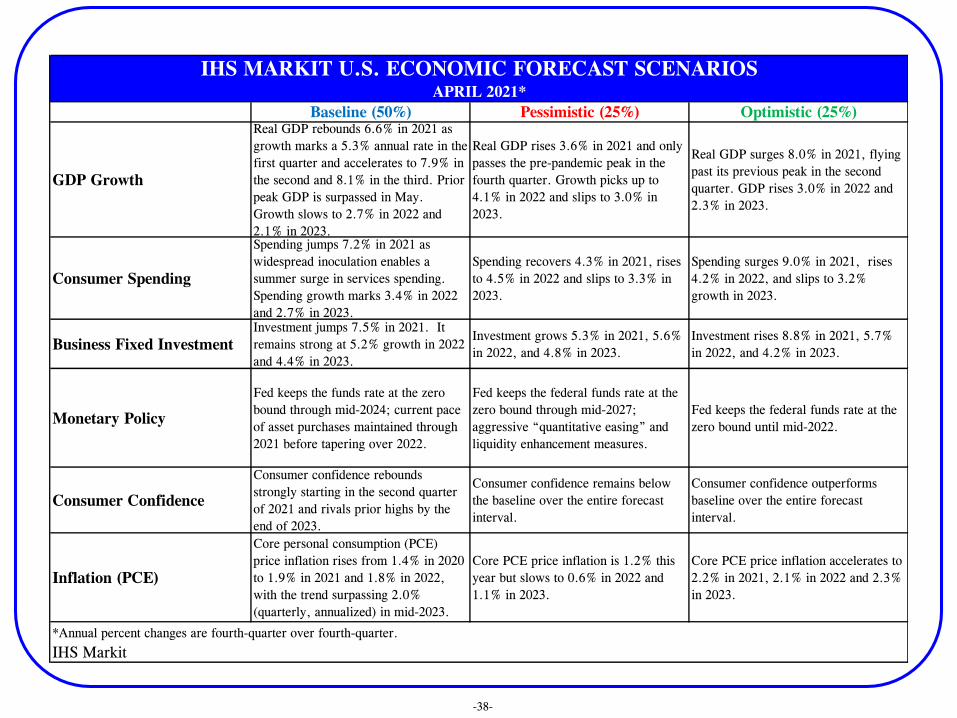
GDP Growth
Real GDP rebounds 6.6% in 2021 as
growth marks a 5.3% annual rate in the
first quarter and accelerates to 7.9% in
the second and 8.1% in the third. Prior
peak GDP is surpassed in May.
Growth slows to 2.7% in 2022 and
2.1% in 2023.
Real GDP rises 3.6% in 2021 and only
passes the pre-pandemic peak in the
fourth quarter. Growth picks up to
4.1% in 2022 and slips to 3.0% in
2023.
Real GDP surges 8.0% in 2021, flying
past its previous peak in the second
quarter. GDP rises 3.0% in 2022 and
2.3% in 2023.
Consumer Spending
Spending jumps 7.2% in 2021 as
widespread inoculation enables a
summer surge in services spending.
Spending growth marks 3.4% in 2022
and 2.7% in 2023.
Spending recovers 4.3% in 2021, rises
to 4.5% in 2022 and slips to 3.3% in
2023.
Spending surges 9.0% in 2021, rises
4.2% in 2022, and slips to 3.2%
growth in 2023.
Business Fixed Investment
Investment jumps 7.5% in 2021. It
remains strong at 5.2% growth in 2022
and 4.4% in 2023.
Investment grows 5.3% in 2021, 5.6%
in 2022, and 4.8% in 2023.
Investment rises 8.8% in 2021, 5.7%
in 2022, and 4.2% in 2023.
Monetary Policy
Fed keeps the funds rate at the zero
bound through mid-2024; current pace
of asset purchases maintained through
2021 before tapering over 2022.
Fed keeps the federal funds rate at the
zero bound through mid-2027;
aggressive “quantitative easing” and
liquidity enhancement measures.
Fed keeps the federal funds rate at the
zero bound until mid-2022.
Consumer Confidence
Consumer confidence rebounds
strongly starting in the second quarter
of 2021 and rivals prior highs by the
end of 2023.
Consumer confidence remains below
the baseline over the entire forecast
interval.
Consumer confidence outperforms
baseline over the entire forecast
interval.
Inflation (PCE)
Core personal consumption (PCE)
price inflation rises from 1.4% in 2020
to 1.9% in 2021 and 1.8% in 2022,
with the trend surpassing 2.0%
(quarterly, annualized) in mid-2023.
Core PCE price inflation is 1.2% this
year but slows to 0.6% in 2022 and
1.1% in 2023.
Core PCE price inflation accelerates to
2.2% in 2021, 2.1% in 2022 and 2.3%
in 2023.
IHS MARKIT U.S. ECONOMIC FORECAST SCENARIOSAPRIL 2021*
IHS Markit
*Annual percent changes are fourth-quarter over fourth-quarter.
-38-

2020
Actual Pessimistic Baseline Optimistic Pessimistic Baseline Optimistic
Gross Domestic Product -2.4% 3.6% 6.6% 8.0% 4.1% 2.7% 3.0%
Personal Consumption -2.7% 4.3% 7.2% 9.0% 4.5% 3.4% 4.2%
Durable 11.6% 1.5% 3.4% 5.3% 0.1% 0.1% 0.9%
Nondurable 4.1% 4.6% 4.1% 5.4% 0.8% 0.3% 1.4%
Services -6.8% 4.7% 8.8% 10.8% 6.5% 4.9% 5.6%
Fixed Investment (Nonresidential) -1.4% 5.3% 7.5% 8.8% 5.6% 5.2% 5.7%
Exports -10.9% 4.5% 6.7% 7.6% 7.4% 6.6% 6.0%
Imports -0.6% 7.3% 9.3% 12.8% 2.5% 2.0% 3.0%
Government
Federal 2.4% 1.6% 1.3% 1.3% -0.5% -1.1% -0.8%
State & Local -2.3% 4.6% 5.4% 5.4% 0.2% -0.2% -0.2%
OTHER MEASURES
Personal Consumption (Current $) -1.5% 5.8% 9.5% 11.6% 4.9% 5.0% 6.1%
Before Tax Profits (Current $) 4.9% -6.1% 6.6% 7.1% 8.9% 3.3% 6.1%
Unemployment Rate (Average Q4) 6.7% 5.2% 4.3% 3.9% 4.6% 3.6% 3.4%
IHS Markit
2021 2022
U.S. FORECASTS -- APRIL 2021(Percent Change of Real 2012 $ on Calendar Year Basis, Q4/Q4 for Annual Rates)
-39-

2020
Pessimistic Baseline Optimistic Pessimistic Baseline Optimistic
Real Gross State Product (Billions 2012$) 757.9 786.8 809.8 819.9 814.3 827.4 839.4
% Change -2.2% 3.8% 6.8% 8.2% 3.5% 2.2% 2.4%
Total Employment (1,000's) 5,649.9 5,885.4 5,962.1 6,004.2 5,986.5 6,091.6 6,116.1
% Change -7.8% 4.2% 5.5% 6.3% 1.7% 2.2% 1.9%
Population (1,000's) 12,546.9 12,495.7 12,495.7 12,495.7 12,475.8 12,475.8 12,475.8
% Change -0.7% -0.4% -0.4% -0.4% -0.2% -0.2% -0.2%
Personal Income (Billions $) 781.6 789.0 805.5 819.2 819.2 840.4 857.1
% Change 4.2% 0.9% 3.1% 4.8% 3.8% 4.3% 4.6%
Private Housing Starts (1,000's) 17.1 19.9 20.7 22.0 18.1 19.2 20.7
% Change -8.4% 16.2% 21.1% 28.4% -8.7% -7.2% -5.9%
Unemployment Rate Average % (Q4) 8.1% 5.9% 5.0% 4.6% 5.0% 4.0% 3.7%
ILLINOIS FORECASTS -- APRIL 2021(Calendar Years, Q4/Q4 for Annual Rates)
IHS Markit
2021 2022
-40-

-41-
DEVELOPMENT OF CGFA ESTIMATES
Econometric Firms—The Commission utilizes the services of IHS Markit, Moody’s Analytics, and Consensus
Economics Inc. They provide a wealth of economic measures and forecasts, both on a national and state specific basis,
which are utilized to varying degrees during the estimating process.
Data Sources—The Commission utilizes actual receipt data via the Comptroller’s warehouse. Additionally, tax
collection data reports prepared by the IDoR, as well as employment and earning reports produced by the Bureau of
Labor Statistics and IDES are also utilized, as are other pertinent data that may be necessary and available.
Forecasting models—Depending on the revenue source being forecasted, model complexity can range from the very
simple to fairly complex. Several smaller sources with relatively low volatility need nothing more than simple trend
analysis to produce accurate forecasts, while the estimates of the larger more economically driven revenue sources such
as income and sales benefit from more sophisticated econometric models which utilize regressions and various time
series techniques.
Application of Adjustments—Often times a base forecast must be adjusted by factors such as tax changes made at either
the federal or state level that will disrupt historical receipt patterns, either by acceleration or delay. A clear example of
this was seen during the pandemic as a one-time delay in the tax deadline date resulted in tax receipts shifting to other
fiscal years. Also, as has been the case in recent years, impacts related to IDOR accounting procedures must also be
included. These are usually one-time phenomena, but must be accounted for by adjusting the estimate. Examples
include tax rates, credits, deductions, exemptions, amnesty, etc.
Review Process and Tests of Reasonableness— Before a forecast is presented, it must pass internal review. In other
words, the forecast must make sense. Any questionable forecast is re-examined for error. Accuracy of the estimates is
reviewed during each forecasting period and, if necessary, appropriate revisions to the models are made in an effort to
improve accuracy.