Embed Size (px)
Citation preview

University of Montana University of Montana
ScholarWorks at University of Montana ScholarWorks at University of Montana
Graduate Student Theses, Dissertations, & Professional Papers Graduate School
2017
Reviewing the Use of Injury Screening Assessments and Reviewing the Use of Injury Screening Assessments and
Identifying Risk of Injury Identifying Risk of Injury
Riley A. Kenney University of Montana, Missoula
Follow this and additional works at: https://scholarworks.umt.edu/etd
Part of the Sports Sciences Commons
Let us know how access to this document benefits you.
Recommended Citation Recommended Citation Kenney, Riley A., "Reviewing the Use of Injury Screening Assessments and Identifying Risk of Injury" (2017). Graduate Student Theses, Dissertations, & Professional Papers. 10924. https://scholarworks.umt.edu/etd/10924
This Professional Paper is brought to you for free and open access by the Graduate School at ScholarWorks at University of Montana. It has been accepted for inclusion in Graduate Student Theses, Dissertations, & Professional Papers by an authorized administrator of ScholarWorks at University of Montana. For more information, please contact [email protected].

REVIEWING THE USE OF INJURY SCREENING ASSESSMENTS AND IDENTIFYING RISK OF INJURY
By
RILEY ALYSE KENNEY
Bachelor of Science, University of Montana, Missoula, Montana, 2017
Professional Paper
presented in partial fulfillment of the requirements for the degree of
Masters of Athletic Training,
The University of Montana Missoula, MT
May 2017
Approved by:
Scott Whittenburg, Dean of The Graduate School
Valerie Moody, Chair
UM Athletic Training
Melanie McGrath, Committee Member
UM Athletic Training
Ryan Mizner, Committee Member
UM School of Physical Therapy and Rehabilitation Science

ABSTRACT
Kenney, Riley, MAT, May 2017 Athletic Training
REVIEWING THE USE OF INJURY SCREENING ASSESSMENTS AND IDENTIFYING RISK OF INJURY
Lower extremity injures account for over half of reported sports related injuries with the ankle
and knee being the most commonly injured joints. The majority of non-contact injuries related
to these two joints can potentially be prevented through individualized prevention programs.
Biomechanical injury screening has the potential to identify the risk factors associated with
injury and allows the implementation of targeted rehabilitation strategies to combat the
identified deficits. There is substantial need for screening assessments that are practical and
accurate for the clinical athletic trainer. This literature reviewed examined the dorsiflexion
lunge test, Functional Movement Screen (FMS), Y-Balance, Star Excursion Balance Test and the
lower extremity strength assessment as preseason screening tools and their ability to predict
future injury of primarily the knee and ankle. Practicing athletic trainers need an assessment
tool that is inexpensive, easy to implement and has the ability to screen large numbers of
athletes efficiently. The Y Balance test is recommended to implement as part of the preseason
pre-participation exam so the athletic trainer can identify athletes who are at higher risk for
injury and develop an individualized rehabilitation program to improve this deficits and
ultimately reduce injury rates. This assessment screen has the highest sensitivity and best
likelihood ratios. These values are specific for non-contact injuries and produce a minimal
amount off false positives.
Chairperson: Valerie Moody

Table of Contents
Introduction…………………………………………………………………………………..4
Impact of Injury…………..……………………………………………………..6
Predicting Injury…………………………………………………………………7
Lower Extremity Injuries…………………………………………………….9
Knee Injuries
Screening Tools………………………………………………………9
Risk Factors……………………………………………………………11
Ankle Injuries
Screening Tools……………………………………………………..13
Risk Factors……………………………………………………………14
Screening Assessment Procedures
Lower Limb Length…………………………………………………………….15
Y Balance/SEBT..…………………………………………………………………15
Functional Movement Screen………………………………………….…16
Muscle Strength…………………………………………………………………19
Dorsiflexion Lunge……………………………………………………………...22
Discussion……………………………………………………………………………………...22
Clinical Recommendation……………………………………………………………...26
Conclusion…………………………………………………………………………………..…30
Figures 1-6………………………………………………………………………………………32
Tables 1-4……………………………………………………………………………………….34
Graphs 1-3………………………………………………………………………………………44
References………………………………………………………………………….………….46

Introduction
Since 1988, the National Collegiate Athletic Association (NCAA) Injury Surveillance
System has collected injury and exposure data from 15 sports through reporting by athletic
trainers.1 Participation in athletics has increased 80% and 20% in females and male sports
respectively. The number of certified athletic trainers working in the collegiate setting has also
increased 86% since 1995. The NCAA Injury Surveillance System estimates over one million
injuries have occurred across the 15 studied sports in the last five years.1 Sixty-four percent of
these injuries occurred at practice and 22% required a period greater than seven days to return
to full competition. Annually, over 8,000 injuries require surgery with nearly 2,000 needing
emergency transport.1
Over half of the total injuries were reported as sprains, including anterior cruciate
ligament (ACL) tears, or strains. The same percentage, over 50%, of injuries were to the lower
extremity, mainly the ankle and knee.1 An average of 11,000 ankle sprains occur each year over
the 15 studied sports with men’s basketball yielding the highest prevalence. An annual increase
of 1.3% in the incidence of ACL injuries was also reported with an estimated 2,000 per year.1
There was more overall injuries in practice over games because there was 4.5 times as many
practice athlete-exposures than competition.1
The injury risk across all sports in intercollegiate athletics is one injury every two games
and one injury every five practices.1 This rate indicates a need to identify and modify the risk
factors that predispose athletes to injury to reduce this growing epidemic of NCAA injuries.
Injury prevention strategies could significantly reduce the 37% and 42% of non-contact injuries

that occur at practice and in games respectively.1 The first step before implementing
individualized rehabilitative exercises to correct deficits is to identify injury risk factors.
Biomechanical preseason injury screening assessments have the ability to identify
athletes who are at a higher risk for injuries. Research has shown the effectiveness of several
testing methods, such as the Functional Movement Screen, Star Excursion Balance Test,
musculature strength, joint range of motion, and motion analysis, in determining factors
associated with injury. However, there is little evidence about the accuracy of these tests used
in combination rather than each individually. Therefore, the purpose of this professional paper
is to review common injury screening assessments to determine which, if any, are able to
better predict risk of injury that are readily available and easy to implement for the practicing
clinician. At the conclusion of this paper is a recommendation to practicing athletic training
clinicians regarding appropriate selection of injury screening assessments based on the best
evidence available.
Review of Literature
The ability to predict injury through the use of screening assessments has been
researched significantly. This area of research was examined to identify relationships between
scores of different testing methods and injury occurrence. This examination focused on knee
and ankle athletic related injuries due to their high prevalence. Most research has centered on
the risk factors surrounding ACL injuries in athletes, although risk factors have been identified
concerning ankle injuries as well. The literature strongly indicates a need for accurate and
efficient screening assessments to reduce the frequency of lower extremity athletic injuries.

Psychological Impact of Injury
Considering personal grief, disability consequences and high costs associated with
athletic injuries, the importance for the prevention of these injuries is significant. Normal
response to athletic injury includes sadness, isolation, irritation, lack of motivation, anger,
frustration, changes in appetite, sleep disturbances and disengagement.2 If these responses are
not addressed properly then they may manifest and become problematic. Caloric restriction
leading to disordered eating is a common issue following major injury because the athlete is
unable to exercise daily due to injury limitation. Substance use and abuse may be used to
modulate the emotions experienced because of injury. Twenty-one percent of collegiate
athletes reported high alcohol use and a correlation was found between depressive symptoms
and alcohol abuse.2
Athletes also undergo the five stages of grief in varying capacity after an injury.3 First,
they experience denial in which they assume the health care professionals with the diagnosis
must be mistaken, refuse to believe the extent of the injury and often seek a second opinion.
Anger then sets in and the athlete resents the injury and usually the health care professional,
such as an athletic trainer, that is working with them. Daily tasks are suddenly more difficult
and the athlete becomes frustrated with the limitations caused by the injury. Athletes then try
to push their limits early to speed up the recovery process in the third stage, bargaining,
because missing playing time is more painful than the actual injury. Depression is the worst
stage and generally the most difficult to overcome.3 Thirty-three percent of injured Division I
football athletes self-reported high levels of depressive symptoms compared to 27% of the
uninjured population.2 Factors such as considerable success before injury, an injury that

requires surgery, long rehabilitation with restricted playing time, inability to return to the prior
level of competition and being replaced in their position by a teammate have been found as
predictors of athlete suicide risk.2
Loss of identity, isolation from the team and inability to cope with the stressors
associated with injury both affect rehabilitation and predispose an athlete to injury.3 Although
athletes are at a higher risk for developing disordered eating, depression and substance abuse
following injury, this population is also less likely to seek help for mental health issues than
non-athletes.2 Therefore, there is a significant importance in the prevention of these injuries.
However, prevention programs would be more effective if they were individualized to each
athlete. In order for this to happen, preseason screening tools are needed that have the ability
to identify athletes who are at a higher risk for injury.
Predicting Injury
There is a significant need to establish injury screening tools and subsequent prevention
programs to minimize the financial, emotional and medical burden of sport injuries. Research
addressing the possibility and effectiveness of injury prediction methods is conflicting.
Historically, the Functional Movement Screen (FMS) has been utilized in pre-participation
assessments to identify athletes with a higher risk of injury. The FMS consists of seven
bodyweight movement tasks that are intended to quickly and easily identify restrictions or
alterations in normal movement.4 It has been found that neuromuscular control, core stability
and contralateral muscular imbalances are the main factors that predispose athletes to injury
and the FMS has the ability to detect these factors.4

Multiple studies have investigated the correlation between FMS score and injury
prevalence. One study found that 69% of the female collegiate subjects in lower extremity
dominant sports who scored less than fourteen sustained an injury.4 They concluded through
linear regression that there is a predictive relationship between FMS score (less than 14) and
injury risk in athletes without a history of major musculoskeletal injury.4 Athletes scoring less
than fourteen were also four times more likely to sustain an injury in their competitive season.
Another study established a 0.91 specificity of the FMS for serious injury which was defined as
the athlete on injured reserve for a minimum of three weeks.5 The authors, however, could not
establish a cause and effect relationship between injury risk and low FMS score. In a similar
study involving professional football players, at least one asymmetry on the FMS regardless of
the total score increased the injury risk.5
The consequences associated with injury and the need for accurate screening tools are
not limited to athletes. The injury rate among firefighters in nearly the highest across all
occupations at 88,500 each year.6 Forty-four percent have suffered a sprain or strain while on
duty. Linear regression found a correlation between firefighters’ FMS score and past
musculoskeletal injury.6 Previous injury lowered FMS by 3.44. Logistic regression, on the other
hand, found no significant correlation between FMS score and injury occurrence.6 In the
military, about one million non-deployed active service members have experienced an injury.
Musculoskeletal injuries accounted for 24% of all medical evacs and nearly 40% of recruits in
boot camp suffered an injury.7 Service members with a FMS score under 14 and three mile run
time greater than 20.5 minutes were four times more likely to sustain an injury. Run time and
FMS score combined were better predictors of traumatic rather than overuse injuries.7

Most of the studies available only established a correlational relationship between a
specific screening tool and injury risk. To produce a causal relationship, a cutoff value of the
screening assessment needs to be determined to separate athletes into high and low risk
groups. A randomized control trial with an intervention program for high risk athletes then
must determine if injury risk is truly caused by the predetermined variable.8 Currently there is
no screening test that can predict injury with adequate test properties and no intervention
study with evidence in support of screening result.8 Although some may say that injury
prediction through screening test is unrealistic8, there is a high demand for such a test by
athletes, coaches, health care professionals and team owners.
Lower Extremity Injuries
Lower extremity injuries account for 53% of all injuries sustained across nine sports
which is equivalent to over 800,000 lower extremity injuries nationally across high school
athletics.9 In basketball, the lower extremity is the most frequently injured body area,
accounting for 62% of all injuries. The ankle is by far the most commonly injured joint at 18% of
all injuries.9 However, injury to the knee and patella resulted in more games missed than the
two most commonly injured areas, ankle and lumbar spine.9
Knee Injuries
Screening Tools
Along with the ankle, the ACL of the knee is one of the most common lower extremity
injury in the NCAA sports.10 Between 150,000 and 200,000 ACL injuries are reported across the
United States each year. 30,000 of those injuries occur in female athletes resulting in nearly

$650 million of medical costs each year.11 The average expense of an ACL injury, including
surgery and rehabilitation services, total around $17,000. The common mechanism of injury
includes a noncontact, deceleration motion involving lateral pivoting or twisting and landing.12
ACL injuries result in osteoarthritic change and overall cartilage damage in fifty to ninety
percent of patients seven to twenty years after injury.13 There is also an increased risk for a re-
injury after ACL reconstruction as high as one in every four people. The risk of a second tear is
higher in athletes under eighteen years old.14 Due to the expenses and long term consequences
associated with ACL ruptures, recent research has been focused on identifying risk factors that
may predict the likelihood of injury.
It has been shown that females, especially athletes, are more susceptible to ACL tears
than males. The NCAA Injury Surveillance System reported that of the female athletes who
suffered an ACL injury, 60% had a noncontact mechanism whereas 59% of the ACL injured
males were described as a contact injury.10 This study spanning fifteen NCAA sports showed a
continued disparity of the overall injury rate between male and female athletes. Anatomical,
hormonal and neuromuscular differences between males and females have been determined
to influence this injury rate disparity. Factors such as thigh length, femoral notch width, Q
angles, and navicular drop cannot be altered to improve biomechanical aspects of the lower
extremity.12
Most of the research pertaining to lower extremity injury screening, ACL ruptures in
particular, identify one specific risk factor that was found using one diagnostic test which was
designed to look for that specific deficit. Currently, the gold standard is 3D video measurement

joint kinematics to screen at risk people.15 However, 2D video analysis, EMG information,
Landing Error Scoring System (LESS), postural sway and the Star Excursion Balance Test (SEBT)
have all been used to recognize common deficits and dysfunctional movements associated with
lower extremity injury. However, it is currently unknown if these diagnostic assessments have
the ability to predict lower extremity injury. They are successful in identifying alterations in
movement that may predispose athletes to injury and therefore indicate a need for prevention
programs.
Risk Factors
Previous injury history is the most consistent predictor of future injury, but cannot be
modified.5 Instead, biomechanical variations that can be improved have been the target of
much of the research involving lower extremity injury prediction risk factors. The majority of
the studies mention lower extremity valgus, mainly during drop-jump, as a critical predictor in
ACL injury risk.6,11,16,17 Deficits in neuromuscular control, postural stability and quadriceps
dominance are also commonly cited topics of interest.6,11–14,16,18 The overall goal of identifying
risk factors is to design an assessment tool in order to determine athletes at a higher risk of
injury. There is a great need for a screening assessment that inspects all potential risk factors to
understand the injury rate disparity between sexes, reduce healthcare expenses and eliminate
the long-term consequences associated with ACL tears.
The National Basketball Association (NBA) determined that the style of play of the
athlete and the individual workload increases risk of injury. This is broken down into the
average speed players run during the game, total number of games played, average distance
covered by the player throughout the game, average number of minutes played and the
average number of field goals attempted.19 According to the authors’ algorithm, they concluded
that by resting the top 20% of the high-risk scores at any given day, there is a potential to
prevent 60% of all injuries. They believe that injury risk evolves daily and the assessment of the
risk needs to be adapted daily as well.19
The LESS can successfully distinguish ACL risk factors with good inter- and intra-rater
reliability. But the ability to predict ACL injury based on these risk factors was not included in
the study.20 When used to assess military cadets, authors found that LESS can quickly and
reliably assess movement patterns in a large population. They identified several differences
between males and female abnormal landing patterns. Males tended to most commonly utilize
an uneven heel strike landing with tibial external rotation. Females landed with a wider stance
which leads to valgus collapse of the knee.20 Despite these differences, all of these factors are
considered high risk movements in ACL injury.
Postural stability has also been identified as a risk factor for ACL injury. A deviation of
the center of mass increases the valgus load on the ACL and makes this structure vulnerable.
Including balance components in training and especially rehabilitation programs after injury,
both single and double leg, is crucial in improving postural stability.14 Similarly, neuromuscular
control is important in maintaining balance and has been determined to be the primary
contributor of ACL injury. Neuromuscular training has the potential to significantly decrease
ACL injury rates, but the efficacy and efficiency of training protocols could be improved if they
could be designed specifically for predetermined high risk athletes.12 Feed forward mechanisms
to load and stabilize the joint are required ACL injury occurs at 17-50 milliseconds after initial

ground contact. There is no time for mechanosensory feedback so the knee must rely on the
neural reactivation of knee flexors just before ground contact and proprioception.13
Regardless of the importance of identifying risk factors closely associated with knee
injury, accurate prescreening tools are in high demand to classify high risk athletes. Without
injury prediction methods, health care professionals are unable to provide individualized
interventions to these athletes in an attempt to decrease the injury risk and associated
consequences of injury.
Ankle Injuries
Screening Tools
The SEBT is an inexpensive, quick and reliable test that can be used to screen for lower
extremity injuries.21 Poor balance during this test was associated with an increased risk of ankle
injury. The strongest predictor, however, is a history of ankle injury which increases the
likelihood of risk fivefold.17 As with the knee, this factor cannot be modified. Instead, balance
and the associated postural sway are considered the most closely related to ankle injury.22,18 A
simple single leg balance test can be used as a screening tool by health care professionals to
identify high risk athletes.22 This can be done objectively with the athlete on a force plate that
measure deviations in center of mass. Or, it can be performed with the health care professional
scoring athletes’ sway. Again, similar to knee screening tools, only correlational relationships
have been found between ankle injuries and the associated risk factors. Researchers do seem
more confident in the ability to predict susceptibility to injury with single leg balance tests
nevertheless.

Risk Factors
Ankle injuries are a common occurrence in basketball, often with residual symptoms
affecting performance and chondral lesions.17 Preventative strategies need to be implemented,
but first risk factors associated with ankle injuries must be identified. Postural sway, muscle
weakness and imbalance, poor flexibility, hypermobile ankle joint, poor proprioception and
previous injury are intrinsic factors that have been recognized as increasing injury risk.18
Correlations have been found between a high variation of postural sway and a greater
likelihood of injury. However, this correlation in one study could only explain 20% of the
increase in injury prevalence.18 Similarly, another study discovered an association between
ankle sprains and a positive single leg balance test.22 The authors stated that this correlation
predicts susceptibility to ankle injury, but the exact mechanism responsible for the increased
risk of injury is unknown. They also found that the failure to tape the ankles was detrimental in
athletes with a positive single leg balance test.22
Summary
The desire for injury prediction methods has been at the forefront of clinicians involved
in sports medicine for decades. Coaches continue to push athletes to improve their
performance, but with that, comes injuries and the psychological responses to injury. Lower
extremity injuries account for more than half of all sports injuries and are arguably the most
preventative. The profession of athletic training is moving more towards a preventative
mindset rather than rehabilitative. However, clinicians are in need of more information that will
help identify athletes who are susceptible to ankle and knee injuries. Injury screening
assessments provide clinicians with the opportunity to identify at risk athletes and therefore
install an individualized preventative rehabilitation program to reduce this risk.
Screening Assessments Procedures
Lower Limb Length
Limb length is used to normalize data collected in all the screening tests. Athletes are
placed in a supine position on a treatment table. A standard tape measure is placed on the
anterior superior iliac spine (ASIS) to the distal portion of the medial malleolus bilaterally.
Possible pelvis malposition is not taken into account during these measurements.
Y Balance
The Y balance test is an adaptation to the Star Excursion Balance Test (Fig. 1). The intra-
and interrater reliability of the Y balance test is 0.85-0.91 respectively.23 It has been found that
a difference greater than four centimeters between limbs in the posteromedial direction
significantly (p=0.001) increases the risk of a non-contact injury by 3.86. Similarly, a deficit of
the same difference in the anterior direction increases likelihood of a non-contact and/or
contact injury by 2.5.23 Three tape measures can be fixed to the floor in a Y shape (Fig. 2), or
standard athletic tape may also be used in the same pattern. The athlete then places the distal
end of the longest toe at the center point where the three lines intersect.
The athlete is then instructed to maximally reach in each direction, posteromedial,
posterolateral and anterior, tap the tape measure with the foot and return to the starting
position while keeping the stance foot flat on the ground. The trial is repeated if the athlete

loses his/her balance during the exercise or when returning to the starting position or if the
athlete places the reaching foot on the ground to maintain posture. Each athlete is allowed four
to six practice runs in each direction before completing three trials where the maximal distance
is recorded. Devices may also be used that have a sliding mechanism where subjects stand
facing forward on one block and slide other blocks as far as possible with the tip of the toe in all
three directions without moving the body (Fig. 3).23
The Star Excursion Balance Test has a similar procedure to the Y Balance test, but also
includes reaches in the posterior, anteromedial, anterolateral, lateral and medial directions in
addition to the anterior, posteromedial and posterolateral direction for a total of eight
reaches.24 Typically tape is placed on the floor in an asterisk like formation and the patient
stands facing forward, reaches in all eight directions and then the clinician measures the
distances with a standard tape measure.
Functional Movement Screen
Athletes with scores of fourteen or less on the Functional Movement Screen (FMS) are
significantly associated with injuries. Sensitivity and specificity of the FMS as a whole are 0.55
and 0.49 respectively for overall risk of injury.25 A significant correlation has been found
between FMS (Fig. 4) scores under fourteen and injury prediction in athletes without previous
ACL reconstruction.4
Deep squat
The athlete stands with feet shoulder width apart, grasps a dowel in both hands and
presses the dowel directly above the head. The athlete then descends in a squat as deep as

possible while maintaining an upright torso and keeping heels and dowel in position.26 A score
of three is awarded if the upper torso is parallel with the tibia, the femur is below horizontal
and the knees and dowel are aligned over the feet. A two is recorded if these criteria are met
only when the heels are elevated on a block. As with all of the test positions, a zero is given if
there is any pain associated with the movement.27
Hurdle Step
While standing tall, the athlete places a dowel behind the neck, across the shoulders.
They then raise the light leg and step over the hurdle while maintaining foot alignment with the
ankle, knee and hip. The athlete touches the floor with the heel and returns to the starting
position.26 A score of three is earned if the hips, knees and ankles remain aligned in a sagittal
plane with minimal movement in the lumbar spine. If the athlete fails to achieve these criteria,
a two is given.27
Inline Lunge
First, the athlete places a dowel along the spine with it touching the head, upper back
and middle of the buttocks. The right hand should be against the back of the neck and the left
on the lower back. The athlete then steps onto a 2x6 with a flat right foot and the left heel
placed ahead at a distance equal to the length of his/her tibial tuberosity. While keeping the
dowel in contact with the body, the athlete descends into a lunge so the right knee touches the
2x6 behind the left heel and returns to the starting position.26 A score of three is described as a
lunge with no torso movement, dowel remains in contact with the body and vertical and dowel
and feet stay in a sagittal plane.27

Shoulder Mobility
After making a fist with the fingers around the thumb, the athlete places the right fist
overhead and down the back as far as he/she can while simultaneously placing the left fist up
the back as far as possible without creeping the hands closer together. The examiner then
measures the distance between the two closest points of each fist.26 If the fists are within one
hand length and one-and-a-half hand lengths, then a score of three and two are given
respectively.27 A shoulder clearing test can also be given by having the athlete place his/her
right palm on his/her left shoulder while raising the elbow as high as possible. If this is painful,
the shoulder mobility test should not be performed.26
Active Straight Leg Raise
The athlete lays supine with the back of the knees against a 2x6, toes pointing up and
arms next to his/her side with palms facing up. The athlete then pulls the toes of the right foot
toward the shin and raises the right leg straight off the ground as high as possible while keeping
the back of the left leg on the 2x6.26 A three is recorded if the vertical line of the malleolus
resides between the mid-thigh and ASIS. If the vertical line is between the mid-thigh and joint
line, then a score of two is given.27
Trunk Stability Pushup
The athlete assumes a prone position with feet together and hands shoulder width
apart. The athlete begins with his/her thumbs at the top of the forehead with the knees fully

extended and ankles dorsiflexed. The athlete is then instructed to perform one pushup in this
position. A score of three indicates the athlete is able to lift the body as a unit with no lag in the
lumbar spine. If the athlete cannot perform a pushup in this position, the thumbs move to chin
level and the procedure is repeated.26 A score of two is given if the pushup is completed in this
second position with no lumbar spine lag. A score of one is given if the subject cannot perform
a repetition with the body lifting as a unit.27
Rotary Stability
The athlete gets on his/her hands and knees over the 2x6 with hands under the
shoulders and knees under the hips. The thumbs, knees and toes must contact the sides of the
board with toes pulled toward the shins. The athlete then reaches the right hand forward and
right leg back at the same time. Without touching down, the right elbow is pulled in and
touched to the right knee, and then returned to the extended position again before resuming
to the start position. If the athlete is unable to perform this movement, it may be modified to a
diagonal pattern. The right arm and left leg are extended and then the same procedure is
followed.26 A score of three indicates that the athlete could perform the correct unilateral
repetition; a two is for a correct diagonal repetition while maintaining proper positioning.27
Muscle Strength
Hip muscle strength, particularly external rotators and abductors, is important in
resisting the external forces placed on the knee and ankle during functional movements. The
knee’s most vulnerable position is in hip adduction and internal rotation resulting in knee
valgus and tibial internal rotation.11 Proper hip musculature strength, especially in the gluteus

medius, is required to counteract this position and protect the knee. Isometric strength of the
hip abductors and extensors can be assessed using a hand-held dynamometer. For the hip
extensors, the athlete is supine on the table with the knee flexed at ninety degrees. The
dynamometer is placed on the middle of the posterior thigh and is secured using a mobilization
strap. The athlete is then instructed to maximally extend the hip while keeping the pelvis on the
table. Trials continue until two measurements are obtained that are similar and repeat
bilaterally.28 The athlete then moves to a side lying position with the test leg on top and hips
rolled slightly forward to look at abduction strength. The dynamometer is placed proximal to
the knee on the lateral aspect of the thigh. The athlete then maximally abducts the hip against
the mobilization strap securing the dynamometer. Adduction strength is taken in the same side
lying position, but now the test leg is on bottom. The dynamometer is placed just proximal to
the medial femoral condyle as the researcher held the top leg.28 Internal and external hip
rotators are tested with the athlete sitting with the lower legs off the table. The dynamometer
is placed just proximal to the medial malleolus for external rotation and above the lateral
malleolus for internal rotation. Hip flexion is also collected with the athlete in a seated position
with the dynamometer about 2cm proximal to the femoral condyles.28
Co-activation of the hamstrings and quadriceps protect the knee joint against anterior
tibial translation. Although this majority of this co-activation is controlled by the quads, 80% to
40% hamstring, deficits in hamstring strength directly limit the potential for muscular co-
contraction to protect the ligaments.12 This may lead to quad dominance that is defined as the
imbalance between the recruitment pattern of the knee flexors and extensors. There may also

be a leg dominance which is an imbalance in strength between limbs. This may result in one
side having a greater dynamic control and an over reliance on one limb.12
Isokinetic quadriceps strength can be measured using an isokinetic device, which is a
computer controlled electromechanical dynamometer. The device provides resistance during
isokinetic movement and during isometric muscle contractions. Signals from the force, angle,
and velocity are processed and displayed on the computer monitor. The test limb is attached to
the dynamometer via a padded cuff which is attached to housing containing strain gauges.
Different limb lengths can be accommodated by moving the housing along a metal lever arm.
The axis of the dynamometer motor is adjusted to match the axis of rotation of the tibiofemoral
joint, while the distal edge of the shin attachment is placed about five centimeters proximal to
the lateral malleolus of the test leg. Athletes are positioned on the machine by a trained
operator with hip flexed to ninety degrees and knee flexed to seventy-five degrees.29 Both
waist and trunk straps were used for stabilization. Athletes perform two submaximal
contractions lasting two to three seconds and one maximal isometric contraction. Athletes are
given a total of three trials, with the last one being maximal contraction. Hamstring and
quadriceps strength are assessed both eccentrically and concentrically at varying angular
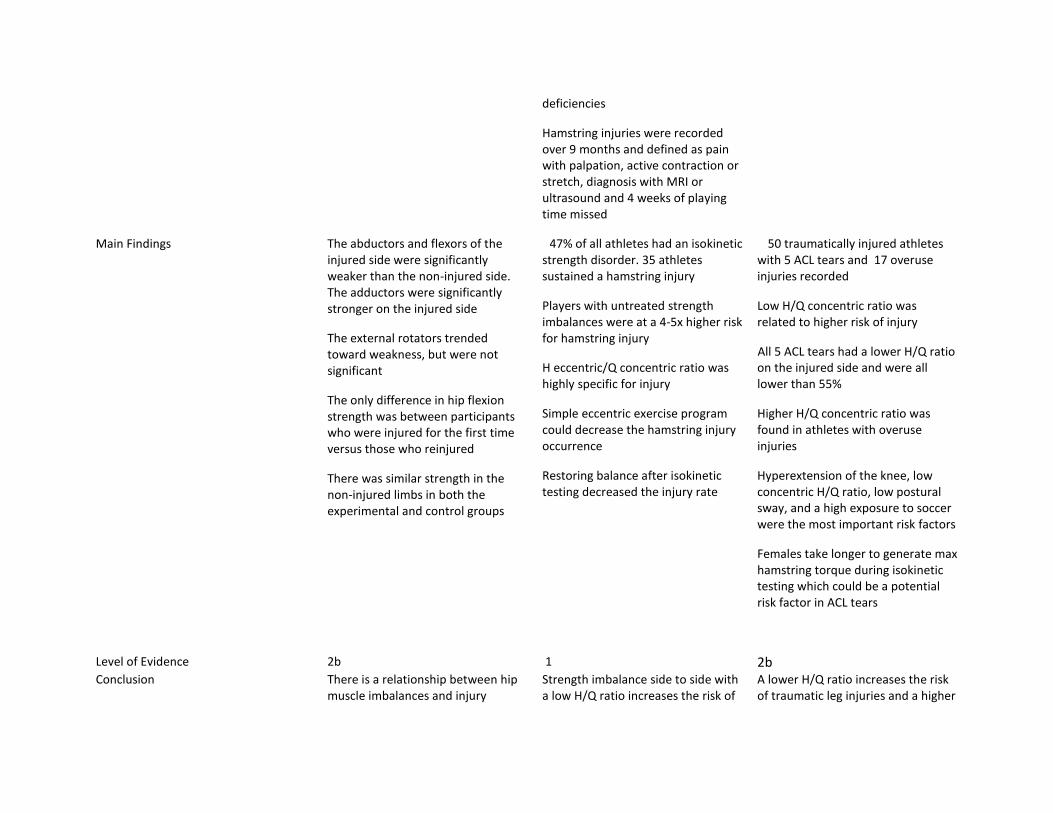
velocities depending on the study. Quadriceps strength can also be assessed with a hand-held
dynamometer (Fig. 5). The athlete sits with knee flexed between 85 and 90 degrees and
maximally extends the leg against the resistance of the dynamometer which is placed on the
distal anterior tibia.29 Although isometric electromechanical dynamometry is considered the
gold standard in assessing quadriceps strength, the hand-held dynamometer has a specificity of

0.72 and sensitivity of 0.83 compared to gold standard when determining return to play after
knee injury.29
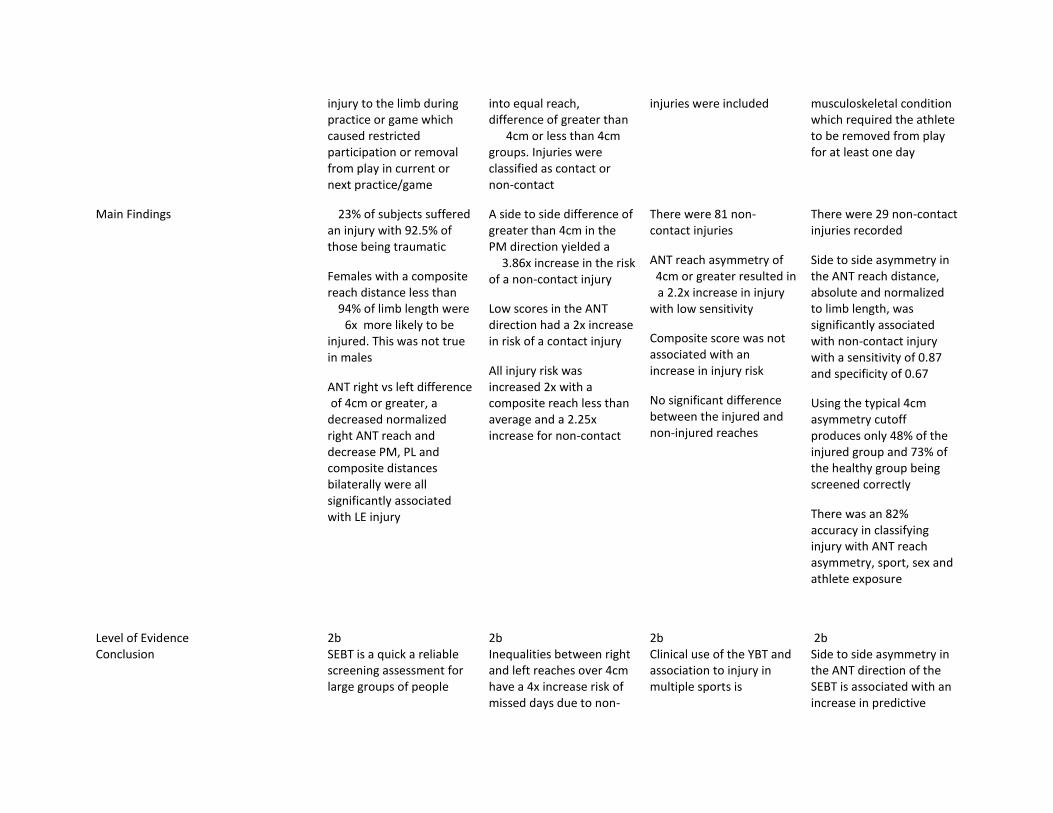
Weight Bearing Dorsiflexion Lunge Test
The weight bearing dorsiflexion luge test (WBDFL) is used to assess active ankle
flexibility (Fig. 6). The athlete places his/her foot perpendicular to the wall and flexes the knee
forward towards the wall. The foot is progressively moved away from the wall until maximum
range of ankle dorsiflexion is reached without the heel lifting from the floor.30 A tape measure
records the distance from the great toe to the wall while minimizes errors that are common
when using a goniometer. ICCs of 0.97-0.98 for intra-observer reliability and 0.99 for inter-
observer reliability in the injured population have been reported.31
Another method for determining maximum dorsiflexion range of motion involves the
use of an inclinometer. The athlete stands on a box 30-45 cm high with the knee flexed or on
the ground in a similar position to the traditional WBDFL test. The athlete then performs
forward displacement of the trunk as far forward as possible while keeping the heel on the box.
The short arm of the inclinometer is placed on the posterior portion of the Achilles tendon
about one centimeter superior to the posterior calcaneal tuberosity.31 This device has a high
reliability of 0.85-0.96. Phone apps such as TiltMeter have been shown to have comparable
reliability in measuring dorsiflexion range of motion and is free to install.31
Discussion
Most research pertaining to screening assessments and their ability to predict future
injury focuses on the Functional Movement Screen. This test is the most common assessment

used in settings outside traditional athletics, such as the military, police academies and
firefighters. The majority of studies agree that the cutoff score for a higher injury risk is a score
less than or equal to fourteen(Table 1). However, one study found a 4.7 time increase in injury
risk with scores under 17.32 Another study established different threshold scores for men and
women under 12 and 15 respectively.25 Sensitivity for the FMS is between 0.55-0.60 and
specificity 0.49-0.61 depending on the study. However, the last study looked at determined
that at least one asymmetry, regardless of total score increased injury risk.5 Overall, the FMS
identifies athletes with dysfunctional movement patterns, specifically a low score and
asymmetry, and indicates these athletes are more likely to suffer a time loss injury.
Implementing the FMS into a pre-participation exam (PPE) for athletes is a reasonable
suggestion. This tool requires minimal equipment and is inexpensive as long as the athletic
trainer has an understanding of the testing movements and scoring. There is a certification
available for FMS that would make the scoring more reliable; however, it is not necessary
before administering the FMS. With a total of seven different movement tests, it may prove to
be difficult to carry out in large volumes of athletes with a limited amount of testing time.
The weight bearing dorsiflexion lunge test has great inter- and intra-rater reliability
while collecting easy to interpret objective data. Studies have shown differences in maximal
dorsiflexion between the dominant and non-dominant leg. Most studies have found an
association between lower than average dorsiflexion and chronic injuries, mainly patellar
tendinopathy (Table 2). One study found that range of motion under 36.5 degrees predisposes
young athletes to patellar issues.33 Another reported the same but with a slightly higher cutoff
value of 45 degrees.34 However, these studies didn’t necessarily look at the ability of this value

to predict future injury, just listed that lack of dorsiflexion is a risk factor for developing patellar
tendinopathy. Most studies don’t look solely at dorsiflexion ranges when determining injury
risk. They tend to include a wide variety of factors, many which are non-modifiable, such as
femoral notch width and Q-angle. Due to this, there is a lack of evidence in the significance of
dorsiflexion deficits in acute injury risk. Instead authors include things like age and past injury
history, which affects dorsiflexion range of motion, and participation in regular weight training
as more predictive factors of injury risk. This screening assessment is easy to implement as a
clinical athletic trainer. The testing procedure is quick, and requires minimal training and
equipment. However, research indicates the need to include the dorsiflexion lunge test with at
least one other screening assessment tool to improve the predictive ability of injury risk.
Objective lower extremity strength assessments are difficult to determine without the
proper equipment. A hand held dynamometer or an isometric/isokinetic dynamometer is
required to assess an athlete’s maximal isometric or isokinetic strength. For the most part, it
makes this testing procedure unrealistic for the practicing athletic trainer on a budget. But,
research indicates that there is a relationship between hip musculature and injuries. One study
measured the muscles of the six actions of the hip joint using a hand held dynamometer (Table
3). They found a relationship between hip muscular imbalances and the prevalence of chronic
overuse injuries in runners.28 The abductors and flexors on the injured side were significantly
weaker than the non-injured side while the adductors of the injured side were significantly
stronger. A second study used an isokinetic kin-com machine to measure concentric and
eccentric hamstring and quadriceps strength. They reported that a mixed ratio of hamstring
eccentric strength to concentric quadriceps strength is highly specific for detecting a risk of

hamstring injuries.35 A similar study found that a lower hamstring to quadriceps strength ratio
increased the risk of traumatic leg injuries. Quad dominance in particular increases the strain on
the ACL and is a potential risk factor for tears.36 All of the studies looked at showed that an
imbalance in muscular strength whether it’s between the agonist and antagonist muscles or a
side to side balance increases the risk of lower extremity injury.
The Star Excursion Balance Test (SEBT) has largely been used in the past to detect
balance issues that predispose an athlete to ankle injury and also in return to play protocols
after ankle and knee injuries. Several studies have indicated that asymmetry in reaching
distance has the potential to determine athletes at a higher risk of future injury. Plisky et al.24
found a 2.5 time increase in lower extremity injury risk with side to side differences in anterior
reach (Table 4). He also reported that females with a composite reach distance less than 94% of
limb length are six times more likely to sustain a lower extremity injury. A similar study focused
just on the incidence of non-contact knee and ankle injuries in collegiate athletes. They also
found a significant association between non-contact injury and a side to side asymmetry in both
absolute and normalized anterior reach distance.37
The SEBT is composed of eight different reaching directions. However, it has been
shown that reach performance is all eight directions is unnecessary and repetitive. The
posteromedial (PM) direction is most strongly associated with performance when looking at the
ankle.38 PM, anteromedial (AM) and the medial directions also identify significant differences in
the limbs without repeating too many similar movements. Going off these findings, the Y
Balance test (YBT) was adapted from the SEBT to minimize the testing time and effort. Patients’
reaches are assessed in the anterior, PM and posterolateral (PL) directions. Comparable to the

findings of the studies involving the SEBT, asymmetry between limbs was found to increase
injury risk. Gonell et al.23 determined that a side to side difference of greater than 4cm in the
PM direction increased the likelihood of sustaining a non-contact injury 3.86 times. He also
found that a low composite score almost double the injury risk. Smith et al.39 reported a 2.2
time increase in injury in athletes with an anterior reach asymmetry of over 4cm. A low
sensitivity and no association between injury risk and composite score was also stated in this
study.
The YBT is a reliable screening assessment that yields easy to use data with a specificity
of 0.67 and sensitivity of 0.87.37 Multiple authors suggested implementing this test into the PPE
to identify and then improve deficits throughout the season. All studies looked at specified that
side to side asymmetry in reach distance, independent of the direction, increases injury risk.
Four centimeters has commonly been used as the threshold for differences in reach values.
However, it has been suggested to only use this cutoff number in the populations it was
designed for.39 The use of the YBT and SEBT and their accuracy in predicting injury varies
between levels of competition and type of sport. The data is potentially more useful when used
without a cutoff score and just looks at general asymmetries, especially in the posteromedial
and anterior directions. Future studies should focus on the ability of just the anterior reach
direction in isolation and its ability to predict injury as a more streamlined assessment of injury
risk.
Clinical Recommendation

Practicing athletic trainers are often short on time and resources, especially in the
secondary school setting. Therefore, the ideal injury prediction assessment should be
inexpensive, applicable to multiple sports and genders, specific for injuries that are common in
each sport, require minimal equipment and training, and allow for a large number of athletes to
be tested efficiently. Also, a test with a higher sensitivity value over specificity is preferred
because the athletic trainer’s goal is to avoid false negatives when screening athletes. These
athletes are at a higher risk for injury, but will receive no additional targeted rehab to lower this
risk. False positives, on the other hand, aren’t as detrimental because adding extra preventative
rehab exercises for athletes without deficits isn’t proven to be harmful. Ideally, the test should
have a negative likelihood ratio less than 0.1 to effectively rule out the risk of injury with a
negative test result. A positive likelihood ratio of over ten significantly increases the probability
of injury with a positive test score. Although no assessment tool is perfect in all of these
categories, each does have their strengths and weaknesses.
The FMS has the largest amount of research specifically looking at its ability to predict
future injury in athletes of a variety of settings. However, because the FMS is made up of seven
movements which are each scored on a scale of zero to three, it may be difficult to implement
this testing method with a larger group of athletes. Although minimal equipment is required
because the athletic trainer doesn’t necessarily need the FMS specific testing kit, they do need
some training to properly score the movements. It would be more efficient to train seven
different people, one per testing movement, to set up a station based assessment screen, but
this would be difficult in smaller school setting with limited personnel.

The cutoff score of fourteen has been used as the threshold for higher injury risk for
athletes that score below fourteen. This value is highly specific, but has a very low sensitivity at
0.26. Therefore, there will be many false negatives even though the FMS is good at determining
true negatives. This leads to a positive likelihood ratio of 2.00 and a negative ratio of 0.85
(graph 1). It has also been determined that athletes are at a higher risk of injury if at least one
side to side asymmetry is present. The sensitivity increases to 0.58 when focusing on this
outcome of the FMS. Nevertheless, there are only minimal changes in the post-test
probabilities at 20% and 10% for a positive and negative test score respectively (graph 2). The
number of false positives identified increases and the amount of false negatives decrease, but it
still represents close to half of the total injured population.
The Y Balance Test had the highest reported sensitivity of all the assessment tools at
0.87.37 This test produces very few false negatives, but will have a relatively high number of
false positives. The YBT also had the best likelihood ratios which produced the greatest effect
on post-test probabilities (graph 3). The negative likelihood ratio of 0.19 is equivalent to a
moderate change in post-test probability at 3% which is the lowest of the screening
assessments.
The YBT requires only a tape measure and athletic tape, materials that every athletic
trainer has on hand, while minimal training is required because of the simple testing procedure.
There is also minimal time commitment for the YBT making it easier to implement on a large
number of athletes than the FMS. The studies have identified that side to side asymmetry in
reaching distance as well as the composite score to be effective predictor of future injury. Most
of the studies separate contact and non-contact injuries which is arguable the most useful
aspect in recommending this screening assessment. Athletic trainers can work only to prevent
the non-contact injuries because generally these occur due to deficits in the kinetic chain or
neuromuscular issues which can be improved through rehab. Although there is limited
research, there is a possibility of using the YBT in addition to other testing methods to more
accurately identify those at risk because the YBT is so easy to implement.
The Weight Bearing Dorsiflexion Lunge test is also inexpensive, quick and easy to
implement for practicing athletic trainers. The equipment is similar to the YBT and minimal
training is necessary due to the simple testing procedure. However, most studies used the
WBDFL test to identify athletes at higher risk for chronic patellar tendinopathies.34,40 There is
limited research on the ability of the WBDFL to predict acute injuries and most studies combine
the WBDFL with a variety of other screening assessments. Due to this, no sensitivity or
specificity values have been determined solely for the WBDFL test’s ability to predict acute
injury. Therefore, the WBDFL test is not recommended for athletic trainers to use
independently. It is a possibility to combine this test with other screening assessments because
it is very applicable to implement for the practicing athletic trainer, especially when the goal is
to identify those at risk for chronic injury.
The gold standard for measuring lower extremity strength is an isometric
electromechanical dynamometer.29 This machine is extremely expensive and is most likely not
available to athletic trainers. The hand-held dynamometer has proven to be similar to the gold
standard when determining strength to return to play with a specificity of 0.72 and sensitivity
of 0.83.29 The hand-held dynamometer also allows the athletic trainer to assess strength in
other muscles than just the quadriceps and hamstrings such as the hip musculature. Studies

have shown the side to side strength imbalances of the hip musculature to be a risk factor in
chronic injuries.28 Hamstring to quadriceps strength ratio is the main predicting factor in ACL
ruptures.36 This indicates that strength assessment is an important factor in screening for injury
risk. Unfortunately, the equipment needed for objective measurements is expensive and largely
inapplicable for athletic trainers in a small setting. Similar to the DFL test, lower extremity
strength measurements are often used in conjuncture with other screening assessments and no
sensitivity/specificity values have been reported for injury prediction.
Conclusion
Lower extremity injury accounts for nearly 50% of all collegiate athletic injuries with
11,000 ankle sprains and 2,000 ACL tears annually. The NCAA injury rate is 13.8 injuries for each
1,000 athlete exposures.1 This increasing injury rate indicates a need to identify the risk factors
associated with lower extremity injury, especially non-contact injuries. After determining which
athletes are at a higher risk of injury, athletic trainers will have the ability to implement
targeted, individualized, rehabilitation programs to improve identified deficits and ultimately
reduce the injury rate.
Athletic trainers are often responsible for a large number of athletes therefore having a
limited amount of time and resources. These health care professionals are at the forefront of
dealing with athletic injuries and are in need of an injury risk assessment tool that allows them
to identify individual deficits to more effectively rehab these athletes who are at a higher risk of
injury. This assessment tool must be inexpensive, quick and easy to implement and have the
ability to screen large numbers of athletes. The Y Balance test meets all these criteria while

providing a more significant change in post-test probabilities than the other screening
assessments.
The Y Balance test is recommended for practicing athletic trainers because it is specific
to non-contact injuries, it produces very few of the possibly detrimental false negatives and the
post-test probability of an athlete with and without an asymmetry in the anterior reach
distance is 30% and 3% respectively, the best of the screening assessments. Although research
is lacking, there is a possibility of combining the YBT and other screening assessments such as
the DFL test, lower extremity strength assessment and the Landing Error Scoring System for a
more accurate understanding of individual deficits. The YBT is recommended for athletic
trainers of all levels and settings to implement during the preseason, pre-participation exam to
identify athletes at a higher risk for injury throughout the season and modify these deficits to
decrease the likelihood of injury.

Fig. 1: Star Excursion Balance Test
https://www.youtube.com/watch?v=YG5Hf7jwDrQ
Fig. 2: Y Balance Test with athletic tape
http://www.institutocohen.com.br/biolabcohen.php
Fig. 3: Y Balance Test with slide boards
https://www.functionalmovement.com/store/23/y_balance_test_kit
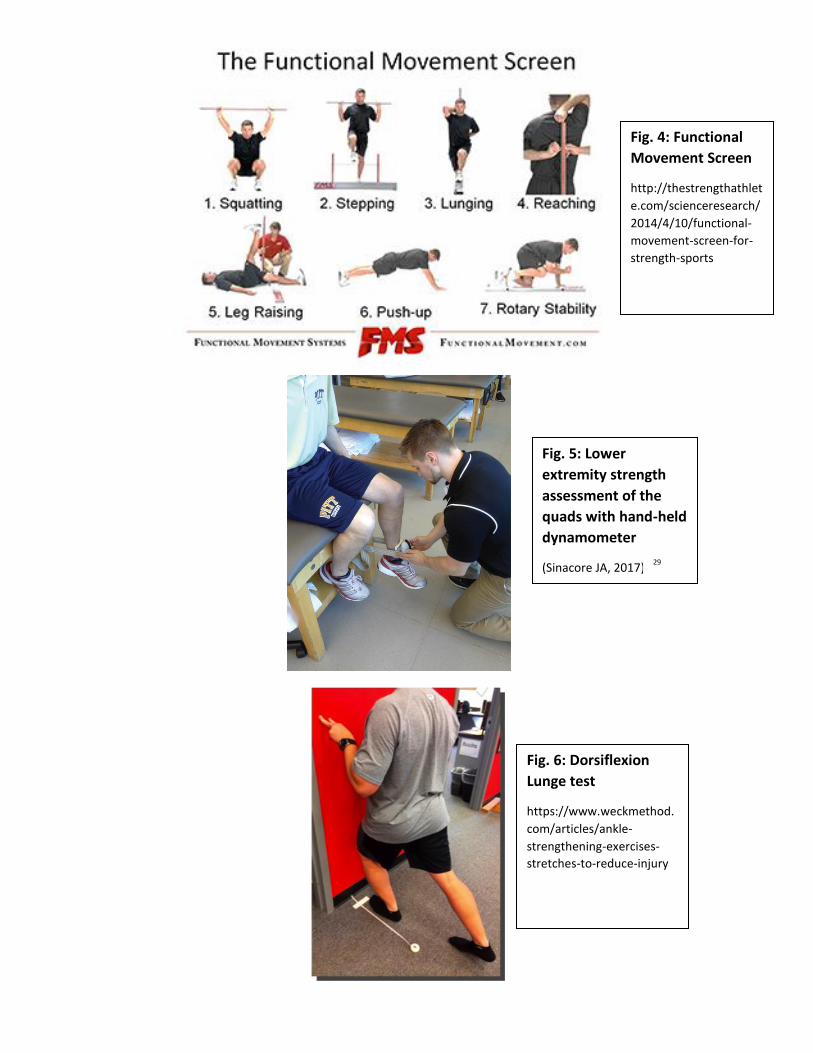
Fig. 4: Functional
Movement Screen
http://thestrengthathlet
e.com/scienceresearch/
2014/4/10/functional-
movement-screen-for-
strength-sports
Fig. 6: Dorsiflexion
Lunge test
https://www.weckmethod.
com/articles/ankle-
strengthening-exercises-
stretches-to-reduce-injury
Fig. 5: Lower
extremity strength
assessment of the
quads with hand-held
dynamometer
(Sinacore JA, 2017) 29

Table 1 Functional Movement Screen
Kiesel et al5 Knapik et al25 Shojaedin et al32
Study Design Prospective Cohort Prospective Cohort Prospective cross sectional
Participants 238 professional football players on a total of two teams
770 male and 275 female incoming freshman cadets age 18-22 in the Summer Warfare Basic Training
100 healthy college aged recreational and competitive athletes (50 male and 50 female) in football, handball and basketball
Excluded if using a prophylactic device or suffered a recent injury
Intervention Investigated FMS included in PPE and conducted by strength and conditioning staff with extensive FMS experience
Injuries were tracked throughout the preseason and coded as joint or musculoskeletal injury
At the end of preseason, players were separated as sustaining an injury or remaining uninjured
Injury was defined as a time loss injury
FMS conducted before training by research staff. Each tester was trained only in the one test they were administering, but all monitored by PT certified in FMS
PT diagnosed SWAB training related injuries and recorder throughout the year
Injury defined as physical damage to body resulting in a clinic visit
FMS was conducted by two PTs prior to the competitive season
Athletes were separated into the groups injured, non-injured, below or above the cutoff score of 17
Main Findings 25% of the football players were injured with the knee being the most commonly injured.
The mean FMS score 16.9 for all subjects, injured: 16.1, non-injured:
17.4
18.6% of males and 24.7% of females sustained an injury
Males were at a higher injury risk with FMS scores under 12 with sensitivity of 0.55 and specificity
0.49
The average FMS score was 16.7
A score of less than 16.5 resulted in a 4.7 times greater chance of injury
There was a statistical difference between preseason FMS scores of the injured and non-injured groups

Significant difference in the number of players with at least one asymmetry on the FMS between the injured and non-injured groups
A score of less than 14 yielded an injury risk of 1.87 with sensitivity of
0.26 and specificity of 0.87
One asymmetry increased the risk of injury to 1.8 with sensitivity of 0.58 and specificity of 0.62
A combination of asymmetry and score below 14 was highly specific for injury at 0.87
Females were at higher injury risk with FMS scores under 15 with sensitivity 0.60 and sensitivity 0.61
Athletes competing in basketball had lower scores on all seven FMS tests
27% of participants scored under 14
Of participants scoring under 17, 22 were injured and 9 remained healthy. 24 were injured and 34 remained healthy in the group of people who scored over 17
Level of Evidence 2b 2b 2a
Conclusion Athletes with dysfunctional movement patterns (low FMS score and asymmetry) are more likely to suffer a time loss injury
The cutoff score was validated in this study at less than 14
One asymmetry increased the injury risk regardless of overall FMS score
The FMS predicted injury risk with moderate accuracy in female cadets and low accuracy in males
There was a 4.7 time greater chance of injury with a FMS score less than
17
Including the FMS as part of the PPE is low cost and simple to implement
Abbreviations: PPE, Pre Participation Exam PT, physical therapist

Table 2 Weigh Bearing Dorsiflexion Lunge
Backman et al40 Malliaras et al34 Gabbe et al33
Study Design Prospective Cohort Cross-Sectional Prospective Cohort
Participants 75 Swedish junior basketball players at the national elite level age 14-20
(38 males and 37 females)
Excluded if history of Osgood-Schlatters, ACL reconstruction or anterior knee pain presently
113 male and female volleyball players over 18 years old
126 adult Australian community level football clubs
Intervention Investigated DF range tested and development of patellar tendinopathy over one year
DF lunge test angle recorded with inclinometer
Clinical exam by PT one year later for anterior knee pain, decrease in knee function, palpable tenderness, activity related pain or pain with decline single leg squat or if these symptoms occurred anytime throughout the year
Pain scale with decline single leg squat and ultrasound image were taken one week before the season with DF lunge scores split athletes into 3 groups: normal tendon, abnormal and no pain, and patellar tendinopathy
Baseline assessments conducted 3 weeks prior to competitive season by PTs including weight bearing DF lunge test
4 month injury surveillance by club PT. Injury defined as damage
resulting in missed participation and or treatment from a health care professional
Main Findings Average DF was 38.7 degrees on the dominant leg and 40.0 degrees on the non-dominant
12 athletes with unilateral tendinopathy. There was no difference in tendinopathy between the dominant and non-dominant leg
36.5 degrees of DF was the cutoff for tendinopathy. 18-29% risk in high
Significant difference in DF range between tendon health groups mainly on the right side
45 degrees was the most accurate cutoff score with an increased risk of tendinopathy 1.8-2.8x
No indication of predicting development of injury, just
53% of the participants sustained LE injuries
DF lunge was the only factor found to be associated with LE injury
Players with a history of 2 or more injuries in the previous season were at an increased risk of injury
Athletes were more than 13 cm of

risk group ( less than 36.5 degrees of DF) compared to 1.8-2.1% in the low risk group
Higher incidence of tendinopathy in athletes with history of 2 or more ankle sprains with predispose them for lower DF range
Cutoff scores not applicable to other ages/sports
predisposing factors
DF were less likely to get injured that those with less than 9cm of DF
Level of Evidence 2b 1 2b Conclusion DF lunge range of motion under 36.5
degrees predispose young basketball players to patellar tendinopathy
Players with less than 45 degrees of DF are at a greater risk of having patellar tendinopathy
DF lunge range of motion was the single univariate association for LE injuries. Other factors included age, past injury history and participation in regular weight training
Abbreviations: DF, dorsiflexion PT, physical therapist LE, lower extremity

Table 3 Lower Extremity Strength Assessments
Niemuth et al28 Croiser et al35 Soderman et al36
Study Design Descriptive Analysis Prospective Cohort Prospective Cohort
Participants 30 recreational runners, 17 females and 13 males (10 miles per week) with a single leg overuse injury referred by a PT clinic
30 non-injured randomly selected recreational runners, 16 females and
14 males
Patellofemoral pain, plantar fasciitis, IT band friction syndrome, stress fracture, Achilles tendinopathy and medial tibial stress syndrome included
Excluded if they participated in competitive running, had bilateral pain
462 soccer players on the Belgian, Brazilian and French professional teams with an average age of 26 years old
146 athletes from Swedish soccer teams
Intervention Investigated 2 trials of max isometric contraction of the 6 muscle groups of the hip joint (flexors, extensors, adductors, abductors, internal and external rotators) were recorded by a PT with a hand-held dynamometer
Preaseason isokinetic testing of the hamstring and quadriceps with a kin-com dynamometer
3 submax warmup repetitions before 3 reps at 60 degrees/sec and
5 reps and 240 degrees/ sec with 1 minute rest in between sets
Athletes separated by imbalances of 15% bilateral differences, concentric
H/Q ratio and mixed ratio
Muscle torques with kin-com dynamometer were conducted preseason
5 trials recorded at 90 degrees/sec to determine maximal isokinetic contraction
deficiencies
Hamstring injuries were recorded over 9 months and defined as pain with palpation, active contraction or stretch, diagnosis with MRI or ultrasound and 4 weeks of playing time missed
Main Findings The abductors and flexors of the injured side were significantly weaker than the non-injured side. The adductors were significantly stronger on the injured side
The external rotators trended toward weakness, but were not significant
The only difference in hip flexion strength was between participants who were injured for the first time versus those who reinjured
There was similar strength in the non-injured limbs in both the experimental and control groups
47% of all athletes had an isokinetic strength disorder. 35 athletes sustained a hamstring injury
Players with untreated strength imbalances were at a 4-5x higher risk for hamstring injury
H eccentric/Q concentric ratio was highly specific for injury
Simple eccentric exercise program could decrease the hamstring injury occurrence
Restoring balance after isokinetic testing decreased the injury rate
50 traumatically injured athletes with 5 ACL tears and 17 overuse injuries recorded
Low H/Q concentric ratio was related to higher risk of injury
All 5 ACL tears had a lower H/Q ratio on the injured side and were all lower than 55%
Higher H/Q concentric ratio was found in athletes with overuse injuries
Hyperextension of the knee, low concentric H/Q ratio, low postural sway, and a high exposure to soccer were the most important risk factors
Females take longer to generate max hamstring torque during isokinetic testing which could be a potential risk factor in ACL tears
Level of Evidence 2b 1 2b Conclusion There is a relationship between hip
muscle imbalances and injury Strength imbalance side to side with a low H/Q ratio increases the risk of
A lower H/Q ratio increases the risk of traumatic leg injuries and a higher

patterns in runners with overuse injuries, the hip abductors in particular
hamstring injury ratio increases the risk of an overuse injury
Quad dominance increases the strain on the ACL
Abbreviations: H/Q, Hamstring To Quadriceps strength ratio

Table 4 Star Excursion Balance Test/Y Balance Test
Plisky et al24 Gonell et al23 Smith et al39 Stiffler et al37
Study Design Prospective Cohort Prospective Cohort Prospective Cohort Retrospective Cohort
Participants 235 high school basketball players (130 males, 105 girls)
Excluded if there was vestibular dysfunction or lower extremity injury within one month
74 male professional soccer club athletes
184 Division I collegiate athletes competing in basketball, cross-country, football, golf, volleyball, track and field, swimming, tennis and soccer
Participants were excluded if they had a current injury
147 Division I athletes from one university
Excluded if there was a history of lower extremity injury
Intervention Investigated Subjects were prospectively followed throughout the competitive season
Previous injury history, current lower extremity symptoms and use of brace/tape were recorded
6 practice trials and 3 recorded trials for max reach distance in PM, PL and Ant direction with the SEBT
Leg length was also measured to normalize reach distances
Injuries were tracked throughout the year. Injury was defined as
Athletes were prospectively followed throughout the competitive season
Previous injury history, MOI and previous time loss due to injury were recorded
6 practice trials and 3 recorded trials to determine max reach distance in ANT, PM and PL directions
Injuries were recorded by a PT and defined as an event that caused the athlete to miss at least one training day
Athletes then separated
Athletes were followed for one sport season
Everyone was blinded from the YBT score as it was conducted with the PPE by certified raters
4-6 practice attempts and 3 recorded trials for max
distance in the PM, PL and ANT directions
Injuries were tracked and defined as the first musculoskeletal problem with a non-contact MOI that caused patients to go the athletic training room and required intervention
Contact injuries were excluded, but overuse
Preseason PPE testing with the SEBT conducted by raters trained by the certified athletic trainer
Injury history, injury status, surgical history and starting status were recorded
4 practice trials with 3 test trials for maximum reach distance
Athletes were separated into healthy or injured group if they sustained a non-contact knee or ankle injury in the competitive season
Injury was defined as an acute non-contact
injury to the limb during practice or game which caused restricted participation or removal from play in current or next practice/game
into equal reach, difference of greater than
4cm or less than 4cm groups. Injuries were classified as contact or non-contact
injuries were included musculoskeletal condition which required the athlete to be removed from play for at least one day
Main Findings 23% of subjects suffered an injury with 92.5% of those being traumatic
Females with a composite reach distance less than
94% of limb length were 6x more likely to be
injured. This was not true in males
ANT right vs left difference of 4cm or greater, a
decreased normalized right ANT reach and decrease PM, PL and composite distances bilaterally were all significantly associated with LE injury
A side to side difference of greater than 4cm in the PM direction yielded a
3.86x increase in the risk of a non-contact injury
Low scores in the ANT direction had a 2x increase in risk of a contact injury
All injury risk was increased 2x with a composite reach less than average and a 2.25x increase for non-contact
There were 81 non-contact injuries
ANT reach asymmetry of 4cm or greater resulted in a 2.2x increase in injury
with low sensitivity
Composite score was not associated with an increase in injury risk
No significant difference between the injured and non-injured reaches
There were 29 non-contact injuries recorded
Side to side asymmetry in the ANT reach distance, absolute and normalized to limb length, was significantly associated with non-contact injury with a sensitivity of 0.87 and specificity of 0.67
Using the typical 4cm asymmetry cutoff produces only 48% of the injured group and 73% of the healthy group being screened correctly
There was an 82% accuracy in classifying injury with ANT reach asymmetry, sport, sex and athlete exposure
Level of Evidence 2b 2b 2b 2b Conclusion SEBT is a quick a reliable
screening assessment for large groups of people
Inequalities between right and left reaches over 4cm have a 4x increase risk of missed days due to non-
Clinical use of the YBT and association to injury in multiple sports is
Side to side asymmetry in the ANT direction of the SEBT is associated with an increase in predictive

A greater side to side difference in ANT reach distance resulted in a 2.5x increase for injury
SEBT can be put in the PPE and can improve deficits with neuromuscular preseason training
contact injury
Lower composite scores result in a greater possibility of missed days
The YBT could be a useful preseason test and to determine return to play following injury
questionable
Asymmetry between limbs was a greater predictor of injury than overall reach differences between injured and non-injured athletes
probability of a non-contact knee or ankle injury
Abbreviations: PPE, pre participation Exam PM, posteromedial PL, postero- Lateral ANT, anterior MOI, mechanism Of injury

Graph 1: Nomogram FMS score
under 14
Sensitivity: 0.26 Specificity: 0.87
+LR: 2.00 Post-test: 25%
-LR: 0.85 Post-test: 12%
Graph 2: Nomogram FMS asymmetry
Sensitivity: 0.58 Specificity: 0.62
+LR: 1.53 Post-test: 20%
-LR: 0.68 Post-test: 10%

Graph 3: YBT non-contact injuries
and anterior reach asymmetry
Sensitivity: 0.87 Specificity: 0.67
+LR: 2.64 Post-test: 30%
-LR: 0.19 Post-test: 3%

References
1. Hootman JM, Dick R, Agel J. Epidemiology of collegiate injuries for 15 sports: Summary and recommendations for injury prevention initiatives. J Athl Train. 2007;42(2):311-319.
2. Putukian M. The psychological response to injury in student athletes: a narrative review with a focus on mental health. Br J Sports Med. 2015:bjsports-2015-095586.
3. Klenk C a. Psychological Response to Injury , Recovery , and Social Support : A Survey of Athletes at an NCAA Division I University. Response. 2006:1-41.
4. Chorba RS, Chorba DJ, Bouillon LE, Overmyer C a, Landis J a. Use of a functional movement screening tool to determine injury risk in female collegiate athletes. N Am J Sports Phys Ther. 2010;5(2):47-54.
5. Kiesel KB, Butler RJ, Plisky PJ. Prediction of injury by limited and asymmetrical fundamental movement patterns in american football players. J Sport Rehabil. 2014;23(2):88-94.
6. Peate WF, Bates G, Lunda K, Francis S, Bellamy K. Core strength: a new model for injury prediction and prevention. J Occup Med Toxicol. 2007;2:3.
7. Lisman P, O’Connor FG, Deuster P a., Knapik JJ. Functional movement screen and aerobic fitness predict injuries in military training. Med Sci Sports Exerc. 2013;45(4):636-643.
8. Bahr R. .Why screening tests to predict injury do not work and probably never will...:a critical review. Br J Sports Med. 2016;50(13):776-780.
9. Drakos MC, Domb B, Starkey C, Callahan L, Allen A a. Injury in the national basketball association: a 17-year overview. Sports Health. 2010;2(4):284-290.
10. Agel J, Rockwood T, Klossner D. Collegiate ACL Injury Rates Across 15 Sports: National Collegiate Athletic Association Injury Surveillance System Data Update (2004-2005 Through 2012-2013). Clin J Sport Med. 2016;0(0):1-6.
11. Zazulak BT, Hewett TE, Reeves NP, Goldberg B, Cholewicki J. The Effects of Core Proprioception on Knee Injury. Am J Sports Med. 2007;35(3):368-373.
12. Ford KR, Mclean SG. Biomechanical Measures of Neuromuscular Control and Valgus Loading of the Knee Predict Anterior Cruciate Ligament Injury Risk in Female Athletes A Prospective Study Biomechanical Measures of Neuromuscular Control and Valgus Loading of the Knee Predict Ant. Am Orthop Soc Sport Med. 2005;33(4):1-10.
13. Zebis MK, Andersen LL, Bencke J, Kjaer M, Aagaard P. Identification of athletes at future risk of anterior cruciate ligament ruptures by neuromuscular screening. Am J Sports Med. 2009;37(10):1967-1973.
14. Paterno M V, Schmitt LC, Ford KR, et al. Biomechanical measures during landing and postural stability predict second anterior cruciate ligament injury after anterior cruciate ligament reconstruction and return to sport. Am J Sports Med. 2010;38(10):1968-1978.

15. Mclean SG, Walker K, Ford KR, Meyer EG, Hewett TE, Bogert AJ Van Den. Evaluation of a two dimensional analysis method as a screening and evaluation tool for anterior cruciate ligament injury. Br J Sports Med. 2005;39:355-363.
16. Redler LH, Watling JP, Dennis ER, Swart E, Ahmad CS. Reliability of a field-based drop vertical jump screening test for ACL injury risk assessment. Phys Sportsmed. 2016;44(1):46-52.
17. Mckay GD, Goldie P a, Payne WR, Oakes BW. Ankle injuries in basketball : injury rate and risk factors Ankle injuries in basketball : injury rate and risk factors. 2001;(November 2006):103-108.
18. Wang HK, Chen CH, Shiang TY, Jan MH, Lin KH. Risk-Factor Analysis of High School Basketball-Player Ankle Injuries: A Prospective Controlled Cohort Study Evaluating Postural Sway, Ankle Strength, and Flexibility. Arch Phys Med Rehabil. 2006;87(6):821-825.
19. Talukder H, Vincent T, Foster G, et al. Preventing in-game injuries for NBA players Paper ID : 1590. MIT Sloan Sport Anal Conf. 2016;2015:1-13.
20. Beutler AI, de la Motte SJ, Marshall SW, Padua D a, Boden BP. Jump-landing, ACL injury risk, motor patterns, qualitative movement screen 16. J Sport Sci Med. 2009;298(704):663-671.
21. Plisky PJ, Rauh MJ, Kaminski TW, Underwood FB. Star excursion balance test as a predictor of lower extremity injury in high school basketball players. J Orthop Sport Phys Ther. 2006;36(12):911-919.
22. Trojian TH, McKeag DB. Single leg balance test to identify risk of ankle sprains. Br J Sports Med. 2006;40(7):610-3; discussion 613.
23. Gonell AC, Romero JAP, Soler LM. Relationship Between the Y Balance Test Scores and Soft Tissue Injury Incidence in a Soccer Team. Int J Sports Phys Ther. 2015;10(7):955-966.
24. Plisky PJ, Rauh MJ, Kaminski TW, Underwood FB. Star Excursion Balance Test as a Predictor of Lower Extremity Injury in High School Basketball Players. J Orthop Sport Phys Ther. 2006;36(12):911-919.
25. Knapik JJ, Cosio-Lima LM, Reynolds KL, Shumway RS. Efficacy of Functional Movement Screen for Predicting Injuries in Coast Guard Cadets. J Strength Cond Res.2015;29(5):1157-1162.
26. Strategies C. Excerpted from the book, Movement: Functional Movement Systems—Screening, Assessment, Corrective Strategies Verbal instructions for the Functional Movement Screen. 2010.
27. Cook G. Fms Scoring Criteria. Mov Funct Mov Syst -- Screening, Assessment, Correct Strateg. 2010.
28. Niemuth PE, Johnson RJ, Myers MJ, Thieman TJ. Hip muscle weakness and overuse

injuries in recreational runners. Clin J Sport Med. 2005;15(1):14-21.
29. Sinacore JA, Evans AM, Lynch BN, Joreitz RE, Irrgang JJ, Lynch AD. Diagnostic Accuracy of Handheld Dynamometry and 1-Repetition-Maximum Tests for Identifying Meaningful Quadriceps Strength Asymmetries. J Orthop Sport Phys Ther. 2017;47(2):97-107.
30. Cejudo A, Sainz de Baranda P, Ayala F, Santonja F. A simplified version of the weight-bearing ankle lunge test: Description and test-retest reliability. Man Ther. 2014;19(4):355-359.
31. Shea SO, Grafton K. The intra and inter-rater reliability of a modi fi ed weight-bearing lunge measure of ankle dorsi fl exion. Man Ther. 2013;18(3):264-268.
32. Shojaedin SS, Letafatkar A, Hadadnezhad M, Dehkhoda MR. Relationship between functional movement screening score and history of injury and identifying the predictive value of the FMS for injury. Int J Inj Contr Saf Promot. 2014;21(4):355-360.
33. Gabbe BJ, Finch CF, Wajswelner H, Bennell KL. Predictors of lower extremity injuries at the community level of Australian football. Clin J Sport Med. 2004;14(2):56-63.
34. Malliaras P, Cook JL, Kent P. Reduced ankle dorsiflexion range may increase the risk of patellar tendon injury among volleyball players. J Sci Med Sport. 2006;9(4):304-309.
35. Croisier J-L, Ganteaume S, Binet J, Genty M, Ferret J-M. Strength imbalances and prevention of hamstring injury in professional soccer players: a prospective study. Am J Sports Med. 2008;36(8):1469-1475.
36. Söderman K, Alfredson H, Pietilä T, Werner S. Risk factors for leg injuries in female soccer players: A prospective investigation during one out-door season. Knee Surgery, Sport Traumatol Arthrosc. 2001;9(5):313-321.
37. Stiffler AMR, Bell DR, Sanfilippo JL, Hetzel SJ, Pickett KA, Heiderscheit BC. Star Excursion Balance Test Anterior Asymmetry is Associated with Injury Status in Division I Collegiate Athletes. J Orthop Sport Phys Ther. 2017;0(0):1-27.
38. Hertel J, Braham RA, Hale SA, Olmsted-Kramer LC. Simplifying the Star Excursion Balance Test: Analyses of Subjects With and Without Chronic Ankle Instability. J Orthop Sport Phys Ther. 2006;36:131-137.
39. Smith CA, Chimera NJ, Warren M. Association of Y balance test reach asymmetry and injury in Division I Athletes. Med Sci Sports Exerc. 2015;47(1):136-141.
40. Backman LJ, Danielson P. Low Range of Ankle Dorsiflexion Predisposes for Patellar Tendinopathy in Junior Elite Basketball Players: A 1-Year Prospective Study. Am J Sports Med. 2011;39(12):2626-2633.

![2018 national curriculum assessments Key stage 1 · 2018 national curriculum assessments Key stage 1 Phonics screening check Pupils materials [BLANK PAGE] This page is intentionally](https://img.dokumen.tips/doc/110x75/5ecb49f2103d046d6322c0d1/2018-national-curriculum-assessments-key-stage-1-2018-national-curriculum-assessments.jpg)


![2019 national curriculum assessments Key stage 1...2019 national curriculum assessments Key stage 1 Phonics screening check Pupils materials Page 2 of 24 [BLANK PAGE] This page is](https://img.dokumen.tips/doc/110x75/5f0d12247e708231d43888ad/2019-national-curriculum-assessments-key-stage-1-2019-national-curriculum-assessments.jpg)