Embed Size (px)
Citation preview

www.pwc.com.au
Review of the commercial competitiveness of SA Pathology in a contestable market
SA Department for Health and Wellbeing
Final report
March 2019
Disclaimer
Competitiveness of SA Pathology in a contestable market - final report 2
Notice to any reader of this report
This report is not intended to be read or used by anyone other than the South Australian Department for Health and Wellbeing (SA Health).
This report has been prepared by PricewaterhouseCoopers Consulting Australia Pty Limited (PwC) solely for the South Australian Department for Health and Wellbeing (SA Health) in accordance with and for the purpose set out in our scope of work set out in our engagement agreement dated 11 September 2018. In doing so, we acted exclusively for SA Health and considered no-one else’s interests.
We accept no responsibility, duty or liability:
• To anyone other than SA Health in connection with this report
• To SA Health for the consequences of using or relying on it for a purpose other than that referred to above.
We make no representation concerning the appropriateness of this report for anyone other than SA Health. If anyone other than SA Health chooses to use or rely on it they do so at their own risk.
This disclaimer applies:
• To the maximum extent permitted by law and, without limitation, to liability arising in negligence or under statute; and
• Even if we consent to anyone other than SA Health receiving or using this report.
The information, statements, statistics and commentary (together the Information) contained in this document has been prepared by PwC based on publicly available material and information provided by SA Health. The Information contained in this document has not been subject to independent verification, validation or an audit by PwC. The Information must not be relied on by third parties, copied, reproduced, distributed, or used, in whole or in part, for any purpose, without the written permission of PwC. PwC may in its absolute discretion, but without being under any obligation to do so, update, amend or supplement this document.
Liability limited by a scheme approved under Professional Standards Legislation.

Contents
Competitiveness of SA Pathology in a contestable market - final report 3
1. Executive summary p4
2. About this report P10
3. Business overview p15
4. Performance review p24
• Financial performance p26
• Customer performance p36
• Operational performance p39
5. Improvement opportunities p44
6. Contestable and non-contestable services p56
7. Recommendations p66
Appendix 1. Improvement opportunities p72
Appendix 2. Benchmarking approach and analysis p116
Appendix 3. FTE classification mapping p126
Appendix 4. Glossary of terms p128

1. Executive summary
4

1. Executive summaryReport overview
Competitiveness of SA Pathology in a contestable market - final report 5
SA Pathology plays a key role in the delivery of healthcare across South Australia, helping to support clinical outcomes. Current performance
however is variable and presents significant opportunity for improvement.
• In addition to performing diagnostic testing services for over 10,000 patient samples daily, the organisation provides clinical advice to doctors in public hospitalsand the broader community, as well as teaching and training to support the current and potential future workforce.
• Feedback shows Local Health Networks (LHNs) and private customers value SA Pathology’s broad offering and technical ability to provide diagnostic and clinicaladvice. Customer loyalty particularly exists with private customers where SA Pathology successfully competes with other providers and supports patients’ accessto services in remote areas of SA where private providers do not offer services or cannot fully meet needs.
• LHNs are dissatisfied with SA Pathology’s customer service, and they desire closer clinical relationships, more responsive service delivery, improved costtransparency and greater value for money. Limited understanding currently exists by LHNs with regards to service costs, pricing structures and cost recoverylevels due to a lack of accurate information being made available. Service Level Agreements (SLAs) have not been comprehensively developed, limiting the scaleof performance reporting to urgent tests for Emergency Departments only. Customer relationship management activities appear to be highly limited despitecurrent performance.
• These issues and recent EPLIS-related clinical performance concerns have undermined confidence in SA Pathology. This, together with broader fiscal pressureshave acted as a catalyst for LHNs to increasingly consider alternative providers.
• Within SA Pathology, there is a lack of good business management processes and structures in place including strategic and annual business planning processes.Furthermore, commercial practices are inadequate to support close management of service costs, revenues and productivity levels. The absence of theseprocesses constrains organisational performance.
• SA Pathology staff have a high level of professional pride in the work and quality of testing and reporting that SA Pathology delivers. Motivation exists amongststaff to improve performance, however, there appears to be levels of fatigue due to SA Pathology’s involvement in prior reforms.
• In FY18, SA Pathology’s operating expenses were $230m, with an operating deficit of $83.0m. SA Pathology would be unlikely to be sustainably competitive in acontestable environment without extensive changes to its operating model, putting the organisation on a more commercial footing and improving performanceacross the organisation.
Current performance has been driven by a broad range of factors. These include internal capabilities, systems and processes and external factors impacting the business.
• Financial management capability and commercial understanding appears to be limited, as demonstrated by overall financial performance, an inconsistentunderstanding of delivery costs across services and an absence of a clear and consistently understood financial baseline. This is restricting good commercialoversight, effective decision-making and close management of efficiency initiatives.
• The cost and profitability of individual tests are unknown within SA Pathology, limiting the effective management of each Directorate.
• Pricing practices are based on the Commonwealth Medicare Benefits Schedule (MBS). This disadvantages SA Pathology as the MBS underestimates the time andcomplexity to complete some tests, does not cover some complex tests, includes coning rules limiting charging frequency, is not indexed to underlying costincreases and can create market dynamics where SA Pathology is left providing ‘unprofitable’ tests.
• Other public pathology providers have acknowledged this by moving to more cost-reflective, fee-for-service arrangements for public hospitals to drive efficiency,productivity and customer-responsiveness within their operations and assist their customers to better manage their own demand for pathology services.

1. Executive summaryReport overview
Competitiveness of SA Pathology in a contestable market - final report 6
• Lack of business planning cycles and documents mean services are delivered without the guidance of strategic objectives or agreed priorities. This has createdconfusion with some Directorates pursuing potential new markets in the hope of better spreading fixed costs over greater demand, while other Directorates avoidgrowth opportunities due to a lack of clarity of their appropriateness.
• The implementation of the EPLIS laboratory information system has created a number of performance issues negatively impacting turnaround times, clinicalquality, customer service and billing. Actions are being undertaken to rectify remaining issues and restore customer confidence in SA Pathology.
• SA Pathology managers cite a lack of direct day-to-day control of ICT and billing systems as contributors to legacy issues and slow resolution of faults.
• SA Pathology is responsible for a range of broader services which are partially block-funded or in some instances not separately funded (and so are fundedthrough ‘top up’ appropriation funding from government). Examples include teaching, training and research, support for clinical trials, mortuary services,management of emergency responses and public health issues. Clearer funding of these broader services would facilitate stronger governance and accountabilityto ensure they closely align to customers’ needs and efficiently deliver the intended service outcomes.
• SA Pathology’s role as a public provider requires it to maintain a core lab presence at hospitals with emergency department (ED) facilities, restricting its ability toconsolidate operations.
• Approaches to improvement have been made more complex by a heavily unionised workforce and an absence of robust performance management processes,which limits the ability to support performance improvement or pursue alternative options for appropriate staff. Furthermore, SA Pathology operates in anenvironment of high patient expectations given the current service range, pricing approaches and broad network of collection centres.
Opportunities exist to improve financial performance, providing a range of benefits and improving competitiveness. Realisation of these opportunities will require significant focus across the business and full implementation may take until FY22. Additional capability support will help to manage the significant risks associated with implementation.
• When fully implemented (in FY22), the improvement opportunities have the potential to generate gross benefits of $61.9m - $76.5m through cost savings($34.5m - $44.1m) and revenue opportunities ($27.4m - $32.4m) compared to the FY18 baseline costs and revenues presented in this report.
• Some of the proposed cost savings and revenue improvements are internal transfers within SA Health which are important to drive efficiency and accountability,but which do not change the net cost of services to government. Excluding these internal transfers ($23.3m - $26.5m), the potential budget benefits are $38.6 -$50.0m, of which $9.6m relates to current improvement initiatives that have already been recognised within the FY19 budget.
• Some improvement opportunities will require significant time, financial resources and external support to successfully implement, particularly those whichrequire extended consultation with LHNs and clinical stakeholders to manage potential clinical and implementation risks.
• The volume of work, planning and support involved should not be underestimated. Full implementation of some opportunities is likely to take until FY22, andwill require close focus and attention to a range of implementation considerations (see page 55).
• Initial estimates for implementation and transitional costs for FY19-FY22 are cumulative one-off costs of $14.7m, as well as targeted voluntary separationpackages (TVSPs) and a change management program. These initial estimates should be refined through detailed planning for each opportunity.
1. Executive summaryReport overview
Competitiveness of SA Pathology in a contestable market - final report 7
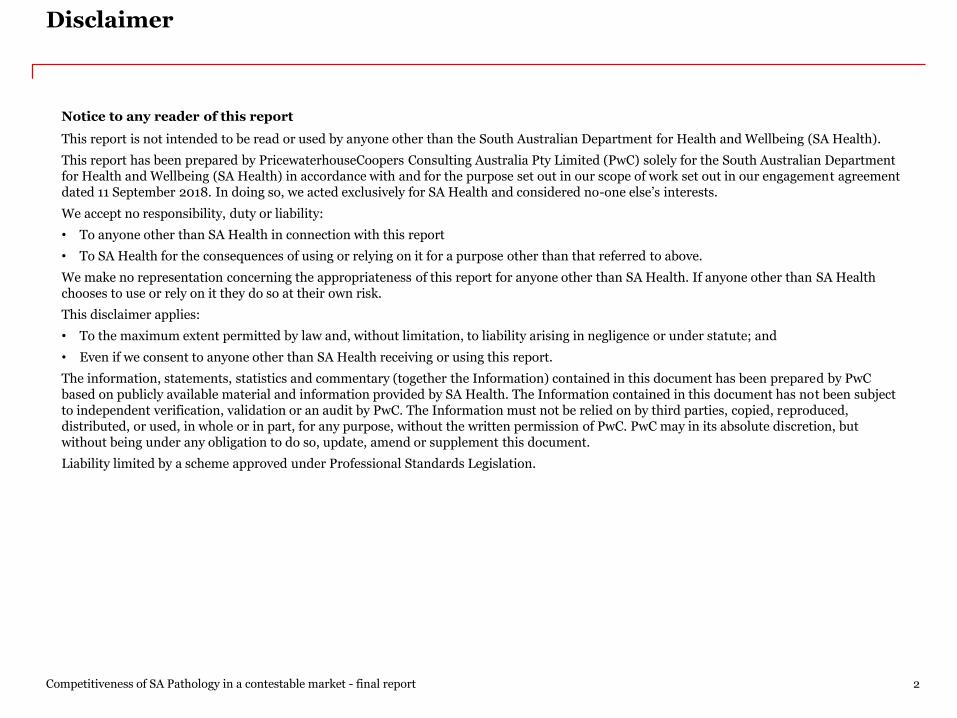
• The estimated net impacts on SA Pathology’s budget for FY19-FY22 (based on mid-point benefits estimates and after implementation costs) are set out below:
Net benefits impact on the budget, after implementation costs ($m)
• The estimated net impacts on budget savings after implementation costs fall short of the Government’s savings targets for SA Pathology which are $25.0m inFY20, $35.0m in FY21 and $45.0m in FY22. However, in future years, SA Pathology should have much more robust and granular financial and performanceinformation, stronger governance and accountability, and an improved commercial culture which should allow it to identify further efficiency savings andproductivity improvements.
• Cost related opportunities relate to operational consolidation, rebalancing of staff mix, improved procurement and realisation of specific Directorate /organisational / system efficiency opportunities.
• Revenue improvement opportunities relate to remediation of billing issues, movement to a fee-for-service pricing model and tactical growth in key areas.
• A performance uplift will also require improvement in business management. These initiatives relate to business and strategic planning, performance reporting,and improving the level of commercial acumen and management capability across the organisation. It is not possible to quantify the financial benefit of theseinitiatives, however they are key to supporting realisation of efficiency opportunities and long-term sustainability.
• Whilst the capability of management has not been assessed, achievement of benefits will require comprehensive planning and capability support given the scale ofopportunities and the need to run ‘business as usual’ activities in tandem. Capability support options include additional Executive level recruitment, specialistPMO resourcing, performance improvement support from an advisory organisation or a strategic partnership with a business management organisation oralternative provider.
• SA Pathology’s Executive independently developed a high level set of potential cost savings initiatives which broadly correspond to those identified in thisanalysis. As at March 2019, high level consultation with LHNs has commenced on six broad areas of potential savings initiatives.
Analysis suggests the majority of SA Pathology’s services could be supplied by alternative providers with appropriate contract conditions and
risk management arrangements. Sensitivities and concerns are highest for services traditionally delivered by Government.
• SA Pathology plays a critical role in supporting the public health system, including the provision of broader services. Stakeholder sensitivities and a need for closeGovernment control means that delivery of specific services such as public health and primary research would traditionally be delivered directly by Government.Whilst considered innovative, potential may exist for these services to be delivered by non-Government organisations within an appropriately designedagreement. Such an arrangement would require careful structuring, and further testing and refinement with key stakeholders.
FY19 FY20 FY21 FY22
Total gross benefits 6.6 29.9 48.0 69.2
- Assumed already in the budget 6.6 8.4 9.6 9.6
- Internal revenue/cost transfer 0.0 14.3 20.2 24.9
Total budget impact 0.0 7.3 18.3 34.8
- Implementation costs 2.7 5.0 7.0 0.0
Net budget benefit -2.7 2.3 11.3 34.8
1. Executive summaryReport overview
Competitiveness of SA Pathology in a contestable market - final report 8
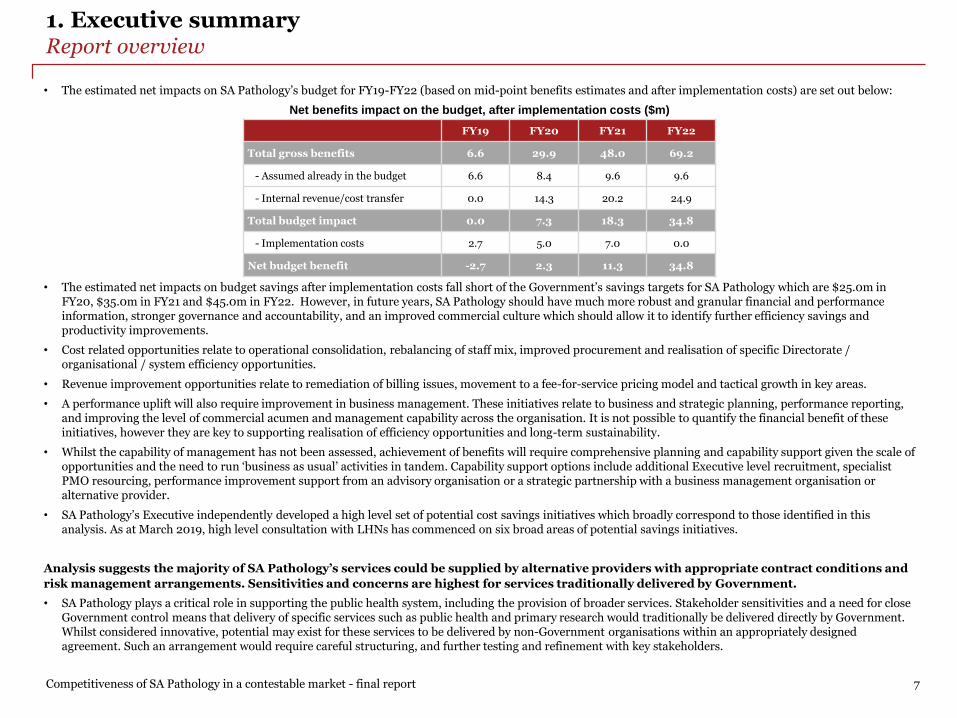
• A range of challenges, however, restrict the ability of Government to separate these services away from those that could more easily be delivered by alternativeproviders. Challenges relate to the existence between services of i) shared assets, staff and systems, ii) operational and clinical dependencies, iii) cross-subsidiesas well as customer expectations relating to available service ranges. Therefore, whilst theoretical separation of services into ‘contestable’ and ‘non-contestable’groups is possible, current operational arrangements do not support this.
Should contestability be pursued, the most appropriate model would involve competitive bids to deliver the full range of pathology services,
encompassing all SA public health facilities, for a defined period. This would require careful design of contestability arrangements and
implementation.
• Should Government wish to pursue a contestability agenda for public pathology within SA, this model would need to include the full range of services as currentlydelivered by SA Pathology. Contestability would therefore be an ‘all or nothing’ decision. This approach would mitigate the associated separability risks andimplementation risks by retaining many of the ‘network’ benefits, synergies and economies of scale inherent in having a single provider for all services in what isa small public pathology market.
• This contestability model would see providers compete for the exclusive right to provide all public pathology services. Delivery would be structured for a definedperiod of time, subject to meeting or exceeding required operational, clinical and financial performance levels. A range of options exist with regard to howcompetition could be facilitated including competition for long-term operational franchising of the whole entity, privatisation of SA Pathology or competition forthe placement of a non SA Government management team to lead and manage SA Pathology’s operations.
• Competition Law restrictions may also limit the ability for some existing providers to participate as the ACCC has previously taken close interest in any proposalslikely to affect competition in the already heavily concentrated private pathology market. Further market/stakeholder engagement would be needed to furtherdefine and manage this risk.
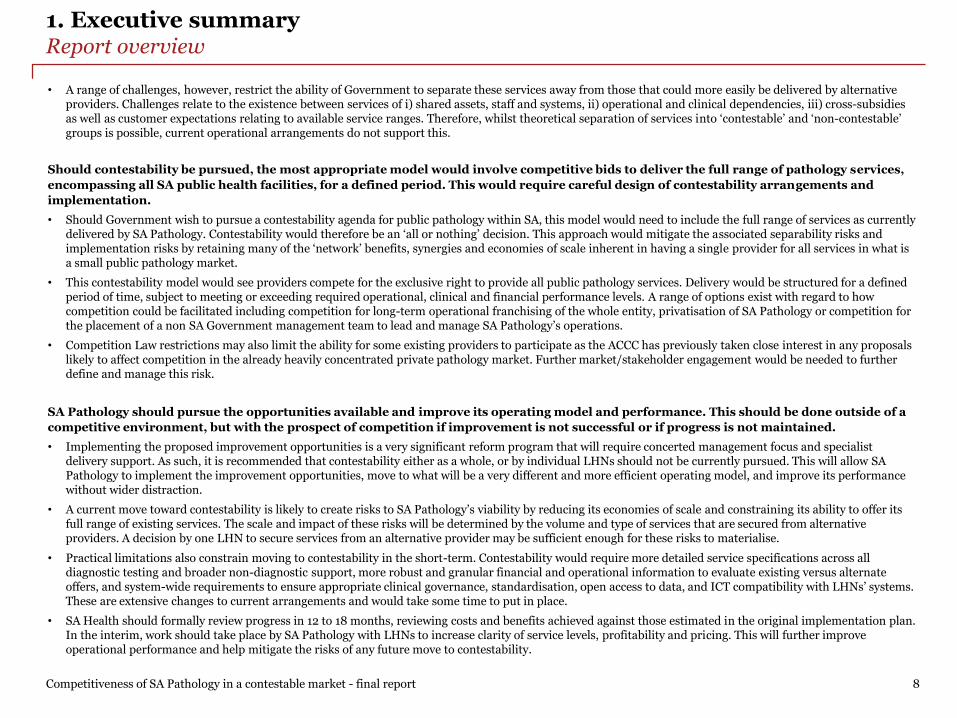
SA Pathology should pursue the opportunities available and improve its operating model and performance. This should be done outside of a
competitive environment, but with the prospect of competition if improvement is not successful or if progress is not maintained.
• Implementing the proposed improvement opportunities is a very significant reform program that will require concerted management focus and specialistdelivery support. As such, it is recommended that contestability either as a whole, or by individual LHNs should not be currently pursued. This will allow SAPathology to implement the improvement opportunities, move to what will be a very different and more efficient operating model, and improve its performancewithout wider distraction.
• A current move toward contestability is likely to create risks to SA Pathology’s viability by reducing its economies of scale and constraining its ability to offer itsfull range of existing services. The scale and impact of these risks will be determined by the volume and type of services that are secured from alternativeproviders. A decision by one LHN to secure services from an alternative provider may be sufficient enough for these risks to materialise.
• Practical limitations also constrain moving to contestability in the short-term. Contestability would require more detailed service specifications across alldiagnostic testing and broader non-diagnostic support, more robust and granular financial and operational information to evaluate existing versus alternateoffers, and system-wide requirements to ensure appropriate clinical governance, standardisation, open access to data, and ICT compatibility with LHNs’ systems.These are extensive changes to current arrangements and would take some time to put in place.
• SA Health should formally review progress in 12 to 18 months, reviewing costs and benefits achieved against those estimated in the original implementation plan.In the interim, work should take place by SA Pathology with LHNs to increase clarity of service levels, profitability and pricing. This will further improveoperational performance and help mitigate the risks of any future move to contestability.

1. Executive summaryRecommendations
Competitiveness of SA Pathology in a contestable market - final report 9
Recommendations focus on supporting a comprehensive improvement in SA Pathology’s operating model to support long-term sustainability
and commercial decision making. Implementation success will rely on SA Pathology’s capacity and capability and external support will be
required to mitigate implementation risks.
1. A clear, realistic and appropriately resourced plan is required to deliver the bold changes needed and realise the identified efficiencies. This will build on SA
Pathology’s existing work and should be supported by additional specialist delivery capability. This will assist in managing the risks associated with
implementing a reform program of this scale and the required changes to SA Pathology’s operating model. SA Pathology will need to work closely with staff and
unions as appropriate.
2. SA Pathology should develop a robust approach to improve financial, commercial and managerial capability and understanding across the organisation. This
would include supporting development across Directorates and Business Management and establishing clearer commercial and financial decision making
protocols.
3. Further development of the financial and operational baseline to support improved understanding and long term sustainability. This should include
identification of the costs (and profitability) of all tests and wider activities such as research.
4. Work should be undertaken to strengthen existing commercial approaches by establishing detailed Service Level Agreements, revising pricing and improving
customer relationship management approaches.
5. SA Government should formally review SA Pathology’s progress in 12 to 18 months to ensure the planned improvement opportunities are progressing as planned
and SA Pathology is well developed in implementing its new operating model.

2. About this report
10
2. About this reportContext within the broader SA Pathology Sustainability Project
Against the context of industry pressures, historical performance and ongoing stability, SA Pathology is currently undertaking a Sustainability Project. This project has four workstreams, including the review of SA Pathology’s competitiveness within a contestable market which is the subject of this report
Scope of the SA Pathology Sustainability Project
In response to industry-wide pressures from customers, Government and potential competitors, SA Health is completing the SA Pathology Sustainability Project to develop and implement a new model for a competitive public pathology service in an era of contestability.
This new public pathology model is intended to support SA Pathology to achieve more commercially competitive performance and demonstrate greater economic, clinical and social value to SA Health. This includes responding to significant budget pressure, with the 4 September 2018 State Budget announcing the expectation for SA Pathology to achieve efficiencies of $25m in FY20, rising to $45m from FY22.
The project is being delivered through four workstreams that are designed to build momentum for change and improvement across the organisation:
1. Change management – to support the delivery of a successful changemanagement approach. To support this work, OzTrain, a specialist changemanagement organisation was engaged by SA Pathology to assist incommencing the change management process.
2. Contestability – to ensure SA Pathology is competitive in a contestablemarket. To deliver this work, PwC was engaged.
3. Demand management – to support purchasers to reduce the volume andcosts of pathology tests ordered.
4. Business improvement – to explore all options within SA Pathology’smodel to identify potential savings, grow revenue and ensure it has soundbusiness management practices in place. This work focuses on the potentialto make changes to support savings targets in FY20 and beyond.
These workstreams have been closely aligned under a common project governance structure to reinforce synergies and avoid duplication of effort.
PwC’s scope of work on contestability
PwC was engaged by the SA Department for Health and Wellbeing (SA Health) to review SA Pathology in the context of a contestable environment. The scope of this review focused on the following:
1. Report, analysis and stakeholder communications
Examine the previous SA Pathology efficiency review and staff and stakeholder feedback to ensure the current review approach and methodology mitigates the issues experienced previously.
2. Services cost and saving analysis
Determine the cost of undertaking services for both public hospitals and for private work. Undertake a transparent analysis of the cost-effectiveness and opportunity for savings in the following areas:
• Examining the cost of collection centres/private work compared to therevenue generated from these centres and private work.
• Contestability – to improve competitiveness of SA Pathology and todetermine which services should be provided only by SA Pathology in itsrole as a public provider.
• Clinical and social value – such as the role of pathology in reducingpathology utilisation (demand management).
• Potential strategy for exiting from non-core services.
• Opportunity for structural changes to deliver expected savings.
• Opportunities for increasing revenue.
3. Identification of core services
Identify essential public services, which would be considered out-of-scope in a contestable model.
4. Contestability options modelling risk assessment
Identify models for costing and funding out-of-scope essential public services, which would otherwise disadvantage SA Pathology in a contestable environment and provide an alternative method of delivering these services if contestability is implemented.
Competitiveness of SA Pathology in a contestable market - final report 11

2. About this reportScope, approach and outputs
This report summarises the key analysis and findings against each scope item. Analysis has been supported by engagement across SA Pathology, SA Health and the broader pathology sector, as well as the review of relevant data
Competitiveness of SA Pathology in a contestable market - final report 12
Scope item 1: Report analysis and stakeholder communications
• Examine previous efficiency reviewand staff and stakeholder feedbackto ensure current review approachmitigates the issues experiencedpreviously.
Approach
• Received briefings regarding priorreview.
• Co-located and aligned PwC and SAPathology teams.
• Analysis tasks supported bysignificant engagement with staff.
• Key financial analysis items andbenchmarking completed in closeconsultation with staff.
• Project governance arrangementsdeveloped to support effectivemanagement and mitigation ofrisks.
• Revised Project Plan.
• Input to SA PathologySustainability Project Plan.
• Staff and union engagement.
Relevant report sections
• Section 2: About this report –applying learnings from previousreviews.
Scope item 2: Services cost and savings analysis
• Determine the costs of undertakingservices for public hospitals andprivate work.
• Transparently analyse the cost-effectiveness and opportunities forsavings across nominated areas.
Approach
• Collated and validated with staff afive year costs/revenue/activitybaseline.
• Baseline trend analysis and high-level benchmarking against otherpublic providers.
• Interviewed customers to gatherperspectives on performance.
• Developed potential improvementoptions and developed furtheranalysis on prioritised options.
• Interviews with SA Pathology staffand wider stakeholders.
Relevant report sections
• Section 4: Performance review
• Section 5: Improvementopportunities
• Appendix 1: Improvementopportunities
• Appendix 2: Benchmarkingapproach and analysis
Scope item 3: Identification of core services (contestable and non-contestable)
• Identify essential public services,which would be considered out-of-scope in a contestable model.
Approach
• Developed a review framework tohelp identify contestable and non-contestable services.
• Interviews with SA Pathology staff.
• Service review workshop held withSA Pathology.
• Interviews with customers,alternative providers and industrybodies.
• Researched the extent ofcontestability within publicpathology services currently inAustralia.
Relevant report sections
• Section 6: Contestable and non-contestable services.
Scope item 4: Contestability options modelling risk assessment
• Identify models for costing andfunding out-of-scope essential publicservices and provide alternativemethods of delivering these servicesif contestability is implemented.
Approach
• Interviews with SA Pathology staff.
• Interviews with customers,alternative providers and industrybodies.
• Research of potential funding modelsfor non-contestable services.
Relevant report sections
• Section 6: Contestable and non-contestable services.
• Section 7: Recommendations.
2. About this reportBasis of preparation
To ensure the robustness of analysis and findings, our approach has involved substantial consultation throughout the deliveryof this project. This has primarily included engagement with SA Pathology staff and business managers with over 100 meetings taking place, as well as engagement with wider industry stakeholders
Competitiveness of SA Pathology in a contestable market - final report 13
Data on SA Pathology’s costs and revenues was sourced from the SA Pathology General Ledger (PATH01), a recent staff survey (2017-18) and responsibility index (RI) mappings provided by SA Pathology. FTE and test activity volumes were drawn from Millennium and its predecessor ULTRA, and in many cases supplemented with manual records retained by Directorate Managers.
A five year baseline of costs, revenues, FTEs and volumes was completed for all Directorates and for SA Pathology as a whole, which required extensive analysis and consultation to review, understand and clarify cost and revenue data including, but not limited to:
• Testing and refining data accuracy with SA Pathology’s Directorate Managers, Contracts and Business Modelling Manager, Directorate BusinessManagers and Statewide Clinical Support Services’ (SCSS) Financial Business Advisor, Financial Operations Manager, and Manager Revenue Services.
• Incorporating data from an SA Pathology staff survey to estimate the cost of research and training.
• Working with SA Pathology and SCSS staff to estimate unbilled revenue due to poor data quality leading to IT system errors and SA Health accountingconventions.
• Consultation with SCSS staff to differentiate (and reallocate) indirect operating costs from true overhead costs.
• Consultation with Directorate Managers and Directorate Business Managers to differentiate specific cost and revenue items they regard as outside of SAPathology’s scope of operations despite these items being on the general ledger.
Benchmarking analysis was carefully designed to overcome challenges encountered in the prior efficiency improvement program by:
• Limiting external benchmarks to publicly available data only (in practice IHPA data) in line with prior SA Pathology commitments to staff.
• Using benchmarking to inform the prioritisation of areas for further detailed optimisation analysis only.
Improvement and savings opportunities were developed in consultation with SA Pathology:
• Initial hypothesis on potential opportunities were developed in a workshop with SA Pathology, PwC and subject matter experts.
• Opportunities were prioritised and refined and further opportunities identified from financial analysis.
• Implementation steps, timings and costs for improvement opportunities were developed, allowing closer estimation of the scale and timing of benefits.
Operational performance was assessed by review of available performance data and customer and stakeholder interviews:
• Review of available performance reporting on turnaround times and internal financial reporting to Directorate Managers.
• Interviews with customers including Local Health Networks (LHNs) and community referrers such as GPs and specialists in private practice.
• Interviews with other stakeholders such as regulatory authorities, industry bodies, unions and alternative providers.
Contestable (non-core) and non-contestable (core) services were differentiated:
• Criteria and a framework were developed to guide identification of contestable (non-core) and non-contestable (core) services.
• A workshop was held with SA Pathology and PwC’s subject matter experts to apply the framework, consider implementation risks, and consider pricing,structural or other arrangements to better support delivery of any non-contestable services.
• SA Pathology provided further input directly to the PwC team with regard to broader considerations and risks relating to contestability.

2. About this reportApplying learnings from previous reviews
Our approach has been heavily informed by the lessons learnt from previous reviews. Throughout our analysis we have worked closely with SA Pathology staff and stakeholders to inform our findings and the development of recommendations
Lessons learnt from the prior
Efficiency Improvement Program
1. Staff did not accept the savings targets underpinning
the prior review because they saw the baseline
information presented on SA Pathology’s costs,
revenues and activity levels as inaccurate, and could
not scrutinise the confidential industry benchmarks
used to calculate the savings targets.
2. Staff and stakeholder engagement were too narrowly
focused on cost benchmarks and did not sufficiently
address issues such as clinical effectiveness, patient
safety and impacts on customers such as patient flow.
3. The timing of proposed changes coincided with
relocating some operations to the new Royal Adelaide
Hospital and problems encountered in implementing
new business information systems, with flow-on
impacts to test ordering and tracking, pathology
report quality and timing, and customer billing.
4. There was an absence of local and incremental
consultation and engagement with regards to analysis
and proposed changes.
5. More comprehensive resourcing was required to
support delivery of the planned reforms, including
project management and specific expertise areas such
as communications, industrial relations and change
management.
Source: SA Pathology Lessons Learnt and interviews
Application of lessons learnt
Application within the delivery of PwC’s scope of work
• Workshop held during the project implementation phase with SA Pathology
executives and nominated staff to identify lessons learned and map the business’
strategic context.
• Multiple interviews with SA Pathology staff to build a comprehensive understanding
of the business and compile a five year baseline of costs, revenues and activity levels
to ensure a correct understanding of data and trends.
• Iterative consultation and testing of the baseline data with Directorate Managers
and key staff to ensure accuracy and correct interpretation.
• Benchmarking approach agreed with SA Pathology in the context of prior concerns
and staff commitments.
• Improvement initiatives developed in consultation with SA Pathology’s Directorate
Managers and Executive to ensure they are based on realistic assessments of
potential reforms.
• High level screening of improvement opportunities with clinical stakeholders to
identify potential clinical risks to be further considered in detailed implementation
planning.
• Analysis of cost-effectiveness based on financial analysis of SA Pathology’s costs and
quantification of potential savings initiatives, rather than the approach used in the
prior Efficiency Improvement Program which relied on comparison to external cost
benchmarks.
• Participation in staff meetings, and presentations to clinical and union forums.
• Weekly project meetings with SA Pathology project lead group and SA Pathology
Executive Director.
• Involvement with broader SA Pathology sustainability project activities as requested.
Competitiveness of SA Pathology in a contestable market - final report 14

3. Business overview
15

3. Business overviewBackground
Created in 2008 as a single statewide public pathology service for South Australia, SA Pathology was formed to better respond to demand and rationalise areas of service duplication. The business provides a broad range of key services that support clinical outcomes and the broader SA Health system
Competitiveness of SA Pathology in a contestable market - final report 16
Formation
In 2008, SA Pathology was formed as a single statewide public pathology service by merging the SA Institute of Medical and Veterinary Science (IMVS) with the pathology departments of South Pathology and the SA Women’s and Children’s Hospital. Subsequently, the Centre for Cancer Biology (CCB) was established within SA Pathology as a Medical Research Institute based on an alliance between SA Pathology and the University of South Australia. SA Pathology was created to realise the benefits of the statewide model including minimising unnecessary duplication and overheads and improving the retention and recruitment opportunities for all staff. It was also formed to strengthen capacity to respond to increasing levels of demand and better position responses to new diagnostic technologies.(a)
Service offering
As a public provider, SA Pathology plays a key role in supporting the health of South Australia. In addition to performing diagnostic testing services for over 10,000 patient samples daily, the organisation provides clinical advice to doctors in public hospitals and the broader community, as well as teaching and training to support the medical workforce. Services also include leading research into new forms of preventative diagnostics and helping to monitor infectious diseases and manage disease outbreaks, food poisonings and other biohazards to ensure public health standards for citizens. The service range includes the following areas:
• Diagnostic services – examination of specimens, testing including Point of Care Testing (POCT) performed outside of labs, analysis and reporting of results tosupport clinicians in diagnosing patients and support to SA Health in monitoring and managing public health issues such as outbreaks of infectious diseases, foodpoisonings, biohazards, particular health issues within vulnerable sections of the community and the emergence of new diseases.
• Clinical services – clinical interpretation of results, clinical governance of diagnostic testing quality and advice to clinicians on selecting appropriate tests.
• Multi-disciplinary teams – scheduled and informal team meetings with clinical specialists collaborating to diagnose and treat patients with complex needs.
• Toxicology – testing for the effects of chemical substances e.g. poisons on living organisms, drug testing workforces.
• Food and Environment Lab – independent testing of food, the environment (air and water), cleaning products and pharmaceuticals for commercial clients andSA Health to support their management of public health emergencies requiring testing of food safety or identification of unknown substances which may pose athreat to human or environmental health.
• Transfusion medicine – blood bank and stem cell management, including the processing, testing and distributing of blood products.
• Research – including diagnostic testing support to clinical trials and primary research into pathology practices to develop new insights and tests.
• Teaching and training – teaching and training of medical students, pathology registrars, staff and clinicians in public hospitals.
• Patient collection services –collection of samples from patients in hospital wards and at collection centres.
• Courier services –transportation of specimens from collection centres to SA Pathology labs or other approved pathology provider labs.
• Policy input – independent specialist pathology input and advice to Government including representation on State and National public health committees.
• Mortuary – provision of mortuary services for South Australia.
Notes: (a) SA Government Hansard - Wednesday, 9 April 2008, Page 2738, cited at page 35 in SA House of Assembly 2007-08, House of Assembly Digest – A Summary of the 2nd session of the 51st Parliament, SA Parliament, accessed 12 December 2018, https://www.parliament.sa.gov.au/HouseofAssembly/BusinessoftheAssembly/RecordsandPapers/Digest/Documents/DigesttoPrinters.pdf. See also SA Attorney General’s Department 2008, Statutes Amendment and Repeal (Institute of Medical and Veterinary Science) Act 2008, Assented to 26/06/2008- Act No 24 of 2008 accessed 12 December 2018, https://www.legislation.sa.gov.au/LZ/V/A/2008/STATUTES%20AMENDMENT%20AND%20REPEAL%20(INSTITUTE%20OF%20MEDICAL%20AND%20VETERINARY%20SCIENCE)%20ACT%202008_24/2008.24.UN.PDF

3. Business overviewOperating model
Competitiveness of SA Pathology in a contestable market - final report 17
Anatomical
Pathology
The diagnosis of
disease from
examining tissue
samples and cellular
smears. Undertakes
autopsies and
manages tissue bank
FTEs: 173 (a)
FY18 Exp: $36m (a)
Locations: 6 labs
Chemical
Pathology
The use of chemical
analysis to test
tissue, blood and
body fluid samples
FTEs: 33 (a)
FY18 Exp: $7m (a)
Locations: 2 labs
Genetics and
Molecular
Pathology
The diagnosis of
genetic and
molecular conditions
from tissue, blood
and body fluid
samples
FTEs: 105 (a)
FY18 Exp: $16m (a)
Locations: 4 labs
Haematology
The testing of blood,
blood cells and blood
products
FTEs: 74 (a)
FY18 Exp: $13m (a)
Locations: 6 labs
Immunology
The examination of
tissue, blood and
body fluid samples
for immune
responses
associated with
disease
FTEs: 43 (a)
FY18 Exp: $9m (a)
Locations: 3 labs
Microbiology
The study of
microscopic
organisms in tissue,
blood and body fluids
FTEs: 174 (a)
FY18 Exp: $31m (a)
Locations: 4 labs
SA PathologyFTEs (a) : 1,413.9
FY18 Diagnostic Revenue (b) : $144m (c)
FY18 Expenditure (b) : $230m (d) (excludes $23m of non-cash items)
Customer services
Metro couriers, delivery of consumables
to GPs, medical centres and private
surgeries and reporting printing
FTEs: 54 (a)
FY18 Exp:$9m
Corporate overheads
Overheads at the corporate
level including billing, ICT
and other
FTEs: 57
FY18 Exp:$21m (e)
Patient Services
Metro collection centres. This
is treated as a cost centre
FTEs: 138 (a)
FY18 Exp:$13m
Notes: (a) including overtime and extra hours and includes teaching, education and training; (b) costs and revenue include both capital and operational.; (c) In addition to the diagnostic revenue SA Pathology has other revenue sources not listed here; (d)
excludes non operating expenses of $31.3m and $22.8m of non cash expenses but includes out of scope expenses; (f) includes FTEs for specimen reception and call centres; (g) includes FTEs for regional couriers and regional collection centres; (h) non-
operating are specific SPFs which have a net cost recovery of $0.0m Out of scope represents business which Directorates considered not belonging to them such as CCB.
Legend: Red indicates Directorates, orange indicates support services and grey indicates research
Research Support
Research support, which is
captured separately in the Ledger
in addition to Directorates’ research
FTEs: 17 (a)
FY18 Exp:$2m
SA Pathology is structured into eight Directorates each managed by a Directorate Manager and a Clinical Director. These are supported by customer services (couriers, report printing and delivery of consumables to GPs, medical centres and private surgeries) and patient services (metropolitan collection centres). Human resources, finance and some executive functions are shared with other statewide clinical support services. ICT services are provided by eHealth
Regional
Pathology
Manages country
collection centres and
couriers. Automated
and semi-automated
testing including
chemical,
haematology, and
microbiology
FTEs: 148 (a) (g)
FY18 Exp: $21m (a)
Locations: 11
regional sites
Automated
laboratory
Sample receipt and
distribution. Routine
testing and reporting.
Testing in: chemical,
microbiology,
immunology and
haematology
FTEs: 324 (a) (f)
FY18 Exp: $46m (a)
Locations: 6 labs
Non-operating / out of scope (h)
Non-operating activities are mainly
research out of specific funds and some
FTE not reconciled to Directorates
FTEs: 75 (a)
Non-operating net cost recovery is $0m.
For out-of-scope it is -$5m in FY18

3. Business overviewOperating model
SA Pathology’s operating model includes laboratories in both metropolitan and regional locations. A number of improvement activities have been undertaken in recent years to raise service quality and efficiency, with variable levels of success
Competitiveness of SA Pathology in a contestable market - final report 18
Governance
SA Pathology is a business within Statewide Clinical Support Services (SCSS) which also administers SA Health’s Pharmacy, Medical Imaging and Breast Screening services. Formally SCSS is administered as part of Central Adelaide Local Health Network (CALHN) and governance arrangements include oversight from CAHLN and the Group Executive Director of SCSS.
These administrative and reporting arrangements are different from some other public pathology providers. For example, those in NSW and WA are distinct entities with independent Boards and Chief Executives with direct reporting lines to their health department Secretary.(a)
Operating model
SA Pathology operates 18 laboratories including seven in metropolitan locations and 11 in regional locations. These laboratories are typically based at public hospitals to support emergency departments, intensive care units and wards. An exception to this is the Frome Road laboratory which was part of the old Royal Adelaide Hospital prior to the hospital’s relocation to a new site.
SA Pathology has 90 collection centres dispersed across the state to collect samples from patients. These are mainly located at hospitals and community medical practices. SA Pathology has its own metropolitan courier network and sources some external couriers in metropolitan and regional areas.
Since formation, a number of operating model reforms have been undertaken. The scale of reforms together with associated issues have frequently served as a ‘distraction’ and placed a burden on operational performance and business as usual activities. Some evidence of ‘reform fatigue’ exists across the business.
• An independent efficiency review in 2014 and subsequent EfficiencyImprovement Program identified potential efficiency savings within thebusiness. Work to realise these savings was suspended in August 2017 inpart due to the challenges of a new laboratory information system (EPLIS)and the move to the new Royal Adelaide Hospital.
• Between 2014 and 2018, SA Pathology developed and implemented a newlaboratory information management system (EPLIS) to provide a uniforminterface for order entry, workflow management and results reporting. Anumber of challenges have been experienced during the implementationof this system in 2017 and 2018 including issues relating to service quality,accuracy and billing. Some of these issues continue to impact businessperformance.
• Ongoing consolidation and standardisation of some services as well as testrationalisation (removing test duplication) for non-urgent testing. In 2017,the new Royal Adelaide Hospital enabled consolidation of routinecommunity-referred testing to a single site using modern automatedtechnology (Roche and Kiestra).
Noarlunga
Lyell McEwin Hospital
Flinders Medical Centre (FMC)
Frome Road (b)
Women’s and Children’s Hospital
nRAH
Modbury Hospital
Queen Elizabeth Hospital
Port Augusta Port Pirie
Berri
Murray Bridge
Mount Gambier
Victor Harbor
Wallaroo
Port Lincoln
Gawler
Whyalla
Notes: (a) NSW Health Pathology at https://www.pathology.health.nsw.gov.au/about-us/our-governance, PathWest is a Chief Executive Governed Health Service Provider which is a distinct Statutory Authority subject to the governance,
performance and accountability framework within the WA Health Services Act 2016 https://www.mediastatements.wa.gov.au/Pages/McGowan/2017/12/Governance-change-for-States-leading-pathology-service.aspx. Accesses January 2019
Location of laboratories

3. Business overviewWorkforce
SA Pathology has a highly qualified workforce which delivers high-quality pathology reports and clinical support to clinicians, enabling them to diagnose patients more rapidly and accurately and commence appropriate treatments
Competitiveness of SA Pathology in a contestable market - final report 19
Workforce highlights
• SA Pathology employs a workforce of 1,413.9 FTEs (including overtime and benefits( (in FY18), which includes 74.7 of non-operating or out of scope FTEs(g), who areexcluded from the below analysis. This workforce includes scientifically and medically trained professionals, some of whom hold dual qualifications as clinicians andpathologists. This breadth of skill and training is a core part of the business’ value proposition.
• As part of their role, staff participate in multi-disciplinary team meetings (MDTs) attended by pathologists from Anatomical Pathology, Haematology andMicrobiology Directorates, with hundreds of meetings attended annually by pathologists within Anatomical Pathology alone. Staff also support on-call assistanceavailable by telephone 24 hours a day, 365 days a year.
• Self reported data indicates 6.8 FTEs (or 0.5% of all FTEs) were focused on teaching and training and 40.1 FTEs (or 2.8% of all FTEs) were focused on research inFY18. (a) The accuracy of this data has not been validated and it is expected that in reality, resource numbers in these areas are higher.
Operating model division Clinical(d) MedicalScientist(d)
Technical Officer(d)
Admin and other(d)
Operational Nurses Total
Automated - testing - 72.1 103.9 1.1 0.0 - 177.2
Microbiology 12.8 77.7 78.2 5.5 - - 174.2
Anatomical Pathology 43.9 44.7 54.2 30.5 - - 173.4
Regional Pathology (c) 12.8 42.2 42.0 50.7 - - 147.7
Specimen reception and call centre and PoCT (part of Automated) 0.0 1.9 6.9 50.9 86.9 - 146.7
Patient services - - 5.5 1.7 83.6 46.9 137.7
Genetics and Molecular Pathology 2.7 67.3 28.5 6.7 - - 105.2
Haematology 7.4 41.5 23.3 1.8 - - 74.0
Corporate overheads 2.0 4.7 10.7 39.3 - - 56.7
Customer Services - - 0.1 53.4 - - 53.5
Immunology 5.6 18.5 15.7 2.8 - - 42.7
Chemical Pathology 4.1 18.6 8.7 1.6 - - 33.0
Research support (e) 0.0 3.0 0.5 13.8 - - 17.3
Total (f) 91.3 392.3 378.3 259.9 170.5 46.9 1,339.2
SA Pathology workforce structure (FTE numbers (b))
Source: SA Pathology General Ledger (PATH01) - FTE: SA Pathology payroll data (1.a FTE FOR EXEC BY EMP AND CLASS_15-16_16-17_17-18FY.xlsx
Notes: (a) Estimates based on a self-reported staff survey and data drawn from the General Ledger. SA Pathology believes this under-represents the time expended on teaching, training and research but does not have more accurate data.
(b) represents FTE including overtime, leave allowance and other benefits; (c) includes regional collection centres, couriers and specimen reception; (d) classifications as per the FTE classification mapping in Appendix 3; (e) from the research support
specific segment and excludes staff survey reported research; (f) excludes 74.7 FTE marked as out-of-scope, removed by Directorates to non-operational (and hence does not directly correlate with total FTEs of 1,413.9 in FY18). Legend: shaded areas
represent overheads and indirect costs. (g) non operating are research specific SPFs which have a net cost recovery of $0.0m and out of scope represents business which directorates did not consider as part of their business such as CCB.

3. Business overviewCommercial approach
SA Pathology has multiple customer groups and sources of revenue. Pricing approaches for diagnostic tests are influenced by the MBS, ‘coning’ restrictions for aggregate charges and agreements negotiated with LHNs
Competitiveness of SA Pathology in a contestable market - final report 20
Payer Testing groupPercentage charged of item
on Medicare Benefits Schedule
Coning rules appliedLimitations on claiming
payment
Local Health Networks (LHNs)
Public patient 85% • In practice the majority of tests are charged as coning rules are less restrictive than Medicare rules.
• However, multiple related tests on a single order are charged at a lower rate where they are completed in asingle pass through the relevant testing equipment.
Claim must be within the same financial year as the test
Outreach groups (Breast Screen, STD Clinic etc.)
85%
Medicare Non admitted patient with Specialists requests 85% • Limited coning for specialist requests.
Claim must be within 2 years from referral
Medicare/Private Fund
Private admitted patient with private health fund insurance
(PHF 25% + 75% Medicare) • ‘Day Coning’ rules limit rebates based on the recurrence of particular tests ordered within a single day.
• These more restrictive and detailed Medicare coning rules are designed to restrict over-ordering.
Medicare/Patient Private admitted patient without Health Fund and benefits assigned
75%
DVAPatient holds a DVA Gold Card 100%
Medicare/Patient Non admitted patients with GP requests 85% • ‘Episode Coning’ rules which limit rebates based onthe recurrence of particular tests ordered over the duration of a single patient episode.
• Typically only the three most expensive test item are allowed, with some exceptions.
Claim must be within 2 years from referral
Insurer/Patient
Overseas patients 85%
Compensable patients 85%
Client Commercial/Research testing Variable• Test items are grouped and coned within a specific
request as is common industry practice as these services are already contestable.
Limited to available funding in research project
Patient Patient requested testing 100%
Historically, SA Pathology charges LHNs 85% of the relevant item on the Medicare Benefits Schedule for the costs of diagnostic testing for public in-patients and public patients in out-patients clinics. This pricing policy is common practice in the private pathology industry, but the MBS schedule does not reflect the full costs of providing the broader range and higher complexity of public pathology services. Public pathology providers in QLD and NSW have moved towards a more cost-reflective ‘fees-for-service’ model to better inform internal management and investment decision making and customers’ demand management.
For private patients in public hospitals and outpatient clinics, SA Pathology recovers the applicable Medicare rebate, (and for private patients in public hospitals only, bills the patients’ insurers for the gap between the rebate and the full value of the schedule item), and offsets this revenue against charges to the relevant LHN. SA Pathology bulk bills members of the public for private referrals and again recovers the applicable Medicare item rebate only, which is 85% of scheduled fee. Direct funding from Government is used to fund broader services such as public health testing, emergency response and mortuary services, as well as any operational funding shortfall.

3. Business overviewCommercial approach
Private providers are limited to the private pathology market in SA, but could leverage their national footprint and investment capabilities to grow their local presence and support broader service delivery to public hospitals if the opportunity arose
Competitiveness of SA Pathology in a contestable market - final report 21
Analysis indicates that both current and broader private providers are keen to grow their footprint within public pathology services both in SA and other parts of Australia. Interest includes appetite from wider operators who provide broader clinical support services and pathology services internationally. Interest within SA and other states stems from the fact that these markets represent the single biggest opportunities to further increase scale in Australia. At present, SA Pathology competes in the market for private services with the three largest private pathology groups in Australia being:
• Sonic Healthcare Limited – Clinpath: The largest private provider, Sonic operates 12 region-specific Australian pathology brands, including ClinpathLaboratories (Clinpath) in SA. Sonic is also the largest operator of medical centres, the largest occupational health provider and the second largest diagnosticimaging provider in Australia(a). Clinpath has labs in Adelaide and is investing in a new central lab. It also provides some services in regional areas.
• Healius (formerly Primary Health Care Limited) – Abbott Pathology: Australia’s second largest private pathology provider operates 11 region-specific brands,including Abbott Pathology in SA. Primary also operates 76 medical centres and 141 diagnostic imaging sites and mainly services the metropolitan Adelaide area.
• Australian Clinical Labs: Australian Clinical Laboratories (Clinical Labs) is private equity owned and is the largest private provider to public hospitals inAustralia(b). It operates in Adelaide and most larger regional towns in SA, except for Port Lincoln(c) and has private collection centres in regional SA(d). It will opena new central lab close to Adelaide Airport in early 2019 which will enable it to better transport specimens interstate and further centralise its operations(b).
These providers compete largely on service breadth, collection centre access, technology-enabled results access, clinical support and price (achieved via automation and economies of scale). A key part of their strategy is investment in collection, referral and logistics networks, ICT capabilities and automation. This is in addition to consolidation of their operations in each region into highly automated central labs, with smaller on-site labs meeting acute care needs only.
Recent work by SA Pathology has sought to clarify its value proposition to customers, patients and SA Health. Whilst currently being finalised, initial work highlights a variety of recognised strengths. Key dimensions of the value proposition include:
• Breadth of technical capabilities and service offering: SA Pathology employs over 1,400 staff and has modern pathology equipment which enables it to provide anintegrated and comprehensive set of pathology services with appropriate clinical governance, and to meet LHNs’, GPs and specialists’ needs in a one-stop shop.
• Clinical governance and advice: In addition to ensuring the quality of diagnostic testing, staff frequently support the clinical interpretation of pathology resultsand provide input into treatment options, including more complex cases or patients with special needs which have been referred from private pathology providers.
• Supporting public safety: SA Pathology plays a key role in supporting the monitoring of infectious diseases and management of public health risks by providingsurge testing capacity, crisis response and toxicology screening in emergency situations. This includes having test capabilities that can identify new risks.
• High levels of access across SA: Services are provided 24 hours a day, seven days a week, 365 days a year at bulk-billed rates to patients and clinicians inmetropolitan, regional and remote areas of South Australia which supports high quality care and ease of service access regardless of patient location.
• Competitive pricing: SA Pathology’s scale enables it to offer bulk-billing to support equity of access to pathology services across SA. It is also recognised as being akey reason for private providers adopting similar pricing approaches, which is particularly important in some regional and remote areas of SA.
• System sustainability: SA Pathology’s technical capabilities, scale and breadth of service offerings allows it to teach medical staff, train pathology registrars andlaboratory professionals, and research new diagnostic techniques supporting long term continuity of the public health system in SA.
• Independence: SA Pathology prides itself in being independent of any financial incentive in its advice to LHNs on the appropriate use of pathology services, whichallows it to focus on delivering clinical value to LHNs rather than maximising SA Pathology’s revenue from diagnostic testing.
Notes: (a) Sonic 2018 Concise Annual Report 2018 https://investors.sonichealthcare.com/FormBuilder/_Resource/_module/T8Ln_c4ibUqyFnnNe9zNRA/docs/Reports/AR/sonic-healthcare-limited-2018-annual-report-online.pdf(b) Clinical Labs 2018c, accessed 31 December 2018 https://www.clinicallabs.com.au/about-us/company-profile/(c) Clinical Labs 2018, New Lab in South Australia, accessed 12 December 2018, https://www.clinicallabs.com.au/about-us/doctor-media-releases/new-lab-in-south-australia/(d) (clinical Labs 2018a, Our Laboratories, accessed 12 December, https://www.clinicallabs.com.au/about-us/our-laboratories/

3. Business overviewOperational constraints
A range of factors currently impact SA Pathology’s ability to operate at an optimum level. Factors include both wider industry dynamics as well as local operating arrangements and are likely to encumber future reform initiatives
Competitiveness of SA Pathology in a contestable market - final report 22
1. Historic charging approaches that are linked to the MBS
Public pathology providers fund their operations from a mix of user charges (LHNs and private patients), Medicare rebates and Government funding. Public providers are not able to seek rebates from Medicare for public patients, however the MBS has effectively become the default pricing policy which is commonly used to charge public hospital networks, private patients and insurers. Feedback indicates that the MBS is not a suitable proxy for the costs of many public pathology tests as it:
• Underestimates the complexity and time to complete many common tests undertaken on samples from patients in acute public hospital settings.
• Does not cover some complex pathology tests required in public hospitals.
• Includes ‘coning rules’ which limit charges in ways that do not reflect the marginal cost of completing additional tests on samples from public patients.
Medicare also pays a Patient Episode Initiation (PEI) fee for collection of specimens, for which private providers are able to obtain a higher PEI fee. The PEI may give private providers a competitive advantage and the coning rules may encourage them to ‘cherry pick’ profitable tests, referring on any remaining unprofitable tests to public providers. Effectively this can lead to situations where public providers need to cross-subsidise unprofitable tests with revenue from other sources.
2. Funding arrangements for public health and non-diagnostic services
SA Pathology supports a range of public health work and provides non-diagnostic services including teaching, training and research and mortuary services. It maintains spare diagnostic capacity to assist SA Health manage emergency responses and public health issues. Funding for these services is inconsistent and ranges from partial block-funding to an absence of funding being provided:
• Post mortem and body handling for perinatal and paediatric is currently not funded.
• Teaching and training for registrars and students as well as university and higher-education teaching is not funded.
• Multi-disciplinary team meetings receive a small fee and only for cancer cases where MBS criteria are met.
• Public health, encompassing diagnostic testing of outbreaks and public health concerns is currently not funded, although block-funding was previously provided.
3. Acute service commitments and stakeholder resistance to change of existing footprints
As the only provider of public pathology services, SA Pathology is required to have a presence within each hospital in SA that has an emergency department. This extensive presence at each major public hospital together with deep historic relationships across SA creates both opportunities and challenges for the business. Whilst these locations allow staff to establish and maintain close working relationships, they increase costs relating to ongoing investment, maintenance and staff due to a decentralised operating model and create practical restrictions against the consolidation of non-urgent testing to a central location. Equally, strategies to rationalise on-site services in public hospitals may be met with stakeholder resistance and are likely to require significant stakeholder management.
4. Governance structure and executive resources
SA Pathology’s governance structure involves oversight from SCSS as well CALHN. Whilst some interstate public pathology providers are also part of local statewide shared service network, some are more distinct operating entities, with larger and more commercially focused executive teams and independent Boards and Chief Executives who report directly to their respective health department Secretary. This simplicity can support organisational flexibility and efficient decision making.

3. Business overviewOperational constraints
A range of factors currently impact SA Pathology’s ability to operate at an optimum level. Factors include both wider industry dynamics as well as local operating arrangements and are likely to encumber future reform initiatives
Competitiveness of SA Pathology in a contestable market - final report 23
5. Workforce reform challenges
As a long-standing and integral part of the SA health system, SA Pathology has a highly experienced and highly trained workforce. Their ability to enable business improvement and sustainability will require ongoing investment and support. Furthermore, industrial relations rules and requirements in SA Health’s (and hence SA Pathology’s) industrial agreements with staff affect how any realignment of staff roles must be managed. These principles and processes must be followed and will shape the timeline, approach and options for workforce changes.
6. Service and access expectations
As a public provider, there is an expectation on SA Pathology to be the provider of last resort and to provide all services regardless of their profitability, complexity or remoteness. This has resulted in:
• Providing services in remote areas and for patients with rare and expensive healthcare needs at levels below cost recovery.
• Receiving referrals from private pathology providers due to testing profitability or technical capability issues. In the interests of the patient and the SA healthsystem, SA Pathology provides these services at a loss, bearing the cost.
The cost impost of providing these services has not been fully calculated by SA Pathology and discreet funding to cover arrangements have not been provided. This impacts SA Pathology’s ability to fully recover its costs of supply.
7. ICT support
Private pathology providers typically manage ICT as a strategically important in-house function and invest heavily in systems that improve customer experience or drive efficiency and productivity. SA Pathology does not have direct day-to-day control of its ICT functions which are provided by eHealth (the exclusive provider of ICT services across SA Health). SA Pathology lacks the practical commercial leverage which a private provider would have to threaten to bring an out-sourced function back in-house or to switch to an alternate provider if it is dissatisfied with service levels or seeks more rapid resolution of performance issues.
8. Collection centre footprint
SA Pathology operates a large footprint of collection centres across SA. This network of collection centres means that the existing SA population is well served in terms of general access to pathology services and holds comparatively greater expectations of service availability. Reform of collection centres of broader access points is likely to be met with some resistance.

4. Performance review
24

4. Performance reviewOverview
Competitiveness of SA Pathology in a contestable market - final report 25
To support structured analysis of existing performance, analysis has been considered across the dimensions of customers, operations and finance. This supports a balanced understanding of SA Pathology’s current performance
Financial Customer Operational
Analysis indicates low levels of cost recovery across the business and variable Directorate performance. Analysis also highlights challenges in obtaining accurate financial and transactional data which has limited the ability for Directorate Managers to manage effectively.
Key analysis focuses on:
• PATH01 – SA Pathology General Ledger.
• Payroll data.
• Collection centres profitability model.
Analysis indicates an appreciation for SA Pathology’s capabilities and service offering amongst customers. However, LHNs expressed a growing appetite to exercise choice driven by some frustrations with service, a desire for improved operational clarity and a need to improve their own financial performance.
Key analysis focuses on:
• LHNs’ perspectives and feedback.
• Community referrers’ perspectives andfeedback.
Analysis indicates an absence of key standard business processes and documentation that would help manage performance, improve business clarity and drive operational improvement. EPLIS-related implementation issues impacted activity data, reporting and billing.
Key analysis focuses on:
• Business management processes andactivities.
• Key business issues including EPLISimplementation.
Performance analysis

4. Performance review: FinancialTrends in 5 year operating baseline
SA Pathology has consistently operated at a deficit over the last five years with deficits ranging from -$93.2m (FY14) to-$67.6m (FY16). Efforts to improve performance were impacted by IT system implementations and opening of the new RAH
Competitiveness of SA Pathology in a contestable market - final report 26Source: SA Pathology General Ledger (PATH01) - Operating expenditure and revenue, excludes non-cash items such as depreciation and amortisationNotes: (a) the unbilled revenue is an estimation; (b) This originates from either i) data that hasn’t transferred out of EPLIS, ii) data yet to transfer to PBRC or iii) bills that have not yet been generated by PBRC.; (c) Separately, there is unbilled revenue payable to LHNs by private insurers for services to private patients in public hospitals – this is not included here.
SA Pathology cost recovery
● In FY18, SA Pathology’s operating expenses were $261m (or $230m
excluding non-operating costs) with an operating deficit of $83.0m.
● Analysis indicates that SA Pathology has consistently operated at a deficit
since FY14. Between FY14-FY16 there was an improvement in the
operating position, however this was subsequently impacted by:
● Declining revenue due to unbilled revenue from system errors,
which commenced in FY17 and worsened in FY18.
● Increased costs to manage the data entry and other issues from
EPLIS implementation impacting FY18 performance.
● Increased cost in FY18 due to the RAH opening which required
duplicate environments to be run during the set up phase.
● Expenses exclude non-cash expenses of$22.8m in FY18.
Revenue
● In FY18, SA Pathology received $144m of diagnostic revenue, $3m from
research support and overheads reimbursements and $31.2m of income
for non-operating. The non-operating costs represents specific Special
Purpose Funds (SPFs) which are set up for specific research grants and
have a net cost recovery of $0.0m.
● Diagnostic revenue declined by 3.7% between FY17 -FY18 due to:
a) A 5-8% market share loss from private work due to EPLIS
implementation issues relating to poor quality reporting of
pathology results to clinicians. Report quality issues have now been
resolved and market share has been clawed back.
b) Issues arising since the introduction of the Power Billing and
Revenue Collection system (PBRC) including data quality issues
and connectivity issues between EPLIS and PBRC which resulted in
a large volume of unbilled revenue.
● Unbilled revenue is estimated to be $6m(a) in FY18 and $2-4m(a) in FY17
and FY16 combined. Unbilled revenue is due to SA Pathology from
Medicare and LHNs for testing already completed but not charged due to
data quality and IT issues(b)(c) .
SA Pathology operating expenses ($m)
SA Pathology cost recovery ($m)
SA Pathology total operating revenue ($m)
261.4
FY18
230.2
30.8
FY17
235.8
FY16
262.9
31.2
235.1
266.6
27.8
FY15
266.6
FY14
29.0
237.6
35.3
275.2
239.9 Cost for diagnostic,overheads, research, excludes non-cash
Cost for non-operating
FY16
31.2
144.1149.6
3.1
FY18
150.2
FY17
184.6
3.15.0
FY15
195.3
149.0
4.0
32.231.6
186.9178.4
42.0
FY14
1.8
148.2
31.9
182.0
(83.0)(79.8)
FY16 FY18FY17
(93.2)
(67.6)
FY15FY14
(81.9)
Revenue Diagnostic
Revenue non-operating
Revenue researchand overheads

4. Performance review: FinancialFY18 cost recovery analysis
SA Pathology’s FY18 net operating position is -$83.0m excluding unbilled revenue, resulting in the need for SA Health to cover the deficit
Competitiveness of SA Pathology in a contestable market - final report 27
FY18 SA Pathology (net cost recovery) baseline ($m)
Cost recovery
● Total diagnostic revenue is $144.1m(c) and total direct diagnostic cost asreported by the Directorates is $160.6m. This results in diagnostic cost recoveryof -$16.5m.
● This excludes research and training costs as self reported by staff ($6.3m), itemsremoved as non-operating ($4.9m) and $1.0m of net cost on the researchsupport responsibility index.
● Inclusion of these costs revises net cost recovery against direct diagnostic costsonly to -$28.8m, prior to inclusion of indirect costs and overheads.
Indirect costs and overheads● $9.0m of indirect costs from Customer Services which includes Frome Rd
reception’s printing of prefilled order forms and couriers servicing metro areas.● $12.7m of indirect costs from collection centres in metro area.● $12.0m of indirect costs for specimen reception and call centres.● $20.6m of central overheads including: Other Operations Costs (d), General
Pathology(e) expenses, Billing Services and ICT and Procurement. This excludes$22.8m of non-cash expenses for central items such as D&A, asset disposal andother non-cash items.
Unbilled revenue● There was an estimated $6.0m of unbilled revenue in FY18. This originates
from either i) data that has not transferred out of EPLIS, ii) data yet totransfer to PBRC or iii) bills that have not yet been generated by PBRC.(g)
The unbilled revenue referenced here is due to SA Pathology fromMedicare and LHNs for services already delivered.(h)
Overall cost recovery● SA Pathology’s cost recovery in FY18 was -$83.0m. If unbilled revenue was
included, cost recovery would have been -$77.0m.● The additional $22.8m of non-cash expenses, within the overheads, have
been excluded, as they do not represent a cash outlay for SA Pathology.
Non-operating and out-of-scope● Non-operating represents specific SPFs set up for research grants. They
are set up for each specific scope. Non-operating has a net cost recovery of$0.0m as the funds are spend as restricted by the grants.
● There is additionally $4.9m of out-of-scope cost. This represents activitiesthat Directorates do not consider to be included in their core pathologydelivery purpose, such as CCB.
(a)
(b)
(7 7 .0)(83.0)
(28.8)(22.9)(16.5)
144.1
FY
18 C
ost
Reco
very
Resea
rch a
nd
train
ing
from
staff su
rvey
6.3
Un
billed
reven
ue
No
n o
pera
ting
0.0
To
tal d
iag
no
sticco
st
160.6
FY
18 d
iag
no
sticco
st recov
ery
FY
18 d
iag
no
sticrev
enu
e
E. F
Y18
cost
recov
ery a
dju
stedfo
r un
billed
reven
ue
6.0
FY
18 co
streco
very
after
ov
erhea
ds
FY
18 C
ost
recov
ery p
rior
to o
verh
ead
s
20.6C
entra
l ov
erhea
ds
12.7 12.0
Co
sts from
Cu
stom
er services
Co
sts from
specim
en recep
tion
an
d ca
ll center
Oth
er ou
t-of-
scop
e
Resea
rch R
I
1.0
Co
sts from
pa
tient serv
ices
9.04.9
(a)
Notes: (a) represents net value; (b) estimated; (c) SA Pathology realises non-diagnostic revenue as well such as research support revenue, etc. Those values are represented as net of the cost in the research and overheads items. (d) includes salaries, service level agreements, staff training and development and travel, Frome road computing, investment income or loss and intra Government Transactions and other; (e) includes: repairs and maintenance, electricity, gas and fuel, occupancy rents and rates and employment expenses.; (g) This estimate will be revised with further analysis.; (h) Separately, there is unbilled revenue payable to LHNs by private insurers for services to private patients in public hospitals
(a)
(a)
(a)
(a)
(a)
Indirect costs Overheads

4. Performance review: FinancialFY18 cost recovery analysis
In FY18, the vast majority of SA Pathology’s revenue was derived from diagnostic testing
Competitiveness of SA Pathology in a contestable market - final report 28
Observations – cost / revenue
● FY18 total diagnostic revenue is $144.1m (and represents98% of SA Pathology’s total revenue when non-operatingrevenues such as specific research funds are excluded).
● FY18 total costs are $160.6m, which results in diagnosticcost recovery of -$16.5m.
● Based on a self-reported staff survey there was a cost of$6.3m for research and training – this has been presentedseparately from diagnostic costs. There has been feedbackfrom SA Pathology’s finance team indicating that $6.3mmay not represent the full scale or cost of activity.
● $31.2m in ‘non-operating’ costs (for items such as such asspecific research funds) have matching revenues of $31.2mand so do not affect SA Pathology’s overall financial result.
● There is $4.9m of out-of-scope cost from the ledger. Out-of-scope are business or FTE that the Directorates do not see aspart of their operations such as the CCB.
● There is a research support specific cost segment in thegeneral ledger which has a revenue of $1.1m and cost of$2.1m – this is in addition to the self-reported staff survey.
● There is $2.0m of overheads revenue such as $1.1m ofContributed Assets and Services which is a recharge for costincurred.
● Additionally the $6.0m of unbilled revenue is also notincluded, which would be used to cover diagnostic costs.
FY18 SA Pathology costs / revenue ($m)
(22.5)
(12.0)
(12.7 )(9.0)(2.1)(4.9)(31.2)
(6.3)
6.02.01.131.2144.1
Dia
gn
ostic
(160.6)
Resea
rch a
nd
train
ing
from
staff su
rvey
No
n o
pera
ting
an
drem
ov
ed b
y D
irectora
tes
Sp
ecimen
receptio
na
nd
call cen
ter
Resea
rch R
I
Un
billed
dia
gn
ostic
reven
ue
Ov
erhea
ds
Cu
stom
er services
Ou
t of sco
pe item
s
Pa
tient serv
ices
Revenue Cost
FY18 SA Pathology revenue ($m)
1.1(1%)
31.2(18%)
2.0(1%)
144.1(81%)
Research revenueNon-operating orremoved by the directorates
Diagnostic revenue Overheads revenue
Source: SA Pathology General Ledger (PATH01) - Operating expenditure and revenue
Indirect costs Overheads

4. Performance review: FinancialFY18 cost recovery analysis
Within SA Pathology, Automated is the only Directorate that generates sufficient cost recovery to cover its portion of indirect costs and overheads
Competitiveness of SA Pathology in a contestable market - final report 29
Observations – baseline detail
● Directorate cost recovery has been adjusted to remove research training andteaching (TTR) as reported in the Staff Survey. This is presented separately.
● Chemical Pathology and Automated are the only two Directorates with positivediagnostic cost recovery, prior to indirect and overhead allocation.
● Automated provides high volume simple testing which leads to the Directoratebeing profitable under the MBS’s standard rates for item rebates.
● Chemical Pathology has undergone consolidation and other cost saving initiativeswhich have resulted in a positive diagnostic cost recovery.
● Additionally, Automated and Chemical Pathology do not undertake any publichealth work.
● However, once overheads and indirect costs are allocated, Chemical Pathology isunable to cover its allocated portion. After overheads and indirect costs allocation,Automated is the only Directorate which retains a positive net cost recovery.
● Based on the Staff survey the aggregate research and training funded throughoperational costs by all Directorates was -$6.3m(c), which is split as $3.1m forresearch and $3.2m for training. This was identified based on a self-reportedsurvey, and the finance department has indicated that the actual spend on researchand training may be significantly higher. In addition to the self-reported costsidentified above, there was an additional net -$1.0m of cost recovery for cost centresthat were marked as research(d). In that segment there is a total cost for researchsupport of $2.1m and a revenue of $1.1m which results in a net cost recovery of -$1.0m. Based on that, the total SA Pathology spend on Research and support is$5.2m and on training is $3.2m. This represents a total TTR spend of $8.4m or5.8% of the diagnostic revenue.
● During analysis, Directorates identified some costs as being out-of-scope and somenon-operating costs which have both been excluded and finally there were costs inthe ledger which didn’t reconcile with the detailed analysis. Those aggregated to anet value of -$4.9m.
● The other costs which are Customer Services(e), Patient Services (f), Billing, otheroperational cost such as staff training and travel, Frome Road computing and intraGovernment Transactions (g), General Pathology(h) and Procurement, ICT and otheroverheads totaled $54.3m.
FY18 SA Pathology cost recovery baseline detail ($m)
(4.9)
0.0(1.0)
(6.3)
0.5
(0.8)
(5.6)(5.8)(7 .0)(7 .4)
(20.1)
Reg
ion
al
Micro
bio
log
y D
.
Imm
un
olo
gy
D.
AP
Dia
gn
ostic
GM
P D
iag
no
stic
Ha
ema
tolo
gy
D.
Ch
emica
lP
ath
olo
gy
D.
Oth
er un
recon
ciled
Resea
rch R
I
(54.3)
No
n o
pera
ting
an
drem
ov
ed b
y D
irectora
tes
Au
tom
ated
D.
29.6
To
tal o
verh
ead
s an
din
direct co
sts
Resea
rch &
train
ing
ba
sed o
n sta
ff surv
ey
Source: SA Pathology General Ledger (PATH01) - Operating expenditure and revenue;
Notes: (b) AP and GMP are not the only to Directorates undertaking research and training. Based on Staff survey the research and training by Directorate is: AP: $2.7m, Automated and Regional $0.0m, Chemical Pathology $0.1m, Immunology $2.1m,
Haematology $0.2m, Microbiology $0.4m and GMP $0.7m; (c) the number may be higher this is only based on self reported staff survey; (d) $1.0m is the net amount which represents revenue minus cost.; (e) includes metro couriers, delivery of
consumables to local medical practices and private surgeries, printing of pre-populated order forms for Emergency Departments and other.; (f) includes metro collection centres; (g) includes salaries, service level agreements, staff training and
development and travel, Frome road computing, investment income or loss and intra Government Transactions and other; (h) includes: repairs and maintenance, electricity, gas and fuel, occupancy rents and rates and employment expenses.
Note: Due to the way revenue and costs are recorded from an accounting perspective, there may be some revenue and / or costs which are not allocated correctly across Directorates.

4. Performance review: FinancialDirectorate analysis
Automated and Chemical Pathology are the only Directorates that fully recover their direct diagnostic costs and so make a contribution to the indirect and overhead costs of running SA Pathology
Competitiveness of SA Pathology in a contestable market - final report 30
Observations – FY18 cost recovery
● The Automated Directorate primarily undertakes high volume and low complexitytesting and has a positive $17.6m cost recovery prior to indirect and overhead allocation.Automated also includes $12.0m of cost for specimen collection, data entry and tooperate SA Pathology’s call centre. Removing those costs from the Directorate (as theyare indirect costs for the entire organisation), the Automated Directorate’s cost recoverybecomes $29.6m.
● Other than the Automated Directorate, only Chemical Pathology has a positive costrecovery of $0.4m prior to indirect and overhead allocation (excluding unbilled revenueand overheads).
● Anatomical Pathology “AP” has a cost recovery of -$22.9m in FY18, which reflects thecomplexity of testing and the high number of pathologists assigned.
Observations – FY18 Standard FTE
● Automated has the highest number of FTEs due to the volume of work performed andoperation of 24/7 labs. Staff include 140 FTEs for specimen reception, data entry and callcentres. The diagnostic testing service of Automated has 177 FTEs.
● AP has the highest number of FTEs after the Automated Directorate again reflecting themore complex and manual nature of their tests.
● There were 31.2 standard FTEs marked as non-operating and 8.5 marked as out-of-scopeby three Directorates: GMP, Haematology and Immunology.
● In addition to the Directorates above, SA Pathology has 266 FTEs(a) across PatientServices, Customer Services, Research Support and Corporate Services, split as: PatientServices: 138, Corporate Overheads: 57, Research Support: 17 and Customer Services: 54.
Observations – FY17 activity
● From FY17 to FY18, SA Pathology transitioned its laboratory information system fromULTRA to Millennium. The two systems count tests differently thereby makingcomparisons to prior years less meaningful. For this reason, activity analysis was onlyconsidered up to FY17.
● Automated undertakes approximately 90% of SA Pathology’s tests given it undertakesthe high volume and low complexity testing.
● GMP and AP have lower volumes as the testing undertaken is higher in complexity.
● The Regional Directorate is composed of 11 regional labs which undertake testing that isessentially automated or semi automated in nature and includes the tests of ChemicalPathology, Haematology and Microbiology. They also run their own couriers, specimenreception and collection centres which are not incorporated in SA Pathology’s overheads.
Directorates FY17 activity (‘000)
Directorates FY18 Standard FTE
0.4
(2.9)(5.8)(6.0)(7 .2)(8.1)
(22.9)
AP
Ha
ema
tolo
gy
GM
P
Mic
rob
iolo
gy
Au
tom
ate
d
29.6
Imm
un
olo
gy
Reg
ion
al
Ch
emic
al
Pa
tho
log
y
Average: 2.9
Directorates FY18 unadjusted cost recovery(b) ($m)
Source: SA Pathology General Ledger (PATH01) - Operating expenditure and revenue;
Notes: (a) in this case these 266 overhead FTEs are ‘full loaded’ in that they include overtime and benefits and leave. In all other cases this report was able to present Standard FTEs which exclude overtime and leave; (b) Due to the way revenue and
costs are recorded from an accounting perspective, there may be some revenue and / or cost which are not allocated correctly across Directorates.
3239
133165
7 2
17 0 17 7
Reg
ion
al
Mic
rob
iolo
gy
Ha
ema
tolo
gy
GM
P
104
AP
Imm
un
olo
gy
Ch
emic
al
Pa
tho
log
y
Au
tom
ate
d
Average:129
Au
tom
ate
d
6,479
Ch
emic
al
Pa
tho
log
y
266
1,080
103
AP
258314
Reg
ion
al
160
2,345
Mic
rob
iolo
gy
Imm
un
olo
gy
GM
P
Ha
ema
tolo
gy
Average: 1,376

4. Performance review: FinancialComparative laboratory analysis – metro labs
Lab financial performance is variable across the metro network, however examples of good financial performance exist where positive net cost recovery is generated
Competitiveness of SA Pathology in a contestable market - final report 31
Observations
● This analysis considers the overall cost recovery for SA Pathology as allocated toeach metro laboratory. Whilst several services are located in one metro lab, theysupport SA Pathology’s wider lab network including those based regionally.
● Due to the way revenue and costs are recorded from an accounting perspective,there may be some revenue and / or cost which are not allocated to the correctmetro lab.
● Frome Road has a net cost recovery of -$19.9m in part due to many Directorateshaving offices there which results in the allocation of the management cost forthose Directorates to Frome Road. Additionally some Directorates such as APallocate the majority of their pathologist costs to Frome Road, even though theymay serve other labs. For a number of Directorates some of the pathologists coststhat are at Frome Road and FMC are used to support the Automated and RegionalDirectorates with interpretation of test results and clinical support.
● In FY18, Frome Road cost recovery was -$19.9m, a decrease from prior years dueto the costs to support the opening of the new RAH and the treatment of someassociated costs not being correctly apportioned.
● WCH also has a lower cost recovery than most other metro labs due to highemployment costs, difficulty of testing undertaken (e.g. requirements for paediatricsamples), complexity of the tests undertaken at WCH and a low volume of tests,thereby minimising scale efficiencies.
● FMC is on-site with a hospital and university and serves as a research and teachinglaboratory.
● RAH’s cost recovery does not reflect its complete cost base as some employmentcosts still remain at Frome Road from an accounting perspective.
● Modbury is the simplest of all metropolitan laboratories in terms of the urgency ofits pathology needs and the high volume of automated/semi-automated testsperformed. This results in the highest positive cost recovery.
Metro labs cost recovery ($m)
Metro labs cost recovery ($m)
2.20.80.4
(13.9)
(19.9)
Frome Road
RAHModLMH
QEH
(3.5)
FMC
(4.4)
WCH
Average: (5.5)
Metro labs FY18 cost recovery ($m)
(4.4)(4.0)(3.0)
0.1
(16.1)(18.0)
(15.8)
(19.9)
(15.6)
(8.8)
(15.5)(13.9)
FY
17
FY
15
FY
18
FY
17
FY
18
FY
16
FY
16
FY
17
FY
18
FY
15
FY
16
FY
15
Avg.(2.8)
Avg.(16.0)
Avg.(15.0)
Frome Road WCH FMC
0.80.81.11.40.4
1.01.3
(3.5)(3.9)
FY
17
FY
17
FY
16
FY
18
FY
16
FY
18
FY
17
FY
15
0.1
FY
15
FY
18
FY
16
FY
15
(3.1)(3.1)
Avg.1.0
Avg.0.7
Avg. (3.4)
QEH LMH Mod
Source: SA Pathology General Ledger (PATH01) - Operating expenditure and revenue;

4. Performance review: FinancialComparative laboratory analysis – metro labs
The two metro labs that have a positive net cost recovery (Modbury and LMH) perform over 20,000 tests per FTE. This contrasts with the performance of other labs in the network
Competitiveness of SA Pathology in a contestable market - final report 32
Source: SA Pathology General Ledger (PATH01) - Operating expenditure and revenue;
Observations – FY17 Metro labs activity
● Due to the way revenue and costs are recorded from an accounting perspective, there
may be some revenue and / or cost which are not allocated to the correct metro lab.
● From FY17 to FY18, SA Pathology transitioned LIS from ULTRA to Millennium. The
two systems count tests differently thereby making comparisons to prior years less
meaningful. For this reason, activity analysis only considers FY17.
● In FY17, a large proportion of SA Pathology’s metropolitan testing was conducted at
two laboratories: Frome Road (56%) and FMC (20%). These labs undertake a broad
test mix that ranges from lower complexity, automated testing to higher complexity
manual testing. This, in addition to the concentration of pathologists and scientists at
these sites reduces their cost recovery levels.
● Modbury is the smallest of the labs by activity and undertakes the only testing required
to service the ED in what is a low acuity hospital. The testing required by Modbury ED
is generally low complexity. This helps Modbury have a positive cost recovery level.
● LMH lab also runs the necessary tests to cover its ED, but LMH is a higher acuity
hospital compared to Modbury. The testing required for LMH’s ED is slightly more
complex than Modbury. LMH also has a positive cost recovery.
● WCH covers the ED Department but also includes the GMP Directorate.
Observations – FY18 Metro labs Standard FTE
● The majority of the FTEs are at Frome Road / RAH (55%). This is due to all
Directorates allocating significant Pathology and Scientific staff costs to that location.
● The WCH has the third largest FTE count even though they undertake the second
lowest volume of activity. This is due to GMP being located at WCH. GMP undertakes
highly complex testing with very low volumes and has over 100 FTEs.
● Modbury has 16 FTEs supporting a 24/7 low acuity ED.
Observations – FY18 Metro labs Employment Cost per Standard FTE
● The WCH has the highest average employment cost per FTE, due to having GMP and
undertaking higher complexity testing.
● Modbury has the lowest average employment cost per FTE, due to the different staff
mix required to support a lower acuity ED. Additionally, Modbury has the lowest
number of FTEs and reportedly a simpler rostering process.
Metro labs FY18 employment cost per Standard FTE ($’000)
Metro labs FY18 Standard FTE
6,471
1,073
Mod
334
2,301
QEH
350
Frome Road
/ RAH
WCH
Average: 1,918978
LMH
FMC
Metro labs FY17 activity (‘000)
16
124148
498
WCHLMH
Mod
55
FMC QEH
67
Frome Road
/ RAH
Average: 151
70.6
144.6128.5126.4
112.3
WCH Mod
90.1
Frome Road
/ RAH
LMH
FMC QEH
Average: 112.1

4. Performance review: FinancialComparative laboratory analysis – regional labs
Similar levels of varied performance exist across regional labs. This is part reflects the staffing profile of labs and their testing volumes
Competitiveness of SA Pathology in a contestable market - final report 33
Observations
● Due to the way revenue and costs are recorded from an accountingperspective, there may be some revenue and / or costs which are notallocated to the correct regional lab.
● Six of the 11 regional labs have positive cost recovery (prior to anyindirect or overhead allocations). Typically the labs with positive netcost recovery processed greater than 25,000 tests per FTE in FY18.
● The regional labs with negative cost recovery completed fewer tests perFTE. This includes Mt Gambier, Pt August and Pt Pirie, each of whichcompleted less than 21k tests per FTE in FY18.
● One exception is Whyalla which generated positive cost recoverydespite a low processing rate of 19k tests per FTE. This result wasdriven by Whyalla’s low average staff cost of $83k per FTE, reflectingits atypical staffing mix. Whyalla has proportionately fewer MedicalScientist and Technical Officers and proportionately moreadministrative and operational roles than other regional labs.
● Wallaroo’s higher employee cost per FTE may be driven by the higherproportion of medical scientists that make up its FTEs. This higheremployee cost is the cause of Wallaroo not generating a positive costrecovery despite its relatively low FTE numbers and high (adjusted (a))number of tests per FTE.
FY 18 Employment cost per FTE ($’000)
FY17 adjusted (a) # of tests per FTE (‘000)
Regional labs FY18 cost recovery ($m)
Source: SA Pathology General Ledger (PATH01) - Operating expenditure and revenue;
Notes: (a)The adjusted cost per test is calculated by removing from the cost base the cost of the FTEs that (based on the staff survey) are supporting other Directorates or are undertaking research or training. Additionally
other cost exclusions were provided by the business managers
Wh
ya
lla
Mu
rra
yB
rid
ge
(93)
Pt
Au
gu
sta
Average: 1
164199
(97)
(305)
Ga
wle
r
169
Vic
tor
Ha
rbo
r
Pt
Pir
ie
Mt
Ga
mb
er
281
32
Ber
ri
No
arl
un
ga
Wa
lla
roo
Pt
Lin
coln
(278)(228)
145
35282826
312932
Pt
Au
gu
sta
Vic
tor
Ha
rbo
r
Pt
Lin
coln
19W
all
aro
o21
Wh
ya
lla
Pt
Pir
ie
No
arl
un
ga
Mt
Ga
mb
er
Ga
wle
r
17
Ber
ri
18
Mu
rra
yB
rid
ge
Average: 26
99
Mt
Ga
mb
er
93
Ga
wle
r
80
Ber
ri
82
Pt
Pir
ie
No
arl
un
ga
Wh
ya
lla
Wa
lla
roo
87
Vic
tor
Ha
rbo
r
134
88 83
Pt
Lin
coln
Pt
Au
gu
sta
10081
Mu
rra
yB
rid
ge
101Average: 93
FTEs: 9 7 14 6 18 8 8 8 7 6 12

PwC’s financial analysis has been limited by available data and information. Wider analysis would support a more complete review of performance and include broader data sets
4. Performance review: FinancialFurther analysis which cannot be undertaken due to unavailable data
Analysis area Limitations in data Impact on current reviewImpact on SA Pathology’s ability to manage performance
1. Fundingarrangements, costallocations, andrevenue attributionrules.
• Insufficient clarity on specific activities funded bythe $65m appropriation (top-up) funding in FY18.
• Block funding for non-diagnostic activities is notclosely tied to specific activities withinDirectorates.
• Revenue is not closely tied to activities andcustomer groups, making revenue attributiondifficult and inaccurate.
• Some allocations of indirect costs betweenDirectorates and of overhead costs to Directoratesare obscure and inconsistent.
• Ongoing uncertainty regardingaggregate revenue and its attribution toactivities and customer groups.
• Unable to reliably quantify:
• Profitability of customer groups.
• Any cross-subsidies across LHNs
• Extent to which pricing reflectsefficient costs.
• Correct funding for TTR, publichealth.
• Significant effort required to generatean agreed financial baseline.
• Constrains Government’s and LHNs’ability to assess SA Pathology’s value formoney.
• Restricts Executives and seniormanagers’ ability to govern and manageSA Pathology.
• Restricts accountability for efficiencyand productivity within Directorates.
2. Analysis of costs,revenues and TATsper test group perlocation.
• Available SA Pathology data are not sufficientlygranular to measure volume, cost, revenue andTATs per test group and per location.
• This is further distorted by some accountingallocations, such as all AP pathologists beingallocated to Frome Road alone.
• Finally, available cost and revenue data are notsufficiently timely, reducing its usefulness formanagers making business decisions.
• Analysis limited to Directorate level – sounable to assess performance of specifictest groups/sites/assets.
• Insufficient information to recommendoptimisation of services.
• Insufficient information to benchmarkspecific test groups (should suitablebenchmarks be available).
Limits managers’ ability to use data to:
• Manage the business more efficiently
• Optimise service offerings.
• Reliably meet service level.
• Gauge the impact of reforms to changeservice ranges, service levels or to moveto more cost-reflective pricing.
3. Benchmarkingcost, revenue andproductivity withother public andprivate providers.
• Benchmarking limited to publicly available IHPAdata only, with little information available atDirectorate level or for test groups.
• There is limited information on what is containedor excluded in the publicly available IHPA datawhich reduces its usefulness.
• Efficiency opportunities identifiedwithout the benefit of benchmarking.
• Unable to test, confirm or dispute priorpublic information on performance.
• Unable to benchmark at Directorate ortest group level.
• Limits managers’ ability to useperformance comparisons to driveaccountability and improvement.
• Limit’s managers’ ability to learn fromothers’ better performance.
Competitiveness of SA Pathology in a contestable market - final report 34

PwC’s financial analysis has been limited by available data and information. Wider analysis would support a more complete review of performance and include broader data sets
4. Performance review: FinancialFurther analysis which cannot be undertaken due to unavailable data
Analysis area Limitations in data Impact on current reviewImpact on SA Pathology’s ability to manage performance
4. Detailed analysisof tests referred byprivate providers.
• The activity data maintained by SA Pathology cannot readily link specific test volumes to theirassociated revenues and costs.
• Manual review required to develop arough estimate of unbilled revenue.
• Limited ability to accurately assessprofitability of private referrals.
• Unable to identify unprofitable tests.
• Limits ability to correctly bill.
• Ongoing risk of private organisations‘cherry picking’ profitable tests and‘cost-shifting’ unprofitable tests to SAPathology.
5. FY18 volumeanalysiscomparative toprior years.
• From FY17 to FY18, SA Pathology transitionedfrom ULTRA to Millennium. The two systemscount tests differently making comparisons toprior years less meaningful.
• Activity analysis considered FY14 - FY17 only.
• Lessened value of time series data toassess performance.
• No analysis of FY18 productivity.
Undermines use of FY14-17 activity data to:
• Evaluate FY18 and FY19 performance.
• Inform projections for FY20 andbeyond.
6. Analysis ofteaching, trainingand research time.
• Robust data are not recorded on staff time spentand other resources expended on teaching,training and research activities.
• Available data are from a self-reported employeesurvey, which the finance team believes.significantly understates the true amount of timespend on teaching, training and research.
• Unable to accurately quantify and assessefficiency and appropriateness ofteaching, training and research.
• Obscured true time expended ondiagnostic testing vs TTR thereforeobscured efficiency and productivity.
• Difficult to efficiently manage spend onteaching, training and research.
• Undermines reliability of FTE numbersused to assess cost/productivity.
• May conflate inefficient time withteaching, training and research.
7. Analysis oftesting for andsupport to publichealth.
• Diagnostic testing to support public healthmonitoring is not separately identified fromservices to LHNs or other customers.
• Limited information on public health functions
• Limited transparency on how appropriations relateto specific public health functions and whetherthese are adequate or insufficient.
• Unable to robustly assess adequacy offunding for public health support andextent of any cross-subsidies.
• Unable to recommend specific fundingrequired for public health support.
• Reduces accountability and ability tomanage these public health functionsfor value.
• Incorrect cost allocations or revenueattributions obscure underlyingperformance.
8. Better analysis ofthe centraloverheads.
• Unlike Directorates, there is no Business Managerwho is responsible for central overhead costs.
• Allocation of central overhead costs is opaque andconfusing to LHNs .
• Required a process to interrogateoverheads and allocations betweenservices and customer groups.
• Large indirect and central overheadcosts mean cost allocation rule crucial.
• Creates opportunities for inefficiency.
• Reduces confidence in financialinformation.
Competitiveness of SA Pathology in a contestable market - final report 35

4. Performance review: CustomerLHN perspectives
LHNs value SA Pathology’s advanced diagnostic capabilities but are dissatisfied with customer service and client management. Against a context of a need to drive improved performance and sustainability, they are increasingly seeking a closer and more formal working partnership with greater transparency on costs and pricing
LHNs value SA Pathology’s advanced diagnostic capabilities but want a more customer-focused, responsive service and a closer clinical partnership.
• LHNs’ clinical staff value SA Pathology advanced diagnostic capabilities, recognising their state of the art equipment and highly skilled staff. This is seen asbeing central to high quality reports and clinical performance, participation in multi-disciplinary meetings and improved patient outcomes. Particularly wherepathology plays a critical role in patient flow and treatment.
• Feedback identifies a number of areas where LHNs are seeking improvements from SA Pathology to enable a more customer-focussed and responsive service.Historic performance issues including those associated with EPLIS have eroded confidence and have strengthened an appetite for further control and clarity:
• A desire exists for better working relationships between pathologists and clinicians to enable collaboration on diagnosis and treatment. These wouldtraditionally be formalised in more detailed Service Level Agreements that can be used to hold both parties accountable and manage service delivery.
• Existing customer relationship management approaches are considered insufficient. LHNs highlighted both limited and reactive engagement by SAPathology, with a lack of formal arrangements to hold SA Pathology to account for performance. Feedback highlighted a perception of LHNs having toinvest time to ‘manage up’ to SA Pathology to resolve issues, rather than SA Pathology directly driving performance improvement.
• Operational performance information is seen as needing significant improvement to increase transparency which will in-turn support productivity,efficiency and asset utilisation. Increased transparency is likely to also help improve staff confidence in the service.
A lack of clarity exists with regards to the price that LHNs are charged for the delivery of pathology services. Wider pressures on financial sustainability are encouraging greater understanding and transparency in this area, and a drive for improved value for money.
• LHNs are unclear on the price paid for pathology services as well as the costs experienced by SA Pathology in delivery. This is in part driven by a lack ofunderstanding by SA Pathology with regards to test costs. SA Pathology’s current pricing approach for LHNs charges 85% of the rate for the equivalent MBSitem. This is commonly misunderstood by LHNs, who have previously believed that they are charged 126% of the MBS. This confusion originates fromprevious calculations made with regards to SA Pathology’s costs of delivery. This has created further uncertainty around performance and value for money.PwC have not reviewed or verified the calculations associated with MBS.
• The total value of funding provided to SA Pathology is unclear to LHNs due to a lack of clarity relating to funding transfers and billing. In addition, it is alsounclear whether SA Pathology billing includes overhead costs and charges associated with activities completed by Statewide Clinical Support Services.
• LHNs do not feel that SA Pathology has been effective in realising the potential benefits of a statewide service, and are looking for much greater operationalefficiency and value-add support to clinical services. SA Pathology is also perceived to have poor practices with regards to the billing of private insurance fundsfor services to private patients in public hospitals, foregoing LHNs additional revenue.
• LHNs have articulated a strong appetite for more frequent and detailed information on pricing and billing to enable a better understanding and reconciliationof costs and overheads. This will be used to help better manage operational performance and inform value for money and performance assessments.
Competitiveness of SA Pathology in a contestable market - final report 36

4. Performance review: CustomerLHN perspectives
LHNs appear to be increasingly open to exploring options around choice of pathology provider. Implementation risks and preparation required to support choice were recognised as being significant, whilst consideration of the impact on SA Pathology as a business was also identified
Given this performance context, LHNs are increasingly open to the potential of exercising choice of provider. Confidence in the ability for SA Pathology to make significant service improvements is variable and alternative providers are seen as potentially providing both efficiency and improved service. LHN financial pressures are creating an additional incentive to consider alternative delivery arrangements.
• As part of considering how best to respond to challenging financial pressures, LHNs are increasingly reviewing clinical support services including pathology todemonstrate value for money and support operational savings. The historic performance of SA Pathology and an erosion of confidence in it has encouragedconsideration in this area.
• Desirable attributes of a potential new provider would be improved reliability and timeliness in acute settings where pathology advice plays a key role insupporting clinical performance and length of stay, as well as better value for money with regards to non-urgent testing. Feedback identified limited concernsin relation to the location of alternative providers, so long as such a provider possesses the appropriate operational capacity to meet KPIs.
LHNs were concerned to ensure that risks associated with affecting choice would be closely managed. These included ensuring common laboratory information systems were maintained, open access to data and consistent testing protocols. Currently these ‘network’ elements are centrally managed by SA Pathology and so consistency is maintained. SA Pathology has standardised testing protocols within each Directorate, and implemented a common laboratory information system (EPLIS) which is linked to LHNs’ patient management system (ePAS and OACIS), albeit with some legacy implementation issues which are the subject of ongoing remediation efforts.
If different LHNs were to opt to engage different pathology providers, these ‘network’ benefits may be eroded unless appropriate standards were put in place to require their maintenance.
Equally, LHNs were cognisant that greater choice of providers would lead to a loss of scale by SA Pathology which may impact its ability to deliver wider services and support long-term sustainability.
Competitiveness of SA Pathology in a contestable market - final report 37

4. Performance review: CustomerPrivate practitioners’ (community referrers) perspectives
Doctors and specialist in private practice who refer patients to SA Pathology highly value the service breadth, accessibility and diagnostic support. This group reflected similar concerns regarding customer management as well as SA Pathology’s long-term ability to offer the full breadth of services
Community referrers (CRs) identified a range of positive performance characteristics within SA Pathology that collectively strengthen their ability to offer efficient and effective clinical care. CRs were keen to highlight that many of these factors were not available from other providers to the same extent. Factors included:
• The breadth of services offered and ‘24/7’ access across geographies. Regional CRs highly valued availability in poorly serviced areas where they sought long-term partners who could contribute to the regional community and support local employment.
• The extent of integration with public hospitals and linkage to leading specialists which enables improved continuity of care.
• Specific specialist skills including their ability to collect and manage samples from children and other patients with specialist phlebotomy needs.
• SA Pathology’s existing bulk-billing pricing models. This was particularly important to regional CRs who remained loyal to SA Pathology despite privateproviders offering them higher rents for collection centres. This was largely driven by their belief in the value of maintaining a bulk billed, high quality publicpathology service in regional areas.
Feedback also highlight similar concerns to those raised by LHNs, with a number of issues raised in connection to EPLIS and an appetite to improve customer management.
• EPLIS was highlighted as causing significant disruption to service delivery, particularly in relation to reporting problems and longer turnaround times. Whilstfeedback noted that the most significant problems had been resolved, these had created a number of associated clinical risks.
• A number of EPLIS associated issues remain, including poor turnaround times for non-urgent tests in regional areas which are considered worse than levelsprior to EPLIS. In addition, some results continue to be delivered to the wrong location in circumstances where doctors operate across multiple sites.
• SA Pathology is perceived to have a lower focus on customer experience than its competitors, and the reporting problems with EPLIS were considered as a step-change deterioration in quality. CRs are keen to see investment in user-friendly reporting, improved test Turn Around Times “TATs” and a move towards amore customer service focused culture. This may include better customer service at call centres and collection centres, investment in technology to better trackand present results and better mechanisms for customers to easily provide feedback.
• Feedback also highlighted that some regional collection centres experience long wait times at key periods which can cause issues.
Within the context of contestability, CRs highlighted concerns that it may enable incoming providers to cherry pick services and undermine SA Pathology’s ability to service regional areas. This was driven by the belief that SA Pathology’s financial sustainability and capability could be eroded by a loss of market share. Broader concerns were also raised with regards to the impact on regional services and consequential impacts to local employment.
Competitiveness of SA Pathology in a contestable market - final report 38

4. Performance review: OperationalStrategy and business management
SA Pathology currently operates without a range of business and management fundamentals to help guide performance. Their absence restricts the ability to consistently and uniformly move SA Pathology towards a clear direction or agreed outcomes
Competitiveness of SA Pathology in a contestable market - final report 39
SA Pathology lacks a number of key structures and documentation that would support improved organisational clarity and enable tighter performance management. The absence of these materials is of concern given the scale and importance of the business, together with its historic financial performance and the to need drive improvements across all aspects of the business.
• Strategic Plan: SA Pathology currently operates in the absence of an agreed and documented strategic plan that summarises its vision and long-term trajectory. Itis recognised that a context of frequent change has created a challenging foundation within which to consider this. There is no clear and accessible shareddirection of progression for the business that describes how it will evolve and respond to changes in demand, technology and industry pressures. This restricts SAPathology’s ability to make considered and aligned long-term business or investment decisions.
• Annual business plan: Similarly to the Strategic Plan, SA Pathology does not have an articulated plan of activities or objectives to be completed for the year ahead.As such, executives and staff do not have a coordinated, shared and visible set of priorities that are communicated to wider stakeholders including staff. Thisrestricts the business’ ability to make appropriate tactical and timely decisions or investments. It is noted that some business Directorates have Directorate levelplanning documents.
• Annual planning cycle: Directorate budgets are largely determined based on the existing prior year budget with minor amendments made by SA Health to ensurecompliance with Treasury parameters. Budget files are reviewed by SCSS Finance team who consult with Directorate Managers before submitting to SA Health.The Health Performance Agreement outlines the available budget each year and SA Pathology is required to balance to this amount with limited ability tochallenge once finalised. However, there is not a robust internal process to challenge budgets against funding constraints and organisational priorities andimportant dialogue, debate and challenge around operational and strategic priorities with key decision internal makers is ad hoc and inconsistent.
• Efficiency planning: It is commonplace for organisations that are required to make significant savings to have a detailed efficiency plan that articulates how thesesavings will be made. Separate to an annual or strategic plan, this document focuses solely on the process to achieve the desired savings within an agreed timeline.Whilst some initial documentation exists articulating current efficiency initiatives, this has been recently assembled (2019) and is of lighter detail comparative toan efficiency plan. Furthermore, development of implementation planning to support the prior Efficiency Improvement Program was not completed.
• Workforce alignment: SA Pathology does not operate a staff performance management system, with staff performance being managed informally. Performanceand development goals are not set, which makes it harder for team members to understand how their efforts align to organisational priorities. This also makes theidentification and management of performance issues and provision of meaningful feedback to resolve issues more challenging.
• Commercial development: There is a lack of capability development support available to Directorate Managers and Business Managers to ensure that they havethe commercial acumen required to manage their Directorates. Consequentially, commercial awareness varies across Directorate leaders depending on their priorexperience and training, and opportunities exist to better support them to drive improved commercial performance.
In addition to constraining organisational performance, these factors have also contributed to variable workforce morale. Whilst our analysis did not involve cultural or staff assessments, engagement across the business indicated a growing frustration with SA Pathology’s inability to more robustly manage organisational performance. In many cases, staff appeared to resent the ask for them to find efficiencies due to perceived poor management practices outside of their control.
Successfully implementing the improvement opportunities will require comprehensive reforms across SA Pathology’s entire operations. Stronger business and management fundamentals are essential to guide and support the organisation as it engages staff, customers and stakeholders in delivering those reforms.

4. Performance review: OperationalStrategy and business management
A number of factors are influencing the delivery models of public and private pathology businesses across Australia. The absence of robust strategic and business management processes will leave SA Pathology more exposed to the potential impact of these pressures and less able to flexibly respond to them. This may create longer-term sustainability issues
Competitiveness of SA Pathology in a contestable market - final report 40
Area Overview Delivery model impact
Demand increases • Historic increases in service demand are likely to continue due to increased chronicdisease in an ageing population, increased routine testing and communityexpectations of closer involvement in health management.
• Pressure to meet increased demand withoutsignificant costs rises. Greater level of need tosupport complex cases as a public provider.
Raised customer expectations
• Increasing customer expectations relating to convenient access to collection centres,user-friendly and technology-enabled access to results and no out-of-pocketexpenses for testing services.
• Online services and apps for clients to ordertests and review results.
• Laboratory Information Systems enablingseamless integration with other health systems.
Genomics and molecular pathology
• Technology and the development of genomic testing is enabling improved testingtechniques which support more personalised and preventative care.
• Genomic and molecular pathology requiresextensive investment and specialised staff.
• Genomic tests are complex and are currently notsuited to automation.
Automation • Automation, such as robotics and advanced testing software holds significantimplications for the sector, particularly regarding consolidation and efficiency.
• Constraints to automation for public providers includes the complexity of some testswhich are carried out almost exclusively by the public system.
• Significant capital investment required todevelop automated capabilities.
• Automated laboratories require greater floorspace and a change in workforce composition.
Point of Care testing • POCT uses analytical devices to provide quality pathology services close to patientsrather than in a laboratory environment.
• Creates new requirements to remotely manageclinical risk at point of care.
• POCT technologies are expensive.
SA Health reforms and priorities
• SA Health and LHNs are seeking to deliver significant savings targets whilst alsodevolving greater autonomy and accountability to LHN Boards to provide strongcorporate oversight.
• Increased pressure to invest in innovation indiagnostic techniques, improve processes andcreate more responsive customer service.
• Increased need to demonstrate value for money.
Small SA market. High proportion of regionaland remote sites
• The total SA pathology market is comparatively smaller and more stable than otherstates, including population groups in Adelaide and regional and remote areas.
• Economies of scale are challenging given scale.
• Geography challenges efficient operation.
SA community expectations of pricing and access to services
• SA Pathology has a much higher share of the private pathology market thanequivalent bodies in other states and maintains a strong commitment to bulk billing.
• Customer expectations regarding access maychallenge efficiency initiatives and pricingchanges.

4. Performance review: OperationalActivities affecting operational performance
Competitiveness of SA Pathology in a contestable market - final report 41
SA Pathology’s operational delivery has been affected by a range of factors in recent years. In some cases, factors have createdongoing operational challenges for the business
Factor Overview and impact
Management and senior staff time commitment to external reviews
• SA Pathology has been externally reviewed multiple times since its creation in 2008.
• The prior Efficiency Improvement Program involved ongoing external review from 2014 to 2017 when the program was suspended.
• These external reviews required significant management and staff time to support data collection, analysis and implementation of
recommendations.
Opening of the new RAH in FY18
• SA Pathology had to fit out a new laboratory including significant new automation equipment and standardisation of processes.
• New equipment had to undertake test runs to ensure accuracy and efficiency of results.
• Numerous tests were replicated at the new RAH from Frome Road during the laboratory’s set up phase.
Lack of suitable space / location
• No single SA Pathology site has sufficient space to consolidate its entire non-urgent testing operations.
• Some laboratories at hospital sites reportedly have insufficient space to efficiently complete their current testing workload.
• For example at the new RAH laboratory space is reportedly less than adequate, with a set up which requires extra work for transport of
samples, and not enough space dedicated to laboratory testing.
Implementation challenges with the EPLIS laboratory information system
• Cerner’s Millennium ‘Enterprise Pathology Laboratory Information System’ (EPLIS) was implemented to replace SA Pathology’s aging
ULTRA laboratory system which was to cease being supported by its vendor.
• EPLIS now coordinates all aspects of laboratory processes including sample registration, front end processing, quality control, results
verification and validation, reporting and billing.
• Implementation challenges and ongoing operational challenges have impacted result turnaround times, clinical quality, customer
service, and created follow-on impacts on billing. Activities to rectify EPLIS continue to be undertaken.
Billing problems with the PBRC billing system
• The introduction of PBRC (a new billing system) in FY17 (a year prior to EPLIS) started a range of difficulties with the billing system,
resulting with numerous failed transactions and revenue that has not been captured.
• This was further exacerbated in FY18 with EPLIS and poor communication between the two systems.
Brennan review
• In 2012, an independent review was conducted of the clinical governance arrangements in place for SA Pathology staff accredited to
provide both pathology and clinical services to LHNs.
• The review recommended that SA Pathology continue to employ these dual-qualified staff, a rigorous accountability framework for their
clinical governance be established and that formal SLAs be created for the clinical support services they provide to LHNs.
• Since then some dual-qualified staff have been reassigned to LHNs, while others have remained with SA Pathology.
Epidemics• SA Pathology is closely involved in providing rapid testing support and advice to SA Health as it responds to influenza epidemics, food
contaminations and potential biohazards such as unidentified powders, materials or diseases.

4. Performance review: OperationalEPLIS
Competitiveness of SA Pathology in a contestable market - final report 42
The Enterprise Pathology Laboratory Information System (EPLIS) is an end-to-end process coordination system which has experienced operational issues since implementation, impacting result turnaround times, clinical quality, customer service, and creating follow-on impacts on billing. Activities to rectify EPLIS continue to be undertaken
Pathology practices use complex IT systems to coordinate all aspects of laboratory processes from sample registration and front end processing to results verification, reporting and billing. In 2014, SA Pathology selected a commercial off-the-shelf product from the Cerner Corporation to standardise its laboratory management. The objective of this investment was to connect all SA Pathology laboratories across metropolitan and regional SA and allow electronic test ordering and viewing of results through interfacing with SA Health’s Enterprise Patient Administration System (EPAS). The RFP and negotiations started in 2012 and the system was delivered in FY18 with an initial development cost of $34.5m.
During EPLIS’ implementation, SA Pathology and LHNs noted deterioration in result turnaround times and escalated concerns via local governance and clinical relationships. By May 2018, turnaround times for results had deteriorated to the point that there were major patient safety concerns. In response, the Minister for Health and Wellbeing formed a Task Force to investigate and remediate performance. Key issues caused through the implementation of EPLIS were:
• Data entry requirements were more complicated than expected, necessitating additional staffing support to perform data entry activities.
• Reduced ability to track where, or if, specimens were in the system due to poor interface with other systems such as EPAS.
• Delayed receipt of results, including extended time between collection and results availability, and instances of results not being provided.
• Provision of lower quality results in terms of their format, readability and reference ranges, as well as increases in errors.
• Reduced ability to perform some operations in a remote distributed manner.
The collective impact of theses issues has led to a number of factors which have negatively impacted wider organisational performance:
• Operational inefficiency such as the repeat collection of samples / specimens.
• Clinical performance issues where planned treatments have been delayed due to a lack of timely receipt of pathology results.
• Significant levels of dissatisfaction from customers, including additional concerns regarding issues management, communication and resolution. This has led to aloss of market share to the private sector.
• A decline in financial performance as a result of associated billing accuracy and processing issues, and additional expenditure associated with EPLIS rectification.An estimated $9.9m of unbilled revenue (total across three financial years) has been identified and broader cost estimations to fix EPLIS are to be finalised.
10/2012Issued RFP to select vendor for new laboratory information system
09/2014Minister approved agreement with Cerner
09/2017 – 12/2017Rollout of EPLIS with 11 Go- Lives
02/2018-04/2018Accelerated rollout of EPLIS with 35 Go-Lives(a)
12/2019 est.EPLIS data entry to be resolved
08/2018EPLIS optimisation project commenced post a Ministerial taskforce
12/2019 est.EPLIS automation and billing to be resolved
12/2018EPLIS reporting issue resolved
02/2017Checkley Go-Live Readiness Assessment
03/2017Pilot with WCH automated transfusion
09/2017New RAH opens
06/2018Checkley Lean review

Case study – Pathology Queensland
● Demand management is being pursued by public pathology providers globally.
● Pathology Queensland (PQ) has been pursuing a demand management strategyand their pathology cost as a share of total ED costs per separation are now4.4%, one of the lowest in Australia.
● PQ collaborates with clinicians in public hospitals to reduce demand forpathology testing through identifying optimal groups of tests for differentclinical contexts, and through the elimination of unnecessary or duplicatedtesting. A decision support tool for ordering is also being implemented.
Demand management practices in place in Pathology Queensland
● ‘Retest’ rules have been built into the PQ LIS to alert laboratory staff when atest is being repeated on a patient within a customised time window.
● Detailed pathology activity is provided to clinicians through an online portal.
● Test choice for clinicians is limited by imposing diagnostic pathways whichlimit the type and frequency of pathology investigations.
● Targeted education campaigns are run to better inform the clinicians, units orfacilities pathology ordering decisions.
● Utilisation of decision support tools will be implemented to enable pathologyordering of clinically appropriate testing, aligned to international evidencebased practice.
4. Performance review: OperationalDemand management
Competitiveness of SA Pathology in a contestable market - final report 43
SA Pathology demand management overview
● Demand management is supporting clinicians to order appropriate setsof diagnostic tests through improved clinician education, improvedunderstanding of the test suite available and decision support tools. It isa means to ensure the right tests are ordered at the right time.
● Studies show that anywhere from 5 - 25% of pathology requestsgenerated by clinicians are ‘inappropriate’ in that the results haveno impact on patient care.(a)(b)
● Further studies indicate that intervention reduces inappropriatetesting by up to one-third.(c)
● Demand management reduces the volume of testing for SA Pathology,but can improve patient outcomes (by for example improving turnaroundtimes on the remaining tests) and reduce the cost to the system overall.
● SA Pathology maintains records of tests requested by each hospital.Consultations are held with hospitals or clinicians (on an ad-hoc basiswhere necessary) to limit over-ordering.
NSW WAVic
5.7% national weightedaverage: 6.3%
NTSA
9.8%
6.9%
3.0%
ACT
8.5%
QLD
4.4%
6.0%
Public pathology cost as a % of total ED cost per separationFY16 (Round 20), NHCDC
Source: The National Hospital Cost Data Collection (NHCDC), Round 20 (FY16)
Notes: (a) Spelman D; Inappropriate pathology ordering and pathology stewardship; Med J Aust 2015; 202 (1): 13-15. (b) Zhi M Ding EL Theisen-Toupal Jet al. The landscape of inappropriate laboratory testing: a 15-year
meta-analysis; PLoS One . 2013;8; (c) The Australian National University, Medical Assessment and Planning Unit, The Canberra Hospital; optimising pathology blood test ordering in the hospital setting
SA Pathology advises clinicians on how to select the appropriate diagnostic tests and reports demand data to LHNs to help them contain costs. Potential exists to increase the focus on demand management, but this is also limited by the level of available financial and operational data

5. Improvement opportunities
44

Competitiveness of SA Pathology in a contestable market - final report 45
4. Improvement opportunitiesOverview
Opportunities to generate efficiencies and increase revenue have been identified in consultation with SA Pathology. Achievement of benefits will require comprehensive reform of SA Pathology’s operating model and business management practices, with associated one-off implementation costs
Improvement opportunity overview
● PwC worked closely with SA Pathology to identify a range of potentialimprovements. This involved development of a financial baseline, over 100interviews and workshops with staff.
● An initial list of opportunities was reviewed with SA Pathology withchallenge from PwC and Subject Matter Experts and subsequently prioritisedand refined. Prioritised opportunities relate to three areas:
● Cost: 15 Opportunities to optimise the existing cost structure to removeinefficiencies and improve operations.
● Revenue: Nine opportunities to increase revenue through new revenuestreams, increasing market share or improving pricing.
● Business Management: Four opportunities to improve businesspractices and support ongoing sustainability.
● Further cost opportunities may be generated once SA Pathology has a betterunderstanding of financial and operational performance.
● Analysis indicates that revenue and cost improvement opportunities maypotentially deliver $69.2m in benefits for SA Pathology when fullyimplemented. Further benefits are likely to be achieved from implementationof business management initiatives, however accurate quantification of theseis not possible.
● Successfully delivering these benefits will require enabling investment andmanagement of associated risks and complexities. Indicative implementationcosts have been estimated (subject to detailed business case costings):
● $14.7m one off costs (excluding funding already committed or things tobe funded internally).
● $2.0-3.0m in change management costs.
● TVSPs cost may also be required.
● Nine of the improvement opportunities are ranked as having a HIGHimplementation risk due to potential issues with IR, stakeholder concerns orcurrent implementation capability. Twelve opportunities are ranked ashaving a LOW implementation ease, indicating they are complex toimplement.
Potential benefits ($m)
Gross Benefits realisation timeline ($m)
Budget Impact of benefits ($m)
Implementation costs ($m)
Net benefits impact on the budget, after implementation costs ($m)
Potential benefit range Mid point
Revenue initiatives 27.4-32.4 29.9
Cost initiatives 34.5-44.1 39.3
Business management initiatives n/a n/a
Total 61.9 – 76.5 69.2
FY19 FY20 FY21 FY22
Revenue initiatives 6.0-6.0 18.1-18.5 21.5-23.3 27.4-32.4
Cost initiatives 0.5-0.6 9.9-13.4 22.3-28.8 34.5-44.1
Total gross benefits 6.5-6.6 28.0-31.9 43.8-52.1 61.9-76.5
FY19 FY20 FY21 FY22
Revenue initiatives 0.0-0.0 0.2-0.3 0.5-1.0 2.1-4.9
Cost initiatives 0.0-0.0 5.6-8.5 14.8-20.2 27.0-35.5
Total budget impact 0.0-0.0 5.8-8.8 15.3-21.2 29.1-40.4
Assumed already in the budget 6.5-6.6 8.3-8.4 9.5-9.6 9.5-9.6
Internal revenue/cost transfer 0.0-0.0 13.9-14.7 19.0-21.3 23.3-26.5
Business Management initiatives Revenue initiatives Cost initiatives Total
6.7 2.0 6.0 14.7
FY19 FY20 FY21 FY22
Total gross benefits 6.6 29.9 48.0 69.2
- Assumed already in the budget 6.6 8.4 9.6 9.6
- Internal revenue/cost transfer 0.0 14.3 20.2 24.9
Total budget impact 0.0 7.3 18.3 34.8
- Implementation costs 2.7 5.0 7.0 0.0
Net budget benefit -2.7 2.3 11.3 34.8

Competitiveness of SA Pathology in a contestable market - final report 46
5. Improvement opportunitiesOverview
Cost opportunities relate to four key areas of focus: operational consolidation, staff mix adjustments, improvements in procurement and broader efficiencies across the business. Potential exists to realise gross benefits of $34.5 - 44.1m by FY22
SA Pathology’s financial year end for FY19 is 30 June 2019, thus leaving only limited time for opportunity implementation. As the majority of the operating costs for FY19 have already been incurred and revenue improvement opportunities require time to mature, only limited amounts of benefits can be realised within FY19.
Cost improvement opportunities gross benefit realisation
FY19 FY20 FY21 FY22
C1: ‘Hub and Spoke’ model - consolidation of all non-urgent testing to one location 0.0-0.0 0.5-1.1 1.6-3.2 2.4-4.7
C2: Collection centre footprint review and profitability improvement strategy 0.0-0.0 0.5-0.6 1.1-1.3 1.4-1.7
C3: Realign the staffing mix in the collection centres 0.0-0.0 0.4-0.5 0.8-0.9 0.8-0.9
C4: Realise lab staffing efficiencies 0.0-0.0 1.4-1.4 2.7-2.7 5.5-5.5
C5: Renegotiate agreements with 3rd party suppliers 0.0-0.0 0.6-1.3 1.1-2.2 1.1-2.2
C6: Remove inefficiencies caused by EPLIS – assumed already in the budget 0.5-0.6 2.3-2.4 3.5-3.6 3.5-3.6
C7: Invest in digital Pathology and digital communication 0.0-0.0 0.0-0.0 0.5-1.5 5.0-7.5
C8: Rationalise and improve management of research activities and research support 0.0-0.0 0.9-0.9 1.1-1.1 1.1-1.2
C9: Reduce operational inefficiencies across all Directorates 0.0-0.0 0.7-1.4 0.7-1.4 1.1-2.1
C10: Improve couriers efficiency 0.0-0.0 0.3-0.5 0.3-0.5 0.3-0.6
C11: Manage overheads and non-diagnostic costs 0.0-0.0 0.3-0.8 1.5-1.9 1.5-1.9
C12: Stop unprofitable tests that are private referred and/or community work n/a n/a n/a n/a
C13: Transfer of business to appropriate agency - internal revenue/cost transfer 0.0-0.0 2.0-2.5 4.0-5.0 4.0-5.0
C14: Commission testing activities from alternative providers where appropriate 0.0-0.0 0.0-0.0 0.7-0.8 1.4-1.8
C15: Commission GMP services from an alternative provider 0.0-0.0 0.0-0.0 2.7-2.7 5.4-5.4
Total 0.5-0.6 9.9-13.4 22.3-28.8 34.5-44.1
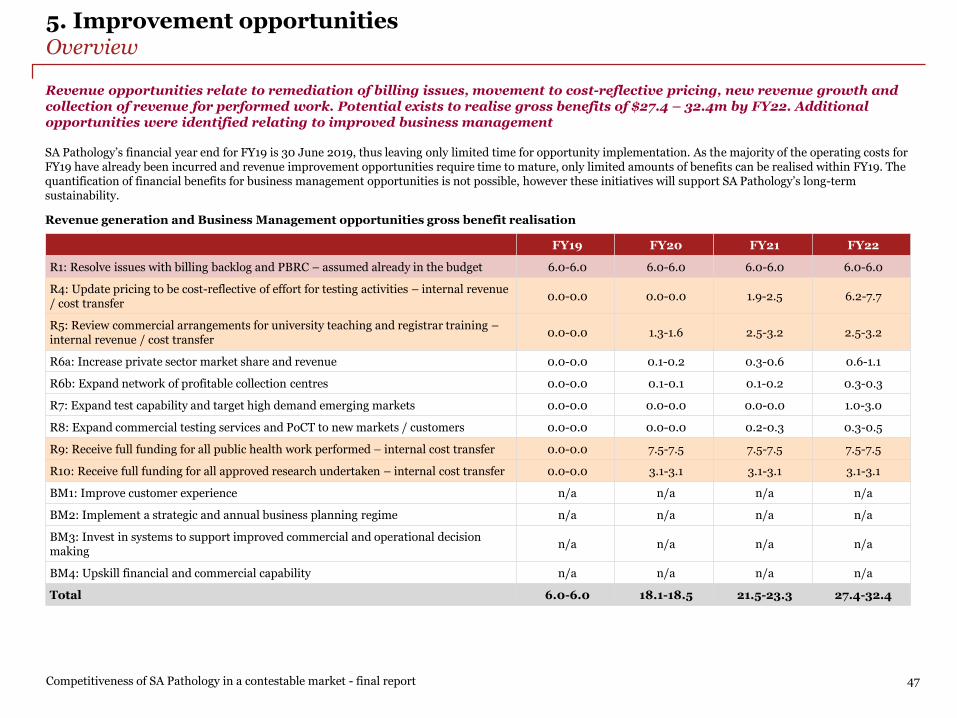
Competitiveness of SA Pathology in a contestable market - final report 47
5. Improvement opportunitiesOverview
Revenue opportunities relate to remediation of billing issues, movement to cost-reflective pricing, new revenue growth and collection of revenue for performed work. Potential exists to realise gross benefits of $27.4 – 32.4m by FY22. Additional opportunities were identified relating to improved business management
SA Pathology’s financial year end for FY19 is 30 June 2019, thus leaving only limited time for opportunity implementation. As the majority of the operating costs for FY19 have already been incurred and revenue improvement opportunities require time to mature, only limited amounts of benefits can be realised within FY19. The quantification of financial benefits for business management opportunities is not possible, however these initiatives will support SA Pathology’s long-term sustainability.
Revenue generation and Business Management opportunities gross benefit realisation
FY19 FY20 FY21 FY22
R1: Resolve issues with billing backlog and PBRC – assumed already in the budget 6.0-6.0 6.0-6.0 6.0-6.0 6.0-6.0
R4: Update pricing to be cost-reflective of effort for testing activities – internal revenue / cost transfer
0.0-0.0 0.0-0.0 1.9-2.5 6.2-7.7
R5: Review commercial arrangements for university teaching and registrar training –internal revenue / cost transfer
0.0-0.0 1.3-1.6 2.5-3.2 2.5-3.2
R6a: Increase private sector market share and revenue 0.0-0.0 0.1-0.2 0.3-0.6 0.6-1.1
R6b: Expand network of profitable collection centres 0.0-0.0 0.1-0.1 0.1-0.2 0.3-0.3
R7: Expand test capability and target high demand emerging markets 0.0-0.0 0.0-0.0 0.0-0.0 1.0-3.0
R8: Expand commercial testing services and PoCT to new markets / customers 0.0-0.0 0.0-0.0 0.2-0.3 0.3-0.5
R9: Receive full funding for all public health work performed – internal cost transfer 0.0-0.0 7.5-7.5 7.5-7.5 7.5-7.5
R10: Receive full funding for all approved research undertaken – internal cost transfer 0.0-0.0 3.1-3.1 3.1-3.1 3.1-3.1
BM1: Improve customer experience n/a n/a n/a n/a
BM2: Implement a strategic and annual business planning regime n/a n/a n/a n/a
BM3: Invest in systems to support improved commercial and operational decision making
n/a n/a n/a n/a
BM4: Upskill financial and commercial capability n/a n/a n/a n/a
Total 6.0-6.0 18.1-18.5 21.5-23.3 27.4-32.4

Competitiveness of SA Pathology in a contestable market - final report 48
5. Improvement opportunitiesBenefit impact
Cost savings / new revenues to the SA health system (against FY18 actuals)
FY22 benefit ($m)
C1: ‘Hub and Spoke’ model - consolidation of non-urgent testing to one space 2.4-4.7
C2: Collection centre footprint review and profitability improvement strategy 1.4-1.7
C3: Realign the staffing mix in the collection centres 0.8-0.9
C4: Realise lab staffing efficiencies 5.5-5.5
C5: Renegotiate agreements with 3rd party suppliers 1.1-2.2
C6: Remove inefficiencies caused by EPLIS - existing 3.5-3.6
C7: Invest in digital Pathology and digital communication 5.0-7.5
C8: Improve management of research activities & rationalise research support 1.1-1.2
C9: Reduce operational inefficiencies across all Directorates 1.1-2.1
C10: Improve couriers efficiency 0.3-0.6
C11: Manage overheads and non-diagnostic costs 1.5-1.9
C12: Stop unprofitable tests that are private referred and/or community work n/a
C14: Commission testing activities from alternative providers where appropriate
1.4-1.8
C15: Commission GMP services from an alternative provider 5.4-5.4
R1: Resolve issues with billing backlog and PBRC - existing 6.0-6.0
R6a: Increase private sector market share and revenue 0.6-1.1
R6b: Expand network of profitable collection centres 0.3-0.3
R7: Expand test capability and target high demand emerging markets 1.0-3.0
R8: Expand commercial testing services and PoCT to new markets/customers 0.3-0.5
Total excluding initiatives in the budget 29.1-40.4
Total including initiatives in the budget 38.6-50.0
• Benefit range of: $38.6-50.0m.• Mid-point: $44.3m against FY18actuals.
• Benefit range of: 23.3-26.5m.• Mid-point benefit: $24.9m.• All benefits remain relevant for future
years budgets.
When fully implemented by FY22, the improvement opportunities have the potential to generate gross benefits of $44.3m compared to the FY18 actuals baseline (or $34.8m compared to the FY19 budget which was reduced by $9.6m in anticipation of two of the opportunities(a)). $24.9m of these gross benefits are internal transfers within SA Health
Notes: (a) Source: SA Pathology
Internal revenue / cost transferFY22 benefit
($m)
C13: Transfer of business to appropriate agency 4.0-5.0
R4: Update pricing to be cost-reflective of effort for testing activities
6.2-7.7
R5: Review commercial arrangements for university teaching and registrar training
2.5-3.2
R9: Receive full funding for all public health work performed
7.5-7.5
R10: Receive full funding for all approved research undertaken
3.1-3.1
Total internal revenue / cost transfer 23.3-26.5
Total including initiatives in the budget and internal revenue / cost transfer
61.9-76.5
• Of which $9.5-9.6m are already in the FY19 budget.(a)
• So net benefits FY22 are $29.1-40.4m, midpoint: $34.8m.

Competitiveness of SA Pathology in a contestable market - final report 49
5. Improvement opportunitiesImplementation costs
A provisional one off investment of $6.0m is required to realise $34.5-44.1m in cost improvement opportunities. TVSPs are not included in the implementation costs below, but would also be required
Cost improvement opportunities implementations costs(a) ($m):
Opportunity One off cost Notes
C1: ‘Hub and Spoke’ model - consolidation of all non-urgent testing to one location
2.5$2.5m one off to fit out location, transport equipment over FY19 and FY20. Does not reflect cost of a modern lab space.
C2: Collection centre footprint review and profitability improvement strategy
0.4$0.3m one off for moving equipment and make good on leases and $0.1m one off for marketing.
C3: Realign the staffing mix in the collection centres - Cost for new staff training absorbed by the business.
C4: Realise lab staffing efficiencies 1.3 $1.3m to training to ensure patient outcomes.
C5: Renegotiate agreements with 3rd party suppliers -Cost to identify the agreements that are expiring and negotiate effectively absorbed by the business.
C6: Remove inefficiencies caused by EPLISApproved project budget is $5.0m of which $1.9m was received as additional budget in FY19 and $3.1m to be internally funded.
C7: Invest in digital Pathology and digital communication 1.3$1.3m for technology deployment, does not include cost for creating a modern lab space
C8: Rationalise and improve management of research activities and research support
-Cost for setting up a way to monitor and manage research and implementing it absorbed by the business.
C9: Reduce inefficiencies across all Directorates -
C10: Improve couriers efficiency 0.5$0.4m to hire advisor to optimise couriers and purchase the relevant software and $0.1 to train FTE in the new systems.
C11: Manage overheads and non-diagnostic costs -Cost to better manage the call centres and identify how to reduce staff cost absorbed by the business.
C12: Stop unprofitable tests that are private referred or community work - Not available.
C13: Transfer of business to appropriate agency -
C14: Commission testing activities from alternative providers where appropriate
-
C15: Commission GMP services from an alternative provider -
Total for cost opportunities 6.0 (Excluding $1.9m of EPLIS costs)
Notes: (a) The implementation costs are a high-level estimate and a detailed business case needs to be developed for each opportunity. The C1 implementation costs reflect a “lift and shift” to Frome Road and RAH and will not provide for the modern lab
space required to achieve full savings in the areas of consolidation, workforce mix, multi-skilling.

Competitiveness of SA Pathology in a contestable market - final report 50
5. Improvement opportunitiesImplementation costs
A provisional one off investment of $2.0m is required to realise $27.4-32.4m in revenue improvement opportunities. A provisional one off investment of $6.7m is required to support business management opportunities
Revenue and Business Management opportunities implementations costs ($m):
Opportunity One off cost Notes
R1: Resolve issues with billing backlog and PBRCCost for temporary FTE required for one year to help clear the billing backlog to be funded internally
R4: Update pricing to be cost-reflective of effort 0.4 Consultancy help with pricing models and systems transition plan
R5: Review teaching at universities and training of registrars No costs for implementation
R6a: Increase revenue through increasing market share in the private sector
0.3Develop and execute strategy to increase market share in private sector includes advertising to GPs, surgeries, community etc
R6b: Expand network of profitable collection centres 0.5Cost to identify the right locations for 5-6 new centres and fit them out. The cost of their FTEs is in their margin calculation
R7: Expanding test capability and targeting high demand emerging markets
0.5Undertake study to identify the right new tests to be offered and new markets to be entered. Running costs are in the margin
R8: Expand commercial testing services and PoCT to new markets / customers
0.3 Cost to expand the PoCT
R9: Ensure cost of public health work is recovered - No costs for implementation
Total for revenue opportunities 2.0
BM1: Improve customer experience 2.0$2m for CRM system design and implementation and ongoing costs of $0.5m for the team managing customer relations
BM2: Develop Strategic and annual business planning regime 0.2 One off consultancy cost to assist with initial development
BM3: Improve systems to provide information to support decision making
4.5$3.0-5.0m for system design and implementation and deployment and $0.5m for training on systems
BM4: Upskill the finance team / function - $0.5m for capability building program
Total business management 6.7
Total implementations cost 14.7

Competitiveness of SA Pathology in a contestable market - final report 51
5. Improvement opportunitiesRisk summary
In implementing the improvement opportunities it will be important for SA Pathology to identify and manage the associated patient outcome and clinical risks. Provisional risks are identified below and more detailed analysis and mitigation approaches should be developed as part of implementation planning
Improvement opportunity
Risk rating
Key clinical and patient outcome risks Other
C1: ‘Hub and Spoke’ model -consolidation of all non-urgent testing to one location
High • Potential for disruption caused during the transition period.• Needs clinical consultation to determine correct split of on/off-site testing.• Continued quality will rely on facilities and fit-out of the new location.• Potential for associated staff resistance and loss due to low support.• Maintaining close clinical support, teaching quality, and research collaboration is
dependent on business systems to support remote access/communications.
• IR risk and LHN clinicians support.• Broad organisational investment
required.• Increased need for an effective and
efficient courier system.
C2: Collection centre footprint review and profitability improvement strategy
Medium • Transition risk for patients who will need to access new collection centres.• Potential for associated staff resistance and loss due to low support. This would
impact the service delivery of the remaining collection centres.• Risk of competitors not bulk billing.
• IR risk.• Broader stakeholder support may be
limited.
C3: Realign the staffing mix in the collection centres
High • Need to ensure phlebotomists can manage clinical risks for highly specialisedsample taking, and retain nursing staff where warranted.
• IR risk.
C4: Realise lab staffing efficiencies
High • Will require capability development support to ensure quality levels are maintained.• Potential for associated staff resistance.
• IR risk.
C5: Renegotiate agreements with 3rd party suppliers
Low • Some minimal potential for disruption during transition period. • Will require co-ordination across Gov.• Resistance from existing suppliers.
C6: Remove inefficiencies caused by EPLIS
Medium • Prior implementation experience highlights the need for careful and thoroughimplementation planning and support to mitigate the potential for any clinical orpatient outcome impacts.
• Needs careful implementationplanning to maintain system integritywhile making the required changes.
C7: Invest in digital Pathology and digital communication
High • Potential for disruption caused during the transition period.• Will require capability development support to ensure quality levels are maintained.• Risk of loss of clinical interaction if not implemented correctly.• Potential for staff resistance, including to the required retraining of pathologists.
• IT system integration.• IR risk.
C8: Rationalise and improve management of research activities and research support
Medium • Whilst SA Health will continue to benefit from targeted research in key areas,broader activities supporting wider testing research will be reduced limitingpotential for testing innovations in these areas.
• Potential for associated staff resistance.
• IR risk.• Broader stakeholder support may be
limited.
C9: Reduce inefficiencies across all Directorates
Medium • May involve changes to collection centres operating hours, impacting patients.• Potential for associated staff resistance.
• IR risk.• Broader stakeholder support may be
limited.

Competitiveness of SA Pathology in a contestable market - final report 52
5. Improvement opportunitiesRisk summary
In implementing the improvement opportunities it will be important for SA Pathology to identify and manage the associated patient outcome and clinical risks. Provisional risks are identified below and more detailed analysis and mitigation approaches should be developed as part of implementation planning
Improvement opportunity
Risk rating
Key clinical and patient outcome risks Other
C10: Improve courier efficiency
Medium • Potential for disruption caused during the transition period. • N/A.
C11: Manage overheads and non-diagnostic costs
Low • Potential for disruption caused during the transition period. • Broader stakeholder support may belimited.
C12: Stop unprofitable tests that are private referred and/or community work
Low • Need to maintain patients’ access to service, eg ensure patient gets referred on• Private providers will need to seek alternative arrangements (or agree a new
commercial agreement). Potential for disruption whilst this is being agreed.• Challenging to segregate testing for public and private patients in ambulatory sector
• Broader stakeholder support may belimited.
C13: Transfer of business to appropriate agency
Low • Potential for disruption caused during the transition period.• Potential for associated staff resistance.
• IR risk.
C14: Commission testing activities from alternative providers where appropriate
High • Potential for disruption caused during the transition to a new operating model.• Some potential for clinical risks due to increased processing and turnaround time.• Oversight will be required to ensure control over the analysis and reporting.• SA researchers may find it more difficult to undertake research in that field.
• Will require establishment of a suitablerelationship with new providers.
• Broader stakeholder support may belimited and IR risk.
C15: Commission GMP services from an alternative provider
High • Potential for disruption caused during the transition to a new operating model.• Some potential for clinical risks due to increased processing and turnaround time.• Oversight will be required to ensure control over the analysis and reporting.• SA researchers may find it more difficult to undertake research in that field.
• Will require establishment of a suitablerelationship with new providers.
• Broader stakeholder support may belimited and IR risk.
R1: Resolve issues with billing backlog and PBRC
Low • N/A. • Likely to be timely to resolve.
R4: Update pricing to be cost-reflective of effort
High • N/A.• Broader stakeholder support may be
limited.
R5: Review teaching at universities and training of registrars
High • N/A.• Broader stakeholder support may be
limited.
R6a: Increasing market share in the private sector
Low • N/A.• Capacity restrictions.• Unrealised financial investment if
revenues are not realised.

Competitiveness of SA Pathology in a contestable market - final report 53
5. Improvement opportunitiesRisk summary
In implementing the improvement opportunities it will be important for SA Pathology to identify and manage the associated patient outcome and clinical risks. Provisional risks are identified below and more detailed analysis and mitigation approaches should be developed as part of implementation planning
Improvement opportunity
Risk rating
Key clinical and patient outcome risks Other
R6b: Expand network of profitable collection centres
Low • N/A.• Capacity restrictions.• Unrealised financial investment if
revenues are not realised.
R7: Expanding test capability and targeting high demand emerging markets
Low • N/A.• Capacity restrictions.• Unrealised financial investment if
revenues are not realised.
R8: Expand commercial testing services and PoCT to new markets / customers
High
• Risk of clinical outcomes if PoCT is used to replace lab testing and results.interpretation by pathologists – quality assurance.
• Risk of mis-diagnosis if PoCT is used to replace lab testing.• Risk of loss of information as PoCT results are not integrated into the IT systems.
• Capacity restrictions.• Unrealised financial investment if
revenues are not realised.
R9: Receive full funding for all public health work performed
Low • N/A.• Appropriate funding to be provided by
the Government to LHNs to purchasethose services.
R10: Receive full funding for all approved research work performed
Low • N/A.• Difficulty in measuring and monitoring
approved research.
BM1: Improve customer experience
Low • N/A. • Capability uplift required.
BM2: Develop Strategic and annual business planning regime
Low • N/A. • Capability uplift required.
BM3: Improve systems to provide information to support decision making
High • N/A. • IT implementation risk.• Capability uplift required.
BM4: Upskill financial and commercial capability
High • N/A. • Capability uplift required.

Competitiveness of SA Pathology in a contestable market - final report 54
5. Improvement opportunitiesOpportunity summary
In developing its implementation strategy, SA Pathology will consider the relative scale of benefits, implementation complexity and required investment. This will help to further prioritise opportunities
Mapping of improvement opportunities to identify ‘quick wins’ (top right)
0.0
Implementation ease
Be
ne
fit
siz
e (
$m
)
Low Medium High
C1
C2
C3
C14
C5
C6
C7
C8
C9
C10
C11
C13C15C4
R1
R4
R5
R6a
R6b
R7
R8
R9
R10
Legend: Green denotes low risk, Orange medium and Red high risk
Methodology: The 24 prioritised opportunities have been evaluated for their investment benefits against the Implementation Ease. C12 and BM1 to BM4 were not charted as their benefits cannot be accurately estimated.
0.4
1.2
3.0
6.0
8.0
key Investment
• C1 ‘Hub and Spoke’ consolidation 2.5
• C2 Collection centres optimisation 0.4
• C3 Realign staff mix in collection centres 0.0
• C4 Realise lab staffing efficiencies 1.3
• C5 Renegotiate with 3rd party suppliers 0.0• C6 Resolve EPLIS inefficiencies 0.0• C7 Invest in digital Pathology 1.3
• C8 Rationalise research activities 0.o
• C9 Operational efficiencies 0.0
• C10 Improve couriers efficiency 0.5
• C11 Manage overheads 0.0
• C12 Stop unprofitable private work or referrals n/a
• C13 Transfer of business 0.0
• C14 Commission alternative providers 0.0
• C15 Commission GMP externally 0.0
• R1 Resolve billing backlog 0.0
• R4 Cost-reflective pricing 0.4
• R5 Review funding for teaching 0.0
• R6a Increase private market share 0.3
• R6b Expand network of collection centres 0.5
• R7 Target growing markets 0.5
• R8 Expand PoCT 0.3
• R9 Review funding for Public Health 0.0
• R10 Review funding for research 0.0
• BM1 Improve customer experience 2.0
• BM2 Develop strategic planning 0.2
• BM3 Improve systems 4.5
• BM4 Upskill financial capability 0.0
C12

5. Improvement opportunitiesImplementation considerations
Improvement opportunities represent a comprehensive set of reforms that will require close focus and attention. Associated planning, resourcing, investment, management and monitoring will need to be considered to ensure that SA Pathology is able to execute the opportunities and capture the identified benefits
Competitiveness of SA Pathology in a contestable market - final report 55
The improvement opportunities represent a significant package of work for SA Pathology and will effectively result in a new operating model for the business. The volume of work, planning and support involved should not be underestimated. Furthermore, success will require close focus by SA Pathology management and a sustained drive through a period of time.
In planning the approach to implementation it will be important to recognise and consider the following key factors:
• Sustained changes: The program of change captured within the improvement opportunities will result in a new operating model for SA Pathology. Movementtowards this model will require sustained changes across the organisation in parallel to delivering business as usual activities. A program of this scale willrequire energy and drive throughout to ensure that an appropriate level of pace is maintained and that progress is held to account.
• Timing: The collective range of opportunities will need to be reviewed in order to understand interdependencies that may exist between them and where thereare logical approaches to sequencing. Key packages of work will require the preparation of detailed business cases which may further impact activities and resultin changes to the quantification of benefits and investment costs.
• Planning: Improvement opportunity development with SA Pathology staff has identified initial details for each opportunity. Whilst these are sufficient for thepurposes of this report, they will need to be complemented by a detailed planning process to provide further granularity. It will be important for this exercise tocapture a sufficient level of detail, whilst not becoming excessive and a delay to implementation activity.
• Risk management: Prior large scale change initiatives have highlighted the need for appropriate levels of risk management during implementation. Given thecritical role that SA Pathology plays across the SA Health system, it will be important that suitable protocols are put in place to help limit the potential forincreased clinical risk or unintended impacts on patient outcomes.
• Resourcing and support: The scale of opportunities and timeline for implementation should be considered against the capacity and capability within SAPathology. Where gaps exists or there are limitations in availability, it will be important to address this. Additional support will be valuable in enabling SAPathology to have a dual focus on improvement and management of business as usual activities.
• Ongoing investment: Initial investment costs have been captured and further work will need to be performed to fully develop estimates. More broadly, there islikely to be a need for SA Pathology to continue investment within the business to support its trajectory towards sustainability. Investment will need to beconsidered across SA Pathology to ensure that it continues to have the right skills, tool and facilities to support performance.
• Change management: There are indications of ‘reform fatigue’ amongst SA Pathology staff which are important to recognise prior to commencement of furtherchange. It will be important that during implementation, appropriate support and care is provided to staff to ensure that they are involved and considered innew working arrangements.
• Performance management: Appropriate oversight arrangements will need to be established to support progress visibility, encourage activity and escalate issues.Oversight will need to be at various levels including for each improvement opportunity, as well as for SA Pathology as a whole. An appropriate performancemanagement regime will also help provide visibility to broader stakeholders within SA Health and Government.

6. Contestable and non-contestable services
56

6. Contestable and non-contestable servicesApproach
Competition in public pathology services is not currently widespread in Australia and consideration of key issues is requiredto fully understand the implications of a change in approach. To support thinking, a contestability framework was developed
Competitiveness of SA Pathology in a contestable market - final report 57
Current market dynamics in public pathology services
• While the market for private pathology services is well established in Australia, competition in public pathology services is not yet widespread with most statesother than Victoria continuing to operate statewide services which have monopoly access to public hospitals. Increasingly, mature public pathology providers areproactively considering where the non-Government sector can best support their delivery, however this is currently limited.
• By contrast, Victoria allows its health networks to operate their own pathology service or contract an external provider. As a result, a range of private and in-house services continue to operate. Private providers support many regional and second tier public hospitals, while in-house services are more common in largertertiary public hospitals with more complex testing requirements.(a) Private providers do support two larger tertiary public hospitals in Victoria, and someprivately administered tertiary hospitals in other States, but competitive supply of the more complex end of the public pathology market is less developed.
• As a result, there is currently a limited amount of domestic and comparable experience within health networks and potential providers to consider in designingcontracting, pricing and commercial models, risk assignments and mitigations, governance, and management arrangements. Whilst broader examples existinternationally, any change in approach would need to be carefully defined and managed.
Contestability framework overview
To support a clear understanding of services which could be considered as contestable, and those which should always be performed only by Government (non-contestable), a contestability framework was developed. This framework sought to explore key criteria relating to system performance and sustainability, risk management, stakeholder views, market capacity and interest and strategic alignment:
Is there currently an alternative provider market for this service within SA, or high potential for one to exist? This seeks to understand whether SA Pathology already competes with alternate providers to offer this service in SA. It also considers whether under the right conditions, an alternative provider market would be interested and capable of providing of servicing SA (either within SA or remotely), with the required clinical governance and technical expertise, meeting required service levels.
Does the service play a critical role regarding the management of public health risks and responsibilities? This criteria looks to understand whether the service plays a critical role in relation to public health responsibilities that may deem it critical to being delivered by Government alone.
Does the service play a critical role regarding SA Health system sustainability and continuity? This seeks to understand instances where services have a unique, direct and critical link to the broader performance and sustainability of the health system. For such services, poor performance or delivery issues may create broader systems performance issues that require signification management and attention.
Are patients and clinicians likely to express strong objections to receiving this service from an alternative provider? Consideration should be given to the voices of patients and clinicians with regards to instances where strong objections exist to service delivery by an alternative provider.
Does SA Pathology currently has a unique position or competitive advantage in this area? This seeks to understand service areas where due to recent investment, resource capabilities or historical culture and performance, SA Pathology currently has a compelling position which should be retained. It should be noted that this criteria was used in lieu of considering ‘Strategic Alignment’, given the absence of an agreed strategic plan for SA Pathology.
1
2
3
4
5
Notes: (a) Private providers in Victoria support hospitals in Ballarat, Bendigo, Geelong, Warrnambool, Wangaratta, Wodonga, Traralgon, Swan Hill, Kyneton, Camperdown, Bairnsdale, Sale, Leongatha, Wonthaggi, Warragul, and Hamilton. In greater metro Melbourne, private providers support second tier hospitals in areas such as Sunshine and Footscray (Western Health), Northern and Frankston.

6. Contestable and non-contestable servicesKey findings
Analysis suggests the majority of SA Pathology’s services could be supplied by alternative providers with appropriate contract conditions and risk management arrangements. Sensitivities and concerns are highest for some specialised, low volume tests, MDTS, training, primary research and public health activities given their traditional Government delivery
Criterion 1. Is there currently an alternative provider market for this service within SA, or high potential for one to exist?
• Interstate public providers have the required equipment, expertise, systems and clinical governance to broadly offer the same range of diagnostic and publichealth services as SA Pathology and may be willing to provide those service remotely under referral from SA Pathology or an alternate private provider.
• Two of the three largest private provider networks are investing in automated testing laboratories in Adelaide to provide routine diagnostic testing to theirexisting SA clients in private practices, and would be readily able to leverage that local capacity to offer off-site routine, high volume diagnostic testing to LHNs.
• At present, SA-based private providers typically refer on more specialised and low volume diagnostic testing to SA Pathology where they lack the technicalcapability or cannot charge for those tests under Medicare coning rule. Private providers have interstate infrastructure and clinical expertise across a wide rangeof specialised testing and have indicated willingness to invest in providing those services in SA under the right contract conditions.
• Teaching, training and primary research, clinical support in multi-disciplinary teams (MDTs), and support to public health management are typically only offeredby public providers. Some Victorian private providers are involved in training and MDTs, and potential alternate providers have indicated that they could providethese broader non-diagnostic services if required specifications were clear, however appetite would need to be confirmed more formally.
• Testing to support public health management and crisis responses typically require rapid availability of surge capacity in certain routine tests. In addition, thecritical role they have in relation to public safety and health mean that these services are usually performed by Government. Provision of these services wouldrequire innovative delivery arrangements involving appropriate standing charges to fund the ability of private providers to maintain spare testing capacity.
• Primary research is offered by a range of research institutions across Australia. It is not typically offered by private pathology services and they would likely needto partner with an existing research institution or develop the required technical expertise and academic standing to attract available grant funding.
Criterion 2. Does the service play a critical role regarding the management of public health risks and responsibilities?
• Some routine diagnostic testing does directly support SA Health’s monitoring and management of public health issues, and so maintaining the surge capacity andclinical relationships to provide this support at short notice is important to ensure Government can flexibly and rapidly respond to emerging health issues.
• Public health management has diffuse benefits, a high public profile, close links to human services agencies, and uncertain but urgent demand volumes. Thesefeatures traditionally make this inappropriate to be delivered by non-Government providers due to the associated risks of delivery failure.
• Similarly, SA Health may be cautious about relying on alternate private providers or interstate public providers to maintain surge testing capacity withoutappropriately sophisticated contracting, pricing and risk management approaches to ensure appropriate capacity is reliably available when needed and atacceptable pricing levels. Likewise, alternative providers would need clarity on commercial and service arrangements to justify investment in this area.
• Statewide services such as neonatal screening programs, tissue banks and autopsy services could be provided by a private supplier under contract, butGovernment may prefer more direct control of these services to provide more flexible management of emerging issues and stakeholders’ perceptions of the risksto quality and continuity of service.
Competitiveness of SA Pathology in a contestable market - final report 58

6. Contestable and non-contestable servicesKey findings
Analysis suggests the majority of SA Pathology’s services could be supplied by alternative providers with appropriate contract conditions and risk management arrangements. Sensitivities and concerns are highest for some specialised, low volume tests, MDTS, training, primary research and public health activities given their traditional Government delivery
Criterion 3. Does the service play a critical role regarding SA Health system sustainability and continuity?
• SA Pathology offers consistent clinical governance, a laboratory information system that can act as the single source of truth across all testing and a singleinterface for data access. These features enhance the value of pathology services to LHNs by allowing pathologists and clinicians to access prior and current testdata, and be confident that diagnostic testing results can be reliably compared through time and between laboratories.
• These ‘network’ benefits may be undermined if LHNs’ demand is fragmented between different pathology providers. Statewide standards, data access policies andsupportive ICT infrastructure may be required to maintain consistent clinical governance and to ensure pathologists and clinicians have timely access to patient’sprior test data regardless of where those tests were completed. Contracting arrangements would need to be carefully designed to support LHNs ability to readilyswitch providers without incurring unacceptable costs or clinical risks during the transition.
• Training of Pathology Registrars is important for long term sustainability of pathology services. Registrars are trained ‘on the job’ while managing andinterpreting the results of diagnostic training, which reinforces the strong synergies between diagnostic testing and training. Private providers do not routinelyoffer training, and would need to be specifically contracted to do so along with the associated diagnostic testing.
• Clinical support and participation in MDTs is as important as the generation of diagnostic results and would need to be carefully specified as part of any servicerequirements so that alternate providers fully understand and appropriately resource and cost this aspect of the service.
Criterion 4. Are patients and clinicians likely to express strong objections to receiving this service from an alternative provider
• For a number of services, the referral of tests between providers is relatively common, both locally and interstate, however clinical sensitivities may exist due to:
• Concerns regarding the clinical governance and specific testing methodologies of alternative providers.
• Potential impacts to turnaround times.
• Access to supervising pathologists, particularly for in person MDTs and informal consults with LHN clinicians.
• Arrangements that include surge capacity for crisis responses being maintained interstate rather than locally.
• Typically, the tests which are referred externally are complex and specialised tests which are low volume and not urgent, which is why in-vitro diagnosticcompanies do not offer automated testing solutions and the referral is required. Specialised tests are often batched until sufficient specimens are received tojustify testing the batch. Longer turnaround times due to transport of samples offsite or interstate are less likely to impact clinical decisions or outcomes.
• Risks are also mitigated by the fact that private providers have well developed systems for referrals as they already rely heavily on the capability of their Australia-wide network to provide a comprehensive range of pathology services. Shipping samples to ‘Centres of Excellence’ offsite or interstate is a key element of theiroperational models. They have developed the logistics networks and operational capabilities to meet service levels with more centralised ‘hub and spoke’ models.
• For the majority of services, patient and public objections are likely to be more limited if alternative arrangements do not negatively impact result time or clinicalquality. However, for more sensitive services such as mortuary services, provision by alternative providers, including other Government pathology providers, islikely to receive lower levels of support.
Competitiveness of SA Pathology in a contestable market - final report 59

6. Contestable and non-contestable servicesKey findings
Analysis suggests the majority of SA Pathology’s services could be supplied by alternative providers with appropriate contract conditions and risk management arrangements. Sensitivities and concerns are highest for some specialised, low volume tests, MDTS, training, primary research and public health activities given their traditional Government delivery
Criterion 5. SA Pathology currently has a unique position or competitive advantage in this area:
• SA Pathology’s recent investment in automation equipment should potentially give it a strong delivery platform to support operational productivity and efficiency.Similarly, the EPLIS laboratory information system is already linked to hospitals patient management systems, albeit with some ongoing implementationchallenges. Any incoming private provider would need to reestablish those interfaces with its proprietary laboratory information system.
• SA Pathology staff enjoy strong public sector cultural compatibility with LHN clinicians and staff, which should underpin strong working relationships.
• The current arrangement offers Government significant flexibility in managing changes in service requirements due to common Government ownership of SAPathology and LHNs. Arrangements with alternate providers would require more formal contracts and less flexible contractual review mechanisms withassociated financial risks if service specification need to be amended.
• SA Pathology plays a critical role in supporting the public health system, including in the provision of its broader range of services. Stakeholder sensitivities and aneed for close Government control mean that delivery of specific services such as public health and primary research would commonly be delivered directly byGovernment. Whilst considered innovative, potential may exist for these services to be delivered by non-Government organisations within an appropriatelydesigned agreement. Such an arrangement would require careful structuring and further testing and refinement with key stakeholders. A range of challenges,however, restrict the ability of Government to separate these services away from those that could more easily be delivered by alternative providers.
• Operational synergies: SA Pathology offers a continuum of pathology services with more basic testing activities supporting its ability to offer a broad andspecialist service range. As part of this, the current operating model involves degrees of sharing of staff and assets. Removing one aspect of the current servicerange may therefore impact SA Pathology’s broader ability to offer wider services. It may also create challenges with relating to accreditation.
• Consistent clinical support: As a Statewide provider of the complete range of pathology services, SA Pathology is able to support the seamless participation ofpathologists from different disciplines in multi-disciplinary teams. Effective clinical support and participation in MDTs aids early diagnosis and treatment,improving preventative medicine, reducing length of stay and reducing costs to the SA Health system.
• Patient needs: SA Pathology’s integrated operating model allows its pathologists rapid access to all prior test data when reporting results, which is importantfor many hospital patients who have complex needs which require a diverse range of diagnostic testing from different testing disciplines.
• Clinicians’ expectations: Clinicians value SA Pathology’s ability to offer the full continuum of pathology services spanning routine and complex testing, clinicalsupport and participation in MDTs, teaching, training and research.
• Market size: The public pathology market in SA is relatively small while the scale of operations required to achieve economies of scale is relatively large.Fragmenting the demand for public pathology risks building inefficiency into the system.
• SA Pathology currently utilises a single statewide service that manages consistency of clinical governance and access to ICT systems and prior test data.Introduction of a range of providers would require consistent clinical standards, interface with statewide systems, and shared prior test data to ensure continuityof care. This is likely to require significant consultation, planning and investment.
Competitiveness of SA Pathology in a contestable market - final report 60

6. Contestable and non-contestable servicesKey findings
Given service dynamics and operational considerations, should contestability be pursued, the most appropriate model would involve competitive bids to deliver the full range of pathology services, encompassing all SA public health facilities, for adefined period. This would require careful design of contestability arrangements and implementation
• Whilst analysis indicates the majority of SA Pathology’s services could be supplied by an alternative provider, limitations in the separability of SA Pathology’sservices and market dynamics would make doing this whilst retaining a range of ‘non-contestable’ services highly challenging. Whilst theoretical separation ofservices into ‘contestable’ and ‘non-contestable’ groups is possible in theory, current operational arrangements do not support this.
• Therefore, should Government wish to pursue a contestability agenda for public pathology within SA, this model would need to include the full range of servicesas currently delivered by SA Pathology. Contestability would therefore be an ‘all or nothing’ decision. This approach would mitigate the associated separabilityrisks and implementation risks by retaining many of the ‘network’ benefits, synergies and economies of scale inherent in having a single provider for all servicesin what is a small public pathology market.
• This contestability model would see providers compete for the exclusive right to provide all public pathology services. Delivery would be structured for a definedperiod of time, subject to meeting or exceeding required operational, clinical and financial performance levels. A range of options exist with regards to howcompetition could be facilitated. These include:
• Competition for a long-term operational franchising of the whole entity.
• Privatisation of SA Pathology.
• Competition for the placement of non SA Government management team to lead and manager SA Pathology’s operations.
• Whilst the most suitable model for contestability, should it be chosen, this approach contains a number of risks. These include:
• The approach would effectively replace the existing public monopoly service with an alternative monopoly which holds the rights to exclusively provideservices for a defined period. Any monopoly arrangement will carry a number of inherent risks and a non SA Government monopoly would be arguablymore challenging to manage if required.
• The appropriate contract structure and duration would require careful consideration. It would need to allow sufficient time and security for an incomingprovider to recoup its investment, whilst being short enough and having appropriate conditions to enable SA Government management of performance.Throughout, SA Government would need to retain commercial leverage and an ability to recontest the contract in the even of sustained poorperformance.
• Should there be poor performance, terminating the contract and switching to an alternate provider may involve considerable transitional issues, such aspotential interim loss of service or poor service delivery. This may create potential financial and clinical risks.
• Government could lose its deep pathology expertise which may limit its ability to effectively manage a contract to provide the service. This loss would alsoseverely limit Government’s ability to bring the service back in-house should this be required.
• The introduction of an alternate provider is likely to generate objections from stakeholders who are concerned about transitional risks and ongoingclinical safety. Objections may be increased should a new provider originate from the private sector due to concerns around profiteering and the role ofGovernment within healthcare delivery.
Competitiveness of SA Pathology in a contestable market - final report 61

6. Contestable and non-contestable servicesKey risks
Broader risks associated with contestability exist and should be recognised by Government. These risks relate to both the preferred contestability model as well as wider approaches
Competitiveness of SA Pathology in a contestable market - final report 62
Broader risks relate to the impact of market structure changes as well as management of service continuity and regional provision.
• Market sustainability: The limited size of the public pathology market in SA, low rates of growth and the need for pathology providers to leverage scale mean thatmaintaining a competitive market would be challenging. Competition Law restrictions may also limit the ability for some existing providers to participate as theACCC has previously taken close interest in any proposals likely to affect competition in the already heavily concentrated private pathology market.
• Service continuity: Additional service continuity planning and ‘provider of last resort’ arrangements may need to be established to cater for situations whereproviders are not able to maintain service availability, particularly in regional and remote areas. Similarly contract structures around any ongoing reserve capacitywould need to be well structured and balance risk with value for money.
• Service sustainability: Responsibility for ensuring the long term capability of the public pathology system clearly sits with SA Pathology under currentarrangements, as demonstrated by its investments in training and research. In a contestable environment, SA Health would need to more directly monitor thisrole, and identify aspects that sit outside of the remit of an alternative provider.
• Clinical connectivity: In any form of contestable environment, SA Health would need to ensure consistent clinical standards, interface with statewide systems,and shared prior test data to ensure continuity of care. This will require clear policies, standards and supporting infrastructure, and may require additionalinvestment from both SA Health and potential providers. A single provider to deliver public pathology would help mitigate this risk.
• Impacts of demand uncertainty: LHNs’ aggregate pathology demand is relatively small given the SA population. Demand is also concentrated in metropolitanAdelaide. Fragmenting volume between providers or increasing demand uncertainty may put upwards pressure on the average cost of providing services.
• Loyalty to local businesses: Some clinicians have a strong stated preference for locally-based, publicly managed services. This is particularly relevant for those inpublic hospitals who value direct clinical support by pathologists and some community-based clinicians in regional settings. These stakeholder would requireclose engagement and management during any planned transition.
• Regional and remote areas: Regional and remote areas of SA have much lower population densities and contestability may put pressure on existing pricingarrangements and operational structures. Ongoing service standards to regional and remote areas would need to be carefully planned and structured.
A decision by an LHN to exercise choice and secure the delivery of public pathology services from an alternative provider would also create a number of risks. Predominantly a single action would limit the Government’s ability to pursue the preferred contestability model (the full service range in its entirety), but is also likely to have significant impacts on SA Pathology’s ongoing sustainability and viability.
• Economies of scale: SA Pathology’s current monopoly over all public pathology services gives it economies of scale and the ability to amortise its fixed costs (ofequipment and staffing for 24/7 service availability) across a larger demand base. A loss of scale would undermine this.
• Service range: Customers expect SA Pathology to offer the widest range of routine and specialised services, which may be harder to sustain if the already small SAmarket is fragmented and SA Pathology’s market share is reduced to such an extent that it cannot financially support that full range of services.
• Cherry-picking and cost-shifting: If LHNs contract alternate providers based on pricing levels and the coning rules in the Medicare Schedule, those providerswill continue to have strong incentives to refer on unprofitable work to SA Pathology, resulting in cost-shifting to SA Pathology.
• Accreditation: A loss of market share may challenge SA Pathology’s ability to maintain its required accreditations, particularly for any non-contestable serviceswhere maintaining the required technical expertise effectively requires sufficient scale of testing activity to warrant ongoing investment in equipment and toattract and retain sufficiently qualified staff.
• Stakeholder views: some clinicians have expressed concern about the potential for contestability to undermine SA Pathology’s existing high levels of technicalcapability and the importance of maintaining patients’ universal access to bulk billed services, particular in regional and remote areas.

6. Contestable and non-contestable servicesSuggested approach
SA Pathology should pursue the opportunities available to improve its operating model and performance. This should be done outside of a competitive environment, but with the prospect of competition if improvement is not successful or if progress is not maintained
Government should maintain SA Pathology’s monopoly access to support LHNs while supporting SA Pathology to implement the identified improvements, reform its delivery model and improve its performance.
• Implementing the full set of improvement opportunities is a significant program of work which will radically change and improve SA Pathology’s operatingmodel and performance potential. 25 improvement opportunities exist, these will take concerted internal management focus and considerable additionalexternal support over several years to be successful.
• Implementation of improvement opportunities also requires a significant investment from the SA Government. Provisional estimates have identified $14.7m ofimplementation costs over the next three years. Prior reform experience have identified challenges that can be associated with large scale change and highlightedthe need for appropriate capacity and an absence of distractions.
• As such, it is recommended that contestability either as a whole, or by individual LHNs should not be currently pursued. This will allow SA Pathology toimplement the improvement opportunities, move towards a more efficient business model and improve performance without wider distraction. The decision of asingle LHN or more to contract an alternate provider for a significant subset of services would likely destabilise SA Pathology’s financial and technical viabilityand challenge broader business improvement progress. Furthermore, this would also impact the potential scale and value of savings that have been identified.
Additionally, a number of practical limitations would constrain a successful move by Government to contestability in the short-term. Overcoming this would require detailed analysis, including:
• Development of detailed service specifications for diagnostic testing and non-diagnostic services such as clinical support, MDTs, teaching training and research,public health testing support and management. LHNs and SA Health do not currently define their service needs in sufficient detail to support contractualdelivery by an alternative provider.
• Development of granular and robust information on the cost and profitability of specific test groups and other pathology services, without which it is challengingto form a reliable view on the value for money of existing services or the benefits of moving to an alternative provider.
• Refinement of financial and operational understanding of existing and potential service delivery arrangements in order to model the practical impacts on LHNpatient flows and logistics arrangements in any move to an alternative provider.
• Careful planning of the transition to an alternative provider to ensure clinical risks are carefully managed, and potential transitional issues and stakeholderobjections are anticipated and mitigated.
SA Health should formally review progress in 12 to 18 months, reviewing costs and benefits achieved against those estimated in the original implementation plan. The scale of further implementation costs and benefit estimates should be projected. In the interim, work should take place by SA Pathology with LHNs to increase clarity of service levels, profitability and pricing. This will both further improve operational performance and help mitigate the risks of any future move to contestability.
• By 12-18 months SA Pathology should have achieved significant progress against the improvement opportunities scheduled within that time.
• This time period will also create an opportunity to build commercial, financial and operational clarity which will help lift SA Pathology’s performance, customerengagement and financial sustainability.
• Gaining a better understanding of financial and operational data, formalising and managing to service levels, and reforming pricing and funding of discreteservices will also be useful in further mitigating the potential implementation risks and accelerating implementation if Government decides to move towardscontestability in the future.
Competitiveness of SA Pathology in a contestable market - final report 63

6. Contestable and non-contestable servicesContestability implementation - indicative actions
Any move towards the preferred model of contestability would need to follow a structured process to support success. A number of activities within this process would also serve to benefit SA Pathology’s broader approach to sustainability, and should be pursued outside of any contestability agenda
Competitiveness of SA Pathology in a contestable market - final report 64
Appropriately price or block-fund all services in agreed SLAs to move to cost-reflective charges and eliminate cross-subsidies.
Develop 10 year forecasts / scenarios for LHNs’ demand and estimate SA Path’s CAPEX / OPEX to meet estimated demand.
Structured engagement with LHNs and market to confirm interest in contestable supply by service or geography and required commercial parameters.
Develop contestability guidelines with LHNs on key commercial and risk decision parameters, and preferred contractual models for different service groups.
Implement statewide requirements and infrastructure to support contestability and test viability against defined clinical risk scenarios.
Transparently calculate and report cross-subsidies between service groups and LHNs.
Implement any ‘quick wins’ arising from structured engagement to gain practical lessons in how to manage risks.
Develop Public Pathology Contestability Policy addressing required statewide standards, supportive infrastructure, risk mitigations and any SA Health approval requirements.
Establish SA Health and cross-LHN arrangements to coordinate market engagement, standardise service specifications and establish preferred contractual models.
If insufficient progress made, confirm market appetite for service range, confirm/amend and establish contestability model, and contest and establish contract with incoming provider.
Establish benchmarking program to assist LHNs in managing contracts for value.
Maintain oversight of service quality against statewide requirements for clinical governance, operational standards, data access and sharing.
Manage cycle of contract reviews and renewals, report publicly on benefits realisation and lesson learned.
Re-assess SA Pathology’s competitiveness and any further support required in the transition to a contestable future.
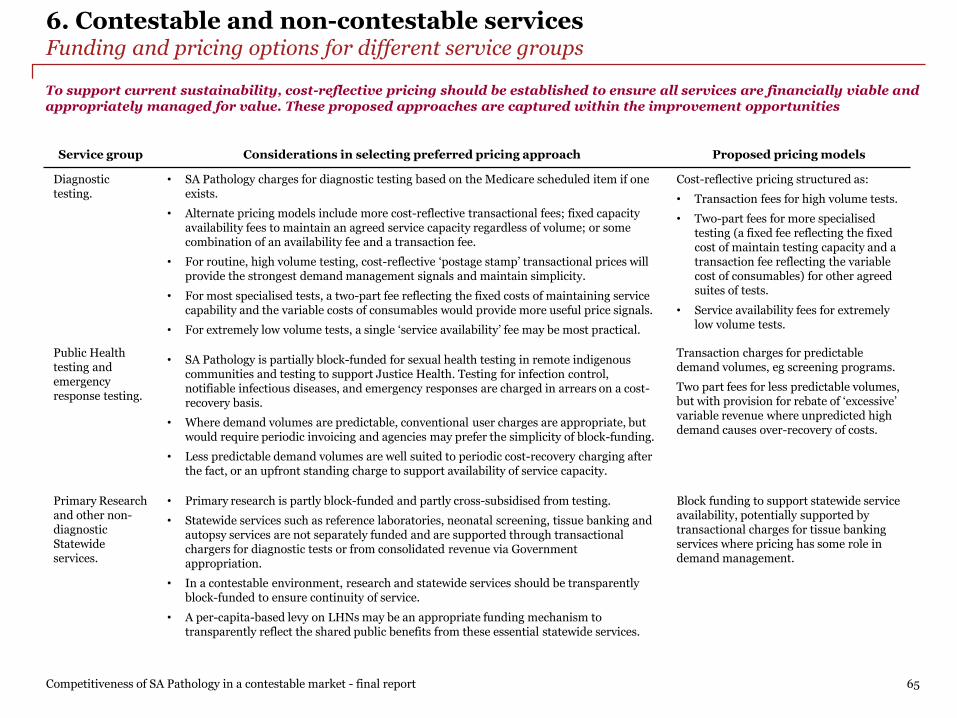
6. Contestable and non-contestable servicesFunding and pricing options for different service groups
To support current sustainability, cost-reflective pricing should be established to ensure all services are financially viable and appropriately managed for value. These proposed approaches are captured within the improvement opportunities
Competitiveness of SA Pathology in a contestable market - final report 65
Service group Considerations in selecting preferred pricing approach Proposed pricing models
Diagnostic testing.
• SA Pathology charges for diagnostic testing based on the Medicare scheduled item if oneexists.
• Alternate pricing models include more cost-reflective transactional fees; fixed capacityavailability fees to maintain an agreed service capacity regardless of volume; or somecombination of an availability fee and a transaction fee.
• For routine, high volume testing, cost-reflective ‘postage stamp’ transactional prices willprovide the strongest demand management signals and maintain simplicity.
• For most specialised tests, a two-part fee reflecting the fixed costs of maintaining servicecapability and the variable costs of consumables would provide more useful price signals.
• For extremely low volume tests, a single ‘service availability’ fee may be most practical.
Cost-reflective pricing structured as:
• Transaction fees for high volume tests.
• Two-part fees for more specialisedtesting (a fixed fee reflecting the fixedcost of maintain testing capacity and atransaction fee reflecting the variablecost of consumables) for other agreedsuites of tests.
• Service availability fees for extremelylow volume tests.
Public Health testing and emergency response testing.
• SA Pathology is partially block-funded for sexual health testing in remote indigenouscommunities and testing to support Justice Health. Testing for infection control,notifiable infectious diseases, and emergency responses are charged in arrears on a cost-recovery basis.
• Where demand volumes are predictable, conventional user charges are appropriate, butwould require periodic invoicing and agencies may prefer the simplicity of block-funding.
• Less predictable demand volumes are well suited to periodic cost-recovery charging afterthe fact, or an upfront standing charge to support availability of service capacity.
Transaction charges for predictable demand volumes, eg screening programs.
Two part fees for less predictable volumes, but with provision for rebate of ‘excessive’ variable revenue where unpredicted high demand causes over-recovery of costs.
Primary Research and other non-diagnostic Statewide services.
• Primary research is partly block-funded and partly cross-subsidised from testing.
• Statewide services such as reference laboratories, neonatal screening, tissue banking andautopsy services are not separately funded and are supported through transactionalchargers for diagnostic tests or from consolidated revenue via Governmentappropriation.
• In a contestable environment, research and statewide services should be transparentlyblock-funded to ensure continuity of service.
• A per-capita-based levy on LHNs may be an appropriate funding mechanism totransparently reflect the shared public benefits from these essential statewide services.
Block funding to support statewide service availability, potentially supported by transactional charges for tissue banking services where pricing has some role in demand management.

7. Recommendations
66

7. RecommendationsSummary
Competitiveness of SA Pathology in a contestable market - final report 67
1. A clear, realistic and appropriately resourced plan is required to deliver the bold changes needed and realise the identified efficiencies.This will build on SA Pathology’s existing work and should be supported by additional specialist delivery capability. This will assist inmanaging the risks associated with implementing a reform program of this scale and the required changes to SA Pathology’s operatingmodel. SA Pathology will need to work closely with staff and unions as appropriate. Key activities to include:
• Scoping project governance and resourcing, and developing a detailed implementation timeline and budget that is supported by SA Health and DTF. As partof this work, SA Pathology should reconfirm their strategic priorities and forward funding envelope, as well as implementation challenges and risks. Planningand governance should be captured in a single detailed turnaround plan that is endorsed and can be used to monitor SA Pathology’s performance.
• Establishing project governance arrangements and resourcing, with backfill arrangements for any seconded staff to ensure ongoing business continuity. Theextent of the time commitment required is unlikely to allow staff to perform project roles in addition to the full scope of their BAU roles. Project governancewill need to meet ongoing oversight requirements from SA Health and DTF.
• Securing agreed implementation support as implementation risks are significant given the need to maintain BAU services while fundamentally restructuringthe operating model and pursuing a broad range of opportunities. Implementation support options should involve consideration of specific additionalresources through to a more strategic partnership with an appropriate organisation. Options include:
• Recruitment of additional Executive staff with appropriate business turnaround or improvement experience. This will provide additionalmanagement capability to lead delivery of the improvement opportunities, allowing SA Pathology’s existing Executive to continue to focus onmanaging BAU services during what will be an extensive reform program.
• Specialist PMO resources. This would ensure implementation planning and delivery is robustly managed and well resourced, reducingimplementation risks and detecting and managing issues early.
• Direct support from an organisation specializing in business turnarounds. This would provide an integrated and experienced management team todrive the realisation of improvement opportunities and lead key areas of work or take a more direct role.
• Strategic partnership with a private sector administrative services provider or private pathology provider. This would be the most extensive supportoption providing comprehensive implementation support with the added benefit of leveraging the operational and business management experienceof the chosen provider.
• Development and delivery of a communication and engagement strategy for staff, customers and clinicians. This should seek to continue the momentummade as a result of the staff and stakeholder engagement undertaken as part of the SA Pathology Sustainability Project.
2. SA Pathology should develop a robust approach to improve financial, commercial and managerial capability and understanding across theorganisation. This would include supporting development across Directorates and Business Management and establishing clearercommercial and financial decision making protocols. Key activities to include:
• Development of a Strategic Plan and annual Business Plan, underpinned by Directorate level operational plans. All plans would be fully financially aligned tothe SA Pathology budget. Plans should clarify SA Pathology’s commercial framework and approach to ensure clarity across staff. These documents should bedeveloped and challenged by the SA Pathology Executive team to ensure that maximum benefit is gained during the planning processes. Appropriate ongoingperformance management regimes should be identified to support performance.
• Review of organisational capability against agreed plans to identify key areas of development. A capability development plan should be developed to raisepeople, processes and systems as appropriate. This should include particular focus to ensure a consistent understanding of financial and commercialperformance to support improved decision making.
Recommendations focus on supporting a comprehensive improvement in SA Pathology’s operating model to support long-term sustainability and commercial decision making. Implementation success will rely on SA Pathology’s capacity and capability and external support will be required to mitigate implementation risks

7. RecommendationsSummary
Competitiveness of SA Pathology in a contestable market - final report 68
3. Further development of the financial and operational baseline to support improved understanding and long term sustainability. Thisshould include identification of the costs (and profitability) of all tests and wider activities such as research. Key activities to include:
• Detailed financial and operational analysis for all SA Pathology activities including an activity based costing model. This should be undertaken in closepartnership with Directorate and Business Managers to ensure a consistent understanding of costs and to support development of commercial awareness.
• Institute strong quality assurance processes and clear dashboard reporting to allow managers to identify and correct errors in financial and operationalinformation. In the short term, it will be important to continue current focus resolving issues associated with EPLIS and PBRC.
4. Strengthen existing commercial approaches by establishing detailed Service Level Agreements, revising pricing and improving customerrelationship management approaches. Key activities to include:
• Refinement and finalization of SA Pathology’s value proposition to the sector. This should clearly articulate SA Pathology’s strengths, ongoing areas ofinvestment and commitment to SA Health. This should build on existing work to date with additional input from staff and customers.
• Development of detailed Service Level Agreements for all service groups, working closely with LHNs and SA Health. This work should also involve input byclinicians and SA Pathology staff to ensure a consistent understanding of agreements and look to leverage SA Pathology’s value proposition. This workshould also ensure each service group is defined, costed, priced and performance managed to ensure customer commitments are clear.
• Leverage the costing analysis to develop a revised approach to pricing that moves towards a fee-for-service model. As part of this, SA Pathology should seekto improve cost and profitability transparency with LHNs, working closely with them to do so. This work should be closely oversighted by SA Health givenbroader financial implications.
• SA Pathology should refresh their customer relationship management approach, with a focus on taking a more proactive and consistent approach to keyrelationships. This refresh should seek to identify and rapidly implement any ‘quick wins’ such as quarterly visits to LHN CEOs to discuss performance. Thiswill help establish stronger working relationships with LHNs to resolve issues, realign services to customer views on their needs and perceived value.
5. SA Government should formally review SA Pathology’s progress in 12 to 18 months to ensure the planned improvement opportunities areprogressing as planned and SA Pathology is well developed in implementing its new operating model.
• Actual implementation costs and benefits achieved by that time should be reported against those estimated in the original implementation plan, and thescale of further implementation costs and benefit estimates should be projected.
• If insufficient progress has been made at that time, Government should reconsider a potential move to contestability. Work completed in the interim tobetter define required service requirements and improve financial and operational information will help better understand and mitigate any associatedrisks.
Recommendations focus on supporting a comprehensive improvement in SA Pathology’s operating model to support long-term sustainability and commercial decision making. Implementation success will rely on SA Pathology’s capacity and capability and external support will be required to mitigate implementation risks

7. RecommendationsReform case study – NSW Health Pathology
Competitiveness of SA Pathology in a contestable market - final report 69
NSW Health Pathology is transforming its operating model and performance, and delivering savings to Local Health Districts. Key to success has been enacting statewide strategies which were co-designed with laboratory teams to deliver a more commercial approach and a close focus on the needs of NSW Health partners
Background
NSW Health Pathology (NSWHP) was formed as a statewide public pathology service in 2012 through consolidation of four pathology services previously operated by individual local health districts (LHDs). It is constituted as a separate administrative entity within NSW Health and its Chief Executive reports directly to the Secretary of the NSW Health. It has an independent Board and pathology testing is self-funding in that it recovers its entire costs through user charges and does not receive ‘top up’ appropriation funding from government for those services.
NSWHP services all but a couple of NSW public hospitals providing routine, urgent and complex pathology services. Services includes specialised and/or on-site testing for treating patients with complex health issues in public emergency and ICU departments. It also supports some referral work from clinicians in private practice, and has won competitively tendered contracts to support private hospitals.
Key activities
Against the context of industry changes, disruption and increased competition, NSWHP led a consultative process to develop a 5 year strategic plan, vision and values. Through this process ‘contestability’ was established as a key strategic objective of the organisation and was defined as involving:
• A service valued by customers
• A clear understanding of NSWHP’s value proposition
• Value for money via competitive pricing, where possible
In order to maximise the potential benefits of contestability and to move towards improved delivery and efficiency, NSWHP is pursuing five key reform strategies:
1. Transformation of service models via: Engaging with LHD customers to better align service models to their needs. This has included expanding access tostatewide pathology expertise, consolidation of high cost/low volume diagnostics to specialist referral centres, streamlining regional delivery models to reducecosts and eliminate cross subsidies between LHDs and significantly extending Point of Care Testing (POCT) to new markets such as Ambulance, Hospital in theHome and aged care, and in some limited cases using it to replace fixed laboratory infrastructure where clinically appropriate.
2. Benchmarking and pricing reform via: Re-profiling staffing levels to leading benchmarks, movement towards new funding models for clinical services,teaching, training and research, and reforming pricing for diagnostic testing to fee-for-service pricing based on detailed analysis of cost drivers across differentservices and customer groups.
3. Increased customer focus via: Strengthening customer relationships and improving customer service, establishing a statewide program for quality use ofpathology to drive more appropriate utilisation of tests and reduce demand for services, and supporting clinical improvements where required.
4. Improving business performance via: Robust organisational structures and processes for governance, planning and performance accountability, establishingimproved financial and operational information and management to drive transparency and accountability in clinical and financial performance, standardisingIT platforms including laboratory information system across sites and modernising the billing system
5. Positioning for the future via: Articulating and strategically planning how to maximise the value that NSWP bring to the health and justice systems, analysingdrivers across services and between customer groups, testing opportunities to partner with external organisations and how to benefit from contestability,including competing with the private sector where appropriate.

7. RecommendationsReform case study – NSW Health Pathology
Competitiveness of SA Pathology in a contestable market - final report 70
Key outcomes
Throughout this process of reform, NSWHP has worked closely with LHDs towards a shared goal of value for money and increased transparency. This partnership approach has delivered a range of benefits and has helped to ensure that key actions and initiatives are well supported. Furthermore, NSWHP also received funding from NSW Health to support key packages of work. Whilst NSWHP continues to invest in driving further improvements, key outcomes from this work to date include:
• NSWHP has been endorsed by NSW as the preferred provider and commissioner of pathology services to NSW health facilities. This recognises its ability toflexibly respond to and resolving market issues and support the NSW health system.
• Delivery of efficiency savings and avoided costs of more than $178 million (as of 2017-18).
• Improved financial management, waste reduction, and more efficient operational configuration and management. This has been supported by budgetmanagement training for all lab managers.
• Increased visibility of costs and budget accountability with NSWHP publishing regular reports of pathology services ordered by LHDs and associated servicecosts by hospital and department.
• A freeze on all price increases (including CPI) to LHDs, and the significant reduction of prices to regional LHDs to bring them more in line with metro LHDs; thecosts of which were all absorbed by NSWHP
• Improved partnering and delivery relationship with LHD customers as well as better focus on customer service and outcomes.
• Improved understanding of the market in which NSWHP operates, the value proposition it offers and execution of this through a clear strategic plan, vision andvalues.
NSW Health Pathology is transforming its operating model and performance, and delivering savings to Local Health Districts. Key to success has been enacting statewide strategies which were co-designed with laboratory teams to deliver a more commercial approach and a close focus on the needs of NSW Health partners

Appendices
Appendix 1. Improvement opportunities
Appendix 2. Benchmarking approach and analysis
Appendix 3. FTE classification mapping
Appendix 4. Glossary of terms
71

Appendix 1. Improvement opportunities
72

Cost opportunities relate to four key areas of focus: operational consolidation, staff mix adjustments, improvements in procurement and broader efficiencies across the business
Competitiveness of SA Pathology in a contestable market - final report 73
Appendix 1. Improvement opportunitiesOverview: Cost related opportunities
Consolidate
Improve procurement
Cost
Adjust staff mix
‘Hub and Spoke' model: consolidation of all non-urgent testing to one location1
Collection centre footprint review and profitability improvement strategy2
Realign the staffing mix in the collection centres3
Realise lab staffing efficiencies4
Resolve inefficiencies caused by EPLIS6
Invest in digital pathology and digital communication7
Reduce operational inefficiencies across Directorates9
Rationalise and improve management of research activities and research support8
Realise efficiencies
Renegotiate agreements with 3rd party suppliers5
Improve couriers efficiency10
Stop unprofitable tests that are privately referred work or community work12
Manage overheads and non-diagnostic costs11
Transfer of business to appropriate agencies13
Commission testing activities from alternative providers where appropriate14
Commission GMP services from an alternative provider15

Competitiveness of SA Pathology in a contestable market - final report 74
Appendix 1. Improvement opportunitiesOverview: Revenue related opportunities
Remediate billing issues
Grow new revenuesRevenue
Move to (efficient) cost-reflective prices
Resolve issues with billing backlog and PBRC1
Update pricing to be cost-reflective of effort for public work4
Review commercial arrangements for university teaching and registrar training5
Increase private sector market share and revenue6a
Expand commercial testing services and PoCT to new markets / customers8
Expand test capability and target high demand emerging markets7
Manage revenue claiming
Receive full funding for all public health work performed9
Expand network of profitable collection centres6b
Revenue opportunities relate to remediation of billing issues, movement to cost-reflective pricing, new revenue growth and collection of revenue for performed work
Receive full funding for all approved research performed10

Competitiveness of SA Pathology in a contestable market - final report 75
Appendix 1. Improvement opportunitiesOverview: Business management related opportunities
BM1
BM3Business
Management
BM2
Improve customer experience1
Implement a strategic and annual business planning regime2
BM4 Upskill financial and commercial capability4
Additional opportunities were identified relating to better business management. Whilst quantification of financial benefits is not possible, these opportunities will support SA Pathology’s long-term sustainability
Invest in systems to support improved commercial and operational decision making3

Competitiveness of SA Pathology in a contestable market - final report 76
Appendix 1. Improvement opportunitiesC1: ‘Hub and Spoke’ model - consolidation of all non-urgent testing to one location
C1‘Hub and Spoke' model: consolidate all SA Pathology non-urgent operations to either a purpose-built greenfield location or suitable existing location, and rationalise testing capacity and pathologist support at other locations to urgent testing and support only.
Notes: (a) full run rate. (b) the estimated implementation cost of $2.5m is related to the fit out of the existing Frome Road site including the relocation of required equipment and staff. The estimated implementation cost of $5m is related to the fit out of a greenfield site, not including its construction. Those are both high-level estimates and a detailed business case to determine the exact implementation cost is required.
Overview
Current state
• SA Pathology was formed with the merger of three organisations: IMVS, FMC South Path and WCH. Since its formation, ithas completed some consolidation with test rationalisation (removing test duplication) for non-urgent testing, howeverbroader opportunities for further consolidation and efficiency exist.
• SA Pathology’s Directorates each have varying levels of consolidation, in part demonstrated by their number of labs:
─ Anatomical Pathology (AP): 6 labs.
─ Genetics and Molecular Pathology (GMP): 4 labs.
─ Immunology: 3 labs.
─ Haematology: 6 labs.
Future state
• Increased consolidation within Directorates:
─ GMP, Immunology, Chemical Pathology, Microbiology and non-blood bank Haematology non-urgent testing to beconsolidated at Frome Rd. This would involve the consolidation of 16 labs. Consultation with LHNs will be utilised to determine what is non-urgent testing.
─ Blood Bank and Automated to remain present at all major hospitals for urgent testing. What constitutes urgent testing will be determined in collaboration with LHNs. Non-urgent testing can be consolidated at RAH.
─ Regional to remain with urgent testing done onsite to minimise double handling and maintain turnaround times.
Benefits summary
• Financial: Consolidation will support a reduction in contingency staff required to manage planned and unplanned leave,wider adoption of modern technology, and will provide opportunity to increase asset cost savings and manage supplies toreduce wastage. The financial benefit is dependent on the ability to reduce FTEs within the IR framework and theinfrastructure costs associated with moving.
Implementation considerations and risks
• A robust industrial relations strategy will be required as well as close management of associated IR and union issues.
• Investment required to relocate equipment and staff and fit-out the relevant locations.
• Timeline of gradual consolidation to enable required change management and minimise associated disruption.
• Redeployment, redundancy and retraining of impacted employees will be required.
Impact summary
Total financial impact
• $2.4-4.7m (EBIT saving)
Timeline for realisation
• FY19: $0.0-0.0m
• FY20: $0.5-1.1m
• FY 21: $1.6-3.2m
• FY22: $2.4-4.7m (a)
Investment required
• High
• Est. implementationcost(b) : $2.5-5.0m forequipment / employeerelocation.
• TVSPs may be an option.
Implementation ease
• Low
• Some resistance amongststaff who wish for the labto remain co-located witha hospital and university(e.g. FMC).
• New labs will requireappropriate fit-out.
Risk rating
• High
• IR and union risk.
• Disruption duringtransition.
• Financial investmentrequired.
─ Chemical Pathology: 2 labs.
─ Microbiology: 4 labs.
─ Regional: 11 labs (no opportunity for consolidation).
─ Automated: 7 labs (no opportunity for consolidation).

Competitiveness of SA Pathology in a contestable market - final report 77
Appendix 1. Improvement opportunitiesC1: ‘Hub and Spoke’ model - consolidation of all non-urgent testing to one location
C1‘Hub and Spoke' model: consolidate all SA Pathology non-urgent operations to either a purpose-built greenfield location or suitable existing location, and rationalise testing capacity and pathologist support at other locations to urgent testing and support only.
Supporting analysis
FY18 Employment cost by Directorate ($m) Benefits realised from consolidation ($’000)
• In FY19 Chemical Pathology and Immunology will be consolidated. This will help reduce contingency staff to manage planned and unplanned leave, may
reduce the supervisory staff required and may reduced the number of highly skilled pathologists required and may reduce the Employment cost of the
Directorates by 5-10%. This will yield $250-490k of benefit from Chemical Pathology and $295-585k from Immunology, resulting in a total of $550-
1,100k. As FY19 is substantially completed no benefit will be realised in FY19, the benefit will be fully realised in FY20.
• In FY20, in addition to the continued benefits from FY19, consolidation will occur in GMP, Microbiology, non-Blood Bank Haematology and AP-
Cytology. This will save 2.5-5% of employment costs, yielding an additional $1,050-2,100k benefit. As this will be executed during FY20, some of the
benefits will not be realised during that year depending when the consolidation happens, so the benefit will be realised in FY21.
• In FY21, the benefits realised from the consolidation in FY19 and FY20 will be repeated. Additionally a potential saving of 1-2% of employment expenses
will be captured from those Directorates consolidating in this year. This will yield an incremental benefit of $500-1,000k but this will be realised in
FY22.
• In FY22, the newly consolidated labs will be able to multi-skill employees and better utilise supplies. This may result in an additional benefit that is
realised in FY22 of $270-540k. By FY22, the consolidation will have reached full run-rate of $2.4-4.7m.
5.0
17.5
27.6
4.15.3
21.0
11.8
5.94.9
AP
-S
urg
ical
Auto
mate
d -
testin
g
AP
-C
yto
logy
Haem
ato
logy
Blo
od B
ank
Imm
unolo
gy
Chem
ical
Path
olo
gy
Haem
ato
logy
non-B
lood B
ank
Mic
robio
logy
GM
P
1,000
3,200
Multis
kill
ing b
enefit
1,050
Prio
r years
consolid
atio
n
2,100
270
FY
21 c
onsolid
atio
n
benefit
1,600
500
540
1,100
5500
FY
19 C
onsolid
atio
n
benefit
Consolid
atio
n
round 1
0
FY
19 C
onsolid
atio
n
benefit
1,100
550
FY
20 c
onsolid
atio
n
benefit
FY19 FY20 FY21 FY22($0-0k) ($550-1,100k) ($1,600-3,200k) ($2,370-4,740k)
min
max
FY19 FY20 FY21

Competitiveness of SA Pathology in a contestable market - final report 78
Appendix 1. Improvement opportunitiesC2: Collection centre footprint review and profitability improvement strategy
C2Review profitability of collection centres supporting community work and rationalise where unprofitable, if access is maintained. Improve the profitability of wider collection centres through targeted marketing and changes to operation hours to increase overall service volume.
Overview
Current state
• Based on the Profitability Model as of 14/12/18. SA Pathology is revising the model and the analysis of benefits estimatesshould be redone once the model is updated.
• SA Pathology currently has 90 collection centres in metro (48) and regional (42) locations. Based on SA pathology’sprofitability model, there are 10 unprofitable collections centres (8 metro and 2 regional).
• 30 collection centres are high volume. These are based in both metro (20) and regional (10) locations. All highvolume collection centres are currently profitable.
• 33 collection centres have medium volume. These are based in both metro (14) and regional (19) locations. 3medium volume metro collection centres are currently unprofitable.
• 27 collection centres have low volume. These are based in both metro (14) and regional (13) location. 5 lowvolume metro collection centres and 2 low volume regional collection centres are currently unprofitable.
Future state
• Closure of unprofitable collection centres, if access to pathology for the area is maintained.
• Increased output and efficiency from collection centres that are profitable but have a below average contribution. This willbe achieved by review of their operation hours, marketing to increase volume, improving rostering and improving the useof consumables.
• Efficiency benefits relating to changes in the staff mix of collection centres has been analysed in opportunity C3.
Benefits summary
• Financial: Based on the Profitability Model as of 14/12/18, closure of unprofitable centres in FY20 will generate $1.1-1.3mof savings arising from FTE reductions, avoided rental costs and consumable savings. In addition, improving performanceby 10% for the lower contribution centres in each category will generate in FY21 $0.3-0.4m of savings. SA Pathology isrevising the model and the analysis of benefits estimates should be redone once the model is updated.
• Operational: Volume from closed collection centres could be met by wider SA Pathology collection centres that are closelylocated. This will help increase staff utilisation at those sites.
Implementation considerations and risks
• Timeline seeks to commence profitability improvement strategy in FY19, close unprofitable centres in FY20 and realise thebenefits from performance optimisation in FY21.
• Rationalisation strategy may results in some overall loss of market share, with patients choosing to access collectioncentres belonging to competitors.
• Broader stakeholder support may be limited given the loss of collection centres in some locations.
• Need to consider any significant community obligations such as APY lands and to ensure access to pathology is maintained
• IR and union considerations.
Impact summary
Total financial impact
• $1.4-1.7m (EBIT saving)
Timeline for realisation
• FY19: $0.0-0.0m
• FY20: $0.5-0.6m
• FY21: $1.1-1.3m
• FY 22: $1.4-1.7m (a)
Investment required
• Low
• Est. implementation cost- $0.4m. (b)
• TVSPs may be an option.
Implementation ease
• Medium
• Resistance from staff ofclosed collection centreswho will need to berelocated or redeployed.
• Stakeholder support maybe limited.
Risk rating
• Medium
• Stakeholder support.
• IR and union risks.
• Industrial relationsstrategy.
Notes: (a) full run rate, (b) cost relating to transporting furniture and equipment of stores to be closed down, as well as make good on pending leases of a total $0.3m and cost of $0.1m for advertising for increasing the volume on the bottom performers to the middle.

Competitiveness of SA Pathology in a contestable market - final report 79
Appendix 1. Improvement opportunitiesC2: Collection centre footprint review and profitability improvement strategy
C2Review profitability of collection centres supporting community work and rationalise where unprofitable, if access is maintained. Improve the profitability of wider collection centres through targeted marketing and changes to operation hours to increase overall service volume.
Metro - Supporting analysis
Metro collection centres cumulative Individual Metro Collection centre contribution ($’000)contribution ($m)
• Based on the Profitability Model as of 14/12/18. SA Pathology is revising the model and the analysis of benefits estimates should be redone once the
model is updated.
• 20 metro collection centres are considered high volume, 14 are medium volume and 14 are low volume.
• The average contribution of the high volume collection centres is $354k. Increasing output of underperforming (d) high volume collection centres by 10%
would result in a $162k saving.
• Of the medium volume collection centres, there are 3 that are unprofitable. Closure in FY20 could generate $897k of savings. In FY21, increasing output
of underperforming (e) medium volume collection centres by 10% would result in a $54k saving.
• Of the low volume collection centres, there are 5 that are unprofitable. Closure in FY20 could generate $132k of savings. In FY21, increasing output of
underperforming (f) low volume collection centres by 10% would result in a $11k saving.
8
4
1
6
3
9
7
10
2
0
5
50% of the metro collection centres generate
88% of the contribution
75% of the collection
centres generate
99% of the contribution
298316
473 444365
516
204
373
582448476
402470
229 212227
588
Average: 354
165180107
Hig
h v
olu
me
(a)
Me
diu
m
vo
lum
e(b
)L
ow
vo
lum
e(c
)
Average: 157
-363
211275
103183
-310
196
-223
134 13316053
161 115
59
2749
76
-52-36
-17-9
Average: 33
-19
25 2131222
Notes: (a) volume of collection generating over $550k of revenue; (b) volume of collection generating revenue below $550k but over $220k, (c) volume of collection generating revenue below $220k, (d) underperforming high volume collection centres are the ones with contribution below $300k; (e) underperforming medium volume collection centres are the ones with contribution below $150k, (f) underperforming low volume collection centres are the ones with contribution below $30k ,
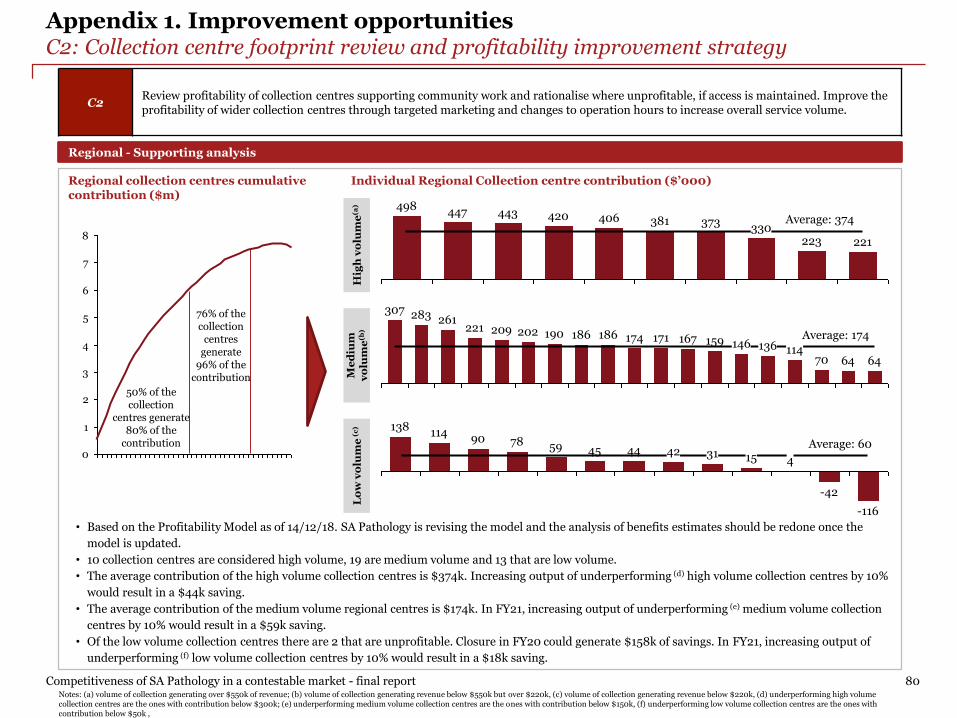
Competitiveness of SA Pathology in a contestable market - final report 80
Appendix 1. Improvement opportunitiesC2: Collection centre footprint review and profitability improvement strategy
Regional - Supporting analysis
Regional collection centres cumulative Individual Regional Collection centre contribution ($’000)contribution ($m)
• Based on the Profitability Model as of 14/12/18. SA Pathology is revising the model and the analysis of benefits estimates should be redone once the
model is updated.
• 10 collection centres are considered high volume, 19 are medium volume and 13 that are low volume.
• The average contribution of the high volume collection centres is $374k. Increasing output of underperforming (d) high volume collection centres by 10%
would result in a $44k saving.
• The average contribution of the medium volume regional centres is $174k. In FY21, increasing output of underperforming (e) medium volume collection
centres by 10% would result in a $59k saving.
• Of the low volume collection centres there are 2 that are unprofitable. Closure in FY20 could generate $158k of savings. In FY21, increasing output of
underperforming (f) low volume collection centres by 10% would result in a $18k saving.
1
2
5
7
0
6
3
4
8
50% of the collection
centres generate 80% of the
contribution
76% of the collection
centres generate
96% of the contribution
447 420498
443Average: 374
221223
406 381330
373
174 167171 159
64
146Average: 174
136
6470114
186221
283
190202209
307
186
261
-116
Average: 6045
-42
42597890
314
4415
138114
C2Review profitability of collection centres supporting community work and rationalise where unprofitable, if access is maintained. Improve the profitability of wider collection centres through targeted marketing and changes to operation hours to increase overall service volume.
Notes: (a) volume of collection generating over $550k of revenue; (b) volume of collection generating revenue below $550k but over $220k, (c) volume of collection generating revenue below $220k, (d) underperforming high volume collection centres are the ones with contribution below $300k; (e) underperforming medium volume collection centres are the ones with contribution below $150k, (f) underperforming low volume collection centres are the ones with contribution below $50k ,
Hig
h v
olu
me
(a)
Me
diu
m
vo
lum
e(b
)L
ow
vo
lum
e(c
)

Competitiveness of SA Pathology in a contestable market - final report 81
Appendix 1. Improvement opportunitiesC3: Realign the staffing mix in the collection centres
C3Realign the staffing mix in the collection centres by replacing RNs and ENs with phlebotomists resulting in lower employment costs and more specialised skillsets.
Overview
Current state
• Staffing mix across SA Pathology’s collection centre network has a range of different types of employees, and includes thefollowing classifications: registered nurses (RN), enrolled nurses (EN) and phlebotomists. 27 collection centres includeRN and EN staff(c).
• The number of RNs and ENs in collection centres has been slowly decreasing since FY14(c) as the preferred staff mix shiftstowards Phlebotomists given their skillset and cost.
Future state
• Continued realignment of staffing types within collection centres to ensure an appropriate mixture of phlebotomists andnursing staff. This will bring SA Pathology inline with privately operated collection centres.
Benefits summary
• Financial: metro:
─ Changing 6.2 RNs(c) and 9.1 ENs(c) to phlebotomist can result in a benefit(c) of $0.3m.(b)
• Financial: regional:
─ Changing 1.6 RNs(c) and 8.6 ENs(c) to phlebotomist can result in a benefit(c) of $0.5m.(b)
Implementation considerations and risks
• IR and union considerations given specific industrial arrangements that apply to nurses.
• Phlebotomists are not qualified for highly specialised sample taking. Staffing realignment will need to consider the impactof this and how it can be most appropriately managed.
• Timeline sees the initiative being fully implemented within 6-8 months, with full benefit realised for FY20.
Impact summary
Total financial impact
• $0.8-0.9m (EBIT saving)
Timeline for realisation
• FY19: $0.0-0.0m
• FY20: $0.4-0.5m
• FY21: $0.8-0.9m
• FY22: $0.8-0.9m (a)
Investment required
• Low
• Est. implementation cost- cost for training of newstaff members to beabsorbed by the business.
• TVSPs may be an option.
Implementation ease
• Low
• Cannot enforceredundancies uponnurses.
Risk rating
• High
• IR and union risk.
Notes: (a) full run rate (b) based on average annual salaries mentioned in the profitability model; (c) Based on the SA Pathology profitability model (14/12/18). SA Pathology is revising the model and facts, analysis and benefits should be reviewed based on the revised model.

Competitiveness of SA Pathology in a contestable market - final report 82
Appendix 1. Improvement opportunitiesC3: Realign the staffing mix in the collection centres
Supporting analysis
FY18 collection centres with FTEs that are classified Benefits estimates from realigning staffing mix(a) ($’000)as RNs or ENs(a) (FTE numbers)
• The three metro collection centres with negative contribution(a) have been identified for closure as per improvement opportunity C2(a). In order to not
double count savings, no benefit will be realised from staffing mix realignment. If these collection centres are not closed, the benefit from staff
realignment at them would have been $205k as a result of 6.5 ENs(a) and 1.3 RNs(a) positions that would be performed by phlebotomists.
• The metro collection centres with positive contribution have 9.1 ENs(a) and 6.2 RNs(a). Changing that staffing mix to phlebotomists, can result in benefit
of $325k(a) in FY20.
• The regional collection centres with positive contribution have 1.6 RNs(a) and 8.6 ENs(a). Changing the staff mix to phlebotomists can result in a benefit
of $480k(a) in FY20.
• The regional collection centres with negative contribution did not have any FTEs classified as RNs or ENs(a).
• The total potential benefit in FY20 is $800-900k(a), based on changing the staffing mix. During implementation if practical constraints require retention
of some RNs or ENs then benefits estimate should be recalculated.
• As the initiative will be executed in FY20, and assuming it is executed during the first half of the year, only half of the benefit will be realised in FY20.
9.1
8.6
6.2
11.3
5.3
6.26.5
15.6
Profitable
regional
locations
(14)
1.6
Profitable
metro
locations
(10)
26.6
1.3
Unprofitable
Metro
locations (3)
14.0
C3Realign the staffing mix in the collection centres by replacing RNs and ENs with phlebotomists resulting in lower employment costs and more specialised skillsets.
Phlebotomist
EN
RN
465
325
273
52
17
481
0
Benefit from switching
RN to phlebotomist
Benefit from switching
EN to phlebotomist
Profitable
regional
locations
(14)
Profitable
metro
locations
(10)
Unprofitable
Metro
locations (3)
Notes: (a) Based on the SA Pathology profitability model (14/12/18). SA Pathology is revising the model and facts, analysis and benefits should be reviewed based on the revised model.

Competitiveness of SA Pathology in a contestable market - final report 83
Appendix 1. Improvement opportunitiesC4: Realise lab staffing efficiencies
Overview
Current state
• Staff have been classified as either clinical, technical officers, medical scientists or admin and other for analysis. Thisindicates the average cost of an FTE in each Directorate varies as the staff mix and specialisation level differs.
• The optimal staff mix in each Directorate depends on testing undertaken, however comparative analysis indicates SAPathology employs significantly more pathologists and highly experienced staff with greater associated costs.
• The employment expense per FTE in each Directorate is as follows in FY18:
─ AP: $182.6k (25% clinical(c) and 26% MES(d)).
─ Immunology: $137.4k (13% clinical(c) and 43% MES(d)).
─ Chemical Pathology: $149.0k (12% clinical(c), 57% MES(d)).
─ GMP: $111.9k (2% clinical(c), 61% MES(d)).
• Existing practices mean some pathologists provide support across multiple Directorates. Associated costs for theseindividuals is not apportioned.
• Additionally there are $12.4m of employment costs in the General Ledger that are marked as ‘non operating’ or have beenjudged by Directorates as ‘out-of-scope or for exclusion’. In optimising the staff skills, staff undertaking the additional$12.4m of work which was marked as out-of-scope should be considered.
Future state
• Optimise the number of pathologists and senior scientists and increase the number of technical officers in Directorates.Activities could leverage the successful learnings of Regional Services around multi-skilled staff.
Benefits summary
• Financial: In FY20 realise the benefits from adjusting the staffing mix so that the average cost per FTE reduces by 2.5% perFTE. In FY21 realise the benefits from adjusting the staffing mix so that the average cost per FTE is reduced by 5% acrossall Directorates.
Implementation considerations and risks
• Realisation of this opportunity will require significant planning and analysis.
• Will require close management of associated IR and union risks.
• Retention of key staff during the rationalisation process may be challenging.
• Will require ongoing capability development and support to ensure appropriate multi-skilling of staff.
• Need to ensure that the accreditation requirements for NPAAC Laboratory Supervision are met.
• Significant organisational change would be required for this to be implemented successfully.
C4Multi-skill lab staff and rationalise their mix to reduce the number of pathologists and senior scientists, and increase more junior scientists and technical officers. This will increase productivity and reduce average cost per test.
Impact summary
Total financial impact
• $5.5m (EBIT saving)
Timeline for realisation
• FY19: $0.0m
• FY20: $1.4m
• FY21: $2.7m
• FY 22: $5.5m (a)
Investment required
• Medium
• Est. implementation cost- $1.3m to identifypositions, and providecapability development.
• TVSPs may be an option.
Implementation ease
• Low
• IR and union risks.
Risk rating
• High
• Potential impacts fromlow staff support.
• Will require closemanagement ofassociated IR and unionrisks,
─ Microbiology: $120.7k (7% clinical(c), 45% MES(d)).
─ Haematology: $125.7k (9% clinical(c), 53% MES(d)).
─ Regional: $85.5k (contains non lab staff).
─ Automated: $99.0k (0% clinical(c), 41% MES(d)).
Notes: (a) full run rate; (c) Clinical staff include Allied Health professionals, Medical practitioners, Senior Registrars. Technical Officers include TGOs, Medical scientists include MES and Admin and other include Executive officer, OPS).(d) Medical laboratory scientist classification

Competitiveness of SA Pathology in a contestable market - final report 84
Appendix 1. Improvement opportunitiesC4: Realise lab staffing efficiencies
C4Multi-skill lab staff and rationalise their mix to reduce the number of pathologists and senior scientists, and increase more junior scientists and technical officers. This will increase productivity and reduce average cost per test.
Supporting analysis
FY18 Employment cost (including out-of-scope) Benefits realised from staff mix change ($’000)per FTE by Directorate ($’000)
• FTE analysis indicates Directorates can be grouped into three size categories: large (Automated-testing, Microbiology and AP), medium (Regional,
Genetics and Haematology) and small (Immunology and Chemical Pathology).
• For large Directorates, the average employment cost (including out-of-scope) per FTE is $135k. Automated does not have any medical staff, whilst
Microbiology has 7% and AP has 25%. If AP reduced the number of senior staff so that the average cost per FTE in AP were to reduce by 2.5%(a), it would
result in $0.8m of savings. Similarly if all other Directorates except automated change their staff mix so that the average cost per FTE reduces by 2.5%)
the total savings would be $2.7m.
• If all Directorates reduced their average cost per FTE by 5%(a) this would result in total benefits of $5.5m. A 7.5% reduction would lead to total benefits of
$8.2m – this is not factored into the saving potential of this opportunity as it is a stretch goal.
• As the majority of the salaries for FY19 have already been paid, changes will commence in FY19 but the benefits will be realised in FY20.
• The expected benefit for FY20 is a 2.5%(a) decrease in average cost per FTE. Also half of that benefit will be realised in FY20, the entire benefit will be
realised in FY21. The expected benefit for FY22 is a 5%(a) decrease in average cost per FTE (in total).
AP
Average:135 Average: 138G
enetics
Regio
nal
Chem
ical
Haem
ato
logy
124149
183
Mic
ro
184
121 118
Auto
mate
d
Te
stin
g
Imm
unolo
gy
171
Average:167
103978
527
Genetics
1,581
1,047
434
2,374
Mic
ro
527349
791349326
1,302
791
Auto
mate
d
Te
stin
g
0
434326
Regio
nal
AP
Imm
unolo
gy
123123196
Chem
ical
370589
196
Haem
ato
logy
177 174 173 148 105 82 43 33
FT
Es
Co
st
($m
)
18 21 32 17 13 14 8 5
5.0%
7.5%
2.5%
Notes: (a) The target savings amount of 2.5%-5.0% of salary costs was utilised as an average estimate in the absence of more robust benchmarks and is likely to be rationalised with further analysis.

Competitiveness of SA Pathology in a contestable market - final report 85
Appendix 1. Improvement opportunitiesC5: Renegotiate agreements with 3rd party suppliers
C5Renegotiate agreements with 3rd party suppliers for consumables, equipment and services. Where possible, consolidate and leveragestatewide and interstate spend.
Overview
Current state
• SA Pathology has 40 contracts with 3rd party suppliers representing a total value of $21.7m. Contracts are as follows:
─ Medical Equipment: $11.8m with 11 contracts.
─ Laboratory Goods: $4.9m with 9 contracts.
─ ICT: $1.9m with 3 contracts.
─ Healthcare services: $1.6m with 8 contracts.
• In addition there are 78 property lease contracts and agreements representing an annual cost of $2.1m.
Future state
• A range of opportunities exist in order to drive savings from existing arrangements:
─ Option 1: Renegotiate existing service and supplies contracts on the basis of existing demand.
─ Option 2: Renegotiate existing service and supplies contracts whilst consolidating SA Pathology’s existing demand.
─ Option 3: Consolidate SA Pathology’s existing demand and then run a competitive process including new potential suppliers.
─ Option 4: Consolidate demand with other states (the benefit from this option has not been assessed).
• Microbiology renegotiated their agreements with 3rd party suppliers in FY17, realising approximately $0.3m of benefit.This represents an approximate 5.7% reduction in their cost of supplies and services.
• Depending on the option selected, savings are estimated in the range of 10-20% in supplies and services costs.
Benefits summary
• Financial: The primary benefits will be efficiency savings and opportunity may exist to secure additional benefits such asimproved distribution and delivery arrangements.
• No benefits have been attributed to the renegotiation of property contracts due to the highly competitive market that thecollection centres operate in and the fact that each property rental agreement is with a different vendor.
Implementation considerations and risks
• The current benefits have been phased to align with contract expiration, however there may be some potential torenegotiate some contracts prior to their expiration.
• Realising the full scale of benefits requires a co-ordinated approach with other states. This will require detailed planningand co-ordination. Benefit’s from an interstate approach have not been factored into the financial impact.
• Timeline focuses initially on renegotiating smaller contracts, before negotiating broader contracts within 2 years.
Impact summary
Total financial impact
• $1.1-2.2m(a) (EBITsaving)
Timeline for realisation
• FY19: $0.0-0.0m
• FY20: $0.6-1.3m
• FY 21: $1.1-2.2m
• FY 22: $1.1-2.2m(a)
• Full run-rate: $2.2-4.3m
Investment required
• Low
• Est. implementation cost- cost to identify andrenegotiate contracts tobe absorbed by thebusiness.
Implementation ease
• High
Risk rating
• Low
• Will require coordinationacross states.
• Resistance from suppliersat risk of contract loss,particularly those whoare locally based.
Notes: (a) not full run rate
─ Medical consumables: $1.4m with 5 contracts.
─ Consultancy services: $71k with 1 contract.
─ Equipment maintenance: $46k with 2 contracts.
─ Office supplies: $23k with 1 contract.

Competitiveness of SA Pathology in a contestable market - final report 86
Appendix 1. Improvement opportunitiesC5: Renegotiate agreements with 3rd party suppliers
C5Renegotiate agreements with 3rd party suppliers for consumables, equipment and services. Where possible, consolidate and leveragestatewide and interstate spend.
Supporting analysis
Annual cost of current contracts ($’000) Benefits realised from renegotiation of agreements ($’000)
• Contracts can only be renegotiated as they expire or on a trigger event. Limited benefit is realised in FY19 given the lack of time to renegotiate.
• SA Pathology’s 40 contracts (excluding property) have an estimated value of $21.7m and varying expiration dates up to January 2028.
• There are 20 contracts (excluding property) due to expire in calendar year 2019 with an estimated value of $6.4m.
• Through renegotiation of contracts, a 10-20%(a) decrease can be achieved in FY20. This will support increase efficiencies in contract management.
• An incremental 10 contracts with total value of $4.8m are to expire in calendar year 2020. Benefits from renegotiation of those contracts can be realisedin FY21 and can be estimated at 10-20%(a) of the contract value.
• SA Pathology will not be able to reach full run-rate by FY21 due to dates of contracts expiry.
• SA Pathology can try to renegotiate agreements in collaboration with other states, this benefit is not modelled or included in this analysis.
Labora
tory
Goods
(9 c
ontr
acts
)
Medic
al E
quip
ment
(10 c
ontr
acts
)
Healthcare
Serv
ices
(8 c
ontr
acts
)11,764
1,880 1,350
ICT
(3 c
ontr
acts
)
4,947
1,621
Consultancy s
erv
ices
(1 c
ontr
act)
Medic
al consum
able
s
(5 c
ontr
acts
)
Equip
ment
main
tenance
(2 c
ontr
acts
)
71
Off
ice s
upplie
s
(1 c
ontr
act)
2346 1,118
2,236
966
483
FY
21 r
enegotia
tio
n
benefit
FY
21 t
ota
l benefit
Fu
ll ru
n r
ate
4,340
2,170
0
FY
19 b
enefit
635
1,270
6350
To
tal F
Y20 b
enefit
1,270
min
max
Notes: (a) based on past experience in similar industries, organisations or sufficiently close industries and organisations. Contract renegotiation has been observed to result with up to 20% improvement, with the average improvement of 12.7%. An example where SA Pathology was able to reduce supplies cost through contract renegotiation is Microbiology which realised a 5.7% reduction.
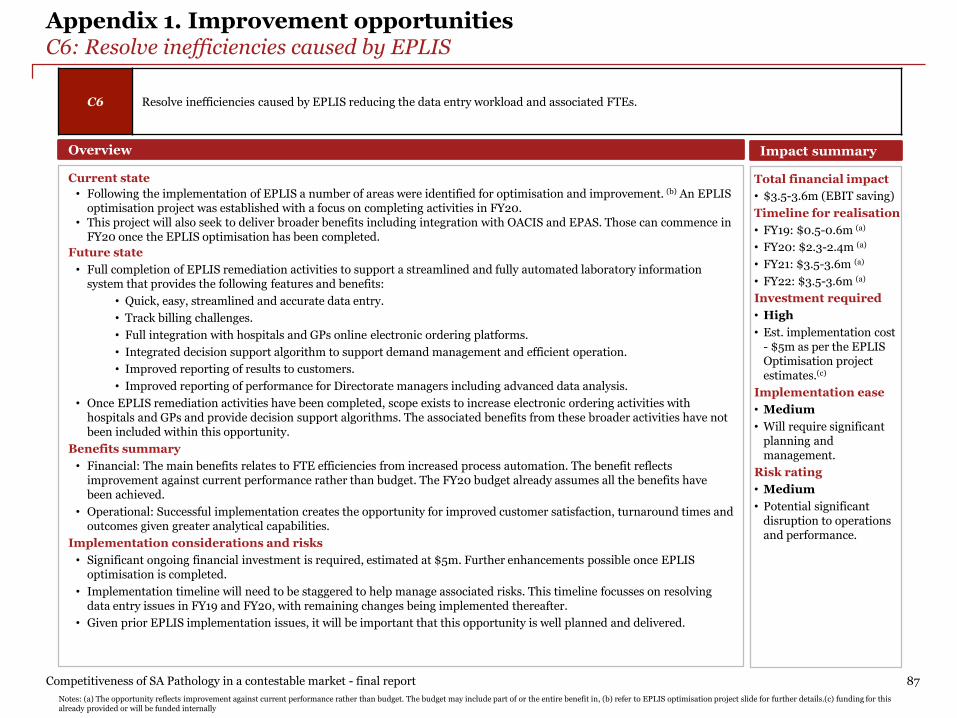
Competitiveness of SA Pathology in a contestable market - final report 87
Appendix 1. Improvement opportunitiesC6: Resolve inefficiencies caused by EPLIS
C6 Resolve inefficiencies caused by EPLIS reducing the data entry workload and associated FTEs.
Overview
Current state
• Following the implementation of EPLIS a number of areas were identified for optimisation and improvement. (b) An EPLISoptimisation project was established with a focus on completing activities in FY20.
• This project will also seek to deliver broader benefits including integration with OACIS and EPAS. Those can commence inFY20 once the EPLIS optimisation has been completed.
Future state
• Full completion of EPLIS remediation activities to support a streamlined and fully automated laboratory informationsystem that provides the following features and benefits:
• Quick, easy, streamlined and accurate data entry.
• Track billing challenges.
• Full integration with hospitals and GPs online electronic ordering platforms.
• Integrated decision support algorithm to support demand management and efficient operation.
• Improved reporting of results to customers.
• Improved reporting of performance for Directorate managers including advanced data analysis.
• Once EPLIS remediation activities have been completed, scope exists to increase electronic ordering activities withhospitals and GPs and provide decision support algorithms. The associated benefits from these broader activities have notbeen included within this opportunity.
Benefits summary
• Financial: The main benefits relates to FTE efficiencies from increased process automation. The benefit reflectsimprovement against current performance rather than budget. The FY20 budget already assumes all the benefits havebeen achieved.
• Operational: Successful implementation creates the opportunity for improved customer satisfaction, turnaround times andoutcomes given greater analytical capabilities.
Implementation considerations and risks
• Significant ongoing financial investment is required, estimated at $5m. Further enhancements possible once EPLISoptimisation is completed.
• Implementation timeline will need to be staggered to help manage associated risks. This timeline focusses on resolvingdata entry issues in FY19 and FY20, with remaining changes being implemented thereafter.
• Given prior EPLIS implementation issues, it will be important that this opportunity is well planned and delivered.
Impact summary
Total financial impact
• $3.5-3.6m (EBIT saving)
Timeline for realisation
• FY19: $0.5-0.6m (a)
• FY20: $2.3-2.4m (a)
• FY21: $3.5-3.6m (a)
• FY22: $3.5-3.6m (a)
Investment required
• High
• Est. implementation cost- $5m as per the EPLISOptimisation projectestimates.(c)
Implementation ease
• Medium
• Will require significantplanning andmanagement.
Risk rating
• Medium
• Potential significantdisruption to operationsand performance.
Notes: (a) The opportunity reflects improvement against current performance rather than budget. The budget may include part of or the entire benefit in, (b) refer to EPLIS optimisation project slide for further details.(c) funding for this already provided or will be funded internally

Competitiveness of SA Pathology in a contestable market - final report 88
Appendix 1. Improvement opportunitiesC6: Resolve inefficiencies caused by EPLIS
C6 Resolve inefficiencies caused by EPLIS reducing the data entry workload and associated FTEs.
Supporting analysis
FY18 estimated cost to resolve EPLIS issues ($m) Benefits realised from the initiative ($m)
• In FY19, a reduction in FTEs focusing on data entry by approximately 25%, yielding a benefit of $500-600k.
• In FY20, a reduction in remaining data entry FTEs and associated Directorate overtime yielding a benefit of $1.75m. FY20 total benefit will be $2.25m-
$2.35m.
• In FY21, FTEs supporting the EPLIS optimisation project will return to their regular roles. This will generate an incremental benefit of approximately
$1,200k.
• The total full run rate by FY21 is $3.5-3.6m.
• Beyond FY21, potential exists for further financial benefits originating from better integration with electronic ordering with hospitals and GPs and
decision support algorithms.
1.8 2.3 2.31.2
3.5
To
tal F
Y21 b
enefit
FY
21 in
cre
menta
l
benefit
1.2
3.6
Prio
r years
benefit
0.5
To
tal F
Y20 b
enefit
2.4
FY
20 in
cre
menta
l
benefit
0.6
FY
19 b
enefit
1.8
0.6
0.5
2.4
Reductio
n in
data
entr
y F
TE
FY19 FY20 FY21($500-600k) ($2,300-2,400k) ($3,500-3,600k)
max
min
FTEsEstimatedcost ($m)
Extra FTEs for data entry in in Automated Directorate
20.2 1.0
Extra FTEs for data entry inPatient Services
4.48 0.2
Extra FTEs for data entry inRegional Services
18.0 0.9
Extra FTEs for data entry in MID (a)
4.0 0.2
Directorate FTEs for EPLISimprovement project
6.0 1.2
Notes: $50,000 average salary used to estimate cost for each data entry FTE in Directorates. $200,000 average salary used to estimate cost for each FTE on EPLIS Improvement Project. (a)
additional FTE related to temporary staff hired to assist with EPLIS implementation e.g. data entry

Competitiveness of SA Pathology in a contestable market - final report 89
Appendix 1. Improvement opportunitiesC7: Invest in digital Pathology and digital communication
Overview
Current state
• SA Pathology does not have the required technology to implement Digital Pathology, and acquiring it would requireinvestment and changes to working practices. Existing practices require pathologists to read and interpret slides onsite,creating additional costs.
Future state
• A new operating model using digital pathology equipment would see technicians create slides (onsite) that are digitallytransmitted to a remote central location where pathologists could interpret them. This would be beneficial for Directoratessuch as AP, Microbiology and Haematology as it would increase pathologist productivity. Patient specimens from multiplelocations could be analysed centrally, reducing the number of pathologists required.
• This would see SA Pathology take a lead position within Australian Public Pathology as digital pathology is not currentlybeing utilised in a diagnostic capacity.
• A modern lab space will also be required to enable centralisation of pathologists and facilitate new and improved ways ofworking. This has not been factored into the implementation costs. A detailed business case needs to be developed for thisopportunity including any revisions to benefits, investment and timelines.
Benefits summary
• Financial: The main driver of efficiency is the reduction in pathologists due to increased productivity. Timelines aredependent on the availability of suitable space and ability to quickly deploy the relevant technology. The timelines mayneed to be extended if appropriate space and implementation capability is not available.
• Operational: Potential operational benefits include improved turnaround times, workplace flexibility for pathologists andbetter use of resources. This would also act as an enabler to help SA Pathology achieve an optimal staffing mix (the value ofthis has not been quantified).
• Successful implementation would also provide SA Pathology with the opportunity to increase its interstate / internationalservice offering and grow revenues from wider sources.
Implementation considerations and risks
• Implementation would involve a pilot study in two labs with an initial investment of $300k. This would be followed bybroader implementation. It is anticipated that associated costs will be approximately $1m, depending on scale.
• Timeline for implementation would see a pilot once EPLIS optimisation is complete to ensure minimal associateddisruption and adequate resourcing. Additional funding and capacity would support an earlier pilot. The timeline shouldbe linked to the availability of an appropriate location and access to appropriate implementation capability.
• Would require significant IT support.
• Would require an Industrial Relationships strategy to mitigate any potential IR and union risks.
C7Invest in digital pathology - enabling remote reporting by Pathologists located at a centralised location, thus improving reporting times, staffing costs and productivity.
Impact summary
Total financial impact
• Not Available (N/A).
Timeline forrealisation
• FY19: $0.0-0.0m
• FY20: $0.0-0.0m
• FY21: $0.5-1.5m(a)
• FY22: $5.0-7.5m(b)
• Full run rate to bereached after FY21.
Investment required
• Medium
• Est. implementation cost- $0.3m for a pilot and$1.0m for full technologydeployment. Theimplementation costs donot include the cost ofthe development of amodern lab space.
• TVSPs may be an option.
Implementation ease
• Low
• IT implementation risks.IT support essential.
Risk rating
• High
Notes: (a) based on reducing the workforce by 1 to 3 pathologist at a cost of $500k each, based on reducing the workforce by 10 to 15 pathologist overall at a cost of $500k each

Competitiveness of SA Pathology in a contestable market - final report 90
Appendix 1. Improvement opportunitiesC8: Rationalise and improve management of research activities and research support
C8Rationalise research and support activities to align to Pathology-focussed LHN needs. Put in place a framework to better manage research and support activities.
Overview
Current state
• SA Pathology supports a broad range of research activities including answering clinical questions, fundamental health andmedical research and translational and clinical research.
• Fundamental health and medical research aims to challenge and improve the understanding of physiological principlesand processes whereas translational and clinical research focuses on application of that understanding into improvingpathology tests, their utilisation, the management of diseases and the search for new and better treatments.
• As per the staff survey as well as items in the FY18 General Ledger marked as research support, $5.2m of research andresearch support was undertaken.
─ AP: $125k.
─ GMP: $609k.
─ Immunology: $2,627k.
─ Haematology: $303k.
• Feedback suggests that the true value of research activities is greater than this.
Future state
• Commercial and transparent approach taken to all research activities.
─ Increased alignment of proposed research: Appropriate governance and challenge to ensure proposed research andsupport activities align to SA Pathology’s required capabilities to meet agreed customer service levels.
─ Improved management of activities: Research has proper KPIs and generates income to cover its own cost.
─ Improved financial visibility: Research activities managed as separate cost centres, rather than being embedded in the staff costs of each Directorates.
─ Alternative delivery arrangements: Where proposed research is deemed not appropriate, this is declined or referred on for consideration by an appropriate alternate research organisation.
Benefits summary
• Financial: Reduction in associated FTEs and costs due to rationalised and more focused research and support activitiesand move of appropriate research to other research institutions where appropriate.
• Operational benefits include increased visibility of tasks which will support improved management.
• Clinical trials supported by SA Pathology are charged at cost and are not captured in this data.
Implementation considerations and risks
• IR and union risks. Reference to DHW recognising the appropriateness of research and supporting its continuance isreferred to in the medical officers EA for consultants.
• Potential for associated staff resistance.
Impact summary
Total financial impact
• $1.1-1.2m (EBIT saving)
Timeline for realisation
• FY19: $0.0-0.0m
• FY20: $0.9-0.9m
• FY21: $1.1-1.1m
• FY22: $1.1-1.2m (a)
Investment required
• Low
• Est. implementation cost- Minimal cost requiredto create an improvedmanagement frameworkfor research to beabsorbed by the business.
• TVSPs may be an option.
Implementation ease
• High
Risk rating
• Medium
• IR and union risks
• Broader stakeholdersupport may be limited.
• May weakenedrelationship with metroLHNs if there is a loss ofcollaborative engagementwith specialists.
─ Chemical Pathology: $94k.
─ Microbiology: $181k.
─ Regional and Automated: $0k.
─ Other: $1,296k (Vet services: $546k, Other: $750k).
Notes: (a) full run rate, benefits calculated in collaboration with SA Pathology mainly based on the reduction of research support to lower levels

Competitiveness of SA Pathology in a contestable market - final report 91
Appendix 1. Improvement opportunitiesC9: Reduce operational inefficiencies across Directorates
C9 Reduce operational inefficiencies across Directorates.
Overview
Current state
• The total operating cost for SA Pathology is $71m (excluding overheads and indirect costs, and including out-of-scopeitems).
• Directorates have identified a number of inefficient practices which include operating labs 24/7 when not required to meetagreed service levels, and opportunities for improved process optimisation such as reducing paper-based activity.
Future state
• Improve the operational inefficiency of Directorates thereby reducing their operational costs. Key strategies relate to:
─ Optimisation of the operating hours of labs increasing utilisation and minimising employment costs such as staffovertime.
─ Review and standardisation of the current repertoire of tests undertaken.
─ Focussed approach to delivering benefits from demand management.
─ Lab-based process optimization, including removal of paper based activity.
Benefits summary
• Financial: Potential for a reduction in operating and staff costs. A total improvement benefit of 1.5%-3% (b) in operatingcosts could be realised.
• Operational: Increased laboratory and equipment utilisation, more efficient lab processes, minimised wastage andincreased turnaround times as a result of improved efficiency.
• The optimised staff mix of Directorates has previously been separately considered. Therefore this opportunity does notinclude analysis and benefits related to this
Implementation considerations and risks
• Would require an Industrial Relationships strategy to mitigate any potential IR and union risks.
• Will require close implementation planning and management to ensure minimum disruption occurs to services.
• Timeline: Commence activities in FY19, however there is limited opportunity to realise benefits within this financial year.
Impact summary
Total financial impact
• $1.1-2.1m (EBIT saving)
Timeline for realisation
• FY19: $0.0-0.0m
• FY20: $0.7-1.4m
• FY21: $0.7-1.4m
• FY22: $1.1-2.1m (a)
Investment required
• Medium
• Est. implementation cost- $0m. More detailedassessment required toconfirm any requiredinvestment.
• TVSPs may be an option.
Implementation ease
• Medium
• Significant planning andchange managementsupport required.
Risk rating
• Medium
• IR and union risk.
• Broader stakeholdersupport may be limited.
Notes: (a) full run rate (b) benefits have been estimated based on prior knowledge of comparable companies and transactions.

Competitiveness of SA Pathology in a contestable market - final report 92
Appendix 1. Improvement opportunitiesC9: Reduce operational inefficiencies across Directorates
C9 Reduce operational inefficiencies across Directorates.
Supporting analysis
FY18 Operating cost by Directorate ($m) Benefits realised ($’000)Including out-of-scope items
• In FY19, commence planning for benefits realisation. Due to the lack of time remaining in the financial year, no benefits are expected to be realised.
• In FY20, commence implementation of opportunities such as optimisation of lab operating hours, rationalising required overtime, minimising travel,
creating more efficient processes that increase machinery and staff utilisation. A 1-2% reduction in the total operating cost across all Directorates can be
realised in FY20 resulting in $0.7-1.4m.
• In FY21, an additional 0.5-1% reduction can be achieved resulting in an overall benefit of $1.1-2.1m.
9.9 7.94.43.9
4.69.14.1
10.0
Mic
ro
3.9
AP
18.4
0.7
17.7
Auto
mate
d
0.1
Chem
ical
2.3
Imm
unolo
gy
8.1
2.33.5
12.3
7.9
Genetics
Reg
3.2
8.5H
aem
ato
logy
1,0680
FY
20
2,137
FY
19
0
1,425
FY
21
712
max
min
Out of scope Agreed operating cost

Competitiveness of SA Pathology in a contestable market - final report 93
Appendix 1. Improvement opportunitiesC10: Improve couriers efficiency
C10Increase efficiency of courier operations (routes, locations, number of runs, rostering) and rationalise large courier vehicles to those that are smaller and more economical.
Overview
Current state
• SA Pathology currently uses a variety of courier arrangements. The main format is an in-house fleet which is supplementedby outsourced provision and the occasional use of taxis. Additionally, regional couriers are run independently and mainlystaffed by volunteers. The cost of metro couriers is $5.0m, which excludes the costs of taxis. Regional couriers utilisevolunteers, some of which use their own vehicles. The cost of regional couriers is not available and is not being consideredin this optimisation.
• Feedback has identified complaints about reliability and courier speed.
• There are two urgency levels for couriers: ‘urgent’ for requests that need to be processed within an hour and ‘non-urgent’for other requests. It is common for packages to be marked as ‘urgent’ despite slower processing times being acceptable.
• To support a more efficient courier system for the in-house fleet, route optimisation analysis has been performed. Whilstthis has generated some benefits, potential exists to further increase route optimisation and efficiency.
• Larger vehicles are used more often than required due to historic Government policies requiring specific makes beprocured. These policies are no longer applicable and SA Pathology is shifting towards hybrid vehicles where possible.
Future state
• An optimised courier service which allows for quick, efficient and effective specimen transport and minimises the need foruse of taxi service. This will be achieved through increased optionality in terms of urgency requirements to moreappropriately manage demand. Software and support on route management and vehicle replacement would also bebeneficial.
• Introduce more levels of urgency – such as urgent (process time less than 1 hour), same day processing with process timeof 24 hours and two day processing with turnaround time of 48 hours. This will allow for better route optimisation.
• Contesting couriers is severely restricted by current industrial agreements.
Benefits summary
• Financial: Efficiency benefits - reduced operating cost through better vehicles, optimised routes and associated reductionsin FTEs and usage of taxis.
• Operational: Optimising couriers routes will help SA Pathology become more agile and competitive through improvedservice and quicker performance. Improved adherence to urgency levels will support more efficient use of assets and lowercosts.
Implementation considerations and risks
• Route optimisation will require specialist advice and support.
• Potential for significant patient and clinical issues should implementation be unsuccessful.
• Would require an Industrial Relationships strategy to mitigate any potential IR and union risks.
Impact summary
Total financial impact
• $0.3-0.6m (EBIT)
Timeline for realisation
• FY19: $0.0-0.0m
• FY20: $0.3-0.5m
• FY21: $0.3-0.5m
• FY22: $0.3-0.6m (a)
Investment required
• Low
• Est. implementation cost- $0.4m to support routeoptimisation andimplementation.
• Est. implementation. cost- $0.1m to train FTE innew processes.
Implementation ease
• Medium
• Specialist skills required.
Risk rating
• Medium
• Potential for operationaldisruption.
• IR and union risk
Notes: (a) full run rate

Competitiveness of SA Pathology in a contestable market - final report 94
Appendix 1. Improvement opportunitiesC10: Improve couriers efficiency
C10Increase efficiency of courier operations (routes, locations, number of runs, rostering) and rationalise large courier vehicles to those that are smaller and more economical.
Supporting analysis
FY18 courier cost ($m) Benefits realised ($’000)
• The current fleet consists of 69 vehicles, including Toyota Camrys, Mitsubishi Outlanders, Kangoos, Hyundai iLoad sand Transporter Panel vans.
• New vehicles are to be leased following analysis to determine suitability based on tasks required, anticipated mileage, lease costs, economy and anyassociated OHS implications. Lease periods to be for 12-36 months and based on mileage. Lease costs to be reviewed at renewal points.
• The benefit will be realised in FY20 and it will be about 5-10% of the total courier cost.
• As FY19 is almost complete the benefits would be realised in FY20. The benefit in FY20 is $252-505k.
• There will be an additional benefits arising from improvements in management of vehicle fleets, resulting in a 1-2% further cost reduction ($50-101k).
FY
20
FY
19
101252
0
050
303
505
To
tal F
Y21 b
enefit
605
Fle
et
optim
isatio
n
505
252 min
max
FTEsEstimatedcost ($m)
Employment cost 43.6 2.8
Other operating cost - 2.2
Total 43.6 5.0

Competitiveness of SA Pathology in a contestable market - final report 95
Appendix 1. Improvement opportunitiesC11: Manage overheads and non-diagnostic costs
C11 Manage overheads and non-diagnostic costs.
Overview
Current state
• Within SA Pathology’s total overheads and indirect costs of $53.2m, a total of $24.7m are not already covered by otherimprovement opportunities and could be better managed for value. These costs are for:
─ Other operations cost: $9.3m.
─ General Pathology: $8.2m.
─ Customer services-non courier cost: $3.9m.
─ Billing: $1.5m.
─ Call centres: $1.0m.
─ ICT and procurement: $0.6m.
Future state
• Closer and more commercial management of overheads to identify and deliver potential savings:─ Other operations cost ($9.3m) consists of the central overhead management and Frome road management as well as
investments and others. SA Pathology is not accountable for the investment loss from an operating result perspective. The EPLIS optimisation project will help with Frome Road computing and staff expenses.
─ General Pathology overheads ($8.2m) include occupancy rent and rates, electricity, utilities, fuel, cleaning, repairs and maintenance, and other general management costs. Renegotiation of contracts and enhanced management of the business will help to contribute savings. This benefit has not been included in the analysis.
─ Customer services – non courier cost ($3.9m) includes printing of order forms, distribution of consumables to private practices and distribution of printed reports. This can be reduced by moving away from paper based activities.
─ Billing ($1.5m) can be reduced using appropriate technology. Benefit will occur beyond FY21.─ Call centres ($1.0m) could be better managed or outsourced. This would involve reposition this function centrally
and outside of the Automated Directorate.─ Immunology ($0.8m) requires better visibility and management of overhead costs. These primarily relate to
employment costs for the CCB.Benefits summary
• Financial: reduction of costs and FTEs through better management of overheads, renegotiation of contracts wherepossible and potential outsourcing of the call centre. Overheads, non-diagnostic costs analysed in broader opportunitiesand non-cash expenses are excluded from this analysis.
• Operational: Reduction in labor intensive support processes supporting better resource efficiency and staff multiskilling.Implementation considerations and risks
• Broad range of activities will require detailed planning.
Impact summary
Total financial impact
• $2.3-2.7m (EBIT saving)
Timeline for realisation
• FY19: $0.0-0.0m
• FY20: $0.3-0.8m
• FY21: $1.5-1.9m
• FY22: $1.5-1.9m (a)
Investment required
• Medium
• Est. implementation costto be absorbed by thebusiness.
Implementation ease
• Medium
Risk rating
• Low
• Broader stakeholdersupport may be limited.
─ Collection centres: $12.7m (covered in C2).
─ Specimen reception: $10.2m (covered in C9).
─ Customer services – couriers: $5.0m (covered in C10).
─ Immunology: $0.8m.
─ Central items: $22.8m (non-cash expense).
Notes: (a) full run rate

Competitiveness of SA Pathology in a contestable market - final report 96
Appendix 1. Improvement opportunitiesC11: Manage overheads and non-diagnostic costs
C11 Manage overheads and non-diagnostic costs.
Supporting analysis
FY18 Employment cost by Directorate ($m) Benefits realised from consolidation ($’000)
• Customer services–non-couriers can achieve a reduction of 5-10%. Implementation will see commencement of planning of printing and management inFY19 (no benefit realised), with the entire benefit realised in FY20. FY21 will focus on better technology and integration with electronic orderingSupporting a 5-10% saving in $197-394k.
• Other operating costs include intra Government transactions ($1.1m), investment loss ($1.2m), Frome Road computing ($1.5m), staff training anddevelopment and travel ($1.7m) Service level agreements ($1.9m), employment expenses ($1.9m). Investment income/loss has consistently been a lossof $0.8-5.2m each year over the past 5 years with the exception of a $2.0 gain in FY17. SA Pathology is not accountable for losses in investments as aresult of the decreased value of marketable securities and so has been excluded from the analysis. Frome Road computing increased by $1.1m from FY17to FY18 due to EPLIS implementation. This extra cost will not occur in FY21. Travel and employment expenses can be managed better to deliver areduction of 5-10% in FY20, however as staff become multi-skilled, an investment in training will be required to reduce the cost by 5-10% in FY21.
• Staff expenses can be slightly reduced e.g. reduction of admin staff, however costs may increase as additional tasks return to SA Pathology’smanagement.
0.6
call
cente
rs
1.01.5
Custo
mer
serv
ices
non c
ourie
rs
Centr
al item
22.8
Bill
ing
5.0
10.2
Courie
rs
12.7
ICT
& P
rocure
ment
Imm
unolo
gy
0.8S
pecim
en r
eceptio
n
Colle
ctio
n C
ente
rs
3.9
8.2
Genera
l P
ath
olo
gy
Oth
er
opera
tin
g c
osts
9.3
394
FY
19 in
itia
tives
1970
0 51
102
1,040
Fro
me R
oad
com
putin
g
1,0401,468
Prio
r year
repeat
benefit
1,896
754
377
call
centr
es
To
tal F
Y21
To
tal F
Y20
754
Sta
ff e
xpenses
377180
360
Custo
mer
serv
ices
non c
ourie
rs
min
max
Overheads Covered by non-cashto be optimised previous analysis
FY19 FY20 FY21($0k) ($377-754k) ($1,468-1,896k)
Yea
r to
re
ali
se
ben
efit
The call centre is currently situated in Automated Directorate.

Competitiveness of SA Pathology in a contestable market - final report 97
Appendix 1. Improvement opportunitiesC12: Stop unprofitable tests that are private referred and/or community work
C12 Stop unprofitable tests that are privately referred and/or community work.
Overview
Current state
• SA Pathology undertakes complex public and private testing and is the only provider in SA for some tests.
• Private work includes private community work (such as collection centres and private referred work) as well as privateresearch work. Some of this is well remunerated and subsidises broader activities. However, other parts of this work areunprofitable.
• Anecdotally, private companies send work to SA Pathology that:
─ Requires additional testing that will not be renumerated because of Medicare coning rules as private companies havealready extracted the MBS fee.
─ Is complex and not part of the private company’s service offering.
─ Requires additional interpretation by SA Pathology experts as the relevant pathologists at private companies lack suitably specialised or recent expertise.
Future state
• SA Pathology continues to undertake the full range of tests for public work.
• SA Pathology only undertakes private work that is profitable. This will require detailed cost analysis to better understandprofitability and cost levels.
• SA Pathology to cease performing unprofitable tests for private companies or agree to receive the right remuneration forundertaking the private referred work. Detailed cost analysis will help inform improved pricing approaches.
Benefits summary
• Financial: Reduction in unprofitable activity will support lower use of consumables and FTE reduction.
• Operational: More efficient use of resources.
Implementation considerations and risks
• Broader stakeholder support may be limited as a private providers will need to seek alternative arrangements.
• Work to identify unprofitable tests is likely to be challenging given limitations in profitability and costing data.
Impact summary
Total financial impact
• Not estimated
Timeline for realisation
• FY19: N/A
• FY20: N/A
• FY21: N/A
• FY22: N/A
Investment required
• Medium
• Est. implementation cost– N/A.
• Improvements inprofitability data.Investment for thiscapability building iscovered under BM3.
Implementation ease
• Low
• Significant work todetermine which testswill be ceased.
Risk rating
• Low
• Broader stakeholdersupport.
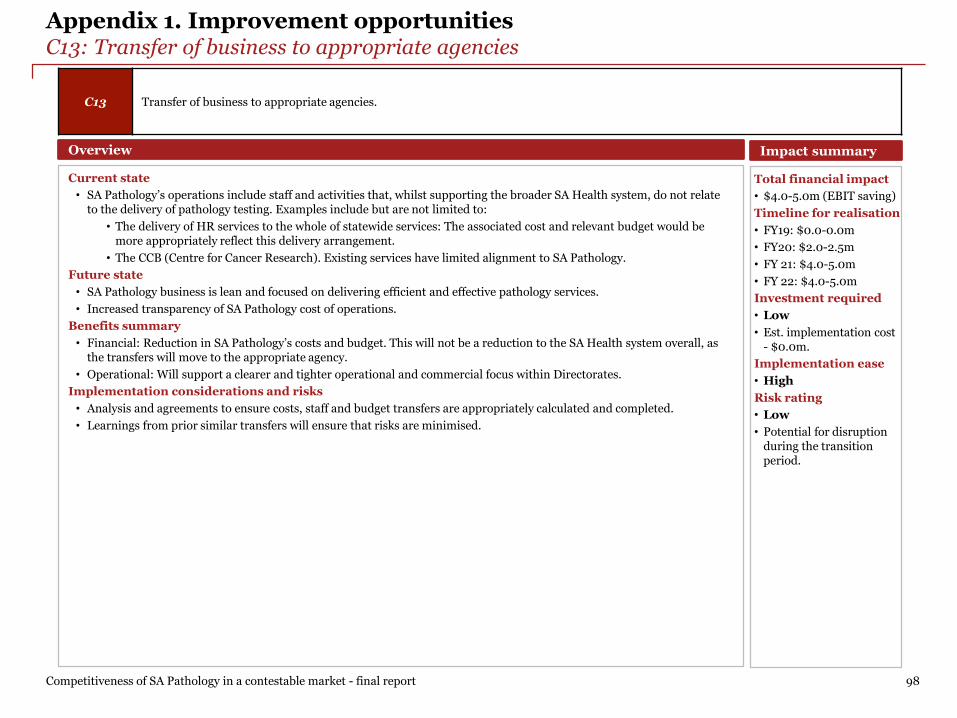
Competitiveness of SA Pathology in a contestable market - final report 98
Appendix 1. Improvement opportunitiesC13: Transfer of business to appropriate agencies
C13 Transfer of business to appropriate agencies.
Overview
Current state
• SA Pathology’s operations include staff and activities that, whilst supporting the broader SA Health system, do not relateto the delivery of pathology testing. Examples include but are not limited to:
• The delivery of HR services to the whole of statewide services: The associated cost and relevant budget would bemore appropriately reflect this delivery arrangement.
• The CCB (Centre for Cancer Research). Existing services have limited alignment to SA Pathology.
Future state
• SA Pathology business is lean and focused on delivering efficient and effective pathology services.
• Increased transparency of SA Pathology cost of operations.
Benefits summary
• Financial: Reduction in SA Pathology’s costs and budget. This will not be a reduction to the SA Health system overall, asthe transfers will move to the appropriate agency.
• Operational: Will support a clearer and tighter operational and commercial focus within Directorates.
Implementation considerations and risks
• Analysis and agreements to ensure costs, staff and budget transfers are appropriately calculated and completed.
• Learnings from prior similar transfers will ensure that risks are minimised.
Impact summary
Total financial impact
• $4.0-5.0m (EBIT saving)
Timeline for realisation
• FY19: $0.0-0.0m
• FY20: $2.0-2.5m
• FY 21: $4.0-5.0m
• FY 22: $4.0-5.0m
Investment required
• Low
• Est. implementation cost- $0.0m.
Implementation ease
• High
Risk rating
• Low
• Potential for disruptionduring the transitionperiod.

Competitiveness of SA Pathology in a contestable market - final report 99
Appendix 1. Improvement opportunitiesC14: Commission testing activities from alternative providers where appropriate
C14 Review existing service range and consider where collaboration with alternative providers could support more efficient delivery.
Overview
Current state
• SA Pathology currently performs the majority of required testing with some specialised tests sent interstate. This meansthat circumstances may exist where SA Pathology currently provides some tests that could be obtained from an alternativeprovider (within an appropriate arrangement).
Future state
• Each Directorate to perform profitability analysis on the range of public pathology tests, identifying those which areunprofitable. These tests should be reviewed to understand the operational implications and risks of them being providedby alternative providers.
• For suitable tests where alternative provision is appropriate, SA Pathology to explore opportunities to commission theseservices. SA Pathology to consider securing services from both broader public and private providers.
Benefits summary
• Financial: More efficient and sustainable delivery model for unprofitable tests. The financial impact is a high levelestimation and more rigorous analysis should be undertaken at a future date.
• Operational: Enhanced relationships with broader provider network.
Implementation considerations and risks
• Will require profitability analysis of existing test range, as well as a review of provider market capacity and capability.
• Potential for disruption caused during transition to a new delivery model for specific tests.
• Will require development of an appropriate governance model.
• May create some clinical risks associated with the transportation of samples.
• Would require an Industrial Relationships strategy to mitigate any potential IR and union risks.
Impact summary
Total financial impact
• $1.4-1.8m (EBIT saving)
• The financial impact is aninitial estimate andrequires further analysis.
Timeline for realisation
• FY19: $0.0-0.0m
• FY20: $0.0-0.0m
• FY21: $0.7-0.9m
• FY22: $1.4-1.8m (a)
Investment required
• Medium
• Est. implementation cost– $0.0m.
• Investment in technologyrequired covered underBM3.
• TVSPs may be an option.
Implementation ease
• Low
• Will require a clearcommissioning strategy.
Risk rating
• High
• Broader stakeholdersupport may be limited.
• IR and union risks.
Notes: (a) Areas where collaboration could be explored as non-urgent testing in: Anatomical Pathology, Cytology, Immunology, Microbiology, non-urgent and Haematology non-urgent which represent a combined cost base of potentially $74.5m. If a combined saving of 1.0-2.5% can not be achieved by the collaboration then the initiative should not be pursued
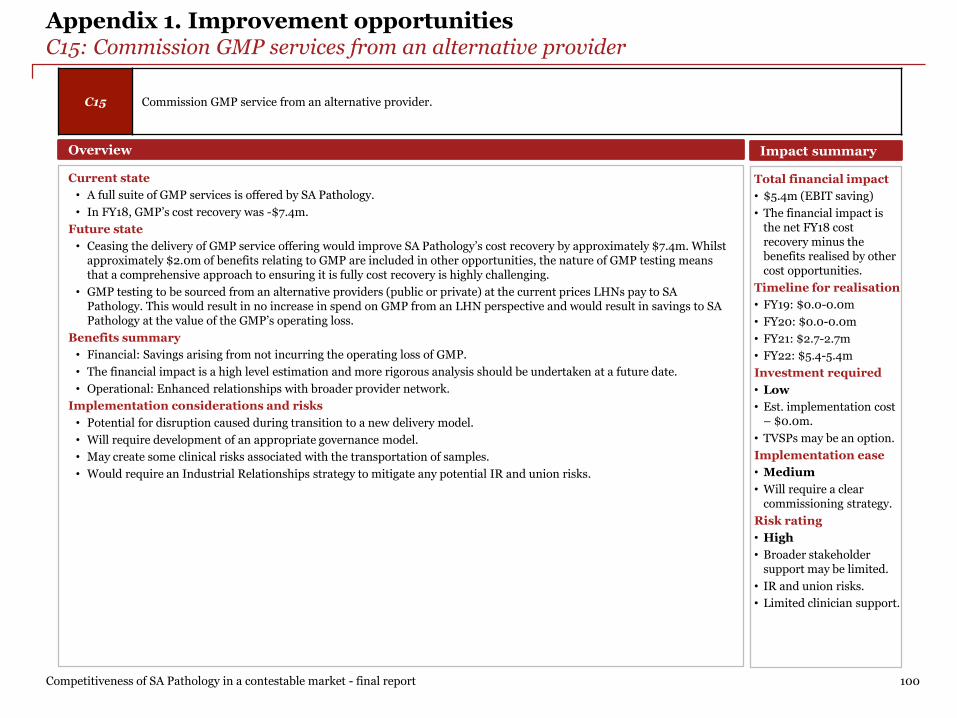
Competitiveness of SA Pathology in a contestable market - final report 100
Appendix 1. Improvement opportunitiesC15: Commission GMP services from an alternative provider
C15 Commission GMP service from an alternative provider.
Overview
Current state
• A full suite of GMP services is offered by SA Pathology.
• In FY18, GMP’s cost recovery was -$7.4m.
Future state
• Ceasing the delivery of GMP service offering would improve SA Pathology’s cost recovery by approximately $7.4m. Whilstapproximately $2.0m of benefits relating to GMP are included in other opportunities, the nature of GMP testing meansthat a comprehensive approach to ensuring it is fully cost recovery is highly challenging.
• GMP testing to be sourced from an alternative providers (public or private) at the current prices LHNs pay to SAPathology. This would result in no increase in spend on GMP from an LHN perspective and would result in savings to SAPathology at the value of the GMP’s operating loss.
Benefits summary
• Financial: Savings arising from not incurring the operating loss of GMP.
• The financial impact is a high level estimation and more rigorous analysis should be undertaken at a future date.
• Operational: Enhanced relationships with broader provider network.
Implementation considerations and risks
• Potential for disruption caused during transition to a new delivery model.
• Will require development of an appropriate governance model.
• May create some clinical risks associated with the transportation of samples.
• Would require an Industrial Relationships strategy to mitigate any potential IR and union risks.
Impact summary
Total financial impact
• $5.4m (EBIT saving)
• The financial impact isthe net FY18 costrecovery minus thebenefits realised by othercost opportunities.
Timeline for realisation
• FY19: $0.0-0.0m
• FY20: $0.0-0.0m
• FY21: $2.7-2.7m
• FY22: $5.4-5.4m
Investment required
• Low
• Est. implementation cost– $0.0m.
• TVSPs may be an option.
Implementation ease
• Medium
• Will require a clearcommissioning strategy.
Risk rating
• High
• Broader stakeholdersupport may be limited.
• IR and union risks.
• Limited clinician support.

Competitiveness of SA Pathology in a contestable market - final report 101
Appendix 1. Improvement opportunitiesR1: Resolve issues with billing backlog and PBRC
R1 Resolve issues with billing backlog, ensure all outstanding bills are charged before expiry and resolve issues with PBRC.(a)
Overview
Current state
• SA Pathology has a large amount of revenue that remains unbilled, some of which may be unbillable due to system issues.Revenue bottlenecks have been caused by suspended EPLIS charges, IMM(a) errors (revenue stuck between EPLIS andPBRC(a)) and worklist items stuck in PBRC(a).
• Accurate calculation of unbilled amounts is challenging and requires various data extracts. Guiding estimates are:
─ Revenue of approximately $4.6m remains unbilled as a result of suspended EPLIS charges. These are charges thatremain in the EPLIS system prior to being released to the PBRC billing system.
─ Revenue of approximately $1m remains unbilled as a result of IMM errors. This is revenue stuck between the EPLIS and PBRC(a) systems.
─ Revenue of approximately $4.4m remains unbilled as a result of worklist items stuck in PBRC.
• Total unbilled revenue that is stuck in the various systems could be as high as $10m across 3 financial years with themajority in FY18. SA Pathology is currently accruing via the General Ledger.
• Medicare does not allow claims for charges after 2 years. The value of total unbilled revenue for FY18 is estimated at $6m.
• Additionally, LHNs are sometime not able to bill for private patients where SA Pathology does not capture the requiredpatient information.
Future state
• Fully integrated systems that ensure revenue billing is streamlined and can be done accurately. Error checks and alerts tousers when the system detects incorrect data entry.
• Revenue to automatically flow through the billing process with limited manual intervention.
Benefits summary
• Financial: Collection of unbilled revenue and prevention of recurrence of billing problems.
• May be additional financial benefits to the SA health system if the systems better support LHNs’ billing of private patient.
• Operational: Improved and integrated billing and IT systems supporting better reporting and business management.
Implementation considerations and risks
• Will require FTEs support. Additional temporary resources already engaged within Data Management and the Billing teamnoting there is some specialisation needed.
• Significant planning to ensure system improvement implementation is successful.
• May encounter challenges with Medicare and LHNs regarding payment given the passage of time.
• Will requires collaboration with eHealth & HRS (Hospital Revenue Services).
Impact summary
Total financial impact
• $6.0m (revenue) andtranslates 100% intoEBIT savings.
Timeline for realisation
• FY19: $6.0-6.0m
• FY20: $6.0-6.0m
• FY21: $6.0-6.0m
• FY22: $6.0m full run rate
Investment required
• Medium
• Est. implementation cost– to be funded internally.
Implementation ease
• Low
• Timely and costly to clearbacklog.
Risk rating
• Low
Notes: The opportunity reflects improvement against current performance rather than budget. If the budget was adjusted, some exclusions would be required to ensure consistency(a) PBRC is SA Pathology’s billing system. And IMM are errors which represent transactions which are stuck between EPLIS and PBRC.

Competitiveness of SA Pathology in a contestable market - final report 102
Appendix 1. Improvement opportunitiesR1: Resolve issues with billing backlog and PBRC
Supporting analysis
Estimated unbilled revenue ($m) Estimated timeline of revenue collection ($m)
• The above analysis indicates estimation of unbilled revenue only, as provided by SA Pathology on 21 December 2018.
• Suspended EPLIS accessions: accessions were said to be a more reliable indicator to estimate unbilled revenue than EPLIS encounters. Approximately110,000 suspended EPLIS accessions currently in the system. Using an average cost per accession, the total estimated unbilled revenue is $4.5m.
• IMM errors: approximately 15,000 EPLIS encounters currently in the system. Based on an average cost per encounter, the total estimated unbilledrevenue is $1m.
• Worklist items stuck in PBRC: 68,000 EPLIS encounters currently in the system. Based on an average cost per encounter, the total estimated unbilledrevenue is $4.7m. Due to Medicare rules, some of the revenue will be unable to be billed as work was completed greater than two years ago.
4.5
Stu
ck in
PB
RC
4.7
0.7
Suspended E
PLIS
accessio
ns
IMM
err
ors
R1 Resolve issues with billing backlog, ensure all outstanding bills are charged before expiry and resolve issues with PBRC.
2
6 6
6
FY
20
FY
19
FY
21
6
3
max
min

Competitiveness of SA Pathology in a contestable market - final report 103
Appendix 1. Improvement opportunitiesR4: Update pricing to be cost-reflective of effort for public work
R4 Move to cost-reflective pricing (at efficient costs of supply rather than current costs) for public and commercial work.
Overview
Current state
• SA Pathology has based its pricing policy on MBS rates, which are applied using a complex set of parameters that includepatient type, location and authorised orderer.
• Charges for Public Inpatients are usually made at 85% of the equivalent MBS fee and this pricing approach does notspecifically consider the cost of the testing provided. This practice for public work means that a number of tests areperformed that do not recover costs.
• Funding for public health, teaching and training, multidisciplinary team meetings, research and other work such as postmortem and body handling, prenatal, paediatrics and GMP is also not reflective of effort.
Future state
• SA Pathology operates all services on a fully cost recovery basis. This would align with the direction of other state publicpathology providers, and would remove cross subsidisation between products and provide transparency to LHNs about thecost of each test helping to support demand management activities. Key steps would include:
• Detailed costing review of all services.
• Pricing of work at cost recovery levels independent of MBS rates and with renegotiation of coning rules to best reflectthe marginal costs of additional tests in public hospital settings. Cost recovery levels would be considered at efficientcosts of supply only.
• SA Pathology to make subsequent price revisions as a result of increased efficiency.
Benefits summary
• Financial: Increased cost recovery of performed work.
• Operational: Improved clarity of costs and profitability. Improved pricing signals to guide SA Pathology’s investmentdecisions and customers’ demand decisions.
Implementation considerations and risks
• Will require investment financial and commercial visibility to determine appropriate costs per tests.
• Broader stakeholder support may be limited given increased charges. This will require close partnership working.
Impact summary
Total financial impact
• $6.2-7.7m (revenue) andtranslates 100% intoEBIT savings.
Timeline for realisation
• FY19: $0.0-0.0m
• FY20: $0.0-0.0m
• FY21: $1.9-2.5m
• FY22: $6.2-7.7m full runrate.
Investment required
• Medium
• Est. implementation cost- $0.4m for consultancyhelp with pricing modelsand implementationplanning.
• Linkage to investment inopportunity BM3.
Implementation ease
• Low
Risk rating
• High
• Broader stakeholdersupport.

Competitiveness of SA Pathology in a contestable market - final report 104
Appendix 1. Improvement opportunitiesR4: Update pricing to be cost-reflective of effort for testing activities
R4 Move to cost-reflective pricing (at efficient costs of supply rather than current costs) for public and commercial work.
Supporting analysis
Estimated shortfall prior to overheads but adjusted Benefits realised ($000s)for missing revenue in appropriations and PBRC By Directorate ($m)
• AP – does not receive samples from collection centres. Undertakes limited private work, teaching and research. Improving costing can result in up to70% of the shortfall recovered. For the purposes of this analysis, we will conservatively estimate that 25-30% will be realised in FY21.
• Haematology – undertakes private work and limited teaching. Improving costing can result in up to 50% of the shortfall recovered. For the purposes ofthis analysis, we will conservatively estimate that 15-20% will be realised in FY20.
• Regional – undertakes private work, however does not do any research or teaching. Improving costing can result in up to 70% of the shortfall recovered.For the purposes of this analysis, we will conservatively estimate that 25-30% will be realised in FY20.
• Immunology – undertakes some private work, research and training. Improving costing can result in up to 50% of the shortfall recovered. For thepurposes of this analysis, we will conservatively estimate that 15-20% will be realised in FY20.
• Microbiology, GMP, Chemical Pathology and Automated – no change to pricing.
-17.6
-0.9
7.35.02.45.16.7
21.8
Auto
mate
d
GM
P
Mic
robio
logy
Chem
ical
Path
olo
gy
Haem
ato
logy
AP
Imm
unolo
gy
Regio
nal
To
tal F
Y21
7,655
6,244
FY
21
5,207
1,905
Prio
r year
repeat
benefit
0
0
2,447
Prio
r year
repeat
benefit
1,905
2,447
1,9050
04,339
To
tal F
Y20
FY
20
FY
19
2,447
min
max

Competitiveness of SA Pathology in a contestable market - final report 105
Appendix 1. Improvement opportunitiesR5: Review commercial arrangements for university teaching and registrar training
R5 Review commercial arrangements for university teaching and registrar training.
Overview
Current state
• SA Pathology employees undertake teaching at universities but do not charge for this services.
• SA Pathology is the only provider in SA that provides training for registrars. This often results in pathologists moving tothe private sector after being trained by SA Pathology.
• Based on the SA Pathology staff survey, SA Pathology’s training cost is $3.2m and represents 22.8 FTEs. Feedback from SAPathology indicate that this cost may be significantly understated.
Future state
• Establish a more equitable approach with universities that seeks reimbursement for clinical time spent teaching andtraining. This would involve obtaining funding from appropriate sources.
• Training arrangements to incorporate SA Pathology having the first option to offer employment to registrars followingcompletion of training. Where registrars are offered employment with SA Pathology, but decline the offer to take upemployment with a private pathology provider within the following 2 years, SA Pathology would be appropriatelyreimbursed by the new employer for a pre-determined contribution towards training costs.
Benefits summary
• Financial: Recovery of costs associated with teaching and training and a reduction in FTEs following the cessation ofunfunded training activities.
Implementation considerations and risks
• Significant consultation required with key stakeholders given that this represents a change from existing approaches andis likely to require negotiation. It will be important that long-term beneficial relationships with universities aremaintained.
• Any reduction in existing training for students and registrars would likely raise strong stakeholder concerns.
• IR and union risks associated with any associated FTE reductions.
Impact summary
Total financial impact
• $2.5-3.2m (revenue) andtranslates 100% intoEBIT savings as the costto deliver this revenuehas already beenincurred.
Timeline for realisation
• FY19: $0.0-0.0m
• FY20: $1.3-1.6m
• FY21: $2.5-3.2m
• FY22: $2.5-3.2m full runrate.(a)
Investment required
• Low
• Est. implementation cost- $0.0.
Implementation ease
• Low
Risk rating
• High
• Broader stakeholdersupport.
Notes: (a) full run rate is estimated based on results of the Staff Survey

Competitiveness of SA Pathology in a contestable market - final report 106
Appendix 1. Improvement opportunitiesR6a: Increase private sector market share and revenue
R6a Increase revenue through increasing market share in the private sector for existing tests.
Overview
Current state
• SA Pathology performs some testing for interstate and international customers where SA Pathology’s expertise andcredentials are well recognised.
• Broader commercial income is derived from the Immunology Directorate which develops intellectual property that is oftensold to third parties.
• These additional revenue sources help to offset SA Pathology’s broader costs.
Future state
• Identify and target profitable community work, increasing SA Pathology’s market share for existing tests.
• Strengthening existing relationships with interstate and international partners to increase referrals for profitable tests.
• Ensure all services are performed profitably with an appropriate pricing model.
Benefits summary
• Financial: Increased revenue streams supporting long-term sustainability.
• Operational: Staff and laboratories remain more highly utilised, improved relationships with interstate/internationalproviders and opportunity to capture learnings from increased testing volumes in specialised areas.
Implementation considerations and risks
• Ensure appropriate activities do not constrain SA Pathology’s core purpose and market, and that operationalarrangements are not impacted.
• Ensure capacity exists within relevant areas to service demand.
• Will require a clear commercial strategy.
Impact summary
Total financial impact
• $0.6-1.1m (a) (EBITsaving).
• This is a rough estimateand additional analysisshould be undertaken.
• This assumes a 20% EBITmargin.
Timeline for realisation
• FY19: $0.0-0.0m
• FY20: $0.5-1.0m
• FY21: $1.4-2.8m
• FY22: $2.8-5.6m (b)
Investment required
• Low
• Est. implementation cost- $0.3m to supportmarketing activities.
• Requires a robustcommercial strategy.
Implementation ease
• High
Risk rating
• Low
(a) SA Pathology has approximately 30% of the private sector market share and generates from it over $40m in revenue, which represents a $1.4m of revenue per 1% of market share. Assuming SA Pathology can increase market share by 1-2% generates the estimated benefits in FY21 and 2-4% the estimated benefit in FY22; (b) estimate full run rate.

Competitiveness of SA Pathology in a contestable market - final report 107
Appendix 1. Improvement opportunitiesR6b: Expand network of profitable collection centres
R6b Increase revenue by opening new collection centres where analysis indicates likely profitability.
Overview
Current state
• As per opportunity C2, profitable collection centres can realise a financial benefit of $0.5-0.6m each. This is in part due tothe fact that these tests are typically high volume simple tests. The majority of those tests are performed by the AutomatedDirectorate, which remains the only Directorate with positive cost recovery after overheads allocation.
Future state
• Expand the network of profitable collection centres using demographic analysis to support locations that are likely tosupport long-term profitability.
Benefits summary
• Financial: Increase in profitable activity. The benefits of this opportunity are based on opening 2 to 3 profitable collectioncentres in FY20 and an additional three in FY21.
• Operational: Increased volume of testing supporting investment in new equipment as appropriate.
Implementation considerations and risks
• Will require detailed costing analysis on existing activities to inform identification of profitable locations. This will need tobe supported with commercial planning activities.
• Significant fixed cost to establish infrastructure for new collection centres.
• Financial risk if collection centres profitability is not achieved.
Impact summary
Total financial impact
• $0.25-0.3m (a) (EBITsaving) assuming a 10%EBIT margin.
Timeline for realisation
• FY19: $0.0-0.0m
• FY20: $0.5-1.0m
• FY21: $1.0-2.0m
• FY22: $2.5-3.0m full runrate.(a)
Investment required
• Medium
• Est. implementation cost- $0.5m.(b)
Implementation ease
• High
Risk rating
• Low
• Risk of sunk financialinvestment.
Notes: (a) benefits have been estimated based on the profitability model and other average profitable centres run by SA Pathology. It’s assumed that 5-6 new profitable collection centres will be opened by FY22 of which 1-2 are opened in FY20, 2-4 are opened in FY21 (b) Costs of FTEs to staff the centres is included in the margin.

Competitiveness of SA Pathology in a contestable market - final report 108
Appendix 1. Improvement opportunitiesR7: Expand test capability and target high demand emerging markets
R7 Increase revenue by expanding test capability and targeting high demand emerging markets not currently served.
Overview
Current state
• SA Pathology has traditionally focused on the delivery of public pathology requirements within South Australia. As such,limited work has been performed to consider expansion into new markets.
• Past efforts to expand services have typically been tactical and uncoordinated, and largely influenced by the capability,experience and appetite of individual Directorate Managers.
Future state
• A clear and agreed commercial strategy that provides a framework to consider expansion opportunities and articulates anagreed range of potential opportunities areas. This would be informed through consultation with SA Pathology staff andkey external stakeholders. One key opportunity is likely to be increased work for interstate and overseas customers.
• All new commercial activities to be charged on a fee for service basis.
Benefits summary
• Financial: Increased revenue streams supporting long-term sustainability.
• Operational: Staff and laboratories increase their utilisation, broader customer base, opportunity to capture learnings fromincreased testing volumes in specialised areas.
Implementation considerations and risks
• Ensure appropriate activities do not constrain SA Pathology’s core purpose and market, and that operationalarrangements are not impacted.
• Ensure that new services offered to emerging markets do not increase the net cost of pathology services to the system.
• Ensure spare capacity exists within relevant areas to service new demand.
• Will require a clear commercial strategy.
• Accurate identification of benefit realisation will be challenging with a potential need for seed investment.
Impact summary
Total financial impact
• $1.0-3.0m (revenue)
• Assuming a 33% EBITmargin this translates to$0.1-0.3m in EBITsaving.(a)
Timeline for realisation
• FY19: $0.0-0.0m
• FY20: $0.0-0.0m
• FY21: $0.0-0.0m
• FY22: $3.0-9.0m full runrate
Investment required
• High
• Est. implementation cost- $0.5m
• May requirediscretionary investmentin key areas.
Implementation ease
• Medium
• Will require a robustcommercial strategy.
Risk rating
• Low
• Broader stakeholdersupport.
Notes: (a) benefits have been estimated based on prior knowledge of comparable companies and transactions. This is the minimum observed as being obtainable.

Competitiveness of SA Pathology in a contestable market - final report 109
Appendix 1. Improvement opportunitiesR8: Expand commercial testing services and PoCT to new markets / customers
R8Expand commercial testing services and PoCT to new markets / customers. Potential opportunities include SA Ambulance Service, MedSTAR, Royal Flying Doctor Service, correctional services / prisons, emergency services, general practice/medical specialists, Diabetes Australia, sport/athletics clubs, naturopath, ancestry, veterinary and aged care.
Overview
Current state
• SA Pathology currently offers PoCT in limited locations and only in public hospitals. PoCT operations are supported by theSA Pathology lab staff in metro and regional SA.
• As technology advances, PoCT can provide more testing and potentially increase patient access. There is also an appetitefor PoCT in settings outside the public hospital.
• Additionally, volume recording for blood gas devices is inaccurate in SA Pathology’s PoCT operations. SA Pathology billsMedicare for the volume recorded only. Not recording a large portion of the volume can potentially lead to significantunbilled revenue for the services delivered.
Future state
• There are three opportunities that SA Pathology can leverage:
1. SA Pathology can expand the PoCT offering to more LHNs, in an effort to reduce lab opening times and staff callout costs. PoCT could also potentially increase access to testing and replace activities in remote areas.
2. SA Pathology can expand the PoCT offering to include SA Ambulance Service, MedSTAR, correctional services, GPsand aged care facilities. iCCnet currently offers PoCT to GPs in regional SA, and their service is greatly valued. SAPathology can offer a similar service to GPs in metro area.
3. SA Pathology should review blood gas devices across the SA Pathology fleet, primarily at FMC, WCH and Modburyto ensure the volume of testing is accurately recorded and Medicare is correctly billed.
Benefits summary
• Financial: Offering PoCT to new markets will increase the volume of PoCT tests completed thus generating extra revenuefrom Medicare. Additionally, accurately charging Medicare for tests completed will increase revenue.
• Operational: Increased access to pathology services for patients.
• System benefit: iCCnet currently offers PoCT services for regional SA. iCCnet is not accredited and therefore it’s unable tocharge Medicare for completed. If iCCnet was able to leverage SA Pathology’s accreditation then there is an opportunity for$1-.0-3.0m in incremental revenue to SA Health (this would not be received by or benefit SA Pathology).
Implementation considerations and risks
• Appropriate resources are required to manage additional PoCT services, and clinical needs and requirements need to beunderstood and satisfied if PoCT is to be used to augment laboratory services.
• Reduction in onsite laboratory services could be negatively perceived by customers if PoCT is perceived as inferior.
• Non-laboratory staff use and interpret PoCT results with no direct input from pathology staff. This requires strong clinicalgovernance to facilitate an effective and clinically safe PoCT service.
Impact summary
Total financial impact
• $0.3m-$0.5m (20% EBITsaving)
Timeline for realisation
• FY19: $0.0-0.0m
• FY20: $0.0-0.0m
• FY21: $0.8-1.3m
• FY 22: $1.5-2.5m full runrate.(b)
Investment required
• High
• Est. implementation cost- $0.3m.
• Leading edge PoCTrequired and technologyto understand the cost ofeach commercial test so itcan be priced properly –this is included in BM3.
Implementation ease
• Low
• Need the right capabilityand technology.
Risk rating
• High
• NATA accreditation isexpensive.
• LHN expansion willrequire PoCT to besuitable for meetingclinical needs.
Notes: (b) benefits have been estimated based on prior knowledge of comparable companies and transactions. This is the minimum observed as being obtainable.

Competitiveness of SA Pathology in a contestable market - final report 110
Appendix 1. Improvement opportunitiesR9: Receive full funding for all public health work performed
Overview
Current state
• SA Pathology performs a range of public health work such as testing for Salmonella and Ebola. Previously, IMVS used toreceive block-funding for this activity, however SA Pathology does not currently receive specific funding for this work.
• It is estimated that the cost of public health work undertaken by SA Pathology is as follows:
─ Microbiology: Approximately $3.0m for managing outbreaks, for reference / typing work and maintaining a PC3 lab.
─ AP: Approximately $1.5m for bone and tissue banks and statewide perinatal / pediatric autopsy service biopsies.
─ Hematology: Approximately $1.5m for some blood bank services and inventory management to fractionated products distribution and reference / typing work.
─ GMP: approximately $1.5m for newborn screening activities.
• The frequency and volume of public health work varies, however in FY17 the Microbiology Directorate undertook 10,350public health tests at an estimated at a cost of $1.8m. This is in addition to typing and reference work and the cost ofmaintaining a PC3 lab.
• This is a high level estimate and detailed analysis is required.
Future state
• All public health work undertaken is specifically funded or priced such that costs are fully recovered.
Benefits summary
• Financial: Full recovery of delivery costs. This is not a benefit to the system as a whole but will help more accuratelyaccount for SA Pathology’s services delivered, and facilitate more efficient management.
• Operational: Improved transparency and service delivery.
Implementation considerations and risks
• Will require detailed cost analysis of public health activities performed.
R9 Ensure the full cost of public health work is recovered through an appropriate funding regime.
Impact summary
Total financial impact
• $7.5m (Revenue)
• As the work undertakenis already paid for thistranslated 100% throughto EBIT savings.
Timeline for realisation
• FY19: $0.0-0.0m
• FY20: $7.5-7.5m
• FY21: $7.5-7.5m
• FY22: $7.5-7.5m
Investment required
• Low
• Est. implementation cost– $0m.
• Need to be able tounderstand the actualcost for each activity butthis is covered underBM3.
Implementation ease
• Medium
Risk rating
• Low

Competitiveness of SA Pathology in a contestable market - final report 111
Appendix 1. Improvement opportunitiesR10: Receive full funding for all approved research undertaken
Overview
Current state
• SA Pathology performs a range of approved research. The Employment Agreement (EA) for medical officers includes aspecific number of research hours.
• The approved research currently undertaken is operationally funded.
• Research activity is currently self reported through a staff survey. The recent staff survey estimated the research activityundertaken to be work $3.2m. This is believed to be an understatement of the actual research activity undertaken.
Future state
• All approved research undertaken is fully funded through an appropriate funding regime that is fully cost recovery.
• Improvement opportunities BM3 and C8 will ensure that research is properly measured and managed.
Benefits summary
• Financial: Full recovery of approved research costs. This is not a benefit to the system as a whole but will help moreaccurately accounting for SA Pathology’s activities undertaken, and facilitate more efficient management.
• Operational: Improved transparency and service delivery.
Implementation considerations and risks
• Will require detailed cost analysis of performed approved research.
R10 Ensure the full cost of approved research is recovered through an appropriate funding regime.
Impact summary
Total financial impact
• $3.1m (Revenue)
• As the work undertakenis already paid for thistranslated 100% throughto EBIT savings.
Timeline for realisation
• FY19: $0.0-0.0m
• FY20: $3.1-3.1m
• FY21: $3.1-3.1m
• FY22: $3.1-3.1m
Investment required
• Low
• Est. implementation cost– $0m.
• Need to be able tounderstand the actualcost for approvedresearch activity but thisis covered under BM3and C8.
Implementation ease
• Medium
Risk rating
• Low

Competitiveness of SA Pathology in a contestable market - final report 112
Appendix 1. Improvement opportunitiesBM1: Improve customer experience
BM1 Develop a consolidated approach to improving customer experience and satisfaction.
Overview
Current state
• Customer feedback on SA Pathology performance is variable with some customers seeking improved performance. Servicelevel agreements (SLAs) are underdeveloped and not used to manage performance.
• Call centres are located within the Automated Directorate, rather than more customer-facing Directorates such as PatientServices or Customer Services.
• Technology platforms and processes are not in place to measure and manage customer satisfaction, and customersatisfaction data collection is limited to periodic surveys of patients visiting collection centres.
Future state
• Develop a consolidated approach to understand customer needs and manage customer satisfaction levels.
• Consult with customers to identify current performance issues and develop appropriate approaches to resolve them.
• Run Customer Satisfaction or Feedback surveys (such as net promoters scores) to provide clear understanding and insightinto LHNs’, clinicians’ and patients’ satisfaction levels. Use surveys to identify issues and appropriate mitigationopportunities.
• Align service offerings to customers’ needs and their perceptions of the clinical value of pathology services.
• Establish SLAs with customers and implement processes to manage to KPIs to ensure targets are adhered to.
• Invest in customer relationship management (CRM) technologies to increase customer experience and enhance customerloyalty.
Benefits summary
• Financial: Increased likelihood of customer retention resulting in increased recurrent revenue streams.
• Operational: Highly satisfied customers that are unlikely to switch to competitors even if they are offered the choice. Earlyidentification and mitigation of any customer issues manifest.
Implementation considerations and risks
• Potential need for technology investment.
Impact summary
Total financial impact
• Not applicable (N/A).
Timeline for realisation
• FY19: N/A
• FY20: N/A
• FY 21: N/A
• FY22: N/A
Investment required
• Medium
• Potential technologyinvestment, of up to $2mfor a full CRM system
• Some investment may berequired for capacity inthis area.
Implementation ease
• High
• Will require a supportshift in operating cultureand capability.
Risk rating
• Low

Competitiveness of SA Pathology in a contestable market - final report 113
Appendix 1. Improvement opportunitiesBM2: Implement a strategic and annual business planning regime
BM2 Develop a strategic and annual business planning regime to support business clarity, accountability and reporting.
Overview
Current state
• SA Pathology operates without a defined and articulated strategic direction that is reflected in an endorsed planningdocument. This means the organisation’s vision and key priorities are unclear and cannot guide activities.
• SA Pathology also operates without a formal annual planning cycle. As a result, there is an absence of an articulated andendorsed yearly plan from which tactical decisions can be made. Whilst Directorates currently have operational plans,these have been prepared on an exception basis, are historically focused (i.e. an analysis of past performance) and arestrictly operational.
• Budgets are largely determined based on the existing prior year budget with minor amendments made by SA Health toensure compliance with Treasury parameters. Budget files are reviewed by Finance and Directorate Managers for eachDirectorate without a robust process to limit budgets to an overall funding constraint and organisational priorities. Filesare then submitted to the Department. The Health Performance Agreement outlines the available budget each year and SAPathology is required to balance to this amount with limited ability to challenge once finalised. As a result, importantdialogue, debate and challenge around operational and strategic priorities with key decision makers does not occur.
Future state
• Agreed strategic priorities and organisational trajectory summarised in a three year strategy that reflects the externalenvironment, internal performance pressures and key objectives around customers and patients. This to be underpinnedby an annual planning cycle that includes:
• A summary annual planning document that sets out the key objectives for SA Pathology in the year ahead.
• Detailed Directorate annual plans that align to the annual planning document, and translate organisationalobjectives to Directorate performance targets.
• An aligned budgeting and financial planning process.
• An agreed performance reporting regime supporting governance and progress reporting against the plan.
Benefits summary
• Operational: Increased potential to support improved business management, through greater clarity on SA Pathology’soverall direction and key objectives. This opportunity would support more efficient operations through creating clarity fordecision making and investment. It would also provide improved clarity on performance through better reporting.
Implementation considerations and risks
• Establishment and management of the planning process may require some initial support to ensure alignment.
• Development of an appropriate performance reporting regime is likely to require some assistance.
Impact summary
Total financial impact
• Not applicable (N/A).
Timeline for realisation
• FY19: N/A
• FY20: N/A
• FY 21: N/A
• FY22: N/A
Investment required
• Low
• Est. implementation cost– $0.2m advisorysupport cost.
Implementation ease
• High
Risk rating
• Low

Competitiveness of SA Pathology in a contestable market - final report 114
Appendix 1. Improvement opportunitiesBM3: Invest in systems to support improved commercial and operational decision making
BM3 Improve systems to support improved commercial decision making and ongoing operational insight.
Overview
Current state
• At present, SA Pathology operates with limited commercial and financial information:
• Key metrics such as cost per test are unknown.
• Profitability per test is unknown.
• Reporting capacity is limited meaning that staff do not have timely access to relevant data or accurate and completevisibility around performance.
• Current financial systems cannot report real-time performance across each site, asset and employee. This makes it difficultfor Directorate Managers to drive performance improvements and realise efficiencies. Some incompatible systems preventtesting activities being linked to revenues, restricting profitability analysis of services, customer groups, LHNs or hospitals.
• Collectively, these commercial and operational issues limit the ability of staff to make appropriate and informed decisions.
Future state
• Fully connected financial and operational systems supporting accountability, management and reporting.
• Reporting provides real-time accurate data on performance of specific test groups, assets, FTEs, locations andDirectorates. Managers are able to compare specific machines’ utilisation and performance on a daily basis.
• The finance function can access fully-connected real-time data and predictive analytics which supports DirectorateManagers to anticipate or intervene early to resolve operational issues before they impact business and patient outcomes.
• Consistent monthly reporting templates and dashboards for each Directorate to ensure comparability.
• Transparency of Directorates’ performance across the organisation.
• Increased accountability for Directorate/Business Managers through the development and monitoring of KPIs.
Benefits summary
• Financial: Improved ability for the business to undertake more commercial and informed decision making which willresulting in better efficiency and financial management.
• Analytics: Advanced analytics can predict and avoid business issues, or intervene early before issues have significantconsequences for customers or SA Pathology.
Implementation considerations and risks
• Likely to require significant technology and broader investment.
• Will need to be supported with investment in capability development (BM4).
• Will need to be support by broader change management to ensure staff buy-in.
Impact summary
Total financial impact
• Not applicable (N/A)
Timeline for realisation
• FY19: N/A
• FY20: N/A
• FY 21: N/A
• FY22: N/A
Investment required
• High
• Need to right technology
• Est. implementation cost– $3.0-5.0m for systemdesign andimplementation anddeployment.
• Est. implementation cost- $0.5m for training forFTEs on new systems.
Implementation ease
• Low
• Need to shift culture andmindset.
• Need the right capability.
Risk rating
• High
• Difficult to implementcorrectly.

Competitiveness of SA Pathology in a contestable market - final report 115
Appendix 1. Improvement opportunitiesBM4: Upskill financial and commercial capability
BM4Raise financial and commercial capability and understanding within SA Pathology to support better decision making. This will involve facilitating improvements in financial reporting, data, analytics and business insights.
Overview
Current state
• Levels of financial and commercial understanding across SA Pathology appear to be variable. Directorate Managers do nothave confidence in current financial reporting which impairs their effective decision making.
• An absence of standardised budgeting, business planning and reporting has enabled differences in reporting metrics andformats for each Directorate.
Future state
• Collective capability of Directorate Managers, Business Managers and the Finance function has been invested in,empowering them to play a more a direct commercial role.
• Directorate Managers and staff trust and value data from the centralised finance function as the single source of truthacross the organisation, drawing on this information as accurate and reliable for the decisions they need to make.
• SA Pathology can interpret and utilise timely information and standardised reporting to manage financial and commercialperformance.
• Streamlined and cost effective financial and operational management processes ensure tasks are performed in a timely andcost effective manner.
Benefits summary
• Financial: Improved ability for the business to undertake more commercial and informed decision making which willresult in better efficiency and financial management.
• Operational: More efficient processes, ability to use data appropriately and drive decision making.
Implementation considerations and risks
• Will need to be supported with investment in financial and operational systems (BM3).
Impact summary
Total financial impact
• Not applicable (N/A)
Timeline for realisation
• FY19: N/A
• FY20: N/A
• FY 21: N/A
• FY22: N/A
Investment required
• Low
Implementation ease
• Low
• Employee developmentand training.
• Whole of organisationcultural shift.
Risk rating
• High
• Need external supportand training.
• High investment intraining, developmentand technology.

Appendix 2. Benchmarking approach and analysis
116

Competitiveness of SA Pathology in a contestable market - final report 117
Appendix 2. Benchmarking approach and detailed analysisKey considerations in determining the approach to benchmarking
The benchmarking approach was selected to balance the insights required with the associated challenges and lessons learnt from previous benchmarking exercises
What is the purpose of benchmarking in relation to the contestability workstream?
The purpose of benchmarking is to support an understanding of SA Pathology’s performance and to inform and support the development and testing of improvement opportunities. In this context, benchmarking should be considered as one of many analysis inputs, rather than an output in and of itself.
Previous and current benchmarking activities
● Prior benchmarking - through Paxton Partners and the Efficiency Improvement Program (EIP), which utilised an aggregate UK dataset which was notmade available to SA Pathology and was challenged by staff and stakeholders.
● Current benchmarking - through the Quad State Group, which began in 2016 and recently agreed on benchmarks for the first service discipline withinAnatomical Pathology. This will shortly be followed by disciplines in Microbiology and then core labs (Chemical Pathology, Transfusion, Haematology andAuto-Immunology). The Quad State Group is benchmarking SA Pathology’s productivity per FTE by Directorate against other state Government providersin NSW, QLD, WA and partly VIC.
Challenges of benchmarking
● Staff alignment - lessons learned from the prior EIP benchmarking exercise show the importance of ensuring staff have a clear and shared understandingof what benchmarking aims to achieve, what it is intended to be used for and how much reliance can be placed on benchmarking alone.
● Data accessibility -
○ Private data: in the absence of a formal market testing process, private providers are unlikely to share information with competitors and there islittle publicly available data on their performance in Australia.
○ Public data: Public provider performance data is potentially more accessible, but agreement to collect and share consistent data is likely to betime consuming. The Quad State Group benchmarking process was developed on the basis that data would not be shared outside of the localexecutive group or to external parties.
● Data quality and transparency - drawing on lessons learned from the EIP benchmarking exercise, SA Pathology has undertaken to share anybenchmarking data with staff and unions, where possible, including how the raw data has been adjusted and presented to ensure a ‘like for like’comparison. This may limit the appetite for other providers to share their data given that it may be circulated more broadly.
● Credible alternatives - benchmarking analysis is likely to be most meaningful where SA Pathology can compare its performance to potential private sectorcompetitors who may enter the SA public sector pathology market. Whilst benchmarking against public sector providers may highlight inefficiencies, it isless useful in identifying where competitive pressures would be mostly keenly felt.

Competitiveness of SA Pathology in a contestable market - final report 118
Appendix 2. Benchmarking approach and detailed analysisSummary of benchmarking approaches
A range of approaches to benchmarking were investigated. These include internal benchmarking, benchmarking against agreed competitors and benchmarking against external functions. Option 1 was completed and used to inform improvement opportunities. Option 2 was completed due to stakeholder interest, but the results are of limited value due to data constraints.Data was not available to complete Options 3 or 4.
Benchmarking type Overview Application – benchmarking options
Internal benchmarking
A comparison of performance across different sites/labs within each Directorate and over time inside the organisation to identify efficiencies and share best internal processes.
Option 1: Comparison of internal SA Pathology labs by discipline and Directorate from data provided by SA Pathology.
• Supports performance comparison and analysis of services providedat multiple SA Pathology labs.
• Supports internal trend analysis.
• Analysis used to build on insights from interviews with staff,stakeholders and customers to test opportunities identified.
Competitive benchmarking
A direct competitor comparison of a product, service, process, method, lab or division. Would provide more meaningful analysis with regards to SA Pathology’s position against the wider market (public and private).
Option 2: Comparison of available data on pathology costs to SA hospitals from the Independent Hospital Pricing Authority.
Option 3: Comparison of cost data against that of other State Government pathology providers.
Option 4: Comparison against qualitative data from public hospitals on outsourced pathology services - to the extent that this is available.
Functional benchmarking
Comparison of non-clinical functions such as procurement, couriers and overheads with wider industries.
Comparison of SA Pathology with best practices of other sectors. Benchmarking unlikely to reflect sector nuances and also likely to be of limited use to the process of wider opportunities development.

Competitiveness of SA Pathology in a contestable market - final report 119
Appendix 2. Benchmarking approach and detailed analysisInternal benchmarking - Option 1: Internal analysis and insights from engagements
This analysis internally compares performance of the same services provided at multiple SA Pathology labs, as well as Directorate performance over time. Comparison is therefore against internal best practice. This analysis has been completed and shared with SA Pathology employees
The benchmarking data includes:
● Performance comparison (cost, revenue, FTEs, activity, KPIs) of services provided at multiple SA Pathology labs.● 5 year trend analysis on the activity, cost and revenue drivers by Directorate.● Investigation of insights from trends and utilisation to generate and validate improvement opportunities.● Qualitative insights.
Performance comparisons of services is limited as not all services are performed at multiple labs but where services were performed at multiple locations, a comparison was undertaken.
This data was accessed through SA Pathology’s financial and information management systems (General Ledger and ULTRA) and from interviews with staff, stakeholders and customers. Data was refined with Directorate Managers and the resulting financial baseline data was made available.
Advantages Disadvantages
● Easily accessible.
● Greater staff involvement in benchmarking of data.
● Comparable across Directorates.
● Easily identify areas of significant spend.
● Consistent approach to the provision of data.
● Multiple years of data, allowing for trend analysis.
● Includes both quantitative and qualitative data.
● Identifies internal best practice.
● Data quality is a concern, resulting in the need for extensivedata cleansing required (note: common issue for all options).
● Not comparable across states/territories or other providers.
● Comparisons are limited as not all services are performed atmultiple labs and this will not provide a true understanding ofoverall organisational efficiency.
● Data baseline may be difficult to establish.
Analysis was completed and informed the analysis of improvement opportunities.

Competitiveness of SA Pathology in a contestable market - final report 120
Appendix 2. Benchmarking approach and detailed analysisCompetitive benchmarking - Option 2: Independent Hospital Pricing Authority (IHPA) data
This data provides high level information on the relative costs of providing pathology services in public hospitals across different Australian states.
Analysis of the publicly available IHPA data is presented in the following pages as staff and stakeholders expressed strong interest in this data. However the available data was not sufficiently granular to inform analysis of performance or to identify improvement opportunities. A lack of transparency in the cost inputs used to compile the data further limits its reliability in assessing the relative efficiency of different states.
Data was accessed online through the public IHPA website. Access to the IHPA portal via SA Health was not provided, which made some analysis not possible to be undertaken. The available benchmarking data included:
● Pathology cost per separation by acute admitted, subacute admitted, not-admitted and emergency departments across states.● Pathology cost per separation growth rate across states.● Pathology’s share of hospital costs per separation across states.● National Efficient Price.● Total number of pathology items (and cost) ordered per DRG across interstate hospital sites.
Advantages Disadvantages
● Easily accessible with some data public and otheraccessible after permission.
● Comparable across all states/territories.
● Consistent approach to the provision of data.
● Multiple data rounds (years), allowing for trend analysis.
● Limited information on what is driving performance levels.
● Does not consider causality or broader factors that may be influencingdata.
● Lack of transparency on what comprises the costs.
● Data is not broken down to a Directorate level.
● Does not reflect the different model of care across states, e.g. differentuse of pathology or nursing for treating a patient in some states.
● Does not consider the quality of the service.
● Represents only public hospitals.
● Permission was not granted for accessing more granular data which isnot publicly available.
Analysis completed using publicly available data but was not sufficiently reliable to inform analysis of improvement opportunities.

FY16 average cost per separation ($)
FY14-FY16 growth rate (%)
SA average cost per separation ($)
Comments
Acu
te a
dm
itte
d • SA average cost in FY16 per separation was $148 compared to $165nationally.
• SA dropped below the national average cost between FY13 and FY16,in part by SA reducing average cost from $152 in FY15 to $148 inFY16 and in part because the national average has increased from$129 to $165.
Em
erg
ency
D
epa
rtm
ent
(ED
)
• In FY16, SA’s average pathology cost per separation in EDs was $64compared to a national average of $41. However, the rate of growthis below national average.
• Pathology cost per separation for ED is growing overall.
No
n-a
dm
itte
d • In FY16, SA’s average pathology cost per separation was $13compared to $10 for the average national cost. This is a consistenttrend from FY15 where SA was $3 above average.
• The national average pathology cost for non-admitted has beendriven lower mainly by NSW which in FY16 had average pathologycosts of only $5 per separation.
Ad
mit
ted
su
ba
cute
• In FY16, SA average pathology cost for subacute admitted cost was$114 per separation compared to $157 average nationally.
• This was a result of a trend which saw SA moving from double theaverage to being 72% of the national average in FY16.
148
NationalSA
165 11.9%
SA
0.8%
National
64
41
SA National
6.8%
NationalSA
14.0%
10
SA
13
National National
3.1%
SA
2.9%
114
National
157
SA
SA
1.1%
-20.1%
National
Comparison against IHPA data indicates SA Pathology performed better than the average national cost per separation for acute and subacute admitted services, but worse than the average national cost per separation for ED and non-admitted. Limited availability of more granular data and a lack of transparency on input costs constrains the utility of this data
152146144148
132131
165
129
FY15(Rn 19)
FY16(Rn 20)
FY14(Rn 18)
FY13(Rn 17)
64565659
41
36
3133
FY16(Rn 20)
FY15(Rn 19)
FY13(Rn 17)
FY14(Rn 18)
178
336
114112
157138153169
FY16(Rn 20)
FY15(Rn 19)
FY14(Rn 18)
FY13(Rn 17)
1312
1012
10
FY15(Rn 19)
9
FY16(Rn 20)
FY14(Rn 18)
FY13(Rn 17)
Appendix 2. Benchmarking approach and detailed analysisPublic pathology provider comparison summary
National SASource: NHCDC Round 17 to 20, IHPA
Competitiveness of SA Pathology in a contestable market - final report 121

Competitiveness of SA Pathology in a contestable market - final report 122
Appendix 2. Benchmarking approach and detailed analysisAcute admitted average pathology cost across states
In the acute admitted category, SA performed as well as QLD with the second lowest cost per separation
Acute admitted average pathology cost per separation as % of totalFY16 (Round 20) (%)
Acute admitted average pathology cost per separation growth rateFY14-FY16 (Round 18 – Round 20) (%)
Acute admitted average pathology cost per separation
FY16 (Round 20) ($)
SA acute admitted average pathology cost per separation FY12 - FY16 (Round 16-Round 20) ($)
Observations
● In FY16 SA was slightly below the national average for acute admittedaverage cost per separation.
● In FY13 SA average cost per separation for acute admitted was slightlyabove national average. This trend was revered from FY16 onwards withSA decreasing it’s average cost per separation and the Nation averageincreasing.
● Compared to the other large states QLD, NSW and VIC, SA is either in lineor better in terms of average cost per separation.
● From FY14 to FY16 the average pathology per separation for admittedacute episodes has been growing at 0.8% in SA compared to 11.9%nationally or 12.6% in NSW.
● WA has a relatively low Pathology test per separation, which is declining.WA, TAS and ACT are all achieving a decrease in average cost perseparation.
● When looking at pathology costs as a % of total hospital costs for admittedacute patients SA is 2.3% which is lower than national average of 3.2%.
202212
108
169194
TASWASA NT
National:165
151
ACT
148148
QLDVICNSW
-18.7%
11.2%
-3.2%-4.8%
0.8%
32.8%
12.6%
SA TASQLD
8.3%
VICNSW ACTNTWA
3.1%
3.9%3.8%
1.7%
3.8%3.6%
2.3%3.0%
WASA ACTTAS
National:3.2%
NTVICNSW QLD
Source: NHCDC Cost report, Admitted acute cost category, appendix 7
152146144
148129132131
165
94
FY12(Rn 16)
FY13(Rn 17)
FY14(Rn 18)
FY16(Rn 20)
FY15(Rn 19)
SA
National

Competitiveness of SA Pathology in a contestable market - final report 123
Appendix 2. Benchmarking approach and detailed analysisSubacute admitted average pathology cost across states
In the subacute admitted category, SA had the lowest cost per separation
Subacute admitted average pathology cost per separation as % of totalFY16 (Round 20) (%)
Subacute admitted average pathology cost per separation growth rateFY14-FY16 (Round 18 – Round 20) (%)
Subacute admitted average pathology cost per separation
FY16 (Round 20) ($)
SA subacute admitted average pathology cost per separation FY12 - FY16 (Round 16-Round 20) ($)
Observations
● In FY16, SA was below the national average pathology cost per separationfor admitted subacute.
● In FY13, SA was significantly higher than the national average, however SAhas been achieving declines in its pathology cost for subacute admitted.The decline from FY14 to FY16 was over 20% p.a.
● SA reduced it’s subacute admitted costs from FY13 to below average in F15for the first time and then further increased the gap below average in FY16.
192142
208165161
SAQLD NTTAS ACT
366
114
WA
National:157
VIC
137
NSW
-13.9%
-4.7%-9.6%
3.8%
-20.1%
13.1%
-1.9%
5.3%
NTTAS ACTQLDVICNSW SA WA
1.2%1.1%
0.8%
1.3%1.1%
0.9%
ACT
National:1.1%
NTSA TASWANSW
1.0%
VIC QLD
1.0%
Source: NHCDC Cost report, Admitted subacute cost category, appendix 7
112178
336
114138153169
157
100
FY15(Rn 19)
FY14(Rn 18)
FY16(Rn 20)
FY12(Rn 16)
FY13(Rn 17)
National
SA

Competitiveness of SA Pathology in a contestable market - final report 124
Appendix 2. Benchmarking approach and detailed analysisEmergency Department (ED) average pathology cost across states
In the Emergency Department category, SA had the highest cost per separation
ED average pathology cost per separation as % of totalFY16 (Round 20) (%)
ED average pathology cost per separation growth rateFY14-FY16 (Round 18 – Round 20) (%)
ED average pathology cost per separation
FY16 (Round 20) ($)
SA ED average pathology cost per separation FY12 - FY16 (Round 16-Round 20) ($)
Observations
● SA is above the national average for Emergency Department pathologycost per separation in FY16.
● From FY13 onwards SA has always been above average in pathology costper separation by approximately $20-25 per separation, representing a58% premium in FT16.
● From FY14 to FY16 the average pathology cost per separation forEmergency Departments has been growing at 6.8% in SA compared to14.0% nationally.
● TAS and WA have relatively low pathology cost per separation compared tothe larger states.
● When looking at pathology cost as a % of total Emergency Department costSA is at 9.8% which is higher than national average of 6.3%. NSW isrelatively high as well at 8.5%.
50
1823
55
TAS
44
WASA
29
VIC
33
64
QLDNSW ACT
National:41
NT
56.4%
-1.2%
10.4%
34.0%
6.8%9.8%6.0%15.8%
ACTNSW QLDVIC NTTASWASA
6.0%6.9%
2.7%
8.5%9.8%
National:6.3%
ACTNTNSW
3.0%
TAS
4.4%
VIC
5.7%
QLD WASA
Source: NHCDC Cost report, ED cost category, appendix 7
56565964
41
36313325
FY13(Rn 17)
FY12(Rn 16)
FY16(Rn 20)
FY15(Rn 19)
FY14(Rn 18)
SA
National

Competitiveness of SA Pathology in a contestable market - final report 125
Appendix 2. Benchmarking approach and detailed analysisNon-admitted average pathology cost across states
In the non-admitted category, SA costs for pathology were slightly above national average
Non-admitted average pathology cost per separation as % of totalFY16 (Round 20) (%)
Non-admitted average pathology cost per separation growth rateFY14-FY16 (Round 18 – Round 20) (%)
Non-admitted average pathology cost per separation
FY16 (Round 20) ($)
SA non-admitted average pathology cost per separation FY12 - FY16 (Round 16-Round 20) ($)
Observations
● SA is slightly above the national average for pathology cost for non-admitted. However the growth rate is slightly below average. QLD, SA, WAare all at similar levels of average pathology cost for non-admitted. Thenational average is lower mainly influenced by NSW which is at 50% of thenational average.
● Looking through historical data, SA data is not available in FY12, FY13 andFY14. In FY15 and FY16 SA was above the national average by $3.
1015
1215
WA
11
27
NTQLDVIC TAS ACT
National:10
13
SANSW
5
11.8%
21.8%
10.9%
3.0%2.9%8.8%
-15.1%
8.0%
ACTNTTASSANSW WAVIC QLD
3.7%4.4%4.5%
3.4%3.3%
4.7%
TASWA ACT
National:3.4%
NT
3.1%
VIC SANSW QLD
2.5%
Source: NHCDC Cost report, Non-Admitted cost category, appendix 7
13
12
10
12
9 9
FY15(Rn 19)
FY16(Rn 20)
10
FY13(Rn 17)
FY14(Rn 18)
FY12(Rn 16)
National
SA

Appendix 3. FTE classification mapping
126

FTE classification mapping
For the purposes of FTE analysis, staff classifications were grouped into four categories of ‘clinical’, ‘admin and other’, ‘medical scientist’ and ‘technical officer’. The tables below provide a reference for how each classification was grouped for the various directorates. Note that the groups apply to the classifications and their associated levels, (e.g. ASO1, ASO2 …. were grouped as ‘Admin and other’).
All Directorates (except Patient Services)
Staff Groupings Classification
Clinical AHP
Admin and other ASO
Clinical CAMD
Clinical EN
Clinical END
Clinical ENM
Admin and other EXE
Admin and other GFS
Admin and other MAS
Clinical MD0
Clinical MDP
Medical Scientist MES
Admin and other (Operationalfor Automated Laboratories) OPS
Admin and other PO
Clinical RN
Admin and other SAE
Admin and other TA
Technical officer TA
Technical officer TGO
Admin and other TRA
Admin and other WHA
Patient Services
Staff Groupings Classification
Other AHP
Other ASO
Other CAMD
Nurses EN0
Nurses END
Nurses ENM
Other EXE
Other GFS
Other GSC
Other MAS
Other MD0
Other MDP
Other MES
OPS and TGO OPS
Other PO
Nurses RN
Other SAE
Other TA
OPS and TGO TGO
Other TRA
Other WHA
Competitiveness of SA Pathology in a contestable market - final report 127

Appendix 4. Glossary of terms
128

Glossary of terms
Term Meaning
AP Anatomical Pathology
Block-funding Lump sum funding for a specific purpose
Bulk-billThe practice of being paid a scheduled rebate directly by the government rather than billing patients directly
CCB Center for Cancer Biology
Coning rules
Medicare payment rules by which Medicare pays for the three most expensive test items requested in one pathology collection episode only. Any remaining tests are 'coned out' or receive no payment
D&A Depreciation and Amortization
ED Emergency Department
EIP Efficiency Improvement Program
EPAS Enterprise Patient Administration System
EPLIS
Enterprise Pathology Laboratory Information System. A commercial off‐the‐shelf ICT application, comprising software modules known as the Cerner Corporation Pty LtdMillennium Laboratory Information System Suite
FMC Flinders Medical Centre
FTE Full-time equivalent
FY Fiscal Year
GMP Genetics and Molecular Pathology
GPs General Practitioners
ICT Information and Communications Technology
IHPA Independent Hospital Pricing Authority
IT Information Technology
LHN Local Health Network
LIS Laboratory Information System
LMH Lyell McEwin Hospital
MDTs Multi-disciplinary Meetings
Term Meaning
Medicare The federal government health insurance program
MillenniumProprietary brand name for the EPLIS laboratory information system.
PBRC Power Billing and Revenue Collection system
PoCT Point of Care Testing
PQ Pathology Queensland
RAH Royal Adelaide Hospital
Run-rate The extrapolation of financial results into future periods
SLA Service Level Agreement
SPF Specific Purpose Fund
TTR Teaching, training and research
TVSP Targeted Voluntary Separation Package
ULTRAThe legacy laboratory pathology system replaced by EPLIS.Full name - Centricity Cirdan Ultra
WCH Womens and Childrens Health Network
Competitiveness of SA Pathology in a contestable market - final report 129


![Report on interoperability of commercial digital pathology ... · interoperability of commercial digital pathology software is -3116] and the COST Action ... equipped with eight Olympus](https://img.dokumen.tips/doc/110x75/5b01ce967f8b9ab9598cdfaf/report-on-interoperability-of-commercial-digital-pathology-of-commercial-digital.jpg)