Embed Size (px)
Citation preview

−1−
Review of Survey Research Literature on Conducting Surveys on Physicians
May 15, 2008
INTRODUCTION Conducting surveys on physicians and other medical personnel is much different from conducting surveys of the general population. Physicians have demanding work schedules, their time is valuable, and participating in a survey represents a high opportunity cost to them. Furthermore, physicians are frequently approached for surveys, making them more reluctant to participate. They also typically have receptionists or other “gatekeepers” whose job includes protecting the physician from unwanted intrusions on their time. Because of the changing nature of medical practice, physician surveys are more often a type of business establishment survey than a survey of individual elite professionals (Sudman, 1995). Sudman characterized physicians as having demanding work schedules, frequently contacted by researchers, pharmaceuticals and others, and hard to reach directly due to receptionists and other “gatekeepers”. Furthermore, physicians are often members of joint practices or employees of a practice or managed care organization without independent freedom to make decisions about use of their time. Physicians are inundated with what they consider “medical junk mail.” In a letter to The Lancet in 2000, one physician noted that he received approximately 122kg of medical junk mail in one year (Montauk, 2000). To a physician, a survey request may not be considered any different than other requests for his/her time. Not surprisingly then, response rates among physicians average about 10% lower than studies with the general population (Cummings, Savitz, and Konrad 2001). Physicians may find the topic of many physician surveys to be uninteresting. Providing detailed information about practice characteristics may be seen as difficult, time-consuming, and intrusive to many physicians. When confronted with such a survey, many will refuse to respond and others will agree to participate only after multiple persuasion attempts. However, surveys concerning physician attitudes about issues relevant to their practice of medicine can obtain high response rates without any phone follow-up or payment of large monetary incentives.
METHODS We conducted a literature review in 2002 that included publications from 1987-2002. In 2008, we recognized a need to update the literature review with current publications. Furthermore, we found only a couple of studies in 2002 that addressed the use of the Internet as a mode of administration. There is much more information available since 2002 and we wanted to include this valuable information. We decided to update our literature review with publications from 2002-2008. In total, this review includes 136 publications from 1987 to 2008 in scientific
−2−
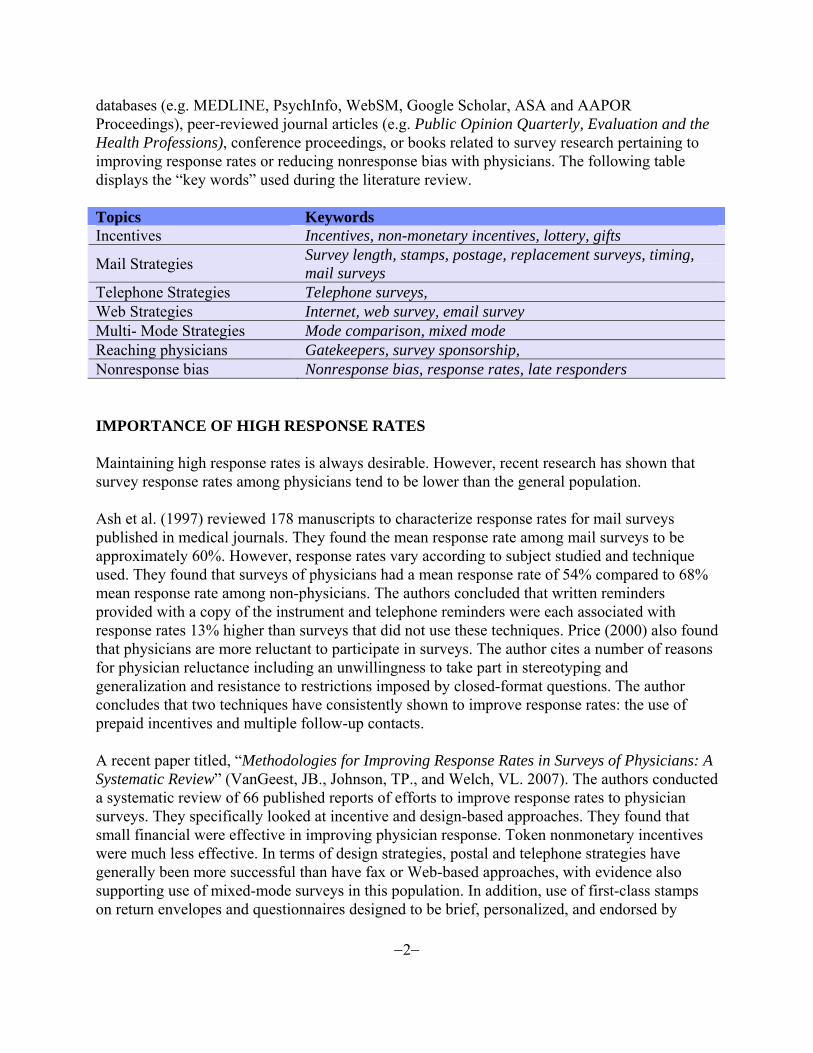
databases (e.g. MEDLINE, PsychInfo, WebSM, Google Scholar, ASA and AAPOR Proceedings), peer-reviewed journal articles (e.g. Public Opinion Quarterly, Evaluation and the Health Professions), conference proceedings, or books related to survey research pertaining to improving response rates or reducing nonresponse bias with physicians. The following table displays the “key words” used during the literature review. Topics Keywords Incentives Incentives, non-monetary incentives, lottery, gifts
Mail Strategies Survey length, stamps, postage, replacement surveys, timing, mail surveys
Telephone Strategies Telephone surveys, Web Strategies Internet, web survey, email survey Multi- Mode Strategies Mode comparison, mixed mode Reaching physicians Gatekeepers, survey sponsorship, Nonresponse bias Nonresponse bias, response rates, late responders
IMPORTANCE OF HIGH RESPONSE RATES Maintaining high response rates is always desirable. However, recent research has shown that survey response rates among physicians tend to be lower than the general population. Ash et al. (1997) reviewed 178 manuscripts to characterize response rates for mail surveys published in medical journals. They found the mean response rate among mail surveys to be approximately 60%. However, response rates vary according to subject studied and technique used. They found that surveys of physicians had a mean response rate of 54% compared to 68% mean response rate among non-physicians. The authors concluded that written reminders provided with a copy of the instrument and telephone reminders were each associated with response rates 13% higher than surveys that did not use these techniques. Price (2000) also found that physicians are more reluctant to participate in surveys. The author cites a number of reasons for physician reluctance including an unwillingness to take part in stereotyping and generalization and resistance to restrictions imposed by closed-format questions. The author concludes that two techniques have consistently shown to improve response rates: the use of prepaid incentives and multiple follow-up contacts. A recent paper titled, “Methodologies for Improving Response Rates in Surveys of Physicians: A Systematic Review” (VanGeest, JB., Johnson, TP., and Welch, VL. 2007). The authors conducted a systematic review of 66 published reports of efforts to improve response rates to physician surveys. They specifically looked at incentive and design-based approaches. They found that small financial were effective in improving physician response. Token nonmonetary incentives were much less effective. In terms of design strategies, postal and telephone strategies have generally been more successful than have fax or Web-based approaches, with evidence also supporting use of mixed-mode surveys in this population. In addition, use of first-class stamps on return envelopes and questionnaires designed to be brief, personalized, and endorsed by

−3−
legitimizing professional associations were also more likely to be successful. NONRESPONSE Although maintaining high response rates is always desirable, research evidence indicates that physician surveys are somewhat more resilient to the effects of survey non-response than other types of surveys. Studies have been done comparing early and late responders on survey questions, as well as comparing responders and nonresponders in terms of background characteristics (usually available on sampling frames of physicians). Kellerman and Herold (2001) suggest that response bias may be less of a concern for physician surveys compared to surveys with the general population as most nonresponse studies have found no or only minimal amounts of response bias. This finding holds true for studies conducted after 2001 as well (Barclay, 2002; Cull et al., 2005; Menachemi et al., 2006; McFarlane et al., 2007; Bjertnaes et a., 2008). Studies of early and late responders (Menachemi et al., 2006; Schoenman et al., 2003; Armstrong and Ashworth, 2000; Guadagnoli and Cunningham, 1989; Malin, Rideout, Ganz, 2000; Parsons, Warnecke, Czaja, Barnsley, and Kaluzny, 1994; Sobal and Ferentz, 1989; Thran, Olson, and Strouse, 1987) indicate that they do not differ significantly in their answers to survey questions. McFarlane et al (2007) found that men were more likely to be early responders and that additional mailings helped to reduce the amount of bias for men. Few differences were found with respect to demographic variables such as income, geographic area, specialty, and gender. When differences were observed, early responders were more likely to live in suburban areas and have higher annual incomes than late responders (Guadagnoli and Cunningham, 1989; Sobal and Ferentz, 1989; Temple et-al., 1997; Kellerman and Herold, 2001; Barclay, 2002; Cull et al., 2005). Studies of respondents and nonrespondents suggest differences on some characteristics (such as age, recency of graduation, medical specialty, practice location, and whether the physician is U.S. or foreign trained), but not large differences. Berk (1983, 1985) suggests that, if a given sample size is needed for statistical power reasons, a larger sample should be drawn. If we assume that nonrespondents are not significantly different from respondents, then the reduction of costs of trying to encourage reluctant sample members to participate can more than offset the costs of initial contacts. Other findings included: Response rates and response bias.

−4−
• Several studies with physicians have shown that higher response rates are not associated with lower response bias (Barton et al. 1980, McCarthy, Loval, and MacDonald 1997; Thomsen 2000; and McFarlane, Murphy, Olmsted, and Hill, 2007).
When bias did exist… • The direction showed that women, non specialist physicians (e.g. generalists), young
physicians or recently licensed physicians, and medical graduates from the country sponsoring the survey were slightly more likely to respond to the survey (Temple et-al, 1997; Kellerman and Herold, 2001; Barclay, 2002; Cull, Karen, O’Connor, Sharp and Tang 2005).
• Contradictory to most findings, one study found that male physicians were more likely to be
responders than females (McFarlane, Murphy, Olmsted, and Hill, 2007). Mode: • Surveys completed on the web have a tendency to incur a greater non-response bias
compared to surveys conducted in other modes (Leece et.al, 2004; Kellerman and Herold 2001; Cummings et.al, 2001)
• In a comparison between mail and web, no response bias was detected in either group for
age, gender or tenure. However, a bias towards nonspecialists was present in the web group. A mail follow-up survey, however, reduced the amount of bias (Beebe, Locke, Barnes, Davern, and Anderson, 2007).
MAXIMIZING RESPONSE IN MAIL AND TELEPHONE SURVEYS Mail Surveys Early research on mail surveys and physicians confirm that Dillman’s (1978) Total Design Method (TDM) variables are important for maximizing mail response rates. Researchers who have manipulated characteristics of mail survey methodology confirm: • Prepaid incentives at initial contact (rather than delayed incentives or prepaid incentives
on follow-up) have been shown to improve response rates (Berk et al., 1990; Berry and Kanouse, 1987; VanGeest, Wynia, 2000).
• Personalized letters (Everett et al. 1997; Oden and Price, 1999; Olson et al., 1993). • Professional organization sponsorship (Olson et al., 1993) • Studies comparing full TDM approaches generally show high response rates (Berry and
Kanouse, 1987; Everett, Bedell, and Telljohann, 1997; Kasprzyk, Montano, Lawerence, and Phillips 2001; Moore, Gaudino, DeHart, Cheadle, and Martin, 2001; Mullen, Easling, Nixon,

−5−
Koester and Biddle, 1987; Olson, Schneiderman, and Armstrong, 1973; Shosteck and Fairweather, 1979; Tambor, Chase, Faden, Geller, Hofman and Noltzman, 1993).
• Prenotification of the survey did improve response rates in most cases (Ward et al., 1998;
Osborn, Ward, & Boyle, 1996; Heywood et al., 1995; Ward & Wain, 1994; Bostick, Pirie). One exception is a study by Shiono and Klebanoff, 1991, which did not see improvements.
However, response rates for mail surveys with physicians have declined over the past decade (Cull et al., 2005), and the above strategies alone are often not sufficient to maintain response rates. Postcard reminders: • Sending replacement questionnaires as opposed to postcards increases response rates, but are
not a cost saving strategy (Becker, Cookston, and Kuberg, 2000; Olmsted et al., 2006). • Sending postcard reminders as opposed to no reminder did not increase response rates in a
survey of registered nurses (Hill, Fahrney, Wheeless, and Carson, 2006). Use of Stamps • Some research with physician populations has shown that the use of stamps can be effective
compared to metered or business reply envelopes for return mail (Streiff, 2001; Kellerman and Herold, 2001; Urban, Anderson, and Tseng, 1993; Fox, 1998).
• No evidence to support the use of stamps on outgoing mail. Seven studies conducted in the
1970’s found no difference in response rates for mailings that used a stamped outgoing envelope versus a metered outgoing envelope (Edwards, 2007; Gullen, 1993). One recent study also found no difference in response rates (McFarlane, Murphy, Olmsted, 2007).
Certified Mail, Priority, and FedEx • Rimm, Stampfer, Colditz, et al. 1990 found that the use of Certified Mail increased response
rates. Del Valle et al., 1997 reported 16.5% increase in response rates using certified mail • Kasprzyk et al. (2001) compared Federal Express delivery with US Mail resulted in an 8%
increase in response rates. • A survey of health care providers in Alaska and New Mexico found no difference in response
rates between surveys sent via US mail and surveys sent via Priority mail (Brems, Johnson, Warner, and Roberts, 2007). However, another study found that the use of Priority mail was effective in increasing response rates with physicians (Moore and An, 2001).
−6−
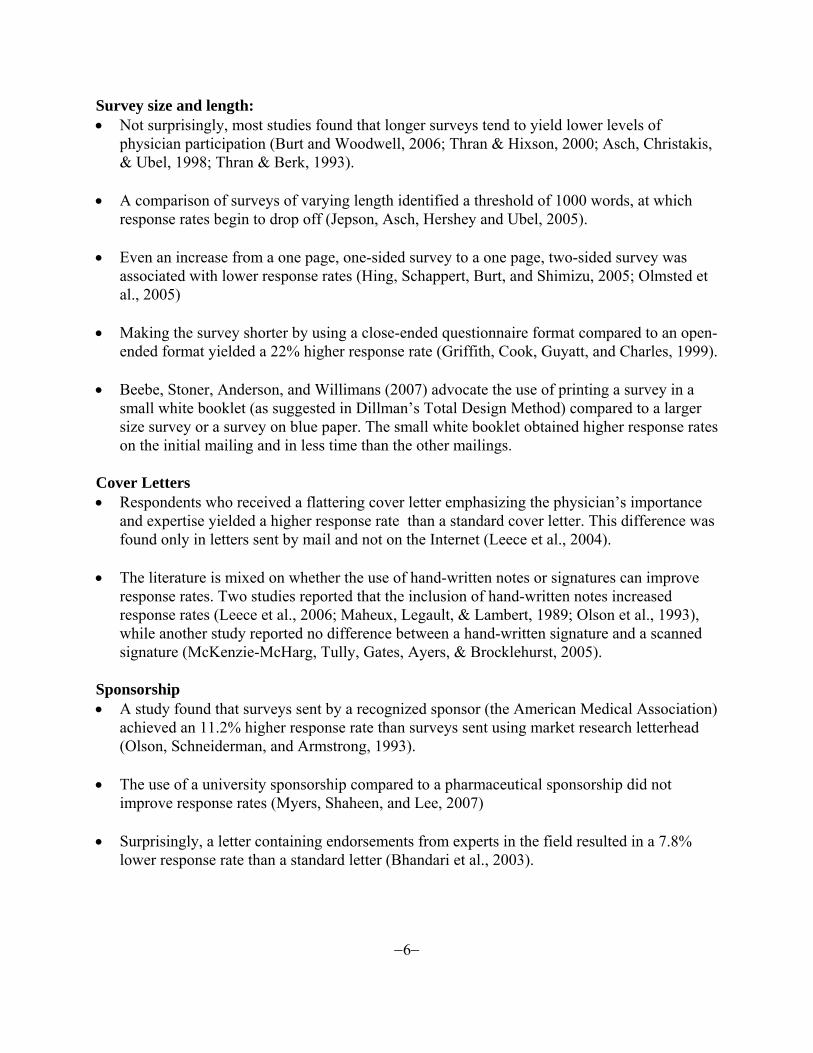
Survey size and length: • Not surprisingly, most studies found that longer surveys tend to yield lower levels of
physician participation (Burt and Woodwell, 2006; Thran & Hixson, 2000; Asch, Christakis, & Ubel, 1998; Thran & Berk, 1993).
• A comparison of surveys of varying length identified a threshold of 1000 words, at which
response rates begin to drop off (Jepson, Asch, Hershey and Ubel, 2005). • Even an increase from a one page, one-sided survey to a one page, two-sided survey was
associated with lower response rates (Hing, Schappert, Burt, and Shimizu, 2005; Olmsted et al., 2005)
• Making the survey shorter by using a close-ended questionnaire format compared to an open-
ended format yielded a 22% higher response rate (Griffith, Cook, Guyatt, and Charles, 1999). • Beebe, Stoner, Anderson, and Willimans (2007) advocate the use of printing a survey in a
small white booklet (as suggested in Dillman’s Total Design Method) compared to a larger size survey or a survey on blue paper. The small white booklet obtained higher response rates on the initial mailing and in less time than the other mailings.
Cover Letters • Respondents who received a flattering cover letter emphasizing the physician’s importance
and expertise yielded a higher response rate than a standard cover letter. This difference was found only in letters sent by mail and not on the Internet (Leece et al., 2004).
• The literature is mixed on whether the use of hand-written notes or signatures can improve
response rates. Two studies reported that the inclusion of hand-written notes increased response rates (Leece et al., 2006; Maheux, Legault, & Lambert, 1989; Olson et al., 1993), while another study reported no difference between a hand-written signature and a scanned signature (McKenzie-McHarg, Tully, Gates, Ayers, & Brocklehurst, 2005).
Sponsorship • A study found that surveys sent by a recognized sponsor (the American Medical Association)
achieved an 11.2% higher response rate than surveys sent using market research letterhead (Olson, Schneiderman, and Armstrong, 1993).
• The use of a university sponsorship compared to a pharmaceutical sponsorship did not
improve response rates (Myers, Shaheen, and Lee, 2007) • Surprisingly, a letter containing endorsements from experts in the field resulted in a 7.8%
lower response rate than a standard letter (Bhandari et al., 2003).

−7−
Response rates compared to other methods • Studies have found that physician response to mail surveys rivals that of telephone surveys
(Kellerman and Herold, 2001). • A mail survey with three follow ups achieved response rates 19% higher than in a telephone
survey (Hocking, Lim, Read, and Hellard 2006) Overall, research has shown that providing a personalized letter, prepaid incentive, and follow-up contacts lead to a greater response rate. Telephone Surveys Several studies looked at the use of telephone as a mode of data collection, while others looked at the use of the telephone in providing prompts to nonrespondents.
• Telephone vs. Other Modes of Administration A study compared a telephone interview with a postal survey that included three reminders. The study found that postal surveys with three reminders can have superior response rates compared with a telephone interview. (Hocking, JS, Lim, MS, Read, T., and Hellard, M. 2006).
Another study randomly assigned primary care physicians to complete a brief, validated patient questionnaire by mail, Internet (web), or Interactive Voice Response (IVR). Response rates were higher by mail (50.8%) than web (18.4%) or IVR (34.7%) (Rodriguez, H. P., Von Glahn, T., Rogers, W. H., Chang, H., Fanjiang, G., Safran, D.G. 2006).
• Call scheduling. Scheduling calls at specific times of the day was found to be successful in one study (Thran, Downes- LeGuin and Berry, 1994). The authors recommend found that including respondent specialty in the call scheduler (ER/ radiology/ pathology in the morning and surgery/anesthesiology in afternoon have higher probability of success), and to avoid too many calls late in the day.
• Repeated callbacks. It was found in several studies that the use of telephone “prompts” to
complete a mail or internet survey were quite successful (Price, 2000, Braithwaite, D., Emery, J., de Lusignan, S. and Sutton, S. 2003, Narayanan, V., Giambo, P., Fry, S., Crafts, J. 2007).
• Follow-up calls by a physician who secures cooperation, then passes the case to an
interviewer, have been shown to produce substantial increases in response rates (Bostick, Pirie, Leupker, and Kofron, 1992).
Overall, results of these studies seem to suggest that telephone as a solo mode of administration is not very effective. However, when used using a physician or other medical personnel as a point of contact, combining telephone with other modes of administration, call scheduling, and repeated callbacks have led to increases in response rate in telephone surveys.

−8−
MAXIMIZING RESPONSE IN MIXED MODE SURVEYS Several surveys have combined telephone surveys with mail in a single design. These studies include telephone surveys in which respondents are: Mail and telephone: • Several studies found that repeated telephone call-backs produced more respondents in a
mail survey than did either providing a mail follow-up option or making special conversion attempts (Kalsbeek, Dever, Sanders, and Bennett, 1992; Olson, Srinath, Burich, and Klabunde, 1999; Gupta, Ward, and D’Este, 1998; Asch, Jedrziewski, and Christakis, 1997; Parsons, Johnson and Warnecke, 1993; Thran, Olson and Strouse, 1987)
• One exception was a study by Donaldson, et al. (1999) that did not find that follow-up calls
improved response rates compared to follow-up mailings. It is unclear, however, whether repeated call-backs were attempted or only one.
Mail and Web: • Providing a web option in a mail survey was not associated with an increase in response
rates, and increased response bias (Brøgger, Nystad, Cappelen, Bakke, 2007). • Sending the initial survey by mail with followed by a web survey to nonresponders increased
response rates compared to an initial survey with a mail nonresponse follow-up (Beebe, Locke, Barnes, Davern, and Anderson, 2007)
Fax and Other Modes: • During a telephone screener for survey, physicians were asked whether they would prefer to
complete the survey via telephone immediately, postal mail, or fax. Almost half of the physicians requested to be surveyed by fax. Physicians in this group achieved an 87% response rate (Lensing et al., 2000).
• In one study, physicians were randomly assigned to receive the survey by fax, postal mail or
email. Surprisingly, the authors found that after two attempts, the physicians in the faxed survey group had the highest response rate at 47%, compared to 41% in the postal mail group, and 26% in the email group (McMahon et al., 2003).
• Mailed surveys with follow-up telephone reminder calls (Armstrong and Ashwort, 2000;
Asch, Jedrziewski, and Christakis, 1997; Berry and Kanouse, 1987; Gupta, Ward, and D’Este, 1998; Kasprzyk, Malin, Rideout, Ganz, 2000; Montano, Lawerence, and Phillips 2001; Moore and An, 2001; Moore, Gaudino, DeHart, Cheadle, and Martin, 2001; Olson, Schneiderman, and Armstrong, 1993; Shiono and Klebanoff, 1991; Tambor, Chase, Faden, Geller, Hofman and Noltzman, 1993; Temple-Smith, Mulvey, and Doyle, 1998; Thran, Olson and Strouse, 1987; Urban, Anderson, and Tseng, 1993; VanGeest, Wynia, Cummins, and Wilson, 2000; Ward, Holt, D’Este, and Sladden, 1998).
−9−
• Administered a phone surveys with mailed prenotifications (Gunn and Rhodes, 1981;
Moore, Gaudino, DeHart, Cheadle, and Martin, 2001; Olson, Srinath, Burich, and Klabunde, 1999).
• Provided a telephone prenotification and reminder calls along with personal interviews
(Shosteck and Fairweather, 1979). • Given the option of responding by different survey modes including: Internet; mail; fax;
telephone. (Olson, Srinath, Burich, and Klabunde, 1999) • Given the option of mail or web modes.(Raziano, Ravishankar, Valenzula, Weiner, and
Lavizzo-Mourey, 2001) . Most of these studies were not designed to assess the effect of including the additional mode. However, those studies which did so found that repeated telephone call-backs produced more respondents in a mail survey than did either providing a mail follow-up option or making special conversion attempts (Asch, Jedrziewski, and Christakis, 1997; Gupta, Ward, and D’Este, 1998; Thran, Olson and Strouse, 1987), and that telephone follow-up of mailed questionnaires is more expensive than mail follow-up (Ogborne, Rush and Fondacaro, 1986). Overall, the best response rates among mixed-mode surveys can be achieved by mailed surveys using a prepaid incentive, follow-up telephone prompts, and the option to complete the survey by several different modes. WEB SURVEYS The use of the Internet as a mode of survey data collection has grown in recent years. The benefits of web-based survey include lower cost per case, quick turnaround, ability to complete the survey at any hour of the day, and low respondent burden are very attractive to survey researchers. Web responders • When given the choice of response mode, physicians who choose to respond over the
Internet tended to be younger, male, graduates of American medical schools, working in/ members of/ partners in a larger group practice, and employees of Health Maintenance Organizations (Lusk et al. 2007; Olson et al. 1999).
Response rates • Studies on physician surveys have shown that lower response rates were the result of using
web surveys alone compared to other survey modes (Akl et al. 2005; Leece et al. 2004; Losh, Thompson and Lutz 2004; Mcmahon et al. 2003; Raziano et al. 2001; Kim et al. 2001).
• Response rates may vary depending upon how Internet savvy the sample physicians are. One
Internet survey was given to “800 Web-using doctors (members of a UK medical Internet

−10−
service provider, Medix)” and reached a response rate of 94% in two months (Potts and Wyatt 2002).
Response accuracy • A study sent by email had fewer incomplete answers compared to the same study sent by fax
or postal mail (McMahon et al, 2003). E-mail sampling error • Since a common practice in web surveys is contacting respondents by an e-mail lead letter
that includes a hyperlink to the survey site, web surveys who use this technique may have greater sampling error because physician e-mail addresses are not as published and easily accessible as physician addresses and phone numbers (Braithwaite et al., 2003).
STUDIES OF PHYSICIAN STAFF AS RESPONDENTS Physicians usually have office staff who both screen their phone calls and mail, and who are knowledgeable about many aspects of the practice. Some survey researchers have investigated the effects of using such staff as proxy respondents (Berk, 1983; Berk, Cohen and Myers, 1981; Marder and Thran, 1988). In general, these studies indicate that proxy respondents may be valuable sources for some kinds of information about finances of the physician’s practice (such as fee levels) or patient characteristics but poorer sources of information about topics such as the physician’s income and expenses or physicians’ use of their time. Physicians often choose to designate proxy respondents for providing cost information (Schneider, et al., 1992 - cited in Thran and Berk, 1993; Thran and Hixson, 2000). Several studies have looked at the best way to overcome gatekeepers’ resistance to allowing access to physicians. • Use of a physician for call-backs (Bostick, Pirie, Leupker, and Kofron, 1992; Gupta,
Ward, and D’Este, 1998; Temple-Smith, Mulvey, Doyle, 1998; Ward, Holt, D’Este, and Sladden, 1998).
• Use of more experienced interviewers (Parsons, Johnson and Warnecke, 1993) have been
found to increase gatekeeper cooperation. EFFECTS OF PROVIDING INCENTIVES Many of the articles we found focused on the use of monetary and nonmonetary incentives to increase response rate. Overall, most of the studies found that the use of an incentive, when appropriate, led to increased response rates. Size of Monetary Incentive

−11−
• VanGeest, Wynia, Cummins, and Wilson (2000) experienced higher response rates as incentives are increased from $5 to $10, but dropped with $20 incentive.
• Kasprzyk, Malin, Rideout, and Ganz (2000) found higher response rates for $15 and $25
group over no incentive. • Malin, Rideout, and Ganz (2000) found a large increase in response rate for $50 incentive for
nonresponders over no incentive. • Researchers concluded that physicians viewed no incentive or use of a small incentive as not
worth the time to complete the survey. Enclosing too large on an incentive was viewed as a payment, therefore turning away many physicians. An incentive that was viewed as a “token of appreciation” had the best result.
Prepaid Incentive Other researchers found that monetary incentives are effective if they are prepaid. (Everett, Bedell, and Telljohann, 1997; Moore, Gaudino, DeHart, Cheadle, and Martin, 2001; Oden and Price, 1999; Price, 2000). • A recent mail survey on smoking cessation among 2,100 physicians found that physician
response rates to mail surveys are greatly improved, especially among certain medical specialties, by using up-front incentives. (Delnevo, CD, Abatemarco, DJ, and Steinberg, MB. 2004).
• Another study of general practitioners experienced a higher response rate among respondents
who received non-conditional incentives.(Tjerbo T, Kvaerner KJ, Botten G, and Aasland OG. 2005).
Non-Monetary Incentives Some researchers experimented with the use of non-monetary incentives with no success. • VanGeest, JB., Johnson, TP., and Welch, VL. 2007 reviewed 10 recent studies that used
nonmonetary incentives. In general, they concluded that token monetary incentives (candy, pencils and pens, stickers) were not very effective in increasing response rate.
• A recent study compared inclusion of candy with no incentive in a mail survey to physicians.
The authors concluded that nonmonetary incentives appear to have little or no impact on response rates (Burt, C. W., and Woodwell, D. 2005).
Inclusion in a “lottery” • One study evaluated the cost-effectiveness of physician willingness to complete a mail
survey when inclusion in a lottery was used as an incentive. A randomized controlled trial of
−12−
a sample of 1,000 general practitioners found that a lottery significantly increased the response rate of physicians to a mail survey (Baron, DeWals, and Milord, 2001).
• A recent national mail survey of consultant obstetricians and gynecologists were randomized
to receiving a questionnaire offering a prize draw incentive (on response) or no such incentive. Overall, the offer of a prize draw incentive did not significantly increase response rates to a national questionnaire survey of consultant obstetricians and gynecologists (Moses, SH and Clark, TJ. 2004).
• A study compared emergency physicians' responses to inclusion of a $2 bill and a chance to
win $250 through a lottery. Two groups of 288 emergency physicians were mailed a questionnaire with incentive type. It was found that a $2 bill produced a better response rate with lower cost per participant than offering a chance to win $250 (Tamayo-Sarver, JH, and Baker, DW. 2004).
Professionally-relevant Incentives There were a few studies that looked at professionally relevant non-monetary incentives. They found the use of incentives such as continuing education credits and research briefs to be effective at increasing response rates (Olson, Schneiderman, and Armstrong, 1993; Tambor, et al., 1993).
CONCLUSION There are many challenges to conducting surveys among physicians. In general, response rates
−13−
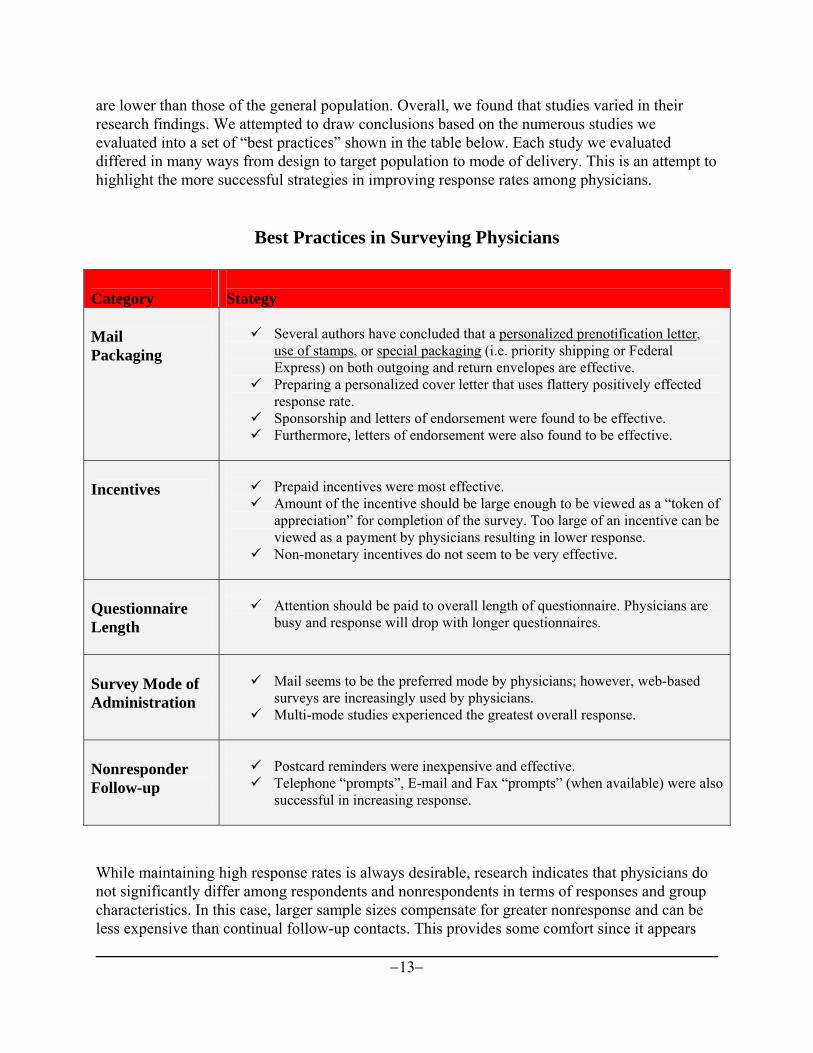
are lower than those of the general population. Overall, we found that studies varied in their research findings. We attempted to draw conclusions based on the numerous studies we evaluated into a set of “best practices” shown in the table below. Each study we evaluated differed in many ways from design to target population to mode of delivery. This is an attempt to highlight the more successful strategies in improving response rates among physicians.
Best Practices in Surveying Physicians
Category
Stategy
Mail Packaging
Several authors have concluded that a personalized prenotification letter,
use of stamps, or special packaging (i.e. priority shipping or Federal Express) on both outgoing and return envelopes are effective.
Preparing a personalized cover letter that uses flattery positively effected response rate.
Sponsorship and letters of endorsement were found to be effective. Furthermore, letters of endorsement were also found to be effective.
Incentives
Prepaid incentives were most effective. Amount of the incentive should be large enough to be viewed as a “token of
appreciation” for completion of the survey. Too large of an incentive can be viewed as a payment by physicians resulting in lower response.
Non-monetary incentives do not seem to be very effective.
Questionnaire Length
Attention should be paid to overall length of questionnaire. Physicians are
busy and response will drop with longer questionnaires.
Survey Mode of Administration
Mail seems to be the preferred mode by physicians; however, web-based
surveys are increasingly used by physicians. Multi-mode studies experienced the greatest overall response.
Nonresponder Follow-up
Postcard reminders were inexpensive and effective. Telephone “prompts”, E-mail and Fax “prompts” (when available) were also
successful in increasing response.
While maintaining high response rates is always desirable, research indicates that physicians do not significantly differ among respondents and nonrespondents in terms of responses and group characteristics. In this case, larger sample sizes compensate for greater nonresponse and can be less expensive than continual follow-up contacts. This provides some comfort since it appears

−14−
response rates will continue to lag behind non-physicians well into the near future. Future Direction: There is no reason to believe that physician cooperation rates will improve in the future. Future research should focus on the concerns voiced by the target population. Focus groups could be used to further investigate barriers and reluctance to participate. Furthermore, emerging technologies may also provide opportunities for more efficient and less invasive forms of gathering data from physicians.
ANNOTATED BIBLIOGRAPHY
Akl, E., Maroun, N., Klocke, R., Montori, V., Schünemann, H. (2005). Electronic Mail was Not Better than Postal Mail for Surveying Residents and Faculty. Journal of Clinical Epidemiology, 58(4): 425-429.
−15−
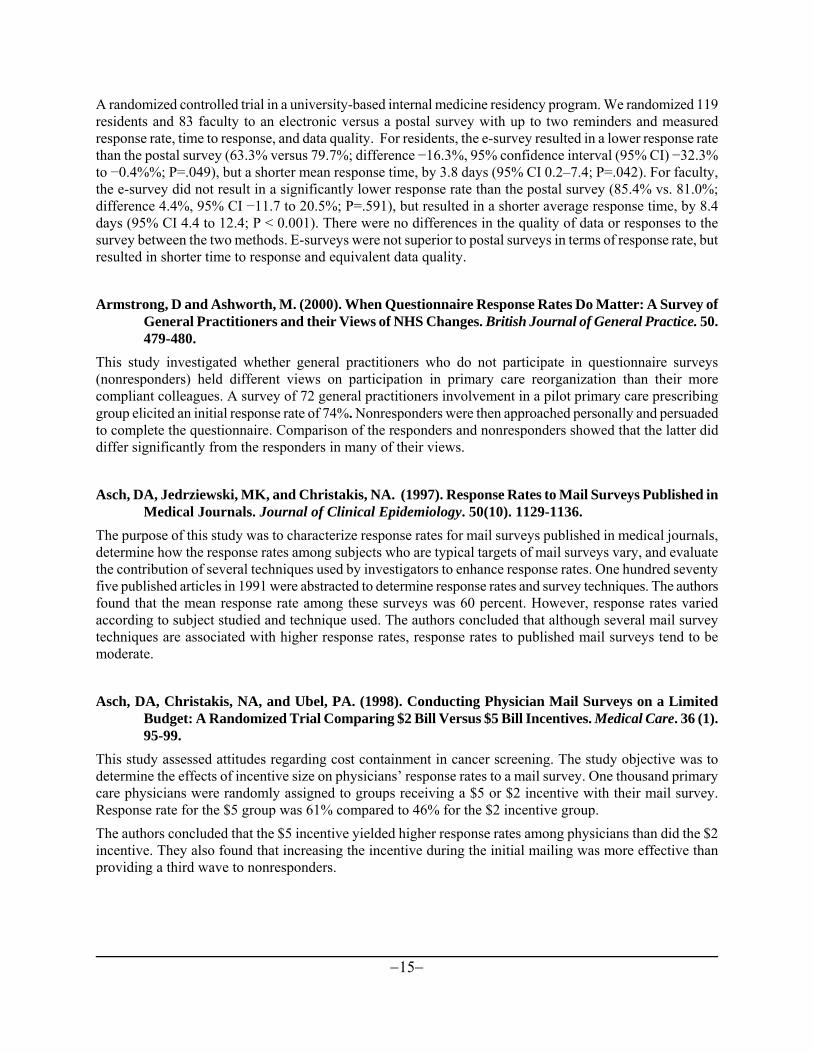
A randomized controlled trial in a university-based internal medicine residency program. We randomized 119 residents and 83 faculty to an electronic versus a postal survey with up to two reminders and measured response rate, time to response, and data quality. For residents, the e-survey resulted in a lower response rate than the postal survey (63.3% versus 79.7%; difference −16.3%, 95% confidence interval (95% CI) −32.3% to −0.4%%; P=.049), but a shorter mean response time, by 3.8 days (95% CI 0.2–7.4; P=.042). For faculty, the e-survey did not result in a significantly lower response rate than the postal survey (85.4% vs. 81.0%; difference 4.4%, 95% CI −11.7 to 20.5%; P=.591), but resulted in a shorter average response time, by 8.4 days (95% CI 4.4 to 12.4; P < 0.001). There were no differences in the quality of data or responses to the survey between the two methods. E-surveys were not superior to postal surveys in terms of response rate, but resulted in shorter time to response and equivalent data quality. Armstrong, D and Ashworth, M. (2000). When Questionnaire Response Rates Do Matter: A Survey of
General Practitioners and their Views of NHS Changes. British Journal of General Practice. 50. 479-480.
This study investigated whether general practitioners who do not participate in questionnaire surveys (nonresponders) held different views on participation in primary care reorganization than their more compliant colleagues. A survey of 72 general practitioners involvement in a pilot primary care prescribing group elicited an initial response rate of 74%. Nonresponders were then approached personally and persuaded to complete the questionnaire. Comparison of the responders and nonresponders showed that the latter did differ significantly from the responders in many of their views. Asch, DA, Jedrziewski, MK, and Christakis, NA. (1997). Response Rates to Mail Surveys Published in
Medical Journals. Journal of Clinical Epidemiology. 50(10). 1129-1136. The purpose of this study was to characterize response rates for mail surveys published in medical journals, determine how the response rates among subjects who are typical targets of mail surveys vary, and evaluate the contribution of several techniques used by investigators to enhance response rates. One hundred seventy five published articles in 1991 were abstracted to determine response rates and survey techniques. The authors found that the mean response rate among these surveys was 60 percent. However, response rates varied according to subject studied and technique used. The authors concluded that although several mail survey techniques are associated with higher response rates, response rates to published mail surveys tend to be moderate. Asch, DA, Christakis, NA, and Ubel, PA. (1998). Conducting Physician Mail Surveys on a Limited
Budget: A Randomized Trial Comparing $2 Bill Versus $5 Bill Incentives. Medical Care. 36 (1). 95-99.
This study assessed attitudes regarding cost containment in cancer screening. The study objective was to determine the effects of incentive size on physicians’ response rates to a mail survey. One thousand primary care physicians were randomly assigned to groups receiving a $5 or $2 incentive with their mail survey. Response rate for the $5 group was 61% compared to 46% for the $2 incentive group. The authors concluded that the $5 incentive yielded higher response rates among physicians than did the $2 incentive. They also found that increasing the incentive during the initial mailing was more effective than providing a third wave to nonresponders.

−16−
Asch, S., Connor, SE., Hamilton, EG., and Fox, SA. (2000). Problems in recruiting community-based physicians for health services research. Journal of General Internal Medicine. Volume 15, Number 8: 591-599. This study attempts to qualitatively determine factors that are associated with higher participation rates in community-based health services research requiring significant physician participation burden. A review of the literature was undertaken using MEDLINE and the Social Science Research Index to identify health services research studies that recruited large community-based samples of individual physicians and in which the participation burden exceeded that of merely completing a survey. Two reviewers abstracted data on the recruitment methods, and first authors were contacted to supplement published information. Sixteen studies were identified with participation rates from 2.5% to 91%. Almost all studies used physician recruiters to personally contact potential participants. Recruiters often knew some of the physicians to be recruited, and personal contact with these “known” physicians resulted in greater participation rates. Incentives were generally absent or modest, and at modest levels, did not appear to affect participation rates. Investigators were almost always affiliated with academic institutions, but were divided as to whether this helped or hindered recruitment. HMO-based and minority physicians were more difficult to recruit. Potential participants most often cited time pressures on staff and themselves as the study burden that caused them to decline. Physician personal contact and friendship networks are powerful tools for recruitment. Participation rates might improve by including HMO and minority physicians in the recruitment process. Investigators should transfer as much of the study burden from participating physicians to project staff as possible. Barclay, S., Todd, S., Finlay, I., Grande, G., and Wyatt, P. (2006). Not another questionnaire! M Maximizing the response rate, predicting non-response and assessing non-response bias in postal questionnaire studies of GPs. Family Practice. 19: 105-111. The authors explained that non-response is an important potential source of bias in survey research. With evidence of falling response rates from GPs, it is of increasing importance when undertaking postal
questionnaire surveys of GPs to seek to maximize response rates and evaluate the potential for non-response bias. The study aims to investigate the effectiveness of follow-up procedures when undertaking a postal questionnaire study of GPs, the use of publicly available data in assessing non-response bias and the development of regression models predicting responder behavior. A postal questionnaire study was carried out of a random sample of 600 GPs in Wales concerning their training and knowledge in palliative care. A cumulative response rate graph permitted optimal timing of follow-up mailings: a final response rate of 67.6% was achieved. Differences were found between responders and non-responders on several parameters and between sample and population on some parameters: some of these may bias the sample data. Logistic regression analysis indicated medical school of qualification and current membership of the Royal College of General Practitioners to be the only significant predictors of responders. Late responders were significantly more likely to have been qualified for longer. This study has several implications for future postal questionnaire studies of GPs. The optimal timing of reminders may be judged from plotting the cumulative response rate: it is worth sending at least three reminders. There are few parameters that significantly predict GPs who are unlikely to respond; more of these may be included in the sample, or they may be targeted for special attention. Publicly available data may be used readily in the analysis of non-response bias and generalizability.

−17−
Barton, J, Bain, CH, Hennekens, B, Rosner, C, Belanger, A, Roth, and Speizer, FE. 1980. Characteristics of Respondents and Non-Respondents to a Mailed Questionnaire. American Journal of Public Health, 70(8), 823-5.
In establishing a cohort of U.S. nurses, an assessment of response bias was made comparing respondents and non-respondents with regard to age, education, state of residence, employment status, field of employment, and major specialty. Overall, the 122,328 respondents (69.7 per cent) and 43,222 non-respondents were quite similar. Together with the reasonable response rate in a homogeneous population, this suggests that estimation of exposure-disease associations is unlikely to be affected by major bias due to non-response. Baron, G, De Wals, P, and Milord, F. (2001). Cost-Effectiveness of a Lottery for Increasing Physicians’
responses to a Mail Survey. Evaluation and the Heath Professions. 24(1), March 2001, 47-52. This study evaluated the cost-effectiveness of physician willingness to complete a mail survey when inclusion in a lottery was used as an incentive. A randomized controlled trial of a sample of 1,000 members of the Quebec Federation of General Practitioners in 1997 was conducted. Respondents were assigned to an experimental group, which received a chance to participate in a lottery upon return of the questionnaire, or to the control group, which received no incentive. Response rate was 41.2% in the experimental group and 34.8% in the control group, 6.4 percentage point difference (CI95%: 0.6% - 12.6%). The authors concluded that a lottery significantly increases the response rate of physicians to a mail survey. Furthermore, this is a very cost-effective treatment for large surveys. Becker, H., Cookston, J., and Kulberg, V. (2000). Mailed Survey Follow-Ups—Are Postcard
reminders More Cost- Effective Than Second Questionnaires? Western Journal of Nursing
Research, 2000, 22(5), 642-647 Finding cost-effective ways to increase response to mailed surveys is a concern for many nurse researchers. This study compared two follow-up methods: sending a second questionnaire packet versus sending a reminder postcard to those who did not respond to an initial mailing. Although the second questionnaire yielded a higher response than did the postcard, the cost per additional response was approximately 2½ times higher for the questionnaire than for the postcard when the differential cost of the two mailings is considered. Although the cost-effectiveness analysis presented here favors the postcard follow-up, it should be noted that adding the extra questionnaire was more effective than the postcard alone. Thus, the clinical nurse researcher should weigh carefully the additional cost versus the enhanced prospects for response when deciding whether to include the second questionnaire. Carefully examining the characteristics of the response to the initial mailing may also help the clinical nurse researcher determine whether to invest in the more costly second questionnaire follow-up or a postcard, which will probably yield a lower response rate. Whichever follow-up strategy is used, clinical nurse researchers are strongly encouraged to implement a second mailing to increase response rate. Beebe, TJ, Stoner, SM, Anderson, KJ, Williams, AR. (2007). Selected Questionnaire Size and Color
Combinations Were Significantly Related to Mailed Survey Response Rates. Journal of Clinical Epidemiology, 60(11), 1184-9.
The study objective was to determine the degree to which mailed survey response rates, response times, and nonresponse bias are affected by questionnaire size and color. Questionnaires were mailed to a random

−18−
sample of 2,000 Mayo Clinic patients in one of four size/color "test" groups. One thousand three hundred nine surveys were completed, approximately two-thirds in each group. A small (6 (1/8) x 8 (1/4) in) questionnaire booklet on white paper had a higher response rate (68.4%) than a similarly sized questionnaire on blue paper (62.3%). A large (8 (1/4) x 11 in) questionnaire on white paper had a 62.7% rate, whereas a large, blue questionnaire had a response rate of 68.6%. Median response times did not differ by questionnaire size/color. No evidence of differential nonresponse bias was observed across the four test groups. This study supports the use of a small/white questionnaire format advocated by the Total Design Method advanced by Don Dillman at Washington State University. We observed a favorable response rate for a large questionnaire printed on blue paper; however, if time and resources are limited, use of a small/white questionnaire appears preferable. Beebe, TJ, Locke III, GR, Barnes, SA, Davern, ME, and Anderson, KJ. (2007) Mixing Web and Mail Methods in a Survey of Physicians. Health Services Research. 42(3 Pt 1):1219-34. This study assess the effects of two different mixed-mode (mail and web survey) combinations on response rates, response times, and nonresponse bias in a sample of primary care and specialty internal medicine physicians. Primary data were collected from 500 physicians with an appointment in the Mayo Clinic Department ofMedicine (DOM) between February and March 2005. Physicians were randomly assigned to receive either an initial mailed survey evaluating the Electronic Medical Record (EMR) with a web survey follow-up to nonrespondents or its converse-an initial web survey followed by a mailed survey to nonrespondents. Response rates for each condition were calculated using standard formula. Response times were determined as well. Nonresponse bias was measured by comparing selected characteristics of survey respondents to similar characteristics in the full sample frame. In addition, the distributions of results on key outcome variables were compared overall and by data collection condition and phase. Overall response rates were somewhat higher in the mail/web condition (70.5 percent) than in the web/mail condition (62.9 percent); differences were more pronounced before the mode switch prior to the mailing to nonrespondents. Median response time was 2 days faster in the web/mail condition than in the mail/web (median 55 and 7 days, respectively) but there was evidence of under-representation of specialist physicians and those who used the EMR a half a day or less each day in the web/mail condition before introduction of the mailed component. They concluded that a methodology that uses an initial mailing of a self-administered form followed by a web survey to nonrespondents provides slightly higher response rates and a more representative sample than one that starts with web and ends with a mailed survey. However, if the length of the data collection period is limited and rapid response is important, perhaps the web survey followed by a mailed questionnaire is to be preferred. Key outcome variables appear to be unaffected by the data collection method. Bergka, V., Gassea, C., Schnellb, R., and Haefelia, WE. (2005). Mail surveys: Obsolescent model or valuable instrument in general practice research? Swiss Medical Weekly: 135: 189-191. Due to low response rates mail surveys have been called into question as research instruments in general practice. The most effective actions to reduce non-response, such as financial incentives and complex follow-up procedures, are costly. We investigated whether a good response rate is achievable with a less costly survey design, and examined the effect of increased response rates due to repeated follow-ups on survey results. In a mail survey on drug interactions among 2000 general practitioners in south-west Germany, most well-known criteria influencing response rates were met except financial incentives. A four stage design with two reminders was applied and the time course of response was recorded. Results after both reminders were calculated with 95% confidence intervals and compared with initial results using the Jonckheere-Terpstra test with correction for multiple testing. A p <0.01 was considered significant. Although we did not provide financial incentives we achieved a response rate of 60.8% with our survey

−19−
design. The first reminder with a simple postcard was almost three times less effective than the second reminder including another copy of the questionnaire. For only two survey questions, the answers of late respondents differed significantly from those of initial respondents (p <0.01). For these two questions, cumulative results after both reminders never differed from initial results by more than 3.7%. Even if financial incentives are not affordable, good response rates can be obtained among general practitioners when surveys are meticulously planned and implemented. Potential non-response bias introduced by those general practitioners, who do not answer despite numerous reminders, cannot be tested by comparing early and late respondents. Therefore, we suggest that the impact of reminders on survey results should be assessed early. If no bias can be detected one further reminder with a copy of the questionnaire might result in estimates very similar to those after numerous reminders. Berk, ML. (1983). Interviewing physicians: The Effect of Improved Response Rate. American
Statistical Association Proceedings of the Social Statistics Section Toronto, Ontario, Canada. 527-532.
Berk, ML. (1985). Interviewing Physicians: The Effect of Improved Response Rate. American Journal of Public Health, 75(11), 1338-1340.
NMCES Physician’s Practice Survey (demographic and economic info). Study compared early versus late responders. Late responders were board certified, younger, with smaller incomes, and more medicaid patients. Data quality was low within the proxy response group in later interviews. Regression prediction of physician income was different using early versus all data, however, the difference was small. The author concluded that higher response rates do not necessarily lower bias. The author suggested considering a larger sample with less stringent response rate requirements and a shorter field period. Berk, ML. (1985). Measuring Cooperation on an Economic Survey of Physicians. ASA Proceedings of
the Social Statistics Section, Las Vegas, NV. 421-424. This study analyzed data from the NMCES Physician’s Practice Survey. The author developed a scale of “problem responding”: proxy report (29%) + No income reported (26%) + interviewer cooperation ratings (13% fair/poor) Berk, ML, Cohen, SB and Myers, SM. (1981). The Usefulness of Proxy Reporting in an Economic
Survey of Physicians. ASA Proceedings of the Section on Survey Research Methods. 671-673. This study looked at the use of proxies in the NMCES Physician Practice Survey and compares completeness of information and interviewer cooperation ratings provided by physicians versus proxies. The authors found that cooperation ratings were lower for proxy interviews. Item non-response was significantly higher for proxy interviews on 8 of the 14 questions (including weeks spent working and patient load, medical training, age, and income). The authors concluded that researchers should interview the physician directly whenever possible, but proxies can provide some useful information. Berk, ML, Edwards, WS and Gay, NL (1990). The Use of a Prepaid Incentive to Convert
Nonresponders on a Survey of Physicians. ASA , Proceeding of the Section on Survey Research Methods. 766-769.
Berk, ML, Edwards, WS and Gay, NL (1993). The Use of a Prepaid Incentive to Convert Nonresponders on a Survey of Physicians. Evaluation and the Health Professions, 13(2), 239-245.
−20−
The National Survey of Allergy Diagnostic Testing, a 2-page questionnaire inquiring about different kinds of tests performed, was sent to allergists and otolaryngologists by certified mail. The study compared a prepaid $10 incentive with an incentive only on follow-up mailings. Nonresponders received a second mailing after three weeks. Authors found that prepaid incentives greatly increase response rate (55% versus 20%), but the delayed incentive was less effective (35% versus 29% increase for second mailing). Interestingly, only 12% of nonrespondents cashed the incentive checks. Berry, SH and Kanouse, DE. (1987). Physician Response to a Mailed Survey: An Experiment in
Timing of Payment. Public Opinion Quarterly 51(1), 102-114. This study examined the use of a $20 incentive prepayment versus the promise of a $20 payment to physicians completing a questionnaire. The mail questionnaire took approximately 25 minutes to complete. The authors report response rates of 78% for the prepayment group, 66% for the post-payment group, and 77% for the late prepayment group. They also found that refusal rates were 11% among the prepayment group compared to 14% among the post-payment group. The authors concluded that prepayment did not affect characteristics of the sample. However, the prepaid group had a lower field cost overall. Bjertnaes, OA, Garratt, Botten, G. (2008). Nonresponse Bias and Cost-Effectiveness in a Norwegian Survey of Family Physicians. Evaluation of Health Professionals. 31: 65-80. The authors explained that low response rates are a common problem in surveys of family physicians leading to uncertainty about the validity of results. In this study, the authors examined the association between multiple reminders and nonresponse bias, survey estimates and costs in a survey of family physicians in Norway (N = 3,463). After three postal reminders and one telephone follow-up, the response rate was 65.9%. They analyzed differences in nine demographic and practice variables between respondents and nonrespondents, the effect of nonresponse bias on survey estimates, and the cost-effectiveness of each reminder. Statistically significant differences between respondents and nonrespondents were found for six variables. However, demographic and practice variables had little association with the main outcome variables, and the overall survey estimates changed little with additional reminders. In addition, the cost-effectiveness of the final reminders was poor. Bonito, AJ, Samsa, GP, Akins, AR, and Matchar, DB. (1997). Use of a Non-monetary Incentive to
Improve Physician Responses to a Mail Survey. Academic Medicine. 72 (1). 73. The authors describe a study conducted in 1993 and 1994. Using a national mail survey of stroke prevention, a sample of 1501 physicians were selected. Eighty percent (1186) received a “Risk Disk” as an incentive to participate in the survey. The disk, prepared by the National Stroke Association, supports patient education by graphically illustrating how lifestyle and behavioral changes can reduce the risk of stroke. The remaining 20% (315) did not receive a disk. The group receiving the incentive had a response rate of 67% compared to 67% in the control group. The results suggest that the physicians lacked interest in the disk as there were no difference between experimental and control groups. Bostick, RM, Pirie, P, Leupker, RV and Kofron, PM. (1989). Using Physician Caller Follow-ups to
Improve the Response Rate for a Physician Telephone Survey. Evaluation and the Health Professions, 15(4), 420-433.
This study examined the effect of call backs by physician investigators in a physician telephone survey. The study compared early and late responders in terms of characteristics and survey effects. The authors reported a 66% response rate after the first call increasing to a 92% response rate after the second, which was made by a
−21−
physician. Sixty-nine nonrespondents took 40 hours of physician caller time (mostly getting in touch with the sample member). The authors concluded that there were no differences between the early and late responders in terms of demographics. Furthermore, the early responders gave more “desirable” responses (where no consensus guidelines exist). Braithwaite, D, Emery, J, De Lusignan, S, and Sutton S. (2003). Using the Internet to Conduct Surveys
of Health Professionals: A valid Alternative? Family Practice, 21(3), 329. The purpose of this study was to examine whether Internet-based surveys of health professionals can provide a valid alternative to traditional survey methods. (i) Systematic review of published Internet-based surveys of health professionals focusing on criteria of external validity, specifically sample representativeness and response bias. (ii) Internet-based survey of GPs, exploring attitudes about using an Internet-based decision support system for the management of familial cancer. The systematic review identified 17 Internet-based surveys of health professionals. Whilst most studies sampled from professional e-directories, some studies drew on unknown denominator populations by placing survey questionnaires on open web sites or electronic discussion groups. Twelve studies reported response rates, which ranged from nine to 94%. Sending follow-up reminders resulted in a substantial increase in response rates. In our own survey of GPs, a total of 268 GPs participated (adjusted response rate = 52.4%) after five e-mail reminders. A further 72 GPs responded to a brief telephone survey of non-respondents. Respondents to the Internet survey were more likely to be male and had significantly greater intentions to use Internet-based decision support than non-respondents. Internet-based surveys provide an attractive alternative to postal and telephone surveys of health professionals, but they raise important technical and methodological issues which should be carefully considered before widespread implementation. The major obstacle is external validity, and specifically how to obtain a representative sample and adequate response rate. Controlled access to a national list of NHSnet e-mail addresses of health professionals could provide a solution. Brehauta, JC, Graham, ID, Visentina, L., and Stiella, IG. (2005). Print format and sender
recognition were related to survey completion rate. Journal of Clinical Epidemiology. Vol. 59. 635–641.
This study assessed whether print format (single-sided vs. double) and sender recognition (known vs. unknown) affect response and completion rates among physician survey respondents. Postal survey of 399 members of the Canadian Association of Emergency Physicians; 232 factorial design. Response rate was 69.4%. Single-sided printing yielded 7.4% (odds ratio OR = 1.41; 95% confidence interval CI = 0.90– 2.20; P = 0.13), and a known sender yielded a 6.3% greater response rate (OR = 0.73; 95% CI = 0.47–1.14; P = 0.16). Overall item completion was 98.2%; items missed per respondent ranged from 1 to 14 out of 50. Print format and sender recognition interacted in predicting completion rate (OR 5 13.33; 95% CI = 3.10–57.4; P = 0.001); completion was higher for double-sided printing with an unknown sender, and for single-sided printing with a known sender. Completion was also lower when response came after later mailouts (c2 (2) = 10.13; P =0.006). Print format and sender recognition both yielded 6%–7% (nonsignificant) response rate differences. Survey completion rate varied even when overall item completion was high. Completion rate was useful for identifying subgroups likely to provide incomplete data (i.e., late responders), and may provide important information for subsequent surveys. Combining factors that on their own improve survey response may have unexpected consequences. Brems, C., Johnson, ME, Warnter T, Roberts, LW. (2006). Survey Return Rates as a Function of
Priority versus First-class Mailing. Psychol Rep. Vol. 99(2):496-501.

−22−
Prior research indicates survey procedures that signal significance and individualized mailings have higher response rates. Thus, it was hypothesized that surveys delivered via Priority mail would result in higher return rates than surveys delivered via First-Class. 260 surveys were sent to individuals randomly selected from lists of licensed physical and behavioral healthcare providers in Alaska and New Mexico. Half of the selected individuals were assigned randomly to receive mailings using Priority mail, the other half received First-Class mailings. Return rate was 39% for First-Class and 35% for Priority. Z tests of proportion indicated no statistically significant differences between methods. Given increased costs with no resultant increase in response rate, sending surveys to potential participants via Priority mail does not appear warranted. Brogger, J, Nystad, W, Cappelen, I, and Bakke, P. (2007). No Increase in Response Rate by Adding a
Web Response Option to a Postal Survey: A Randomized Trial. Journal of Medical Internet Research, 9(5), 40.
There is substantial interest in use of the Internet for surveys, but there have been few health-oriented, large, randomized trials of general population surveys on the Internet. It is unclear whether providing the option to respond via Internet increases the response rate, and to what degree the results will differ. The aim of the study was to evaluate changes in response rate and outcomes in a postal respiratory health survey by adding an optional Web response alternative. This was a randomized trial of a random sample of 4213 permanent residents of Norway, aged 20-40 years. Participants were randomized into a traditional survey arm, where they were asked to return the survey by mail, and an arm where they were also offered the option to respond via a Web form. RESULTS: A total of 1928/4213 subjects responded, a response rate of 45.8% across both arms. The total response rate was 44.8% (944/2105) in the postal plus optional Internet response arm and 46.7% (984/2108) in the usual postal survey arm, with no statistically significant difference between the randomized groups (P = .24). In the optional Internet arm, 8.3% (175/2105) of the sample responded using the Internet and 36.5% (769/2105) responded by post. Thus, Internet response was chosen by 18.5% (175/944) of those who replied in the optional Internet arm. In the multivariate analysis, Internet response was associated with being male, frequency and type of Internet access (home users more likely to respond by Internet than work users), and smoking habit, with current smokers being more likely to be Internet responders. 57% preferred postal response (1102/1928), 38% preferred Internet response (733/1928), and 3% preferred telephone interview (54/1928), with no difference between randomization arms (P = .56). But among those who indicated that they preferred the Internet response and who were randomized to the optional Internet arm, only 47% actually chose the Internet response. Asthma prevalence was higher among participants choosing the Internet response mode (16.7% vs 12.4%). We failed to increase survey response rates by adding an optional Internet response. Asthma diagnosis was higher in the Internet response group, suggesting nonresponse bias. Method comparison studies should be carried out before Internet studies are accepted in new populations or new subject matters. Burt, C. W., & Woodwell, D. (2005). Tests of methods to improve response to physician surveys. Paper
presented at the 2005 Federal Committee on Statistical Methodology, Arlington, VA. No abstract available. Christian, J. . (2005). The Effect of Incentives on Two Physician Mail Surveys: A Response Rate Comparison . The American Association for Public Opinion Research (AAPOR) 60th Annual Conference. Garnering cooperation for surveys from physicians presents some interesting challenges for survey research professionals. A common approach for surveying physicians is the use of mail surveys and incentives. Battelle conducted two such studies -- one study was of psychiatrists who treat schizophrenic patients and the

−23−
other was a study of primary care physicians, dermatologists, urologists and Ob/Gyns who had the potential to treat patients with the genital human papillomavirus (HPV). Both studies were conducted using modified versions of Donald Dillman's "Tailored Design Approach." Additionally, in the psychiatrist survey a $15 money order was included along with the initial package of survey materials as incentive for completing the survey. Clinicians in the HPV survey received a $50 bill included with the initial package of survey materials.
Clark TJ, Khan KS, Gupta JK. (2002) Effect of paper quality on the response rate to a postal survey: A
randomized controlled trial. BMC Medical Research Methodology. Vol. 1:12. Response rates to surveys are declining and this threatens the validity and generalizability of their findings. We wanted to determine whether paper quality influences the response rate to postal surveys. A postal questionnaire was sent to all members of the British Society of Gynecological Endoscopy (BSGE). Recipients were randomized to receiving the questionnaire printed on standard quality paper or high quality paper. The response rate for the recipients of high quality paper was 43/195 (22%) and 57/194 (29%) for standard quality paper (relative rate of response 0.75, 95% CI 0.33-1.05, p = 0.1 The use of high quality paper did not increase response rates to a questionnaire survey of gynaecologists affiliated to an endoscopic society. Clark TJ, Khan KS, Gupta JK. (2001). Provision of pen along with questionnaire does not increase the
response to a postal survey: A randomized controlled trial. Journal of Epidemiological Community Health. Vol. 55:595-6.
No abstract available. Cull, W.L., O’Connor, K.G., Sharp, S., and Tang, S.S. (2005). Response rates and response bias for
50 surveys of pediatricians. Health Services Research 40(1), 213-226. This study was designed to track response rates across time for surveys of pediatricians, to explore whether response bias is present for these surveys, and to examine whether response bias increases with lower response rates. A total of 63,473 cases were gathered from 50 different surveys of pediatricians conducted by the American Academy of Pediatrics (AAP) since 1994. Thirty-one surveys targeted active U.S. members of the AAP, six targeted pediatric residents, and the remaining 13 targeted AAP-member and nonmember pediatric subspecialists. Information for the full target samples, including nonrespondents, was collected using administrative databases of the AAP and the American Board of Pediatrics. The study was designed to assess bias for each survey, age, gender, location, and AAP membership type were compared for respondents and the full target sample. Correlational analyses were conducted to examine whether surveys with lower response rates had increasing levels of response bias. Response rates to the 50 surveys examined declined significantly across survey years (1994–2002). Response rates ranged from 52 to 81 percent with an average of 68 percent. Comparisons between respondents and the full target samples showed the respondent group to be younger, to have more females, and to have less specialty-fellow members. Response bias was not apparent for pediatricians’ geographical location. The average response bias, however, was fairly small for all factors: age (0.45 years younger), gender (1.4 percentage points more females), and membership type (1.1 percentage points fewer specialty-fellow members). Gender response bias was found to be inversely associated with survey response rates (r5 _0.38). Even for the surveys with the lowest response rates, amount of response bias never exceeded 5 percentage points for gender, 3 years for age, or 3 percent for membership type. While response biases favoring women, young physicians, and non specialty-fellow members were found across the 52–81 percent response rates examined in this study, the amount of bias was minimal for these factors that could be tested. At least for surveys of pediatricians, more attention should be devoted by investigators to assessments of response bias rather than relying on response rates as a proxy of response bias.
−24−
Cummings SM, Savitz, LA, and Konrad, TR. (2001). Reported Response Rates to Mailed Physician
Questionnaires. Health Service Research, 35(6), 1347-55. To examine response rate information from mailed physician questionnaires reported in published articles. Citations for articles published between 1985 and 1995 were obtained using a key word search of the Medline, PsychLit, and Sociofile databases. A 5 percent random sample of relevant citations was selected from each year. Citations found to be other than physician surveys were discarded and replaced with the next randomly assigned article. Selected articles were abstracted using a standardized variable list. The average response rate for mailed physician questionnaires was 61 percent. The average response rate for large sample surveys (> 1,000 observations) was 52 percent. In addition, only 44 percent of the abstracted articles reported a discussion of response bias, and only 54 percent reported any type of follow-up. (1) Response rates have remained somewhat constant over time, and (2) researchers need to document the efforts used to increase response rates to mailed physician questionnaires. Delnevo, CD, Abatemarco, DJ, and Steinberg, MB. (2004) Physician Response Rates to a Mail
Survey by Specialty and Timing of Incentive. American Journal of Preventative Medicine, 26(3), 234-236.
The authors discuss primary care physician responses to a mail survey on smoking cessation and are summarized by physician specialty and timing of incentive. A stratified random-sample design, stratified by patient populations—adults, adolescents, and pregnant women—was used. The sampling frame included New Jersey internists, general practitioners, family physicians, pediatricians, and obstetrician– gynecologists. A total of 2100 physicians, 700 physicians from each patient strata, were sampled and mailed a smoking-cessation survey in summer 2002. The sample was randomized by incentive. Half received the incentive (i.e., $25 gift card) with the first survey mailing, and half received the incentive on receipt of their completed survey. The promised-incentive group achieved a significantly lower response rate (56%) compared with the up-front–incentive group (71.5%). Response rates by medical specialty varied overall and within incentive groups. The difference between the incentive groups was greatest among obstetrician– gynecologists (i.e., 20.2 percentage points) and was least among pediatricians (i.e., 5.8 percentage points). Physician response rates to mail surveys are greatly improved, especially among certain medical specialties, by using up-front incentives. Del Valle, M, Morgenstern, H, Rogstad, T, Albright, C, and Vickrey, B. (1997). A Randomized Trial
of the Impact of Certified Mail on Response Rate to a Physician Survey, and a Cost-effectiveness Analysis. Evaluation and the Health Professions, 20(4), 389-406.
This study examined whether sending a survey by certified mail resulted in a higher response rate from physicians compared to delivery by first-class mail. The study also evaluated the cost-effectiveness of this method. A sample of 409 physicians who were nonresponders to two previous mailings of a medical specialty society survey were selected. Randomized samples of the physician were drawn into groups receiving a final mailing by U.S. postal certified mail or by first-class mail. Results showed a higher response rate from the certified mail group (41.3% versus 24.8%). A cost-effectiveness analysis showed that the cost per respondent was higher using certified mail rather than first class mail, but the cost difference was slight ($2.77 versus $2.34). The authors concluded that the use of certified mail is effective in increasing survey response but more costly. Dietel, K.. (2001). Is physician Internet research accurate? Medical Marketing and Media. Vol. 36(2): 98-101

−25−
No abstract available. Dillman, DA (1978). Mail and Telephone Surveys: The Total Design Method. New York: Wiley and Sons.
This book is considered to be the premiere guide to mail and telephone survey design. Dillman, DA (2000). Mail and Internet Surveys. New York: Wiley and Sons. Excellent book discussing new innovations in mail surveys and covering the newly-emerging mode of Internet surveys for data collection. Donaldson, GW, Moinpour, CM, Bush, N, Chapko, M, Jocom, J, Sidak, M, Nielsen-Stoeck, M,
Bradshaw, J, Bichindaritz, and I, Sullivan, K. (1999). Physician Participation in Research Surveys: A Randomized Study of Inducements to Return Mailed Research Questionnaires. Evaluation and The Health Professions. 22(4), December 1999, 427-441
This study examined a randomly selected group of 400 physicians from a population of 1,545 practicing physicians providing follow-up care to patients who receive bone marrow or blood stem cell transplants. The study was designed as a two-factor randomized factorial design. Physicians were either assigned to a group with no compensation or a group with a $5 check and either no follow-up call or a follow-up call 3 weeks after mailing. An overall 51% response rate was achieved. A comparison of logit models indicated a significant increase (p=.016) of the probability of survey return among those in the incentive group (57.5% versus 45.5%). The authors also found that telephone follow-up calls had no effect. The authors concluded that a modest financial reward can significantly improve physician response rates. However, a telephone follow-up may be inefficient. Edwards, P, Roberts, I, Clarke, M, DiGuiseppi, C, Pratap, S, Wentz, R, Kwan, I. (2002). Increasing response rates to postal questionnaires: systematic review. BMJ. Vol. 18. 01-09. The objective of this study was to identify methods to increase response to postal questionnaires. Design Systematic review of randomized controlled trials of any method to influence response to postal questionnaires. Studies reviewed 292 randomized controlled trials including 258 315 participants Intervention reviewed 75 strategies for influencing response to postal questionnaires. The proportion of completed or partially completed questionnaires returned. The odds of response were more than doubled when a monetary incentive was used (odds ratio 2.02; 95% confidence interval 1.79 to 2.27) and almost doubled when incentives were not conditional on response (1.71; 1.29 to 2.26). Response was more likely when short questionnaires were used (1.86; 1.55 to 2.24). Personalized questionnaires and letters increased response (1.16; 1.06 to 1.28), as did the use of colored ink (1.39; 1.16 to 1.67). The odds of response were more than doubled when the questionnaires were sent by recorded delivery (2.21; 1.51 to 3.25) and increased when stamped return envelopes were used (1.26; 1.13 to 1.41) and questionnaires were sent by first class post (1.12; 1.02 to 1.23). Contacting participants before sending questionnaires increased response (1.54; 1.24 to 1.92), as did follow up contact (1.44; 1.22 to 1.70) and providing non-respondents with a second copy of the questionnaire (1.41; 1.02 to 1.94). Questionnaires designed to be of more interest to participants were more likely to be returned (2.44; 1.99 to 3.01), but questionnaires containing questions of a sensitive nature were less likely to be returned (0.92; 0.87 to 0.98). Questionnaires originating from universities were more likely to be returned than were questionnaires from other sources, such as commercial organizations (1.31; 1.11 to 1.54). Health researchers using postal

−26−
questionnaires can improve the quality of their research by using the strategies shown to be effective in this systematic review. Etter, JF, Cucherat, M., Perneger, TV. (2002). Questionnaire Color and Response Rates to Mailed Surveys: A Randomizedtrial Anda Meta-Analysis. Evaluation & the Health Professions. 25; 185-199. The authors conducted a randomized trial in Geneva, Switzerland, to assess whether response rates to a mailed survey could be increased by printing the questionnaire on green paper. The authors also conducted a meta-analysis of 10 experimental studies that tested the effect of colored questionnaires on response rates. The randomized trial showed no effect (relative risk of responding [RR] = 1.00). The meta-analysis showed that mailing questionnaires on pink paper increased response rates by 12% (RR=1.12, 95% confidence interval=1.01 to 1.25, p=0.04). Other colors had no statistically significant effect (blue: RR = 1.03, p = 0.49; green: RR = 1.02, p = 0.23; yellow: RR = 0.96, p = 0.30). Overall, using colored instead of white paper had no effect (RR = 1.02, p = 0.17). Thus, printing questionnaires on colored paper does not substantially increase response rates in surveys, except for pink paper. Everett, SA, Price, JH, Bedell, AW, Telljohann SK, (1997). The Effect of a Monetary Incentive in
Increasing the Return Rate of a Survey to Family Physicians. Evaluation and the Health Professions, 20(2), 207-214.
This study examined the effects of using a modest $1 monetary incentive to increase response rate among a sample of 600 family physicians. Physicians were randomly separated into a group receiving an incentive and a group not receiving an incentive. Physicians were then mailed a survey on firearm safety counseling. The authors report an overall 54% response rate, with a 63% response rate among the incentive group compared to 45% in the nonincentive group (statistically significant at p < .001). The authors concluded that the use of a modest incentive in a mail survey to family physicians led to an increase in response rate. Field, TS, Cadoret, CA, Brown, ML, Ford, M., Greene, SM, Hill, D., Hornbrook, MC, Meenan, RT,
White, MJ, and Zapka, JM (2002). Surveying Physicians: Do Components of the “Total Design Approach” to Optimizing Survey Response Rates Apply to Physicians? Medical Care. Volume 40, Number 7, pp 596–606.
Surveys serve essential roles in clinical epidemiology and health services research. However, physician surveys frequently encounter problems achieving adequate response rates. Research on enhancing response rates to surveys of the general public has led to the development of Dillman’s “Total Design Approach“ to the design and conduct of surveys. The impact of this approach on response rates among physicians is uncertain. This study was designed to determine the extent to which the components of the total design approach have been found to be effective in physician surveys. The effectiveness of prepaid financial incentives, special contacts, and personalization to enhance response rates in surveys of physicians have been confirmed by the existing research. There is suggestive evidence supporting the use of first class stamps on return envelopes and multiple contacts. The optimum amount for incentives and the number of contacts necessary have not been established. Details of questionnaire design and their impact on response rates have received almost no attention from researchers. Few studies have assessed the usefulness of combinations of components of the total design approach. Despite the number of surveys conducted among physicians, their cost, the level of interest in their findings, and in spite of inadequate response rates, there have been few randomized trials conducted on important aspects of enhancing response in this population. Until this gap has been filled,

−27−
researchers conducting surveys of physicians should consider including all components of the total design approach whenever feasible. Frances JD, Sharp, L., Carsin, AE, Kelleher, T., Comber, H. (2008) Questionnaire order
significantly increased response to a postal survey sent to primary care physicians. Journal of clinical epidemiology. Volume 61, Issue 2: 177-185
The authors explained that primary care physicians are increasingly being asked to participate in postal surveys. Difficulties in achieving adequate response rates among physicians have been reported. We investigated the effect of two low-cost interventions on response to a primary care physician postal questionnaire. A 2x2 factorial trial was developed within the context of a national survey assessing views and practices of physicians regarding prostate-specific antigen testing. We evaluated questionnaire order (version 1: demographics first, version 2: topic-specific questions first) and written precontact. A national database of primary care physicians was compiled. One thousand five hundred ninety-nine physicians were randomly selected, stratified by health board, and randomized. 47.9% of eligible physicians completed a questionnaire. There was a statistically significant 5.1% higher response rate among physicians receiving version 1 of the questionnaire than those receiving version 2 (50.6% vs. 45.4%, P=0.05); the adjusted odds of response were significantly raised (odds ratio=1.24; 95% confidence interval=1.01-1.54). Precontact resulted in a nonsignificant 3.6% increase in response (49.8% vs. 46.2%; P=0.16). The interventions did not interact. Ordering questionnaires with general questions first can significantly increase response rates, whereas precontact can achieve a modest increase. These strategies may enhance response while adding little to the cost of a physician survey. Gelb, L. (2000). Comparing Online and Telephone Research Methods with Physicians. ARF's Week of Workshops. Laurie Gelb of Cozint Interactive said it is in line with other evidence that results from online surveys tend to be more skeptical and negative. Physicians were also more likely to mention the leading brand (Lipitor) when asked to list drugs for treating high cholesterol. She said this is counter to the expectation that more socially acceptable answers will be given when a personal interviewer is involved. But since it is the brand most doctors prescribe, it also appears the web survey gave the most accurate answer. She also found attribute ratings correlated more closely with overall satisfaction, showing the web survey provided more internal consistency. This evidence of more thoughtful answers online was relevant because she said physicians are groups that already have virtually universal access to the Internet. But she mentioned response rates to both the phone and web versions of her survey were in the low single digits, causing many to feel cautious about the results. Griffith, LE, Cook, DJ, Guyatt, GH, and Charles, CA. (1999). Comparison of Open and Closed
Questionnaire Formats in Obtaining Demographic Information from Canadian General Internists. Journal of Clinical Epidemiology, 52(10), 997-1005.
The objective of this study was to compare the impact of closed- versus open-ended question formats on the completeness and accuracy of demographic data collected in a mailed survey questionnaire. We surveyed general internists in five Canadian provinces to determine their career satisfaction. We randomized respondents to receive versions of the questionnaire in which 16 demographic questions were presented in a closed-ended or open-ended format. Two questions required respondents to make a relatively simple computation (ensuring that three or four categories of response added to 100%). The response rate was 1007/1192 physicians (80.0%). The proportion of respondents with no missing data for all 16 questions was 44.7% for open-ended and 67.0% for closed-ended formats (P < 0.001). The odds of having missing items

−28−
remained higher for open-ended response options after adjusting for a number of respondent characteristics (2.67, 95% confidence interval 2.01 to 3.55). For the two questions requiring computations focused on professional activity and income, there were more missing data (P = 0.02, 0.02, respectively) but fewer inaccurate responses (P = 0.009, 0.20, respectively) for the open-ended compared to the closed-ended format. Investigators can achieve higher response rates for demographic items using closed format response options, but at the risk of increasing inaccuracy in response to questions requiring computation. Gough, HG and Hall, WB (1977). A Comparison of Physicians Who Did or Did Not Respond to a
Postal Questionnaire. Journal of Applied Psychology, 62(6), 777-780. This study looked at differences between responders and nonresponders to a mail survey of physicians. Authors reported an overall response rate of 80.7% with 2 mailings of a 4-page questionnaire on practice characteristics, past training, and attitudes. They found no differences between respondents and nonrespondents on premedical variables and performance in medical school. Guadagnoli, E and Cunningham, S. (1989). The Effects of Nonresponse and Late Response on a
Survey of Physician Attitudes. Evaluation and the Health Professions, 12(3), 318-328. This study compared respondents and nonrespondents and early versus late answerers, with respect to demographic and practice characteristics, using a mailed survey of cancer attitudes. The sample included 408 general practitioners, family practitioners, internists, and oncologists. The authors reported a 35% early response rate and 58% response rate after a 2-month follow-up mailing was sent. The authors concluded that respondents were more likely to be U.S. medical school graduates and recently licensed. However, they did not find any differences between early and late respondents in terms of demographics, practice characteristics, or attitudes. Gunn, WJ, and Rhodes, IN. (1981). Physician Response Rates to a Telephone Survey: Effects of
Monetary Incentive Level. Public Opinion Quarterly, 45(1), 109-115. This study examined the effects of $0/$25/$50 incentive on response rates for a 20-30 minute phone interview. The authors reported the response rate improved with incentive level (final response rate: 58%/69%/77%). They also found differences in the effect of incentives by physician specialty. Response rates were higher among general practitioners and internists and lower for industrial doctors. Gupta, L, Ward J, and D’Este, C. (1998). Differential Effectiveness of Telephone Prompts by Medical
and Non-medical Staff in increasing Survey Response Rates: A Randomized Trial 1998. Australian and New Zealand Journal of Public Health 56:442-453.
A randomized trial was designed to determine the differential effectiveness of a telephone prompt by a medical researcher compared with a non-medical research assistant in improving response rates of general practitioners. A sample size of 373 was drawn (184 assigned to medical staff callers and 189 to non-medical staff). The response rate for medical staff was 81% compared to 72% for nonmedical staff. The authors concluded that an experienced non-medical research assistant is as effective as a medical practitioner in administering telephone prompts to enhance survey response rates, although savings are not necessarily made. Halpern SD, Ubel PA, Berlin JA, and Asch DA. (2002). Randomized trial of 5 dollars versus 10 dollars monetary incentives, envelope size, and candy to increase physician response rates to mailed questionnaires. Medical Care. Vol 40(9): 834-9.
−29−
The validity of the results of mailed surveys is often threatened by nonresponse bias, which is made more likely when response rates are low. However, the effectiveness and cost-effectiveness of several strategies to increase response rates are uncertain. To assess three strategies to increase response rates to mailed physician surveys: including a 10 dollars versus a 5 dollars cash incentive in the initial mailing, including a mint candy or not, and using a large versus small outgoing envelope. Using a 2 x 2 x 2 factorial design, a randomized trial of these strategies was conducted in a survey of 1200 physicians randomly selected from the American Medical Association's Master File. Including a 10 dollars incentive yielded a significantly higher response rate (60.5% vs. 52.8%) (P = 0.009). The mailing and incentive costs per completed response were 12.24 dollars (95% CI, 11.75 dollars, 13.64 dollars) in the 5 dollars group and 18.48 dollars (95% CI, 17.77 dollars, 20.69 dollars) in the 10 dollars group. Each additional response obtained in the 10 dollars group came at an incremental cost of 61.26 dollars (95% CI, 36.98 dollars, 200.80 dollars). Neither inclusion of a mint nor use of a large envelope influenced the response rate. Investigators may increase response rates by including more money in the initial questionnaire packet, but there may be diminishing returns to serial increments in incentives greater than 5 dollars. Including smaller incentives in more questionnaires may maximize total responses.
Hill, CA., Fahrney, K., Wheeless, SC., and Carson, CP. (2006). Survey response inducements for registered nurses. West J Nurs Res. Vol 28 (3):322-34
The past 20 years have seen an overall decline in survey response rates and an even more pronounced decline in samples of health care professionals. The authors tested the use of a "thank you" or "reminder" postcard as a method by which to stem the tide of declining response rates. The authors conducted a mail and telephone survey of 49,605 registered nurses for the 2000 National Sample Survey of Registered Nurses and sent an extra mailing to a random subsample (n = 4,968). They then compared response rates for both groups. Contrary to prior research, this study found that reminder postcards did not improve response rates or rates of return. There may be several reasons for this finding, including the general familiarity with, and high saliency of, this research project for the nursing community. These results suggest that even widely accepted best practices for survey methods deserve scrutiny when applied to special subpopulations.
Hing, Schappert, Burt, and Shimizu, 2005. Effects of form length and item format on response patterns and estimates of physician office and hospital outpatient department visits. National Ambulatory Medical Care Survey and National Hospital Ambulatory Medical Care Survey, 2001. Vital Health Statistics 2., 139, 1-32.
This report describes effects due to form length and/or item formats on respondent cooperation and survey estimates. Two formats were used for the Patient Record form for the 2001 NAMCS and OPD component of the NHAMCS: a short form with 70 subitems and a long form with 140 subitems. The short form also contained many write-in items and fit on a one-sided page. The long form contained more check boxes and other unique items and required a two-sided page. The NAMCS sample of physicians and NHAMCS sample of hospitals were randomly divided into two half samples and randomly assigned to either the short or long form. Unit and item nonresponse rates, as well as survey estimates from the two forms, were compared using SUDAAN software, which takes into account the complex sample design of the surveys. RESULTS: Physician unit response was lower for the long form overall and in certain geographic regions. Overall OPD unit response was not affected by form length, although there were some differences in favor of the long form for some types of hospitals. Despite having twice the number of check boxes on the long form as the short form, there was no difference in the percentage of visits with any diagnostic or screening services ordered or provided. However, visit estimates were usually higher for services collected with long form check-boxes than with (recoded) short form write-in entries. Finally, the study confirmed the feasibility of collecting certain items found only on the long form. Overall, physician cooperation was more sensitive to form length
−30−
than was OPD cooperation. The quality of the data was not affected by form length. Visit estimates were influenced by both content and item format.
Hocking, JS, Lim, MS, Read, T., and Hellard, M. (2006). Postal surveys of physicians gave superior response rates over telephone interviews in a randomized trial. Journal of Clinical Epidemiology. May;59(5):521-4. Epub 2006 Mar 15
This study compared general practitioner (GP) response to a telephone interview with response to a postal survey with three reminders in a randomized controlled trial. GPs were randomly assigned to either a telephone interview or a postal survey. GPs in the telephone group were mailed a letter of invitation and asked to undertake a telephone interview. GPs in the postal group were mailed a letter of invitation and questionnaire. Non-responders were sent up to three reminders, the final by registered post. Response rates were calculated for each group. As a result, 416 GPs were randomized to the telephone interview and 451 to the postal survey. Eighty-six in the telephone group and 30 in the postal were ineligible. One hundred thirty-four GPs completed the telephone interview with a response rate of 40.6% (95% confidence interval [CI]: 35.3%, 46.1%). Two hundred fifty-two GPs completed the postal survey with a response rate of 59.9% (95%CI: 55.0%, 64.6%). The difference in response was 19.3% (95%CI: 12.2%, 26.3%). These results show that postal surveys with three reminders can have superior response rates compared with a telephone interview. Jepson, C., Asch, DA, Hershey, JC, and Ubel, PA. (2005) In a mailed physician survey,
questionnaire length had a threshold effect on response rate. Journal of Clinical Epidemiology 58 (2005) 103–105.
This study examined the association between questionnaire length and response rate in a mailed survey of generalist physicians randomly selected from the American Medical Association master file. In a pilot study, otherwise similar questionnaires of 30 different lengths (849 to 1,867 words) were mailed to 192 physicians in April 1999. In the main study, questionnaires of 16 different lengths (564 to 988 words) were mailed to 1,700 physicians between June 1999 and January 2000. In the pilot study, response rate decreased from 60% for questionnaires 849 words in length to 16.7% for questionnaires over 1,800 words in length. Logistic regression revealed an odds ratio of 0.887 (95%CI 0.813, 0.968; p _ 0.006) for word count, expressed in units of 100 words. In the main study, response rate varied between 51.5% and 71.4%. Logistic regression showed no association between response and word count (OR 0.988; 95%CI 0.896, 1.090; p _ 0.81). There appears to have been a threshold in these studies of approximately 1,000 words. Questionnaires above the threshold had lower response rates than those below it (38.0% vs. 59.4%).
Kalsbeek, WD, Dever, JA, Sanders, LL, and Bennett, EM (1992). An Assessment of Alternative Designs for Conducting Physician Surveillance Surveys. ASA 1992 Section on Survey Research Methods, Boston, MA pp. 256-261. This study compared different designs in administering the CDC’s Physician Surveillance System Survey. The study compared mail to telephone modes of delivery against telephone data collection with two mailed questionnaires. The authors measured response rates, costs, and cost-efficiency models. They found mail most cost efficient while telephone collection had the lowest response rates. Kasper, J. (1979). Problem Respondents. In R. Andersen, J. Kasper, MR Frankel and Associates,
Total Survey Error: Applications to Improve Health Surveys. 75-86. San Francisco: Jossey-Bass. This study analyzed the Center for Health Administration-NORC survey on national health services use and expenditures. The authors concluded that refusing/non-cooperating physicians were not different by age,

−31−
board certification, and showed little difference by type of medicine practiced. Physicians that were asked to complete data on several patients were more likely to be partially cooperative or uncooperative. Kasprzyk, D, Montano, DE, Lawrence, JS, and Phillips, WR. (2001). The Effects of Variations in Mode
of Delivery and Monetary Incentive on Physicians’ Responses to a Mailed Survey Assessing STD Practice Patterns. Evaluation and the Health Professionals 24(1). 3-17.
This study, sponsored by the Centers for Disease Control and Prevention and Battelle investigators, assessed physician characteristics, STD diagnosis, STD treatment, STD reporting, and partner notification. This mail survey involved a 21 page questionnaire sent to 311 physicians in OB-GYN, family practice, internal and emergency medicine, and pediatrics. Respondents were randomly assigned to one of six groups. A (3x2) factorial designed using cash incentives ($0, $15, $25) and 2 modes of delivery (Federal Express and U.S. Mail). Overall, a 56% response rate was achieved. There were significant effects at p < .01 for incentive level and delivery mode at p < .05 . The highest response rate (81%) was among physicians in the $25 Federal Express condition. The authors concluded that providing a monetary incentive resulted in a much greater response than those receiving no incentive, and that the mode of delivery had virtually no effect on response rate when no monetary incentive was provided. However, among physicians receiving incentive, Federal Express delivery resulted in a higher response rate than first class mail. Kate LL, Quilliam, BJ, and Hughes, CM. (2007). A Comparison of Two Distribution Methods on Response Rates to a Patient Safety Questionnaire in Nursing Homes. Available online 13 August 2007. Survey research focusing on patient safety issues in the nursing home sector poses challenges owing to nursing staff turnover rates, and the adversarial and punitive nature of US nursing home regulation which may promote a negative culture of distrust. Using a patient safety questionnaire, we compared two methods of survey distribution on response rates, respondent sample characteristics, and resident safety ratings. We hypothesized that employees may provide overly positive perceptions when the surveys are distributed on-site as opposed to distribution to employees’ homes, as has been reported by studies evaluating patient satisfaction in other settings. In August 2003, 26 nursing homes indicated their distribution method preference (mail directly to staff members’ homes vs. distributed at work) for a survey determining perceptions of resident safety. Facilities provided lists of currently employed nurses (n=721) and nursing assistants (n=1,233). The survey process included an initial mailing of the survey packet, a reminder postcard, a re-mail of the survey packet to non-respondents to the initial survery, and a final reminder postcard. Return envelopes were addressed to the research team. In nursing facilities where surveys were distributed at work, a greater proportion of respondents were identified as no longer currently employed. Response rates were similar regardless of distribution method, but with greater variability in the facility-specific response rate in surveys distributed at work. Regardless of staffing type, yield of the first mailing was lower and yield of the second mailing higher in homes with surveys distributed at work than those mailed directly to respondents’ homes. While characteristics of nurses were similar regardless of wave, nursing assistant responders to second mailing were more likely to be black relative to responders to the first wave. Distributing surveys at the workplace may not result in a reduction of response rate, but may provide overly positive perceptions of patient safety issues. Mailing directly to homes may result in less facility-level variability in response rates. Multiple mailings may increase the diversity of the respondent pool. Kellerman, SE, and Herold, J. (2001). Physician Response to Surveys: A Review of the Literature. American Journal of Preventive Medicine 20(1). 61-67. The authors conducted a literature review on physician response to surveys. Twenty-four studies were

−32−
examined by searching MEDLINE and PSYCHInfo from 1967 through February 1999. The authors concluded that pre-notification of survey respondents, personalizing the survey mail-out package, and non-monetary incentives were not associated with increased response rates. The use of stamps on both outgoing and return envelopes, and short questionnaires resulted in increased response rates. Surprisingly, the authors found that response rates of mail surveys on physicians compared favorably with those from telephone and personal interview surveys. Kim, H.L., Gerber, G.S., Patel, R.V., Hollowell, C.M., Bales, G.T. (2001). Practice Patterns in the
Treatment of Urinary Incontinence: A Postal and Internet Survey. Urology 57(1): 45-48. Postal and e-mail surveys were sent to 2502 members of the American Urological Association. From the postal group (n = 1000), 419 (42%) responses were obtained; from the e-mail group (n = 1502), 160 (11%) responses were obtained. Lee, C., Frank, J. R., Cole, G., Mikhael, N. Z., Miles, C. A. (2002). Web-Based Surveys for Data Gathering from Medical Educators: An Exploration of the Efficacy and Impact of Follow- Up Reminders . Annual Meeting of the American Educational Research Association, 2002. No abstract available Leece, P, Bhandari M, Sprague S, Swiontkowski MF, Schemitsch EH, Tornetta P, Devereaux PJ, and
Guyatt GH. (2004) Internet versus mailed questionnaires: a randomized comparison. Journal of Medical Internet Research. Sep 24;6(3):e30.
The authors explained that low response rates among surgeons can threaten the validity of surveys. Internet technologies may reduce the time, effort, and financial resources needed to conduct surveys. They investigated whether using Web-based technology could increase the response rates to an international survey. They solicited opinions from the 442 surgeon-members of the Orthopaedic Trauma Association regarding the treatment of femoral neck fractures. They developed a self-administered questionnaire after conducting a literature review, focus groups, and key informant interviews, for which we used sampling to redundancy techniques. They administered an Internet version of the questionnaire on a Web site, as well as a paper version, which looked similar to the Internet version and which had identical content. Only those in our sample could access the Web site. They alternately assigned the participants to receive the survey by mail (n=221) or an email invitation to participate on the Internet (n=221). Non-respondents in the mail arm received up to three additional copies of the survey, while non-respondents in the Internet arm received up to three additional requests, including a final mailed copy. All participants in the Internet arm had an opportunity to request an emailed Portable Document Format (PDF) version. The Internet arm demonstrated a lower response rate (99/221, 45%) than the mail questionnaire arm (129/221, 58%) (absolute difference 13%, 95% confidence interval 4%-22%, P<0.01). The Internet-based survey to surgeons resulted in a significantly lower response rate than a traditional mailed survey. Researchers should not assume that the widespread availability and potential ease of Internet-based surveys will translate into higher response rates. Leece, P, Bhandari M, Sprague S, Swiontkowski MF, Schemitsch EH, Tornetta P,
Devereaux PJ, and Guyatt GH. (2006). Does flattery work? A comparison of two different cover letters for an international survey of orthopedic surgeons. Journal of Canc Chir. Vol 49. No 2. 90-95
The authors conducted an international survey of 442 surgeon-members of the Orthopaedic Trauma Associattion on the treatment of femoral-neck fractures. Half of the participants received the survey by mail

−33−
and half received an email invitation to participate on the Internet. They alternately allocated participants to receive a “standard” or “test” cover letter. The authors found a higher primary response rate for the test cover letter (34%) when both the mail and Internet groups were combined, compared with the standard cover letter (27%). The authors concluded that the test cover letter to surgeons resulted in a significantly higher primary response rate than a standard cover letter when the survey was sent by mail. Researchers should consider using a more personalized cover letter with a postal survey in order to increase response rate. Lensing, SY, Gillaspy, SR, Simpson, PM, Jones, SM, James, JM, and Smith, JM. (2000). Encouraging
Physicians to Respond to Surveys through the Use of Fax Technology. Evaluation and the Health Professions, 23(3), 348-359.
High response rates to surveys of physicians are difficult to achieve. One possible strategy to improve physicians’ survey participation is to offer the option of receiving and returning the survey by fax. This study describes the success of the option of fax communication in a survey of general practitioners, family physicians, and pediatricians in Arkansas with regard to pediatric asthma. Eligible physicians were given the choice of receiving the survey by telephone, mail, or fax. In this observational study, physicians’ preferences, response rates, and biases for surveys administered by fax were compared with mail and telephone surveys. The overall survey response rate was 59%. For the 96 physicians completing an eligibility screener survey, the largest percentage requested to be surveyed by fax (47%) rather than by telephone (28%) or mail (25%). Faxing may be one strategy to add to the arsenal of tools to increase response rates in surveying physicians. Leslie, LL. (1972). Are High Response Rates Essential to Valid Surveys? Social Science Research, 1,
323-334. The author reviewed 28 surveys in which characteristics of early and late responders, or of respondents and nonrespondents, were compared. She found that, for homogeneous groups, there were few differences between comparison groups in terms of dependent variables (answers to survey questions), although they may differ in independent variables (demographic traits: e.g., sex, age, geographic location). An important qualifying factor was that low response rates had little impact when the issues surveyed were directly relevant to the group membership. Leung GM, Johnston JM, Saing H, Tin KY, Wong IO, and Ho LM. (2004). Prepayment was superior to postpayment cash incentives in a randomized postal survey among physicians. Journal of Clinical Epidemiology. Vol 57(8):777-84. Improving response rates, particularly among physicians, is important to minimize nonresponder bias and increase the effective sample size in epidemiologic research. We conducted a randomized trial to examine the impact of prepayment vs. postpayment incentives on response rates. Self-completion postal questionnaires were mailed to 949 physicians who were respondents to an earlier survey and representative of the general physician population in Hong Kong. These physicians were randomly allocated to receive a HK dollar 20 cash prepayment incentive that accompanied the survey (n=474) or a postpayment reward of the same amount on receipt of the completed questionnaire (n=475). RESULTS: The final prepayment response rate was 82.9%, compared with 72.5% in the postpayment arm (P < .001). Of the eight alternative incentive and follow-up strategies evaluated, three lie on the efficiency frontier (i.e., not dominated), including postpayment with three mailings at HK dollar 42.7, prepayment with three mailings at HK dollar 66.5 and prepayment with three mailings and telephone follow-up at HK dollar 112.1 per responder recruited (US dollar 1=HK dollar 7.8). The findings demonstrate that prepayment cash incentives are superior to postpayment of the equivalent amount in improving response rates among a representative sample of Hong Kong physicians. Further research should concentrate on confirming the generalizability of these findings in other health care occupation groups and settings.

−34−
Leung GM, Ho LM, Chan MF, M Johnston JM, Wong FK. (2002). The effects of cash and lottery incentives on mailed surveys to physicians: a randomized trial. Journal of Clinical Epidemiology. Vol 55:801-7. Low response rates, especially among physicians, are a common problem in mailed survey research. We conducted a randomized trial to examine the effects of cash and lottery incentives on response rates. A total of 4,850 subjects were randomized to one of three interventions accompanying a mailed survey-no incentive (n = 1,700), cash payment [three levels of Hong Kong dollars (HKD) $10, $20, and $40; N = 50 in each subgroup], or entry into a lottery (three levels of HKD$1,000, $2,000, and $4,000; N = 1,000 in each subgroup) on receipt of the completed questionnaire. The response rates were higher among those offered incentives than those without (19.8% vs. 16.8%, P =.012). Cash was the more effective incentive compared to lottery (27.3% vs. 19.4%, P =.017). Response also increased substantially between the first and second mailings (14.2% vs. 18.8%, P >.001). In addition, those with specialist qualifications were more willing to participate in mailed surveys. We found no significant differences in response outcomes among the various incentive arms. Cash reward at the $20 level was the most cost-effective intervention, in terms of cost per responder. Further systematic examination of the effects of different incentive strategies in epidemiologic studies should be encouraged. Lockhart, DC. (1991). Mailed Surveys to Physicians: The Effect of Incentives and Length on the
Return Rate. Journal of Pharmaceutical Marketing and Management 6(1), 107-121. Experiment 1: The author surveyed three groups of physicians: general/family practice, internal medicine, and diabetes specialists using a questionnaire on blood glucose self-monitoring. The design compared return rates for short (4 page) versus long (8 page) questionnaires. A comparison of different incentive levels ($0, $1, $5, $10, $20) was conducted. The author found a significant increase in return rate, with significant increases at each level except between the $5 and $10 incentive levels. Experiment 2: Another experiment was conducted comparing 4 incentive levels: a small gift; $10 incentive and gift; $20 incentive; $30 incentive. The surveys were sent to a sample of diabetes specialists. The author found that the gift incentive resulted in a low response rate, but the gift and $10 incentive and $20 incentive resulted in much higher response rates. However, the response rate for the $30 incentive group was not significantly higher than the $20 incentive group. Regression modeling across the two experiments suggested that incentive, number of pages, specialist, and gift contributed significantly to stepwise regression model. The author concludes that the gift was more effective when combined with a financial incentive. Losh, M. E., Thompson, N., Lutz, G. (2004). The Effect of Mode on Response Rates and Data Quality in a Survey of Physicians. The American Association for Public Opinion Research (AAPOR) 59th Annual Conference, Physicians represent a survey target group that is difficult to reach and often has low compliance rates. Inclusion of incentives has been shown to increase response rates but few systematic studies have compared the effect of mode on physician response rates. Some earlier studies found little evidence that web administration improved response rates even though ease of completion and efficiency have been listed as factors affecting likelihood of response. Additionally, some evidence suggests that responses may differ based on mode of administration. In this study, mode of initial administration was manipulated in a 3-group experiment. Physicians were randomly assigned to web, paper, or choice (either web or paper) in initial survey recruiting. In the follow-up, both web and paper were offered to all respondents. The effect of mode on
−35−
initial response rates was presented and discussed. Comparisons of data quality between web and paper responses was also presented. Lusk, C., Delclos, G. L., Burau, K., Drawhorn, D.D., Aday, L.A. (2007). Mail Versus Internet Surveys:
Determinants of Method of Response Preferences Among Health Professionals. Evaluation & the Health Professions, 30(2): 186-201.
The authors evaluated determinants of response to Internet-based surveys in a sample (n = 5600) of Texas healthcare professionals. Participants were given the option of responding by mail or over the Web (response, 66%). Internet respondents were younger (p < .001), had worked fewer years in healthcare (p < .001), and were more likely to be male (p < .001) and to work in a hospital (p = .007). Missing questionnaire items were significantly higher among Web responders with regard to age, sex, race, body mass index, and smoking (p < .001). In the final multivariate logistic regression, only male gender (odds ratio [OR] = 2.09, 95% CI = 1.56-2.80) and younger age remained significantly associated with response over the Internet. Age quartile and responding electronically were inversely associated. Taken together with a priori knowledge of the demographic and professional profile of a study population, these findings can be useful in planning and implementation of surveys among healthcare workers. Maheaux, B, Legault, C, and Lambert, J (1989). Increasing Response Rates in Physicians’ Mail
Surveys: An Experimental Study. American Journal of Public Health, 79(5), 638-639. This study describes a survey of physicians in Quebec conducted in 1989. The sample included 729 general practitioners and 379 specialists. The questionnaire, on patient care issues, included 70 closed-choice items and took about 20 minutes to complete. Following the first mailing, half of the respondents received a follow-up letter with handwritten postscript which resulted in a 30% response rate. The other half of the respondents received no follow-up which resulted in a 21% response rate. In addition, nonrespondents in the second mailing were randomized into one of two groups. The first group received the same mail packaging as the first mailing resulting in a 26% response rate. The second group received a personalized/TDM package resulting in a 40% response rate. Overall, a final response rate of 78.9% was achieved. Malin, J, Rideout, J, Ganz, P (2000). Tracking Managed Care: The importance of a Cash Incentive for
Medical Director Response to a Survey. American Journal of Managed Care, 6(5), 1209-1214. This survey assessed the impact of a monetary incentive on response rate of medical directors. Surveys were mailed to the directors and IPAs of a large California managed care health plan (n=174). Following the second mailing without an incentive, a $50 bill was included in the third mailing. The response rate for the first and second mailing was 30%. The third mailing received a 76% response rate. There were no significant differences in the physician organizations of medical directors who responded to the third mailing compared to the organizations of the first and second mailing. The authors concluded that including a$50 bill improved the response rate considerably.
−36−
Marder, WD and Thran, SL. (1988). Proxy or Principal: Cost Minimizing Strategies of Survey Respondents. ASA Proceedings of the Section on Survey Research Methods. 497-499.
This study examined the characteristics of physicians who designate proxies and compares data quality (item response rates) of proxies versus principals. The survey, the American Medical Associations’ Socioeconomic Monitoring Survey, included a sample of 623 proxies (15.5%) out of 4014 respondents. An overall response rate of 66.9% was achieved. The authors calculated the average hourly wage of respondents and compared it to the quality of proxy responses in the income/expense and fees sections of questionnaire. The authors concluded that those who used proxies had higher predicted wages and differences by specialty (more proxies in surgery, ob/gyn, while fewer in psychiatry, pathology, and ER) and region (fewer proxies in NE region). The authors also found that hourly wage was a significant predictor of using a proxy. Item response rates were lower for proxies than principals on net income (59% versus 81%) and expenses (56% versus 67%), while proxy response rates were higher for fees (92% versus 87%). Maheux, B, Legault, C, and Lambert, J. (1989). Increasing Response Rates in Physicians’ Mail
Surveys: An Experimental Study. American Journal of Public Health, 79(10), 1434. It is becoming increasingly difficult to obtain high response rates in physicians' mail surveys. In 1983-84, we tested the effectiveness of two techniques among 604 Quebec physicians who had not responded to an initial letter. A handwritten thank you note at the bottom of the letter accompanying the questionnaire and a more personalized mailout package increased response rates by 40.7 per cent and 53.1 per cent, respectively, compared to control groups. McAvoy BR, Kaner EF: (1996) General practice postal surveys: a questionnaire too far? British
Medical Journal, 313(7059), 732-733. A primary care led NHS, driven by evidence based practice, needs to build on a firm foundation of research in primary care. As researchers are making increasing use of questionnaire surveys to assess general practitioners' views and attitudes, so response rates to questionnaire surveys among general practitioners are dropping. The reasons include lack of perceived relevance of the research and lack of information and feedback about it, and researchers need to be more aware of the realities of everyday practice. Approaches that might reverse this trend include monitoring all research activities going on in an area to ensure that practices are not overused, giving general practitioners incentives to participate, and improving the relevance of research and the quality of questionnaires. McCarthy, GM, Koval, JJ, and MacDonald, JK. (1997). Nonresponse Bias in a Survey of Ontario
Dentists’ Infection Control and Attitudes Concerning HIV. Journal of Public Health and Dentistry, 57(1), 59-62.
This study investigated late response and nonresponse bias in an HIV-related survey of dentists. Questionnaires with ID numbers were mailed to all dentists in Ontario (N = 5,997) with additional mailings four and seven weeks later. Proportionately more respondents who returned questionnaires less than four weeks after the first mailing reported that they knowingly treated (P < .05) or were willing to treat HIV-infected patients (P < .05); that they had an accurate perception of risk of HIV infection after a needle stick injury (P < .01), and preferred not to refer HIV-infected patients (P < .01). Linear extrapolation of cumulative percent responses indicated nonresponse bias in terms of attitude and knowledge items; however, the magnitude was low. The effects of late response and nonresponse bias on the results of this study were small. However, these results cannot be generalized beyond the study population, and obtaining high response rates and testing for nonresponse bias in surveys of attitudes related to HIV are recommended.

This study identifed whether the form of introduction to a study and knowledge of a substantial prize influence the response rate of general practitioners (GPs) to a postal survey. A postal survey of 700 randomly selected Victorian GPs concerning management of early pregnancy bleeding and miscarriage, incorporating two randomized-controlled trials of recruitment methods; analysis of response rates and costs at 4 weeks and 11 weeks. The response rate was 61.5% of eligible participants. Doctors made aware of a prize were more likely to respond in the first four weeks (difference in response rate 10.2%, 95% confidence interval (CI) 2.8%-17.6%). This difference diminished after the first four weeks. Doctors introduced to the survey by a telephone call were no more likely to respond than those introduced by a postcard. The use of a postcard saved 73% of the cost of introducing the survey by telephone. Female doctors were more likely than males to reply (difference 12.3%, 95% CI 4.7%-19.9%). Rural doctors were no more likely to reply than urban doctors. Very few doctors (16.2%) completed a Practice Assessment activity associated with the survey. A valuable prize will accelerate response to a survey by GPs, thereby reducing the costs of follow-up. The cost of telephoned introductions is not justified, when compared with a brief written introduction.
−37−
McFarlane, EM, Murphy, J, Olmsted, MG, and Hill, CA. (2007). Nonresponse Bias in a Mail Survey of
Physicians. Evaluation and the Health Professions, 30(2), 170-185. With the increased pressure on survey researchers to achieve high response rates, it is critical to explore issues related to nonresponse. In this study, the authors examined the effects of nonresponse bias in a mail survey of physicians (N = 3,400). Because slightly more than one half of the sample did not respond to the survey, there was potential for bias if nonresponders differed significantly from responders with respect to key demographic and practice variables. They analyzed response status and timing of response with respect to five variables: gender, region, specialty, urbanicity, and survey length. The potential consequences of nonresponse bias on the survey estimates were then analyzed. Men were more likely to respond, as were physicians receiving a shorter questionnaire. Repeated follow-up attempts reduced gender response bias because male physicians were more likely to be early responders. Overall, higher response rates were not associated with lower response bias. McKenzie-McHarg, K, Tully, L, Gates, S, Ayers, S, and Brocklehurst, P. (2005). Effect on Survey
Response Rate of Hand Written versus Printed Signature on a Cover Letter: Randomised Controlled Trial. BMC Health Service Research, 9(5), 52.
It is important that response rates to postal surveys are as high as possible to ensure that the results are representative and to maximise statistical power. Previous research has suggested that any personalisation of approach helps to improve the response rate. This experiment tested whether personalising questionnaires by hand signing the covering letter improved the response rate compared with a non-personalised group where the investigator's signature on the covering letter was scanned into the document and printed. Randomised controlled trial. Questionnaires about surgical techniques of caesarean section were mailed to 3,799 Members and Fellows of the Royal College of Obstetricians and Gynaecologists resident in the UK. Individuals were randomly allocated to receive a covering letter with either a computer printed signature or a hand written signature. Two reminders were sent to non-respondents. The outcome measures were the proportion of questionnaires returned and their time to return. The response rate was 79.1% (1506/1905) in the hand-signed group and 78.4% (1484/1894) in the scanned and printed signature group. There was no detectable difference between the groups in response rate or time taken to respond. No advantage was detected to hand signing the covering letter accompanying a postal questionnaire to health professionals. McLaren B, Shelley J. (2000). Response rates of Victorian general practitioners to a mailed survey on miscarriage: randomized trial of a prize and two forms of introduction to the research. Aust N Z Journal of Public Health. 2000, Vol. 24:360-4.

−38−
McMahon SR, Iwamoto M, Massoudi MS, Yusuf HR, Stevenson JM, David F, Chu SY, Pickering LK. (2003). Comparison of e-mail, fax, and postal surveys of pediatricians. Pediatrics. Apr;111(4 Pt 1):e299-303. This study compared three communication modes (postal, fax, and e-mail) in a rotavirus vaccine physician survey. They used 3 communication modes to distribute a survey to physicians listed in the membership directory of the Georgia Chapter of the American Academy of Pediatrics. The directory listed 1391 members; however, 404 were deemed ineligible on the basis of their listing as a specialist, retiree, resident in training, or government public health employee. Of the 987 members expected to administer vaccines, 150 were selected randomly to receive the postal survey (postal group). Of the remaining listings, 488 (58%) of 837 listed a fax number; 150 members were selected randomly and faxed a survey (fax group). Of the remaining members, 266 (39%) of 687 had e-mail addresses listed; 150 members were selected randomly for the e-mail survey (e-mail group). A follow-up survey was sent by the same mode at 2 weeks. A final survey was sent via another mode (mixed mode) at 1 month: by fax to e-mail and postal nonresponders and by post to fax nonresponders and those without fax. Eligible respondents in the 3 survey groups were similar in their practice setting and location. Although the e-mail group had fewer median years (8 years) since medical school graduation than the fax group (19 years) and postal group (17 years), a similar percentage of responders in all groups had computers (>85%) and Internet access (> or =70%) at work. However, only 39% of members listed an e-mail address in the directory. There were significant differences among the 3 groups for invalid addresses/numbers (4% postal, 8% fax, and 16% e-mail) listed in the directory. Using mixed modes as the third contact, the overall response rate increased from 39% before mixed mode to a final of 53%. On the basis of the 3 initial groups, responses to 1 of 12 rotavirus questions differed significantly. They concluded that future use of e-mail surveys in selected circumstances is promising, because the majority of providers have Internet access and acknowledged interest in participating in e-mail surveys. E-mail surveys could be especially useful if rapid response time is necessary. There were fewer incomplete questions by participants who completed the e-mail survey compared with postal or fax participants. Updating membership e-mail addresses and routinely using e-mail as a communication tool should improve the ability to use e-mail surveys. There may need to be ongoing evaluations that critically evaluate providers' responses to e-mail surveys compared with other survey modes before e-mail surveys can become a standard survey tool. In the meantime, mixed-mode surveys may be an option. Menachemi, N., Hikmet, N., Stutzman, M., Brooks, R.G. (2006). Investigating response bias in an information technology survey of physicians. Journal of Med Systems, 30, 277–282.
The authors explained that monitoring the diffusion of electronic health records (EHR) into ambulatory clinical practice has important policy implications. However, estimates of EHR use are typically derived from survey data and may be subject to significant response bias. The current study is a retrospective analysis testing for response bias in a large information technology survey of physicians (n=14,921). To detect bias, respondents were compared to nonrespondents on known characteristics. Moreover, early respondents were compared to late respondents with respect to key variables in the survey that are likely to influence participation. The 4,203 respondents (28.2% participation rate) did not differ demographically from nonrespondents. Response rates, by specialty, differed slightly. When comparing early and late survey respondents, no differences were detected in EHR use, length of time since EHR installation, practice size, physician age, years since medical school graduation, and years of practice in their current community. Overall, response bias was not detected using established methodologies in this mailed survey of physician EHR use. Similar surveys of physicians, even with a lower than expected response rate, may still be valid.

−39−
Mizes, JS, Fleece, ME and Roos, C (1984). Incentives for Increasing Return Rates: Magnitude Levels, Response Bias, and Format. Public Opinion Quarterly, 48(4), 794-800.
This survey was administered to 200 allergy specialists. The instrument was a five item questionnaire on treatment of rhinitis medicamentosa. The authors compared the inclusion of a $1 and $5 incentive payment, and postcard with answer check (answer sheet on back of payment check), in determining the return rate for each treatment. The authors reported response rates of 53% for the $1 incentive group, 63% for the $5 incentive group, 73% for the postcard group, and 74% for the answer check group. The authors concluded that there were no significant differences between each of the groups. Montauk, L. (2000). Medical Junk Mail. The Lancet, 356, p. 344. No abstract available. Moore, DL, Gaudino, J, DeHart, P, Cheadle, A, and Martin, D (2001). Physician Response in a trial of
High-Priority Mail and Telephone Survey Mode Sequences. 2001 EDS. M. Cynamon and R. Kulka. Health Survey Research Methods, Department of Health and Human Services, Centers for Disease Control, and National Center for Health Statistics, DHHS Publication (PHS) 01-1013. 149-154.
The Department of Health and the Social and Economic Sciences Research Center at Washington State University studied the effectiveness of using U.S. Postal Service 2-day priority mail verses telephone mode sequences. The survey sampled pediatric and family practice physicians on the subject of immunization. The sample included the entire population of eligible physicians in Washington state (n=2,472) and was conducted during January through October 1998. The “mail-start” experimental group was sent a questionnaire by two-day priority mail with two additional follow-up contacts by mail, followed by a second mailing after the fifth week. The “telephone-start” experimental group received a notification letter prior to the telephone contact. This group received up to 20 attempted phone contacts. The survey resulted in an overall 76% response rate. The “telephone-start” group achieved a 59% response rate, compared to a 62% response rate from the “mail-start” group which was significant at p = .001. The authors concluded that using two-day priority mail in conjunction with a telephone follow-up is effective in increasing response among physicians. Furthermore, the two-day priority mail as first and primary mode sequence was significantly associated with higher response. Moore, DL and An, L (2001). Effect of Mail Packaging, Postal Level, Token Incentive, and Timing of
Incentive on Response for a Physician Practice Addressed Survey of Physicians. An experimental study of physicians was conducted altering postage and mail packaging in conjunction with the use of a token monetary incentive at several stages of follow-up. With a sample size of 1,474, six treatment group comparisons were selected to show how response rates change. The comparison groups include: a control group of first or second mail follow-up, an group combining an incentive with first class postage rather than 2-day priority mail, and a group receiving plain packaging with no incentive for the two contacts that send mail questionnaires. An overall response rate of 62% was achieved. The results of the study indicated that the use of priority mail in combination with a monetary incentive at first or second questionnaire mail contacts was a superior combination for obtaining response rate. The groups including a $10 incentive and using 2-day priority mail also resulted in an increased response rate.
Moses, SH and Clark, TJ. (2004). Effect of prize draw incentive on the response rate to a postal survey of obstetricians and gynaecologists: A randomised controlled trial. BMC Health
−40−
Services Research. Vol 4(14):4-14 Response rates to postal questionnaires are falling and this threatens the external validity of survey findings. We wanted to establish whether the incentive of being entered into a prize draw to win a personal digital assistant (PDA) would increase the response rate for a national survey of consultant obstetricians and gynecologists. A randomized controlled trial was conducted. This involved sending a postal questionnaire to all Consultant Obstetricians and Gynecologists in the United Kingdom. Recipients were randomized to receiving a questionnaire offering a prize draw incentive (on response) or no such incentive. The response rate for recipients offered the prize incentive was 64% (461/716) and 62% (429/694) in the no incentive group (relative rate of response 1.04, 95% CI 0.96 – 1.13). The offer of a prize draw incentive to win a PDA did not significantly increase response rates to a national questionnaire survey of consultant obstetricians and gynecologists.
Mullen, PD, Easling, I, Nixon, SA, Koester, DR, and Biddle, AK. (1987). The Cost-Effectiveness of
Randomized Incentive and Follow-up Contacts in a National Mail Survey of Family Physicians. Evaluation and the Health Professions, 10(2), 232-245.
This study, a national mail survey of 1218 family practice physicians, inquired about involvement with counseling patients on topics such as smoking, weight management, exercise, and stress. The questionnaire, a 4 page 140 item instrument, required about ten minutes to complete. The authors used TDM methods (personalized cover letter, stamped envelope, described uses of data, stressed confidentiality, offered summary of results), a 2-week reminder postcard, a second questionnaire and letter after 2 weeks, and a final letter and questionnaire sent by certified mail. The authors tested the impact on initial response rates of non-monetary incentives (sticker) with an invitation to withdraw from the survey. They also looked at the effectiveness and efficiency of three different types of follow-up contact. Finally, they looked at the response rates for each condition. The authors reported that the initial response rates (an average of 40.5%) were not significant among the different groups, although interaction was nearly significant. The final response rates (an average of 72.8%) were not significantly different among the groups, although withdrawal from study was nearly significant (4.8% at the first mailing). Both the non-monetary incentive and offer to withdraw had no effect on response rates. Myers, RP, Shaheen, AA, and Lee, SS, (2007). Impact of pharmaceutical industry versus university
sponsorship on survey response: a randomized trial among Canadian hepatitis C care providers. Canadian Journal of Gastroenterology, 21(3), 169-75.
Surveys originating from universities appear to have higher response rates than those from commercial sources. In light of the growing scrutiny placed on physician-industry relations, the present study aimed to determine the impact of the pharmaceutical industry versus university sponsorship on response to a postal survey completed by Canadian hepatitis C virus (HCV) care providers. In the present controlled trial, 229 physicians and nurses involved in HCV treatment were randomly assigned to receive a survey with sponsorship from a pharmaceutical company or university. The primary outcome was the proportion of completed surveys returned. The secondary outcomes included the response rate after the first mailing and the number of days taken to respond. One hundred fifteen participants were randomly assigned to receive the pharmaceutical industry survey and 114 were assigned to receive the university survey. The final response rate was 72.9% (167 of 229), which did not differ between the industry and university groups (RR=0.91; 95% CI 0.78 to 1.07). Nurses (OR=2.20; 95% CI 1.08 to 4.48) and participants from an academic centre (OR=3.14; 95% CI 1.64 to 6.00) were more likely to respond. The response rate after the first mailing (RR=0.85; 95% CI 0.68 to 1.07) and the median number of days taken to respond (21 days in both groups; P=0.20) did not differ

−41−
between the industry and university groups. Pharmaceutical industry sponsorship does not appear to negatively impact response rates to a postal survey completed by Canadian HCV care providers. Narayanan, V., Giambo, P., Fry, S., Crafts, J. (2007). Using the Web for Surveys of Medical Providers. 3rd International conference on establishment surveys.
The authors offer case studies of using the web in the Medicare Contractor Provider Satisfaction Survey and Survey of Provider Satisfaction with Quality Improvement Organizations. In both, the web survey is offered as the first option. All respondents receive a survey notification package with instructions to complete the web survey and a reminder/ thank you postcard. Nonresponders are followed up by telephone. While the design is relatively straightforward, use of the web and telephone poses unique challenges. They focused on design issues for a multimode survey, use of usability testing to ensure ease of navigation of the web survey, proportion of the sample completed by the web, correlates of selecting the web to respond, and procedural issues related to accommodating two or more modes Oden, L and Price, JH. (1999). Effects of a Small Monetary Incentive and Follow-up Mailings on
Return Rates of a Survey to Nurse Practitioners. Psychological Reports, 85, 1154-1156. The purpose of this study was to examine the effectiveness of a modest monetary incentive ($1) and no incentive on increasing the response rate of a mail survey to 600 nurse practitioners. The study achieved a response rate of 81% in the incentive group compared to 66% in the control group. The authors found that the most cost effective survey technique for increasing the response rate of nurse practitioners was to code the envelopes and eliminate the monetary incentive. Ogborne, AC, Rush, B and Fondacaro, R (1986). Dealing with Nonrespondents in a Mail Survey of
Professionals: The Cost-Effectiveness of Two Alternatives. This survey of health professionals (physicians and others) used prenotification techniques, stamped envelopes, personal signatures, cover letter, and a 6-page questionnaire of Likert-type items. Overall, the authors reported a 39% physician response rate after the first mailing. Nonrespondents were then sent either a second mailing or they received a phone follow-up which offered them the opportunity to complete the interview by phone. When the authors compared the cost of the two strategies, they found that the cost of the phone follow-up was $13.00/per case complete (only 4 chose phone interview while 17 requested a second questionnaires), versus $6.66/per case complete for 2nd mailing group. Olmsted, MG, Murphy, J, McFarlane, EM, and Hill, CA. (2005). Evaluating Methods for Increasing
Physician Survey Cooperation. In Proceedings of the section on survey research methods of the American Statistical Association, American Statistical Association.
Over the years, a number of effective methods have been developed to increase the level of survey participation. These methods include pre-notification letters, incentives, reminders, survey form design, endorsement letters, sending additional surveys, and shortening survey length, among others. Each of these methods has been demonstrated to have a positive impact on the level of participation in surveys with the general population. However, the success of many of these methods has not been adequately tested with special or elite populations such as physicians who typically have low rates of survey participation. One of the key questions for researchers considering methodological improvements is the cost to benefit ratio (or cost-effectiveness). Essentially, the question is which method will yield the best response at the lowest cost. To address this issue, researchers at RTI International conducted several experiments within a national survey of

−42−
board certified physicians conducted as part of the “America’s Best Hospitals” project for U.S. News & World Report. This paper discusses the results of two methodological experiments designed to increase physician survey cooperation/participation by use of reminders and survey length. The usefulness of cost-effectiveness analyses is also explored as a possible addition to the methodological toolbox of survey researchers. Olson, L, Srinath, KP, Burich, MC, Klabunde, C (1999). Use of a Website Questionnaire as One
Method of Participation in a Physician Survey. American Association of Public Opinion Research.
This study gaged the response rate of physicians using the Internet as a survey mode option. The study, sponsored by the National Cancer Institute, surveyed physicians on Colorectal Cancer Screening Practices. Four versions of the questionnaire were offered to respondents: mail, fax, telephone, and website. Respondents were initially sent a “fulfillment” card asking them to choose the survey mode that works best for them. An overall response rate of 72% for primary care physicians and 83 % for specialists was achieved. Eighty-five percent responded by mail compared to 7.3% by internet, 3.4% by fax, and 4.2% by telephone. The results suggested that physicians who choose to use the Internet version were predominantly younger, male, graduate of a US medical school, worked in a large medical practice, or an employee of an HMO. Interestingly, 78% of those which completed the web questionnaire indicated that they would not have completed the survey if the web option was not available. The authors concluded that the web questionnaire was a success in terms of physician satisfaction. Olson, L and Schneiderman, M (1994). Physicians’ Motivations for Focus Group Attendance.
American Association of Public Opinion Research. The study researched physicians’ motivations for focus group attendance in terms of money, curiosity, or self-expression. The authors found that physicians which were motivated by money were less interested in research. They also found that motivations were related to age, gender, specialty, and country of medical school. Those most interested in attending focus groups were most interested in self-expression. Olson, L, Schneiderman, M, and Armstrong, RV. (1993). Increasing Physician Response in Surveys.
ASA Proceedings, Survey Research Methods section. 1036-1041. Compared AMA-sponsored research versus research from sponsored surveys of AMA journal. The authors found an 11.2% higher response rate w/ AMA sponsorship and little differences to survey answers comparing the two sponsorship conditions. Characteristics of the respondents differed by number of procedures, diagnostic tests, and noncooperative patient visits. They did not differ by AMA membership, type of practice, or major professional activity. The authors concluded that self-evaluation can produce valid results (versus neutral outside evaluator). Compared personalization versus no-personalizationThe authors sampled callers to AMA regarding satisfaction to services received in-calls. Personalization = date/time of call-in, department called, personalized cover letter, and the use of a window envelope. The authors found a higher response rate (45.3% versus 27.5% after 1 month) with personalization. However, there was no difference in terms of data quality (unanswered questions) For mail survey of international medical school grads, they found no difference with personalization for personalized outer envelope versus mailing label reply envelopes, but there were differences in regards to questions on discrimination. The authors concluded that researchers may want to avoid personalization in surveys where anonymous responding is warranted. Studied non-cash incentives

−43−
Charity incentives: A 6-page survey on AMA journal readership (2 mailings with up to 10 telephone follow-up calls) compared $1 charity incentive (respondent chooses from list of 8) versus no charity offered. Measures were taken to personalize the mailing (appearance, materials) in order to maximize the response rate. The authors found no meaningful differences by the charity incentive condition. Other non-cash incentives: A research brief and discount on AMA products were offered to respondents who returned a questionnaire (with similar measures to attain high response rates) for a physician panel survey. The authors reported that 23.7 % of the discount coupons were redeemed. The ratings indicated that the research brief rated higher than the coupons with respect to getting something in return for completing the questionnaire. The authors concluded that respondents who believed that the survey was relevant may have been a stronger motivation for participation. Parsons, JA, Johnson, TP and Warnecke, RB (1993). The Effect of Interview Characteristics on
Gatekeeper Resistance in Surveys of Elite Populations. Evaluation Review, 17(2), 131-143. Telephone surveys of professionals are often routed through gatekeepers. This study examined the effect of interviewer characteristics (gender and experience) on securing gatekeeper cooperation in an NCI National Physician Survey of primary care physicians. An overall response rate of 63% was achieved (67% for surgeons and 52% for internists) (55% by phone and 45% by mail). The authors concluded that there were no significant differences between gender or years of experience. However, patterns suggest that inexperienced female interviewers receive higher gatekeeper refusals. Males had a 5.5% higher completion rates (ns). Experienced interviewers had 6% lower (p = 0.06) completion rate - more interviews at end of data collection, with hard-core refusals; no significant differences for physician refusal. In general, the authors concluded that males did better, possibly due to role issues, and more experienced interviewers were better at overcoming gatekeeper and physician refusals. Parsons, JA, Warnecke, RB, Czaja, RF, Barnsley, J and Kaluzny, A (1994). Factors Associated with
Response Rates in a National Survey of Primary Care Physicians. Evaluation Review, 18(6), 756-766.
This study examined the characteristics of early versus late responders by specialty when allowing respondents to choose between mail and telephone interview. The authors used the NCI Community Clinical Oncology Program Survey to construct a sample of physicians. The authors reported an overall completion rate of 63%. The authors found there were lower completion rates for phone interviews and more contact attempts for phone interviews required. The authors concluded that late responders were less centrally involved in professional activities and were less likely to be employed in a group practice. Peugh, J., Zapert, K. . (2004). Exploration of Physicians Who Choose to Respond Online. The American Association for Public Opinion Research (AAPOR) 59th Annual Conference.Given the proliferation of the Internet, survey researchers are turning more often to Web-based surveys (either exclusively or in conjunction with traditional methods), including for research with hard to reach professionals such as physicians. This trend has raised a number of questions as to its impact on sample representativness. A recent mail survey of physicians (sampled from the American Medical Association database) conducted by Harris Interactive and the Commonwealth Fund allowed physicians to complete either the paper version of the survey or to complete the survey online. A total of 1,837 physicians completed the survey (response rate of 52%). Of these, 157 (9%) completed the survey online. This survey asked about a wide range of topics including observation of medical problems and errors, use of technology, satisfaction with current practice, and other topics. Using data from this study, we explore the following questions: 1) Is the profile of physicians who choose to respond online different from those who respond via mail?; 2) Are the views of physicians who choose to respond online different from those who respond via mail?; 3) If

−44−
differences exist, do they persist after controlling for demographic factors and practice profiles; and 4) Do differences vary by topic. By analyzing the results of this survey by participants’ chosen method of response, this paper addresses selected concerns about potential biases in online survey research, while also providing information about the characteristics of physicians who prefer to respond to surveys online. This information will allow us to better evaluate the viability of recruiting physicians for online surveys, whether there are any inherent biases in using this method, and whether some topics may be more appropriate than others for online surveys of physicians.
Potts HW, and Wyatt, JC. (2002). Survey of Doctors’ Experience of Patients Using the Internet.
Journal of Medical Internet Research, 4(1), e5. There have been many studies showing the variable quality of Internet health information and it has often been assumed that patients will blindly follow this and frequently come to harm. There have also been reports of problems for doctors and health services following patient Internet use, but their frequency has not been quantified. However, there have been no large, rigorous surveys of the perceptions of Internet-aware doctors about the actual benefits and harms to their patients of using the Internet. To describe Internet-literate doctors' experiences of their patients' use of the Internet and resulting benefits and problems. Online survey to a group of 800 Web-using doctors (members of a UK medical Internet service provider, Medix) in September and October 2001. Responses were received from 748 (94%) doctors, including 375 general practitioners (50%). Respondents estimated that 1%-2% of their patients used the Internet for health information in the past month with no regional variation. Over two thirds of the doctors considered Internet health information to be usually (20%) or sometimes (48%) reliable; this was higher in those recently qualified. Twice as many reported patients experiencing benefits (85%; 95% confidence interval, 80%-90%) than problems (44%; 95% confidence interval, 37%-50%) from the Internet. Patients gaining actual physical benefits from Internet use were reported by 40% of respondents, while 8% reported physical harm. Patients' overall experiences with the Internet were judged excellent 1%, good 29%, neutral 62%, poor 9%, or bad <1%. Turning to the impact of patient Internet use on the doctors themselves, 13% reported no problems, 38% 1 problem, and 49% 2 or more problems. Conversely, 20% reported no benefits for themselves, 49% 1 benefit, and 21% 2 or more benefits. These doctors reported patient benefits from Internet use much more often than harms, but there were more problems than benefits for the doctors themselves. Reported estimates of patient Internet usage rates were low. Overall, this survey suggests that patients are deriving considerable benefits from using the Internet and that some of the claimed risks seem to have been exaggerated. Price, JH. (2000). “Show Me the Money:” Medical Directors’ Responses to a Mail Survey. American Journal of Managed Care, 6(11), 1257-1259. This article examined the difficulties in obtaining response from medical directors using a mail survey. The author cites a number of reasons, including unwillingness to take part in stereotyping and generalization, resistance to restrictions imposed by closed-format questions, and a hesitancy to respond to questions that “don’t make sense.” The author cites two techniques that have consistently shown to improve response rates: the use of a modest incentive and conducting multiple follow-up contacts.
Puleo, E., Zapka, J., White, M.J., Mouchawar, J., Somkin, C., Taplin, S. (2002). Caffeine, cajoling, and other strategies to maximize clinician survey response rates. Evaluation & The Health Professions, 25(2), 169-184. The authors explained that an ongoing objective in health services research is to increase response rates to clinician surveys to ensure generalizability of findings. Three HMOs in the Cancer Research Network participated in a primary care clinician survey to better understand organizational characteristics affecting

−45−
adoption and implementation of breast and cervical cancer screening guidelines. A four-stage data collection strategy was implemented to maximize response. This included careful attention to survey design and layout, extensive piloting, choice of token incentive, use of “local champions,” and denominator management. An overall response rate of 91% was attained, ranging from 83 to 100% among the plans (N = 621). Although the response rate after the second stage of data collection met commonly used standards, the authors argue for the four-stage method due to the possibility of differences when comparing early and late responders. This is important when multiple plans with differing structure and internal characteristics are surveyed. Raziano, DB, Ravishankar, J, Valenzula, D, Weiner, M, and Lavizzo-Mourey, M (2001). E-mail Versus
Conventional Postal Mail Survey of Geriatric Chiefs. The Gerontologist. 41(6), 799-803. This study compared the response time, response rate, and cost of two types of survey administration techniques (e-mail versus conventional postal mail). A sample of 114 geriatric chiefs was drawn and evenly distributed into either a postal group or email group. The survey instrument took about five minutes to complete. The survey achieved a 58% response rate among the e-mail group compared to 77% among postal group. Other finding indicated that email resulted in a quicker response and is less expensive ($7.70 versus $10.50 per case). The authors concluded that email is less expensive and quicker, but does not result in an increase in response rate compared to conventional postal mode of delivery. Robertson J, Walkom EJ, and McGettigan P. (2005). Response rates and representativeness: a lottery
incentive improves physician survey return rates. Pharmacoepidemiol Drug Safety. Vol 14(8):571-7.
This study tested the effect of a AU dollars 2 scratch lottery ticket on response rates to a national mailed questionnaire of Australian general practitioners (GPs) and medical specialists. A randomized controlled trial was conducted and the incentive sent to half of the participants with the first mailing. A single follow-up mailing without incentive was sent to all non-respondents. Survey respondents were then informed of the research question regarding incentives and allowed to withdraw their study data. Differences in response rates between doctors receiving and not receiving the incentive, and between respondents and non-respondents, were examined. The overall response rate was 47% (443 respondents). Twenty-two respondents (5%) withdrew their data after being informed of the research question. Of the remaining 421 respondents, 233 had received the incentive (response rate 49.7%) and 188 had not (40.1%, p=0.0032). The absolute increase in response rate with the incentive (9.6%, 95%CI 3.2, 15.9) was quantitatively similar in effect to the reminder mailing (11.8%). The incentive had a larger effect among the GP sample compared with specialists (13.4 vs. 5.9%), although the difference was not statistically significant (p=0.20). There were no systematic differences in demographic characteristics between respondents and non-respondents. Increased response rates associated with a small incentive may reduce the need for a second mailed reminder, but strong views about the use of incentives may negatively influence the participation of some practitioners. While the overall response rate was low, there was no evidence of bias in our sample.
Rodriguez, H. P., von Glahn, T., Rogers, W. H., Chang, H., Fanjiang, G., Safran, D. G. . (2006). Evaluating Patients' Experiences with Individual Physicians: A Randomized Trial of Mail, Internet, and Interactive Voice Response Telephone Administration of Surveys. Medical Care, Vol. 44, :pp. 167-174
There is increasing interest in measuring patients' experiences with individual physicians, and empirical evidence supports this area of measurement. However, the high cost of data collection remains a significant barrier. Survey modes with the potential to lower costs, such as Internet and interactive voice response (IVR) telephone, are attractive alternatives to mail, but their comparative response rates and data quality have not been tested. The authors randomly assigned adult patients from the panels of 62 primary care physicians in

−46−
California to complete a brief, validated patient questionnaire by mail, Internet (web), or IVR. After 2 invitations, web and IVR nonrespondents were mailed a paper copy of the survey ("crossover" to mail). They analyzed and compared (n = 9126) the response rates, respondent characteristics, substantive responses, and costs by mode (mail, web and IVR) and evaluated the impact of "crossover" respondents.
Response rates were higher by mail (50.8%) than web (18.4%) or IVR (34.7%), but after crossover mailings, response rates in each arm were approximately 50%. Mail and web produced identical scores for individual physicians, but IVR scores were significantly lower even after adjusting for respondent characteristics. There were no significant physician-mode interactions, indicating that statistical adjustment for mode resolves the IVR effect. Web and IVR costs were higher than mail.
The equivalence of individual physician results in mail and web modes is noteworthy, as is evidence that IVR results are comparable after adjustment for mode. However, the higher overall cost of web and IVR, as the result of the need for mailings to support these modes, suggests that they do not presently solve cost concerns related to obtaining physician-specific information from patients. Schneiderman, M., Thran, S., Adams, C., Lerner, B. . (2003). Using Internet-Based Surveys With
Physicians, What Works and What Doesn't Work. The American Association for Public Opinion Research (AAPOR) 58th Annual Conference, 2003.
No abstract available.
Schoenman, J.A., Berk, M.L., Feldman, J.J., Singer, A. (2003). Impact of differential response rates on the quality of data collected in the CTS physician survey. Evaluation & The Health Professions, 26(1), 23-42. This study used data from the Community Tracking Study’s Physician Survey and examined how survey estimates and data quality changed as additional respondents completed the survey. Results showed that improvements in response rates over the range examined (i.e., up to 65%) did not change estimates appreciably nor affect data quality. As long as these results are not overstated to imply that extremely low response rates are credible, this study may permit researchers to disseminate interesting results in peer-reviewed journals even when the response rate falls slightly short of current standards. It must also be emphasized, however, that we were unable to measure the nonresponse effect of those who were never interviewed. Achieving a response rate significantly above 65% might have changed the survey results appreciably. Sheatsley, PB and Loft, JD. (1981). On Monetary Incentives to Respondents. Public Opinion
Quarterly, 45(4), 571-572. This article explains that payment of money by government agencies to physicians for completing a 20 to 30 minute survey that is not overly burdensome or for private use, especially when it’s professionally beneficial, is inappropriate. Shiono, PH and Klebanoff, MA. (1991). The Effect of Two Mailing Strategies in the Response to a
Survey of Physicians. American Journal of Epidemiology, 134(5), 539-542. A survey of 10,047 physicians which recently graduated. Physicians were sent a three-page questionnaire on pregnancy outcomes, a cover letter, an endorsement letter, a postcard reminder, and a second questionnaire over a 6-week data collection period. The authors also attempted to conduct the interview by phone to non-respondents. A two-factor experiment was designed: a pre-notification letter or no letter and by franked or by

−47−
stamped return envelope. The authors looked at the response rate after two mailings. Survey results indicated that pre-notification did not increase the response rate. A stamped letter did result in a significant improvement in response rate (66.5% versus 60.6%) overall among men. However, this was not significant among women. They also found that calling increased response rates, but did not eliminate the advantage of the stamped return group. The authors estimated that by placing stamps on letters and eliminating pre-notification could have saved $6000-$12,000 for a survey with 10,000 respondents. Shosteck, H and Fairweather, WR. (1979). Physician Response Rates to Mail and Personal Interview
Surveys POQ 43(2) 206-217. A sample of 543 physicians (primary care/ambulatory and upper respiratory/lower urinary infection specialists) were distributed into a mail group (296) and a personal interview group (247). Respondents were chosen from the Washington DC/MD area. The physicians were given or administered a 12-page questionnaire on physician practice, medical philosophy, and prescribing patterns for antibiotics. The authors used TDM (prenotification, cover letter, follow-up letter, 2 follow-up questionnaires for mail; telephone prenotification/ scheduling, lead letter prior to interview, confirmation/rescheduling calls, conversion of refusals with mail/phone options for initial refusals, and an offer of a shortened interview for respondents refusing a second time). The study objective was to compare mail versus personal interview on completion rate. The authors reported that the mail survey took 9 weeks, while the personal interviews took 15 weeks (due to training lag and difficulties scheduling documents). The mail cost was $24/initial respondent while the personal interviews cost $63 per initial respondent. The mail group experienced a final completion rate of 65% compared to the personal interview group at 53%. The personal interviews disclosed more bad addresses, other ineligible respondents, refusals, and fewer unanswered inquiries. Sobal, J, DeForge, PB, Ferentz, KS, Muncie, HL, Valente, CM, and Levine, DM. (1990). Physician
Responses to Multiple Questionnaire Mailings. Evaluation Review, 14(6), 711-722. The authors hypothesized that for homogeneous groups surveyed regarding matters of concern to them that high response rates were not necessary. A Questionnaire (145 items about issues of everyday concern in practice, types of patients, and other professional matters) was sent to 1535 adult primary-care physicians (ob/gyn, family practice, internists) in Maryland. An overall response rate of 64% was achieved. The authors compared non-respondents on AMA data and found differences in non-response by specialty, age, and recency of graduation. The authors found homogeneity of results within specialties, but not among physicians in general. Sobal, J and Ferentz, KS. (1989). Comparing Physicians’ Responses to the First and Second Mailings
of a Questionnaire. Evaluation and the Health Professions, 12(3), 329-339. A mail questionnaire, regarding the length of residency and hospital privileges for family physicians, was sent to 308 recent residency graduates, 383 residency program directors, and 319 third year residents. The authors looked at age, sex, specialty, state, type of residency, and current location. A second mailing was sent ten weeks following the first mailing. The authors compared respondent characteristics and response quality (don’t know and missing responses) of the first and second mailing. The first mailing return rates were 63% for the graduates, 79% for the program directors, and 55% for the residents. The second mailing added an additional 17% of graduates, 10% of program directors, and 21% of residents. The total response rate was 80% among the graduates, 89% among the directors, and 76% among the residents (significant for all comparisons). There were no early/late differences on demographics, except practice location, or substantive questions or data quality.
−48−
Solberg, L.I., Plane, M.B., Brown, R.L., Underbakke, G., And Mcbride, P.E. (2002). Nonresponse bias: Does it affect measurement of clinician behavior. Medical Care, 40, 347-352. The authors explained that previous studies of nonresponders have not assessed the effects of nonresponse on the accuracy of clinician behavior measurements. Knowledge of these effects is critical to both research and quality improvement. This study evaluated the hypothesis that nonresponders to a survey would not adversely affect the ability to measure rates of preventive services. Four primary- care medical practices participating in a randomized clinical trial provided an unusual opportunity to compare the medical record-documented care of both responders and nonresponders to a survey of their patients. Three hundred forty-five nonresponders and 321 responders to a questionnaire requesting participation in the study. Differences in patient characteristics and diseases and documentation of screening and management of tobacco use, hypertension, and hypercholesterolemia. Although the survey process resulted in a response rate of only 52.5% and some statistically significant differences in responder and nonresponder characteristics, there were no differences in management behavior regarding cardiovascular risk factors. Responders were more likely to have adjusted documentation of tobacco use (OR _ 1.4), blood pressure measurement (OR _ 9.8), and cholesterol testing (OR _ 2.0), but not family history of cardiovascular disease. The most striking difference in subject characteristics was that 22.0% of nonresponders and only 12.1% of responders were tobacco users (P _ 0.002). This study confirms that survey nonresponders may have some different characteristics and risk factor screening rates than responders. However, if confirmed by others, nonresponders who have risk factors identified may not be managed differently than responders. Streiff, MB, Dundes, L, Spivak, JL (2001). A mail survey of United States hematologists and
oncologists: A comparison of business reply versus stamped return envelopes. Journal of Clinical Epidemiology. Vol. 54, 430–432.
The authors explained that mail surveys are a popular means of obtaining data on large populations. In July 1999 a mail survey was conducted among 3000 randomly selected members of the American Society of Hematology to assess their approach to diagnosis and treatment of polycythemiavera. Because the researchers and the study population are members of the same professional organization with a vested interest in the results, we anticipated that the advantages of return stamped postage seen in previous studies would be less significant. The response rate for stamped return envelopes was 38% versus 32% for business reply envelopes. This statistically significant difference (P=.0005) of six percentage points is comparable to previous research. Excluding labor, the total cost per returned survey was $2.62 for business reply envelopes versus $1.82 for stamped return envelopes. We conclude that stamped return envelopes are a more effective and cost-efficient means of procuring data from physician specialists. Sudman, S (1985). Mail Surveys of Reluctant Professionals. Evaluation Review, 9(3). 349-359. The author discusses the difficulties of conducting mail surveys on professionals. He explains that professionals (a) don’t have time for surveys, (b) need to see relevance of survey to their professional work (cost-benefit analysis), (c) concerned with confidentiality of results, (d) resent simplification of complex issues with possibly biased forced-choice answers. The author provided ways to address reluctant professionals including: Relevance: Title of study, Sponsorship, Reduce range of multipurpose survey topics, Explain uses, Pay for commercial or irrelevant surveys, More extensive justification of survey (letters from sponsors or advisory panel), Mention of previous work with questionnaire, Provide copies and citations
−49−
Hard-core refusals: Encourage response, Give chance to return blank questionnaire with reasons for refusal Confidentiality for sensitive surveys: Separate questionnaire, Card indicating compliance Questionnaire design: Leave room for written comments, Avoid forced choice formats with few categories (use 5 or 7 for attitude scales) include DK/NA/None of Above responses, Have advisory panel decide on strictly relevant questions and unbiased wording, Tell respondents that survey crafted, Don’t use question just because they were used before Tamayo-Sarver, JH, and Baker, DW. (2004). Comparison of responses to a US 2 dollar bill versus a
chance to win 250 US dollars in a mail survey of emergency physicians. Academy of Emergency Medicine. Vol. 11(8):888-91.
To the best of the authors' knowledge, no one has evaluated emergency physicians' response rate and cost per participant of a small monetary incentive relative to a chance to win a more substantial sum. The authors compared emergency physicians' responses and per-participant costs between a US 2 dollar bill and a 250 US dollars lottery. Two groups of 288 emergency physicians were randomly selected and mailed a survey. Within each group of 288, half received a US 2 dollar bill and the other half received an offer that respondents would be entered into a drawing to win 250 US dollars. Nonresponders received a reminder postcard one week later, and persistent nonresponders received a second mailing of the survey three weeks after the initial mailing. Of the 576 surveys that were mailed, nine (2%) subjects were ineligible or undeliverable, leaving 567 eligible subjects, of whom 301 (53%) participated in the survey. The US 2 dollar bill had a substantially higher response rate: 170 (56%) of those receiving a US 2 dollar bill participated versus 131 (44%) of those receiving a chance to win 250 US dollars (95% confidence interval = 5% to 22%; p < 0.001). The US 2 dollar bill offer was less expensive per participant than the 250 US dollars offer. The cost of postage and incentives was 997.33 US dollars for 170 participants, or 5.87 US dollars per participant, for the US 2 dollar bill and 979.29 US dollars for 131 participants, or 7.48 US dollars per participant, for the chance to win 250 US dollars. Mailing a US 2 dollar bill incentive produces a better response rate with lower cost per participant than offering a chance to win 250 US dollars. Tambor, ES, Chase, GA, Faden, RR, Geller, G, Hofman, KJ, and Holtzman, NA. (1993). Improving
Response Rates through Incentive and Follow-up: The Effect on a Survey of Physicians’ Knowledge of Genetics. American Journal of Public Health, 83(11). 1599-1603.
During the pilot test, an initial questionnaire, postcard at 2.5 weeks, and an offer to AMA CE credits were given to half physician respondents. The survey included a $25 incentive and CE credits for participation, along with enhanced lead letters and other mailed materials, and phone reminders. Only the initial survey and follow-up postcards (no incentives) were offered to medical geneticists and genetic counselors. A response rate of 19.6% was achieved among the those receiving a 30 minute questionnaire with no incentives. The offer of CE credits was not effective (except for family physicians, for whom such credits are important for recertification). For medical geneticists and genetic counselors, the response rate was 74.6%. An overall response rate of 64.8% for physicians (higher for pediatricians: 72.6%) and 79.1% for geneticists was achieved. Based on information in the AMA’s masterfile, respondents and nonrespondents differed in terms of age, US medical training, years of practice, specialty, board certification, and type of practice. The time taken to respond differed as function of specialty, US medical school, race, and religiosity. Overall knowledge of genetics was not affected by the early/middle/late responding variable, but late responders were

−50−
lower on concepts subscale. Temple-Smith, M, Mulvey, G, and Doyle, W (1998). Maximizing Response Rates in a Survey of
General Practitioners: Lessons from a Victorian Survey on Sexually Transmitted Diseases. Australian Family Physician,(27)1. S15-S18.
The objective of this study was to describe the factors that influence participation by general practitioners in survey research. In particular, to examine the effectiveness of telephone prompts made by a general practitioner researcher compared with non-medical researchers in a survey of general practitioners on sexually transmissible diseases. A survey was distributed to 520 Victorian general practitioners randomly selected from the AMA’s database of Australian medical practitioners. An overall response rate of 85% was achieved. The general practitioner researcher was able to make contact by telephone in a higher proportion of cases (80%) than the non-general practitioner researcher (69%). The authors concluded that telephone prompts to encourage general practitioner response in survey research need not be made by a medical practitioner. Templeton, L., Deehan, A., Taylor, C., Drummond, C., and Strang, J. (1997). Surveying general
practitioners: does a low response rate matter? British Journal of General Practice, 1997, 47 91-94.
The authors explained that primary care has long been of interest to policy research. Recently, there is evidence to suggest that it is becoming more difficult to encourage GPs (general practitioners) to participate in surveys. As low response rates can introduce bias into survey results, it is important to study the effects of non-response. This study assessed the validity of a response rate of 44% obtained in a national postal study of GPs surveyed about their work with alcohol-misusing patients by assessing the extent of any nonresponse bias. A telephone survey of 148 GPs who had not responded to repeated mailings of a postal questionnaire was undertaken. In addition to personal and practice structure characteristics, the GPs were asked three questions taken from the original questionnaire about their work with alcohol-misusing patients. Of the 148 GPs telephoned, 64 responded to the telephone questionnaire in full; all had previously failed to respond to the postal questionnaire. Younger GPs were more likely to respond to both the national postal and telephone surveys, but more so to the latter. Telephone responders were more likely to be GPs in a single-handed practice. The work of GPs with alcohol- misusing patients highlighted differences between the two response groups. Male telephone responders were found to be identifying a significantly higher average of alcohol misusers than male postal responders. Telephone responders were more likely to feel trained in treating alcohol misuse and to feel better supported to deal with this patient group. They concluded that some significant differences were identified, indicating the presence of non-response bias. A low response rate need not affect the validity of the data collected, but it is still necessary to test for non-response effects and make corrections to the original data in order to maximize validity. Thran, SL and Hixson, JS. (2000). Physician Surveys: Recent Difficulties and Proposed Solutions.
ASA 2000 Proceedings. 233-237. This article reviewed recent difficulties and provided recommendations for administration of physician surveys. As in Ms. Thran’s 1993 article, a review of physician surveys found that the average length of interview was 25 minutes based on information complied since 1981. Thran explains that survey response rates have declined for a number of years but became dramatically worse in 1998 and 1999. This has been due to:
• An influx of market research studies focusing on high-income individuals and offer respondents attractive incentives
−51−
• AMA lagging behind its competition in offering incentives
• A general recognition that physicians are more difficult to locate
• Longer surveys which are much less successful than shorter ones
• The number of accurate telephone numbers drawn from AMA physician master file has fallen
• Physicians are busier and less willing to cooperate, especially for long telephone interviews
• A difficulty getting around gatekeepers
• Physicians are less knowledgeable about financial aspects Thran, SL, Downes-Le Guin, T, and Berry, S. (1994). Improving Productivity in an Annual Survey of
Physicians. ASA/AAPOR 1994 Proceedings. 577-582. The authors looked at AMA’s Socioeconomic Monitoring System Survey. They focused on the cross-sectional and panel components and developed a model to predict completed interviews. The authors reported a response rate of 70.6% for the panel and 62 % for the cross-sectional components. Refusal rates were related to specialty (internal medicine worst), race (non-white worst), and length of practice (11-30 years worse than shorter/longer). The authors recommend including respondent specialty in the call scheduler (ER/radiology/pathology in the morning and surgery/anesthesiology in afternoon have higher prob of success), and to avoid too many calls late in day. Thran, SL and Berk, ML. (1993). Surveys of Physicians: An Overview. Proceedings of the International
Conference on Establishment Surveys: Survey methods for businesses, farms and institutions. 83-92. Alexandria, VA: American Statistical Association.
This was a good review article. It covered descriptions of major physician surveys, importance of high response rates, reasons for nonresponse, methods for reducing response burden and nonresponse, and nonresponse adjustments. Thran, SL, Marder, WD, and Wilke, JR. (1986). Probability of Response: A Multivariate Probit
Analysis. ASA Section on Survey Research Methods. 435-439. This study is designed to evaluated three nonresponse models with questions about income and hours worked for respondents and nonrespodents. The study experienced a 43.5% overall non-response rate, of respondents, 25.7% nonresponse to the income questions, and a 4.4% nonresponse to the hours question. The authors concluded that the survey and item nonresponse to income question are related to specialty, census region, sex, country of medical training, and total calls. However, factors affecting survey nonresponse were different from those affecting item non-response and predictors were better at accounting for survey nonresponse than item nonresponse. Thran, SL, Olson, L, and Strouse, R (1987). The Effectiveness and Costs of Special Data Collection
Efforts in a Telephone Survey of Physicians. ASA Section on Survey Research Methods. 761-766. The authors examined AMA’s Socioeconomic Monitoring System survey. The survey, a 25 minute phone survey with cross-sectional and panel components. The authors examined characteristics of respondents to special efforts and determined whether the special efforts reduce bias, and costs of those efforts (13-hour call scheduling period, 800 call-in number. The special efforts include: (1) mail-in option with tailored packets

−52−
(2) repeated call-backs (3) mailing to initial refusals with conversion call. The response rate without special effort was 45.6% while the response rate with for the three special efforts were 60.1% (more cases from repeated call backs than conversion or mail). The special effort cases differed by sex, specialty, census region and income. Estimates of income were not different for special effort compared to no effort. Additional calls were most productive around the 8th call, then decreased slightly thereafter. Refusal conversion took 9 or more calls per interview plus supervisor time to review the case, create letters, and distribute bonuses. Opting for mail incurred the cost of producing mail-out packages plus 6.5 reminder calls per case. Item nonresponse on income question was lower for easy cases (22%) versus mail (25%), 12+ callbacks (36%) or conversions (46%). The authors concluded that refusal conversion was worth the effort and mail questionnaires are expensive and nonproductive. Thran, SL, Wozniak, GD. (1995). Adjustment for Nonresponse in a Physician Survey. American
Medical Association. This study selected classification variables from the AMA Socioeconomic Monitoring System Survey and examined survey response rates for 1991 through 1994, with respect to a number of demographic and practice characteristics. While response rates differed significantly across specialties, the patterns remained fairly constant over the time span. AMA members had significantly higher response rates than nonmembers for the period from 1991 to 1994. Except for 1993, physicians in rural locations were the most likely to respond, while those in large metropolitan areas had the lowest response rates. In 1991, there were significant geographic variations in response rates. In the last two years of the survey, board certified physicians had higher response rates than non-certified physicians. The authors conducted a thorough review of the determinants of survey response and eligibility for recent years of the SMS survey, and compared these results to those on which the current weighting strategy is based. They were surprised to find very few differences in the results between the periods examined. Thomsen, S. (2000). An Examination of Nonresponse in a Work Environment Questionnaire Mailed to
Psychiatric Health Care Personnel. Journal of Occupational Health Psychology, 5(1), 204-210. Nonresponse to surveys, which seems to plague work environment studies and studies of health care personnel in particular, may pose problems of generalizability and validity. The aim of this study was to provide an estimate of nonresponse error in a self-administered survey concerning the work environment of psychiatric health care personnel. A random sample of 10% of the original survey population (N = 693) was selected to participate in a telephone follow-up of a postal survey that had a response rate of 51%. There were no differences between the responders and nonresponders to the postal survey on the exposure or outcome variables. There was no evidence of nonresponse bias in this study, although recall bias may have been a problem. In those cases in which generalizability is deemed important, it is recommended that nonresponse studies be regularly carried out when response rates are less than 100%. Tjerbo T, Kvaerner KJ, Botten G, and Aasland OG. (2005). Use of incentives to enhance response rates in questionnaire surveys. Tidsskr Nor Laegeforen {Article in Norwegian}. Vol. 125(18):2496-7. The purpose of this article is to relate response rates in surveys among GPs to the use of conditional and non-conditional incentives. The data were gathered during a nation-wide survey among all Norwegian general practitioners. There was a higher response rate among respondents who received non-conditional incentives.

−53−
Although not significant at the 5 percent level, the effect is sufficiently strong to be characterised as interesting. The results indicate that non-conditional incentives are effective in enhancing the response rate in surveys among GPs. Urban, N, Anderson, GL, Tseng, A (1993). Effects of Response Rates and Costs of Stamps versus
Business Reply in a Mail Survey of Physicians. Journal of Clinical Epidemiology. 46(5). 455-459. This study examined the use of stamps versus business reply postage on response rates among physicians. In 1989, 380 physicians who reported providing primary care were surveyed. The response rate for the stamps cohort was 83.8% compared to 72.1% among the business reply cohort, significant at p < 0.01. It was also found that the total cost per completed survey was $11.18 fo the stamp cohort compared to $14.25 for the business reply cohort. The authors concluded that the use of first-class stamps on return envelopes both improves response rates and reduces cost in surveys of physicians. VanGeest, JB, Wynia, MK, Cummins, DS, and Wilson, IB. (2000). Effects of Different Monetary
Incentives on the Return Rates of a National Mail Survey of Physicians. Medical Care. 39(2). 197-201.
The researchers studied a group of 873 physicians practicing medicine in the United States. The respondents were randomly assigned to receive a $5, $10, or $20 cash incentive to complete a survey on physician attitudes toward, and response to, utilization review pressures. An overall response rate of 65% was achieved. The response rate for the $5 incentive group was 60.3% compared to 68.0 % for the $10 incentive group, and 65% for the $20 group. There were no significant differences between the three groups, however the $10 incentive produced the highest response rate of the three groups. The authors concluded that changes in the magnitude of financial incentives within the range of $5 to $20 do not result in increases in survey response among physicians. VanGeest, JB, Wynia, Johnson, TP and Welch, VL. (2007). Methodologies for Improving Response
Rates in Surveys of Physicians: A systematic Review. Evaluation of Health Profesionals. Vol 30(4): 303-321.
The authors conducted a systematic review of 66 published reports of efforts to improve response rates to physician surveys. Two general strategies were explored in this literature: incentive and design-based approaches. Even small financial incentives were found to be effective in improving physician response. Token nonmonetary incentives were much less effective. In terms of design strategies, postal and telephone strategies have generally been more successful than have fax or Web-based approaches, with evidence also supporting use of mixed-mode surveys in this population. In addition, use of first-class stamps on return envelopes and questionnaires designed to be brief, personalized, and endorsed by legitimizing professional associations were also more likely to be successful. Researchers should continue to implement design strategies that have been documented to improve the survey response of physicians. Ward, J, Bruce, T, Holt, P, D’Este, K, and Sladden, M (1998). Labour-saving Strategies to Maintain
Survey Response Rates: A Randomized Trial. Australian and New Zealand Journal of Public Health. 22(3). 394-396.
Study to evaluate response-aiding strategies feasible in large surveys. A sample of 1550 general practitioners were randomly assigned to one of the following four intervention groups:
• Group 1 received extensive telephone prompts by a medical peer in advance of the questionnaire

−54−
• Group 2 received an embossed pen with the questionnaire
• Group 3 received an advance letter prompt
• Group 4 received a single attempt advance telephone prompt by a non-medical research assistant. An overall response rate of 67% was achieved. The highest response rate was obtained by Group 1 (73%). Response rates did not vary with age, vocational registration status, and whether or not the general practitioner was a fellow of the RACGP, or practiced in a metropolitan or rural location. The authors concluded that equivalent response rates can be achieved, not only by using exhaustive advance telephone prompt by a medical peer or non-medical staff member, but also by sending an advance letter prompt or enclosing a pen with the survey.