Embed Size (px)
Citation preview

REVIEW OF SOCIAL RENT SETTING IN NORTHERN IRELAND
Updating the 2007 research project Gillian Young1, Allison Orr2, Kenneth Gibb2 Steve Wilcox3 and Declan Redmond4 Final Report date: 21 February 2013
1 Newhaven Research Limited
2 University of Glasgow
3 University of York
4 UCD Dublin

1
Contents
1 INTRODUCTION ............................................................................................ 3
1.1 Aims and objectives ................................................................................................ 3
1.2 Overview of research methods ............................................................................... 3
1.3 Report structure ...................................................................................................... 4
2 RENT SETTING POLICIES IN CONTEXT ..................................................... 5
2.1 Introduction ............................................................................................................. 5
2.2 Rent setting in the social sector .............................................................................. 5
2.3 Housing Benefit and Universal Credit ..................................................................... 6
2.4 Rent policies in England ......................................................................................... 9
2.5 Wales .................................................................................................................... 15
2.6 Scotland ................................................................................................................ 16
2.7 Republic of Ireland ................................................................................................ 18
2.8 Northern Ireland .................................................................................................... 23
2.9 Concluding Observations ...................................................................................... 28
3 NORTHERN IRELAND'S SOCIAL HOUSING STOCK ................................ 30
3.1 Introduction ........................................................................................................... 30
3.2 Overview of NIHE stock data ................................................................................ 30
3.3 Overview of housing association stock data ......................................................... 32
3.4 Social rented stock attributes ................................................................................ 35
3.5 A benchmark rent .................................................................................................. 40
3.6 Concluding observations ....................................................................................... 41
4 ANALYSIS OF BASIC RENT LEVELS AND STRUCTURES ...................... 42
4.1 Introduction ........................................................................................................... 42
4.2 National comparisons ........................................................................................... 42
4.3 Northern Ireland Rents .......................................................................................... 44
4.4 Further consideration of housing association rents .............................................. 54
4.5 Concluding observations ....................................................................................... 58
5 AFFORDABILITY OF SOCIAL RENTS IN NORTHERN IRELAND ............. 61
5.1 Introduction ........................................................................................................... 61
5.2 The concept of affordability ................................................................................... 61
5.3 Affordability of social sector rents in Northern Ireland .......................................... 68
5.4 Affordability across the UK .................................................................................... 71
5.5 Welfare Reforms ................................................................................................... 72
5.6 Northern Ireland rents under the Universal Credit regime .................................... 75
5.7 Concluding observations ....................................................................................... 77

2
6 POTENTIAL FOR RENT HARMONISATION ............................................... 79
6.1 Introduction ........................................................................................................... 79
6.2 Rationale for greater rent harmonisation .............................................................. 79
6.3 Potential rent structure alternatives ...................................................................... 80
6.4 Overview of the illustrative rent harmonisation model .......................................... 81
6.5 Central scenario: main findings ............................................................................. 86
6.6 Concluding observations ....................................................................................... 96
7 SUMMARY AND CONCLUSIONS ............................................................... 98
7.1 Introduction ........................................................................................................... 98
7.2 Summary of Findings ............................................................................................ 98
7.3 Conclusions ........................................................................................................ 103
8 Appendices ............................................................................................... 109
APPENDIX 1: REFERENCES .................................................................................... 109
APPENDIX 2: PROCESSING NIHE AND HOUSING ASSOCIATION DATA ............. 113
APPENDIX 3: HOUSING ASSOCIATION RENTS - ADDITIONAL TABLES .............. 120
APPENDIX 4: NIHE and HA RENT REGRESSION - SUMMARY OUTPUTS ............ 136
APPENDIX 5: SERVICE CHARGES .......................................................................... 139

3
1 INTRODUCTION
1.1 Aims and objectives
This report explores the pattern of rents in the social housing sector and considers the scope for the development and implementation of a harmonised rent-setting regime.
The specific objectives of this study, which was commissioned by the Northern Ireland Housing Executive (NIHE), were to:
• Compare the rent policy framework, rent-setting arrangements and pattern of rents in Northern Ireland with those in Britain and the Republic of Ireland.
• Provide a reasonable like with like comparison of rents between social landlords across Northern Ireland in 2011 and explore the extent to which the pattern of housing association rents reflects the rent policies of social landlords.
• Develop a definition of an affordable rent and review the affordability and effectiveness of arrangements to determine rent levels, taking into account the potential affordability implications of the welfare reforms legislated for by the UK Government Review.
• Explore the influence of grant rates and rent controls on housing association rents and reserves, their ability to lever in private finance and any potential scope to reduce grant available to housing associations.
• Develop a model to exemplify the profile of rents that might be generated from an alternative harmonised rent-setting regime and assess its potential implications, including plausible convergence strategies.
The study builds on a previous review of social rents in Northern Ireland (Gibb et al, 2007), which highlighted inconsistencies between the rents of different social landlords and suggested a need to establish a new and consistent way of setting social rents.
1.2 Overview of research methods
The main research method was the collation and analysis of data on rents in the social rented sector. All 29 housing associations and NIHE were asked to supply details of the weekly basic rent, service charges (split by HB eligible or not) bedroom size, address and the main attributes, such as dwelling type and size, for each of their properties. Some landlords were able to respond relatively promptly but others required repeated reminders and chasing in order to secure the required data. Considerable time was also required to verify and, where necessary, rectify incorrect or missing data. In total in took 10 months to secure the necessary data.

4
To accompany the data collection exercise, the study team undertook an analysis of the rent policy documents provided by social landlords. The study team also reviewed research and policy documents relating to rent setting in the social rented sector elsewhere in the UK and the Republic of Ireland and conducted interviews with key stakeholders and opinion formers in both countries.
1.3 Report structure
Chapter 2 outlines the rent policy framework across the UK and the Republic of Ireland and the wider policy, regulatory and subsidy arrangements that shape social rents. It also reviews the rent policies and structures of social landlords in Northern Ireland and the role affordability plays in setting rents. Documents reviewed as part of this study are detailed in the references section (appendix 1).
Chapter 3 provides an overview of the NIHE and housing association data used to inform the analysis presented in the rest of the report and why the basic rent for a 3 bedroom terraced property was selected as a benchmark rent. Appendix 2 provides further details on the research method and the work undertaken to collate and process the data.
Chapter 4 begins with a comparative analysis of social rents in Northern Ireland, Britain and the Republic of Ireland. It then looks more closely at the pattern of social rents in Northern Ireland, with particular reference to housing associations. The impact of service charges on housing association gross rent levels is also briefly examined. Further exploration of social rents and service charges in the housing association sector and of social landlord polices are set out in appendices 3 and 4.
Chapter 5 considers the concept of affordability and how it applies to social renting in the context of the current tax and welfare benefit regime in the UK. It also examines the affordability of social rents and the implications of the forthcoming housing and welfare benefit reforms for measures of affordability in Northern Ireland.
Chapter 6 outlines and explores the potential impact of an alternative rent setting regime, the scale of rent adjustment that might be required and potential convergence scenarios for achieving rent harmonisation.
Chapter 7 summarises and discusses the main findings and how these relate to the project’s objectives, and sets out issues that should frame discussions for taking forward a harmonised rent setting scheme for social housing in Northern Ireland. The chapter also suggests areas for further research.

5
2 RENT SETTING POLICIES IN CONTEXT
2.1 Introduction
Rent policies, together with policies for the allocation, management and supply of the stock, are fundamental elements of social rented housing. This chapter looks at the recent evolution of rent policies across the UK and the Republic of Ireland, focusing on their key characteristics and associated policy drivers, including the UK welfare reform programme.
2.2 Rent setting in the social sector
Current levels and patterns of social rents in Northern Ireland and elsewhere in the UK reflect the cumulative effect of various Government policy and landlord business decisions over several decades. They reflect:
• When and where social housing was constructed, the borrowing conditions that then applied, policy changes in the provision of capital and revenue subsidies to social landlords and personal subsides to tenants to help towards the cost of rents (Wilson, 2012).
• The influence of policy decisions such as stock transfer and the rent provisions built into stock transfer contracts, regulatory conditions and government attitudes to maximum rent increases (as has been the case in Northern Ireland).
• Individual social landlord decisions on the rental income required to maintain financial viability and the way in which rents for individual properties should be arrived at. This includes historic decisions in respect of debt repayment, refinancing, the accumulation and use of surpluses, property maintenance, rent pooling, rent structures and so on.
The evolution of rent policies cannot, therefore, be discussed without reference to the wider housing policy and finance regimes that have shaped rent policies.
The UK Government's reform of the welfare benefits system, the cornerstone of which will be the introduction of the Universal Credit for working age households, will impact on social housing. In particular, the ongoing programme of Housing Benefit reforms, which will be subsumed in the Universal Credit, will affect the affordability of rents for tenants and the revenue income and costs of social landlords. Before discussing rent policies therefore, it is helpful to outline the main welfare reforms that are likely to shape future rent policy decisions.

6
2.3 Housing Benefit and Universal Credit
Northern Ireland has formal autonomy over Housing Benefit and other social security policies. However, as Fitzpatrick and Burrows (2012) observe, the parity principle set out in sections 87 and 88 of the Northern Ireland Act 1998 means that such policies remain closely aligned with those operating in Britain.
As DSD (2012) recently explained, the parity principle dictates that individuals in Northern Ireland should receive the same benefits, under the same conditions, as other UK individuals and that any substantial variance from this principle would have adverse financial consequences that would have to be paid from the Northern Ireland Block. Consistent with this, it was confirmed at the NI Assembly Committee for Social Development on 24 May that the NI Welfare Reform Draft Bill will contain much the same provisions as those set out in the GB Welfare Reform Act 2012.
The main exceptions are, first, that the introduction of the Universal Credit reforms will be delayed until April 2014 (seven months later than in GB). Second, Northern Ireland tenants, in contrast to tenants in Britain, In contrast to Great Britain, in Northern Ireland, the default position will be that the landlord receives the benefit direct, although claimants will be able to request payments to themselves. Third, Universal Credit will be payable fortnightly rather than monthly and may be split between two people in a household.
The programme of welfare reforms is wide ranging and will have many implications that go well beyond the scope of this study. However, the provisions of most significance in respect of the social rented sector and their possible implications are outlined below.
Non-dependant deductions
One change that is already affecting tenants is the increase in Housing Benefit non-dependant deductions (NDDs). These had been frozen since 2001 but are being increased in a phased manner between April 2011 and April 2014 to levels equal to what they would have been without the freeze.
Further changes are to be introduced under Universal Credit; NDDs will be replaced with flat rate ‘Housing Cost Contributions’ (HCCs). The most recent Universal Credit Regulations 2013 (DWP, 2012 d) report that the flat rate will be £68 per calendar monthand that the lower age limit for a non-dependant will be raised from 18 to 21 years.
Wilcox (2011) estimated that around one in seven social tenants in England may be affected by the changes to NDDs but the impact of the move to HCC remains to be investigated.

7
Under-occupation deductions
Working age social tenants who under-occupy their home will see a reduction in their Housing Benefit allowance. A deduction of 14% will be made where there is one spare bedroom and 25% where there are two or more spare bedrooms. These deductions will apply to the total eligible rent plus service charges. The higher the gross rent therefore, the higher the amount of money that will be deducted from Housing Benefit5. The DSD (2012) has estimated that 25,100 NIHE tenants in Northern Ireland may be affected by this change.
Existing tenants (or their partner) who are above the qualifying age for Pension Credit and in receipt of HB will be exempt from the size criteria rules. For mixed age couples making a new claim, both partners will need to be over the Pension Credit age to be exempt from the size criteria when Universal Credit is introduced. The qualifying age for Pension Credit is set to increase from 61 to 66 years by 2020. Thus, more tenants will be subject to the size criteria restrictions over time.
Reaction to the extension of size criteria restrictions to the social rented sector, which already apply in the private rented sector, has been mixed.6 Although it should lead to more effective use of social housing in pressured housing markets, it may increase turnover and void rates if significant numbers of working age tenants seek a transfer each time the composition of their household changes. In rural areas and locales where few small units exist, tenants may have little opportunity to avoid this financial penalty by downsizing. Older social tenants looking to reduce their fuel costs and other outgoings may also find it more difficult to downsize if 'demand' for smaller dwellings from working age waiting list and transfer applicants increases.
A further complication is that some bedrooms may not accommodate two children sharing. For example, a 2 bedroom, 3 bedspace dwelling may not be sufficient for families with up to two children as the under-occupation calculation assumes. The revised HB regulations (DWP 2012b) do not define a bedroom and may provide some flexibility to look at the specific circumstances and living arrangements of families in determining whether the claimant is under-occupying. This would have to be done selectively and sparingly however, in order to keep within GB provisions.
5 Temporary and supported accommodation social lettings will be exempt from this deduction (DWP, 2012b).
6 Interestingly, the 4 bedroom maximum rule and the shared accommodation rate for single persons under 35 years will continue to apply to private tenants only.

8
Cap on household benefit payments
There will be a cap on benefit payments for most 'workless' working age households7 of £350 per week for single persons and £500 per week for lone parents and couples. This cap will encompass Housing Benefit, most other state benefits and tax credits in preparation for the introduction of the Universal Credit.8 Where the total benefits assessment exceeds the appropriate cap, Housing Benefit payments will be reduced, and when Universal Credit is introduced, deductions will be made from it. In Northern Ireland, larger families are most at risk of being affected by the benefit cap, due to the higher level of Child Benefit and Housing Benefit those claimants receive (and this also applies to Income Support and Child Tax Benefits) (DSD, 2012).
Other developments
The Universal Credit Regulations 2013 to be debated in the UK Parliament in early 2013 also note that:
• Instead of defining ineligible services (as under Housing Benefit), four categories of service charges will be eligible for support: maintenance of the general standard of a dwelling (e.g. cleaning multi-storey windows); the up-keep of communal areas; communal services; and, accommodation-specific charges (e.g. furniture). More detailed guidance is expected by January 2013.
• Residents of ‘supported exempt accommodation’ will have their housing costs (rent and eligible service charges) met outside Universal Credit and will therefore be exempt from the under-occupation rules. This is also likely to mean that most such residents will no longer be affected by the benefit cap.
• Housing costs will be back-dated and will be limited to a period of up to one month (six months currently) and claimants temporarily absent from their home (e.g. in hospital, prison or care home) will be eligible for Housing Benefit for six months rather than one year at present.
Finally, changes to the Local Housing Allowance(LHA) arrangements9to exert downward pressure on HB payments to private tenants may see a shift in the
7 From April 2013 a household must work the relevant number of hours (which varies by household composition) to be eligible for working tax credit to be defined as 'in work'. Under Universal Credit a household will be 'in work' if the claimant (or their partner) has gross monthly earnings equivalent to 16 hours a week at the minimum wage (£430).
8 The Equality and Human Rights Commission (2012) reported that the lack of equality screening prior to the announcement of the household benefits cap breeched the 2006 Equality Act..
9Most significantly, in April 2011 the LHA rate was reset at the 30th percentile of private rents in each Broad Rental Market Area, rather than the median and excess LHA payments were abolished( previously tenants that paid a rent below the applicable LHA could be paid an excess of up to £15). In 2012 the shared room rent for those living alone

9
share of working age households seeking social tenancies as opposed to private tenancies, although the scale of change will in part depend on the response of private landlords.
2.4 Rent policies in England
Rent polices during the 1990s
The 1989 Local Government and Housing Act 'ring fenced' the housing revenue accounts (HRA) of local authority landlords (hereafter referred to councils) and revised annual subsidy determinations to steer council spending and borrowing on housing. It also introduced guideline rents that sought to reflect house price relativities across England. The net effect of these measures was that by the end of the 1990s the average council rent broadly reflected relative differences in average house prices across England. However, the rents set by councils for individual properties continued to display little coherence.
In the 1990s, housing association rents rose more sharply than council rents. Housing association rents (and implicitly Housing Benefit) ‘took the strain’ of Government decisions to abolish major repair grants and to boost the numbers of units constructed for a given sum of public finance by reducing the proportion of development costs met from Social Housing Grant.
Rent restructuring and convergence policy
In response to disquiet about the affordability and incoherence of social rents, a common method for setting rents throughout the social rented sector was introduced from April 2002 (DETR 2000a and 2000b). The aims of this rent restructuring policy were to:
• Deliver affordable social rents that were fairer and less confusing for tenants and to remove unjustifiable differences between local authority and housing association rents.
• Ensure that, within the same broad area, similar properties had similar rents regardless of social landlord or how the dwelling was financed.
• Encourage social landlords to manage their housing stock better and more efficiently.
The rent restructuring policy also sought to reduce possible impediments to:
• The implementation of choice based letting by ensuring rents better reflected the property attributes tenants’ value, thus giving tenants more ability to choose whether to pay more for a better property or to save money by choosing a less popular property.
was extended from those under 25 years to under 35 years and from April 2013 the LHA will be increased in line with the Consumer Prices Index (CPI), which will reduce the value of the LHA relative to private rents over time.

10
• The possible reform of the Housing Benefit system in the social sector in the shape of extending the Local Housing Allowance (LHA) to social tenants.
Collectively, these three policies were intended to usher in a quasi-market in social housing. Although rent convergence and choice based lettings were implemented, the reform of Housing Benefit for social tenants was not pursued during the 'noughties'.
The rent restructuring policy has required social landlords to converge the basic rent (i.e. excluding service charges) for individual properties to within 5% of target rents. The Government's target rent formula takes account of property value, average county earnings and the number of bedrooms in a property. Target rents are currently subject to an annual uplift of RPI + 0.5%. For rents above or below the target rent, social landlords are permitted to adjust rents by no more than £2 per week after the permitted annual uplift has been applied.
The original aim was to secure rent convergence by March 2012. This 10-year time frame was adopted to protect tenants from excessive annual rent increases and to protect social landlords from substantial changes in rental revenue in any given year. Perhaps inevitably over such a lengthy period, elements of the rent convergence policy have had to be adjusted.
For example, councils were invited to de-pool service charges but plans to bring service charges within the scope of the rent convergence policy were never pursued.
The timescale for convergence has been reviewed on more than one occasion. The timescale for councils has been extended to 2015-16, although most have completed the convergence process. Provision has also been made to extend the convergence period beyond 2012 for housing associations that face specific challenges such as a loan default or a breech in commitments made to tenants as part of a stock transfer deal (TSA, 2009).
Other adjustments have been necessary to balance the objective of increasing the efficiency demands placed on social landlords with the need to limit the financial exposure of housing associations with limited reserves and/or tied into long-term fixed financing arrangements. For example, the increase in target rents for 3+ bedrooms properties in 2006, which housing associations lobbied for, increased the rental income for social landlords with significant numbers of larger properties.
Housing associations with a sizable development programme but little historic stock have been at most risk of financial exposure and less able to manage falls in rental income. That said, the downward trend in grant rates, the increased use of surpluses to cross-subsidise development and rent increase limits have all contributed to a fall in the spare capacity on the overall housing association sector balance sheet (Hall and Gibb, 2010).

11
Rent convergence has not been uniformly applied to all housing association tenancies. The Rent Service continues to set fair rents (including associated service charges) for a small proportion of tenants and these rents do not necessarily conform to the target rent. Basic rents for supported housing can be set at up to 110% of the target rent to reflect the additional costs associated with this type of provision, whilst temporary accommodation is amongst the list of tenancies exempt from rent restructuring. Legal contracts also take precedence over rent restructuring, so that the rent and annual uplift for some stock continue to be governed by provisions contained in legal contracts and leases.
The fact that property valuations and county earnings continue to be based on 1999 prices (inflated to present day values)has led some to question the validity of the price and earning relativities underpinning rent convergence. HACAS Chapman Hendy (2005) also found that these valuation exercises often produced less than robust property values, and created anomalies and inexplicably high rents – and were often associated with organisations having insufficient staff with the necessary expertise to project manage the valuation exercise.
There remain concerns about the affordability of rents in areas with comparatively high property values but comparatively low average county earnings and/or areas where local earnings are below the average county earnings levels used in the formula (Solomou et al 2005). There is also some unease that the policy has not taken account of the very uneven relationship between the target rents set for social housing and private rents. In parts of the north of England there is very little difference between the rents in the two sectors.
Future prospects
Reforms to the way that social housing is financed, developed and regulated were announced in the Comprehensive Spending Review in October 2010 and the Localism Bill in December 2010. These reforms have contributed to mounting uncertainty regarding the future of rent convergence.
Affordable rents
Capital spending on affordable housing was halved for the period 2011-15, to some £4.5 billion. To date, the main measure to help offset this reduction in the Homes and Communities Agency (HCA) development programme has been the introduction of the Affordable Homes Programme.
This allows housing associations to offer tenancies at rents of up to 80% of market rent levels (i.e. where the appropriate LHA is the proxy for the market rent) within the local area. Housing associations can also convert existing properties that fall vacant to affordable rent, subject to an investment agreement with the HCA about how additional rental income will be reinvested in the supply of new affordable housing. Affordable rent properties are not subject to rent restructuring but the rents set are expected to be inclusive of any service
12
charge. The properties are allocated according to housing need but there is flexibility in the length and type of tenancies offered.
This model for new development has been characterised as revenue subsidy since it involves cross-subsidy from affordable rents on existing social dwellings that fall vacant. Pawson and Wilcox (2011) estimate that, on average, the higher affordable rent will have to be charged on three properties to cross-subsidise development of one new property.
The affordable rents model has retained a modest capital grant for new development. HCA figures published in July 2011 suggest the unit grant subsidy rate for affordable rent is around 20% (i.e. averaging £20,000-£25,000), with the remaining debt financed by a combination of the aforementioned higher rents, private borrowing and housing association reserves.
The general perception is that in the period to 2015 the affordable rent provisions will generate higher rates of development than would otherwise occur, primarily in Southern England and other locations where there is a substantial gap between social rents and market rents. Budget approvals indicate that up to 70,000 units could be delivered by the new model, subject to individual negotiations between housing providers and councils.
The long term viability of the affordable rent programme is less certain because of the inherent risks of a predominately revenue-based development model for providers and lenders – risks which are compounded by welfare reform and the policy drive to cut Housing Benefit expenditure. More specifically:
• As the new funding model requires associations to take on more debt, housing associations are increasingly likely to reach the limits of their borrowing capacity, which will erode their capacity to build homes in the future (Wilcox and Pawson, 2011, TSA, 2012 and Communities & Local Government Committee, 2012).
• CML (2011), the NHF (2011) and others argue that affordable rents have intensified the degree of uncertainty generated by the impacts of welfare reform on future rental income streams. This growing uncertainty at a time when banks are being encouraged by the FSA to ensure that their assets more closely match their liabilities has seen lenders begin to move towards shorter loan periods and/or to demand the ability to re-price loan portfolios every five years or so. These developments suggest that capital market funding will continue to be used more extensively as the cost of borrowing from banks for housing associations that are willing and able to extend their credit lines will increase10.
10 Debt funding constraints have seen an upturn in interest in institutional finance and equity funding. There have been some high profile bond issues but the potential capacity of HAs to secure new borrowing of this kind is unknown.

13
• The annual uplift for an affordable rent has been set at RPI + 0.5%, whereas the LHAs are to be increased by CPI. This raises the possibility that rents may rise above LHA thresholds during the period of a fixed term tenancy in spite of HCA advice to the contrary and casts some doubt on whether DWP and Treasury will tolerate the growing Housing Benefit costs of the affordable rents regime in the longer term.
The expansion of affordable rents will chip away at the coherence of the rent restructuring and convergence policy. As the numbers of affordable rented tenancies expand, there will be a re-emergence of wide variations in rents for similar dwellings located in the same locale, especially in areas where existing stock that falls vacant is converted to an affordable rent.
From a business perspective, the Chartered Institute of Housing (CIH) has stressed that housing associations operating in several local authority areas will have to manage a number of conflicting tenancy strategies across their stock whilst charitable associations will need to assess the risks that affordable housing might pose to the continuation of such status. Social landlords may also need to differentiate the service delivered to tenants on different rent and tenancy arrangements within their own stock.
Social landlords that operate in local housing markets where house prices and private rents are relatively modest may find that affordable rented properties become more difficult to let than traditional social rents as housing market conditions improve.
Abolition of HRA subsidy regime
In the council sector, rent convergence operated alongside the HRA subsidy system (which transferred the revenue income of some councils to other councils to help pay the cost of servicing capital debt), until 2012. Essentially, the Government calculated the assumed income (mainly rents) and outgoings (based on notional allowances) of each council. These calculations were then used to decide which councils required additional income (positive subsidy) and which councils had surplus income and had to pay money into the national pot (negative subsidy).
Over the decade, rental income increased at a faster rate than the value of the allowances. As the numbers of councils in negative subsidy increased, the rental surpluses retained by HM Treasury began to increase. The HRA subsidy system was also criticised for lacking transparency and under-funding the management, maintenance and upgrading of council stock. In 2009 DCLG issued a consultation paper that acknowledged the HRA subsidy system was no longer fit for purpose and proposed to dismantle it.
In April 2012 the HRA subsidy regime was replaced by a devolved system of self-financing HRAs. The new system allows councils to retain all rental income and a proportion of capital receipts from the sale of land and dwellings. In support of this policy change, the Government re-allocated some £28 billion housing debt to reflect the amount of debt that each council can support by

14
rental income. This re-allocation process also built in provision for higher levels of expenditure on management and maintenance as well as major repairs.
As stated in Implementing Self-Financing for Council Housing (DCLG, 2011), these reforms:
• End decades of complex central control by abolishing the HRA subsidy system under which there was little connection between rent levels and the resources councils had available to spend locally.
• Will increase investment in new and improved social and affordable housing by giving councils greater financial autonomy to determine their debt management strategy and how best to use their HRA income and assets to address local housing needs. Moreover, councils still face overall borrowing caps.
It is too soon to predict the numbers of affordable new homes that councils will support through increased borrowing, but much will depend on the borrowing headroom available to individual councils as well as future revenue surpluses and rent increases.
The HRA reforms set a ceiling on the level councils can borrow against their revenue income, consistent with the Government's aim to reduce the Public Sector Borrowing Requirement. HM Treasury has also reserved the right to revisit the debt redistribution at some time in the future. Councils may therefore be hesitant to increase rents or find other ways to boost future revenue surpluses to invest in new social housing or repay debt11.
Moreover, the rent rebate subsidy limitation will continue to provide Government with a lever to limit rent increases. As DCLG (2011) observes, “the Housing Benefit limit rent will continue to ensure the Exchequer does not meet the extra costs of rents which are set above policy levels". From 2013 this control will continue to apply (albeit indirectly) through the eligible rent limits used to calculate Universal Credit.
Another area which may shape future rent revenues is the possibility that councils might be permitted to charge affordable rents for existing stock that falls vacant in certain circumstances – for example to generate additional revenue needed to meet the decent homes standard. Even so, councils are far less likely to pursue this option than RSLs, because of the LA borrowing caps embedded in the new HRA arrangements and the rent rebate subsidy limitation.
11 As LAs with a revenue surplus have limited ability to increase borrowing, council investment in new housing may be largely restricted to those councils that can provide capital subsidy in the form of land or other capital receipt. Some neighbouring LAs may be able to form a partnership to 'pool' their borrowing capacity to fund new housing.

15
2.5 Wales
Current arrangements
Welsh rent setting and subsidy arrangements in the local authority sector are similar to those that existed in England prior to rent convergence. The HRA subsidy system, which has yet to be dismantled in Wales, is governed by ‘guideline’ rents that are set by the Welsh Assembly Government. As the revenue income of every council exceeds their subsidy system limits, Welsh councils make substantial financial transfers to HM Treasury via the Welsh Government. In the 12 years to 2010, over £1 billion was transferred to HM Treasury (Pawson and Wilcox, 2011).
The ‘benchmark’ rent system requires housing associations with a development programme to specify the maximum rents which they would charge for six key property types and to ensure that the average of these six rents does not exceed the ‘benchmark’ rent specified by the Welsh Assembly Government. The benchmarks, which do not apply to service charges, are underpinned by a rent matrix that sets out the rent to be charged for a property depending on the local authority area, number of bedrooms, dwelling type, and provision type (general needs or sheltered). An additional charge is added for properties with access to a garage but this charge is not subject to the benchmark constraint.
During the 'noughties' the Welsh Assembly Government sought to align local authority guideline rents and housing association ‘benchmark’ rents but this proved to be a very slow process.
Future prospects
Building on the recommendations of the 2008 ‘Essex Review’ of affordable housing, the Welsh Assembly Government plans to reform social housing through the introduction of a Housing Act in 2013. One of the planned reforms will be the introduction of a unified single social rent policy to replace guideline rents and benchmark rents.
Homes for Wales – A White Paper for Better Lives and Communities (WAG, 2012) indicates that a new policy for social rents will be introduced subject to the outcome of negotiations with UK Treasury on ending the HRA subsidy system. The policy is still in development but essentially:
• Each year the Welsh Assembly Government will set a national target average rent for the following year (assumed to be £71 for 2012-13).
• A ‘target rental income’ will be set for each social landlord to reflect the type, size, quality and location of their housing stock. The location factor will be based on a formula: 50% on earnings, 25% on market rents and 25% on house prices in the local authority area.
• Social landlords will be free to set their own annual rent increases, so long as rental revenue remains within 5% of the target rent income.
16
• Social landlords will be free to set the distribution of rents within their own stock. If a landlord chooses to charge above the target rent for some properties, it will be expected to balance this by charging below target rents for others to ensure the rental revenue is in line with target rental income for any given year12.
• Transition arrangements and timescales will be similar to those in England.
Much of the detail will depend on what arrangements are agreed to dismantle the HRA subsidy system but the Welsh Assembly Government has said that it intends to permit social landlords more discretion than applies under the English rent policy. It has also said that, in the first instance, the framework will only apply to general needs housing and will not include service charges. However, the framework is to be accompanied by measures to ensure a consistent approach between social landlords in terms of service charges to tenants. The White Paper also confirms that Welsh councils will have the power to set affordable (or intermediate) rents for households with moderate earnings (as opposed to general need tenants).
2.6 Scotland
Current arrangements
Social landlords in Scotland have considerable financial autonomy and freedom to set rents. The main regulatory requirement is that both council and housing association landlords should adhere to the Scottish Housing Regulator's good practice rent setting principles. In effect, social landlords should be able to demonstrate that rent revenue is sufficient to cover the cost of servicing debt and the costs of managing and maintaining their housing stock. Social landlords should also be able to demonstrate that they have a fair and transparent system for setting affordable rents for individual properties, and that tenants are consulted on the annual rent review.
More et al (2003) and Wilcox et al (2007) report that social landlords tend to project the aggregate level of rental income required to ensure their continued financial viability and then use their own rent structure to distribute the required rental income across their housing stock. There is, however, wide variation in accounting practice and what costs may be met from rental income in both sectors (Wilcox et al, p.7).
Housing association rent structures often include a 'dwelling age' variable or some other mechanism that allows new build rents to be set at higher levels to take account of development viability considerations. Since the advent of prudential borrowing in 2004 and Scottish Government grants in 2009, many
12In particular, the 2011 consultation paper (WAG, 2011) stated that social landlords will be free to charge higher rents for more energy efficient dwellings and lower rents for less energy efficient dwellings.

17
local authority landlords have recommenced building council housing. These councils have generally set a premium for new units.
Some social landlords still operate two or more rent structures, including those obliged to adhere to rent provisions set out in stock transfer contracts for a specified number of years. Social landlords that have modernised their rent structure over the past decade have favoured the use of a comparability based rent structure – often utilising a points-based structure. There has been no enthusiasm for using property values as part of the rent setting process. Housing association tenants generally pay separate rent and service charges. Local authorities, including those that have recently renewed their rent policies, have tended not to de-pool service charges other than for services not Housing Benefit eligible, such as district heating.
In contrast to the rest of Britain, the Scottish Government has shown little desire to pursue a national rent convergence policy. Such a policy does not sit well with the Scottish Government and COSLA (Convention of Scottish Local Authorities) Concordat ethos of local decision-making. There is also a strong sense that rent disparities between social landlords are far less of a problem than in England. Wilcox et al (2007) report that in 2005-6 the average weekly housing association rent (£50.27) was just £5 more than the comparable council rent (£45.02). No doubt this reflects the higher grant rates housing associations in Scotland have enjoyed. Although there is greater variation in social rents at local authority level, the general perception is that more transparent, fair and affordable rents could be achieved by social landlords, working with tenants to modernise outdated rent structures.
Rent reform would also require corresponding reform of the regulatory and financial arrangements within which council and housing associations operate (Wilcox et al, 2007).Since the Housing Revenue Support Grant (HRSG) began to be phased out in the 1980s, the Scottish Government has lacked 'financial' levers to influence council rent polices.13
Future prospects
The Scottish Government has stated that at least two thirds of the 6,000 affordable homes it plans to deliver each year during 2012-15 will be for social housing. Consistent with this, the Affordable Housing Supply Programme (AHSP) for 2012-15 allows for a modest expansion of 'intermediate rent’ housing but explicitly states that more than two out of three new units should be for social rent. AHSP guideline unit level capital subsidies for social housing have been set at around £43,000 to £46,000 for housing associations and £30,000 to £34,000 for councils, although these subsidies vary according to factors such as location. The AHSP also stresses the Scottish Government desire to see social landlords bring other resources to the table, for example by
13 Only Shetland Council receives HRSG and in 2012 the Scottish Government introduced a Bill to abolish HRSG.

18
drawing on existing borrowing capacity, through cross-subsidy, by reducing costs, or by justifiable increases in rents.
The AHSP 2012-15 will most likely increase rents in real terms but it is far less certain that rent levels will exceed affordability limits:
• The Scottish Government expects the rent for a new housing association home to be around £71 for a 2 bedroom (3 person) property for 2012-13 and that future annual uplifts will be RPI + 1%.
• In spite of applying a 'premium' for new dwellings, councils primarily fund capital investment via rent fund contributions, capital receipts and/or prudential borrowing. Debt repayment costs are for the most part, therefore, borne by all tenants rather than tenants of new homes, as has been traditional for housing associations.
• The Scottish Housing Regulator (SHR) has signalled an intention to scrutinise rent policies and the steps taken by social landlords to appraise affordability.
On balance there are few signs that the rent levels charged by social landlords in the next few years might cause the Scottish Government to intervene to ensure rents remain affordable.
2.7 Republic of Ireland
In the Republic of Ireland accommodation for low income households is secured through the direct provision of social housing by local authorities or housing associations and through the use of rent supplements and lease arrangements to secure access to private housing.
Social housing provision
The Local Authority Sector
Local authorities collectively own over 129,000 properties, which equates to 8% of the Republic of Ireland's housing stock. The stock is made up of general needs housing constructed with 100% capital funding from central government.
The local authority rent-setting framework is known as the differential rents system. Local authority rents are set directly in relation to tenant incomes rather than in relation to the costs of managing and maintaining the housing stock – similar to public housing in Australia. More than eight out of 10 tenants depend on welfare payments, so rents are low. In 2008-9 (the latest year for which figures are available) the average weekly rent was £37.31. As local authorities have some discretion on how to set rents, over 30 separate rent setting arrangements exist, albeit they all share basic similarities. Local authorities generally do not levy a separate service charge.

19
The most recent Housing Revenue Account (HRA) data is from 1998 to 2004 and shows that rental income across all local authorities accounted for two thirds of management and maintenance expenditure. There is no reason to believe this pattern has changed in the intervening period. Whilst local authorities are permitted to fund this deficit from other local authority revenue, housing management and maintenance standards compare unfavourably with those in the UK. This reflects the lack of revenue income from rent and other sources available to local authority landlords.
However, funding pressures have been compounded by the fact that local authorities (unlike their GB counterparts) do not have to balance income and outgoings and thus have little financial incentive to manage their stock efficiently (Norris & O’ Connell, 2010).
To deal with the lack of capital investment in local authority housing stock, a Remedial Works Scheme (RWS) was set up in the mid 1980s. Since then, local authorities have increasingly relied on central government funding to carry out major repairs. Run-down estates and other estates built prior to 1960 have also been modernised with RWS funds.
The Housing Association Sector
The ROI Census 2011 reports there are almost 15,000 housing association units, which is just under 1% of the total ROI housing stock. Housing association development is supported through one of two central government capital funding schemes, each with its own rental arrangement:
• The Capital Loan and Subsidy Scheme (LSS) provides 100% capital funding for the provision of general needs housing for families rehoused from local authority waiting lists.
• The Capital Assistance Scheme (CAS) provides 95% capital funding for the provision of housing for people with 'specialist' needs such as older, disabled and homeless people, with the 5% difference being met by the housing association providing the land or site.
Table 2.1: Average housing association weekly rent in the Republic of Ireland
Year Capital Loan and Subsidy Scheme (General needs housing)
Capital Assistance scheme (Special needs housing)
€ £ € £ 2008 43 34.2 62 49.37 2009 47 41.9 65 57.91 2010 47 40.3 63 54.04 2011 48 41.65 64 55.54 Source: Data supplied by the Irish Council for Social Housing Note: Figures are for basic rent only and exclude service charges
As in the local authority sector, the rents for LSS units reflect the household income of tenants, which are assessed each year. Housing associations receive

20
a ‘management and maintenance allowance’ to top up rental income in order to balance their books. This allowance is based on property values and in 2012/13 was set at €543 per dwelling for properties in Dublin and the larger conurbations and €436 elsewhere. Housing associations state that this allowance is insufficient, especially since it was cut by some 25% in 2009.14.
CAS rents are intended to reflect ongoing management and maintenance costs and should therefore be higher than those for LSS funded properties (see table 2.1) but housing associations report this is not generally the case.15 Housing associations therefore tend to draw on other funding streams, including other government grants and charitable donations to help fund shortfalls.
Rent Supplement and Lease Arrangements
Rent Supplement
Low income private tenants can claim a means tested supplementary welfare allowance known as the Rent Supplement. This de facto form of housing benefit is intended to provide short-term support to private renters who experience a change in personal circumstances. It is payable to those not in full time employment (i.e. who work fewer than 30 hours a week) if they are assessed to meet various eligibility criteria and if their rent is below the maximum rent limit set by the Department of Social Protection for their relevant household type for their area of residence. Irrespective of personal circumstances, all recipients must contribute towards their rent.
Around four out of 10 private tenants currently receive this supplement. As Table 2.2 shows, over the past decade there has been significant growth in the number of recipients and the annual cost of the Rent Supplement Scheme. In an effort to contain annual revenue costs:
• The minimum weekly household contribution was increased by €6 to €30 for single tenants and by €11 to €35 for couples in January 2012. Most non-dependant single adults and couples must also make a minimum contribution of €30 or €35.
• The maximum rent limits were reduced from the start of 2010 and 2012 (see table 2.3). The 2012 downward adjustment is broadly in line with market trends and reflects the Government's ambition not to distort the market in a way that could adversely affect low paid full time workers, students and other persons who are not eligible for rent supplement.
14Interviews with housing association officials.
15 Interviews with housing association officials and with housing association representative body.

21
Table 2.2: Trends in Rent Supplement Year No of
recipients Total cost (€000)
Average rent supplement per recipient per annum €
Average rent supplement per recipient per week €
2000 42,683 150,590 3528.10 67.85 2001 45,028 179,438 3985.03 76.64 2002 54,213 252,203 4652.08 89.46 2003 59,976 331,471 5526.73 106.28 2004 57,874 353,762 6112.62 117.55 2005 60,176 368,705 6127.11 117.83 2006 59,861 388,339 6487.35 124.76 2007 59,726 391,466 6554.36 126.05 2008 74,038 440,548 5950.30 114.43 2009 93,030 510,751 5490.18 105.58 2010 97,260 516,861 5314.22 102.20 2011* 96,800 503,000 5196.28 99.93 Source: Department of Social Protection ( *denotes provisional figures)
The Rental Accommodation Scheme and other leasing arrangements
The Rental Accommodation Scheme (RAS) was introduced in 2004. Local authorities enter into contracts with private landlords to provide housing for an agreed term, typically of four years. Local authorities guarantee to fill vacancies and pay the negotiated rent for the term of the lease. In return for this transfer of risk, rents are set below Rent Supplement. The RAS mainly assists private tenants who have receivedrent supplement for more than 18 months and are therefore defined to be in long term housing need, but local authorities can also use the scheme to house other households assessed to be in long-term housing need.
By the end of 2009, more than 9,250 private dwellings had been leased through the RAS. Rents data is scarce but information obtained from Dublin City Council (see table 2.4) indicates that RAS rents have fallen back since 2008. City officials say this is due to a combination of market conditions and local authority efforts to secure greater value for money from private landlords.
Building on the RAS approach, a new Social Housing Leasing Initiative (SHLI) was set up by the Department of Environment, Community and Local Government in 2009. The scheme is designed to provide a revenue-based approach to expanding the supply of social tenancies to offset the dearth of public capital funding for new social housing and to take advantage of the large numbers of empty private houses.

22
Table 2.3: Rent Supplement Weekly Rents Limits for Selected Counties, 2010 and 2012
Selected Counties
Single person in shared accomm-odation
Couple in shared accomm-odation
Single person
Couple with no children
Couple with 1 child or one-parent with 1 child
Couple with 2 children or one parent with 2 children
Couple with 3 children or one parent with 3 children
€ € € € € € € 2010 Cavan 45 46 85 92 104 115 118 Donegal 54 55 85 105 115 127 129 Dublin Fingal 81 90 122 178 215 231 242 Dublin-Other 90 92 122 185 215 242 254 Leitrim 44 46 85 90 92 104 115 Louth 66 66 108 122 138 158 162 Monaghan 45 46 85 90 115 125 127 2012
Cavan 37 44 75 81 92 99 104 Donegal 45 46 73 81 90 104 115 Dublin Fingal 58 76 110 150 179 190 208 Dublin-Other 69 85 110 162 202 213 219 Leitrim 40 45 69 75 81 87 92 Louth 53 65 90 99 133 138 150 Monaghan 42 44 69 81 111 115 121 Source: Department of Social Protection
The SHLI allows approved social landlords to lease five or more dwellings from property owners for between 10 and 20 years, during which time the owners cannot reclaim or sell their property. The leased dwellings are then used to accommodate waiting list applicants in accordance with the local allocation scheme. Rents paid to property owners by social landlords are met through central government revenue funding.
Table 2.4: Maximum Monthly RAS rent paid by Dublin City Council (€) Year 1 bed 2 bed 3 bed 2006 950 1100 1200 2007 950 1200 1250 2008 950 1200 1300 2009 700 900 1100 2010 700 850 1000 2011 650 850 950 Change 2008-2011 -32% - 29% -26% Source: Data supplied by Dublin City Council

23
According to the Comptroller and Auditor General (2011), 643 units had been approved for leasing by mid-2010; Coates and Silke (2011) report that SHLI rents are at least 20% below Rent Supplement values, albeit this finding is based on a very small sample.
Under the RAS and SHLI arrangements, tenants pay an income-based rent to the local authority rather than the private landlord. This financial contribution is calculated on a similar basis to the differential rent paid by local authority tenants.
2.8 Northern Ireland
In Northern Ireland social housing is provided by the NIHE and housing associations. NIHE stock is primarily general needs housing, whereas housing association stock is a mix of general and special needs housing provision, including sheltered housing for older people and supported housing for various client groups.
Northern Ireland Housing Executive (NIHE)
NIHE rent setting is a two-step process. The first step involves identifying the annual level of income to be collected through rents and thereafter the annual rent increase and NIHE deficit subsidy required. These matters are set in consultation with the Department for Social Development (DSD) and allow for political considerations regarding what is deemed to be an acceptable rent uplift. DSD statistics (2010) suggest that in 2010-11 NIHE rental income was around £243 million. This rental income contributed towards the cost of loan charges, supervision and management, leaving a deficit subsidy requirement of around £123 million for maintenance in 2010-11.
The second step involves the NIHE setting the rent for each dwelling. The NIHE uses a points-based rent structure, which is described below. Unlike housing associations, but in common with many public landlords, the NIHE does not levy separate service charges. Instead, service charges are pooled across the rental stock subsumed within the overall rental charge.
The NIHE rent structure
The NIHE points-based rent structure was established in 1984. Comparability rent structures of this kind are favoured by many social landlords because of the transparency they offer in terms of the property attributes that are included or excluded in the setting of rent and the number of points (weight) applied to each attribute.
The rent for a property is calculated by multiplying the total number of points allocated to it by the cash value assigned to a single rent point. Annual rent increases involve applying the uplifted cash value of the rent point.
The points awarded (or subtracted) for a variety of property attributes through the NIHE rent structure are summarised in Table 2.5.The table contains a

24
relatively large number of attributes but many of these apply to only a small proportion of the stock.
In common with comparability-based rent structures that operate elsewhere in the UK, property type and property size are important drivers of the distribution of rents across the NIHE stock. The number of rooms is calculated in an additive way, giving the same number of points for each additional bedroom (distinguishing between single and double bedrooms). Other social landlords often limit the value of additional bedrooms beyond a given size, such as 4 bedrooms, with the explicit aim of ensuring rents for the largest properties remain affordable.
Table 2.5: NIHE rent structure Feature Points Type of Accommodation Detached (House, Bungalow, Cottage) 12 Semi Detached (House, Bungalow, Cottage) 9 Terrace (House, Bungalow, Cottage) 8 Flat/Maisonette (2 storeys or less) 5 Flat/Maisonette (3 storeys or more) 2 Sheltered Flat 2 Sheltered Bungalow 3 Size/Number of rooms Bathroom with W/C 3 Separate Bathroom 2 Internal WC separate from Bathroom 2 Living Room 3 Living Room with dining area* 4 Dining Room 2 Double Bedroom** 3 Single Bedroom** 2 Bedsitter 3 Kitchen 3 Kitchen with dining area* 4 Communal Facilities 1 Person Sheltered Dwelling 2 2 Person Sheltered Dwelling 4 3 or more Person Sheltered Dwelling 6 Age Pre 1945 1 Fully Rehabilitated 3 1945-1955 3 Fully Rehabilitated 4 1956-1965 5 Fully Rehabilitated 6 1966-1975 7

25
Table 2.5: NIHE rent structure Feature Points Post 1975 9 Heating - Whole House 1 or 2 Bedspaces Dwelling 2 3 or 4 Bedspaces Dwelling 4 5 or more Bedspaces Dwelling 6 Heating Part House 1 or 2 Bedspaces Dwelling 1 3 or 4 Bedspaces Dwelling 2 5 or more Bedspaces Dwelling 4 Individually Controlled Heating 1 Communal Heating (District Heating) 0 Access Shared Gallery or Gallery/Scissor without control -7 Gallery or Gallery/Scissor controlled -5 Communal without control -2 Communal, controlled 0 Access Independent Gallery or Gallery/Scissor Blocks -5 Other 0 Garage Within curtilage of the dwelling 7 Absence of amenities No cold water supply whatever -7 No hot water source -7 Outside pump and standpipe only -3 No mains electricity -7 Dwelling not served by mains sewer or sceptic tank -7 Source: NIHE Rent Scheme Notes: * The definition of a living room or kitchen with a dining area depends on the size of the given room plus the number of bedspaces in a property. The greater the number of bedspaces the large the minimum room size threshold. For example, in a 1-2 bedspace dwelling a kitchen with dining area must be at least 10sq m but in a 6+ bedspace dwelling this threshold is 15 sq m. **A single bedroom must be at least 3.7 sq m and a double bedroom must be at least 9.3 sq m.
The NIHE rent structure takes no account of the demand (popularity) for housing in different areas. It also takes no account of locational amenity (i.e. whether tenants have good or poor access to public transport or access to a GP, shops or other services). This reflects political considerations relating to the treatment of specific communities at the start of the 1980s.

26
Location, as measured through house price relativities, has become a feature of rent setting in England. Location is also one of the attributes on which the unified social rent policy for Wales is to be based. It may therefore be timely to review the potential to take account of location in any future rent harmonisation framework for Northern Ireland.
That said, the use of locational attributes remains a matter of some controversy. As noted earlier, the use of house prices in the target rents formula for England has and remains a matter of dispute. The CIH and tenant representatives have queried the proposed use of local authority level house prices as a proxy for location in the setting of target rents across Wales.
In Scotland, More et al (2003) found there was no consensus on whether social rents should take account of house prices or any other measures of housing demand. The same was true for locational amenity. The study team also reported that attempts to quantify either housing demand for a given area or locational amenity were beset by technical difficulties and hampered by data deficits.
The NIHE rent structure is almost 30 years old and over this time the profile of NIHE housing stock has changed substantially as a result of house sales and investment to modernise the stock. This has inevitably raised questions about whether the rent structure continues to provide a fair and defensible vehicle for distributing rents across the NIHE stock. It has also given rise to questions about the widespread use of the NIHE rent structure as the starting point for setting de-controlled and controlled rents in the housing association sector.
Housing Associations
Housing associations (HAs) must set rents and service charges at a level sufficient to cover planned expenditure but that is affordable for lower income households. Within the sector:
• Tenancies that commenced prior to September 1992 have a controlled rent, whereby the rent is set in accord with the NIHE rent structure and the annual rent uplift is set by DSD.
• Properties allocated, constructed or otherwise acquired since September 1992 have a decontrolled rent, which means that rents are set by individual housing associations.
For properties constructed prior to 1992 but re-let since then, housing associations initially sought to keep rent levels broadly in line with controlled rents. Over time, housing associations that have developed new homes have tended to modify this policy stance to ensure rental income reflects operating costs. This has been achieved by assigning extra points to these properties or charging a higher annual uplift than the DSD rate or, in at least one instance, a combination of the two.

27
Rents for properties acquired or constructed after 1992 are set in accordance with each housing association's rent structure. Documents supplied by housing associations confirm that these continue to resemble the NIHE rent structure to a greater or lesser extent.
As expected, some HA rent structures have been adapted to charge a premium for newer units. For example, one housing association awards 7 points for dwellings built between 1975 and 1995 but 16 points for dwellings built since 2005. Other attributes that have been employed in at least one instance include location, eco-housing design, secured by design, and possession of a driveway. Housing associations also tend to apply higher weights (cash value per point) for dwellings developed since 1992 and in at least one instance this weight was found to vary between schemes.
The use of higher weights is consistent with evidence supplied by DSD that the annual rent uplift applied by individual housing associations tends to exceed the DSD rate for controlled rents.
HA rent policies that have been revised within the past five years indicate that one or two housing associations have looked to rationalise their rent setting arrangements by transferring all decontrolled rents (or at least for general needs provision) onto a single rent structure.
Service charges
Housing associations often levy a service charge, most commonly for the upkeep of shared areas and facilities such as landscape maintenance, the lighting, heating and cleaning of common areas, and the maintenance and replacement of door entry systems and lifts. Tenants of sheltered housing and other 'specialist' housing and tenants of smaller general needs dwellings (in particular, flats), are most likely to pay service charges on top of their basic rent.
Service charges for 'specialist' housing generally exceed those for general needs housing. This is largely because 'specialist' housing schemes contain more costly common facilities and services. Sheltered housing, for example, may include a communal lounge and kitchen, assisted bathrooms and laundry facilities. Charges may also be levied to cover the costs associated with certain services provided by a concierge, caretaker, warden or other staff. Most service charges are eligible for Housing Benefit support but charges for heating or fuel (except for communal areas) as well as counselling or other personal support or services such as meals are not.
Regulation requires that service charges should be transparent but there appear to be marked differences in how such charges are determined and managed:
• There are different interpretations about what services fall outside the landlord functions funded from basic rental income. For example, some associations set a service charge for fire alarm maintenance or gutter cleaning whilst others do not.

28
• Some housing associations set charges to cover the full cost of providing and administering a service, but the rationale for some administrative overheads is unclear.
• Other housing associations compare their service charges with other associations to help gauge and decide what is a ‘fair charge’ to tenants.
• Whilst most appear to set charges on a scheme by scheme basis, a couple of housing associations are known to pool charges across two or more schemes.
• Some levy a charge to build up a 'sinking fund' to pay for sporadic expenditure, such as the redecoration of common areas, to prevent tenants incurring extra fees in any given year.
Future prospects
Cuts in the NI Executive capital programme and welfare reform are expected to see the already high levels of housing stress increase in the coming years. Public expenditure reductions and the collapse of capital receipts from the sale of property and land has also had an adverse impact of NIHE stock investment plans. In April 2012 the NIHE Chief Executive advised the Northern Ireland Assembly that under current arrangements NIHE could not fully meet the decent homes standard until at least 2021, some 10 years later than first anticipated.
The NI Executive is currently looking at options to boost private investment in housing. These options include the planned structural reform of the NIHE with separation of the landlord and strategic functions. How that will be done and the number and type of the new landlords is unknown, but it will not happen before 2015. Whatever options are pursued, a major challenge will be to ensure there is sufficient rental income to fund future private borrowing commitments whilst also ensuring rents remain affordable for lower paid working age and pensioner households.
2.9 Concluding Observations
Wilcox et al (2007) observe that the design of a national rent policy is ultimately a matter of policy judgement and political decisions about the balance between local autonomy and central policy control and compliance. This point is reinforced by the contrasting positions adopted in England and Scotland with respect to social rents over the last two decades.
English rent convergence experience highlights that the pace of transition from one rent setting framework to another is inevitably slow because of the need to shield tenants from major rent adjustments in any given year and 'protect' housing associations whose financial viability is finely balanced. It also shows that implementation of a national rent policy is no simple matter and often requires modifications to accommodate wider policy developments. Any plans to achieve greater rent harmonisation in Northern Ireland will need to consider

29
the impact of the welfare reform agenda on the affordability of social rents and work incentives. We return to this issue in chapter 5.
The development of proposals to harmonise social rents in Northern Ireland would have to address other and sometimes potentially controversial issues.
One such issue is whether any such proposals should include service charges as well as basic rents. Other parts of the UK have focused on basic rents. However, service charges can result in gross rents exceeding affordability limits. Service charges also increase the risk that working age tenants will find their total benefits capped under the Universal Credit provisions and there are also signals that DWP may be looking to limit eligible service charges under Universal Credit.
Another issue is what kind of rent structure could be applied and whether this should be based on a few key property attributes or a more comprehensive set of attributes. Resolution of this matter would partly depend on policy judgements about the degree of discretion social landlords should have in setting rents for individual dwellings in order to take account of local factors that centralised rent policy regimes cannot allow for.
In terms of the possible attributes, there remains a need to explore whether it would be desirable to take account of the demand (popularity) for housing across Northern Ireland and, if so, whether a measure could be identified that would be in tune with tenant valuations.
Social landlords generally apply premiums for new build dwellings and improved dwellings – albeit there has been a move to disregard improvement premiums since social landlords were required to bring their stock up to specified national standards. Such premiums tend to be based on dwelling age but questions arise as to how long the ‘newness’ of a dwelling should be associated with a rent premium.
Finally, there would be a need to consider what, if any, forms of social housing provision would be excluded from any proposed rent harmonisation framework.

30
3 NORTHERN IRELAND'S SOCIAL HOUSING STOCK
3.1 Introduction
This chapter provides an overview of the data supplied by social landlords and the sub-set of NIHE and housing association dwellings used to analyse rent patterns reported in subsequent chapters. Appendix 2 provides further details about the work undertaken to collate, clean and process NIHE and housing association data prior to analysis.
3.2 Overview of NIHE stock data
The NIHE provided rents data for 90,162 properties and the dwelling type profile of these units is shown in figure 3.1
Figure 3.1 NIHE housing stock, 2011
The data supplied included 34 units classed as ‘other’. This sub-group included 22 travellers’ places, 8 mobile homes, a disability centre, a hostel, a warden’s flat and a property recorded as sold. A further 834 units had either no assigned rent or the rent had been set at zero. These units appeared to include dwellings that were awaiting disposal or were in the process of being refurbished. After excluding units classed as 'other' or without a rental figure, the NIHE had an effective housing stock of 89,294 properties in 2011. This represented just less than 13% of Northern Ireland's occupied housing stock in 2010-11 (DSD, 2011).
Figure 3.2 illustrates that a small proportion of the 89,294 NIHE rented dwellings had unusually high or low basic rents, in some instances as low as £0.20 per week. It was not always possible from the data provided to ascertain why these 'outlier' rents existed. It was therefore decided to discount properties

31
with a rent that fell within the bottom and top percentiles (1%) from further analysis.
Figure 3.2a: Histogram of NIHE basic rent before outliers removed
Figure 3.2b: Histogram of NIHE basic rent after outliers removed
Table 3.1 summarises rent statistics for the 87,510 NIHE dwellings that formed the basis for the analysis presented in the rest of this report and excludes the invalid and outlier cases. It shows that NIHE rents ranged from £29.53 to £74.59 per week, although 80% of rents fell within the range from £41.96 to £68.38 per week.

32
Table 3.1 NIHE final sample and distribution of basic rent Sample Distribution of basic rent (deciles) Number of Units 87,510 10 £41.96 Mean weekly rent £55.09 20 £46.62 Median weekly rent £55.94 30 £51.28 40 £52.84 Minimum weekly rent £29.53 50 £55.94 Maximum weekly rent £74.59 60 £57.50 70 £60.61 Std. Deviation 8.92 80 £62.16 90 £68.38
3.3 Overview of housing association stock data
In 2011 there were 28 registered housing associations in Northern Ireland that collectively owned and managed 4% of the occupied stock in the region (DSD, 2011). There was much variation in the number of units owned and managed by housing associations. Helm and Fold had stock portfolios in excess of 4,000 dwellings whilst Broadway had a stock portfolio of 84 properties.

33
Table 3.2 Size of the housing association stock, 2011 Association Total stock Association Total stock Abbeyfield 163 Harmony 473 Alpha 926 Helm 4,706 Apex 2,609 Newington 397 Ark 280 Oaklee 3,924 Broadway 84 Open Door 301 Clanmil 2403 Rural 418 Connswater 546 SHAC 806 Covenanter 27 South Ulster 939 Dungannon& District 369 St Matthew’s 188 Filor 382 Triangle 265 Flax 445 Trinity 1,709 Fold 4,511 Ulidia 664 Gosford 197 Wesley 105 Grove 205
Total 29,732 Habinteg 1,690
Table 3.2 shows that housing associations provided data for 29,732 properties intended for let to social tenants16. Some 702 of these case records were discounted because they contained insufficient data to support analysis. The bottom and top rent percentiles (1%) of rents were also excluded from further analysis because, as with NIHE data, it was not possible to explain the reason for these outlier rents by reference to property attributes or other factors. Figure 3.3 shows the impact of removing these extreme outlier rent observations from the housing association dataset.
16This figure excludes a small number of dwellings that were not intended for let to tenants, such as warden housing.

34
Figure 3.3a: Histogram of housing association basic rent before outliers removed
Figure 3.3b: Histogram of housing association basic rent after outliers removed
Table 3.3 presents key rent statistics for the 28,450 housing association dwellings retained in the dataset used to analyse rents. With rents ranging from £28.24 to £96.67, the distribution of housing association rents was wider than the comparable rent range for NIHE dwellings observed in table 3.1.

35
Table 3.3 Housing association valid cases sample and distribution of basic rent Sample Distribution Of Basic Rent
(Deciles) Number of Units 28,450 10 £43.28 Mean weekly rent £61.71 20 £48.09 Median weekly rent £60.50 30 £50.18 40 £54.74 Minimum weekly rent £28.24 50 £60.50
Maximum weekly rent £96.67 60 £66.61
70 £71.74 Std. Deviation 14.92 80 £77.13 90 £81.35
3.4 Social rented stock attributes
Spatial distribution
The spatial distribution of social housing across the Belfast Metropolitan Area and the rest of Northern Ireland is summarised in Table 3.4, which shows that:
• The analysis of social rents was based on the rental charges and other property attributes of 115,960 NIHE (87,510) and housing association (28,450) dwellings, which represented almost 97% of all social rented dwellings held by social landlords.
• Half of the social housing stock was located in one of the six local government districts that form the Belfast Metropolitan Area (BMA). This reflects the high concentration of social housing located within Belfast, especially in the housing association sector.
• In absolute terms there were more flats in the NIHE sector (19,011) than in the housing association sector (12,653) but the proportion of flats in the NIHE sector (22%) was much lower than in the housing association sector (44%).
• The proportions of housing association properties made up of flats of any form in the BMA (47%) and the rest of Northern Ireland (42%) were similar but there were wide variations in the proportions of NIHE stock made up of flats across different parts of Northern Ireland.
• Almost half of the NIHE stock was made of terraced houses but in the BMA there was a clear difference between Belfast (61%) and the rest of the BMA (40%). Just 22% of housing association dwellings were terraced houses, but as discussed below, this proportion increased to 37% for general needs dwellings with a decontrolled rent.

36
• Most multi-storey flats (>6 storeys) were located in the BMA as were other flats located in buildings with three or more storeys. The 181 housing association multi-storey units were situated within three tower blocks located in Belfast LGD. .
Table 3.4 Spatial distribution of NIHE and housing association stock
Belfast LGD
Rest of Belfast Metropolitan Area
Belfast Metropolitan Area
Rest of Northern Ireland
Total
NIHE Stock Bedsit 79 79 158 70 228 Flat Up to 2
floors 2,725 4,263 6,988 6,292 13,280
3+ floors 1,349 1,444 2,793 1,351 4,144 Multi storey (>6)
755 715 1,470 117 1,587
Bungalow Terraced 1,381 2,534 3,915 7,820 11,735 Semi detached
379 1,097 1,476 4,900 6,376
Detached 22 47 69 398 467 House Terraced 13,408 7,417 20,825 22,060 42,885
Semi detached
1,798 957 2,755 3,971 6,726
Detached 13 21 34 48 82 Sub-total (No) 21,909 18,574 40,483 47,027 87,510 Sub-total (%) 25% 21% 46% 54% 100% Housing Association Stock Bedsit 296 195 491 516 1,007 Flat Up to 2
floors 1,941 1,142 3,083 2,777 5,860
3+ floors 3,226 1,270 4,496 2,116 6,612 Multi storey (>6)
181 0 181 0 181
Bungalow Terraced 472 290 762 500 1,262 Semi detached
475 335 810 934 1,744
Detached 90 100 190 367 557 House Terraced 3,648 481 4,129 2,187 6,316
Semi detached
1,191 1,018 2,209 2,144 4,353
Detached 180 133 313 245 558 Sub-total (No) 11,700 4,964 16,664 11,786 28,450 Sub-total (%) 41% 17% 59% 41% 100%
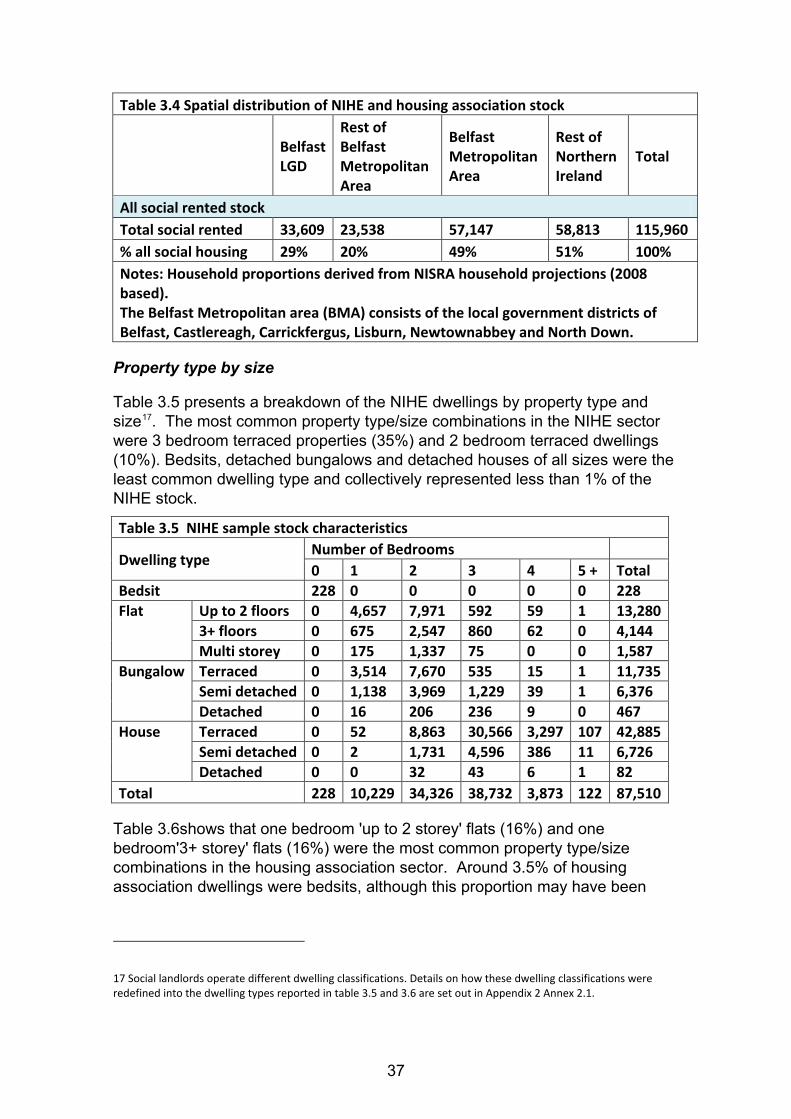
37
Table 3.4 Spatial distribution of NIHE and housing association stock
Belfast LGD
Rest of Belfast Metropolitan Area
Belfast Metropolitan Area
Rest of Northern Ireland
Total
All social rented stock Total social rented 33,609 23,538 57,147 58,813 115,960 % all social housing 29% 20% 49% 51% 100% Notes: Household proportions derived from NISRA household projections (2008 based). The Belfast Metropolitan area (BMA) consists of the local government districts of Belfast, Castlereagh, Carrickfergus, Lisburn, Newtownabbey and North Down.
Property type by size
Table 3.5 presents a breakdown of the NIHE dwellings by property type and size17. The most common property type/size combinations in the NIHE sector were 3 bedroom terraced properties (35%) and 2 bedroom terraced dwellings (10%). Bedsits, detached bungalows and detached houses of all sizes were the least common dwelling type and collectively represented less than 1% of the NIHE stock.
Table 3.5 NIHE sample stock characteristics
Dwelling type Number of Bedrooms 0 1 2 3 4 5 + Total
Bedsit 228 0 0 0 0 0 228 Flat Up to 2 floors 0 4,657 7,971 592 59 1 13,280
3+ floors 0 675 2,547 860 62 0 4,144 Multi storey 0 175 1,337 75 0 0 1,587
Bungalow Terraced 0 3,514 7,670 535 15 1 11,735 Semi detached 0 1,138 3,969 1,229 39 1 6,376 Detached 0 16 206 236 9 0 467
House Terraced 0 52 8,863 30,566 3,297 107 42,885 Semi detached 0 2 1,731 4,596 386 11 6,726 Detached 0 0 32 43 6 1 82
Total 228 10,229 34,326 38,732 3,873 122 87,510
Table 3.6shows that one bedroom 'up to 2 storey' flats (16%) and one bedroom'3+ storey' flats (16%) were the most common property type/size combinations in the housing association sector. Around 3.5% of housing association dwellings were bedsits, although this proportion may have been
17 Social landlords operate different dwelling classifications. Details on how these dwelling classifications were redefined into the dwelling types reported in table 3.5 and 3.6 are set out in Appendix 2 Annex 2.1.

38
closer to 4%, because we suspect some larger dwellings reported by housing associations to be a house were in fact single dwellings that contained bedsit provision for sheltered tenants.
Table 3.6 Characteristics of stock held by housing associations
Dwelling type Number of Bedrooms 0 1 2 3 4 5 + Total
Bedsit 1,007 0 0 0 0 0 1,007
Flat Up to 2 floors 0 4,550 1,242 65 1 2 5,860 3+ floors 0 4,549 1,830 230 3 0 6,612 Multi storey 0 84 91 6 0 0 181
Bungalow Terraced 0 551 594 97 13 7 1,262 Semi detached 0 273 1,152 286 31 2 1,744 Detached 0 53 285 172 41 6 557
House Terraced 0 71 2,030 3,406 599 210 6,316 Semi detached 0 1 1,339 2,707 207 99 4,353 Detached 0 0 176 324 40 18 558
Total 1,007 10,132 8,739 7,293 935 344 28,450
Type of provision supplied by housing associations
The high proportion of bedsits and one bedroom dwellings in the housing association sector reflects the sector’s role in providing specialist housing for various specific need groups. Table 3.7 shows that:
• Some 56% of the housing association stock was defined as general needs but this increased to 84% if properties with 0-1 bedroom dwellings were excluded.
• Almost 31% of all housing association dwellings were in the form of sheltered provision; these were mainly 1 or 2 bedroom dwellings.
• Housing association general needs housing stock mainly comprised 2 and 3 bedroom dwellings.
• Of the 2,628 dwellings (9%) classified as 'other or 'missing', 746 units were defined by the study team to be 'other'. These units were virtually all student accommodation and hostel style accommodation for single people.
• All 1,007 bedsits catered for specific sub-groups of the population such as older people, other adults with support needs, students and other single people seeking short term, furnished accommodation.

39
Table 3.7 Type of provision of housing association stock Provision type
Number of Bedrooms 0 1 2 3 4 5 + Total
General Number 6 1,499 6,731 6,571 886 312 16,005 % 0.6% 14.8% 77.0% 90.1% 94.8% 90.7% 56.3%
Sheltered Number 2 7,512 1,109 116 16 30 8,785 % 0.2% 74.1% 12.7% 1.6% 1.7% 8.7% 30.9%
Supported Number 510 381 106 29 6 0 1,032 % 50.6% 3.8% 1.2% 0.4% 0.6% 0.0% 3.6%
Other or missing
Number 489 740 793 577 27 2 2,628 % 48.6% 7.3% 9.1% 7.9% 2.9% 0.6% 9.2%
Total
Number 1,007 10,132 8,739 7,293 935 344 28,450 % 100% 100% 100% 100% 100% 100% 100%
In terms of general needs provision, a 3 bedroom terraced house was the single most common property type/size combination in the housing association sector. It represented 12% of all housing association dwellings but 21% of general needs provision.
Controlled and decontrolled rents in the housing association sector
As discussed in chapter 2, a complicating factor that housing associations must contend with is that their rent policies and rent setting arrangements must take account of controlled and decontrolled rents. Table 3.8 therefore breaks down the 28,450 housing association dwellings by rent type.
It shows that:
• Of the 28,450 housing association dwellings, there are some 227 records where rent type was not reported by housing associations and could not be verified.
• Some 95% of housing association lettings had a decontrolled rent but this increased to 96% if unknown cases were excluded.
• Where known, just over 96% of general needs dwellings had a decontrolled rent, which was matched by the proportion of decontrolled rents for sheltered dwellings (also 96%). This is reflected in the fact that 96% of 1 and 2 bedroom units – the dominant property sizes – had a decontrolled rent. The proportion of decontrolled rents was slightly lower for 3 bedroom units, but 98% of dwellings with 5 or more bedrooms had decontrolled rents.

40
Table 3.8 Number of controlled and decontrolled rents in housing association sector
Number of Bedrooms 0 1 2 3 4 5 + Total
General Controlled 0 57 228 254 63 8 610 Decontrolled 6 1,442 6,502 6,317 823 304 15,394
Sheltered Controlled 0 280 33 7 0 0 320 Decontrolled 2 7,232 1,076 109 16 30 8,465
Total
Controlled* 193 361 262 261 63 8 1,148 Decontrolled* 814 9,722 8,376 6,957 870 336 27,075 Missing etc 0 49 101 75 2 0 227 All 1,007 10,132 8,739 7,293 935 344 28,450
Note: * The total sum of controlled and decontrolled rents includes cases where the provision type is supported /specialist provision or is not known.
3.5 A benchmark rent
To examine rent differentials between dwellings of a different type and size it is helpful to select a benchmark dwelling type/size against which other combinations can be compared. A benchmark rent is also useful to gain some insight into the geographic pattern of rents across Northern Ireland.
In view of the analysis presented in this chapter, a general needs, unfurnished 3 bedroom terraced house was adopted as the benchmark property:
• Around 35% of the NIHE stock was in this category.
• 2,834 housing association properties with a decontrolled rent were in this category, which represented around 18% of all decontrolled rent general needs housing.
The adoption of a possible second benchmark rent for one bedroom flats was ruled out because of the complication that a large share of such housing association units were some form of specialist accommodation.
The basic weekly rent ranges for 3 bedroom terraced houses in the NIHE and housing association sectors are summarised in table 3.9. In interpreting the housing association figures, it should be kept in mind that the rent figures are restricted to unfurnished general need dwellings with a decontrolled rent. Moreover, in both sectors the 3 bedroom terraced house includes a small number of dwellings with a garage. Table 3.9 shows that:
• The median benchmark rent in the housing association was higher than the comparable NIHE rent. This was consistent with previous findings (Gibb et al, 2007)

41
• The spread of rents for 3 bedroom general needs terraced houses was wider in the housing association sector than in the NIHE sector. This issue is investigated further in chapter 4.
Table 3.9: Benchmark rent for NIHE and NI housing associations
NIHE Stock HA general needs decontrolled stock
All NIHE valid dwellings
3 bedroom terraced house
All decontrolled rents
3 bedroom terraced house
No units 87,510 30,566 15,394 2,834 Mean £55.09 £61.20 £70.20 £76.23 Median £55.94 £60.61 £71.74 £77.13 Std. Deviation 8.92 5.51 12.46 9.19 Maximum £74.59 £74.22 £96.67 £96.64 Decile (rent distribution or spread of rents) 10 £41.96 £54.39 £51.56 £64.45 20 £46.62 £55.94 £59.60 £69.21 30 £51.28 £59.05 £64.45 £71.87 40 £52.84 £60.61 £68.38 £73.72 50 £55.94 £60.61 £71.74 £77.13 60 £57.50 £62.16 £74.61 £78.55 70 £60.61 £63.71 £78.89 £80.15 80 £62.16 £68.38 £80.44 £83.66 90 £68.38 £68.38 £84.96 £88.62
3.6 Concluding observations
The analysis contained in the rest of this report is based on the rent and property attributes for 115,960 NIHE and housing association dwellings, which represented 97% of all social rented dwellings in Northern Ireland in 2011-12. The dataset excluded properties for which insufficient data was provided to support analysis and dwellings with unusually high or low rents.
In terms of general needs provision, the single most common dwelling type in both the NIHE and housing association sectors was a 3 bedroom terraced house. Three bedroom terraced houses also represented a similar proportion of the stock held within the Belfast Metropolitan Area and in the rest of Northern Ireland. As a result, such units were judged suitable to use as a base for some of the rent comparisons reported in chapter 4.

42
4 ANALYSIS OF BASIC RENT LEVELS AND STRUCTURES
4.1 Introduction
This chapter compares social rents in Northern Ireland relative to the rest of the UK. It also updates key elements of the 2007 analysis of social rents in Northern Ireland (Gibb et al, 2007). To facilitate comparison between the two sectors, much of this analysis centres on general needs provision. In light of the small numbers of bedsits and larger dwellings, this analysis concentrates on dwellings that contain between one and five bedrooms. In the case of housing associations, all rents reported are decontrolled basic rents and exclude service charges unless specified otherwise. Further exploration of rents and service charges is set out in appendices 3 and 4.
4.2 National comparisons
Trends in social rent across the UK
Table 4.1 shows trends in the average published public sector and housing association rent across the UK. The figures must be treated with caution; NI housing association rents are inclusive of rates and service charges for all dwellings whereas the housing association figures for the rest of the UK are basic rents for general needs housing.
Table 4.1: LA (Public) and HA average weekly rents across UK, 2001-2011 England Wales Scotland Northern Ireland Public HA Public HA Public HA Public HA* 2001-02 £47.87 £55.46 £43.28 £46.26 £39.30 £48.81 £40.34 £46.95 2002-03 £49.93 £56.90 £44.74 £48.07 £40.43 £50.69 £41.53 £52.31 2003-04 £51.02 £58.11 £46.20 £49.61 £40.89 £52.14 £42.88 £56.05 2004-05 £52.90 £60.45 £48.22 £51.15 £42.64 £50.22 £44.19 £58.85 2005-06 £55.27 £63.08 £50.05 £52.99 £44.79 £52.37 £45.73 £61.87 2006-07 £57.93 £65.40 £51.98 £55.21 £46.11 £51.96 £47.04 £64.82 2007-08 £61.62 £68.13 £55.26 £58.23 £48.35 £56.21 £48.82 £68.76 2008-09 £64.21 £72.23 £57.90 £62.06 £50.36 £58.32 £50.81 £73.44 2009-10 £66.05 £75.88 £61.04 £65.40 £52.67 £61.01 £51.84 £76.96 2010-11 £67.83 £76.39 £62.58 £67.01 £54.31 £62.96 £52.76 £81.69 2011-12* £72.30 £78.28 £66.32 £69.51 £56.80 £65.77 £54.73 NA Change (£) 2001 -10
£19.96 £20.93 £19.30 £20.75 £15.01 £14.15 £12.42 £34.74
Change (%) 2001-10
41.7% 37.7% 44.6% 44.9% 38.2% 29.0% 30.8% 74.0%
Sources: DCLG (2012) live tables; DSD (2011) Northern Ireland Housing Statistics and Pawson and Wilcox, 2011

43
Notes: Rent Figures for 2011-12 are provisional (and subject to revision). HA figures for Northern Ireland include service charges, whereas rents for Great Britain are taken from the Annual statistical return and refer to basic rents for general needs housing. In Scotland the transfer of stock from local authorities, especially in Glasgow, offset rent increases in the 'traditional ' housing association sector during the middle of the decade.
In 2001-02 the average rents in both sectors were highest in England, followed by Wales; this has remained the case thereafter. Table 4.1 also indicates that:
• The difference between the average public sector rent for England and Wales has fluctuated over time but for the most part has been around £5-£7. In contrast, the difference between the average public sector rent for England and the comparable figures for Northern Ireland and Scotland have widened. In 2001-02 the average NIHE rent was £7.53 lower than the local authority rent for England but by 2010-11 the difference had widened to £15.07. Provisional data suggest this trend continued in 2011-12.
• Public sector rents in Northern Ireland and Scotland increased at a similar rate until 2006-7. Since then, Scottish rents have increased more sharply, in part to pay for additional borrowing to upgrade stock to the Scottish Housing Quality Standard and, more recently, to fund new council housing.
• The average housing association rent has increased much more sharply than the average NIHE rent. The extent to which this development has been due to a sharp rise in housing association basic rents, service charges or a combination of the two, is not known.
Northern Ireland and England rent differentials compared
Table 4.2 indicates that the average basic housing association and the average NIHE rent are considerably lower than their English equivalents, irrespective of dwelling size.
Table 4.2 Northern Ireland and England weekly rent by size
Sector
Dwelling size
Northern Ireland (2011) England (2010-11)
Basic Gross Basic rent differential Basic Gross Basic rent
differential
Public sector
Bedsits £34.30 £34.30 67.0% £58.84 £66.51 86.4% 1 bedroom £43.18 £43.18 84.4% £60.59 £65.31 88.9% 2 bedroom £51.16 £51.16 100.0% £68.14 £71.19 100.0% 3 bedroom £60.76 £60.76 118.8% £75.12 £76.83 110.2% 4 bedroom £65.55 £65.55 128.1% £86.74 £89.53 127.3%
Housing Bedsits £40.29 £61.73 62.3% £62.01 £71.43 80.4%

44
association 1 bedroom £48.27 £71.95 74.7% £67.34 £74.18 87.3% 2 bedroom £64.65 £70.86 100.0% £77.11 £81.69 100.0% 3 bedroom £76.53 £79.11 118.4% £86.27 £88.61 111.9% 4 bedroom £79.95 £82.29 123.7% £103.60 £107.14 134.4%
Sources: Northern Ireland rents are based on NIHE and housing association datasets. English rents are derived from CORE and reported in Pawson and Wilcox (2011); accessed July 2012. Note: Gross rents for England include any applicable general service charges, personal service charges and support charges. NIHE (public sector) does not levy separate service charges and hence basic and gross rent are the same.
Table 4.2 also shows the basic average rent for different sized dwellings as a proportion of the average rent for a 2 bedroom dwelling (100%) in 2010-11. These rent differentials illustrate the relative value of different sized dwellings and permit comparison with the bedroom weighting applied in the English rent convergence policy.
The rent differential percentages show that the relative values of housing association rents in England for different sized dwellings were reasonably similar to the English guideline bedroom weights. The rent for a one bedroom housing association dwelling was equivalent to 87% of the rent for a 2 bedroom property, which was slightly below the guideline weight of 90%. Likewise the rent for a 3 bedroom dwelling was 112%, which was just above the guideline weight of 110%.
The only exception was 4 bedroom dwellings where the rent differential of 134% was well in excess of the guideline weight of 120%. The most likely reason for this was that a higher share of 4 bedroom dwellings was allocated in the south of England where rents were higher18. A similar pattern can be seen in respect of English local authority rents.
In comparison, rent differentials for 1 to 3 bedroom dwellings in both the NIHE and housing association sectors were wider than the guideline weights. The relative values for one bedroom housing association (75%) and NIHE (85%) dwellings were lower than the guideline weight of 90%, while the relative values for 3 bedroom housing association (118%) and NIHE (119%) dwellings exceeded the guideline weight of 110%. We investigate this matter further later in this chapter.
4.3 Northern Ireland Rents
NIHE rent patterns
Table 4.3 summarises NIHE rents at the Northern Ireland level by dwelling type and size in 2011-12. It shows that:
18 We also suspect the 4 bedroom figures may in fact be for 4 or more bedrooms.

45
• There was a clear relationship between rent and property size; the higher the number of bedrooms the higher the rent. This pattern was evident across all dwelling types.
• Consistent with the NIHE rent structure summarised in chapter 2, rents varied by dwelling type, with detached houses and bungalows being the most expensive type of accommodation, followed by semi-detached and then terraced properties.
• Multi-storey flats typically had a lower average rent than low rise flats. The one exception was that the average rent for a 3 bedroom multi-storey flat rent was higher than the average rent for a 3 bedroom low rise flat. This anomaly was due to the presence of significant numbers of low rise flats with common access arrangements. In line with the NIHE rent structure, these flats had lower rents than other flats to reflect their lower popularity with tenants, at least historically.
Sub-national NIHE rent patterns
There was little variation in the average NIHE rent at sub-national level. Moreover, geographical variations in the average rent for any dwelling type/size combination simply reflected variations in the detailed composition of NIHE properties that fell within each broad dwelling type/size category in different geographical areas. This reflects the absence of a location attribute in the NIHE rent structure and is confirmed by the figures in table 4.4, which show that the average rent for all 3 bedroom dwellings in the BMA was £60.31 compared with £61.09 for the rest of Northern Ireland. Likewise, for a 3 bedroom terraced house, the average rent figures were £60.89 and £61.44 respectively.
Table 4.3: NIHE weekly rent by dwelling type and size, 2011/12
Dwelling type
Dwelling Size 1 2 3 4 5
Detached house
Number 0 32 43 6 1 Average - £57.93 £64.16 £68.64 £65.27 Range - £20.20 £28.45 £9.33 £0.00 Minimum - £46.62 £46.14 £63.71 £65.27 Maximum - £66.82 £74.59 £73.04 £65.27
Semi-detached house
Number 2 1,731 4,596 386 11 Average £37.30 £54.25 £61.56 £65.23 £69.08 Range £0.00 £32.63 £32.63 £27.97 £15.54 Minimum £37.30 £37.30 £41.96 £46.62 £59.05 Maximum £37.30 £69.93 £74.59 £74.59 £74.59
Detached bungalow
Number 16 206 236 9 0 Average £52.55 £58.23 £62.54 £68.72 - Range £9.32 £32.64 £29.78 £15.54 - Minimum £46.62 £40.40 £43.26 £57.50 - Maximum £55.94 £73.04 £73.04 £73.04 -

46
Semi-detached Bungalow
Number 1,138 3,969 1,229 39 1 Average £47.43 £55.93 £58.34 £63.99 £71.48 Range £23.31 £32.64 £34.19 £27.97 £0.00 Minimum £35.74 £35.74 £38.85 £45.07 £71.48 Maximum £59.05 £68.38 £73.04 £73.04 £71.48
Terraced bungalow
Number 3,514 7,670 535 15 1 Average £46.30 £55.10 £61.09 £66.10 £66.82 Range £21.76 £32.64 £27.97 £27.97 £0.00 Minimum £35.74 £35.74 £45.07 £45.07 £66.82 Maximum £57.50 £68.38 £73.04 £73.04 £66.82
Terraced house
Number 52 8,863 30,566 3,297 106 Average £39.48 £52.34 £61.20 £65.50 £67.75 Range £12.43 £34.19 £35.37 £32.63 £21.75 Minimum £35.74 £35.74 £38.85 £41.96 £52.84 Maximum £48.17 £69.93 £74.22 £74.59 £74.59
Low rise flat
Number 5,332 10,518 1,452 121 0 Average £40.46 £45.82 £50.82 £67.85 - Range £38.66 £44.44 £40.41 £32.64 - Minimum £29.53 £29.53 £32.63 £40.40 - Maximum £68.19 £73.97 £73.04 £73.04 -
Multi/high rise Number 175 1,337 75 0 0
Average £36.08 £43.32 £53.94 - - Range £7.77 £13.99 £6.21 - - Minimum £31.08 £32.63 £49.73 - - Maximum £38.85 £46.62 £55.94 - -
Total Number 10,229 34,326 38,732 3,873 120 Average £43.18 £51.16 £60.76 £65.55 £67.87 Range £38.66 £44.44 £41.96 £34.19 £21.75
Table 4.4: NIHE weekly rent by sub-region
Dwelling Size 1 2 3 4 5
Belfast Metropolitan Area (BMA)
Total
Number 4,863 17,473 16,451 1,476 62 Average £42.73 £50.21 £60.31 £64.94 £67.65 Range £38.66 £43.51 £40.41 £32.64 £15.54 Minimum £29.53 £29.53 £32.63 £40.40 £57.50 Maximum £68.19 £73.04 £73.04 £73.04 £73.04
Terraced house
Number 38 6,003 13,398 1,327 59 Average £39.67 £52.68 £60.89 £64.88 £67.69 Range £7.77 £32.64 £32.64 £31.08 £15.54 Minimum £35.74 £35.74 £40.40 £41.96 £57.50 Maximum £43.51 £68.38 £73.04 £73.04 £73.04

47
Rest of Northern Ireland
Total
Number 5,366 16,853 22,281 2,397 58 Average £43.59 £52.14 £61.09 £65.92 £68.11 Range £38.19 £42.89 £41.96 £29.52 £21.75 Minimum £29.53 £31.08 £32.63 £45.07 £52.84 Maximum £67.72 £73.97 £74.59 £74.59 £74.59
Terraced house
Number 14 2,860 17,168 1,970 47 Average £38.96 £51.64 £61.44 £65.92 £67.81 Range £10.87 £31.08 £35.37 £29.52 £21.75 Minimum £37.30 £38.85 £38.85 £45.07 £52.84 Maximum £48.17 £69.93 £74.22 £74.59 £74.59
Housing association basic rent patterns
Table 4.5 summarises basic housing association decontrolled rents by dwelling type and size. Comparable figures for general needs and sheltered/supported housing can be found in Annex 3.1. Collectively, these tables show that in terms of average rents:
• Housing associations rents, as in the NIHE sector, were generally higher for larger than for smaller dwellings of the same dwelling type.
• Rents tended to be higher for houses than for flats but there were exceptions. Average rents for 1-2 bedroom low-rise flats were higher than those for 1-2 bedroom terraced houses. This apparent anomaly seems to be due to the common practice of charging a premium for recently constructed dwellings, which has pushed up the average rent for smaller flats.
For all dwelling type/size combinations, the average housing association rent was higher than the NIHE rent. Moreover, for virtually all dwelling type/size combinations, the average basic rent for general needs provision was higher than for sheltered/supported provision, albeit in almost all cases the difference was modest.
The average rent for a 3 bedroom terraced house ranged from £76.23 for general needs provision to £66.52 for sheltered/supported provision but this difference is atypical and in any case there were only a handful of sheltered/supported dwellings in this dwelling type/size category. More typical of the general pattern were the average rents for 1 bedroom flats: £48.57for general needs provision and £47.65 for sheltered/supported provision.

48
Table 4.5: NI housing association decontrolled basic weekly rent by dwelling type and size
Dwelling type Dwelling Size 1 2 3 4 5
Detached house
Number 0 176 314 40 15 Average - £70.82 £79.18 £81.61 £87.30 Range - £27.85 £33.03 £64.08 £14.81 Minimum - £58.97 £61.97 £32.21 £79.56 Maximum - £86.82 £95.00 £96.29 £94.37
Semi-detached house
Number 1 1,327 2,675 204 87 Average £57.71 £72.50 £79.83 £83.89 £83.71 Range £0.00 £60.11 £50.34 £36.94 £15.71 Minimum £57.71 £35.04 £46.33 £59.73 £76.13 Maximum £57.71 £95.15 £96.67 £96.67 £91.84
Detached bungalow
Number 47 282 167 39 6 Average £57.45 £68.37 £81.25 £82.48 £79.03 Range £32.82 £37.44 £31.95 £64.97 £23.89 Minimum £40.31 £53.38 £61.75 £30.74 £65.51 Maximum £73.13 £90.82 £93.70 £95.71 £89.40
Semi-detached Bungalow
Number 256 1,141 279 29 2 Average £55.25 £67.26 £77.22 £82.52 £84.49 Range £35.99 £52.00 £44.85 £28.52 £4.14 Minimum £35.77 £38.96 £49.95 £67.54 £82.42 Maximum £71.76 £90.96 £94.80 £96.06 £86.56
Terraced bungalow
Number 516 570 81 11 5 Average £52.06 £64.69 £72.52 £75.90 £76.52 Range £32.35 £43.73 £30.97 £32.99 £19.98 Minimum £43.53 £48.17 £57.65 £52.81 £62.20 Maximum £75.88 £91.90 £88.62 £85.80 £82.18
Terraced house
Number 65 1,842 3,151 543 168 Average £46.68 £61.97 £75.62 £79.74 £80.14 Range £46.08 £60.07 £62.24 £42.27 £35.57 Minimum £37.70 £36.04 £34.40 £54.40 £59.86 Maximum £83.78 £96.11 £96.64 £96.67 £95.43
Low rise flat
Number 8,773 2,992 290 4 2 Average £47.93 £62.29 £62.02 £56.97 £62.22 Range £53.47 £66.65 £54.60 £7.18 £4.40 Minimum £28.70 £28.36 £40.41 £52.84 £60.02 Maximum £82.17 £95.01 £95.01 £60.02 £64.42
Multi/high rise
Number 64 46 0 0 0 Average £50.30 £57.83 - - - Range £10.58 £18.36 - - - Minimum £46.72 £51.24 - - -

49
Maximum £57.30 £69.60 - - -
Total Number 9,722 8,376 6,957 870 285 Average £48.40 £65.04 £77.00 £80.86 £81.43
Range £55.08 £67.75 £62.27 £65.93 £35.57
Sub-national rent patterns
Table 4.6 compares housing association rents for the Belfast Metropolitan Area (BMA) and the rest of Northern Ireland. The analysis focuses on low rise flats and terraced houses as these are the most common housing association dwelling types. This comparison reveals less spatial variation in basic rents than might have been anticipated.
Table 4.6: NI decontrolled housing association weekly rent by sub-region
Dwelling type Dwelling Size 1 2 3 4 5
BMA
Total
Number 5,527 5,297 3,771 564 225 Average £48.83 £65.11 £76.93 £80.00 £80.93 Range £55.08 £67.75 £61.82 £65.93 £35.57 Minimum £28.70 £28.36 £34.40 £30.74 £59.86 Maximum £83.78 £96.11 £96.22 £96.67 £95.43
Terraced House
Number 61 1,166 1,933 421 145 Average £46.46 £61.38 £75.84 £79.03 £79.38 Range £45.31 £60.07 £61.82 £42.27 £35.57 Minimum £38.47 £36.04 £34.40 £54.40 £59.86 Maximum £83.78 £96.11 £96.22 £96.67 £95.43
Low Rise Flats
Number 4,976 2,148 214 3 0 Average £48.47 £63.08 £61.64 £55.95 - Range £52.47 £66.65 £54.60 £4.67 - Minimum £28.70 £28.36 £40.41 £52.84 - Maximum £81.17 £95.01 £95.01 £57.51 -
Rest of Northern Ireland
Total
Number 4,195 3,079 3,186 306 60 Average £47.82 £64.92 £77.08 £82.45 £83.31 Range £50.75 £60.59 £52.13 £64.08 £34.35 Minimum £31.42 £34.56 £44.54 £32.21 £60.02 Maximum £82.17 £95.15 £96.67 £96.29 £94.37
Terraced House
Number 4 676 1,218 122 23 Average £50.10 £63.00 £75.27 £82.18 £84.94 Range £18.40 £45.61 £48.31 £37.00 £22.12 Minimum £37.70 £39.04 £48.33 £58.19 £71.74 Maximum £56.10 £84.65 £96.64 £95.19 £93.86
Low Rise Flats Number 3,797 844 76 1 2 Average £47.22 £60.30 £63.09 £60.02 £62.22

50
Range £50.75 £53.04 £46.42 £0.00 £4.40 Minimum £31.42 £34.56 £44.54 £60.02 £60.02 Maximum £82.17 £87.60 £90.96 £60.02 £64.42
Housing association decontrolled rents within the BMA were therefore investigated further. This analysis indicated that the average decontrolled general needs rent for a 3 bedroom terraced house in five of the six local government districts was within £5 of the comparable average rent for the BMA reported in table 4.6 (£75.84). The exception to this was Lisburn, where the average decontrolled rent for a general needs 3 bedroom terraced house was slightly higher at £86.24.
With dwellings constructed prior to 2006 discounted, the range in the average rent between the six local government districts increased by £13.24, but the only local authority areas to have more than 10 valid cases were Belfast and Lisburn.
The lack of any substantive spatial variation in average rents is consistent with housing association rent policies, which indicate that location is not a variable that housing associations generally use to set rents.
Rent differentials
As noted earlier, one way to explore the coherence and fairness of rents is to examine rent differentials and the relative value of dwellings. To permit comparison with the English guideline weights, we calculated the average rent for different sized dwellings as a proportion of the average rent for a 2-bedroom terraced dwelling. These rent differentials are set out in table 4.7.

51
Table 4.7: NIHE and housing association rent as % of rent for 2 bedroom terraced house NIHE rent
Dwelling Type Rent as a percentage of the rent for a 2 bedroom terraced house
1 2 3 4 5 Detached house - 111% 123% 131% 125% Semi-detached house 71% 104% 118% 125% 132% Detached bungalow 100% 111% 119% 131% - Semi-detached bungalow 91% 107% 111% 122% 137% Terraced bungalow 88% 105% 117% 126% 128% Terraced house 75% 100% 117% 125% 129% Low rise flat 77% 88% 97% 130% - Multi/high rise flat 69% 83% 103% - - Housing association - decontrolled basic rent
Dwelling Type Rent as a percentage of the rent for a 2 bedroom terraced house
1 2 3 4 5 Detached house - 114% 128% 132% 141% Semi-detached House 93% 117% 129% 135% 135% Detached bungalow 93% 110% 131% 133% 128% Semi-detached bungalow
89% 109% 125% 133% 136%
Terraced bungalow 84% 104% 117% 122% 123% Terraced house 75% 100% 122% 129% 129% Low rise flat 77% 101% 100% 92% 100% Multi/high rise flat 81% 93% - - -
Rent differentials in both sectors confirm that rents generally increase with size and that for dwellings of the same size rents for houses are higher than for flats. There are exceptions, the most important of which were explained earlier. In most other cases, anomalies are, in the main, due to the small numbers of 4 or 5 bedroom properties within some dwelling classifications.
Table 4.2 illustrated that rent differentials in Northern Ireland were wider than the English guideline bedroom weights. Table 4.7 confirms that these wider differentials persisted across most dwelling types. In the case of terraced houses, the relative values for one bedroom NIHE(75%) and housing association (75%) dwellings were lower than the guideline bedroom weight of 90%. Likewise, the relative values for 3 bedroom NIHE (117%) and housing association (122%) terraced houses exceeded the guideline bedroom weight of 110%.

52
One of the reasons for these wider size differentials is that the NIHE rent structure applies the same number of points for the first bedroom and each additional single or double bedroom; this is also a feature of most housing association policies. In contrast, rent structures applied by social landlords elsewhere in the UK often assign a specific number of points for a given number of bedrooms in order to achieve greater compression of rents. The different outcomes of these alternative approaches are illustrated in appendix 3 (see table A3.2).
It would be relatively straightforward from a technical perspective to make some adjustment to the NIHE rent structure in order to achieve greater compression of social rents in Northern Ireland. This might be seen as desirable if the policy aim was to dampen the adverse impact of the forthcoming cuts in housing benefits for those under-occupying larger dwellings, albeit the impact would be rather limited.19
Rent distributions
Average rents often disguise variations in the range of rents for properties of the same size and dwelling type category. The minimum rent, maximum rent and rent range figures in tables 4.3 to 4.6 illustrate that this is the case in Northern Ireland:
• The cash differential for 3 bedroom terraced houses in the housing association sector was more than £62. For general needs provision (see table A3.1), the differential was over £57.
• The rent range for many dwelling type/size combinations in the NIHE sector was also considerable. For 3 bedroom terraced dwellings there was a cash differential of £35.37 between the lowest (£38.85) and highest (£74.22) rents.
Looking more closely at the distribution of rents for 3 bedroom terraced houses (and, in the case of housing associations, general need decontrolled rents), figure 4.1 illustrates that:
• There was much more variation in housing association rents, with greater compression of rents around the average NIHE rent. Put another way, if the bottom and top deciles were excluded, the cash differential for NIHE dwellings fell from over £35 to £14, whereas in the housing association sector this cash differential was still over £24.
19 To illustrate the point, assume that the rent for a dwelling (basic rent and eligible service charge) is £90 per week. For a tenant under-occupying by one bedroom a 14% reduction of £12.60 would be applied, resulting in a HB payment of £77.40. For a tenant under-occupying by two bedrooms, a 25% reduction of £22.50 would be applied and would result in a HB payment of £67.50. If the rent for this dwelling were to be reduced to £75 per week, the 14% and 25% reductions would fall to £10.50 and £18.75 respectively.

53
• Approximately 50% of housing association-owned3 bedroom terraced houses had a rent of £77 or more, which was the upper limit in the NIHE sector.
• The peak of the distribution in the NIHE sector (the modal rent) was £68.38 while in the housing association sector it was £77.13.
Figure 4.1 a Distribution of weekly rent for NIHE general needs 3 bedroom terrace house
Figure 4.1 b Distribution of weekly rent for HA (decontrolled) general needs 3 bedroom terrace house

54
4.4 Further consideration of housing association rents
Comparison between controlled and decontrolled rents
Broadly speaking, housing association decontrolled rents were found to be higher than controlled rents. That said, there was a substantial degree of overlap. No doubt this is because housing associations tend to use controlled rents as a basis for setting decontrolled rents for dwellings built or acquired prior to 1992. Figure 4.2 illustrates this by reference to general needs 3 bedroom terraced houses. It also highlights that the spread of controlled rents (£48.18 to £86.42), although still wide, was more compressed than for decontrolled rents (£39.56 to £96.64).
Figure 4.2a Distribution of HA controlled weekly rent for general needs 3 bedroom terrace house
Figure 4.2b Distribution of HA decontrolled weekly rent for general needs 3 bedroom terrace house

55
Comparison of decontrolled rents by date of construction
Since the 1990s, housing associations have relied on a mix of public subsidy, private borrowing and contributions from reserves to fund new housing. The size and structure of private finance portfolios and the use of rental income to pay for this borrowing vary from one housing association to another.
We do not have evidence on the funding arrangements of individual housing associations and how this affects the level of rent for decontrolled properties. Some insight into the possible impact of greater use of private finance over time can, however, be gleaned by comparing the rents for general needs dwellings constructed before 2006 with those constructed from 2006 onwards.
The findings reported in table 4.8 show that rents for more recently constructed dwellings were generally higher across all property type/size combinations for which there were sufficient cases to permit valid comparisons. A similar pattern can be observed when 2002 is selected as an alternative cut-off year.
Regression analysis, used to examine the significance of different attributes in shaping the basic rents set by NIHE and housing associations, also suggests that mixed funding has had a significant influence on housing association rents (see appendix 4).
Table 4.8: Average HA general needs decontrolled weekly rent by dwelling size and year constructed
Dwelling size 1 2 3 4
Housing association general needs dwelling constructed from 2006 onwards Semi-detached house - £72.29 £80.16 £85.34 Detached bungalow - £72.41 £81.98 £88.82 Semi-detached bungalow - £71.13 £88.31 £82.39 Terraced bungalow - £70.41 £81.70 - Terraced house - £71.08 £79.81 £83.95 Low rise flat £56.31 £66.08 £58.68 - Housing association general needs dwelling constructed prior to 2006 Semi-detached house £57.71 £70.13 £78.35 £82.16 Detached bungalow £57.31 £67.13 £81.08 £86.29 Semi-detached bungalow £56.42 £66.37 £77.54 £81.84 Terraced bungalow £53.33 £64.76 £72.16 £77.11 Terraced house £48.13 £61.11 £72.39 £76.49 Low rise flat £46.43 £58.65 £61.95 £55.95 Note: The table is based on 77% of HA sample of 15,394 decontrolled general needs provision as construction year not specified in all records. Bedsits, detached houses, multi storey flats and 5+ bedroom properties are not reported because of the small numbers constructed from 2006 onwards.
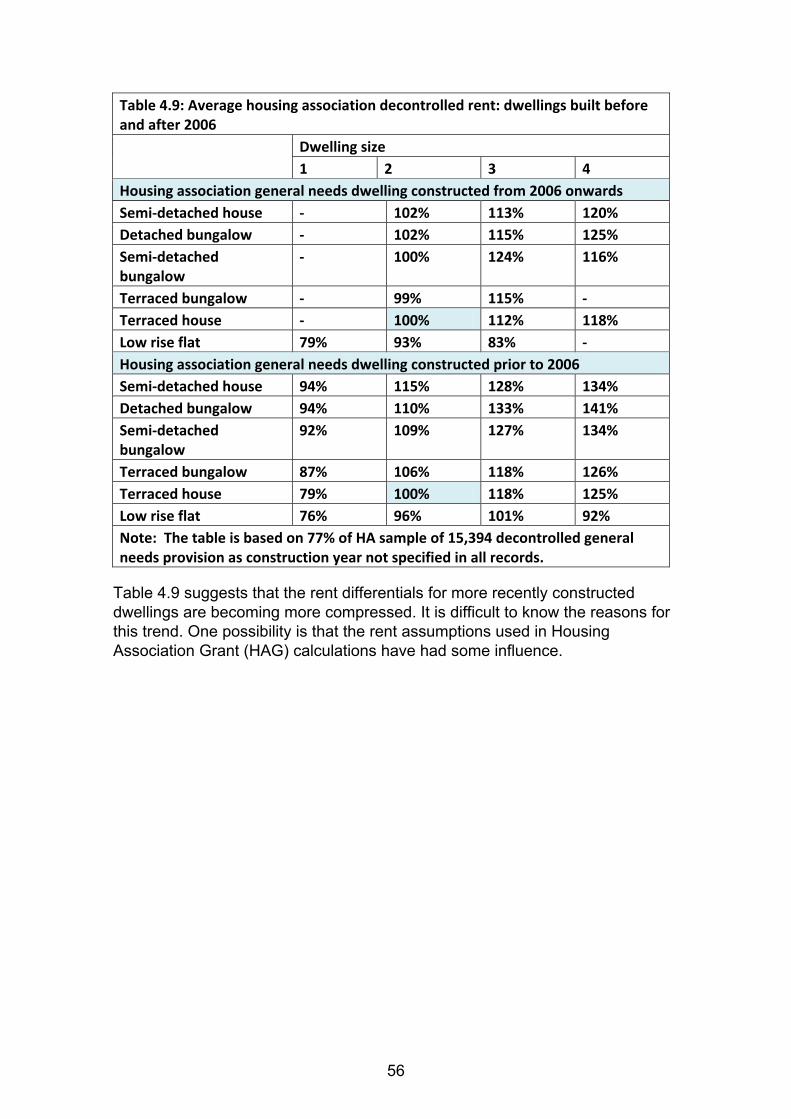
56
Table 4.9: Average housing association decontrolled rent: dwellings built before and after 2006
Dwelling size 1 2 3 4
Housing association general needs dwelling constructed from 2006 onwards Semi-detached house - 102% 113% 120% Detached bungalow - 102% 115% 125% Semi-detached bungalow
- 100% 124% 116%
Terraced bungalow - 99% 115% - Terraced house - 100% 112% 118% Low rise flat 79% 93% 83% - Housing association general needs dwelling constructed prior to 2006 Semi-detached house 94% 115% 128% 134% Detached bungalow 94% 110% 133% 141% Semi-detached bungalow
92% 109% 127% 134%
Terraced bungalow 87% 106% 118% 126% Terraced house 79% 100% 118% 125% Low rise flat 76% 96% 101% 92% Note: The table is based on 77% of HA sample of 15,394 decontrolled general needs provision as construction year not specified in all records.
Table 4.9 suggests that the rent differentials for more recently constructed dwellings are becoming more compressed. It is difficult to know the reasons for this trend. One possibility is that the rent assumptions used in Housing Association Grant (HAG) calculations have had some influence.
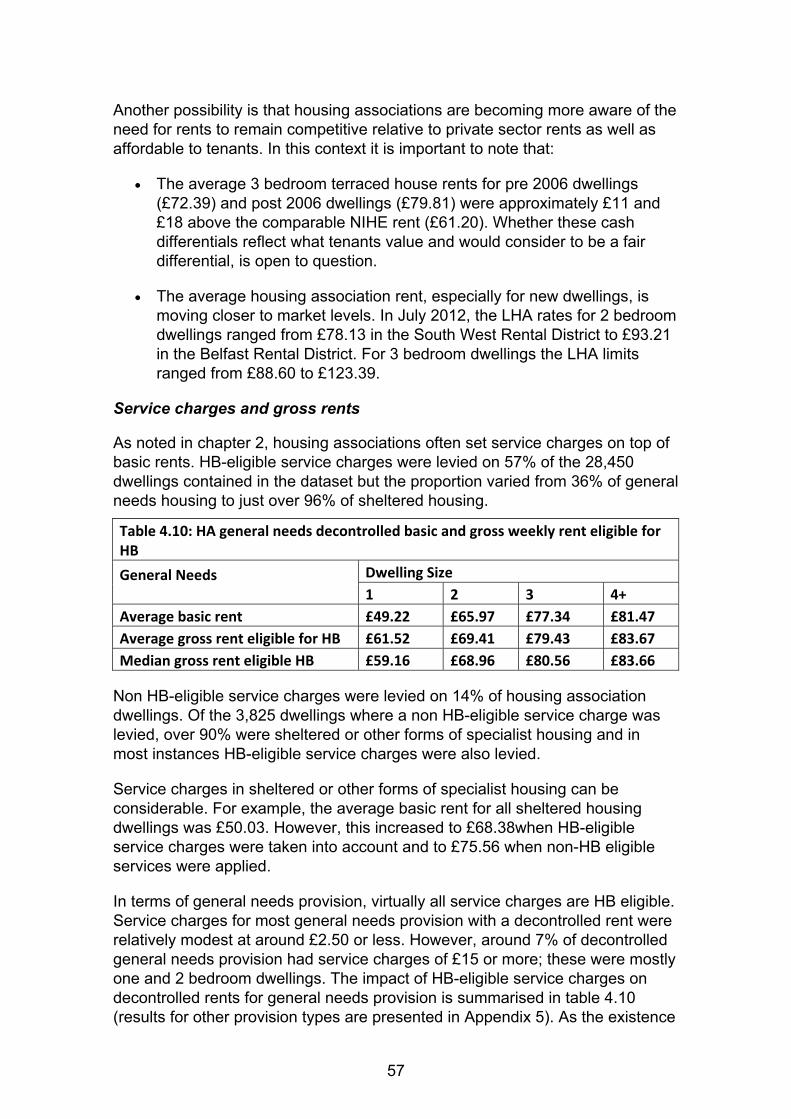
57
Another possibility is that housing associations are becoming more aware of the need for rents to remain competitive relative to private sector rents as well as affordable to tenants. In this context it is important to note that:
• The average 3 bedroom terraced house rents for pre 2006 dwellings (£72.39) and post 2006 dwellings (£79.81) were approximately £11 and £18 above the comparable NIHE rent (£61.20). Whether these cash differentials reflect what tenants value and would consider to be a fair differential, is open to question.
• The average housing association rent, especially for new dwellings, is moving closer to market levels. In July 2012, the LHA rates for 2 bedroom dwellings ranged from £78.13 in the South West Rental District to £93.21 in the Belfast Rental District. For 3 bedroom dwellings the LHA limits ranged from £88.60 to £123.39.
Service charges and gross rents
As noted in chapter 2, housing associations often set service charges on top of basic rents. HB-eligible service charges were levied on 57% of the 28,450 dwellings contained in the dataset but the proportion varied from 36% of general needs housing to just over 96% of sheltered housing.
Table 4.10: HA general needs decontrolled basic and gross weekly rent eligible for HB General Needs
Dwelling Size 1 2 3 4+
Average basic rent £49.22 £65.97 £77.34 £81.47 Average gross rent eligible for HB £61.52 £69.41 £79.43 £83.67 Median gross rent eligible HB £59.16 £68.96 £80.56 £83.66
Non HB-eligible service charges were levied on 14% of housing association dwellings. Of the 3,825 dwellings where a non HB-eligible service charge was levied, over 90% were sheltered or other forms of specialist housing and in most instances HB-eligible service charges were also levied.
Service charges in sheltered or other forms of specialist housing can be considerable. For example, the average basic rent for all sheltered housing dwellings was £50.03. However, this increased to £68.38when HB-eligible service charges were taken into account and to £75.56 when non-HB eligible services were applied.
In terms of general needs provision, virtually all service charges are HB eligible. Service charges for most general needs provision with a decontrolled rent were relatively modest at around £2.50 or less. However, around 7% of decontrolled general needs provision had service charges of £15 or more; these were mostly one and 2 bedroom dwellings. The impact of HB-eligible service charges on decontrolled rents for general needs provision is summarised in table 4.10 (results for other provision types are presented in Appendix 5). As the existence

58
of a small proportion of high service charges has an upward affect on average gross HB eligible rents, median figures are also quoted.
Other factors that shape rent levels
Table 4.11 decomposes the stock of 3 bedroom terraced houses to examine the influence of garages on basic rents. It shows that the average rents for 3 bedroom terraced houses let by NIHE were approximately £5.00 higher if the property had a garage. The relationship was less clear for housing association properties, as basic weekly rents from properties with a garage appeared to be lower than for properties without a garage. The basic rent regression for housing association stock shows this attribute to have an insignificant effect (see appendix 4).
Table 4.11: Basic weekly NIHE and NIHA rent for 3 bedroom terraced house with/without garage
NIHE Stock Housing association Stock 3 bedroom terraced house 3 bedroom terraced house
Total With garage
Without garage Total
With garage
Without garage
No units 30,566 185 30,381 2,834 68 2,766 Average £61.20 £66.94 £61.16 £76.23 £74.51 £76.27 Median £60.61 £68.38 £60.61 £77.13 £73.07 £77.13 Range £35.37 £31.08 £35.37 £57.08 £34.22 £57.08 Maximum £74.22 £73.04 £74.22 £96.64 £95.07 £96.64 Minimum £38.85 £41.96 £38.85 £39.56 £60.85 £39.56
The findings from the regression analysis, reported in Appendix 4, show that the basic rents for partially and fully furnished properties in the housing association sector were typically £4.82 less than unfurnished properties. The parameter t-test in the model suggests that this attribute has a significant influence on the basic rent. In interpreting this figure, it should be borne in mind that service charges are usually levied to cover this service.
4.5 Concluding observations
The average housing association and NIHE rent for properties of different sizes remain lower than the comparable rent in most other parts of the UK. Although house prices and private rents vary across Northern Ireland, reflecting differences in supply and demand, there is little spatial variation in social rents. This reflects that the fact that local market conditions or local amenities are not a feature of social landlord rent policies in Northern Ireland. As noted in chapter 2, this contrasts with rent policy developments in England and Wales, although the use of location in the setting of social rents remains an issue of some debate.
There were marked differences in the average housing association and NIHE rent for each of the dwelling type/size categories it was possible to identify on a

59
consistent basis across the two sectors. As social landlords set rents principally to cover their running costs, differences in average rents are in the main attributable to differences in the costs of management, maintenance and debt servicing.
It is possible that the gap between the average NIHE and housing association rent may, at least in part, be consistent with differences in the quality and condition of properties in the two sectors. This cannot be assessed from the data available but housing associations do appear to set higher rents for new build than for older housing stock. That said, whether the cash differentials between average rents in the two sectors reflect consistent or fair price-quality relationships is open to question. Likewise, it is not known whether the cash differentials between average rents for newer and older housing association dwellings of a similar dwelling size and type would be considered fair by tenants.
Looking at the average rent in 2011, relative rent differentials for different sized dwellings revealed that both NIHE and housing association rents were less compressed than the rent differentials built into the rent convergence policy for England. The relatively low weight for small dwellings and the relative high rate for larger dwellings were consistent with the rent structures applied by social landlords. The issue for policy makers is whether these differentials adversely affect the coherence and fairness of rents.
There were very substantial variations in the range of rents for properties of a similar dwelling type and size within both sectors. In the case of general needs housing, the spread of rents was most pronounced in the housing association sector. This remained the case after controlled rents were discounted.
One consequence of this very wide range of rents is that tenants living in properties of a similar dwelling type and size can pay very different rents. Within both sectors, there were instances where rents for properties at the top end of the distribution were double (or more)the level of those at the bottom end of the distribution within the same dwelling type/size category.
Another consequence is that there is much overlap between the rent distributions for different dwelling type/size categories. There were many instances where the rent for a flat was higher than the rent for a house of a similar size in both the NIHE and housing association sector.
The NIHE rent structure includes attributes other than size and type and therefore some variation in rents for reasonably similar properties is to be expected. However, the application of percentage based rent uplifts for much of the period since the rent structure was introduced in the 1980s would appear to have increased the scale of these differences in cash terms beyond what was probably intended and what tenants and others might consider reasonable.
The very large spread of rents in the housing association sector is more difficult to disentangle. That said, it is clear that at one end of the spectrum some decontrolled rents are set to be broadly in line with controlled rents whilst, at the other end of the spectrum, rents for more recently constructed dwellings are

60
influenced by the decisions individual housing associations have made about the extent to which tenants of new homes should contribute to the cost of borrowing.
The extent of the distribution of rents for properties of a similar dwelling type and size suggest that the points (values) embedded in rent structures may no longer be defensible and may not fairly reflect variations in the value tenants place on different property attributes. The complex pattern of rents must also be confusing for tenants and other stakeholders.

61
5 AFFORDABILITY OF SOCIAL RENTS IN NORTHERN IRELAND
5.1 Introduction
This chapter explores the affordability of social sector rents in Northern Ireland. It begins with a brief overview of the concept of affordability, and how this applies in the context of the current tax and welfare benefit regime in the UK. It then compares the relative affordability of social sector rents in Northern Ireland with those in England, Scotland and Wales. This is followed by a set of affordability measures for NIHE and Northern Ireland housing association rents under the prevailing tax and welfare benefit regime. It concludes with a brief discussion of the implications of the forthcoming housing and welfare benefit reforms for measures of affordability in Northern Ireland.
5.2 The concept of affordability
There is widespread agreement with the broad principle that social sector rents should be ‘affordable’ for households in low paid work, but there is less consensus about how to define affordability. There are a multiplicity of approaches in use, and different views on appropriate levels, whichever approach is used. The three principal approaches to defining rental affordability are:
• Rent to income ratios (gross rent to net income including housing benefit, and rent net of housing benefit to net income)
• Residual income measures (over Income Support, and over Income Support plus the value of free school meals)
• Work incentive measures (Housing Benefit dependency, ‘replacement ratios’, and marginal rates of tax and benefit deductions from gross earnings).
Rent to income ratios
Rent to income ratios are the most commonly used form of affordability measure, and are used in Australia, Canada and the USA, as well as in many European countries (Housing Corporation, 1989). They are also used for different purposes. In Australia they are used to set benchmarks for the allocation of subsidy. In Canada they are used to set ‘differential rents’ for tenants in the small social housing sector, whilst in Germany they are used to calculate eligibility for housing allowances.
In the UK, rent to income ratios have been widely used in debates about social sector rents since 1989 (Rugg and Wilcox, 1997) but views continue to differ about the most appropriate form and level of ratio.

62
One dimension of the UK debate has been an equitable view that social sector rents should correspond (proportionately) with the housing costs freely entered into by home buyers, but adjusted to take account of the fact that home buyers are acquiring a capital asset, as well as seeking the beneficial occupation of the home they are buying. On that basis, for example, Alan Holmans suggested that it might be reasonable to expect tenants to pay rents of some 20% of their incomes (see Beattie et al, 1998). Drawing on Family Expenditure Survey data related to all homebuyers, rather than just first time buyers, John Hills suggested that a more appropriate ratio would be ‘significantly lower than 16%’ (see Hills, 1988, and Housing Corporation, 2001).
Many other views on appropriate rent to income ratios have been expressed, but without there always being any explicit rationale for their selection. What is important to note, however, is that a rent policy based on an affordability target significantly higher than reflected in the expenditure choices of home buying households, will inevitably limit the numbers of working households that find renting from social landlords preferable to house purchase.
There have also been divergent views on the most appropriate method for measuring rent to income ratios. These methods generally involve looking at either:
• Gross rents as a percentage of net incomes before housing costs. (Net incomes comprise net earnings (after tax and National Insurance) plus, wherever applicable, Child Benefit, Working Tax Credit and Housing Benefit); or
• Rents net of Housing Benefit as a percentage of net incomes, comprising net earnings, and any child benefit or working family tax credit.
Net rent to income ratios have the merit of focusing attention on the extent of the poverty trap, and identifying the peak ratios at the income level where tenants cease to be dependent on housing benefit. However this approach can be unintentionally misleading, in that the peak ratios do not identify those tenants who literally have the greatest affordability problems, in the sense that they have the lowest disposable incomes after they have paid their rent.

63
Figure 5.1: Gross and net affordability ratios compared (couple with 2 children, rent of £70 pw)
The advantage of the ratios produced utilising the gross rent to income approach is that they meet the common sense expectation that the highest ratios are incurred by those with the lowest incomes.
Figure 5.1 illustrates how these two broad rent to income ratios operate, using the example of a couple with two children that pay a weekly rent of £70. It shows how the two ratios converge at the point where tenants’ incomes are such that they are no longer eligible for housing benefit.
In either form, rent to income ratios vary significantly between household types for given levels of earnings, as a result of the operation of the Child Benefit, Working Tax Credit and Housing Benefit schemes. Those schemes all, in different ways, reflect the greater requirements for families with children in respect of non-housing expenditures. Child Benefit and Working Tax Credit directly boost family incomes, while Housing Benefit is provided for families at higher income levels than for single people and childless couples.
The consequence of these benefit provisions is that for any given level of rents and earnings single people and couples will have higher rent to income ratios than families with children. This is illustrated, using gross rent to income ratios in the case of a £70 rent, in Figure 5.2. As can be seen, it is only at higher income levels, beyond the range of tax credit and Housing Benefit entitlement, that the ratios converge. Even then, small differences remain, reflecting the provisions for Child Benefit.

64
Figure 5.2: Gross affordability ratios for different types of households for a rent of £70 per week
It does not, however, follow that rents for bedsit and one bed dwellings should be set significantly lower than those for family size dwellings, in order to (more or less) equalize the rent to income ratios for single people and childless couples with those of families with children. This would be to ignore the purpose of in-work benefits, and the higher non-housing costs of families, which they are designed to cover.
Residual income measures
There is a strong case, in principle, for looking at ‘residual income’ measures of affordability (Freeman et al, 1997 and Ditch et al, 2001). They are routinely used, for example, in the form of the ‘after housing costs’ measures of household poverty published each year by the Department for Work and Pensions (DWP, 2003).
A number of important efforts have been made at constructing independent measures of minimum household income requirements (Bradshaw, 1993). There is not, however, any current standard UK yardstick of basic income requirements that is widely accepted, or has any official status within the UK. Moreover, any shortfalls in residual incomes that are the result of differences between an independently established income standard and the prevailing Income Support levels cannot be tackled by varying rent levels.
In that context, the Income Support scale rates provide the only practical basis for constructing residual income based measures of housing affordability. However, this is not a wholly satisfactory base, as changes in Income Support

65
policy will have a knock-on effect on affordability scores. Moreover, while Income Support continues to be up-rated in line with inflation (rather than annual earnings), these measures will set a progressively less challenging standard relative to average earnings.
For working households dependent on Housing Benefit, the levels of residual income above the Income Support thresholds are, critically, determined by the characteristics of the Housing Benefit scheme. The extent of residual incomes directly reflects the Housing Benefit ‘earnings disregards’ and 'tapers'. For working families, a further important factor is that, since November 2009, Child Benefit income is also disregarded when calculating housing and council tax benefit (where applicable) entitlements, and this reform boosted the residual incomes of working families with dependent children claiming those benefits20.
Unless upper limits on eligible rents are imposed, which only very exceptionally occurs in the social rented sector, higher rent levels result in a ‘£ for £’ increase in the level of Housing Benefit entitlement. Higher rents thus make no difference to the net incomes of those tenants who would in any event be dependent on housing benefit. In the short term, higher rents only reduce the disposable incomes of tenants with slightly higher incomes, who are ineligible for Housing Benefit, or those that are eligible for, but do not claim, Housing Benefit.
This is illustrated in Figure 5.3, which shows the case of a couple with two children. It shows that, for any rent over £50 per week, the residual income measure is the same for any family earning up to £210 per week. It is only at higher earnings levels that differences in rent levels have any impact on the residual income measure. This is because at that earnings level, the family with a rent of £50 per week ceases to qualify for Housing Benefit.
For tenants with higher rents, continuing Housing Benefit dependency limits the rise in disposable incomes and thus depresses the residual income measure. In broad terms, for every £10 increase in rent the Housing Benefit poverty trap extends some £40 further up the gross earnings scale.
Consequently, average residual income measures are of limited value, as rent differences only impact on those households at the higher end of the earnings range. The small changes in the average measure for all households reflect the far greater impact that higher rents are having on households above a given level of earnings. In that sense, residual income measures are a dampened form of measure of Housing Benefit dependency.
20 In Northern Ireland, the relevant benefit is Rates Relief.

66
Figure 5.3: Residual income measures for a range of rents for a couple with 2 children
Work incentive measures
The Housing Benefit scheme has the merit of ensuring that households are generally better off in work than if they are out of work and dependent on Income Support. The exceptions are households with high levels of travel to work and/or unassisted child care costs.
Households in receipt of Housing Benefit are, however, only slightly better off in work. This is the result of the ‘earnings disregards’ and the 65% taper features of the Housing Benefit scheme. For families with children, there are the further complications resulting from the overlap of the Housing Benefit and tax credit schemes; albeit that this been softened by the 2009 reform to disregard Child Benefit when calculating the Housing Benefit entitlement for families in low paid work.
The earnings disregards are the amounts households are permitted to earn above the level of the Housing Benefit personal allowances before they cease to qualify for the maximum level of Housing Benefit. For single people, the earnings disregard is £5 per week, and for couples the standard disregard is £10, whether or not they have any children.
The earnings disregards for lone parent households are higher, at £25, but these should be seen in the context of the much lower levels of personal allowances for lone parents, and the greater likelihood that they will need to incur child care costs in order to work.
Above the levels of the Housing Benefit personal allowances and earnings disregards, benefit entitlement is reduced by the 65% taper, and net disposable incomes grow very slowly, particularly when the tax credit tapers apply at the

67
same time. The cumulative impact of the current Housing Benefit taper rates, in conjunction with tax and other means tested benefits that reduce net disposable incomes, is shown in Table 5.1. The incidence of high marginal rates of cumulative tax and benefit deductions from gross earnings is generally referred to as ‘the poverty trap’.
Table 5.1: Tax and benefit marginal deductions from earned incomes Deductions
Households with tax credits
Other households
Deduction from each additional £1 of gross earnings Income Tax @ 20% £0.20 £0.20 National Insurance @ 11% £0.11 £0. 11 Net earnings £0.69 £0.69 Tax credits £0.41 - Net income £0.28 £0.69 Deductions from net income Housing benefit @65% £0.18 £0.45 Council tax benefit @20% £0.06 £0.14 Net disposable income £0.04 £0.10
The table shows, in particular, that where there is an overlap of the Housing Benefit and tax credit tapers for families (and other households in receipt of tax credits), this can leave them with as little as five pence disposable income from each £1 additional gross earnings. These cumulative deductions from gross earnings can still extend over a wide range of earnings, especially for households with higher rent levels, as shown in figure 5.3.
It is only when net incomes are no longer subject to the impact of benefit tapers that they begin to rise significantly above Income Support levels. The impact of these features on residual income ratios has already been seen above, and there is a similar effect on the ‘replacement ratios’, which measure Income Support entitlements as a percentage of net working incomes.
The sharpness and range of the ‘poverty trap’ inevitably raises concerns about the lack of financial incentives provided for low income households to undertake low paid work. Hence the indicators of the severity and range of the poverty trap are described as work disincentive measures.
A key measure here is the threshold income level required for a household to cease to qualify for Housing Benefit, and thus to cease to be subject to the high level of deductions from gross earnings which result from the overlap of the marginal deduction rates (or tapers) of the various components of the tax and benefit system.

68
5.3 Affordability of social sector rents in Northern Ireland
In this context, the analysis of the affordability of social sector rents in Northern Ireland in 2011/12 uses three indicators of affordability:
• Ratio of gross rents to gross earnings;
• Residual incomes above Income Support levels; and
• Gross earnings level at which Housing Benefit entitlement expires.
The analysis of affordability has been undertaken based on working households paid the minimum wage for working adults. The April 2011 level was £5.93 per hour. Lone parent households are assumed to work for 30 hours a week, and thus to have gross weekly earnings of £177.90, while in all other cases the households are assumed to work for 40 hours a week, and thus have gross weekly earnings of £237.20.
This income level is taken to be broadly representative of the earnings levels of households in the social rented sector. For the total working population in Northern Ireland, the lowest decile level of gross hourly earnings in 2011 was £6.00 an hour; just £0.07 per hour above the level of the minimum wage. The lowest quintile level of gross hourly earnings in 2011 was £6.83 an hour;£0.90 per hour above the level of the minimum wage.
The affordability analysis also examines two alternative rent levels; (mean) average rents for each size of dwelling, and the 90th percentile rent levels. The 90th percentile rents are used as a representative measure of the highest rents in the sectors, while excluding possible outliers at the extremities of the rent distribution. The NIHE rents are those reported in table 4.3 whilst the housing association rents are based on the average basic decontrolled rents for general needs provision reported in appendix 3 (see table A 3.1).
In all cases the affordability calculations have been undertaken based on the tax and benefit system as it operated in 2011/12. In addition, the affordability analysis is based on ‘archetypes’ of households resident in each size of dwelling. These are as follows:
• 1 bedroom: Couple (without children)
• 2 bedroom: Lone parent plus one child
• 3 bedroom: Couple plus two children
• 4 bedroom: Couple plus four children
• 5 bedroom: Couple plus five children

69
Key Findings
The results of the affordability analyses are set out in Table 5.2 for NIHE rents and in Table 5.3 for housing association rents. Collectively the tables show that:
• Rent to income ratios were generally quite modest. Only in the case of the 90th percentile housing association rents did the ratios exceed 20%; and then only in respect of one and two bedroom dwellings.
• Residual incomes were clearly higher in those cases where the rents did not result in Housing Benefit eligibility, but in all cases there was a residual income in excess of £65 per week over Income Support levels (without making any allowance for the value of free school meals or other passported benefits). Households would, however, also have to meet any travel or other work related costs from that income, so the extent to which they would be better off in work would tend to be rather less than stated, depending on the extent of their work related costs, and the value of passported benefits.
• Lone parent households tend to have higher levels of residual incomes. This is largely because of the structure of the tax credit and benefit systems. Income Support and Housing Benefit allowances for lone parents are essentially based on the rates for a single adult, while tax credit allowances for lone parents are essentially the same as those for couples. That said, the higher figures for the residual incomes for lone parents in low paid work do not take account of any child care costs, travel and other work related costs.
Table 5.2: Affordability of NIHE rents in Northern Ireland Rent 1 Bed 2 Bed 3 Bed 4 Bed 5 Bed Mean £43.18 £51.16 £60.76 £65.55 £67.87 90th Percentile £49.73 £57.50 £68.38 £73.04 £73.04
Affordability Couple Lone parent &1 child
Couple & 2 children
Couple & 4 children
Couple & 5 children
Mean Rent Rent to income ratio (%) 17.3 16.3 14.8 11.6 10.6
Residual Income £83.80 £97.49 £72.84 £95.56 £107.54 Housing Benefit? No No £6.44 £31.05 £38.54 90th Percentile Rent Rent to income ratio (%) 19.9 18.3 16.3 12.8 11.3
Residual Income £77.25 £91.15 £72.84 £95.56 £107.54 Housing Benefit? No No £14.06 £38.54 £44.71

70
The analysis of NIHE rents also shows that:
• With earnings based on the minimum wage, neither childless couples nor lone parents would need to rely on Housing Benefit, whether for the average or higher 90th percentile rents.
• In all cases couples with children at those earnings levels would be eligible for Housing Benefit. However couples with two children (in three bedroom accommodation) would only need to have a moderately higher level of earnings in order to escape from Housing Benefit dependency (£36.85 per week in the case of the mean rent, and £76.52 per week in the case of the 90th percentile rent).
The extent of Housing Benefit dependency was somewhat greater in respect of the housing association rents such that:
• Lone parents would be eligible for Housing Benefit in the case of the 90th percentile rent levels.
• For couples with children the levels of earnings required to move beyond Housing Benefit eligibility were far higher. For couples with two children the additional earnings required (above the minimum wage) would have been £111.81 per week in the case of the mean rent, and £178.73 per week in the case of the 90th percentile rent.
Table 5.3: Affordability of housing association rents in Northern Ireland Rent 1 Bed 2 Bed 3 Bed 4 Bed 5 Bed Mean £49.22 £65.97 £77.34 £81.31 £81.50 90th Percentile £59.61 £76.94 £88.62 £91.38 £87.84
Affordability Couple Lone parent &1 child
Couple & 2 children
Couple & 4 children
Couple & 5 children
Mean Rent Rent to income ratio (%) 19.7 21.1 18.1 14.0 12.5
Residual Income £77.76 £82.68 £72.84 £95.56 £107.54 Housing Benefit? No No £23.02 £46.81 £53.17 90th Percentile Rent Rent to income ratio (%) 23.8 23.8 20.2 15.5 13.3
Residual Income £67.37 £81.21 £72.84 £95.56 £107.54 Housing Benefit? No £9.50 £34.30 £56.88 £59.51

71
5.4 Affordability across the UK
This section provides a comparison of the affordability of social sector rents across the UK.
A broad comparison of the relative affordability of social sector rents in England, Scotland, Wales and Northern Ireland can be found in the annual UK Housing Review (Pawson and Wilcox, 2011).This shows overall average rents in the council and housing association sectors as a percentage of average full time earnings in each country. While most social sector tenants in employment have below average earnings, this measure is nonetheless a consistent benchmark in terms of the relative affordability of rents in each country.
Figure 5.4: NIHE and council rents as a percentage of national average earnings
Source: Pawson and Wilcox (2012) UK Housing Review
The rent to income ratios for NIHE, and council housing in England, Scotland and Wales, are shown in Figure 5.4, for the decade to 2010. As can be seen, NIHE rents on this basis are more affordable than council rents in England and Wales, but rather less so than council rents in Scotland.
Figure 5.5 shows the equivalent analysis for housing association rents in the four countries, and appears to show that housing association rents in Northern Ireland are now considerably less affordable than housing association rents in the rest of the UK.
However this is misleading, as the housing association rents for Northern Ireland are inclusive of rates and service charges, neither of which are included in the figures for the other UK regions. They are, however, the only time series

72
of housing association rents in Northern Ireland that are routinely published in the DSD’s Northern Ireland Housing Statistics.
Figure 5.5 Housing association rents as a percentage of national average earnings
Source: Pawson and Wilcox (2012) UK Housing Review
This research project has, however, collected data on ‘basic’ housing association rents for 2011/12. These figures show that the overall average housing association rent was £61.71 per week, compared to an average of £55.09 for NIHE rents. In contrast, the 2010/11 published figure for housing association rents, inclusive of rates and service charges was much higher at £81.69 per week.
Moreover, if the basic housing association rent figure for 2011/12 is expressed as a percentage of average earnings in 2011, it comes out as 11.6%. This is just a little below the 2010 figures for England and Wales, but still a little higher than the figure for Scotland.
5.5 Welfare Reforms
The affordability analysis presented above is based on the tax and benefit system as it operated in 2011/12. However, as discussed in chapter 2, the UK Government's major package of reforms to the structure of welfare benefits will see the introduction of an integrated ‘Universal Credit’ (UC) scheme to replace a whole range of separate tax credit and welfare benefit policies that currently operate for working age households.
Those reforms are wide ranging, and have many implications beyond the scope of this report. They will, however, also impact on the affordability of social sector rents for households in low paid work.

73
At the point of change, which is currently set to be April 2014 for new claimants living in Northern Ireland, most new claimants will fare better under Universal Credit compared with households still operating under the old regime in 2014.
The in-work incomes of larger families in low paid work may, however, receive less benefit support than under the current system. There will be no direct ‘losers’ at the point of change as there are transitional protection provisions for existing claimants as they are gradually transferred on to UC on a phased basis from 2014.
However the numbers that receive transitional protection, and the comparison of the old and new systems’ support for new claimants, have both been impacted by the post-2010 reductions in the value of in work benefit under the current system. In particular:
• The taper rate for tax credits was increased from 39% to 41%, and this is already reflected in the 2011 benefits system used for the affordability analyses in this chapter.
• Working tax credit allowances have been frozen in cash terms, and this will continue into 2013.
• More recently, the hours that couples need to work to qualify for Working Tax Credit have been increased from 16 to 24 hours per week, leaving couples working between 16 and 24 hours a week in “limbo” between tax credits and out of work household benefits.
Universal Credit
As outlined in chapter 2, the central feature of the proposed Universal Credit (UC) scheme is that it is a single integrated scheme, replacing a multiplicity of in-work benefits. In particular it has a single taper, provisionally set at 65% of net earnings, and there will be no overlap between the tax credit and Housing Benefit tapers as under the current system (see table 5.1).
As rate rebates have been left outside of the UC scheme, there will still be one overlapping taper. However, the worst case scenario for working households (in receipt of UC and CTB) is that they will keep £0.19 out of every additional £1 of gross earnings, compared to just £0.04 at present. Similar concerns apply in Northern Ireland regarding Rates Relief.
The gains for working households from the lower taper rate are progressively greater as their earnings increase (while they still remain eligible for UC). For some tenant households there is also likely to be an increase in the level of earnings they are permitted before their UC benefits begin to be reduced by the income taper. However the ‘earnings disregard’ under the UC scheme will replace not just the earnings disregards that currently apply for Housing Benefit, but also the disregard of Child Benefit that has been part of the Housing Benefit scheme since 2009.
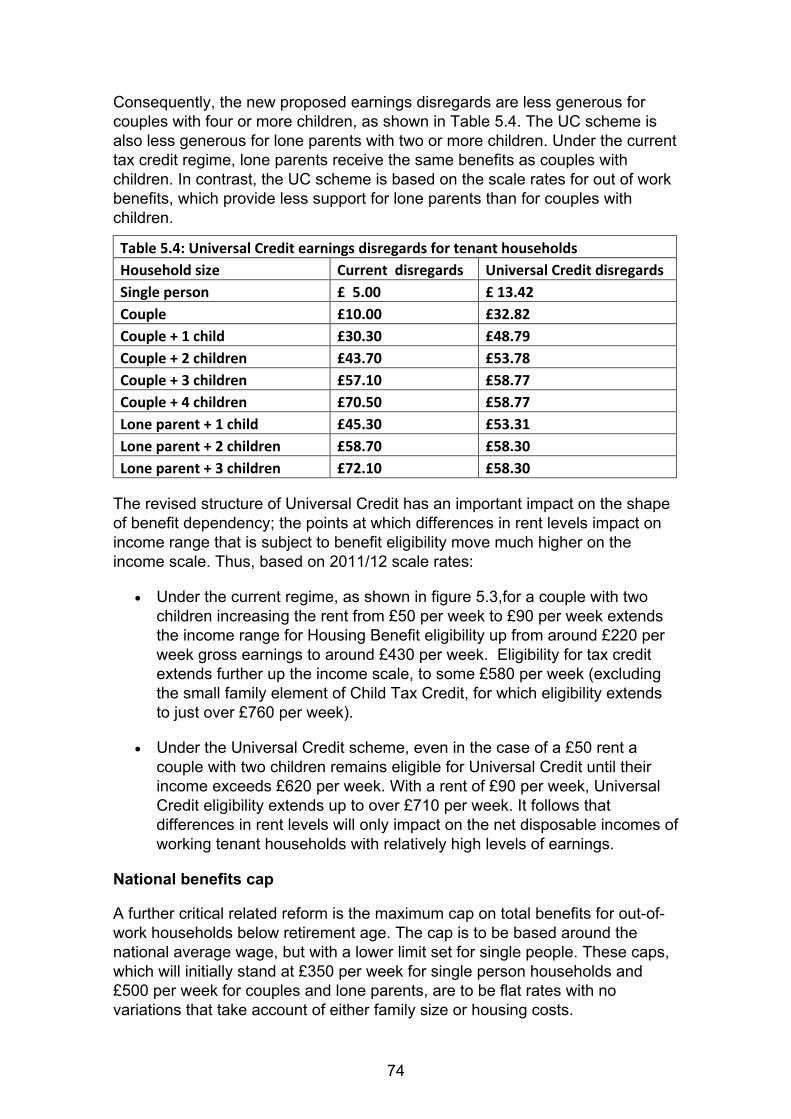
74
Consequently, the new proposed earnings disregards are less generous for couples with four or more children, as shown in Table 5.4. The UC scheme is also less generous for lone parents with two or more children. Under the current tax credit regime, lone parents receive the same benefits as couples with children. In contrast, the UC scheme is based on the scale rates for out of work benefits, which provide less support for lone parents than for couples with children.
Table 5.4: Universal Credit earnings disregards for tenant households Household size Current disregards Universal Credit disregards Single person £ 5.00 £ 13.42 Couple £10.00 £32.82 Couple + 1 child £30.30 £48.79 Couple + 2 children £43.70 £53.78 Couple + 3 children £57.10 £58.77 Couple + 4 children £70.50 £58.77 Lone parent + 1 child £45.30 £53.31 Lone parent + 2 children £58.70 £58.30 Lone parent + 3 children £72.10 £58.30
The revised structure of Universal Credit has an important impact on the shape of benefit dependency; the points at which differences in rent levels impact on income range that is subject to benefit eligibility move much higher on the income scale. Thus, based on 2011/12 scale rates:
• Under the current regime, as shown in figure 5.3,for a couple with two children increasing the rent from £50 per week to £90 per week extends the income range for Housing Benefit eligibility up from around £220 per week gross earnings to around £430 per week. Eligibility for tax credit extends further up the income scale, to some £580 per week (excluding the small family element of Child Tax Credit, for which eligibility extends to just over £760 per week).
• Under the Universal Credit scheme, even in the case of a £50 rent a couple with two children remains eligible for Universal Credit until their income exceeds £620 per week. With a rent of £90 per week, Universal Credit eligibility extends up to over £710 per week. It follows that differences in rent levels will only impact on the net disposable incomes of working tenant households with relatively high levels of earnings.
National benefits cap
A further critical related reform is the maximum cap on total benefits for out-of-work households below retirement age. The cap is to be based around the national average wage, but with a lower limit set for single people. These caps, which will initially stand at £350 per week for single person households and £500 per week for couples and lone parents, are to be flat rates with no variations that take account of either family size or housing costs.

75
The cap will be particularly hard-hitting for larger families in areas of high housing costs, because it will severely constrain the maximum amount of Housing Benefit such households can access, limiting their ability to meet ‘affordable’ or even social rents in some cases. For very large families the impact will also be felt in areas with relatively low rents.
An indication of the level of funding available for housing costs under the caps, without requiring households to reduce their expenditures on essential living costs below the levels provided for in basic benefit allowances, can be seen in Figure 5.6.
Figure 5.6: Impact of maximum cap
Impact of Maximum Benefit Cap
0
100
200
300
400
500
600
Single Couple Couple + 1 Couple + 2 Couple + 3 Couple + 4
£ pe
r wee
k
Basic Credits Maximum Housing Credits
£279
£389 £306 £241 £176 £111
Source: UK Housing Review 2012 Briefing Paper
5.6 Northern Ireland rents under the Universal Credit regime
The affordability of social sector rents in Northern Ireland has also been assessed in terms of how they are likely to fare under the Universal Credit regime. For comparability, this analysis is based on the personal allowances for out of work benefits in 2011/12, and indicative figures so far provided in respect of the earnings disregards and tapers of the scheme.
On that basis the affordability assessments shown in tables 5.2 and 5.3 above have been replicated under the Universal Credit regime, and the results are shown in tables 5.5 for NIHE tenants and 5.6 for housing association tenants.
One key difference is that all households working at the minimum wage are eligible for Universal Credit, including an element for the rent. Only in the case of couples without children is the amount of Universal Credit awarded below the level of the eligible rent. This would also be true for single adults.

76
As a general rule, couples with children, and a minimum wage income, would have a lower rent to income ratio, and a higher level of residual income (relative to the level of out of work benefit entitlement).
In the case of the NIHE rents, couples without children and lone parents with one child fare rather less well under Universal Credit, and have higher rent to income ratios and lower levels of residual income. The differences in the case of the 90th percentile NIHE rents are, however, very limited.
In the case of housing association rents, which are higher than the NIHE rents, only childless couples with an average rent fare worse under the Universal Credit regime, but again the differences are quite limited. In other words, the introduction of Universal Credit will, in broad terms, tend to improve the affordability of social sector rents for working age households with one adult in low paid employment. However, there is some unevenness, and this outcome will not apply in all cases.
Table 5.5: Affordability of NIHE rents in Northern Ireland Rent 1 Bed 2 Bed 3 Bed 4 Bed 5 Bed Mean £43.18 £51.16 £60.76 £65.55 £67.87 90th Percentile £49.73 £57.50 £68.38 £73.04 £73.04
Affordability Couple Lone parent &1 child
Couple & 2 children
Couple & 4 children
Couple & 5 children
Mean Rent Rent to income ratio (%) 17.8 16.8 13.7 11.2 10.3 Residual Income £75.68 £89.14 £104.28 £119.74 £126.17 Universal Credit £32.96 £111.48 £186.86 £302.04 £358.08 90th Percentile Rent Rent to income ratio (%) 20.0 18.5 15.2 12.3 11.0
Residual Income £75.68 £89.14 £104.28 £119.74 £126.17 Universal Credit £39.51 £117.92 £194.48 £309.63 £363.25

77
Table 5.6: Affordability of housing association rents in Northern Ireland Rent 1 Bed 2 Bed 3 Bed 4 Bed 5 Bed Mean £49.22 £65.97 £77.34 £81.31 £81.50 90th Percentile £59.61 £76.94 £88.62 £91.38 £87.84
Affordability Couple Lone parent &1 child
Couple & 2 children
Couple & 4 children
Couple & 5 children
Mean Rent Rent to income ratio (%) 19.8 20.6 16.9 13.5 12.1
Residual Income £75.68 £89.14 £104.28 £119.74 £126.17 Universal Credit £39.00 £126.29 £203.44 £317.90 £371.71 90th Percentile Rent Rent to income ratio (%) 23.1 23.3 18.8 14.9 13
Residual Income £75.68 £89.14 £104.28 £119.74 £126.17 Universal Credit £49.39 £137.26 £214.72 £327.97 £378.05
5.7 Concluding observations
The measurement of housing affordability in respect of social sector rents involves examining the interaction of housing costs and incomes. Although there is an extensive literature on housing affordability and how to measure it, there remains little agreement and no official definition about the appropriate relationship between housing costs and income and the residual income that households require to meet other costs.
To move beyond what is sometimes a sterile debate, three alternative measures of affordability were employed to examine housing affordability for tenants with one adult in low paid employment. It shows that the use of different but overlapping measures of affordability offer useful insights and help to ensure that normative judgements are based on a more rounded perspective than those that rely on any single measure.
The analysis confirms that there is no single tipping point at which a rent level becomes unaffordable. This is in large part because the current Housing Benefit system provides a safety net for low earning households and the only real change happens when the tenant’s earnings rise above the Housing Benefit threshold. In short, there is no obvious point to draw the line between the affordable and the not affordable.
That said, housing association rents at the top end of the rent distribution for different dwelling type/size categories do appear to create affordability pressures and poverty traps for tenants in full time employment at the lower end of the earning distribution. In the case of the 90th percentile housing association

78
rent, for example, a couple with two children and one adult earning the minimum gross weekly wage of £237.20 would need to increase earnings by 75% (an additional £178.73) to rise above the housing benefit threshold.
Under Universal Credit, there will also be no single tipping point other than the benefit cap for working age households where no-one is in work. The cap will increase the risk that larger families in social rented properties with gross rents (basic rent and eligible service charges) of £111 or more will have to reduce their expenditure on other essential living costs.
As a general rule, however, couples with children, with someone in low pay will tend to fare better under Universal Credit and have a lower rent to income ratio and a higher level residual income (relative to the level of out of work benefit entitlement). In contrast, single people, couples, and lone parents will tend to do somewhat less well.
However, irrespective of welfare reform, it remains the case that any policy to harmonise rents would also need to take account of the affordability of accessing other tenures. Setting any affordability target for social rents at levels equivalent to or significantly higher than that reflected in the expenditure choices of households buying their own home would inevitably limit the numbers of working households that find renting from social landlords preferable to house purchase. A similar argument may also be made in respect of private renting.

79
6 POTENTIAL FOR RENT HARMONISATION
6.1 Introduction
This chapter summarises the rationale for seeking greater conformity of social rents in Northern Ireland and the potential options for developing a rent structure to secure greater harmonisation. It then sets out a model to illustrate a rent structure for achieving the greater harmonisation of NIHE and housing association rents and the implications of different convergence scenarios.
6.2 Rationale for greater rent harmonisation
A variety of factors cast doubt on the sustainability of current rent setting arrangements and suggest a need for greater harmonisation of rents in the social rented sector. These have been referred to earlier in the report but it is useful to briefly recap the five main reasons.
1. The present structure and distribution of rents is extremely confusing and cannot be described as fair, equitable or transparent. There are wide disparities in the rents charged in the two sectors. There are also sharp discrepancies and inconsistencies within each sector. The net effect of this is that tenants who live in properties of a similar dwelling type and size often pay very different rents. It also means that some social tenants face severe poverty traps.
2. Evidence suggests that the NIHE administrative rent structure, which has not been revised since it was introduced in 1984 (and the modified versions of this policy applied by individual housing associations), no longer fairly reflects variations in the stock of social housing that is now available or the value tenants place on different attributes.
3. It is unlikely that the current pattern of rents would support any policy moves to offer more choice to tenants in the allocation of social housing or to enable tenants to have a greater say on the quality and cost of services that they pay for.
4. Any policy moves to ensure and maintain the affordability of social rents would potentially be more straightforward with a single rent harmonisation policy framework.
5. The programme of welfare reforms, the change to the calculation of LHA rates for private sector rents and the planned structural reform of the NIHE provide a timely opportunity to work towards the adoption of a more consistent approach to the setting of basic rents and service charges and to harmonise rents across the social sector.
80
6.3 Potential rent structure alternatives
Alternative rent structure mechanisms for setting social sector rents and thus for achieving greater rent harmonisation were discussed in the previous study (Gibb et al 2007).
One possible rent structure would be a market based system. This would involve distributing the total annual required rental income across the stock on the basis of the relative capital value of each dwelling, possibly in combination with other variables such as incomes, earnings or dwelling attributes. In theory, market values should be a straightforward means of taking account of location and other aspects of a dwelling that tenants value. However, unless underlying price movements for social housing can be established, disequilibrium conditions can be embedded into rent levels and rent distributions may fail to reflect tenant values or preferences. A further practical problem is that collecting and updating the required data can be very costly and, in the case of Northern Ireland, estimates are not available.21
A second possible rent structure is a cost based rent system. It would involve setting rents in relation to the costs of providing housing services (which, from an economist’s perspective, would include space standards, quality standards and housing management services) plus the costs of replacing (and/or upgrading) dwellings. Such a system could potentially offer tenants more choice over the level of housing services they consume and thus pay for. This potential advantage is, however, severely constrained by the fact that most tenants are in receipt of Housing Benefit and would see no financial benefit from any decision to consume less in terms of housing services (or vice versa). Moreover, such rental systems do not sit comfortably with the main objective of social housing, which is to ensure tenants consume a minimum standard of housing services in terms of space and quality. The development of any such system would also incur very high start up costs due to the need for comprehensive cost service level data at different spatial scales.
Following discussions with stakeholders in 2007, the use of both market based and cost based systems was ruled out due to the downside risks outlined above and the reluctance expressed by many to break with administrative systems. As this remains the case, the exemplar rent harmonisation model has been framed around the use of administrative rent setting arrangements.
Allowing for data limitations
A related consideration has been the need to ensure proposed arrangements are parsimonious and rely on data accessible to social landlords. An ongoing
21 The method employed in the Valuation and Lands Agency (subsequently Land & Property Services) revaluation exercise for setting domestic rates for social housing precluded its use as a basis for estimating the capital values of social housing.

81
challenge is the limited range of variables that are consistently recorded by social landlords. NIHE holds data about the characteristics and general condition of its stock at unit level but there is still much variation in the unit level data that housing associations can access.
Social landlords generally hold unit level data on dwelling type, provision type and dwelling size, as measured by the number of bedrooms within each unit. However, housing associations tend to find it difficult to provide unit level data in relation to quality variables (e.g. dwelling age, refurbishment date, and absence of amenities) or service variables (e.g. garages, gardens, dining space, and extra WC). Social landlords, including NIHE, also tend to record few, if any, location variables on their ICT systems, no doubt reflecting the absence of location factors in current rent setting frameworks.
It has therefore been assumed that social landlords would retain reasonable discretion to vary rent levels in order to avoid the need for any future policy to require social landlords to embark on potentially costly and time consuming data collection. That said, an important distinction between rent harmonisation and rent convergence is that the former is intended to allow social landlords flexibility to vary rent levels to reflect local circumstances.
As discussed in chapter 2, it is extremely difficult to devise a single set of rent harmonisation arrangements that extend across general needs, sheltered housing and other forms of specialist provision. For instance, registered care homes, temporary accommodation, student accommodation, fair rents and key worker accommodation are amongst the list of housing association tenancies that have been exempted from rent convergence in England.
One of the main reasons for this is that it is difficult to identify appropriate arrangements for non general needs housing without sufficient evidence to investigate and clarify what service charges are being levied, the nature and costs associated with different services and how these shape service charges.
The illustrative rent harmonisation model has, therefore, focused on general needs housing, and, in the case of housing association stock, decontrolled rents. Nonetheless, any policy to achieve greater harmonisation of rents would need to address the issue of service charges. This issue is considered in more detail in section 7.3 (Conclusions).
6.4 Overview of the illustrative rent harmonisation model
Outline of the proposed rent harmonisation rent structure
The central feature of the illustrative model is a set of reference rents for a number of dwelling type and size categories, which are shown in table 6.1. The indicative reference rents would provide a platform to simultaneously:
• Achieve greater consistency of social rents through the upward adjustment of NIHE rents and the dampening of future rent increases for housing association dwellings at the upper end of the rent distribution;

82
• Allow individual landlords, in consultation with their tenants, to determine rents to take account of quality and other factors that tenants value – subject to rents remaining within reasonable 'striking' distance of the reference rents; and
• Ensure social rents remain below market levels and remain affordable for tenants through the annual reference rent review and uplift process.
For each property covered by the rent harmonisation policy, social landlords would be asked to bring the basic rent to within 10% of the reference rent within a specified period of time. This would be subject to negotiation but a 10-11 year time frame has been adopted for the central scenario.
Table 6.1 illustrates the upper and lower rent limit of the 10% band either side of each indicative reference rent. These rent ranges are far more compressed than currently exist22 but remain quite wide, ranging from £10.20 for 1 bedroom flats to over £16 for 5+ bedroom dwellings.
This range of rents is intended to reduce the existing very substantial and unjustifiable rent ranges for properties of a similar dwelling type and size, whilst allowing individual social landlords sufficient room to exercise discretion in the setting of rents to reflect local circumstances.
As long as rents fall within the 10% band either side of the reference rent, social landlords, in consultation with tenants, would have the freedom to:
• Modify rents to reflect local variations in house prices, private rents (and LHA rates) and the relative popularity of different estates.
• Apply a discount for less popular attributes (e.g. communal entrances, single bedrooms etc)
• Apply a premium for new housing and other attributes that tenants value or that would reduce non-housing costs (e.g. an improved heating system).
It is important to note that the transition timescale and the freedom of social landlords to set rents within a reasonably wide rent range are also intended to allow housing associations sufficient time and flexibility to take appropriate action to minimise potential risks to their financial viability.
22 For example, the difference between the minimum and maximum basic weekly rent for a 2 bedroom flat under the current rent structure is in excess of £40 in both sectors (see chapter 4) whereas under the proposed rent structure the rent range would fall to £12.20.

83
Table 6.1: Reference rents for the simulation exercise central scenario, 2011-12 prices Dwelling Type 1 2 3 4 5+ Reference rent: basic rent excluding service charge at 2011-12 prices House or bungalow (semi- or detached) £58.00 £68.00 £74.00 £80.00 £83.00
Terraced House or Bungalow £55.00 £65.00 £72.00 £78.00 £82.00 Flat £51.00 £61.00 £70.00 £76.00 £81.00
HA upper and lower rent range limit for benchmark rent 10% above reference rent House or bungalow (semi- or detached) £63.80 £74.80 £82.50 £88.00 £93.50
Terraced House or Bungalow £60.50 £71.50 £79.20 £85.80 £91.30 Flat £57.20 £68.20 £77.00 £83.60 £89.10 10% below reference rent House or bungalow ((semi- or detached) £52.20 £61.20 £67.50 £72.00 £76.50
Terraced House or Bungalow £49.50 £58.50 £64.80 £70.20 £74.70 Flat £46.80 £55.80 £63.00 £68.40 £72.90 Permissible rent range House or bungalow (semi- or detached) £11.60 £13.60 £14.80 £16.00 £16.60
Terraced House or Bungalow £11.00 £13.00 £14.40 £15.60 £16.40 Flat £10.20 £12.20 £14.00 £15.20 £16.20 HA illustrative rents differential: based on 3 bed terraced dwelling Dwelling Type 1 2 3 4 5+ House or bungalow (semi- or detached) 89% 105% 114% 123% 128%
Terraced House or Bungalow 85% 100% 111% 120% 126% Flat 78% 94% 108% 117% 125%
The proposed reference rents
The indicative reference rents used for the model were set after reflecting on several matters.
One measure of the coherence of rents is to look at rent differentials and the relative value of dwellings. As discussed in chapter 4, rent differentials for different sized dwellings in the NIHE and housing association sectors are wider than those generally found in the social rented sector elsewhere in the UK. Social rent differentials are also wide relative to those for LHA rents for Northern Ireland’s private rented sector (see table 6.2), which is very unusual.
To improve the coherence of the harmonised rent structure, rent differentials for reference rents were brought into somewhat closer alignment with those set out

84
in English policy guidelines. The resulting rent differentials for the reference rents are summarised in table 6.1.
Table 6.2: Reference rent and comparator of possible benchmarks LHA rate from April 2013
Broad Rental Market Area 1 Bedroom
2 Bedroom
3 Bedroom
4 Bedroom
Belfast £85.04 £93.27 £104.63 £125.24 Lough Neagh Upper £68.79 £86.10 £94.23 £110.01 Lough Neagh Lower £62.94 £77.47 £91.10 £100.88 North £68.33 £82.86 £88.16 £95.65 North West £74.34 £90.99 £97.96 £107.47 South £64.87 £78.55 £88.82 £102.40 South East £73.01 £93.13 £103.06 £124.87 South West £63.52 £79.85 £88.15 £97.55 Simple Northern Ireland average £70.11 £85.28 £94.51 £108.01 Rent differential 82.2% 100.0% 110.8% 126.6% 80% of LHA rate
Broad Rental Market Area 1 Bedroom
2 Bedroom
3 Bedroom
4 Bedroom
Belfast £68.03 £74.62 £83.70 £100.19 Lough Neagh Upper £55.03 £68.88 £75.38 £88.01 Lough Neagh Lower £50.35 £61.98 £72.88 £80.70 North £54.66 £66.29 £70.53 £76.52 North West £59.47 £72.79 £78.37 £85.98 South £51.90 £62.84 £71.06 £81.92 South East £58.41 £74.50 £82.45 £99.90 South West £50.82 £63.88 £70.52 £78.04 Simple Northern Ireland average £56.08 £68.22 £75.61 £86.41 Reference rent: basic rent excluding service charge at 2011-12 prices Reference rent for a detached dwelling £58.00 £68.00 £74.00 £80.00
10% upper limit for a detached dwelling £63.80 £74.80 £82.50 £88.00
NI housing association rents, 2011-12 Mean rent for all dwelling types £49.22 £65.97 £77.34 £81.31 90th percentile for all dwelling types £59.61 £76.94 £88.62 £96.67
Maximum rent for all dwelling types £82.17 £96.11 £96.64 £91.38
Notes: The LHA rates for April 2013 were selected because these are the critical figures and because they are, in many instances, lower than the LHA rates for 2012. The Northern Ireland average is simply the average for all Broad Rental Market Areas for each dwelling size and has not been weighted to reflect the population distribution.

85
In setting those rent differentials, smaller one and two bedroom flats were slightly more heavily discounted to allow for the fact that tenants living in 'general needs' flats are much more likely than those living in houses to pay for service charges. Likewise, the value of additional bedrooms for larger dwellings was compressed with a view to ensuring rents for the largest properties remain affordable.
After April 2013, LHA rates will be up-rated by the CPI measure of inflation. If social rents were to continue to rise at RPI rates or higher,23 a growing proportion of housing association rents would exceed LHA rates under the current rent-setting regime. In light of this, it was felt that the indicative reference rents should generally not exceed 80% of the average April 2013 LHA rate.
Table 6.2 summarises the April 2013 LHA rate, the discounted LHA value and the indicative reference rent for a detached dwelling, which is the highest reference rent for each dwelling size. It illustrates that reference rents generally do not exceed the discounted LHA rate. The exception is one-bedroom detached houses. It was decided not to further adjust this reference rent downwards in light of the fact that there are only around 60 such properties and any such move would limit the wider goal of bringing rent differentials for Northern Ireland into closer alignment with those underpinning rent convergence polices England and Wales.
The remaining reference rents were then set with reference to the distribution of basic rents in the decontrolled segment of the housing association sector.
Finally, the affordability of the indicative reference rents was assessed in terms of the indicative Universal Credit regime at 2011/12 scale rates. The results are set out in Table 6.3. It suggests that, in the main, there would be no substantive change relative to the residual income outlined in table 5.6 in respect of mean housing association rents. However, as expected, there was some upward shift in rent to income ratios for working age couples living in one bedroom properties.
Table 6.3: Affordability of housing association rents in Northern Ireland Rent 1 Bed 2 Bed 3 Bed 4 Bed 5 Bed Mean £58.00 £68.00 £75.00 £80.00 £85.00
Affordability Couple Lone parent &1 child
Couple & 2 children
Couple & 4 children
Couple & 5 children
Mean Rent Rent to income ratio (%) 22.6 21.1 16.4 13.3 12.6 Residual Income £75.68 £89.14 £104.28 £119.74 £126.17 Universal Credit 47.78 128.32 £191.10 £316.59 £375.21
23 Between 1989 and 2011, RPI inflation, on average, was 0.7 percentage points higher than the CPI inflation.

86
Inflation and transition assumptions
The comparison of housing association rents with the April 2013 LHA rates and the findings from the affordability analysis suggest that the indicative reference rents are broadly at the upper acceptable level. In light of this, the central scenario assumed that rent reference increases would increase each year by the underlying rate of RPI inflation. Over the past decade this has been 3%.
For transition purposes it was assumed that in any given year:
• A rent that was within 10% of the reference rent in the previous year would increase by 3%.
• A rent that was more than 10% below the reference rent in the previous year would increase by 3% plus a maximum of £2 per week transition payment.
• A rent that was more than 10% above the reference rent in the previous year would increase by 3% minus a maximum of £2 per week transition deduction.
The transition premiums are the cash value adopted in England in 2002 and were designed to protect tenants from large annual rent rises and to restrict social landlord exposure from a sharp fall in rental income in any given year.
When a property has been allocated to a new tenant, some social landlords that have pursued rent restructuring have moved the rent immediately to the 'target' rent level to speed up the movement of rents towards restructured levels. However, no such assumption has been built into the simulation model. Likewise, no allowance has been made for social landlords to introduce the reference rent on completion of modernisation works. This is because such moves tend to create further anomalies and inconsistencies between rents charged.
6.5 Central scenario: main findings
Overall harmonisation adjustment impact
From the data provided by housing associations, 15,388 general needs dwellings with a decontrolled rent were included in the Excel-based model. The model therefore includes housing stock owned by 24 housing associations. A random sample of 24,148 NIHE dwellings was included in the Excel model. This sample was cross-checked against the total NIHE stock profile to ensure it was representative.
Any new rent policy would inevitably redistribute rents across the social housing sector and result in an increase in rents for some dwellings and a reduction in rents for others. Table 6.4 summarises the numbers of basic rent charges that would require adjustment and the direction of this adjustment.

87
Table 6.4: Estimates of the numbers of housing association and NIHE properties that would require rent adjustment
category NI Housing associations
NIHE sample
Within range 9,360 60.8% 4,074 16.9% More than 10% below reference rent 2,325 15.1% 20,071 83.1%
More than 10% above reference rent 3,703 24.1% 3 0.01%
Cases to be transitioned 6,028 39.2 20,074 83.1 Cases All 15,388 100.0 24,148 100.0
It shows that:
• Almost 61% of housing association dwellings would require no rent adjustment, whilst 15% would face an upward adjustment and 24% would require a downward adjustment.
• The position for NIHE stock would be very different. Only 17% of dwellings would require no rent adjustment and virtually all other dwellings would require an upward rent adjustment.
This profile is not surprising, as the proposed rent harmonisation model has been designed to gradually raise NIHE rents towards housing association rent levels and to smooth out the widest anomalies within the housing association sector.
Table 6.5 gives an indication of the scale of adjustment required to reach the reference rent assuming that the rent harmonisation model had been introduced in full in 2011-12 without any transition provisions. The scale to reach the "within 10% band" would be somewhat less.
Comparing the reported proposed basic rent for 2011-12 with the reference rent:
• Around 7% of housing association rents and 28% of NIHE rents would require an upward adjustment of between £5 and £10 per week.
• Less than 1% of housing association rents and no NIHE rents would require an upward adjustment in excess of £20.
• Of the 3,703 housing association rents that require a downward adjustment, around 72% require an adjustment of between £5 and £10 per week.
• Around 344 or just over 2% of housing association rents would require a downward adjustment in excess of £20. This includes 84 units that would require a downward adjustment of £30 or more, most of which are smaller 1-2 bedroom flats.

88
Table 6.5: Estimates of the scale of adjustment to attain reference rent , 2011-12 based NI housing associations NIHE Number % Number % Within option range 9,360 60.8% 4,074 16.9% More than 10% below 2,325 15.1% 20,071 83.1% £5-10 upward adjustment 1,055 6.9% 6,709 27.8% £10-15 upward adjustment 892 5.8% 6,075 25.2% £15-£20 upward adjustment 283 1.8% 5,452 22.6% £20+ upward adjustment 95 0.6% 0 0.0% More than 10% above 3,703 24.1% 3 0.0% £5-10 downward adjustment 1,392 9.0% 1 0.0% £10-15 downward adjustment 1,270 8.3% 1 0.0% £15-£20 downward adjustment 697 4.5% 1 0.0% £20+ downward adjustment 344 2.2% 0 0.0%
Transition impact
Figures 6.1 and 6.2 show the numbers of housing association and NIHE dwellings that would transition onto a rent that would fall within the rent reference 10% band over a 10-11 year period. Collectively they show that:
• By year five, more than 92% of housing association dwellings would have transferred onto a rent that fell within 10% on either side of the indicative reference rent. This includes the 60% of dwellings that fell within the indicative reference rent range in the base year.
• By year 10 more than 99% of housing association dwellings would have transferred onto the harmonised rent. This slowdown in the rate of transition after year five reflects the lengthy timescales required to achieve the necessary downward adjustment to rents that are at the upper end of the rent distribution.
• Around 75% of NIHE dwellings would have transferred onto the harmonised rent by year five, almost 97% would have transferred onto the harmonised rent by year 10 and almost 99% by year 11.
• Over the 10-11 year period the average NIHE rent would increase by some 5% per annum for most of the period, before falling back to 4% from year eight onwards.

89
Figure 6.1: Transition of NI housing association sector (transitional premium of £2 per week)
Figure 6.2: Transition of NIHE sector sample (transitional premium of £2 per week)

90
Results for different dwellings types/sizes
There are few regular or recurring differences in the profile of the housing association stock in terms of rates of transition. The main issue of note is that of the 103 rents that would not have completed the transition process by year 11:
• 89 would require a further downward adjustment; most are 1-2 bedroom flats with a rent of £25+ above the reference rent level in 2011-12.
• 14 would require a further upward adjustment; most are 2-3 bedroom dwellings with a rent of £25+ below the reference rent in 2011-12.
In the NIHE sector, some 332 rents in the sample would not have completed the transition process by year 11, all of which had a rent of £25+ below the reference rent in 2011-12.
Completion rates for transition within a 10 year period for 3-4 bedroom flats are well below the rate for other dwelling type/size combinations. For example, only 65% of 3 bedroom flats are likely to complete transition within 11 years, compared with upwards of 90% of terraced and detached houses of all sizes. The reasons for this are not immediately apparent, but it would suggest that there are some clusters of low rent flats that might require additional measures in order to achieve rent harmonisation within a reasonable time frame.
Potential impact on annual rental income
The model offers some qualified insight into the possible impact of rent harmonisation on annual rental income at the aggregate level. The figures set out in table 6.6 and 6.7 are intended for illustrative purposes only and make no provision for voids, turnover, welfare reforms or other factors that might impact on future levels of annual rental income. In addition, the figures for NIHE have not been weighted or grossed up.

91
Table 6.6: Illustration of annual basic rental income revenue for NIHE sample
Year
Annual rent income via existing rent structure (rent increase 3% per annum)
Annual rent income via rent harmonisation (rent increase 3% per annum)
Difference (column B -column A)
base £69,402,875 NA NA NA year 1 £71,484,961 £73,572,998 £2,088,037 2.92% year 2 £73,629,510 £77,644,296 £4,014,786 5.45% year 3 £75,838,395 £81,337,875 £5,499,480 7.25% year 4 £78,113,547 £84,855,489 £6,741,942 8.63% year 5 £80,456,953 £88,209,108 £7,752,155 9.64% year 6 £82,870,662 £91,498,318 £8,627,655 10.41% year 7 £85,356,782 £94,643,785 £9,287,003 10.88% year 8 £87,917,485 £97,746,313 £9,828,828 11.18% year 9 £90,555,010 £100,832,486 £10,277,476 11.35% year 10 £93,271,660 £103,943,907 £10,672,246 11.44% year 11 £96,069,810 £107,128,739 £11,058,929 11.51% Note: Figures refer to the rent for the 24,148 units contained in the Excel rent model only.
Keeping these health warnings in mind, the figures in table 6.6 lend support to claims that the cumulative financial gain for the NIHE relative to the continuation of the existing rent structure could be considerable over the longer term. If the rent inflation rate for both the current and harmonised rent setting frameworks was set at 3%, the harmonised rent provisions would generate an additional 11% rental revenue from year eight onwards. This could potentially provide an important source of revenue to complement or help offset reductions in revenue deficit subsidy.
Similarly, Table 6.7 provides some indication of the potential scale of reduction in the annual flow of rental income at the aggregate level for decontrolled general needs dwellings in the housing association sector as a result of rent harmonisation.
Table 6.7 suggests that if annual rent uplifts are held constant at 3% across the current rent structure and the transition rent structure, the harmonisation provisions would result in a slightly lower rate of increase in the annual aggregate level of rental income relative to current arrangements. The difference is fairly modest and less than 1% until year 10.
The figures take no account of the annual rent uplift assumptions set out in housing associations’ business plans. The difference between the projected aggregate harmonised rental income and the revenue collectively projected in associations’ business plans could potentially be much higher than the illustrative figures infer.

92
On the other hand, the table also makes no allowance for any additional rental income that housing associations could generate from any business decisions to modify rents that fall within the reference rent 10% band.
Table 6.7: Illustration of annual basic rental income revenue for housing association sample
Year
Annual rent income via existing rent structure (rent increase 3% per annum)
Annual rent income via rent harmonisation (rent increase 3% per annum)
Difference (column B -column A)
base £56,174,546 NA NA NA year 1 £57,859,783 £57,716,601 -£143,182 -0.25% year 2 £59,595,576 £59,347,129 -£248,447 -0.42% year 3 £61,383,444 £61,042,730 -£340,714 -0.56% year 4 £63,224,947 £62,805,450 -£419,497 -0.66% year 5 £65,121,695 £64,622,799 -£498,896 -0.77% year 6 £67,075,346 £66,500,796 -£574,550 -0.86% year 7 £69,087,607 £68,453,771 -£633,836 -0.92% year 8 £71,160,235 £70,480,081 -£680,154 -0.96% year 9 £73,295,042 £72,573,114 -£721,928 -0.98% year 10 £75,493,893 £74,740,106 -£753,787 -1.00% year 11 £77,758,710 £76,973,663 -£785,047 -1.01%
Sensitivity analysis
A number of sensitivity tests were undertaken. The rent harmonised model was re-run with different assumptions about annual rates of rent inflation, the percent point of flexibility and the transition premium, which are summarised in Table 6.8. It shows that:
• Increasing the annual rent uplift would lower the proportion of NIHE rents that would complete the transition process within 11 years. The two rates illustrate that the higher the annual rent increase, the lower the relative value of the transition premium and therefore the greater the number of years required to complete transition for rents that require a substantial upward adjustment.
• For much the same reason, increasing the annual rent uplift would also extend the timescale required to complete transition for rents that require a substantial downward adjustment. In the housing association sector, the number of rents still to complete the transition process by year 11 would increase to 165 if a 5% rent inflation factor was applied and to 284 if an 8% inflation factor was applied.
• Increasing the transition premium to £4 would see all NIHE dwellings transferred onto the harmonised rent within eight years but the overall annual uplift to the average rent would increase from 5% to over 6% in the first four years of transition.

93
• Increasing the transition premium to £4 would see all housing association dwellings transferred onto the harmonised rent within eight years. However, assuming everything else was held constant, the aggregate rental income generated from the harmonised rent provisions would be 1% less than the aggregate rental income from the current rent regime from year three onwards, and this percentage gap would continue to rise slowly thereafter.
• Lowering the transitional premium to £1 would considerably extend the period required to achieve full implementation of the harmonised rents in both sectors. This might be considered unfair by tenants who would still be paying rents well in excess of the upper end of the rent band after year 10.
• Reducing the reference rent band from +/-10% to +/-5% would increase the proportion of rents that would be subject to an upward or downward adjustment. In the NIHE sector almost 99% of dwellings would require some adjustment whilst in the housing association sector the figure would increase to 72%.
• A rent band of 5% would also extend the timescale required to achieve full implementation of the harmonised rents.
• Increasing the rent band to +/-15% would improve transition rates but only by a relatively modest sum. It would also increase the cash rent ranges. The rent range for one bedroom units would increase to £15+ whilst the rent range for five bedroom dwelling types would increase to £24+. This would arguably reduce the coherence of the harmonised rent provisions.
Table 6.8: Sensitivity analysis and impact on transition rates
Test NIHE Housing association Year 5 (%)
Year 11 (%)
Year 5 (%)
Year 11 (%)
CENTRAL CASE 74.4 98.6 92.1 99.3 Rent inflation increased to 5% 70.4 97.2 91.6 98.9 Rent inflation increased to 8% 68.6 94.0 90.3 97.7 Transition premium increased to £4 98.6 100.0 99.3 100 Transition premium reduced to £1 55.8 74.4 80.8 92.3 Reduce rent band to 5% 59.2 95.4 84.4 98.5 Increase rent band to 15% 89.9 99.3 96.6 99.4

94
Table 6.9: Proportion of general needs decontrolled dwellings where rent transition completed by individual HA and by year
Association Units (No) year 1 year 2 year 3 year 4 year 5 year 6 year 7 year 8 year 9 year 10 year 11
Alpha 66 89.4 97.0 98.5 100.0 100.0 100.0 100.0 100.0 100.0 100.0 100.0 APEX 1,992 92.3 97.2 98.5 99.9 100.0 100.0 100.0 100.0 100.0 100.0 100.0 Ark 181 64.1 75.1 82.9 86.2 87.8 91.2 91.2 100.0 100.0 100.0 100.0 Clanmil 1,123 71.3 86.9 87.4 92.7 94.7 98.8 99.8 100.0 100.0 100.0 100.0 Connswater 438 24.2 40.2 49.8 64.4 66.9 78.5 82.6 82.6 83.1 84.9 85.2 Dungannon 287 58.5 73.2 78.7 85.7 92.0 94.1 96.2 97.9 99.7 99.7 99.7 Filor 365 82.7 86.3 91.0 94.0 100.0 100.0 100.0 100.0 100.0 100.0 100.0 Flax 324 51.9 78.7 98.1 99.4 100.0 100.0 100.0 100.0 100.0 100.0 100.0 Fold 1,902 68.3 97.8 98.9 99.5 99.6 99.9 99.9 100.0 100.0 100.0 100.0 Gosford 146 71.9 88.4 91.8 94.5 95.2 95.2 95.2 100.0 100.0 100.0 100.0 Grove 176 80.7 84.1 85.2 92.6 95.5 96.6 97.7 98.3 98.9 99.4 100.0 Habinteg 1,547 80.7 90.8 93.0 95.2 96.1 97.0 97.3 98.7 98.8 99.3 99.8 Harmony 297 73.4 85.2 89.9 95.3 98.3 100.0 100.0 100.0 100.0 100.0 100.0 Helm 2,475 46.7 59.9 68.7 81.0 85.0 92.2 98.0 98.6 98.7 99.5 99.5 Newington 279 56.3 74.2 75.6 76.0 84.9 86.7 88.5 92.1 96.4 98.9 98.9 Oaklee 1,607 64.3 78.0 83.7 85.1 87.2 89.7 90.9 91.8 97.6 99.1 99.5 Open Door 20 100.0 100.0 100.0 100.0 100.0 100.0 100.0 100.0 100.0 100.0 100.0 Rural 369 64.5 81.0 85.4 90.5 91.9 93.0 93.5 94.9 96.2 99.2 99.5 South Ulster 776 40.6 51.3 63.8 74.6 84.1 90.3 92.3 94.1 98.3 98.8 99.6 St. Matthew’s 143 58.7 67.8 82.5 93.0 97.9 99.3 99.3 99.3 99.3 99.3 99.3 Trinity 366 69.4 82.2 91.8 95.4 98.4 99.2 99.2 99.5 99.5 99.7 99.7 Ulidia 500 27.4 46.8 59.6 63.0 81.6 88.4 94.0 96.8 97.0 97.6 99.2 Wesley 9 55.6 100.0 100.0 100.0 100.0 100.0 100.0 100.0 100.0 100.0 100.0 All 15,388 64.8 79.0 84.3 89.1 92.1 95.1 96.7 97.6 98.6 99.1 99.3

95
Individual housing associations
Table 6.9 shows the projected transition rates for individual housing associations and indicates that:
• Twelve housing associations would complete the transition process within 10-11 years, including five that would have fully moved onto the rent harmonisation regime by year five.
• A further 11 housing associations would have more or less completed the transition process within the same period, in the sense that over 99% of their general needs decontrolled rents would have transferred onto the rent harmonisation regime.
As noted earlier, the model suggests that the harmonisation provisions would result in only a modest reduction in the aggregate annual rental income in the housing association sector. This is partly because gains in rent by some landlords are offset by losses for others.
To explore this issue further, we examined the rent profile of two housing associations. The first was Connswater, which is the one housing association that would not come close to achieving the transition over a 10-11 year period. The analysis suggests that:
• Of Connswater’s 438 dwellings included in the rent harmonisation model, 332 would require a downward rent adjustment. This is equivalent to 75%.
• Of those 332 dwellings, 66 require an adjustment of £25 or more, which is the main reason why only 85% of rents would have transitioned by year 11.
• 65 out of the 66 dwellings are 1-2 bedroom flats in Belfast and have a basic weekly rent of between £81 and £95 and an additional service charge of between £3 and £5.42.
• Holding the annual uplift constant, Connswater would see a widening gap between the annual rental income it would receive under its current rent structure and the rent harmonisation provisions. In year one the 'shortfall' would be some 1.8% rising to 6.6% in year five and to over 9% by year 11.
The second housing association was Oaklee, which has 1,607 decontrolled general needs rents. Further analysis suggests that:
• Around 945 rents (59%) would require no transitioning. A further 222 rents would require an upward adjustment (14%) and some 440 rents would require a downward adjustment (27%).

96
• Upward transition, where required, would be achieved by year 10 but around 2% of rents that require a downward adjustment would not have completed transition by year 11.
• Holding the annual uplift constant, the difference between the annual rental income Oaklee would receive under its current rent structure by comparison with the rent harmonisation provisions would result in a shortfall of around 1% in year three rising to 1.3% in year five and 2.1% by year 11.
The findings, whilst far from conclusive, indicate that transition could prove a challenge for some housing associations. Housing associations required to apply substantial downward adjustments to a significant proportion of their dwellings might have little room for manoeuvre if there were adverse changes in key external factors.
A proportion of housing associations might therefore be at risk of being unable to remain financially viable as a result of implementing the rent harmonisation. However, the precise number would depend on the range of reference rents agreed and the annual upward adjustment to reference rents.
6.6 Concluding observations
Rent policies are often assessed in relation to coherence, affordability, fairness, transparency and sustainability.
In terms of coherence, the rent harmonisation provisions would impose greater order on the ‘incoherent’ and difficult to justify patterns of rents within the social rented sector in Northern Ireland at present. A harmonised system would also be more likely to ensure that rents increase with property size, and reflect the relative popularity of different dwelling types.
Whether the resulting harmonised rents would better reflect the range and quality of service tenants receive is less easy to discern. In part this is because it would beup to individual social landlords to determine rents for dwellings within a 10% band of the reference rent. That said, the setting of reference rents would provide tenants with a clear benchmark against which individual landlords would have to explain why rent levels and rent distributions differ.
In terms of affordability, the way the welfare system deals with housing costs means that there is no single tipping point at which rents become unaffordable. However, it is clear that most NIHE tenants and some tenants of housing associations would face an increase in rents under a harmonised system. If 'controlled' housing association general needs tenancies were included in any future rent policy, most of those tenants would also face a rise in rent payments. The application of a transition limit of, say, £2 would protect these tenants from large or sudden rent increases so long as the annual rent uplift remained close to the rate of inflation.

97
As discussed in chapter 5, affordability considerations also need to take account of the affordability of accessing other tenures. In this regard, the rent harmonisation model, in contrast to current arrangements, would ensure that social tenants continued to benefit from rents lower than what they would pay in the private sector for properties of a similar size. However, this would only be ensured over the longer term if annual rent uplifts, especially in the housing association sector, were constrained to be in reasonably close alignment to CPI rates.
The rent harmonisation provisions outlined in this chapter have sought to be as straightforward and fair as possible, given the limitations of the data available. The reference rents have been set to minimise the number of housing association rents that would require adjustment whilst reducing affordability pressures for larger dwellings in general and more specifically for dwellings with rents at the upper end of the distribution, which in some cases are close to or exceed LHA rates.
As far as the data provided by housing associations has permitted, the reference rents have been set to be as revenue neutral as possible, but inevitably some housing associations would make some financial gains and others would lose out financially.
In developing arrangements for any future rent harmonisation process, DSD would therefore need to consider its policy position in terms of possible ‘corrective strategies’ for housing associations at serious risk of being unable to remain financially viable, including possible cross-subsidy arrangements.

98
7 SUMMARY AND CONCLUSIONS
7.1 Introduction
This project was envisaged as an update of earlier research carried out for DSD/NIHE that reviewed social rents in Northern Ireland (Gibb, et al, 2007) but in practice ithas gone much further. The study involved:
• A detailed comparative analysis of social rents, rent policy and practices across the UK and the Republic of Ireland (see chapters 2, 4 and 5).
• The preparation of a database that contained unit level data on the rents and property attributes of social rented sector housing stock. The database was then comprehensively analysed to explore rent patterns in 2011 and whether these reflected the rent policies of social landlords (see chapters 3 and 4).
• An analysis of the affordability of social rents, taking account of the complex interactions within the benefits and tax credits system, as well as recognising the effects of the imminent introduction of the Universal Credit (see chapter 5).
• The construction of a simulation model to exemplify a possible approach to rent harmonisation, which informed the discussion of possible harmonised rent structures and plausible convergence strategies (see chapter 6).
This conclusion summarises the main study findings and reflects further on the interaction between grant rates, rents and the financial viability of housing associations,. It also draws together a series of key issues that would need to inform any future policy developments and highlights potential areas for further research.
7.2 Summary of Findings
Starting with the comparative rent policy analysis, there are several points to stress:
• Rent setting and rent levels are the cumulative effect of government policies and landlord business decisions over many decades, including changes to revenue and capital subsidy arrangements and individual social landlord rent polices. Rent policies have to be framed within the wider housing finance and benefits regimes in operation. This is why the on-going welfare reforms and the limited devolution of the new Universal Credit in Northern Ireland is so important with respect to both affordability and business viability.

99
• England has shown that it is possible to achieve rent convergence, but the pace of transition from one rent setting framework to another is inevitably slow. This is because of the need to shield tenants from major rent adjustments in any given year and to 'protect' the financial viability of housing associations. Convergence is also now being undermined by the Affordable Homes Programme, which is establishing a different rent model that affects new build and some relets of existing property.
• Wales is in the process of moving to a new rent policy, which will involve greater landlord discretion within a broadly common framework (though this remains subject to further complementary reforms to council housing finance in Wales). Scotland has retained greater discretion and continues to show little enthusiasm for rent harmonisation or convergence.
• The Republic of Ireland relies on a combination of rent supplements (social security) and rent-setting to keep social rents low. Local authority and housing association rents are positively related or proportional to income.
• In Northern Ireland, the Housing Executive’s rent point system, set up in 1984, not only remains the basis for setting the organisation’s rents, but different variants of it tend to be used by individual housing associations for the decontrolled part of the housing association sector too. The points system does not have a location factor and after nearly 30 years it has become somewhat dated. It no longer reflects the NIHE stock profile, which has changed considerably over this period as a result of house sales and investment patterns. At the same time, individual associations have made various changes, creating similar but different policies across the sector.
• Service charges are subsumed in the NIHE rents but are levied separately by housing associations. These mainly apply to sheltered, specialist and some smaller general needs properties. Despite the fact that regulation requires transparency, there are marked variations in service charges.
• Rent convergence policies in the UK have focused primarily on basic rents due to the difficulties of coming to a common agreement on service charges. However, inclusion of service charges in the gross rent can lead to affordability issues. The Welsh Assembly Government therefore intends to introduce complementary measures to deal with service charges. In England the new affordable rents are expected to include service charges. Both moves appear to have been driven by a desire to constrain gross rents.
100
In terms of the patterns of rents in the social rented sector in Northern Ireland in 2011-12:
• Rent levels were lower in the NIHE sector and more dispersed in the housing association sector. This was the case across all dwelling size/type combinations.
• Based on 87,510 NIHE properties in the cleaned sample, the average (mean) weekly basic rent was £55.09 and the median rent was £55.94 for 2011-12. The standard deviation was 8.92.
• For housing associations, based on 28,450 observations, the average (mean) basic weekly rent was £61.71, the median rent was £60.50 and the standard deviation was 14.92.
• Although house prices and private rents varied across Northern Ireland, reflecting differences in supply and demand, there was little spatial variation in social rents.
• The average NIHE rent for properties of different sizes was lower than the comparable rent in most other parts of the UK. This also appeared to be the case for the housing association sector, but differences in the way rents data is collected and reported in Government statistics prohibits reaching a firm conclusion.
• The gap between the average NIHE and housing association rent may, at least in part, be consistent with differences in quality in the two sectors. This cannot be assessed from the data available but housing associations do appear to set higher rents for new build. That said, whether the cash differentials between average rents in the two sectors are consistent price-quality relationships is open to question. Likewise, it is not clear whether the cash differentials between the two sectors would be considered fair by tenants.
• Rent differentials in both sectors confirm that rents generally increase with size and that for dwellings of the same size, rents for houses are higher than for flats. However, rent differentials in both the NIHE and housing association sector exceed those recommended in English guidelines. One of the reasons for these wider size differentials is that the NIHE rent structure applies the same number of points for the first bedroom and each additional single or double bedroom - which is also a feature of most housing association policies.
• Average rents often disguise variations in the range of rents for properties of the same size and dwelling type. The extent of the distribution of rents for properties of a similar dwelling type and size can be considerable and frequently exceeds £50 per week. This suggests that the points (values) embedded in rent structures may no longer be defensible and may not fairly reflect variations in the value tenants place on different property

101
attributes. The complex pattern of rents must also be confusing for tenants and other stakeholders.
The study also carried out a new rental affordability analysis drawing on the new data and a bespoke tax and benefits model designed to examine affordability. This part of the research found:
• It made sense to embrace three measures of affordability: rent to income, residual income and work disincentives. The analysis was in turn based on minimum wage employment for different household types and property sizes, and also took account of the introduction of the Universal Credit.
• Looking at comparative rent to income ratios, NIHE rents on this basis are more affordable than council rents in England and Wales, but rather less so than council rents in Scotland. Likewise, the basic general needs housing association rent figure for 2011/12, expressed as a percentage of average earnings in 2011, equates to 11.6%, a little below the 2010 figures for England and Wales, although still a little higher than the figure for Scotland.
• The analysis suggested that rent to income ratios for average rents were modest. Residual incomes were clearly higher in those cases where the rents did not result in Housing Benefit eligibility, but in all cases there was a residual income in excess of £65 per week over Income Support levels. Lone parent households also tend to have higher levels of residual incomes. The extent to which households would be better off in work would tend to be rather less than stated depending on the extent of their work related costs, and the value of passported benefits. While generally not problematic, Housing Benefit dependency was greater for housing association tenants.
• Under the Universal Credit (UC), most new claimants in low paid employment will fare better compared with households still operating under the old regime in 2013. The gains for working households stem from the lower UC taper rate, and are progressively greater as earnings increase (while they still remain eligible for UC).
• At the same time, the new proposed earnings disregards are less generous for couples with four or more children, and lone parents with two or more children. The UC scheme is also less generous for lone parents, as under the current tax credit regime lone parents receive the same benefits as couples with children. In contrast, the UC scheme is based on the scale rates for out of work benefits, which provide less support for lone parents than for couples with children.

102
Chapter 6 explores the potential to move to a more consistent basis for setting rents across social rented housing in Northern Ireland.
• The case is made for a sector-wide harmonised rent-setting regime, based on important elements of the English and Welsh models. The key features of the model are a size and type reference rent matrix. The underlying principle is that all social landlords would move the basic rent for each general needs dwelling to within a 10% band either side of the appropriate reference rent. Rents would transition towards the reference rent ‘zone’ with limits on how quickly they rise (or not, if required) to dampen the impact of the reform.
• Working to a central scenario, about a quarter of housing association rents would need a downward readjustment, whereas NIHE rents would generally need to rise to move into the +/-10% band.
• The central scenario suggests that in both the NIHE and housing association sectors transition could more or less be achieved over an 11 year period.
• As far as the data provided has permitted, the reference rents have been set to be as revenue neutral as possible in respect of housing associations. While not taking account of other risks to income, the central scenario suggests that over an eleven-year period the housing association sector as a whole would only lose a modest sum of rental income each year from transition, gradually rising to around one per cent of income by year 10.
• Inevitably, some housing associations would make some financial gains while others would lose out financially and a few housing associations might face difficulties. Any rent harmonisation policy might therefore require DSD to provide individual support to specific exposed social providers. In England, for example, some associations were supported in their transition by stretching out the length of time to achieve the target.
• Sensitivity analysis tests the central scenario and indicates, for instance, that while the model is generally robust, policy decisions to narrow the zone (e.g. +/-5%) would increase transition problems, whereas widening the zone (e.g. to +/-15%) would undermine the broader coherence of a harmonised model.

103
7.3 Conclusions
A need for change?
There is a considerable gap between the average NIHE and housing association rents for different sized dwellings, which appears to have been increasing over time. Whether such disparities reflect price-quality differences is open to question. Rent differentials between dwellings of a different size within both sectors also exceed the English rent policy guideline bedroom weights, and the very wide range of rents charged for dwellings of a similar size/type within each sector is hard to justify.
The divergent and wide spread of rents that has evolved over many years is the cumulative result of decisions on government policies on capital and revenue subsides and landlords’ business decisions in regards to rent setting and the extent to which ongoing costs should be distributed across the stock of properties.
Whatever the mix of reasons, the very wide spread of rents found in the social housing sector suggests that the current rent setting policy framework in Northern Ireland no longer fairly reflects variations in the stock of social housing that is available or the value tenants place on different attributes. An added problem is that some housing association rents are close to exceeding the LHA rates set for private sector rents from April 2013.
The conclusion drawn from the analysis of rent practices and policies (manifested in rent levels and their distribution) is that current practice is unsustainable. A new approach to rent-setting is warranted.
Moving forward
The rent harmonisation provisions outlined in chapter 6 suggest that it would be feasible to move to a more consistent and rational basis for setting rents across social rented housing in Northern Ireland. Modelling based on the proposed rent harmonisation structure also suggests that this could be more or less achieved within a 10-11 year time frame, with tolerably acceptable rates of transitioning.
That said, the design of a national rent policy is ultimately a matter of policy judgement and political decisions about the balance between local autonomy and central policy control and compliance. As the experience from England highlights, decisions about the balance between local autonomy and central policy control would have to take account of other factors.
NIHE and revenue subsidy
Rent harmonisation and the raising of NIHE rent levels up towards association levels would be politically challenging and would adversely impact non-HB recipient tenants.

104
On the other hand, and depending on what transition arrangements were put in place, harmonisation would potentially reduce the need for NIHE revenue deficit subsidy with positive public expenditure implications. Gradually phasing out the NIHE revenue subsidy and allowing NIHE rents to rise might release additional funding that could be capitalised into grant for new social housing development. However, it is not immediately obvious that the political case could be made to ‘keep’ the revenue subsidy within social housing,
Moreover, removing this subsidy is very unlikely to be fiscally-straightforward. Reduction of the revenue subsidy would in large part be offset by higher Housing Benefit (and thereafter Universal Credit) costs associated with the rent increases. Much would therefore depend on the aggregate scale of annual increases across the social rented sector and inter-governmental negotiations over the Comprehensive Spending Review and public spending more generally.
Housing association financial viability
The proposed harmonised rent structure seeks to balance the financial requirements of housing associations and affordability for tenants. In particular, the application of the 10% band is intended to give housing associations flexibility to set rents at a level that would enable them to maintain their stock and their financial viability and meet their commitments to lenders.
This flexibility might need to be accompanied by explicit national checks and balances by the DSD regulatory function to ensure that social landlords did not seek to make a windfall gain by increasing all rents to 10% above the reference rent. To protect tenants, it might also be appropriate to limit annual increases over and above the annual uplift to the transition premium.
Although it was beyond the scope and resources of this study to undertake a detailed financial viability appraisal, the findings from the simulation exercise suggest that a small proportion of housing associations that would be required to apply a substantial downward adjustment to a large proportion of their stock might be at risk of being unable to perform within agreed financial and business plan parameters and to meet existing loan covenants. In particular, those organisations might have little room to manoeuvre if there were adverse changes in the wider external environment or welfare reform brought about larger changes in rental income and revenue than business plans had allowed for. However, the precise number would depend on the range of reference rents agreed and, more importantly, the annual upward adjustment to reference rents.
In developing arrangements for any future rent harmonisation process, DSD would therefore need to consider its policy position in terms of possible ‘corrective strategies’ for housing associations at serious risk of being unable to remain financially viable, including possible cross-subsidy arrangements.
In this context, it is worth noting that in England, housing associations that faced funding difficulties were expected, in the first instance, to draw on reserves to fund expected deficits arising from a projected shortfall in rental income relative

105
to business plan assumptions. Social landlords could only seek a ‘time limited waiver’ if they could demonstrate that they faced severe difficulty in following the policy.
A related issue is ongoing funding for new social housing development. Falling levels of public funding for new housing has increased policy attention on the need to lever in as much private funding as possible for new social housing development.
Rent harmonisation would require downward pressure on housing association rents. This means that housing associations would generally be unable to continue to pursue a policy of ‘charging more for new properties’ and would need to find new means of meeting the cost of private borrowing. The blurring of LHA and housing association rents suggests that such a move would be necessary even without rent harmonisation.
To assess the financial capacity of housing associations and their scope to draw on their own unencumbered reserves and surpluses or other assets would require detailed financial data. Similarly, any assessment of the extent to which individual housing associations might be able to cross-subsidise new supply from any overall increase in rental income arising from rent harmonisation would require detailed financial data. However this is easier said than done.
Glen Bramley and colleagues (2010) undertook a study for the Scottish Government into the financial capacity of local authority landlords and housing associations. It focused on the potential number of units that could be built, given different assumptions about future rental growth and what was known about surpluses and reserves, borrowing and security.
One important finding in the context of the planned restructuring of NIHE was that there was considerable potential to expand public sector house building so long as rent increases were used to underpin capital spending as opposed to management cost inflation. The study also suggested that there was potential for housing associations to release resources for investment by reducing costs, sharing services or rationalising stock as well as through increasing rental income.
The problem, however, was inconsistent buy-in and, in particular, a lack of participation by a large component of the housing association sector – undermining the credibility of the work and the ability to secure data. If DSD was to consider commissioning a financial capacity study, we would therefore recommend it seeks to learn from the strengths and weaknesses of the Scottish research.
Service charges
An important dimension of rent harmonisation and other policies to create greater consistency between rents is to ensure rents are transparent so that tenants understand that they are paying for, and this extends to service charges.

106
The illustrative rent harmonisation model did not make any allowance for service charges. However, at several points, this study has noted that service charges in the HA sector are anomalous and appear to be inconsistent in their application and financial burden. Any policy to achieve greater harmonisation would need to be underpinned by policy discussion and clarification on what service charges should and should not be levied for.
In England, for example, Minsters concluded that charges for lift maintenance and other expenditures associated with the higher costs of maintaining high rise flats and system-built dwellings should not be levied as a separate service charge as these costs "are inevitable for the properties concerned: neither tenant nor landlord has any discretion over them" (ODPM, 2003, P19).
Any policy to achieve greater harmonisation of rents would also need to consider the potential merit of NIHE separating out service charges from its basic rents – especially in terms of improving transparency for tenants – and the political and technical feasibility of doing so.
The planned restructuring of the NIHE landlord role suggests that this difficult issue will need to be resolved one way or another. In this regard, much could be learned from a similar process of de-pooling of service charges carried out by Glasgow Housing Association (which occurred while the organisation attempted to redesign its rent policy).
Whatever the outcomes of these discussions, arrangements would need to be put in place to ensure:
• Service charges (and therefore gross rents) remain within affordability limits.
• Current anomalies (for example where the gross rent for a flat is higher than for a house of the same size) were addressed.
• Social landlords do not make windfall gains as a result of re-classifying rental income as service charges.
DSD regulation and data collection
Better quality information is needed about service costs and charges to assist policy discussions between DSD, housing associations and other stakeholders about services for which charges should be levied, and what are reasonable costs in the Northern Ireland context. Putting together the necessary evidence base with which to develop a more transparent and consistent basis for setting service charges will require buy-in and support from an engaged housing association sector.
More generally, there is a relative lack of consistent and readily accessible data on the financial well being and governance of housing associations in Northern Ireland. This suggests that any move to introduce rent harmonisation would

107
require the DSD regulatory function to think carefully about the data and framework it would require to:
• Assess the impact of rent harmonisation and the associated transitioning provisions on individual provider capacity to do what they expect to do in these longer term plans, alongside coping with new and other known business risks.
• Engage with housing association to manage potential future risks, protect public investment and ensure tenants have appropriate opportunities to influence decision-making, particularly in respect of the setting of rents and service charges.
The regulator would also need to put in place arrangements for those associations that encounter difficulties.
Rents and tenant choice
The Universities of Ulster and Cambridge are presently undertaking a parallel study on allocations in the social housing sector.
The prospect of a harmonised rent regime together with welfare reform would start to move the social housing sector in Northern Ireland to something approaching the quasi-market envisaged by the UK Labour Government in 2000 (which at that point withdrew from radical welfare reform).
This highlights that the shape of any future rent harmonisation policy would depend on the overall direction of travel the Northern Ireland Executive and the Northern Ireland Assembly envisage for the social housing sector in the coming decade.
Judgements, timescale and monitoring arrangements
Rent harmonisation models and affordability analysis can help to inform policy decisions about the most appropriate principles from which a harmonised rent policy should be developed. However, those decisions must ultimately be a matter of judgement, reflecting the relative priority given to different objectives.
The rent harmonisation model presented here was underpinned by an explicit assumption that any future rent harmonisation policy would continue to allow social landlords a considerable degree of discretion and autonomy. This assumption was in part influenced by data limitations. Nonetheless, it does serve to highlight that a key issue for policy makers is the trade-off between consistency and autonomy objectives.
Until recently the use of RPI (with or without some additional percentage points) for establishing annual rent uplifts was not an issue that raised much discussion. This is no longer the case, not least because of the use of the Consumer Prices Index, to uprate LHA rates and state benefits for people of working age.

108
Any policy proposals to introduce a harmonised rent structure would therefore need to reflect on the most appropriate inflation measures to employ, as well as arrangements for reviewing annual rent uplifts, what the scale of such an increase should be, and what would happen in the event of deflation.
Any move towards rent harmonisation would need to be widely and fully consulted on to ensure the requisite level of buy-in from tenants as well as the housing associations and other stakeholders that would face its financial consequences. Each individual housing association would also have to review their ongoing costs and loan repayment commitments and decide what changes to their business plans would be required to comply with any future rent harmonisation policy. This suggests that any introduction of a rent harmonisation policy would require a 2-3 year lead in time to permit DSD and social landlords to consult on proposals and prepare for a change in policy.
Finally, it was slow and frustrating work to assemble the data for this project. One major reason for this is the lack of routinely captured basic rent and stock data in a consistent computerised form. In contrast, this data is routinely maintained by individual housing associations in England and Scotland in order to complete Annual Statistical Performance Returns. We would therefore encourage DSD to make full use of its annual statistical return to update and maintain the basic data that was so difficult to capture and build from scratch for this project.

109
8 Appendices
APPENDIX 1: REFERENCES
Bayley, R (1988), The Rent Dilemma, Housing Vol 24 No 8, Institute of Housing.
Beattie, C., Burrows, R., Cole, I., Ford, J., & Wilcox, S (1998), Social Housing Rent Differentials And Processes Of Social Exclusion, University of York.
Bradshaw, J (1993), Household budgets and living standards, Joseph Rowntree Foundation.
Bramley, G., Pawson, H., Morgan, J., Wilcox, S. and Williams, P. (2010) A Study into the
Housebuilding Capacity of Local Authorities and RSLs in Scotland. Edinburgh: Scottish Government.
Coates, D. and Silke, D. (2011) Comparative Financial Appraisal of the Projected Long-Term Costs of Social Housing Delivery Mechanisms, Dublin: The Housing Agency.
Comptroller and Auditor General (2011) Report of the Comptroller and Auditor General, Volume 2, Office of the Comptroller and Auditor General, Dublin
Department of Social Protection (2011a) Statistical Information on Social Welfare Services 2010.DSP, Dublin
Department of Social Protection (2011b) Rent Limits Review Report 2011,DSP, Dublin
Department of the Environment, Transport and the Regions DETR (2000a) Quality and Choice: A Decent Home for All: The Housing Green Paper, DETR, London.
Department of the Environment, Transport and the Regions DETR(2000b) Quality and Choice: A Decent Home for All: The Way Forward for Housing, DETR, London.
Department of Communities & Local Government (2009) Reform of Council Housing Finance DCLG, London.
Department of Communities & Local Government (2009) A Review of Council Housing Finance: Impact Assessment, DCLG.
Department of Communities & Local Government (2010) Prospectus and Impact Assessment, Council Housing, A real future, DCLG, London.
Department of Communities & Local Government (2011) Self-Financing – Planning the Transition’, DCLG, London.

110
Department of Communities & Local Government Committee(2012) Financing of new housing supply - Eleventh Report, UK Parliament, London.
Department for Social Development (2011) Northern Ireland Housing Statistics 2010-2011, Statistics and Research Branch (Core), Department of Social Development, Belfast.
Department for Work and Pensions (DWP) (2003), Households below average income, Department of Work and Pensions. And subsequent annual editions.
DWP (2011) Welfare Reform 2011 Assessment of Impacts. DWP: London
DWP (2012a) Draft Statutory Instruments: The Universal Credit Regulations 2012, DWP, London
DWP (2012b) Housing Benefit and Council Tax Benefit Circular, HB/CTB A4/2012, DWP, London
DWP (2012c) Explanatory Memorandum for the Social Security Advisory Committee Universal Credit Regulations 2012 For the meeting of the Social Security Advisory Committee on Wednesday 13 June 2012, DWP, London
DWP (2012d) Draft Statutory Instruments: The Universal Credit Regulations 2013, DWP, London
Ditch, J., Lewis A., & Wilcox, S (2001), Social Housing, Tenure And Housing Allowance : An International Review, Department for Work and Pensions.
Equality and Human Rights Commission (2012) Making Fair Financial Decisions - An assessment of HM Treasury’s 2010 Spending Review conducted under Section 31 of the 2006 Equality Act, EHRC
Fitzpatrick, B and Burrows, N (2012) An Examination of Parity Principles in Welfare and Wider Social Policy. Northern Ireland Commissioner for Children and Young People: Belfast.
Freeman, A., Chaplin, C., & Whitehead, C (1997) Rental Affordability: A Review Of International Literature, Department of Land Economy, University of Cambridge; IN Garnett, D and Perry, J (2005) Housing Finance. CIH: Coventry.
Gibb, K., Orr, A., Croudace, R. and Littlewood, M. (2007) Rents Review: The Pricing of Social Housing in Northern Ireland. A Report to the Department of Social Development and the Northern Ireland Housing Executive, University of Glasgow.
Hall, D and Gibb, K (2010) Increasing Supply Within The Social Rented Sector York: Joseph Rowntree Foundation.
Hancock, K (1993), Can’t Pay? Won’t Pay? The economic principles of affordability, Urban Studies 30:1.

111
Hills J (1988), Twenty-First Century Housing Subsidies: Durable Rent-Fixing and Subsidy Arrangements for Social Housing, STICERD, London School of Economics.
Housing Corporation (1989), Rent Policy and Principles, Circular HC 60/89
Housing Corporation (2001) The Rent Influencing Regime: Implementing The Rent Restructuring Framework, HC, London.
Marsh, A. and Walker, B. (2006) Getting A Policy To ‘Stick’: Centralising Control Of Social Rent Setting In England, Policy and Politics, 34(2), pp. 195-217.
More, A, Gibb, K, Findlay, J, Kasparova, D and Mills, C (2003) Determined Differences: Rent Structures in Scottish Social Housing. Report to the Scottish Executive. Edinburgh: Scottish Executive.
National Audit Office (2012) Financial viability of the social housing sector: introducing the Affordable Homes Programme, London: The Stationery Office
Norris, M; (2005) Social Housing' In: Norris, M. and Redmond, D (eds). Housing Contemporary Ireland: Policy, Society And Shelter. Dublin: Institute of Public Administration.
Norris, M and O'Connell, C; (2010) 'Social Housing Management, Governance and Delivery in Ireland: Ten Years of Reform on Seven Estates'. In: Housing Studies, 25 (3).
Office Deputy Prime Minster (2003) A Guide to Social Rent Reforms in the Local Authority Sector, London, The Stationary Office
O’Sullivan, A, Young, G and Gibb, K (2012) The Belfast Housing Market Area: A Local Housing Systems Analysis. NIHE, Belfast
Pawson, H and Wilcox, S (2011) UK Housing Review 2010-11. Chartered Institute of Housing: Coventry.
Rugg, J & Wilcox, S (1997), Taking The Strain? University of York.
Solomou, W., Wright, P. and Whitehead, C. (2005) Understanding the Rent-restructuring Formula for Housing Association Target Rents. Rent Briefing paper 4. Cambridge: Dataspring.
TSA (2009) Rents, Rent Differentials And Service Charges 2010-11, November 2009.
TSA (2012) Written Evidence Submitted By The Tenant Services Authority: The Social Housing Regulator, HC 1652 Communities and Local Government Committee, TSA, Manchester
112
Welsh Assembly Government (2011) A New Policy for Social Housing Rents - Consultation Paper, Welsh Assembly Government, Cardiff
Welsh Assembly Government (2012) Homes for Wales, A White Paper for Better Lives and Communities. Welsh Assembly Government, Cardiff
Wilcox, S., O’Sullivan A., and Young, G. (2007) Social Sector Rents in Scotland, Scottish Executive Social Research: Edinburgh.
Wilcox, S (2011) Housing Benefit Reforms and Housing Associations, February, University of York.
Wilcox, S. (2011b) Universal Credit: Issues, Opportunities and The Housing Dimension; In Pawson, H. & Wilcox, S., UK Housing Review 2010/11,CIH, Coventry.
Wilcox, S. (2011c) Constraining choices: the housing benefit reforms; In Pawson, H. & Wilcox, S., UK Housing Review 2010/11,CIH, Coventry.
Wilson, W. (2012) Rent Setting For Social Housing Tenancies, House of Commons Library.
113
APPENDIX 2: PROCESSING NIHE AND HOUSING ASSOCIATION DATA
Collation and processing of NIHE data
The Housing Executive provided records for 90,162 properties. As there was a need to devise a standard definition across social landlords for different property types and formats, each property was re-classified in accordance with the common definitions used in appendix 2.1.
A total of 34 records were removed from the total property as they were defined as “other”. These were 22 travellers’ places; eight mobile homes; one warden’s flat; one property recorded as sold, and a disability centre and hostel where it was not possible to disaggregate the rents into rent per dwelling.
A further 834 dwellings were removed as the rent for these properties was either missing or recorded as zero. This gave a total of 89,294 dwellings prior to analysis. Missing/incomplete postcodes were inserted using the LP Valuation Roll and Postcode Finder, and the heights of flats were validated using Google Map.
Collation and processing of housing association data
Table A2.1 summarises the data provided in respect of each of the 28 Housing Associations that provided data. Recorded on the right hand side column of Table A2.1 are the numbers of properties that were removed from the housing association property database prior to analysis. These were as follows:
• Two self-contained flats owned by Broadway, as the rents were missing.
• Fold’s stock contained six properties that were occupied by wardens. These units were excluded from the analysis with 60 other properties that had no or zero rents recorded, including three communal areas.
• Three records were excluded from the Gosford stock; they related to a garage, a shop, and a warden’s unit.
• 153 records were removed from the Apex dataset as these properties had no dwelling form details. A further two records were removed as no rents were supplied.
• Flax Housing Association included 11 properties with rents given as £608.37. These were two bedroom terraced houses and flats in the Thorndale Family Centre, jointly owned by Flax Housing Association and the Salvation Army. They were excluded from the analysis as the £608.37 appeared to be the aggregated rent for these affordable family units.
• 43 long term vacant dwellings were removed from stock held by Harmony.

114
• Missing/zero rents and incomplete records meant 331 records were removed from the Helm stock.
• Two records were removed from the Clanmil dataset. One had a zero rent while the other had no rent recorded.
• A bedsit record was removed from the Habinteg sample as the high rent recorded was probably the aggregated rent for the hostel.
• 97 records were removed from the Trinity database because 56 had no dwelling form attribute and 41 did not include the number of bedrooms.

115
Table A 2.1: Average basic rent for housing association sample
Total Sample
Basic Rent Records removed Mean Median Std. Dev
Abbeyfield 163 £53.31 £52.83 3.09 0 Alpha 926 £51.98 £49.73 7.33 0 Apex 2,454 £68.92 £71.87 12.97 155 Ark 280 £57.76 £58.67 15.15 0 Broadway 82 £27.06 £24.49 3.29 2 Clanmil 2,401 £60.57 £55.60 14.02 2 Connswater 546 £83.67 £81.24 12.66 0 Covenanter 27 £49.93 £52.23 3.18 0 Dungannon& District 369 £70.65 £73.01 14.43 0 Filor 382 £64.81 £62.53 7.55 0 Flax 434 £67.53 £68.22 13.3 11 Fold 4,451 £57.83 £48.09 15.25 60 Gosford 197 £60.78 £60.92 13.13 3 Grove 205 £67.36 £69.21 11.75 0 Habinteg 1,689 £68.77 £69.55 11.67 1 Harmony 430 £59.80 £59.80 9.49 43 Helm 4,375 £64.00 £61.23 14.48 331 Newington 397 £65.54 £68.38 13.3 0 Oaklee 3,924 £58.51 £53.14 15.79 0 Open Door 301 £50.56 £49.53 4.32 0 Rural 418 £78.27 £75.96 12.09 0 SHAC 806 £35.23 £30.56 10.22 0 South Ulster 939 £64.90 £59.57 16.79 0 St Matthew’s 188 £65.22 £63.74 9.82 0 Triangle 265 £46.48 £48.18 9.42 0 Trinity 1,612 £60.26 £59.57 11.88 97 Ulidia 664 £76.12 £78.51 14.01 0 Wesley 105 £53.87 £51.68 7.1 0
Wherever possible, missing/incomplete postcodes and addresses were confirmed used the LP Valuation Roll and Postcode Finder. When details were missing from data supplied by housing associations on the number of storeys in a building and other dwelling form attributes, the cases were validated by visually inspecting the properties via Google Maps.

116
Annex 2.1: Standardisation of property type descriptions for NIHE and housing association dwellings
Landlord bedsit 2 storey flat 3+ storey flat (3 to 6 storeys high)
multi-storey flat > 6 storeys
terraced bungalow
semi detached bungalow
detached bungalow
terraced house
semi detached house
detached house
HA Terms
bedsit flat (2 or less storeys)
flat (3+ storeys)
flat (7+ storeys)
terraced bungalow
semi detached bungalow
detached bungalow
terraced house
semi-detached house
detached house
flat, 0 bedroom
flat in block (2 storeys)
flat in block (3+ storeys)
terraced, category one bungalow
semi detached, category one bungalow
category one bungalow
house in block
detached house
bungalow, 0 bedroom
flat in 2 storey house
flat in 3+ storey house
terraced, bungalow for wheelchair user
semi detached, bungalow for wheelchair user
cottage (1 storey)
cottage (> 1 storey)
room in shared house
flat, bungalow
maisonette (3+ storeys)
detached bungalow
room in shared accommodation
maisonette (2 storeys)
detached, bungalow for wheelchair user

117
Landlord bedsit 2 storey flat 3+ storey flat (3 to 6 storeys high)
multi-storey flat > 6 storeys
terraced bungalow
semi detached bungalow
detached bungalow
terraced house
semi detached house
detached house
NIHE Terms
point flat, 0 bedroom
corner flat (2 storeys)
corner flat (3+ storeys)
point flat (>6 storeys)
mid-situated bungalow
semi-detached bungalow
detached bungalow
mid-situated house
semi-detached house
detached house
end situated flat, 0 bedroom
point flat (2 storeys)
point flat (3+ storeys)
corner flat (>6 storeys)
end-situated bungalow
semi-detached rural cottage (1 storey)
detached rural cottage (1 storey)
end-situated house
semi-detached rural cottage (> 1 storey)
detached rural cottage (> 1 storey)
mid-situated flat, 0 bedroom
end-situated flat (2 storeys)
end-situated flat (3+ storeys)
detached flat (>6 storeys)
corner bungalow
corner house
end-situated bungalow, 0 bedroom
mid-situated flat (2 storeys
mid-situated flat (3+ storeys
mid-situated rural cottage (1 storey)
mid-situated rural cottage (>1 storey)
semi detached bungalow, 0 bedroom
semi detached flat (2 storeys)
semi-detached flat (3+ storeys)
end-situated rural cottage (1 storey)
end-situated rural cottage (> 1 storey)

118
Landlord bedsit 2 storey flat 3+ storey flat (3 to 6 storeys high)
multi-storey flat > 6 storeys
terraced bungalow
semi detached bungalow
detached bungalow
terraced house
semi detached house
detached house
end-situated other, 0 bedroom
detached flat (2 storeys)
detached flat (3+ storeys)
corner maisonette (2 storeys)
corner maisonette (3+ storeys)
end-situated maisonette (2 storeys)
end-situated maisonette (3+ storeys)
mid-situated maisonette
mid-situated maisonette
semi-detached maisonette (2 storeys)
semi-detached maisonette (3+ storeys)
detached maisonette (2 storeys)
detached maisonette (3+ storeys)
point maisonette (2 storeys)
point maisonette (3+ storeys)

119
Landlord bedsit 2 storey flat 3+ storey flat (3 to 6 storeys high)
multi-storey flat > 6 storeys
terraced bungalow
semi detached bungalow
detached bungalow
terraced house
semi detached house
detached house
end-situated split level (2 storeys)
end-situated split level (3+ storeys)
mid-situated split level (2 storeys)
mid-situated split level (3+ storeys)
semi detached, split level (2 storeys)
semi detached, split level (3+ storeys)
detached, split level (2 storeys)
detached, split level (3+ storeys)

120
APPENDIX 3: HOUSING ASSOCIATION RENTS - ADDITIONAL TABLES
Table A 3.1: HA decontrolled rents by provision type
Dwelling Size 1 2 3 4 5
General Needs
Detached house
Number 0 173 299 37 14 Average - £70.59 £79.09 £85.61 £87.20 Range - £27.85 £31.36 £32.64 £14.81 Minimum - £58.97 £61.97 £63.65 £79.56 Maximum - £86.82 £93.33 £96.29 £94.37
Semi-detached House
Number 1 1,290 2,507 186 84 Average £57.71 £72.52 £79.78 £83.82 £83.81 Range £0.00 £60.11 £50.16 £36.94 £15.71 Minimum £57.71 £35.04 £46.33 £59.73 £76.13 Maximum £57.71 £95.15 £96.49 £96.67 £91.84
Detached bungalow
Number 35 262 161 36 6 Average £57.31 £68.38 £81.17 £86.80 £79.03 Range £32.82 £37.44 £31.95 £18.53 £23.89 Minimum £40.31 £53.38 £61.75 £77.18 £65.51 Maximum £73.13 £90.82 £93.70 £95.71 £89.40
Semi-detached Bungalow
Number 24 891 241 28 2 Average £57.36 £67.44 £76.26 £82.65 £84.49 Range £25.27 £52.00 £44.85 £28.52 £4.14 Minimum £46.49 £38.96 £49.95 £67.54 £82.42 Maximum £71.76 £90.96 £94.80 £96.06 £86.56
Terraced house
Number 27 1,643 2,834 523 148 Average £47.00 £62.74 £76.23 £79.88 £79.88 Range £22.74 £60.07 £57.08 £42.27 £35.57 Minimum £37.70 £36.04 £39.56 £54.40 £59.86 Maximum £60.44 £96.11 £96.64 £96.67 £95.43
Low rise flat
Number 1,305 1,828 211 3 0 Average £48.57 £62.99 £60.14 £55.95 - Range £52.28 £60.45 £54.60 £4.67 - Minimum £29.89 £34.56 £40.41 £52.84 - Maximum £82.17 £95.01 £95.01 £57.51 -
Multi/high rise Number 0 41 0 0 0 Average - £58.08 - - -

121
Table A 3.1: HA decontrolled rents by provision type
Dwelling Size 1 2 3 4 5
Range - £18.36 - - - Minimum - £51.24 - - - Maximum - £69.60 - - -
Total
Number 1,442 6,502 6,317 823 259 Average £49.22 £65.97 £77.34 £81.31 £81.50 Range £52.28 £61.55 £57.08 £43.86 £35.57
Sheltered/support accommodation
Detached house
Number 0 0 7 3 1 Average - - £74.14 £32.21 £88.78 Range - - £10.26 £0.00 £0.00 Minimum - - £67.33 £32.21 £88.78 Maximum - - £77.59 £32.21 £88.78
Semi-detached House
Number 0 5 17 6 3 Average - £65.00 £76.50 £80.35 £81.01 Range - £2.92 £14.33 £12.65 £7.32 Minimum - £64.42 £67.33 £76.13 £76.13 Maximum - £67.34 £81.66 £88.78 £83.45
Detached bungalow
Number 12 13 3 3 0 Average £57.85 £67.45 £82.20 £30.74 - Range £13.88 £22.22 £14.23 £0.01 - Minimum £49.69 £57.71 £72.71 £30.74 - Maximum £63.57 £79.93 £86.94 £30.75 -
Semi-detached Bungalow
Number 215 181 16 1 0 Average £54.67 £66.54 £83.85 £79.06 - Range £33.51 £32.44 £27.44 £0.00 - Minimum £35.77 £49.73 £64.40 £79.06 - Maximum £69.28 £82.17 £91.84 £79.06 -
Terraced house
Number 7 11 12 7 18 Average £59.14 £64.79 £66.52 £75.51 £81.98 Range £40.50 £9.19 £43.19 £5.98 £2.93 Minimum £43.28 £62.95 £34.40 £74.66 £80.52 Maximum £83.78 £72.14 £77.59 £80.64 £83.45
Low rise flat Number 6,863 783 66 1 2 Average £47.65 £60.06 £66.04 £60.02 £62.22 Range £42.19 £34.85 £27.33 £0.00 £4.40

122
Table A 3.1: HA decontrolled rents by provision type
Dwelling Size 1 2 3 4 5
Minimum £28.70 £45.08 £55.48 £60.02 £60.02 Maximum £70.89 £79.93 £82.81 £60.02 £64.42
Multi/high rise
Number 30 0 0 0 0 Average £52.52 - - - - Range £5.58 - - - - Minimum £51.72 - - - - Maximum £57.30 - - - -
Total Number 7,589 1,181 138 22 24 Average £48.13 £61.66 £70.24 £63.67 £80.50 Range £55.08 £37.09 £57.44 £58.04 £28.76
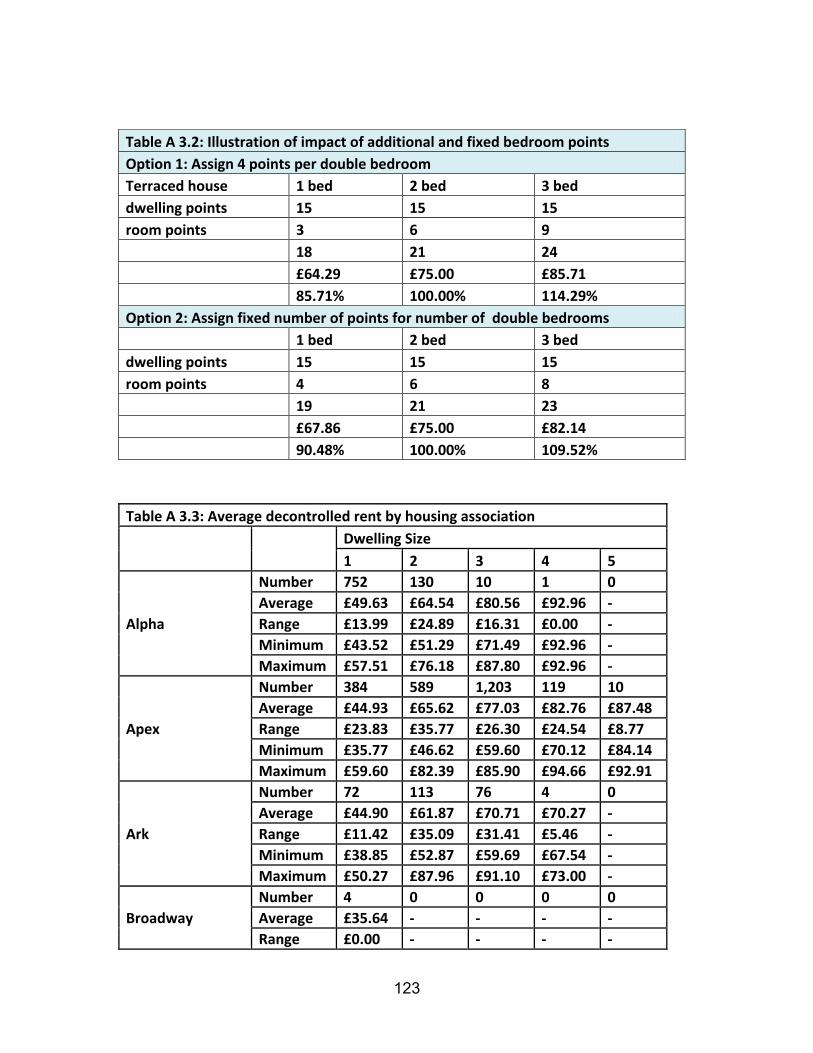
123
Table A 3.2: Illustration of impact of additional and fixed bedroom points Option 1: Assign 4 points per double bedroom Terraced house 1 bed 2 bed 3 bed dwelling points 15 15 15 room points 3 6 9 18 21 24 £64.29 £75.00 £85.71 85.71% 100.00% 114.29% Option 2: Assign fixed number of points for number of double bedrooms 1 bed 2 bed 3 bed dwelling points 15 15 15 room points 4 6 8 19 21 23 £67.86 £75.00 £82.14 90.48% 100.00% 109.52%
Table A 3.3: Average decontrolled rent by housing association Dwelling Size
1 2 3 4 5
Alpha
Number 752 130 10 1 0 Average £49.63 £64.54 £80.56 £92.96 - Range £13.99 £24.89 £16.31 £0.00 - Minimum £43.52 £51.29 £71.49 £92.96 - Maximum £57.51 £76.18 £87.80 £92.96 -
Apex
Number 384 589 1,203 119 10 Average £44.93 £65.62 £77.03 £82.76 £87.48 Range £23.83 £35.77 £26.30 £24.54 £8.77 Minimum £35.77 £46.62 £59.60 £70.12 £84.14 Maximum £59.60 £82.39 £85.90 £94.66 £92.91
Ark
Number 72 113 76 4 0 Average £44.90 £61.87 £70.71 £70.27 - Range £11.42 £35.09 £31.41 £5.46 - Minimum £38.85 £52.87 £59.69 £67.54 - Maximum £50.27 £87.96 £91.10 £73.00 -
Broadway Number 4 0 0 0 0 Average £35.64 - - - - Range £0.00 - - - -

124
Table A 3.3: Average decontrolled rent by housing association Dwelling Size
1 2 3 4 5 Minimum £35.64 - - - - Maximum £35.64 - - - -
Clanmil
Number 912 613 484 85 176 Average £50.25 £60.55 £70.79 £79.57 £80.24 Range £25.93 £33.68 £59.30 £63.42 £29.28 Minimum £32.63 £45.38 £34.40 £30.74 £60.02 Maximum £58.56 £79.06 £93.70 £94.16 £89.30
Connswater
Number 13 263 151 11 0 Average £59.55 £78.97 £83.18 £91.62 - Range £25.86 £37.51 £27.61 £10.39 - Minimum £55.31 £57.50 £67.40 £84.69 - Maximum £81.17 £95.01 £95.01 £95.08 -
Covenanter Number 27 0 0 0 0 Average £49.93 - - - - Range £9.27 - - - - Minimum £46.86 - - - - Maximum £56.13 - - - -
Dungannon .
Number 76 81 162 43 4 Average £49.19 £67.35 £77.86 £83.87 £91.31 Range £21.03 £37.47 £35.91 £36.45 £6.82 Minimum £43.66 £50.13 £58.19 £58.19 £87.04 Maximum £64.69 £87.60 £94.10 £94.64 £93.86
Filor Number 11 206 132 14 2 Average £59.06 £59.83 £72.09 £70.05 £82.27 Range £0.00 £24.68 £23.03 £14.80 £26.32 Minimum £59.06 £49.36 £57.59 £62.53 £69.11 Maximum £59.06 £74.04 £80.62 £77.33 £95.43
Flax
Number 107 142 154 25 2 Average £50.57 £64.59 £79.32 £84.89 £84.64 Range £18.92 £23.62 £29.47 £16.13 £4.53 Minimum £44.36 £50.70 £57.43 £71.40 £82.37 Maximum £63.28 £74.32 £86.90 £87.53 £86.90
Fold
Number 2,348 1,105 779 105 5 Average £45.26 £67.47 £79.73 £85.24 £85.92 Range £35.27 £36.87 £32.06 £14.43 £1.60 Minimum £33.66 £46.49 £57.71 £81.75 £84.96 Maximum £68.93 £83.36 £89.77 £96.18 £86.56
Gosford Number 32 97 39 2 0

125
Table A 3.3: Average decontrolled rent by housing association Dwelling Size
1 2 3 4 5 Average £42.39 £62.16 £72.53 £68.76 - Range £24.41 £41.77 £22.63 £1.74 - Minimum £33.03 £41.78 £57.44 £67.89 - Maximum £57.44 £83.55 £80.07 £69.63 -
Grove
Number 6 66 98 6 0 Average £44.31 £63.44 £70.88 £61.09 - Range £18.87 £34.61 £29.88 £4.72 - Minimum £29.89 £37.75 £50.34 £58.20 - Maximum £48.76 £72.36 £80.22 £62.92 -
Habinteg
Number 135 686 661 92 11 Average £48.95 £63.42 £76.15 £81.78 £76.39 Range £43.10 £52.65 £53.49 £43.25 £23.72 Minimum £32.96 £35.75 £41.58 £52.81 £59.86 Maximum £76.06 £88.40 £95.07 £96.06 £83.58
Harmony
Number 94 168 105 21 3 Average £48.07 £59.17 £68.51 £73.51 £83.04 Range £16.11 £22.99 £28.78 £16.53 £6.35 Minimum £41.81 £48.52 £54.23 £65.04 £80.19 Maximum £57.92 £71.51 £83.01 £81.57 £86.54
Helm
Number 1,640 1,528 845 109 31 Average £52.19 £67.72 £80.10 £82.09 £87.68 Range £49.94 £57.03 £43.50 £38.67 £9.67 Minimum £33.84 £28.36 £49.95 £58.00 £82.17 Maximum £83.78 £85.39 £93.45 £96.67 £91.84
Newington Number 97 61 124 73 12 Average £51.59 £64.46 £74.13 £70.33 £74.98 Range £32.70 £37.30 £53.74 £36.25 £17.10 Minimum £31.08 £45.07 £40.41 £52.84 £68.38 Maximum £63.78 £82.37 £94.15 £89.09 £85.48
Oaklee
Number 1,967 853 653 86 23 Average £47.21 £64.55 £79.29 £81.79 £82.46 Range £44.91 £54.19 £47.89 £34.37 £25.84 Minimum £28.70 £41.92 £48.33 £61.97 £68.53 Maximum £73.61 £96.11 £96.22 £96.34 £94.37
Open Door
Number 218 49 0 0 0 Average £49.35 £58.37 - - - Range £14.05 £7.99 - - - Minimum £45.07 £51.13 - - -

126
Table A 3.3: Average decontrolled rent by housing association Dwelling Size
1 2 3 4 5 Maximum £59.12 £59.12 - - -
Rural
Number 0 132 225 12 4 Average - £72.37 £76.81 £78.33 £76.15 Range - £35.28 £38.94 £23.25 £21.27 Minimum - £59.87 £57.73 £66.87 £65.51 Maximum - £95.15 £96.67 £90.12 £86.78
SHAC
Number 150 10 32 1 0 Average £48.54 £53.60 £66.04 £61.88 - Range £18.76 £16.91 £36.32 £0.00 - Minimum £31.49 £46.07 £51.18 £61.88 - Maximum £50.25 £62.98 £87.50 £61.88 -
South Ulster
Number 95 477 263 12 0 Average £49.72 £59.64 £75.96 £87.18 - Range £35.57 £53.92 £50.46 £18.07 - Minimum £31.42 £34.56 £44.54 £74.95 - Maximum £66.99 £88.48 £95.00 £93.02 -
St Matthew’s
Number 13 55 50 25 0 Average £58.13 £60.92 £69.69 £74.58 - Range £10.70 £21.61 £48.40 £29.68 - Minimum £50.56 £50.56 £39.56 £60.44 - Maximum £61.26 £72.17 £87.96 £90.12 -
Trinity
Number 402 717 388 0 0 Average £49.20 £61.48 £71.30 - - Range £45.30 £50.93 £47.05 - - Minimum £29.67 £32.79 £45.08 - - Maximum £74.97 £83.72 £92.13 - -
Ulidia Number 75 222 323 24 2 Average £56.59 £69.93 £83.87 £87.44 £86.10 Range £30.45 £51.31 £48.91 £31.69 £8.69 Minimum £43.13 £35.04 £46.33 £63.69 £81.75 Maximum £73.58 £86.35 £95.24 £95.38 £90.44
Wesley Number 92 13 0 0 0 Average £52.02 £66.97 - - - Range £23.36 £10.83 - - - Minimum £38.66 £60.00 - - - Maximum £62.02 £70.83 - - -

127
Table A3.4: Average general needs decontrolled rent by housing association
Dwelling Size 1 2 3 4 5
Alpha
Number 1 54 10 1 0 Average £50.51 £65.21 £80.56 £92.96 - Range £0.00 £16.34 £16.31 £0.00 - Minimum £50.51 £59.84 £71.49 £92.96 - Maximum £50.51 £76.18 £87.80 £92.96 -
Apex
Number 116 550 1,201 114 10 Average £46.36 £66.44 £77.02 £82.79 £87.48 Range £20.55 £32.66 £26.30 £24.54 £8.77 Minimum £37.30 £49.73 £59.60 £70.12 £84.14 Maximum £57.85 £82.39 £85.90 £94.66 £92.91
Ark
Number 12 97 68 4 0 Average £40.98 £63.32 £71.58 £70.27 - Range £3.56 £35.00 £31.41 £5.46 - Minimum £38.85 £52.96 £59.69 £67.54 - Maximum £42.41 £87.96 £91.10 £73.00 -
Clanmil
Number 25 418 424 64 152 Average £45.21 £60.95 £70.72 £84.83 £80.20 Range £17.57 £33.68 £43.92 £25.35 £23.42 Minimum £36.60 £45.38 £49.78 £68.81 £65.88 Maximum £54.17 £79.06 £93.70 £94.16 £89.30
Connswater
Number 13 263 151 11 0 Average £59.55 £78.97 £83.18 £91.62 - Range £25.86 £37.51 £27.61 £10.39 - Minimum £55.31 £57.50 £67.40 £84.69 - Maximum £81.17 £95.01 £95.01 £95.08 -
Dungannon
Number 13 65 162 43 4 Average £54.43 £69.95 £77.86 £83.87 £91.31 Range £15.06 £31.30 £35.91 £36.45 £6.82 Minimum £49.63 £56.30 £58.19 £58.19 £87.04 Maximum £64.69 £87.60 £94.10 £94.64 £93.86
Filor
Number 11 206 132 14 2 Average £59.06 £59.83 £72.09 £70.05 £82.27 Range £0.00 £24.68 £23.03 £14.80 £26.32 Minimum £59.06 £49.36 £57.59 £62.53 £69.11 Maximum £59.06 £74.04 £80.62 £77.33 £95.43
Flax Number 0 142 154 25 2 Average - £64.59 £79.32 £84.89 £84.64 Range - £23.62 £29.47 £16.13 £4.53

128
Table A3.4: Average general needs decontrolled rent by housing association
Dwelling Size 1 2 3 4 5
Minimum - £50.70 £57.43 £71.40 £82.37 Maximum - £74.32 £86.90 £87.53 £86.90
Fold
Number 89 939 764 105 5 Average £47.03 £69.86 £79.92 £85.24 £85.92 Range £25.65 £20.84 £25.65 £14.43 £1.60 Minimum £43.28 £62.52 £64.12 £81.75 £84.96 Maximum £68.93 £83.36 £89.77 £96.18 £86.56
Gosford
Number 10 95 39 2 0 Average £41.46 £62.30 £72.53 £68.76 - Range £24.41 £41.77 £22.63 £1.74 - Minimum £33.03 £41.78 £57.44 £67.89 - Maximum £57.44 £83.55 £80.07 £69.63 -
Grove
Number 6 66 98 6 0 Average £44.31 £63.44 £70.88 £61.09 - Range £18.87 £34.61 £29.88 £4.72 - Minimum £29.89 £37.75 £50.34 £58.20 - Maximum £48.76 £72.36 £80.22 £62.92 -
Habinteg
Number 100 685 658 92 11 Average £48.93 £63.42 £76.18 £81.78 £76.39 Range £43.10 £52.65 £53.49 £43.25 £23.72 Minimum £32.96 £35.75 £41.58 £52.81 £59.86 Maximum £76.06 £88.40 £95.07 £96.06 £83.58
Harmony
Number 12 159 104 19 3 Average £49.40 £59.22 £68.45 £72.66 £83.04 Range £10.09 £22.99 £28.78 £16.53 £6.35 Minimum £41.81 £48.52 £54.23 £65.04 £80.19 Maximum £51.90 £71.51 £83.01 £81.57 £86.54
Helm
Number 543 1,042 761 100 29 Average £51.01 £67.53 £80.89 £82.37 £88.00 Range £48.33 £41.89 £43.50 £38.67 £8.06 Minimum £33.84 £43.50 £49.95 £58.00 £83.78 Maximum £82.17 £85.39 £93.45 £96.67 £91.84
Newington
Number 25 53 118 71 12 Average £36.55 £65.28 £74.34 £70.30 £74.98 Range £6.22 £37.30 £53.74 £36.25 £17.10 Minimum £31.08 £45.07 £40.41 £52.84 £68.38 Maximum £37.30 £82.37 £94.15 £89.09 £85.48

129
Table A3.4: Average general needs decontrolled rent by housing association
Dwelling Size 1 2 3 4 5
Oaklee
Number 261 618 619 85 23 Average £46.50 £66.16 £79.98 £82.02 £82.46 Range £26.76 £54.19 £47.89 £34.37 £25.84 Minimum £36.43 £41.92 £48.33 £61.97 £68.53 Maximum £63.19 £96.11 £96.22 £96.34 £94.37
Open Door
Number 20 0 0 0 0 Average £46.66 - - - - Range £3.19 - - - - Minimum £46.34 - - - -
Maximum £49.53 - - - -
Rural
Number 0 130 222 12 4 Average - £72.21 £76.58 £78.33 £76.15 Range - £35.28 £38.91 £23.25 £21.27 Minimum - £59.87 £57.73 £66.87 £65.51 Maximum - £95.15 £96.64 £90.12 £86.78
South Ulster
Number 84 446 235 11 0 Average £47.86 £59.03 £75.32 £86.96 - Range £28.85 £53.92 £49.52 £18.07 - Minimum £31.42 £34.56 £44.54 £74.95 - Maximum £60.27 £88.48 £94.06 £93.02 -
St Matthew’s
Number 13 55 50 25 0 Average £58.13 £60.92 £69.69 £74.58 - Range £10.70 £21.61 £48.40 £29.68 - Minimum £50.56 £50.56 £39.56 £60.44 - Maximum £61.26 £72.17 £87.96 £90.12 -
Trinity
Number 24 201 141 0 0 Average £52.73 £63.83 £72.69 - - Range £17.71 £33.81 £45.08 - - Minimum £45.08 £45.08 £45.08 - - Maximum £62.79 £78.89 £90.16 - -
Ulidia
Number 64 209 206 19 2 Average £58.10 £70.00 £83.16 £86.14 £86.10 Range £30.45 £51.31 £48.91 £31.69 £8.69 Minimum £43.13 £35.04 £46.33 £63.69 £81.75 Maximum £73.58 £86.35 £95.24 £95.38 £90.44
Wesley Number 0 9 0 0 0

130
Table A3.4: Average general needs decontrolled rent by housing association
Dwelling Size 1 2 3 4 5
Average - £69.84 - - - Range - £2.23 - - - Minimum - £68.60 - - - Maximum - £70.83 - - -
Note: Broadway, Covenanter and SHAC specialise in sheltered/supported housing so are excluded from this analysis of general needs housing.
Table A 3.5: Average decontrolled general needs rent by housing association
Dwelling Size 1 2 3 4 5
Alpha
Detached house/bungalow - £70.10 £80.30 £92.96 Semi-detached house/bungalow - £65.18 £80.67 - -
Terraced house/bungalow £50.51 £61.51 - - - Flat/Maisonette (2 storeys or less) - - - - -
Flat/Maisonette (3 storeys or more) - - - - -
Multi-storey flat - - - - -
Apex
Detached house/bungalow - £68.77 £83.67 £88.65 £89.40
Semi-detached house/bungalow £57.85 £67.84 £78.58 £83.25 £85.9
0
Terraced house/bungalow £52.35 £67.77 £74.55 £81.09 £88.35
Flat/Maisonette (2 storeys or less) £48.26 £59.15 £59.60 - -
Flat/Maisonette (3 storeys or more) £42.39 - £71.87 - -
Multi-storey flat - - - - -
Ark
Detached house/bungalow - - - - - Semi-detached house/bungalow - £64.07 £74.09 £70.27 -
Terraced house/bungalow - £59.05 £69.21 - - Flat/Maisonette (2 storeys or less) - £55.65 - - -
Flat/Maisonette (3 storeys or more) £40.98 £80.82 - - -

131
Table A 3.5: Average decontrolled general needs rent by housing association
Dwelling Size 1 2 3 4 5
Multi-storey flat - - - - -
Clanmil
Detached house/bungalow - £71.49 £82.52 £90.77 £85.67
Semi-detached house/bungalow £50.51 £69.20 £79.45 £88.04 £81.5
7
Terraced house/bungalow - £63.24 £73.70 £84.32 £79.17
Flat/Maisonette (2 storeys or less) £52.08 £58.51 £65.15 - -
Flat/Maisonette (3 storeys or more) £40.26 £54.70 £57.22 - -
Multi-storey flat - £52.11 - - -
Connswater
Detached house/bungalow - £77.35 £84.69 - - Semi-detached house/bungalow - £78.71 £89.19 £95.07 -
Terraced house/bungalow - £74.48 £82.65 £91.27 - Flat/Maisonette (2 storeys or less) £60.82 £81.13 - - -
Flat/Maisonette (3 storeys or more) £55.31 £92.47 £95.01 - -
Multi-storey flat - - - - -
Dungannon
Detached house/bungalow - £64.81 £77.49 - - Semi-detached house/bungalow
£64.69 £69.06 £77.48 £80.33 -
Terraced house/bungalow - £68.94 £78.14 £84.45 £91.31
Flat/Maisonette (2 storeys or less)
- £76.59 £73.01 - -
Flat/Maisonette (3 storeys or more)
£53.58 £70.98 - - -
Multi-storey flat - - - - -
Filor
Detached house/bungalow - £66.91 £77.66 - - Semi-detached house/bungalow
- £62.67 £73.17 - -
Terraced house/bungalow - £58.77 £71.10 £70.05 £82.27
Flat/Maisonette (2 storeys or less)
- £54.55 - - -
Flat/Maisonette (3 storeys or more)
£59.06 £49.36 - - -

132
Table A 3.5: Average decontrolled general needs rent by housing association
Dwelling Size 1 2 3 4 5
Multi-storey flat
- - - - -
Flax
Detached house/bungalow - - - - - Semi-detached house/bungalow
- £69.38 £78.18 £83.95 £86.90
Terraced house/bungalow - £64.66 £79.68 £85.13 £82.37
Flat/Maisonette (2 storeys or less)
- £62.37 - - -
Flat/Maisonette (3 storeys or more)
£62.64 £83.19 - -
Multi-storey flat - £69.60 - - -
Fold
Detached house/bungalow - £74.94 £83.73 £90.00 - Semi-detached house/bungalow
£52.10 £71.56 £80.06 £85.20 £86.56
Terraced house/bungalow £50.50 £70.14 £79.35 £84.62 £84.96
Flat/Maisonette (2 storeys or less)
£44.34 £65.23 £72.14 - -
Flat/Maisonette (3 storeys or more)
£49.90 £67.24 £74.86 - -
Multi-storey flat - - - - - 1 2 3 4 5
Gosford
Detached house/bungalow - £70.58 - - - Semi-detached house/bungalow
- £67.97 £75.62 £68.76 -
Terraced house/bungalow £50.48 £60.41 £69.91 - - Flat/Maisonette (2 storeys or less)
£57.44 £55.05 £69.63 - -
Flat/Maisonette (3 storeys or more)
£38.33 £41.78 - - -
Multi-storey flat - - - - -
Grove
Detached house/bungalow - - - - - Semi-detached house/bungalow
- £65.49 £74.88 - -
Terraced house/bungalow - £63.83 £68.35 £61.09 - Flat/Maisonette (2 storeys or less)
£47.19 £53.48 - - -
Flat/Maisonette (3 storeys or more)
£42.87 £37.75 - - -

133
Table A 3.5: Average decontrolled general needs rent by housing association
Dwelling Size 1 2 3 4 5
Multi-storey flat - - - - -
Habinteg
Detached house/bungalow £72.45 £68.85 £79.94 £84.87 Semi-detached house/bungalow
£58.35 £66.66 £76.21 £81.49 £82.44
Terraced house/bungalow £55.64 £64.31 £75.32 £79.44 £74.12
Flat/Maisonette (2 storeys or less)
£51.21 £61.19 - - -
Flat/Maisonette (3 storeys or more)
£46.26 £55.22 £58.75 - -
Multi-storey flat - - - - -
Harmony
Detached house/bungalow - £64.92 £83.01 £81.57 - Semi-detached house/bungalow
- £66.70 £65.08 - -
Terraced house/bungalow £47.93 £58.71 £68.59 £72.17 £83.04
Flat/Maisonette (2 storeys or less)
£50.90 £56.14 £64.08 - -
Flat/Maisonette (3 storeys or more)
£41.81 £48.52 - - -
Multi-storey flat
- - - - -
Helm
Detached house/bungalow - £74.00 - £88.62 £88.62
Semi-detached house/bungalow
£67.67 £76.29 £83.63 £89.08 £88.46
Terraced house/bungalow £57.89 £58.05 £76.94 £79.79 £86.54
Flat/Maisonette (2 storeys or less)
£59.91 £64.14 - - -
Flat/Maisonette (3 storeys or more)
£48.90 £63.93 £76.53 - -
Multi-storey flat - - - - -
Newington
Detached house/bungalow - - - - - Semi-detached house/bungalow
- £67.60 £80.44 £74.60 -
Terraced house/bungalow - £66.79 £73.91 £70.83 £74.98
Flat/Maisonette (2 storeys or less)
£36.26 £51.27 £45.38 - -
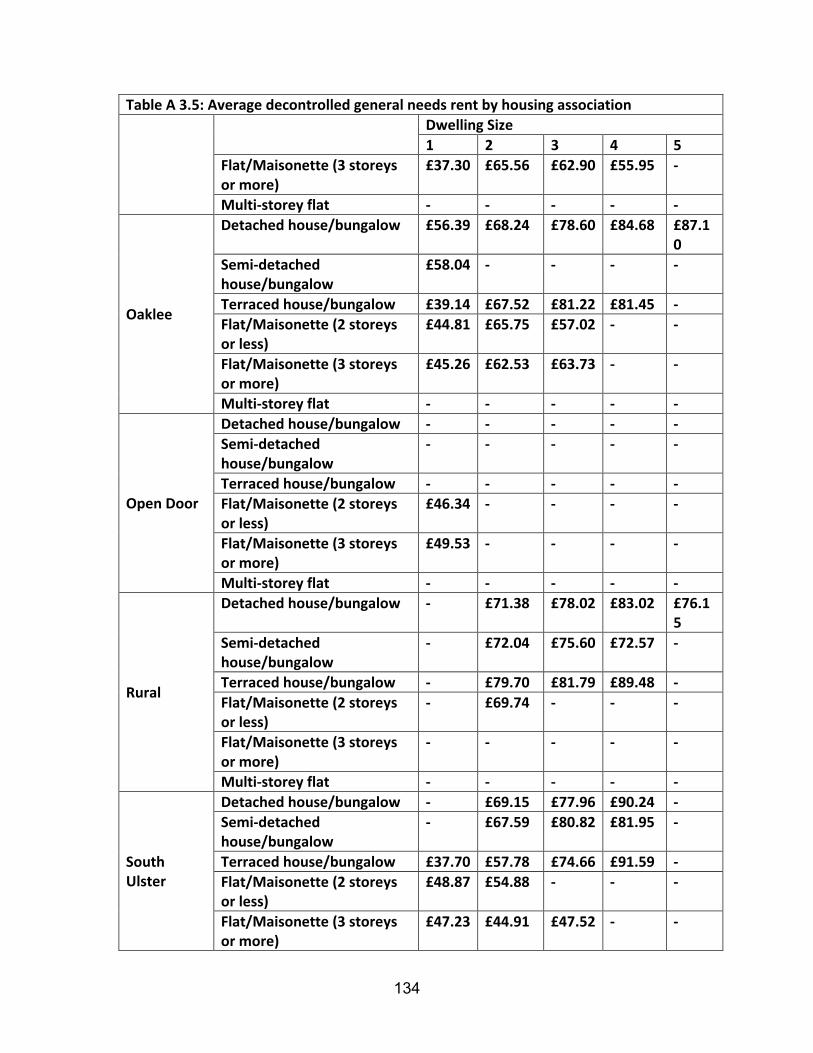
134
Table A 3.5: Average decontrolled general needs rent by housing association
Dwelling Size 1 2 3 4 5
Flat/Maisonette (3 storeys or more)
£37.30 £65.56 £62.90 £55.95 -
Multi-storey flat - - - - -
Oaklee
Detached house/bungalow £56.39 £68.24 £78.60 £84.68 £87.10
Semi-detached house/bungalow
£58.04 - - - -
Terraced house/bungalow £39.14 £67.52 £81.22 £81.45 - Flat/Maisonette (2 storeys or less)
£44.81 £65.75 £57.02 - -
Flat/Maisonette (3 storeys or more)
£45.26 £62.53 £63.73 - -
Multi-storey flat - - - - -
Open Door
Detached house/bungalow - - - - - Semi-detached house/bungalow
- - - - -
Terraced house/bungalow - - - - - Flat/Maisonette (2 storeys or less)
£46.34 - - - -
Flat/Maisonette (3 storeys or more)
£49.53 - - - -
Multi-storey flat - - - - -
Rural
Detached house/bungalow - £71.38 £78.02 £83.02 £76.15
Semi-detached house/bungalow
- £72.04 £75.60 £72.57 -
Terraced house/bungalow - £79.70 £81.79 £89.48 - Flat/Maisonette (2 storeys or less)
- £69.74 - - -
Flat/Maisonette (3 storeys or more)
- - - - -
Multi-storey flat - - - - -
South Ulster
Detached house/bungalow - £69.15 £77.96 £90.24 - Semi-detached house/bungalow
- £67.59 £80.82 £81.95 -
Terraced house/bungalow £37.70 £57.78 £74.66 £91.59 - Flat/Maisonette (2 storeys or less)
£48.87 £54.88 - - -
Flat/Maisonette (3 storeys or more)
£47.23 £44.91 £47.52 - -

135
Table A 3.5: Average decontrolled general needs rent by housing association
Dwelling Size 1 2 3 4 5
Multi-storey flat - - - - -
St Mathew
Detached house/bungalow - - - - - Semi-detached house/bungalow
- - - - -
Terraced house/bungalow £58.61 £63.15 £69.69 £74.58 - Flat/Maisonette (2 storeys or less)
£56.24 - - - -
Flat/Maisonette (3 storeys or more)
£61.26 £55.48 - - -
Multi-storey flat - - - - -
Trinity
Detached house/bungalow - £74.87 £80.10 - - Semi-detached house/bungalow
£57.96 £67.51 £78.78 - -
Terraced house/bungalow - £60.82 £70.93 - - Flat/Maisonette (2 storeys or less)
£52.65 £67.57 - - -
Flat/Maisonette (3 storeys or more)
£51.92 £59.76 £46.69 - -
Multi-storey flat - - - - -
Ulidia
Detached house/bungalow - - £88.15 £95.19 - Semi-detached house/bungalow
- £71.16 £84.52 £87.01 £86.10
Terraced house/bungalow - £71.38 £80.90 £82.91 - Flat/Maisonette (2 storeys or less)
£57.22 £65.54 £76.76 - -
Flat/Maisonette (3 storeys or more)
£58.13 £62.12 £72.95 - -
Multi-storey flat - - - - -
Wesley
Detached house/bungalow - - - - - Semi-detached house/bungalow
- - - - -
Terraced house/bungalow - £70.83 - - - Flat/Maisonette (2 storeys or less)
- £68.60 - - -
Flat/Maisonette (3 storeys or more)
- - - - -
Multi-storey flat - - - - -
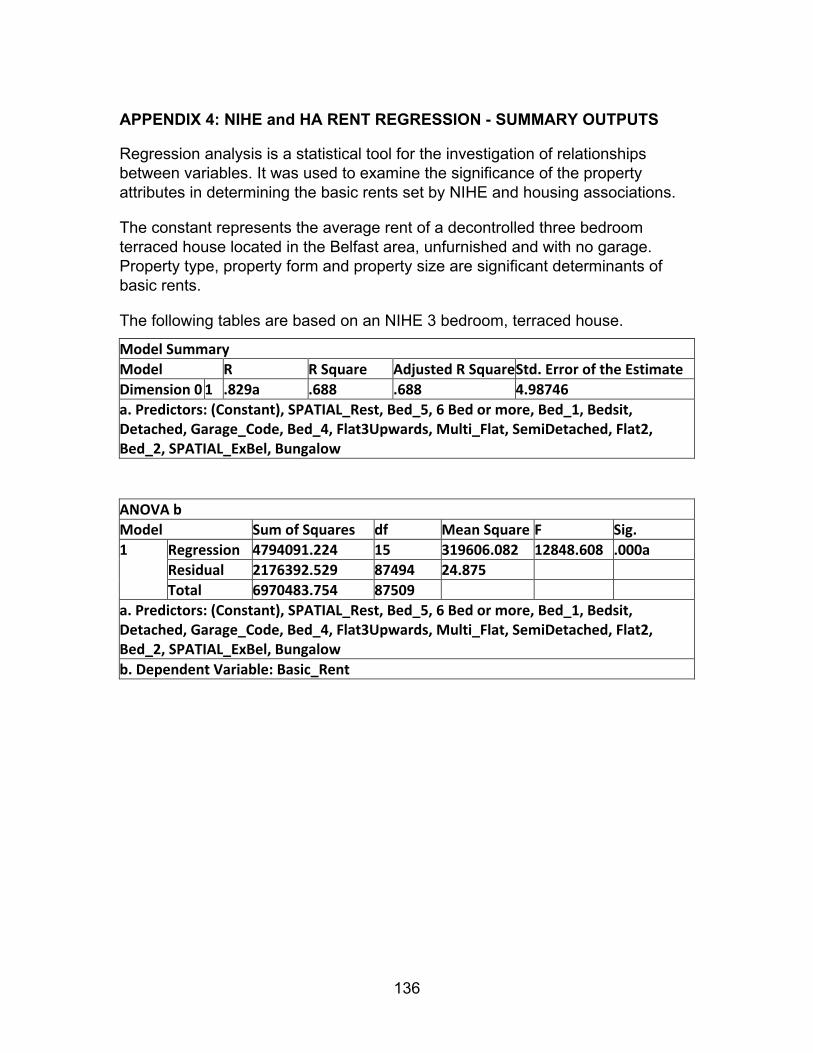
136
APPENDIX 4: NIHE and HA RENT REGRESSION - SUMMARY OUTPUTS
Regression analysis is a statistical tool for the investigation of relationships between variables. It was used to examine the significance of the property attributes in determining the basic rents set by NIHE and housing associations.
The constant represents the average rent of a decontrolled three bedroom terraced house located in the Belfast area, unfurnished and with no garage. Property type, property form and property size are significant determinants of basic rents.
The following tables are based on an NIHE 3 bedroom, terraced house.
Model Summary Model R R Square Adjusted R Square Std. Error of the Estimate Dimension 0 1 .829a .688 .688 4.98746 a. Predictors: (Constant), SPATIAL_Rest, Bed_5, 6 Bed or more, Bed_1, Bedsit, Detached, Garage_Code, Bed_4, Flat3Upwards, Multi_Flat, SemiDetached, Flat2, Bed_2, SPATIAL_ExBel, Bungalow
ANOVA b Model Sum of Squares df Mean Square F Sig. 1 Regression 4794091.224 15 319606.082 12848.608 .000a
Residual 2176392.529 87494 24.875 Total 6970483.754 87509
a. Predictors: (Constant), SPATIAL_Rest, Bed_5, 6 Bed or more, Bed_1, Bedsit, Detached, Garage_Code, Bed_4, Flat3Upwards, Multi_Flat, SemiDetached, Flat2, Bed_2, SPATIAL_ExBel, Bungalow b. Dependent Variable: Basic_Rent

137
Coefficients a Model Unstandardized
Coefficients
Standardized Coefficients t Sig.
B Std. Error Beta 1 (Constant) 61.106 .040 1517.025 .000
Bedsit -26.608 .332 -.152 -80.266 .000 Flat2 -4.913 .063 -.197 -77.776 .000 Flat3Upwards -12.809 .086 -.305 -149.562 .000 Multi_Flat -9.558 .133 -.143 -72.113 .000 Bungalow 1.382 .058 .063 23.800 .000 Detached 2.040 .217 .018 9.409 .000 SemiDetached .328 .050 .013 6.515 .000 Bed_1 -15.149 .072 -.545 -209.467 .000 Bed_2 -7.880 .048 -.431 -163.694 .000 Bed_4 4.733 .084 .109 56.255 .000 Bed_5 6.745 .456 .028 14.789 .000 6 Bed or more 12.193 3.527 .007 3.457 .001 Garage_Code 4.895 .204 .046 24.034 .000 SPATIAL_ExBel -.448 .051 -.021 -8.769 .000 SPATIAL_Rest -.133 .043 -.007 -3.098 .002
a. Dependent Variable: Basic_Rent
The following tables are based on a 3 bedroom, terraced house in respect of all HA general needs decontrolled rents. An important point to highlight here is that in the housing association model, dummy variables are used to differentiate general needs properties that are mixed funded (MF_Rent). The significance of this variable appears to confirm that mixed funding is a significant positive influence on rents set in the Housing Association sector.
Model Summary
Model R R Square Adjusted R Square
Std. Error of the Estimate
Dimension 0 1 .871 .759 .759 7.34368
a. Predictors: (Constant), Type_support, Flat 3+, 6 Bed or More, Part /Fully Furbished, Garage/Car port, Controlled Rent, 5 Bed, Spatial_ExBel, Multi Flat, 4 Bed, Detached, 2 Bed, MF_Rent, Bungalow, Lic _Rent, Semi-detached, Spatial_Rest, Type_sheltered, Flat up 2, Bedsit, 1 Bed
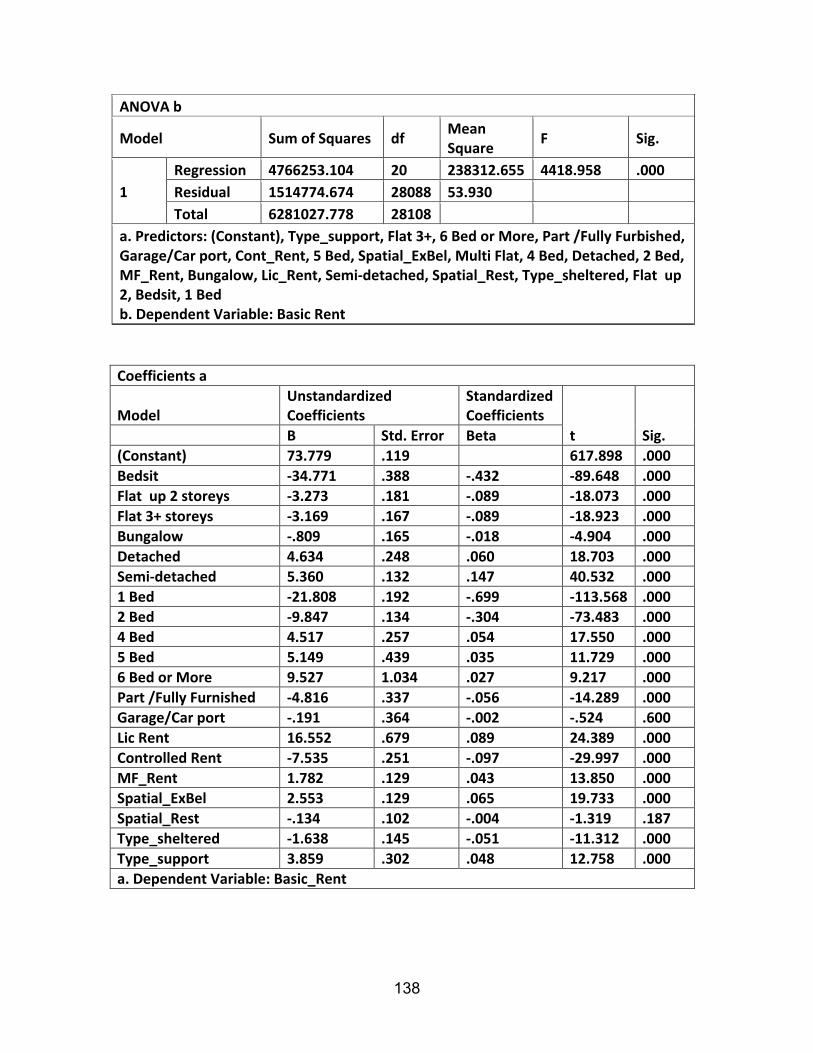
138
ANOVA b
Model Sum of Squares df Mean Square F Sig.
1 Regression 4766253.104 20 238312.655 4418.958 .000 Residual 1514774.674 28088 53.930 Total 6281027.778 28108
a. Predictors: (Constant), Type_support, Flat 3+, 6 Bed or More, Part /Fully Furbished, Garage/Car port, Cont_Rent, 5 Bed, Spatial_ExBel, Multi Flat, 4 Bed, Detached, 2 Bed, MF_Rent, Bungalow, Lic_Rent, Semi-detached, Spatial_Rest, Type_sheltered, Flat up 2, Bedsit, 1 Bed b. Dependent Variable: Basic Rent
Coefficients a
Model Unstandardized Coefficients
Standardized Coefficients
t Sig. B Std. Error Beta (Constant) 73.779 .119 617.898 .000 Bedsit -34.771 .388 -.432 -89.648 .000 Flat up 2 storeys -3.273 .181 -.089 -18.073 .000 Flat 3+ storeys -3.169 .167 -.089 -18.923 .000 Bungalow -.809 .165 -.018 -4.904 .000 Detached 4.634 .248 .060 18.703 .000 Semi-detached 5.360 .132 .147 40.532 .000 1 Bed -21.808 .192 -.699 -113.568 .000 2 Bed -9.847 .134 -.304 -73.483 .000 4 Bed 4.517 .257 .054 17.550 .000 5 Bed 5.149 .439 .035 11.729 .000 6 Bed or More 9.527 1.034 .027 9.217 .000 Part /Fully Furnished -4.816 .337 -.056 -14.289 .000 Garage/Car port -.191 .364 -.002 -.524 .600 Lic Rent 16.552 .679 .089 24.389 .000 Controlled Rent -7.535 .251 -.097 -29.997 .000 MF_Rent 1.782 .129 .043 13.850 .000 Spatial_ExBel 2.553 .129 .065 19.733 .000 Spatial_Rest -.134 .102 -.004 -1.319 .187 Type_sheltered -1.638 .145 -.051 -11.312 .000 Type_support 3.859 .302 .048 12.758 .000 a. Dependent Variable: Basic_Rent

139
APPENDIX 5: SERVICE CHARGES
Table A 4.1: HA decontrolled basic and gross weekly rent eligible for HB, disaggregated by provision type
General Needs Sheltered Supported
Basic Rent
HB eligible service charge
Gross Rent eligible for HB
Basic Rent
HB eligible service charge
Gross Rent eligible for HB
Basic Rent
HB eligible service charge
Gross Rent eligible for HB
Bedsit
Number 6 6 6 2 2 2 317 317 317 Mean £56.75 £4.46 £61.21 £32.06 £21.48 £53.54 £47.62 £3.56 £51.18 Median £62.84 £0.00 £62.84 £32.06 £21.48 £53.54 £48.18 £0.00 £51.29 Range £35.15 £13.38 £21.77 £0.00 £0.00 £0.00 £49.73 £25.27 £49.73 Minimum £35.74 £0.00 £49.12 £32.06 £21.48 £53.54 £29.53 £0.00 £29.53 Maximum £70.89 £13.38 £70.89 £32.06 £21.48 £53.54 £79.26 £25.27 £79.26
1 bedroom
Number 1,442 1,442 1,442 7,232 7,232 7,232 357 357 357 Mean £49.22 £11.45 £60.67 £48.02 £18.93 £66.95 £50.36 £16.08 £66.43 Median £47.41 £10.00 £58.25 £48.09 £19.42 £65.77 £49.53 £14.50 £63.16 Range £52.28 £58.76 £89.52 £40.98 £40.00 £48.29 £55.08 £58.76 £74.11 Minimum £29.89 £0.00 £29.89 £32.63 £0.00 £42.39 £28.70 £0.00 £32.21 Maximum £82.17 £58.76 £119.41 £73.61 £40.00 £90.68 £83.78 £58.76 £106.32
2 bedroom Number 6,502 6,502 6,502 1,076 1,076 1,076 105 105 105 Mean £65.97 £2.77 £68.74 £61.58 £13.34 £74.92 £62.48 £20.16 £82.63 Median £66.61 £0.00 £68.93 £61.21 £12.85 £75.28 £59.12 £14.97 £76.46
Range £61.55 £58.76 £81.66 £37.09 £34.97 £43.80 £29.10 £64.98 £69.44 Minimum £34.56 £0.00 £37.75 £45.08 £0.00 £55.61 £48.31 £0.00 £49.97 Maximum £96.11 £58.76 £119.41 £82.17 £34.97 £99.41 £77.41 £64.98 £119.41
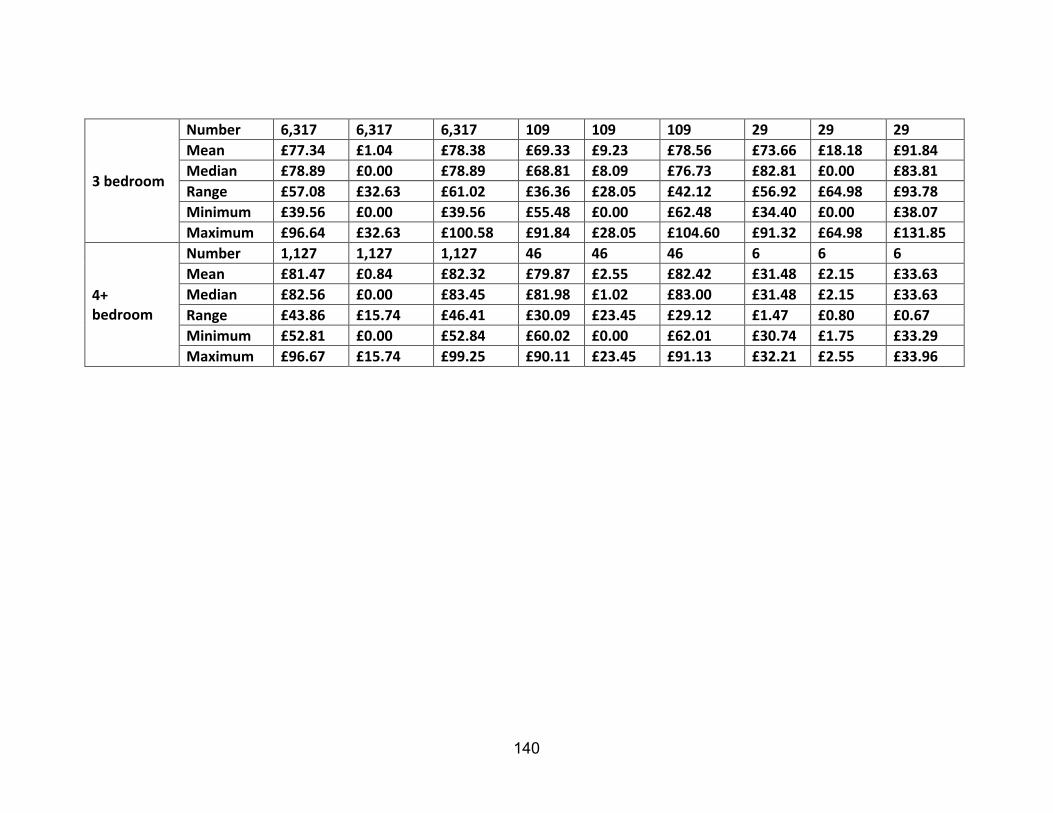
140
3 bedroom
Number 6,317 6,317 6,317 109 109 109 29 29 29 Mean £77.34 £1.04 £78.38 £69.33 £9.23 £78.56 £73.66 £18.18 £91.84 Median £78.89 £0.00 £78.89 £68.81 £8.09 £76.73 £82.81 £0.00 £83.81 Range £57.08 £32.63 £61.02 £36.36 £28.05 £42.12 £56.92 £64.98 £93.78 Minimum £39.56 £0.00 £39.56 £55.48 £0.00 £62.48 £34.40 £0.00 £38.07 Maximum £96.64 £32.63 £100.58 £91.84 £28.05 £104.60 £91.32 £64.98 £131.85
4+ bedroom
Number 1,127 1,127 1,127 46 46 46 6 6 6 Mean £81.47 £0.84 £82.32 £79.87 £2.55 £82.42 £31.48 £2.15 £33.63 Median £82.56 £0.00 £83.45 £81.98 £1.02 £83.00 £31.48 £2.15 £33.63 Range £43.86 £15.74 £46.41 £30.09 £23.45 £29.12 £1.47 £0.80 £0.67 Minimum £52.81 £0.00 £52.84 £60.02 £0.00 £62.01 £30.74 £1.75 £33.29 Maximum £96.67 £15.74 £99.25 £90.11 £23.45 £91.13 £32.21 £2.55 £33.96


![siemens.com/sirius · Class 10 Coil voltage Auxiliary switch Thermally delayed Electronic Mea- suring range Basic Analog setting Standard Digital setting Power [kW] Cur-rent [A] [A]](https://img.dokumen.tips/doc/110x75/5f2929897ff4df371a595d95/class-10-coil-voltage-auxiliary-switch-thermally-delayed-electronic-mea-suring.jpg)