Embed Size (px)
Citation preview

www.eidebai l ly.comwww.eidebai l ly.com 1
~Becoming a patient focused but metrics driven
Revenue Cycle team~
Revenue Cycle Management
Presented by:
Kimberly MooreDirector, Health Care Revenue Cycle Consulting

www.eidebai l ly.comwww.eidebai l ly.com
Revenue Cycle Metrics:
2

www.eidebai l ly.comwww.eidebai l ly.com
Why Measure?

www.eidebai l ly.comwww.eidebai l ly.com
Why Measure?
• The old saying is correct: “What get’s measured, get’s improved”
• Providing managers and staff with accurate, intuitive and easily
interpretable data is one-third of the recipe for improvement. The other
key ingredients are alignment with strategic objectives and a system for
accountability.
• Accurately implement those items that will drive improvement vs.
implementing for implementation sake.
• Heightened awareness of accountability and transparency when
communicated at the proper levels with in the team.
• To move from, not just Good to Great but from Great to Excellent!!!

www.eidebai l ly.comwww.eidebai l ly.com
• Do you ever look at your Revenue Cycle and ask
yourself:
• How do top performing hospitals become top performing
hospitals?
• How can I ensure the best quality processes are in
place?
• How can I engage leadership and my team to move
toward the same goals?
• The simple answer – MEASURE TO IMPROVE
but remember measurement with out accountability
is ineffective.
Reflect for a moment:

www.eidebai l ly.comwww.eidebai l ly.com
How to get started?
• Educate first - help your team understand your direction.• Define: Never assume that everyone understands the
acronyms you might use.
• Remember not everyone understands metrics or how they effect their performance.
• Get feedback from the team – they know their challenges and have ideas about what they would like to have improved.
• Identify those metrics that you will measure and communicate them with your team.• Always explain ‘Individual Accountability’ – what can they do to
help improve. What will happen if they do not.
• Tie Process improvement to incentives.
www.eidebai l ly.comwww.eidebai l ly.com
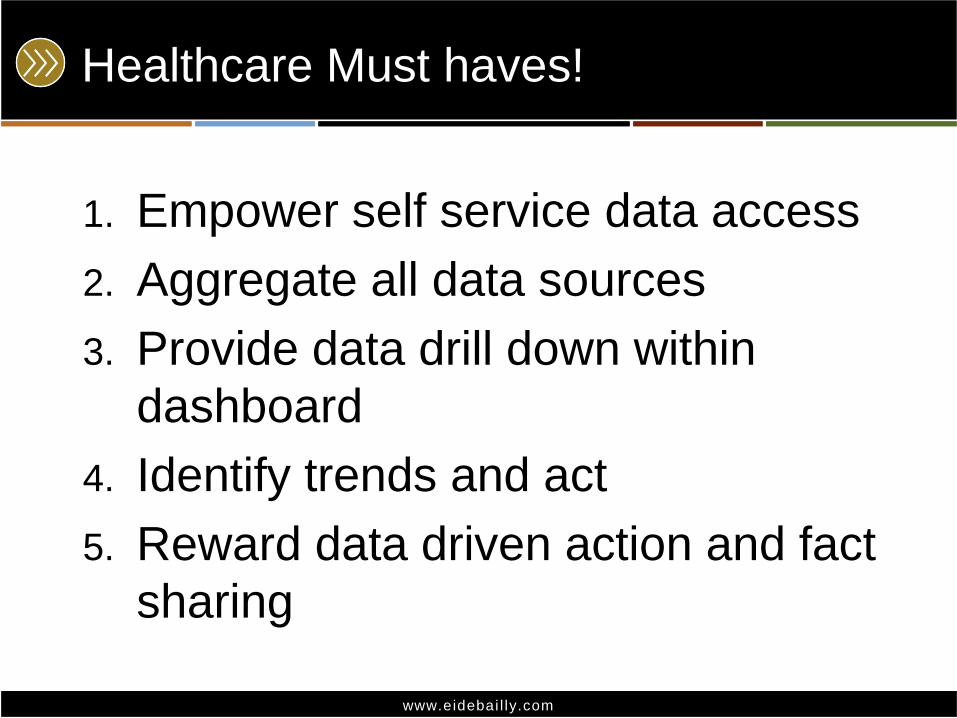
Healthcare Must haves!
1. Empower self service data access
2. Aggregate all data sources
3. Provide data drill down within
dashboard
4. Identify trends and act
5. Reward data driven action and fact
sharing

www.eidebai l ly.comwww.eidebai l ly.com
Influence the Culture
• Revenue Cycle Leaders that influence a culture, driven by performance standards, backed by real data, create positive change.
• Leaders that share realistic goals with their teams and help them understand:• How their goals are established
• How Individual Accountability is just as important to ones self as it is to overall good of their team and the hospital over-all.
• That to support the team, management will have real-time course correction plans to influence improvement.
• That progress will be measured daily/weekly/monthly
• That Management will Report positive as well as negative results with Senior Leadership as well as the entire team.
• That there will be accountability for all actions taken and those missed.
• Everyone can be a “leader” for change.

www.eidebai l ly.comwww.eidebai l ly.com
User community adoption – viral use!
“ The old approach to business intelligence
confirms what we know. Now departments
throughout the hospital can ask the question,
‘What am I trying to accomplish?’ and explore
what they don’t know.”
-Ted Corbett, Director of Knowledge
Management, Seattle Children’s Hospital

www.eidebai l ly.comwww.eidebai l ly.com
Senior Leadership
• In High Performing Hospitals’ Senior
Leadership publicly support the notion that the
Revenue Cycle is not a “money thing” it is a
hospital wide responsibility as well as a patient
responsibility.
• When leadership shows support, positive
change can happen. Invite your CFO to your
meetings.
CFO’s…attend when you can.

www.eidebai l ly.comwww.eidebai l ly.com
Organizational Structure
Structure
• Do you have a functional organizational structure
with Key Revenue Cycle leaders?
• Has the structure been clearly communicated to
staff?
• Does leadership support the Revenue Cycle’s
operating model and objectives?
• Are the Revenue Cycle objectives in line with the
facilities strategies?
• Does Leadership communicate expectations,
opportunities and successes with the staff?
11

www.eidebai l ly.comwww.eidebai l ly.com
What to Measure:
Pre-Reg. Rates and
Financial Clearance
Registration accuracy
Ins Verification Rates
Service Auth. Rates
POS Cash Collections
POS – Prior Balance collection %
Cash Collections as % Net /Gross
SP Conversion Rates
DNFB
DNSP
Late Charges
Credits
Case Mix
Payer Mix
Patient Satisfaction scores
Vendor (Net Back %)
Gross Days Revenue Outstanding
Net Revenue outstanding
Gross to Net Revenue Ratio
Un-collectibles
Days from Discharge to Bill
Aged AR from Discharge
Self Pay Revenue and Self Pay AR
Medicare, Medicaid Managed Care, Other Sources Revenue and AR
# of Open Accounts and per collector
Cost to Collect
Denials % GR
Denial over-turned %
Payer Rejects as % of Remit Revenue processed

www.eidebai l ly.comwww.eidebai l ly.com
Measurements
Hospitals Nationwide
1. Gross Days
Revenue
Outstanding
Benchmark: 60 days
2. Gross % of
Revenue as Un-
collectible
Benchmark: 5%
3. Days from
Discharge to bill
Benchmark: 10 days
4. A/R > 90 days
Benchmark: 25 days
or Less
49.73 Days
5.37%
13.12 Days
24.33 Days
Metric/Benchmark

www.eidebai l ly.comwww.eidebai l ly.com
Measurements
Hospitals Nationwide
5. % A/R in SP
6. % Gross SP Revenue
7. % A/R MDCR
8. % Gross MDCR Rev.
9. % A/R MDCD
10. % Gross MDCD Rev.
17.11 %
5.03 %
29.88 %
42.50 %
12.43 %
12.50 %
Metric/Benchmark

www.eidebai l ly.comwww.eidebai l ly.com
Measurements
Hospitals Nationwide
11. % A/R Commercial
12. % Gr. Commercial Rev
13. % A/R Managed
14. % Gross Managed Rev
15. % A/R Other
16. % Gross Other Rev
8.20 %
6.16 %
25.48 %
27.02 %
9.54 %
4.86 %
Metric/Benchmark
www.eidebai l ly.comwww.eidebai l ly.com
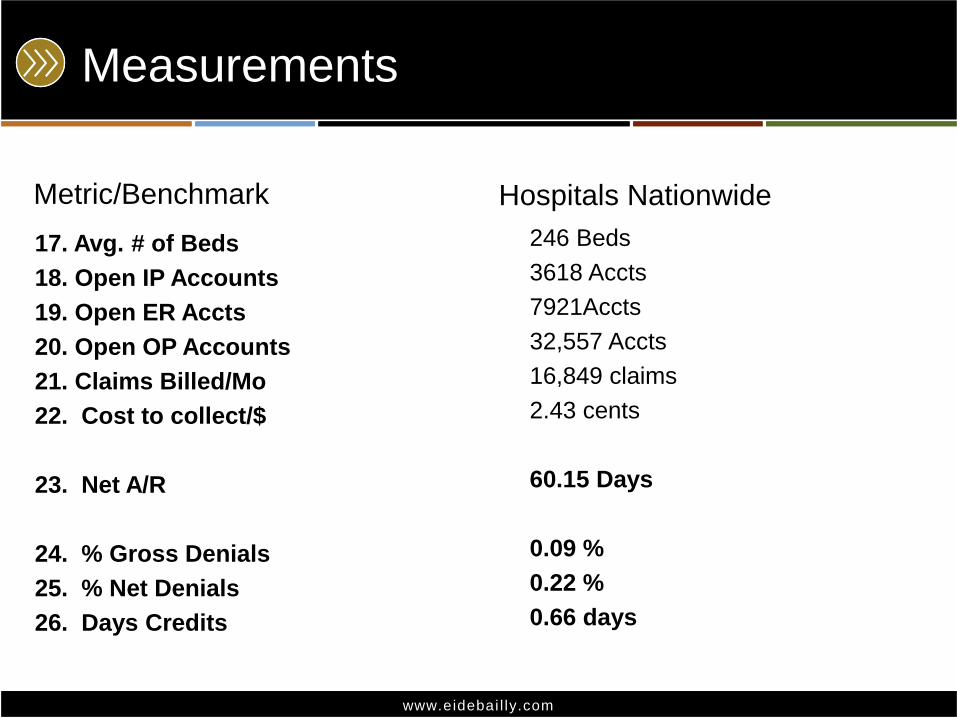
Measurements
Hospitals Nationwide
17. Avg. # of Beds
18. Open IP Accounts
19. Open ER Accts
20. Open OP Accounts
21. Claims Billed/Mo
22. Cost to collect/$
23. Net A/R
24. % Gross Denials
25. % Net Denials
26. Days Credits
246 Beds
3618 Accts
7921Accts
32,557 Accts
16,849 claims
2.43 cents
60.15 Days
0.09 %
0.22 %
0.66 days
Metric/Benchmark

www.eidebai l ly.comwww.eidebai l ly.com
Become a Metric Driven Organization
(BYODB) Before You Open Daily Business
• This is both a tool and an advanced approach for
Measurement of daily KPI’s
• This tool is used daily at a payer level
• This document is used to guide each functional area
of the Revenue Cycle
• BYODB manages away “surprises” that would
normally create chaos for Finance and the Revenue
Cycle Team at month end.
Examples: Turn over rates, Net Days to Target days, DNFB to target, Cash to target, Cash Acceleration
Opportunities, Net to Gross %, Conversion rates, Erosion Rates to target, Contractual to Target, CWOT, POS
to total Cash and to total expected, % of financially cleared accounts prior to admission…
17

Month/Yr
UB:FB as %
Gross Rev
Ratio
Conversion
Rate: UB:FB
%
Conversion
Rate of
Gross
Revenue %
Adj. as % of
Conversion Rate
Net Net A/R
Factor
Beginning of
Month
Net Net
AR
Factor
MTD
November-09 102.2% 98.3% 100.4% 52.6% 56.8% 54.6% BD Transfers $1,483,606
October-09 107.6% 90.2% 97.0% 57.9% 54.3% 56.8%BD Recoveries $65,802.00
September-09 96.5% 102.3% 98.7% 58.2% 56.8% 54.3%
BD Less
Recoveries/ Gross
Revenue 11.6%
August-09 93.2% 102.8% 95.8% 57.5% 53.6% 56.8%
Gross Denial Rate tbd
Denial Recoveries tbd
Net Denial Rate tbd
Days in Revenue Outstanding Net Denial Impact tbd
Month/Yr Gross Days Net DaysDNFB Net
Days
Delayed Cash
Opportunity Do to
Unbilled beyond
suspense
Days in Credit
Balances
Medicare
Net Days
Self Pay
Net Days
November-09 51.5 64.8 9.6 $1,904,836 tbd 37.9 443.4
October-09
53.2 66.6 9.7 $1,471,617 tbd 24.5 441.9
Cash MTD $4,722,016.00
September-0949.9 63.4 10.9 $1,909,272 tbd 23.9 465.2
Cash Target $9,049,682.00
August-09 49.6 63.8 7.6 $1,647,177 tbd 30.3 477.1 Variance MTD $4,327,665.00
Rolling Target $6,033,121.00
Notes: Cash MTD
Rolling Variance -$1,311,105.00
Other Operating Statistics
Month/Yr Revenue ADGR ADNR Gross A/R Net A/R
Net to
Gross %
Adj. As %
of Gross
Revneue
BD as % Gross
Rev
Charity Care
Adj as % Gross
Rev A/R > 90 as $
AR > 90 as %
total A/R
November-09 $12,834,442 $764,193 $331,647 $40,563,954 $22,149,715 54.6% 52.8% 11.6% 2.1% $13,805,096 35.5%
October-09 $22,755,934 $764,193 $331,647 $40,532,916 $22,194,385 54.8% 56.2% 3.6% 1.3% $14,016,461 36.3%
September-09 $22,611,000 $786,947 $342,353 $39,828,655 $22,025,547 54.3% 57.5% 2.6% 2.0% $13,774,462 34.6%
Notes:
Notes:
Income Stmt & Cash
Income Statement
Imparatives
Bad Debt
Denials
Key Ratios

Business Intelligence Impacts!
1. Hospitals have uncovered underlying, recurring issues with claims processing that have let them proactively identify claims that need a different level of attention to be processed on time.
2. Clinics have uncovered service providers who are not assigning correct services and taken corrective action.
3. Physicians running studies are identifying patients who not only have not been adhering to protocols, but glean insight as to the possible reasons behind this to take action.

Scenario– Hospital Profitability

Charges vs. Collections

Charge Detail Information

www.eidebai l ly.comwww.eidebai l ly.com
Front End : Revenue Cycle Metrics
Pre-Registration Rate:
This indicator will show the timeliness, accuracy and efficiencies of your Patient
Access processes. To Pre-Register an account allows the facility to gather data
prior to the patients appointment date. It also allows for a more timely registration
process and patient flow at the time of service.
Equation: # of patient encounters pre-registered
# of scheduled patient encounters
Insurance Verification Rate:
This indicator also shows the timeliness, accuracy and efficiencies of your Patient
Access processes. Insurance regulations, changes in coverage and employer cost
cutting initiatives are just a few issues that are uncovered during an insurance
verification encounter. Discussions with the carrier and/or the patient prior to
services rendered can eliminate issues on payment receipt on the back end of the
revenue cycle where you are less likely to be able to collect.
Equation: Total number of verified encounters
Total number of registered encounters

www.eidebai l ly.comwww.eidebai l ly.com
Front End: Revenue Cycle Metrics
Service Authorization Rate:
This indicator also shows the timeliness, accuracy and efficiencies of your Patient
Access processes. Many carriers require Authorization be obtained prior to
services being rendered. This indicator will reflect only those services that are on
the schedule. Keep in mind that if changes are made in the clinical setting with out
notice to the Authorization team, you may need to implement a new process.
Equation: number of encounters authorized
number of encounters requiring authorization
Cash Collection as a % of Adjusted net Patient Service Revenue:
Indicator to accurately report effectiveness for converting Patient Service Revenue into
Cash. The Value of this indicator is it indicates fiscal integrity/financial health of the
facility.
Equation: Total Cash Collected
Average Monthly Net Revenue

www.eidebai l ly.comwww.eidebai l ly.com
Front End: Revenue Cycle Metrics
Point-of-Service (POS) Cash Collections:
Trending of POS efforts. Implementation of POS Collections should be considered at
each facility. The Value of this measurement is to identify potential exposure to Bad
Debt, accelerates cash collections, and can reduce collection costs. POS might be
defined as any payment received Prior to, at or with in 7-10 business days post Date
of service.
Equation: POS Payments Received
Total patient cash collected
Pre and Point of Service Self Pay A/R Collections:
This metric may take a bit more manual figuring, however, it is an indicator that the
Revenue Cycle team is taking a holistic approach looking at past accounts and
creating “Consumer Accountability”
Equation: Total Cash Collected on A/R
Total $ in Self Pay A/R for scheduled patients
www.eidebai l ly.comwww.eidebai l ly.com
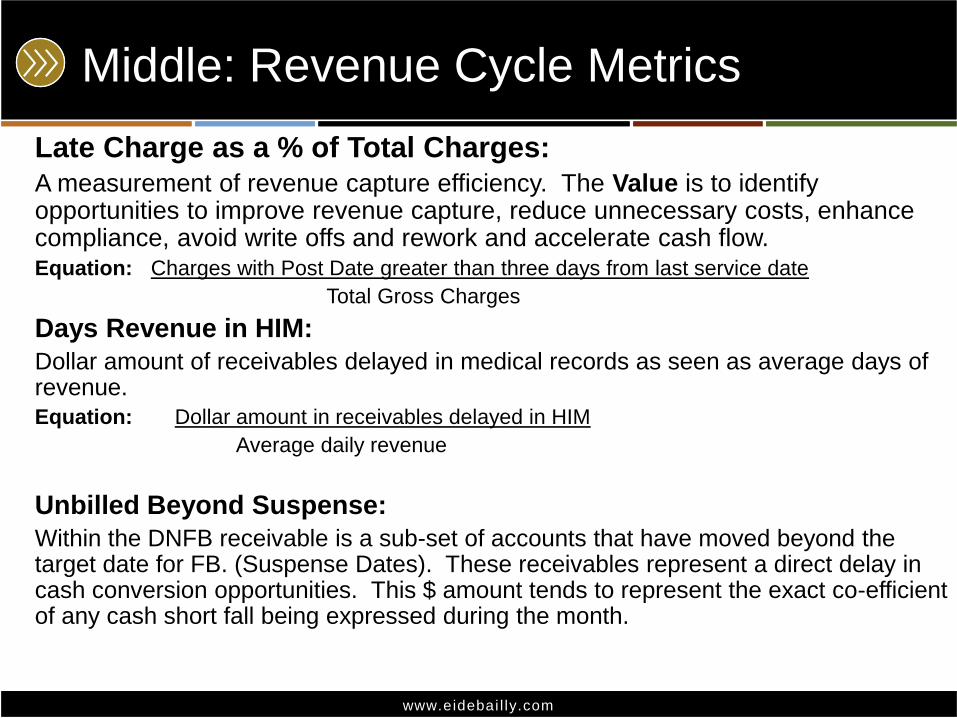
Middle: Revenue Cycle Metrics
Late Charge as a % of Total Charges:
A measurement of revenue capture efficiency. The Value is to identify opportunities to improve revenue capture, reduce unnecessary costs, enhance compliance, avoid write offs and rework and accelerate cash flow.Equation: Charges with Post Date greater than three days from last service date
Total Gross Charges
Days Revenue in HIM:
Dollar amount of receivables delayed in medical records as seen as average days of revenue.
Equation: Dollar amount in receivables delayed in HIM
Average daily revenue
Unbilled Beyond Suspense:
Within the DNFB receivable is a sub-set of accounts that have moved beyond the target date for FB. (Suspense Dates). These receivables represent a direct delay in cash conversion opportunities. This $ amount tends to represent the exact co-efficient of any cash short fall being expressed during the month.

www.eidebai l ly.comwww.eidebai l ly.com
Middle: Revenue Cycle Metrics
Discharged Not Final Billed (DNFB) Rate:
This is an indicator of charts that have not yet been finalized coding, documentation
deficiencies, physician queries etc. a charts on hold report should be reviewed to
identify coder performance, provider performance, departmental performance
(charges not entered timely), system issues that are causing charts to remain on hold
vs. moving to your billing department and/or your business office may be slow in
billing claims. It can identify performance issues impacting cash flow.
Equation: Gross Dollars in A/R (Not Final Billed)
Average Daily Gross Revenue
Average Discharge to Bill time:
Discharge to Final Bill Days. Be sure to factor in any delays with in your editor. Use
in-patient claims only.
Medicare Equation: Average # of calendar days from Discharge to Billing Medicare
All others Equation: Average # of calendar days from Discharge to Billing Others

www.eidebai l ly.comwww.eidebai l ly.com
Middle & Back: Revenue Cycle
MetricsDischarged not Sent to Payer (DNSP) Rate:
This indicator is used to identify claims that have not been sent to the payer. It includes (FBNE) Final Billed Not Edited (bills held in your claim editor for various reasons) and DNFB accounts.
This equation is not always identified in your host system, in some cases the account will show as billed but is actually stuck in your editor. Be sure to pull reports from your Claims Editor system.
FBNE as % of total claims: FBNE: Total # Claims on Hold in Editor
Total # of claims submitted
Plus
DNFB as % of Gross Revenue: Gross Dollars in A/R (Not Final Billed)
Average Daily Gross Revenue
DNSP: Total Gross Discharged Unbilled (DNFB $ + FBNE $)
Average Daily Gross Revenue
www.eidebai l ly.comwww.eidebai l ly.com
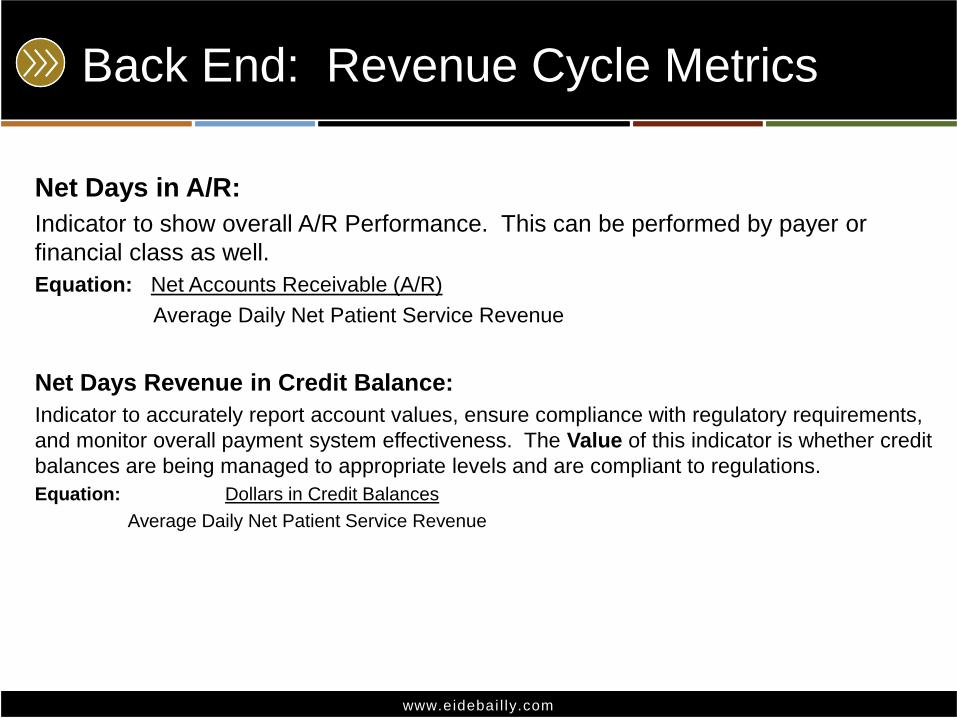
Back End: Revenue Cycle Metrics
Net Days in A/R:
Indicator to show overall A/R Performance. This can be performed by payer or
financial class as well.
Equation: Net Accounts Receivable (A/R)
Average Daily Net Patient Service Revenue
Net Days Revenue in Credit Balance:
Indicator to accurately report account values, ensure compliance with regulatory requirements,
and monitor overall payment system effectiveness. The Value of this indicator is whether credit
balances are being managed to appropriate levels and are compliant to regulations.
Equation: Dollars in Credit Balances
Average Daily Net Patient Service Revenue

www.eidebai l ly.comwww.eidebai l ly.com
Back End: Revenue Cycle Metrics
Financial Class or payer AR as a % of Total AR:
This metric will show you well performing payers and those that may need to be
reviewed. At a minimum Revenue Cycle leadership should meet with top payers to
discuss process and payment improvement. Be sure to have either feedback or
personal representation from those who work closest with the payer.
Equation: Total $ amount in Self-Pay:Medicare:Medicaid:Managed Care:Commercial:Other
Total $’s in Open A/R
Aged Accounts Receivable as a % of Billed A/R:
This indicator is used to identify receivable collectability and indicates the revenue cycle’s ability
to liquidate A/R. This can also be used to identify Payer or financial class %’s.
Equation: >30,>60,>90,>120 days
Total Billed A/R

www.eidebai l ly.comwww.eidebai l ly.com
Back End: Revenue Cycle Metrics
Average Daily Gross Revenue:Equation: Gross Revenue
Days in a quarter
Gross Days Revenue Outstanding:Equation: Total $ amount in open A/R
Average Daily Revenue
Cost To Collect:
Operational Performance with in the Revenue Cycle. Indicates efficiency and productivity with in the processes. It is recommended that you include: staff members performing insurance billing and verification, patient account representatives, cashiers and cash application staff, refund staff, financial counselors, pre-registration, pre-certification, and POS registration staff, collectors, managers and supervisors involved in these areas. Be sure to include temporary staff costs and outsourced costs. Do not include UR, coding, HIM.
Equation: $ Amount of Total YTD Revenue Cycle Expenses
$ Amount of Total Cash Collected YTD

www.eidebai l ly.comwww.eidebai l ly.com
Self Pay: Revenue Cycle Metrics
Total Un-collectibles:
This indicator will show the total dollars for services rendered that were not collectable. It is an indicator that shows both exposure to Bad Debt and the importance of a Pre-Service Financial Clearance process.
Equation: Total Gross $’s of Bad Debt + Charity
Total Gross Revenue YTD
*Avoidable Denials can be grouped here as well
Charity as a % of Uncompensated Care
Monitor Charity Care Versus Bad Debt. The Value is a reflection of community service.
Equation: Charity Care Write-off amount
Total uncompensated care (Bad Debt + Charity Care)
Conversion Rate of Uninsured Inpatient to Payer Source:
Trending indicator of qualifying uninsured inpatients for a funding source. The Value Indicates the facilities ability to secure funding for uninsured patients.
Equation: Total number of cases approved
Total uninsured inpatient discharges

www.eidebai l ly.comwww.eidebai l ly.com
Self Pay: Revenue Cycle Metrics
Bad Debt:
Trending indicator of the effectiveness of Self-Pay collection efforts and financial
counseling. It indicates the facilities ability to collect self-pay accounts and identify
payer sources for those who can not meet their financial obligations.
Equation: Total Gross $’s of Bad Debt Write-Offs
Total Gross Patient Service Revenue (YTD)
Charity Care:
Indicator of community’s ability to pay. It shows services provided to patients that
were unable to pay.
Equation: Total Gross $’s of Charity Care Write-Off
Total Gross $’s of Patient Service Revenue (TYD)

www.eidebai l ly.comwww.eidebai l ly.com
Staff: Revenue Cycle Metrics
Staff Ratios:
A/R Accounts per Biller FTE
Equation: Total Open Accounts
Number of Billers
Total Claims per Biller FTE
Equation: Claims Billed per Month
Number of Billers
Total Accounts per Collector FTE
Equation: Total Open Accounts
Number of Collectors
Business Office open accounts per FTE
Equation: Total Open accounts
Total A/R Management FTE HFMA MAP Keys

www.eidebai l ly.comwww.eidebai l ly.com
Disclaimer
These seminar materials are intended to provide the seminar participants with guidance in Health Care Revenue Cycle matters. The materials do not constitute, and should not be treated as professional advice regarding the use of any particular Revenue Cycle technique or the consequences associated with any technique. Every effort has been made to assure the accuracy of these materials. Eide Bailly LLP. and the author do not assume responsibility for any individual's reliance upon the written or oral information provided during the seminar. Seminar participants should independently verify all statements made before applying them to a particular fact situation, and should independently determine the correctness of any particular insert subject matter planning technique before recommending the technique to a client or implementing it on the client's behalf.
35