Embed Size (px)
Citation preview
www.eidebai l ly.comwww.eidebai l ly.com 1
Account Management: Move from Denial Management to
Denial Avoidance with Process Improvement
Revenue Cycle Management
Presented by:
Kimberly MooreDirector, Health Care Revenue Cycle Consulting

www.eidebai l ly.comwww.eidebai l ly.com
Putting it together
2
www.eidebai l ly.comwww.eidebai l ly.com
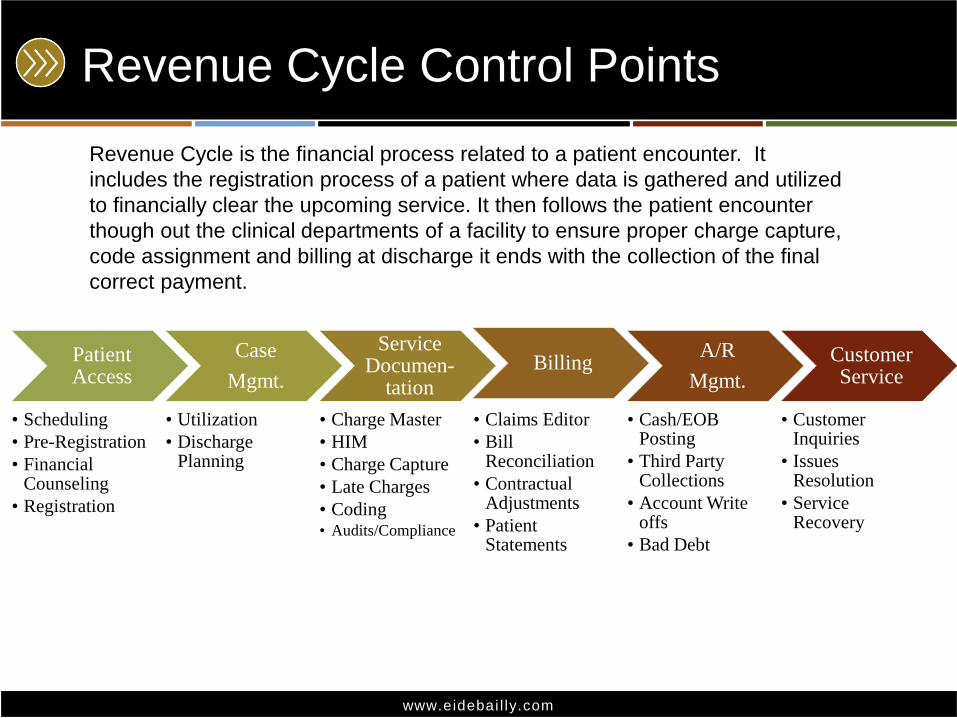
Patient Access
• Scheduling
• Pre-Registration
• Financial Counseling
• Registration
Case
Mgmt.
• Utilization
• Discharge Planning
Service Documen-
tation
• Charge Master
• HIM
• Charge Capture
• Late Charges
• Coding• Audits/Compliance
Billing
• Claims Editor
• Bill Reconciliation
• Contractual Adjustments
• Patient Statements
A/R
Mgmt.
• Cash/EOB Posting
• Third Party Collections
• Account Write offs
• Bad Debt
Customer Service
• Customer Inquiries
• Issues Resolution
• Service Recovery
Revenue Cycle Control Points
Revenue Cycle is the financial process related to a patient encounter. It
includes the registration process of a patient where data is gathered and utilized
to financially clear the upcoming service. It then follows the patient encounter
though out the clinical departments of a facility to ensure proper charge capture,
code assignment and billing at discharge it ends with the collection of the final
correct payment.
www.eidebai l ly.comwww.eidebai l ly.com
Policies
• Create policies that support the process
• Train your team to follow the policy and process
• Ensure them that you will support sound decisions
based upon the policy.
• Outline a path for escalation if needed
4
www.eidebai l ly.comwww.eidebai l ly.com
• Dispositional Receivables Management
• Payer Score Cards
• Understanding your payer contracts
• Understanding your rights as a provider
• Follow up with “intention” not just “claims
status”
5
Insurance Billing and Follow up Using the Score
Card
www.eidebai l ly.comwww.eidebai l ly.com
Payer Score Card
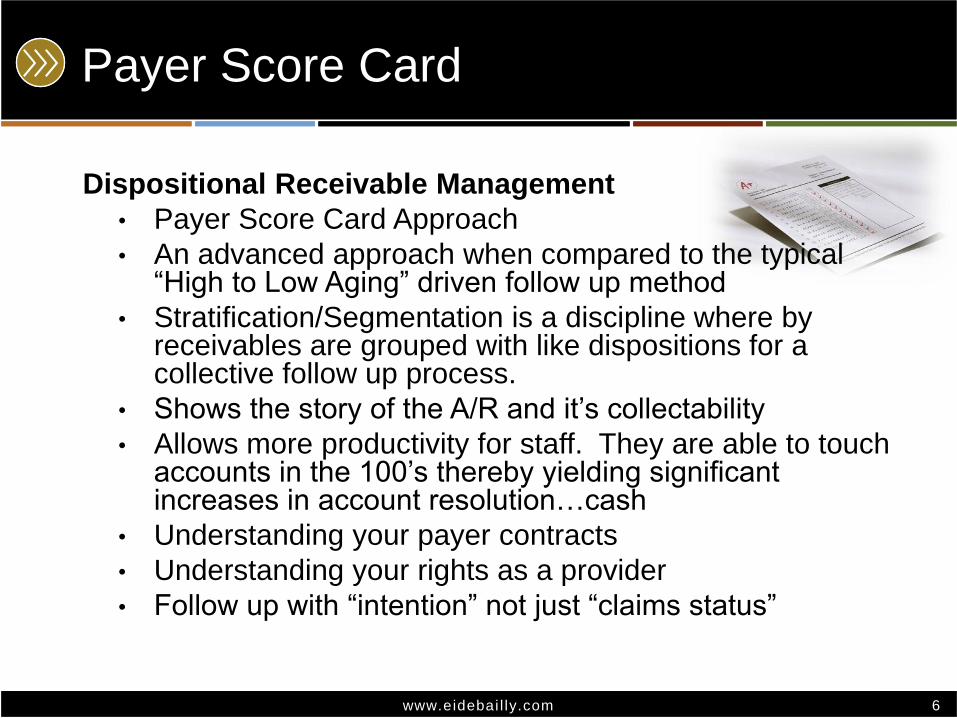
Dispositional Receivable Management
• Payer Score Card Approach
• An advanced approach when compared to the typical “High to Low Aging” driven follow up method
• Stratification/Segmentation is a discipline where by receivables are grouped with like dispositions for a collective follow up process.
• Shows the story of the A/R and it’s collectability
• Allows more productivity for staff. They are able to touch accounts in the 100’s thereby yielding significant increases in account resolution…cash
• Understanding your payer contracts
• Understanding your rights as a provider
• Follow up with “intention” not just “claims status”
6
www.eidebai l ly.comwww.eidebai l ly.com
Payer Score Card
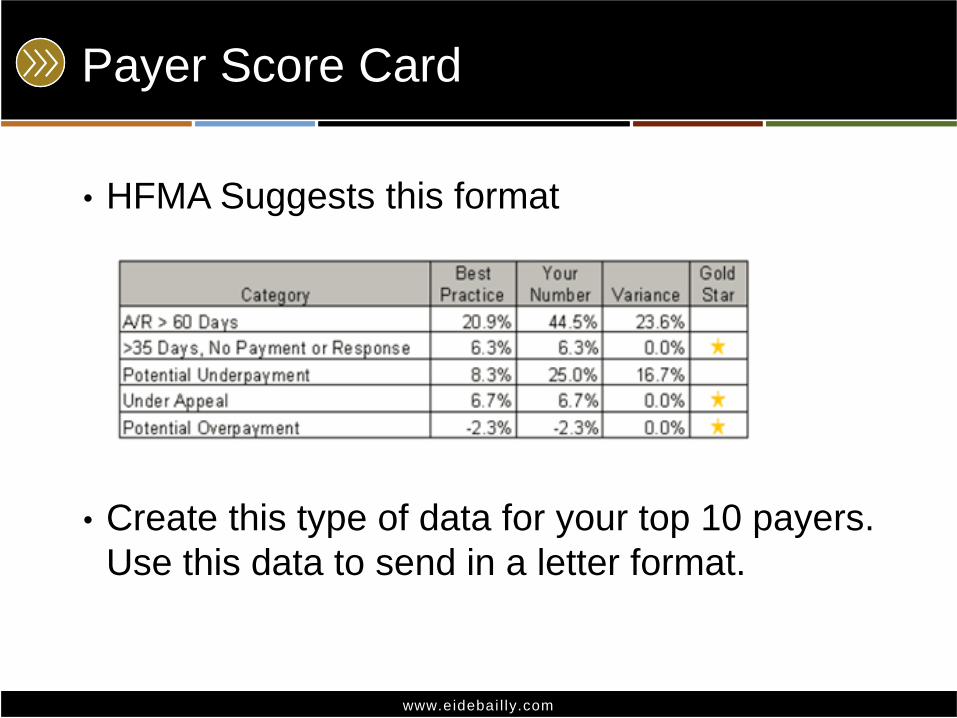
• HFMA Suggests this format
• Create this type of data for your top 10 payers.
Use this data to send in a letter format.
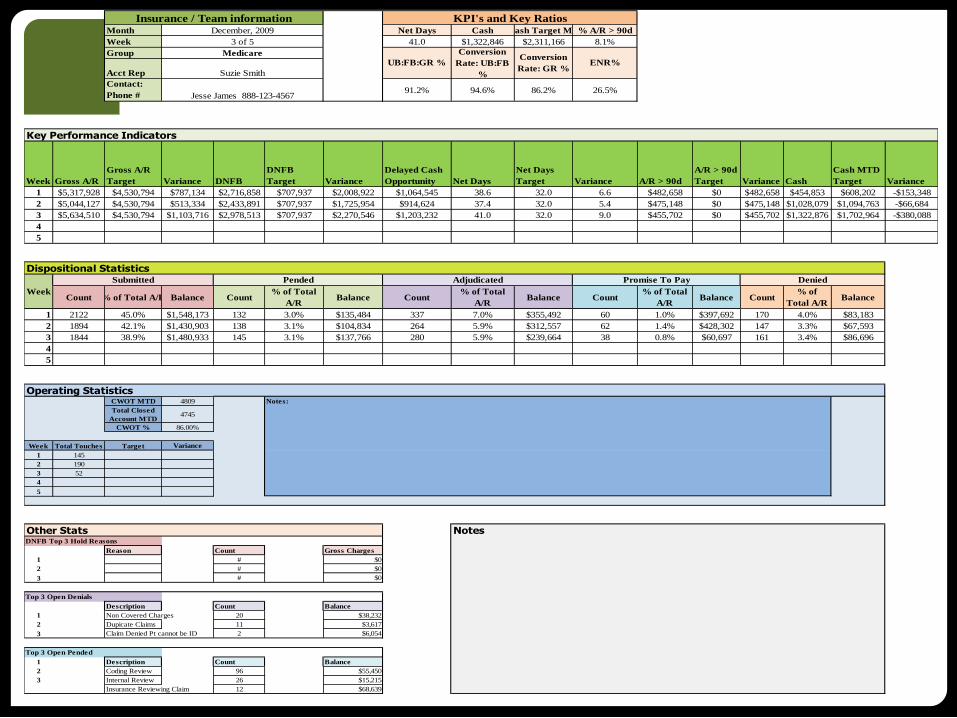
Month Net Days Cash Cash Target ME% A/R > 90d
Week 41.0 $1,322,846 $2,311,166 8.1%
Group
Acct RepPayer
Contact:
Phone #91.2% 94.6% 86.2% 26.5%
Week Gross A/R
Gross A/R
Target Variance DNFB
DNFB
Target Variance
Delayed Cash
Opportunity Net Days
Net Days
Target Variance A/R > 90d
A/R > 90d
Target Variance Cash
Cash MTD
Target Variance
1 $5,317,928 $4,530,794 $787,134 $2,716,858 $707,937 $2,008,922 $1,064,545 38.6 32.0 6.6 $482,658 $0 $482,658 $454,853 $608,202 -$153,348
2 $5,044,127 $4,530,794 $513,334 $2,433,891 $707,937 $1,725,954 $914,624 37.4 32.0 5.4 $475,148 $0 $475,148 $1,028,079 $1,094,763 -$66,684
3 $5,634,510 $4,530,794 $1,103,716 $2,978,513 $707,937 $2,270,546 $1,203,232 41.0 32.0 9.0 $455,702 $0 $455,702 $1,322,876 $1,702,964 -$380,088
4
5
Count % of Total A/R Balance Count% of Total
A/RBalance Count
% of Total
A/RBalance Count
% of Total
A/RBalance Count
% of
Total A/RBalance
1 2122 45.0% $1,548,173 132 3.0% $135,484 337 7.0% $355,492 60 1.0% $397,692 170 4.0% $83,183
2 1894 42.1% $1,430,903 138 3.1% $104,834 264 5.9% $312,557 62 1.4% $428,302 147 3.3% $67,593
3 1844 38.9% $1,480,933 145 3.1% $137,766 280 5.9% $239,664 38 0.8% $60,697 161 3.4% $86,696
4
5
CWOT MTD 4809
Total Closed
Account MTD4745
CWOT % 86.00%
Week Total Touches Target Variance
1 145
2 190
3 52
4
5
Reason Count Gross Charges
1 # $0
2 # $0
3 # $0
Description Count Balance
1 Non Covered Charges 20 $38,232
2 Dupicate Claims 11 $3,617
3 Claim Denied Pt cannot be ID 2 $6,054
1 Description Count Balance
2 Coding Review 96 $55,450
3 Internal Review 26 $15,215
Insurance Reviewing Claim 12 $68,639
Insurance / Team information KPI's and Key Ratios
Conversion
Rate: GR %ENR%
Key Performance Indicators
UB:FB:GR %
Conversion
Rate: UB:FB
%
Week
December, 2009
3 of 5
Medicare
Suzie Smith
Jesse James 888-123-4567
Dispositional StatisticsSubmitted Pended Adjudicated Promise To Pay Denied
Top 3 Open Pended
Other Stats
Notes:
Notes
Operating Statistics
DNFB Top 3 Hold Reasons
Top 3 Open Denials
www.eidebai l ly.comwww.eidebai l ly.com
How do we ensure proper
and prompt Insurance payments
You must confirm that you have…
1) Trained your insurance verification staff
• Not only to request coverage data but also request
Quotes of anticipated reimbursement for the planned
procedure (get it in writing)
2) Identified the data that payers are using to
determine your fee schedules.
• Work with the lower paying carriers to ensure they are not
misinterpreting your data.
3) Reviewed your reductions
• Do they appear to be from Fee Schedules, Reasonable
and customary rates, down coding or audit issues.
9

www.eidebai l ly.comwww.eidebai l ly.com
Understand your payers
• There are innumerable edits that a payer can
place in their system which makes it inevitable
that you will receive a denial.
• Pre-Bill edits based on experiential data
• Continual process improvement
• Be sure you know how to correct the issue on
this claim and future claims
• Ask yourself if the denial is appropriate and
where you could have redirected efforts prior to
claim submission and/or prior to discharge.
www.eidebai l ly.comwww.eidebai l ly.com
Resolve Discrepancies
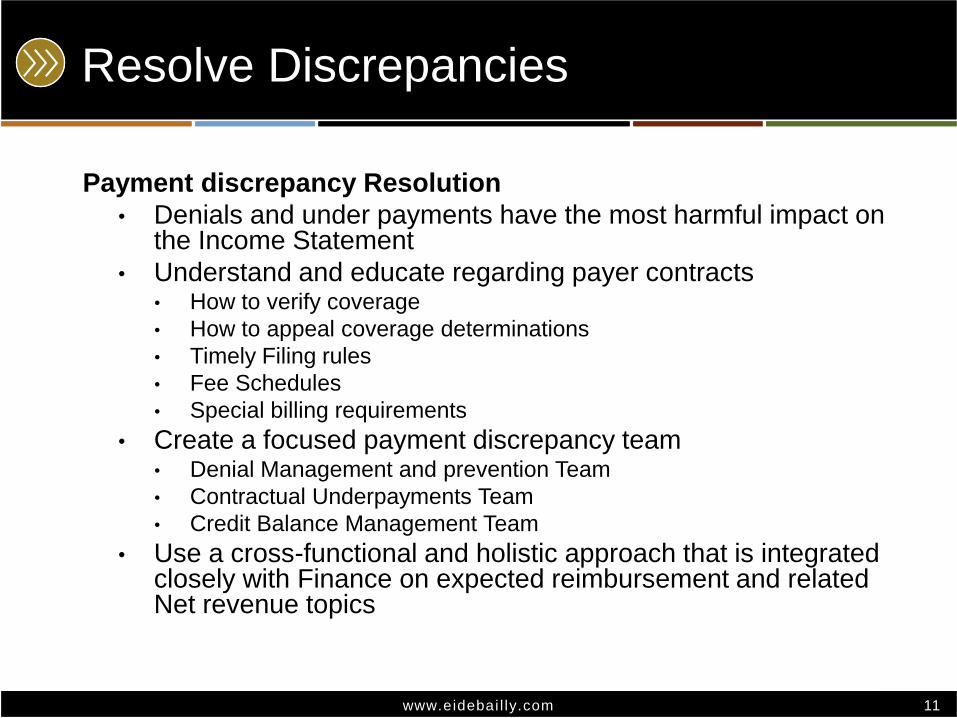
Payment discrepancy Resolution
• Denials and under payments have the most harmful impact on the Income Statement
• Understand and educate regarding payer contracts• How to verify coverage
• How to appeal coverage determinations
• Timely Filing rules
• Fee Schedules
• Special billing requirements
• Create a focused payment discrepancy team• Denial Management and prevention Team
• Contractual Underpayments Team
• Credit Balance Management Team
• Use a cross-functional and holistic approach that is integrated closely with Finance on expected reimbursement and related Net revenue topics
11
www.eidebai l ly.comwww.eidebai l ly.com
Claims Auditing
• Insurance companies are deploying robust claim
checking software that use sophisticated coding logic
and providers find themselves struggling to keep up
with what their services are worth on any given date.
• Reduced payments are one area that have hit providers
hard.
• Many providers are remiss in their responsibility to
protect their payments thinking they have no other
choice…
12
www.eidebai l ly.comwww.eidebai l ly.com
Denial Management
• Have you ever asked yourself ~ how is it that most insurance companies use the same tactics to delay or deny my claims
• Track your denials by payer and by type
• Interpret your carrier contracts to ensure that you do not receive incorrect “denial reasons”
• Track your denials to prevent oversight of a denial
• Report overturned denials to leadership for use during contract negotiations
• Creation of an interdepartmental task force to mitigate denials
• Education will help to identify upstream issues that might be causing the denial
13
www.eidebai l ly.comwww.eidebai l ly.com
Denial Score Card
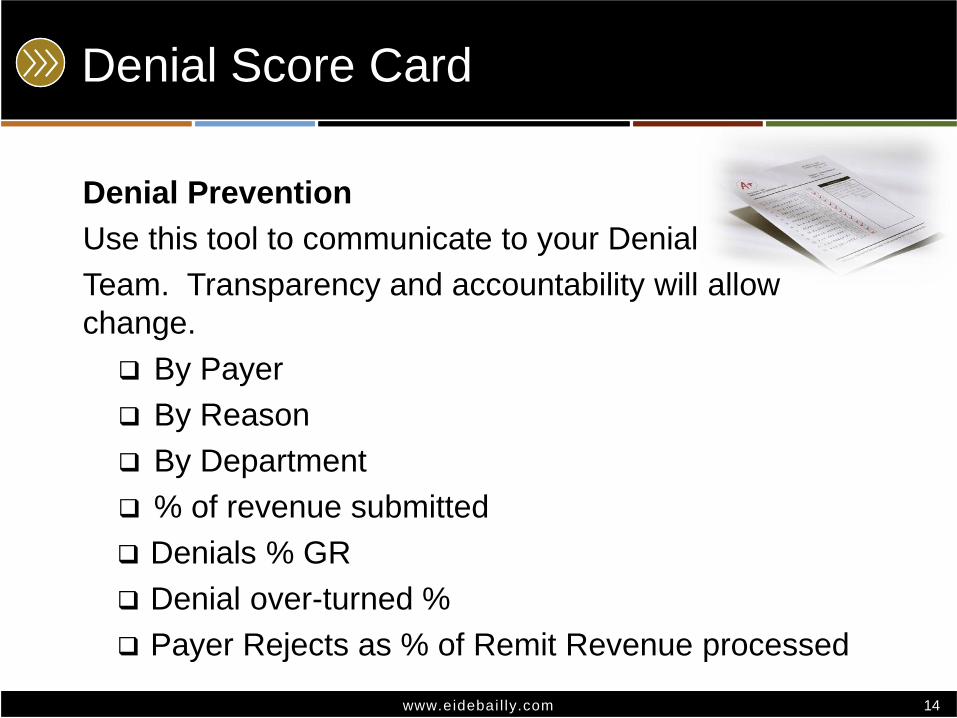
Denial Prevention
Use this tool to communicate to your Denial
Team. Transparency and accountability will allow
change.
By Payer
By Reason
By Department
% of revenue submitted
Denials % GR
Denial over-turned %
Payer Rejects as % of Remit Revenue processed
14
www.eidebai l ly.comwww.eidebai l ly.com
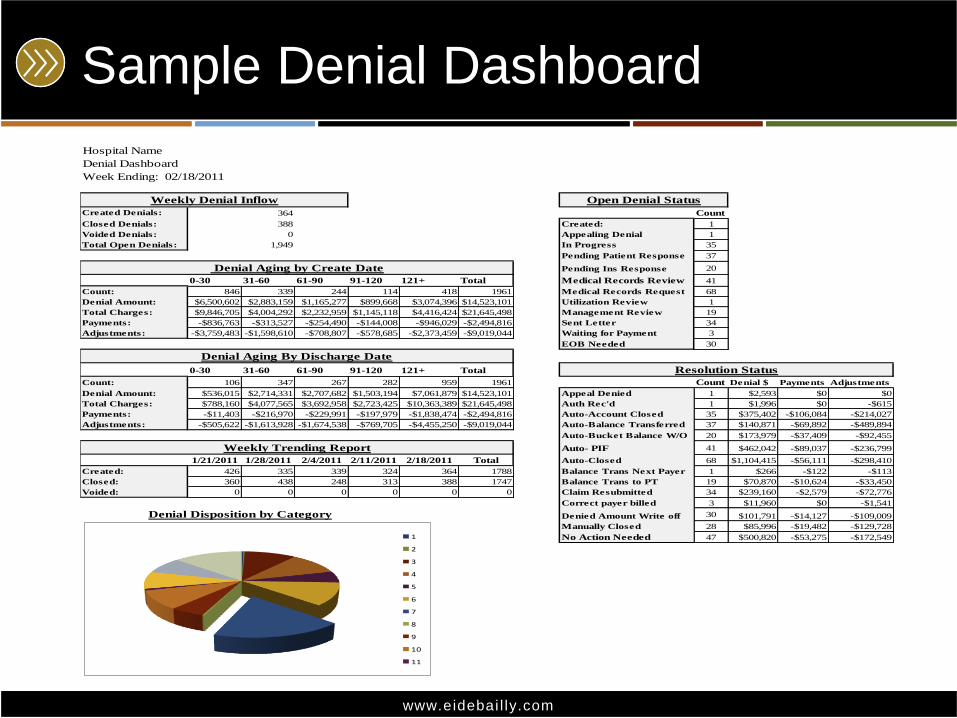
Sample Denial Dashboard
Hospital Name
Denial Dashboard
Week Ending: 02/18/2011
Created Denials: 364 Count
Closed Denials: 388 Created: 1
Voided Denials: 0 Appealing Denial 1
Total Open Denials: 1,949 In Progress 35
Pending Patient Response 37
Pending Ins Response 20
0-30 31-60 61-90 91-120 121+ Total Medical Records Review 41
Count: 846 339 244 114 418 1961 Medical Records Request 68
Denial Amount: $6,500,602 $2,883,159 $1,165,277 $899,668 $3,074,396 $14,523,101 Utilization Review 1
Total Charges: $9,846,705 $4,004,292 $2,232,959 $1,145,118 $4,416,424 $21,645,498 Management Review 19
Payments: -$836,763 -$313,527 -$254,490 -$144,008 -$946,029 -$2,494,816 Sent Letter 34
Adjustments: -$3,759,483 -$1,598,610 -$708,807 -$578,685 -$2,373,459 -$9,019,044 Waiting for Payment 3
EOB Needed 30
0-30 31-60 61-90 91-120 121+ Total
Count: 106 347 267 282 959 1961 Count Denial $ Payments Adjustments
Denial Amount: $536,015 $2,714,331 $2,707,682 $1,503,194 $7,061,879 $14,523,101 Appeal Denied 1 $2,593 $0 $0
Total Charges: $788,160 $4,077,565 $3,692,958 $2,723,425 $10,363,389 $21,645,498 Auth Rec'd 1 $1,996 $0 -$615
Payments: -$11,403 -$216,970 -$229,991 -$197,979 -$1,838,474 -$2,494,816 Auto-Account Closed 35 $375,402 -$106,084 -$214,027
Adjustments: -$505,622 -$1,613,928 -$1,674,538 -$769,705 -$4,455,250 -$9,019,044 Auto-Balance Transferred 37 $140,871 -$69,892 -$489,894
Auto-Bucket Balance W/O 20 $173,979 -$37,409 -$92,455
Auto- PIF 41 $462,042 -$89,037 -$236,799
1/21/2011 1/28/2011 2/4/2011 2/11/2011 2/18/2011 Total Auto-Closed 68 $1,104,415 -$56,111 -$298,410
Created: 426 335 339 324 364 1788 Balance Trans Next Payer 1 $266 -$122 -$113
Closed: 360 438 248 313 388 1747 Balance Trans to PT 19 $70,870 -$10,624 -$33,450
Voided: 0 0 0 0 0 0 Claim Resubmitted 34 $239,160 -$2,579 -$72,776
Correct payer billed 3 $11,960 $0 -$1,541
Denied Amount Write off 30 $101,791 -$14,127 -$109,009
Manually Closed 28 $85,996 -$19,482 -$129,728
No Action Needed 47 $500,820 -$53,275 -$172,549
Weekly Denial Inflow
Denial Aging by Create Date
Denial Aging By Discharge Date
Weekly Trending Report
Resolution Status
Denial Disposition by Category
Open Denial Status
1
2
3
4
5
6
7
8
9
10
11
www.eidebai l ly.comwww.eidebai l ly.com
Appeal Incorrect payments
What to include in your appeal
1. Cite ERISA, State statutes/Laws that support your position
2. Provide average stats on your anticipated reimbursement amount. Be prepared to challenge their citing of other providers who are out of your region and/or do not provide the same level of care.
3. Stand firm that you only offer discounts to those who pay promptly
4. Request prompt payment
5. If the denial is upheld request that they send supporting documentation
6. Incorrect payments – request a copy of the fee schedule
16
www.eidebai l ly.comwww.eidebai l ly.com
Core Teams
Integrated Unbilled Receivables Management
• All areas of the Revenue Cycle must view their core activities as a form of A/R Management• Pre-Processing
• Patient Access
• Care Management
• Charge Capture/Revenue Integrity
• HIM/Coding
• Patient Financial Services
• Specific suspense periods around Financial class and service type.
• Align fatal edits by department and type
• Revenue Integrity
• Service Documentation requirements.
• Rigid front end edits allowing only the cleanest product to flow into the PFS department for cash conversion.
17

www.eidebai l ly.comwww.eidebai l ly.com
Steps
• Identify the reason for the denial
• Route the denial automatically vs. print, copy, and file in a “to do” bucket.
• Have specific staff members within each department responsible for timely correction of denied claims. (i.e. Coding, Patient Access, Clinical…etc.)
• Ensure that the staff member has access to technology and training on how to correct not only this claim but future claims.
• Create a standard workflow either manual or automated with reminders. Base the work flow on type of denial.
• Create a step by step manual for employees to follow.
www.eidebai l ly.comwww.eidebai l ly.com
Reimbursement Opportunities
• Difficult to hold staff accountable if organization
has not taken every step to capture all earned
revenue
• Medicare
• Other payors
• Easier to capture lost reimbursement than to
identify operational efficiencies
• Remember cost reimbursement does not occur
unless the charges are successfully processed
www.eidebai l ly.comwww.eidebai l ly.com
Reimbursement Opportunities: Coding
• Coding
• Periodic DRG and CPT code reviews
• Medicare is not your only payor
• DRG and CPT code reviews
• Do not assume your coders are up to date
• Failure for payors to return claims does not equal proper
coding
• 20% – 30% error rates common
• Periodic reviews can lead to increase in prospective
payments and decrease in denials
www.eidebai l ly.comwww.eidebai l ly.com
Coding
• Coding should be completed by
a certified coding expert prior to sending a final
bill to ensure that all services are captured
correctly.
• Regulatory changes and governmental
divisions have been created with a strict focus
on compliant coding. (RAC, MAC etc.)
• On going audits become essential to ensure
that you have a compliant process in place to
stave off any sanctions from the government.
21
www.eidebai l ly.comwww.eidebai l ly.com
Reimbursement Opportunities:
Charge Capture
• Charge capture
• Failures occur due to failures in design of charge
capture processes and lack of understanding of
reportable services by nursing staff
• A perfect chargemaster means nothing if the charges
are not properly captured
• Periodic documentation and billing reviews
• 30% - 40% error rates common
• Majority of errors include lost charge
• CPT/HCPCS for fee schedule payors
• Charges for charge based payors
www.eidebai l ly.comwww.eidebai l ly.com
Charge Capture ~ Revenue Integrity
• Suspense times should be communicated and
should be a part of your facilities policies and
procedures.
• Suspense times are strict time lines placed on clinical
departments to enter compliant, audited and
correct charges for services rendered.
• It is important to remember that each day that
charges are not entered and fall out of
“suspense” can cause negative effects on your
days in A/R outstanding as well as cash flow.
23
www.eidebai l ly.comwww.eidebai l ly.com
Charge Master ~ Revenue Integrity
• Systematic reviews of your charge master are
essential to ensure that you are capturing all
revenue correctly and that you are not leaving
dollars on the table.
• Keep in mind that if you make adjustments to
your Charge Master you must think of the down
stream effects to your cost reports.
• Ensure that you have a process in place that will tie
your changes to your compliant cost report
24
www.eidebai l ly.comwww.eidebai l ly.com
Reimbursement Opportunities: Pricing
• Pricing
• Charges still matter for Critical Access Hospitals
• Many CAHs have payor contracts that reimburse based on
charges or percentage of charge
• Charges must be above published fee schedules or risk
reductions in reimbursement
• Pricing falls behind the market for two reasons
• Failure to understand the true impact of charges
• Perceived pressure on Board to hold down pricing

www.eidebai l ly.comwww.eidebai l ly.com
Reimbursement Opportunities: Pricing
• Pricing
• Recommend periodic market based comparisons of
pricing
• Medicare outpatient data
• Commercial claims data
www.eidebai l ly.comwww.eidebai l ly.com
What gets measured gets improved
• Clean Claim Rates – 93% of all claims should
be “clean claims” (Includes: claims not paid
within 45 days, claims sent more than one time
prior to payment, claims held in your clearing
house for a failure or claims that were denied
needing more information from the provider)
• Classify denials by reason, source, cause and
other distinguishing factors.
• The AMA reports that between1.38% and
5.07% of claims are denied on first submission.
www.eidebai l ly.comwww.eidebai l ly.com
Disclaimer
These seminar materials are intended to provide the seminar participants with guidance in Health Care Revenue Cycle matters. The materials do not constitute, and should not be treated as professional advice regarding the use of any particular Revenue Cycle technique or the consequences associated with any technique. Every effort has been made to assure the accuracy of these materials. Eide Bailly LLP. and the author do not assume responsibility for any individual's reliance upon the written or oral information provided during the seminar. Seminar participants should independently verify all statements made before applying them to a particular fact situation, and should independently determine the correctness of any particular insert subject matter planning technique before recommending the technique to a client or implementing it on the client's behalf.
28