Embed Size (px)
Citation preview
National Conference on Building Commissioning: May 2-4, 2007
Amarnani et al: Retrocommissioning Sustainable Savings … 1
Retro-commissioning (RCx) Sustainable Savings: Are We There Yet?
Narendra Amarnani, Brian Roberts and Nora Hernandez
Internal Services Department, County of Los Angeles
Michael B. Lo Energy Efficiency Division, Southern California Edison
Synopsis
The County of Los Angeles (County) Internal Services Department (ISD) in partnership with Southern California Edison (SCE) and Southern California Gas (SCG) Company implemented a comprehensive HVAC retro-commissioning (RCx) project involving ten courthouses and a library administration building in 2004/2005. The scope of the HVAC retro-commissioning involved systematic investigation of mechanical, electrical and controls components/systems to diagnose and resolve root causes of operational deficiencies. During the implementation phase, new energy efficiency measures were installed and sequence of operations were optimized and functionally tested. System-level benchmark models for cooling, heating and ventilation systems were developed based on optimized runs of eQUEST energy models and parametrically integrated into the County owned web-based Enterprise Energy Management Information System (EEMIS) with Itron/Silicon Energy EEM Suite® backbone for the purpose of monitoring the operations of the HVAC systems. The County is realizing persistent energy savings by developing, refining and practicing maintenance and operations (M&O) protocols/processes that is becoming sustainable modus operandi. The building experienced equipment and operational difficulties that were quickly acknowledged and acted upon to remain on the sustainability path. It is being discovered that post-RCx phase is not a hands-off phase; instead, it is a phase of much greater involvement. When deviations are observed, EEMIS staff (with controls expertise) and M&O staff work together to keep the systems on sustainability track. Based on utility bills, the County is realizing a reduction in (whole building) electric consumption by average 13% and reduction in gas consumption by 37%.
About the Authors
Narendra Amarnani was the project manager for the County of Los Angeles’ Internal Services Department, Energy Management Division on this retro-commissioning project. He has over 30 years of experience in mechanical field with specialties in building HVAC sciences, solar thermal power cogeneration and energy engineering. He is a registered Mechanical Engineer in California, had earned a bachelor’s degree from University of Maryland, and a graduate degree from Cal Poly University, Pomona. He is a Certified Energy Manager, a LEED Accredited Professional, and a Certified Energy Plan Examiner. Brian Roberts’s background includes more than years of experience in the HVAC industry including 15 years in building control and facility operations. Brian’s current title is Section Manager of the Systems Section within Energy Management Division. His responsibilities include managing the daily operations of the Building Environmental Automation Systems (BEAS) and
National Conference on Building Commissioning: May 2-4, 2007
Amarnani et al: Retrocommissioning Sustainable Savings … 2
Enterprise Energy Management Information Systems (EEMIS). Brian’s section provides building control and energy monitoring for more than 120 of the larger County facilities encompassing 25 million square feet. Nora Hernandez is a Section Manager of Project Management Section of Energy Management Division of Internal Services Department of the County of Los Angeles. Mrs. Hernandez’s career spans over 27 years in the construction industry. Her work experience includes 17 years as a project manager responsible for the completion and oversight of major capital and energy efficiency projects, totaling $47 million, for the County of Los Angeles. Nora has earned Bachelor of Science in Computer Science from California State University, Chico. Michael Lo is a Partnership Program Manager for Southern California Edison (SCE). He has earned a bachelor’s and a graduate degree in Mechanical Engineering from Cal Poly Pomona. He managed a portfolio of CPUC approved energy efficiency 3rd party programs and was instrumental in the development and management of energy efficiency partnerships with local government and institutional entities such as the County of Los Angeles and Riverside, California Department of Corrections and Rehabilitation, University of California, California State University and Community College systems, as well as the energy efficiency partnership with the State of California.
Acknowledgements
The authors would like to acknowledge the vision and direction provided by the following project partners: Howard Choy, Division Manager, and Nora Hernandez, Section Manager, Energy Management Division, Internal Services Department, County of Los Angeles; David Bruder, Energy Efficiency Division, Southern California Edison Company (SCE); and Paulo Morais, Mass Market Division, Southern California Gas Company. The Internal Services Department (ISD) provided considerable O&M staff resources without which the project goals would not have been realized.
National Conference on Building Commissioning: May 2-4, 2007
Amarnani et al: Retrocommissioning Sustainable Savings … 3
Introduction to Retro-Commissioning Process Adapted by the SCE/SCG/County of Los Angeles Energy Efficiency
Partnership The 2004-2005 SCE/SCG/County of Los Angeles Energy Efficiency Partnership program (The Program) was an approved and funded program under the auspices of the California Public Utilities Commission (CPUC). The County of Los Angeles (County), Southern California Edison Company (SCE), and Southern California Gas Company (SCG), entered into a two-year energy efficiency partnership commencing in 2004 that included building RCx as a program element. The Program included electricity and natural gas energy savings and electricity demand reduction goals. Retro-commissioning of County administration buildings and courthouses was one of the major elements to achieve the energy savings goal. This RCx activity was aligned with the green building initiative objectives of the Executive Order S-20-04 (EO), to achieve cost effective energy savings through energy efficiency RCx and retrofits of state-owned facilities. The Executive Order S-20-04 directs “that state agencies, departments and other entities under direct executive authority of the Governor cooperate in taking measures to reduce grid-based energy purchases for state-own buildings by 20% by 2015 [compared to a base year of 2003], through cost-effective efficiency measures and distributed generation technologies.” It also encourages local government and private sector to do the same. Since the County had already accomplished significant lighting retrofits, the RCx element exclusively focused on retro-commissioning of the County’s heating, ventilating, and air conditioning (HVAC) systems in 11 County facilities with the following objectives:
• Optimize HVAC system performance in sustainable manner by utilizing the County’s Enterprise Energy Management Information Systems (EEMIS) to provide tenant comfort, reduced energy consumption, improved operation, and reduced maintenance calls.
• Train building technicians on the retro-commissioning process and the optimized HVAC system operating parameters.
• Create System-level Benchmark to facilitate efficient monitoring of the HVAC systems for optimized performance.
• Establish a protocol for using system-level benchmarks in EEMIS to ensure persistence of energy savings, to improve O&M activities through preventative maintenance planning, and provide overall management of the building operation.
• Provide a single document resource for the County’s Operations & Maintenance staff. This paper presents the measured energy savings and costs of optimizing HVAC system performance by retro-commissioning. It also describes how the County’s EEMIS along with organizational changes have been phased in to continually monitor the retro-commissioned systems to ensure the persistence of energy savings.
National Conference on Building Commissioning: May 2-4, 2007
Amarnani et al: Retrocommissioning Sustainable Savings … 4
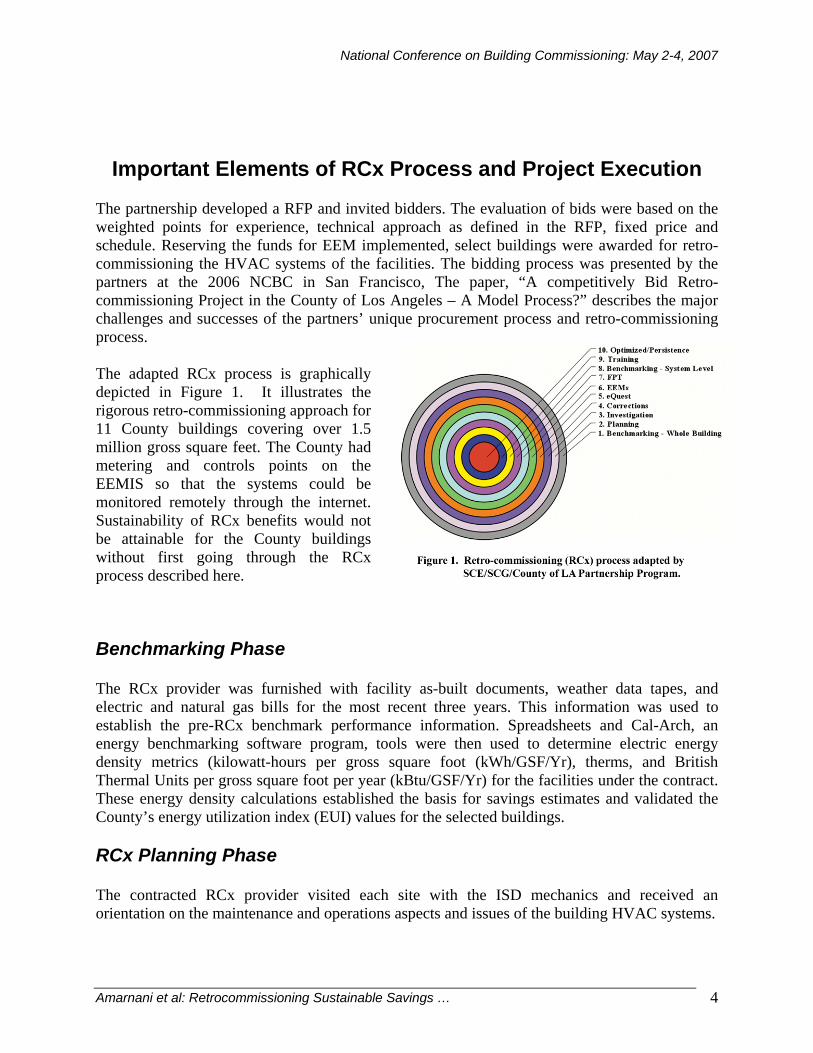
Important Elements of RCx Process and Project Execution The partnership developed a RFP and invited bidders. The evaluation of bids were based on the weighted points for experience, technical approach as defined in the RFP, fixed price and schedule. Reserving the funds for EEM implemented, select buildings were awarded for retro-commissioning the HVAC systems of the facilities. The bidding process was presented by the partners at the 2006 NCBC in San Francisco, The paper, “A competitively Bid Retro-commissioning Project in the County of Los Angeles – A Model Process?” describes the major challenges and successes of the partners’ unique procurement process and retro-commissioning process. The adapted RCx process is graphically depicted in Figure 1. It illustrates the rigorous retro-commissioning approach for 11 County buildings covering over 1.5 million gross square feet. The County had metering and controls points on the EEMIS so that the systems could be monitored remotely through the internet. Sustainability of RCx benefits would not be attainable for the County buildings without first going through the RCx process described here. Benchmarking Phase The RCx provider was furnished with facility as-built documents, weather data tapes, and electric and natural gas bills for the most recent three years. This information was used to establish the pre-RCx benchmark performance information. Spreadsheets and Cal-Arch, an energy benchmarking software program, tools were then used to determine electric energy density metrics (kilowatt-hours per gross square foot (kWh/GSF/Yr), therms, and British Thermal Units per gross square foot per year (kBtu/GSF/Yr) for the facilities under the contract. These energy density calculations established the basis for savings estimates and validated the County’s energy utilization index (EUI) values for the selected buildings. RCx Planning Phase The contracted RCx provider visited each site with the ISD mechanics and received an orientation on the maintenance and operations aspects and issues of the building HVAC systems.
National Conference on Building Commissioning: May 2-4, 2007
Amarnani et al: Retrocommissioning Sustainable Savings … 5
The County technicians shared their system knowledge, history of modification and trouble issues, and expected solutions with the RCx Provider. Armed with available as-built drawings, preventive maintenance logs, and occupant complaint logs, the RCx provider audited each facility and submits a planning report for each building containing comprehensive building information collected including operational and maintenance status of HVAC system. Report also includes list of observed deficiencies and issues with proposed strategies to address them. Pre-functional Testing or Investigation Phase During the pre-functional phase, major field activities were performed to identify specific operations of each HVAC system. The RCx provider, along with their subcontractor teams, performed a thorough examination including review of existing sequence of operations, point-to-point controls testing, calibration of controls components/sensors, diagnostic airflow and temperature measurements, eQUEST Modeling baseline energy usage of the HVAC system, development of scope of work and cost proposals for recommended optimization measures, or energy efficiency measures (EEMs). Correction of Deficiencies The single most important action item was to correct the deficiencies identified primarily during the pre-functional phase and after functional performance test phase. Without correcting the deficiencies, it would not have been possible to optimize the scheduling of the equipment in the buildings. Presented below are several examples of retro-commissioned buildings with identified deficiencies and resolutions.
• At Downey Courthouse (CH) Air Handling Unit (AHU) fans were running continuously because the variable frequency drives (VFDs) serving the Supply Fan (SF) had failed and had been running in “Hand.” Multiple VFD failures had occurred due to the condensing cold room environment in which they were originally mounted. New VFDs were relocated to a non-condensing environment. Additional points were configured to monitor the equipment and provided control of equipment scheduling.
• At Whittier CH, main air handler controls were upgraded from pneumatic to electro-pneumatic controls to gain control over the chilled water valve (CHWV), hot water valve (HWV) and an economizer. Chiller plant, hot water pump (HWP) and chiller temperature, cooling tower (CT) lead/lag and other programming issues were resolved by fully restoring automatic control of the HVAC system that enabled successful temperature control in the building and equipment scheduling could be imposed.
• At Beverly Hills CH, due to a network configuration problem, a failed VFD couldn’t be replaced due to network mismatch and brought online; therefore, facility was running extended hours and needed to be managed on daily basis. Controls network configuration was replaced by an expert vendor to alleviate the problem resulting in reduced motor runtime.
• Library Headquarters (HQ) underwent construction right before the RCx project. Fans were kept on for dust control. Additionally, building air balance was not found to be within acceptable design range. Air handler controls were of different brand and there
National Conference on Building Commissioning: May 2-4, 2007
Amarnani et al: Retrocommissioning Sustainable Savings … 6
were few points integrated into Teletrol control (system most commonly used in the County building). Comprehensive solutions included repairing zone VAV boxes, reheat valves, air balancing the building, enacting economizer controls, additional points and programming to incorporate EEMs allowing operators to minimize equipment operating hours and subsequently to monitoring it. Last year, the schedule was expanded to accommodate tenant request. However, the facility still remains under optimized state.
EEM Implementation Selected EEMs were then implemented by one of two methods. In some cases, the County used in-house resources to implement a measure. In other cases, a change order was issued to the RCx provider enabling them to implement the measure. During this phase, the County’s M&O and Energy Management Division staff implemented many EEMs recommended by the RCx provider. Most of these measures involved HVAC control set-point and schedule changes. Other recommendations, many involving control programming changes, were contracted out to the RCx provider who subcontracted much of the work to local mechanical and controls contractors. The following describes the EEMs that were implemented at the facilities:
• HVAC system start/stop for AHUs, chillers and boilers • Outside air economizer sequence based on OSA or enthalpy • Minor boiler tune-up • Hot deck/cold deck reset (adjustable) • Discharge (DAT) / mixed air temperature (MAT) reset • Adjust condenser water temperature • Testing and Balancing of full facility was performed at two building • Mixing box repair • Hot water pump lock-out • Chilled water pump outside air enable • Garage exhaust fan carbon monoxide control • Hot water supply temperature reset strategy based on OSAT • Night purge control strategy
Functional Performance Testing Functional performance Test (FPT) procedures were conducted in all facilities on the entire HVAC systems that included new EEMs. The RCx provider began functional testing of the HVAC systems during the unoccupied hours with the assistance of their controls subcontractors. During this phase, more deficiencies and optimization measures, though fewer in number, were discovered, reported and corrected, in most cases. All the change order related measures were successfully commissioned and demonstrated to County M&O staff for field training purpose. Functional performance test logs with master list of findings were submitted by the RCx
National Conference on Building Commissioning: May 2-4, 2007
Amarnani et al: Retrocommissioning Sustainable Savings … 7
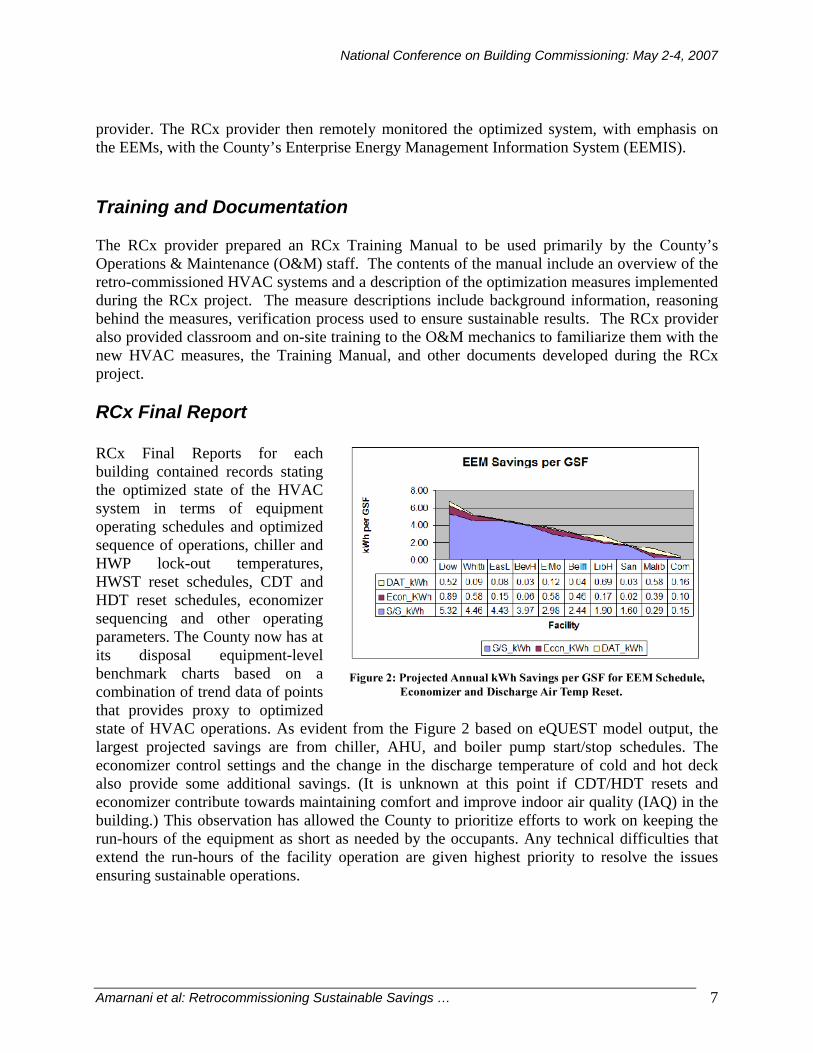
provider. The RCx provider then remotely monitored the optimized system, with emphasis on the EEMs, with the County’s Enterprise Energy Management Information System (EEMIS). Training and Documentation The RCx provider prepared an RCx Training Manual to be used primarily by the County’s Operations & Maintenance (O&M) staff. The contents of the manual include an overview of the retro-commissioned HVAC systems and a description of the optimization measures implemented during the RCx project. The measure descriptions include background information, reasoning behind the measures, verification process used to ensure sustainable results. The RCx provider also provided classroom and on-site training to the O&M mechanics to familiarize them with the new HVAC measures, the Training Manual, and other documents developed during the RCx project. RCx Final Report RCx Final Reports for each building contained records stating the optimized state of the HVAC system in terms of equipment operating schedules and optimized sequence of operations, chiller and HWP lock-out temperatures, HWST reset schedules, CDT and HDT reset schedules, economizer sequencing and other operating parameters. The County now has at its disposal equipment-level benchmark charts based on a combination of trend data of points that provides proxy to optimized state of HVAC operations. As evident from the Figure 2 based on eQUEST model output, the largest projected savings are from chiller, AHU, and boiler pump start/stop schedules. The economizer control settings and the change in the discharge temperature of cold and hot deck also provide some additional savings. (It is unknown at this point if CDT/HDT resets and economizer contribute towards maintaining comfort and improve indoor air quality (IAQ) in the building.) This observation has allowed the County to prioritize efforts to work on keeping the run-hours of the equipment as short as needed by the occupants. Any technical difficulties that extend the run-hours of the facility operation are given highest priority to resolve the issues ensuring sustainable operations.
National Conference on Building Commissioning: May 2-4, 2007
Amarnani et al: Retrocommissioning Sustainable Savings … 8
Another level of oversight is based on final output from the eQUEST that defined the performance of the calibrated building in terms of monthly energy usage that can be used to track the bills and monitor the building operations from an energy perspective. Finally, eQUEST output allowed the development of system-level benchmarks, based on multiple input points, for each system such as ventilation, cooling and heating system energy usage per GSF, run-hours, ton-hours or Btu-hrs delivered, chiller demand based on OSAT, etc., to monitor the performance in run-time or when thresholds are crossed. The system-level benchmarks are being programmed into EEMIS for persistence of savings. The County can now utilize EEMIS, over the internet, to efficiently monitor equipment operations, analyze energy billing data and trend system-level benchmarks for sustainable optimized HVAC operations.
Retro-commissioning Sustainability Roadmap
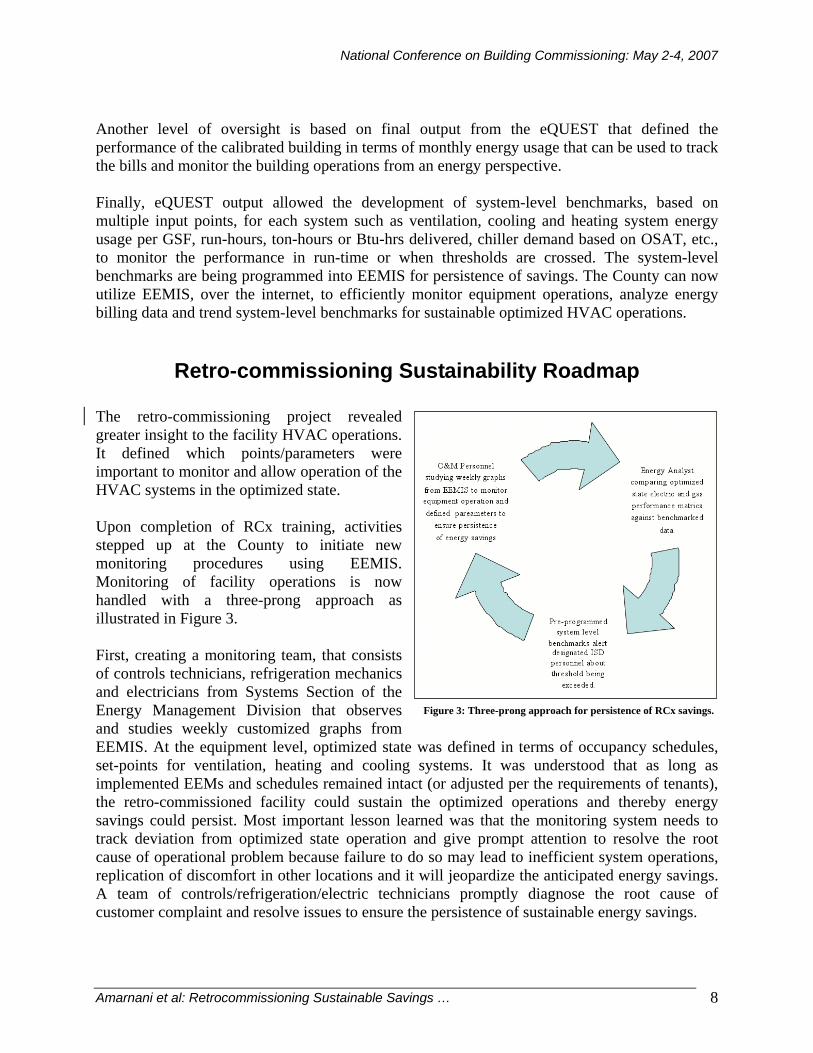
The retro-commissioning project revealed greater insight to the facility HVAC operations. It defined which points/parameters were important to monitor and allow operation of the HVAC systems in the optimized state. Upon completion of RCx training, activities stepped up at the County to initiate new monitoring procedures using EEMIS. Monitoring of facility operations is now handled with a three-prong approach as illustrated in Figure 3. First, creating a monitoring team, that consists of controls technicians, refrigeration mechanics and electricians from Systems Section of the Energy Management Division that observes and studies weekly customized graphs from EEMIS. At the equipment level, optimized state was defined in terms of occupancy schedules, set-points for ventilation, heating and cooling systems. It was understood that as long as implemented EEMs and schedules remained intact (or adjusted per the requirements of tenants), the retro-commissioned facility could sustain the optimized operations and thereby energy savings could persist. Most important lesson learned was that the monitoring system needs to track deviation from optimized state operation and give prompt attention to resolve the root cause of operational problem because failure to do so may lead to inefficient system operations, replication of discomfort in other locations and it will jeopardize the anticipated energy savings. A team of controls/refrigeration/electric technicians promptly diagnose the root cause of customer complaint and resolve issues to ensure the persistence of sustainable energy savings.
Figure 3: Three-prong approach for persistence of RCx savings.
National Conference on Building Commissioning: May 2-4, 2007
Amarnani et al: Retrocommissioning Sustainable Savings … 9
In the second approach, a team of analysts is tasked to analyze utility bill data from EEMIS to gauge the performance of the facilities at the whole building level and compared with the utility benchmarks derived from eQUEST final run. Although, lighting and plug loads are not measured separately, utility analysis of the trends can pin point major deviations that could be further investigated. Variables such as weather, plug, elevators, and lighting loads were not designed to be monitored; however, HVAC operations could be kept under control by targeting select parameters in a systematic manner. Third, ISD have contracted with Itron to program a select system-level benchmarks in terms of run-hours, ton-hours, Btu-hours, kW demand, kWh electric consumption and therm gas consumption to gauge the HVAC performance of the facility in numerical terms. Upon completion of this phase some of the manual workload from the other two phases is envisioned to be reduced through electronic alerting modules. These email notifications will be sent out to facility operations manager along with the energy manager. System-Level Equipment Monitoring using EEMIS
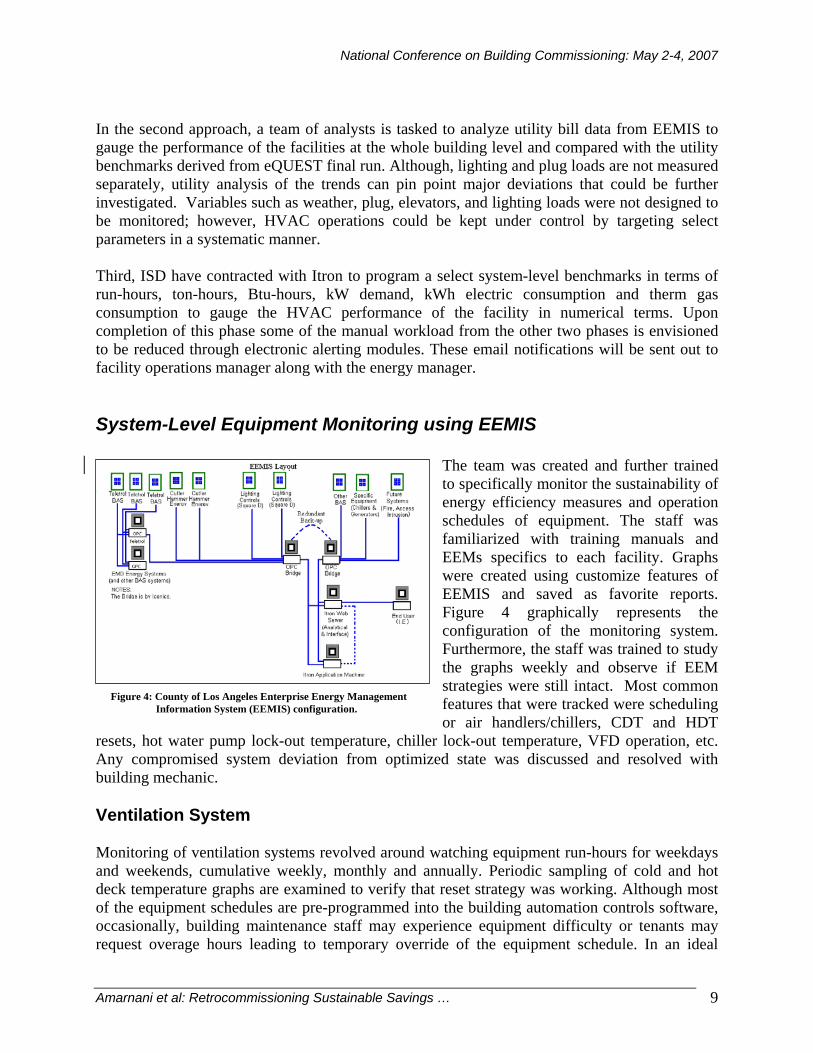
The team was created and further trained to specifically monitor the sustainability of energy efficiency measures and operation schedules of equipment. The staff was familiarized with training manuals and EEMs specifics to each facility. Graphs were created using customize features of EEMIS and saved as favorite reports. Figure 4 graphically represents the configuration of the monitoring system. Furthermore, the staff was trained to study the graphs weekly and observe if EEM strategies were still intact. Most common features that were tracked were scheduling or air handlers/chillers, CDT and HDT
resets, hot water pump lock-out temperature, chiller lock-out temperature, VFD operation, etc. Any compromised system deviation from optimized state was discussed and resolved with building mechanic. Ventilation System Monitoring of ventilation systems revolved around watching equipment run-hours for weekdays and weekends, cumulative weekly, monthly and annually. Periodic sampling of cold and hot deck temperature graphs are examined to verify that reset strategy was working. Although most of the equipment schedules are pre-programmed into the building automation controls software, occasionally, building maintenance staff may experience equipment difficulty or tenants may request overage hours leading to temporary override of the equipment schedule. In an ideal
Figure 4: County of Los Angeles Enterprise Energy Management Information System (EEMIS) configuration.
National Conference on Building Commissioning: May 2-4, 2007
Amarnani et al: Retrocommissioning Sustainable Savings … 10
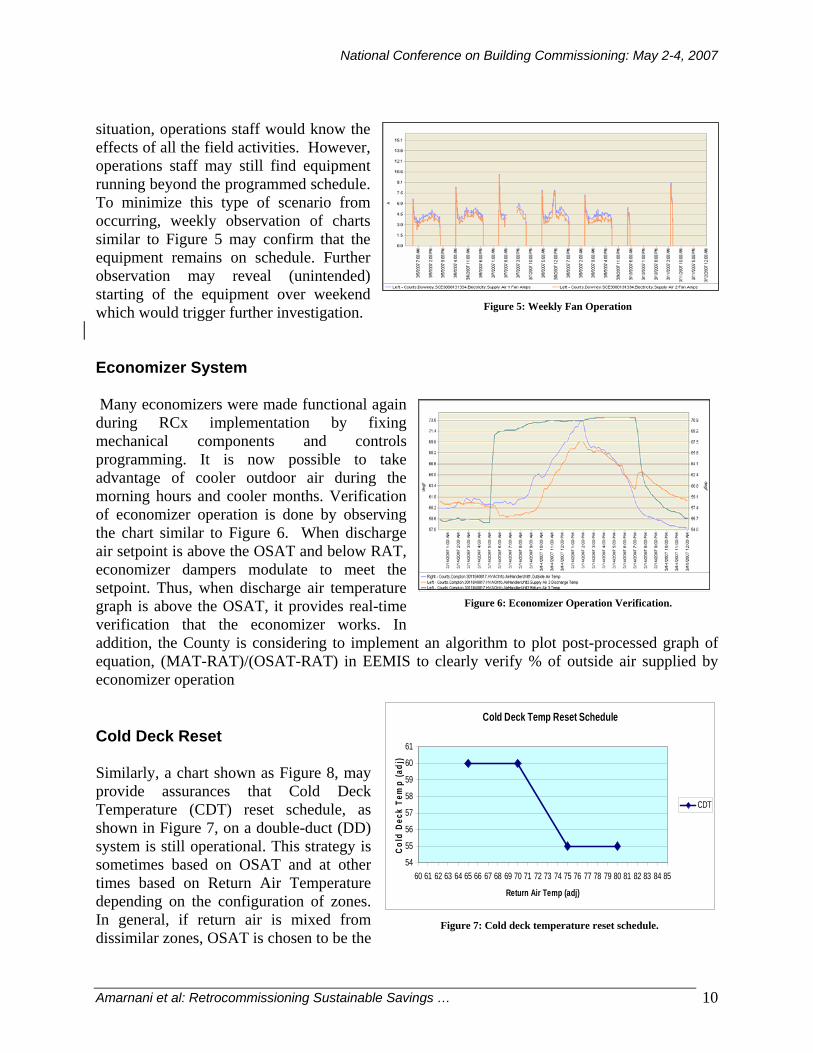
situation, operations staff would know the effects of all the field activities. However, operations staff may still find equipment running beyond the programmed schedule. To minimize this type of scenario from occurring, weekly observation of charts similar to Figure 5 may confirm that the equipment remains on schedule. Further observation may reveal (unintended) starting of the equipment over weekend which would trigger further investigation. Economizer System Many economizers were made functional again during RCx implementation by fixing mechanical components and controls programming. It is now possible to take advantage of cooler outdoor air during the morning hours and cooler months. Verification of economizer operation is done by observing the chart similar to Figure 6. When discharge air setpoint is above the OSAT and below RAT, economizer dampers modulate to meet the setpoint. Thus, when discharge air temperature graph is above the OSAT, it provides real-time verification that the economizer works. In addition, the County is considering to implement an algorithm to plot post-processed graph of equation, (MAT-RAT)/(OSAT-RAT) in EEMIS to clearly verify % of outside air supplied by economizer operation Cold Deck Reset Similarly, a chart shown as Figure 8, may provide assurances that Cold Deck Temperature (CDT) reset schedule, as shown in Figure 7, on a double-duct (DD) system is still operational. This strategy is sometimes based on OSAT and at other times based on Return Air Temperature depending on the configuration of zones. In general, if return air is mixed from dissimilar zones, OSAT is chosen to be the
Cold Deck Temp Reset Schedule
54
55
56
57
58
59
60
61
60 61 62 63 64 65 66 67 68 69 70 71 72 73 74 75 76 77 78 79 80 81 82 83 84 85
Return Air Temp (adj)
Cold
Dec
k Te
mp
(adj
)
CDT
Figure 7: Cold deck temperature reset schedule.
Figure 5: Weekly Fan Operation
Figure 6: Economizer Operation Verification.
National Conference on Building Commissioning: May 2-4, 2007
Amarnani et al: Retrocommissioning Sustainable Savings … 11
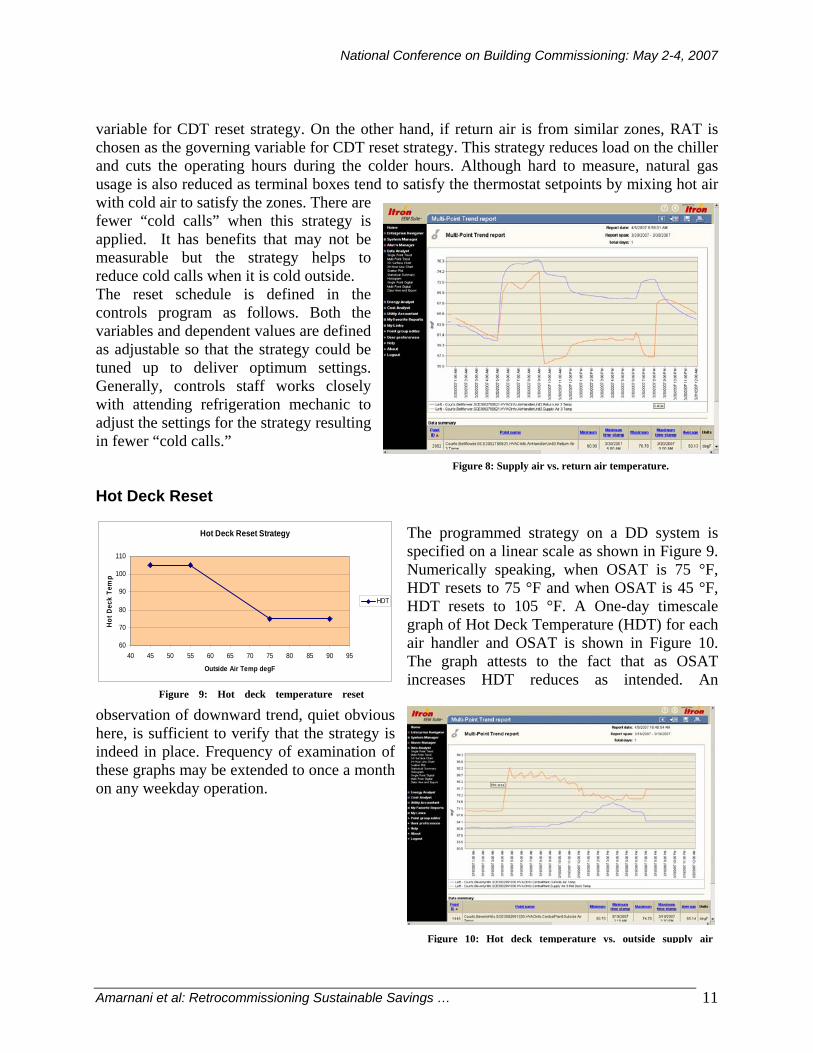
variable for CDT reset strategy. On the other hand, if return air is from similar zones, RAT is chosen as the governing variable for CDT reset strategy. This strategy reduces load on the chiller and cuts the operating hours during the colder hours. Although hard to measure, natural gas usage is also reduced as terminal boxes tend to satisfy the thermostat setpoints by mixing hot air with cold air to satisfy the zones. There are fewer “cold calls” when this strategy is applied. It has benefits that may not be measurable but the strategy helps to reduce cold calls when it is cold outside. The reset schedule is defined in the controls program as follows. Both the variables and dependent values are defined as adjustable so that the strategy could be tuned up to deliver optimum settings. Generally, controls staff works closely with attending refrigeration mechanic to adjust the settings for the strategy resulting in fewer “cold calls.” Hot Deck Reset
The programmed strategy on a DD system is specified on a linear scale as shown in Figure 9. Numerically speaking, when OSAT is 75 °F, HDT resets to 75 °F and when OSAT is 45 °F, HDT resets to 105 °F. A One-day timescale graph of Hot Deck Temperature (HDT) for each air handler and OSAT is shown in Figure 10. The graph attests to the fact that as OSAT increases HDT reduces as intended. An
observation of downward trend, quiet obvious here, is sufficient to verify that the strategy is indeed in place. Frequency of examination of these graphs may be extended to once a month on any weekday operation.
Hot Deck Reset Strategy
60
70
80
90
100
110
40 45 50 55 60 65 70 75 80 85 90 95
Outside Air Temp degF
Hot D
eck
Tem
p
HDT
Figure 9: Hot deck temperature reset
Figure 8: Supply air vs. return air temperature.
Figure 10: Hot deck temperature vs. outside supply air
National Conference on Building Commissioning: May 2-4, 2007
Amarnani et al: Retrocommissioning Sustainable Savings … 12
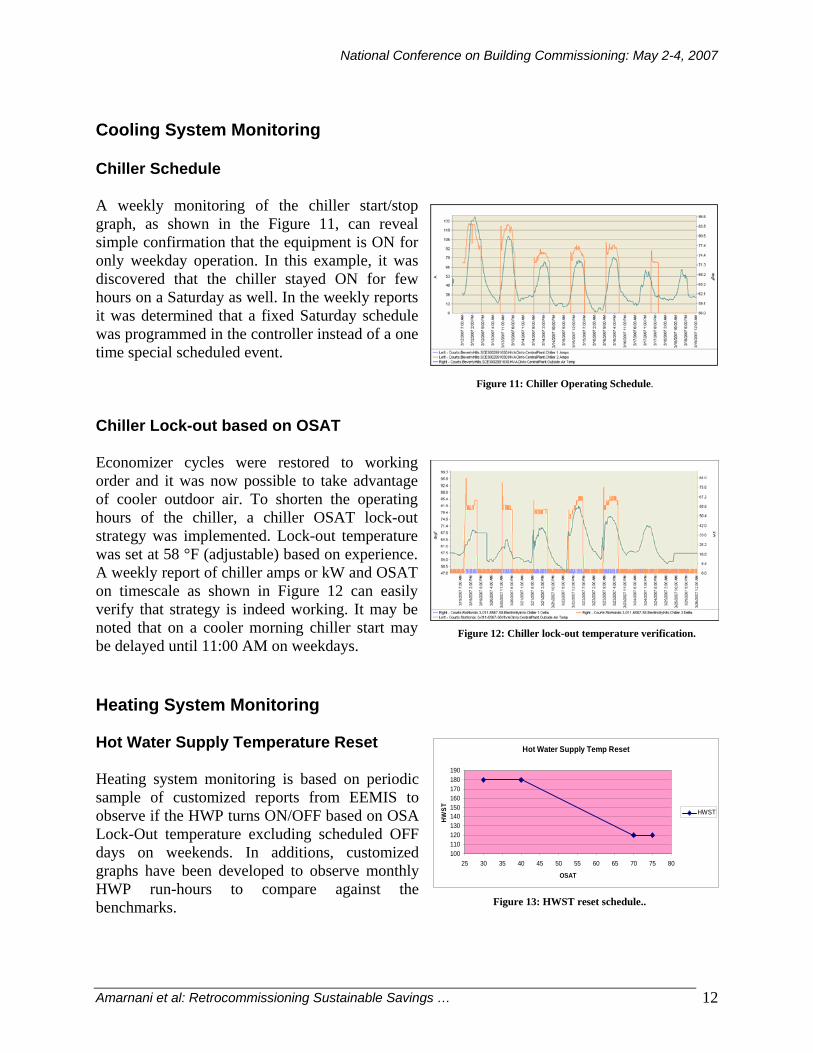
Cooling System Monitoring Chiller Schedule A weekly monitoring of the chiller start/stop graph, as shown in the Figure 11, can reveal simple confirmation that the equipment is ON for only weekday operation. In this example, it was discovered that the chiller stayed ON for few hours on a Saturday as well. In the weekly reports it was determined that a fixed Saturday schedule was programmed in the controller instead of a one time special scheduled event. Chiller Lock-out based on OSAT Economizer cycles were restored to working order and it was now possible to take advantage of cooler outdoor air. To shorten the operating hours of the chiller, a chiller OSAT lock-out strategy was implemented. Lock-out temperature was set at 58 °F (adjustable) based on experience. A weekly report of chiller amps or kW and OSAT on timescale as shown in Figure 12 can easily verify that strategy is indeed working. It may be noted that on a cooler morning chiller start may be delayed until 11:00 AM on weekdays. Heating System Monitoring Hot Water Supply Temperature Reset Heating system monitoring is based on periodic sample of customized reports from EEMIS to observe if the HWP turns ON/OFF based on OSA Lock-Out temperature excluding scheduled OFF days on weekends. In additions, customized graphs have been developed to observe monthly HWP run-hours to compare against the benchmarks.
Figure 11: Chiller Operating Schedule.
Figure 12: Chiller lock-out temperature verification.
Hot Water Supply Temp Reset
100110120130140150160170180190
25 30 35 40 45 50 55 60 65 70 75 80
OSAT
HWST HWST
Figure 13: HWST reset schedule..
National Conference on Building Commissioning: May 2-4, 2007
Amarnani et al: Retrocommissioning Sustainable Savings … 13
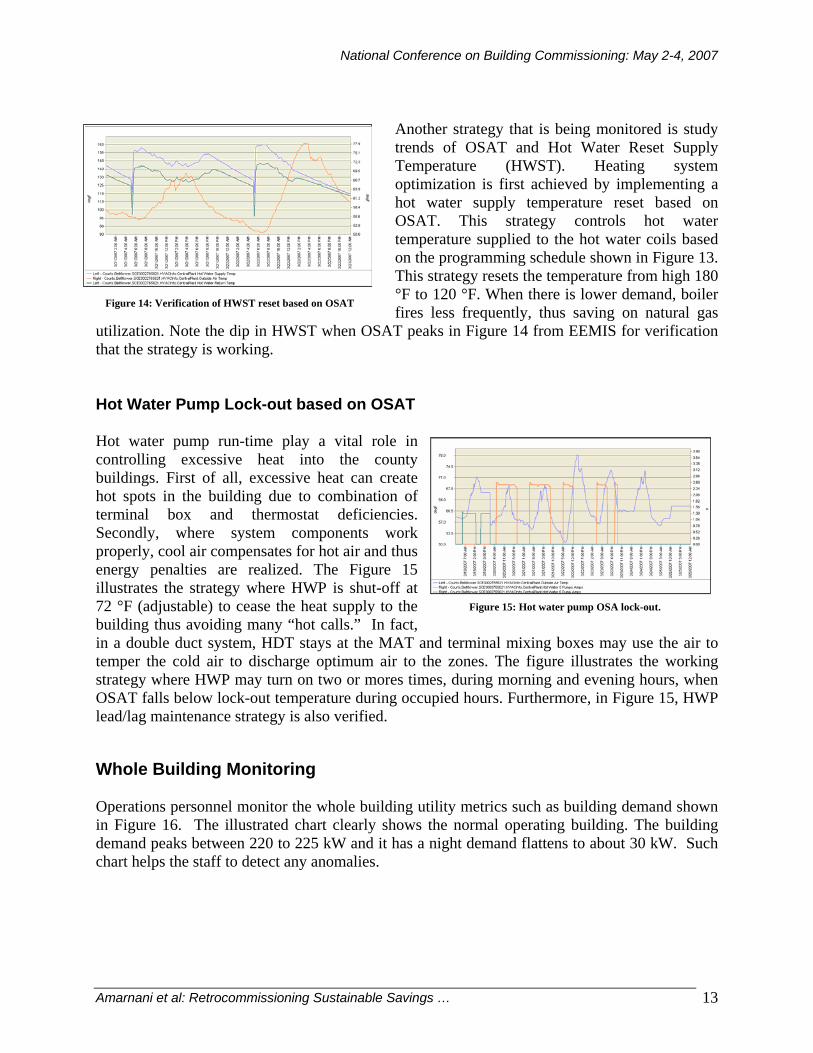
Another strategy that is being monitored is study trends of OSAT and Hot Water Reset Supply Temperature (HWST). Heating system optimization is first achieved by implementing a hot water supply temperature reset based on OSAT. This strategy controls hot water temperature supplied to the hot water coils based on the programming schedule shown in Figure 13. This strategy resets the temperature from high 180 °F to 120 °F. When there is lower demand, boiler fires less frequently, thus saving on natural gas
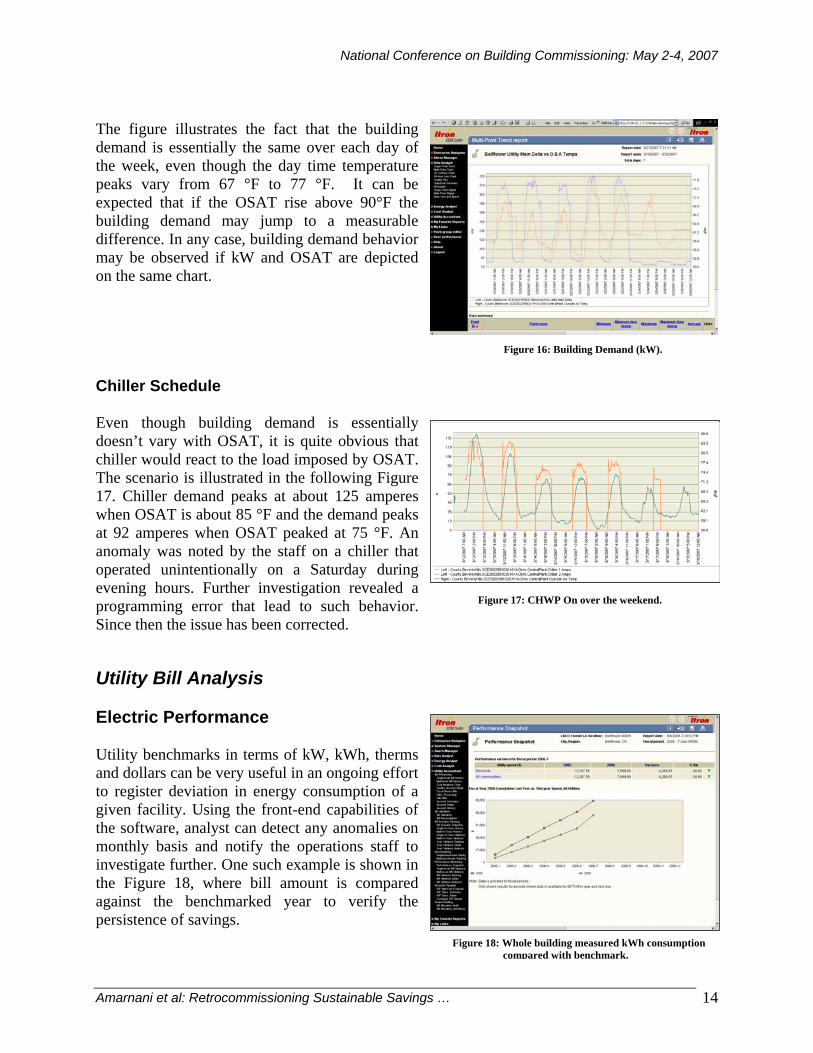
utilization. Note the dip in HWST when OSAT peaks in Figure 14 from EEMIS for verification that the strategy is working. Hot Water Pump Lock-out based on OSAT Hot water pump run-time play a vital role in controlling excessive heat into the county buildings. First of all, excessive heat can create hot spots in the building due to combination of terminal box and thermostat deficiencies. Secondly, where system components work properly, cool air compensates for hot air and thus energy penalties are realized. The Figure 15 illustrates the strategy where HWP is shut-off at 72 °F (adjustable) to cease the heat supply to the building thus avoiding many “hot calls.” In fact, in a double duct system, HDT stays at the MAT and terminal mixing boxes may use the air to temper the cold air to discharge optimum air to the zones. The figure illustrates the working strategy where HWP may turn on two or mores times, during morning and evening hours, when OSAT falls below lock-out temperature during occupied hours. Furthermore, in Figure 15, HWP lead/lag maintenance strategy is also verified.
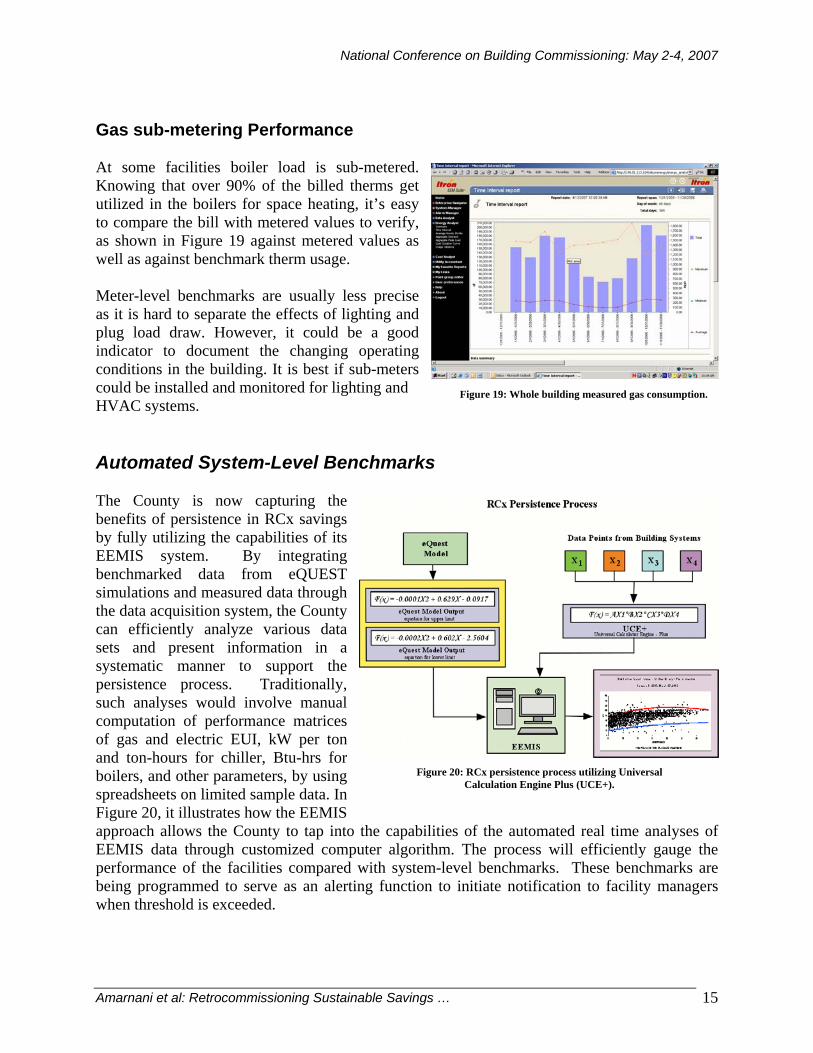
Whole Building Monitoring Operations personnel monitor the whole building utility metrics such as building demand shown in Figure 16. The illustrated chart clearly shows the normal operating building. The building demand peaks between 220 to 225 kW and it has a night demand flattens to about 30 kW. Such chart helps the staff to detect any anomalies.
Figure 14: Verification of HWST reset based on OSAT
Figure 15: Hot water pump OSA lock-out.
National Conference on Building Commissioning: May 2-4, 2007
Amarnani et al: Retrocommissioning Sustainable Savings … 14
The figure illustrates the fact that the building demand is essentially the same over each day of the week, even though the day time temperature peaks vary from 67 °F to 77 °F. It can be expected that if the OSAT rise above 90°F the building demand may jump to a measurable difference. In any case, building demand behavior may be observed if kW and OSAT are depicted on the same chart. Chiller Schedule Even though building demand is essentially doesn’t vary with OSAT, it is quite obvious that chiller would react to the load imposed by OSAT. The scenario is illustrated in the following Figure 17. Chiller demand peaks at about 125 amperes when OSAT is about 85 °F and the demand peaks at 92 amperes when OSAT peaked at 75 °F. An anomaly was noted by the staff on a chiller that operated unintentionally on a Saturday during evening hours. Further investigation revealed a programming error that lead to such behavior. Since then the issue has been corrected.
Utility Bill Analysis Electric Performance Utility benchmarks in terms of kW, kWh, therms and dollars can be very useful in an ongoing effort to register deviation in energy consumption of a given facility. Using the front-end capabilities of the software, analyst can detect any anomalies on monthly basis and notify the operations staff to investigate further. One such example is shown in the Figure 18, where bill amount is compared against the benchmarked year to verify the persistence of savings.
Figure 16: Building Demand (kW).
Figure 17: CHWP On over the weekend.
Figure 18: Whole building measured kWh consumption compared with benchmark.
National Conference on Building Commissioning: May 2-4, 2007
Amarnani et al: Retrocommissioning Sustainable Savings … 15
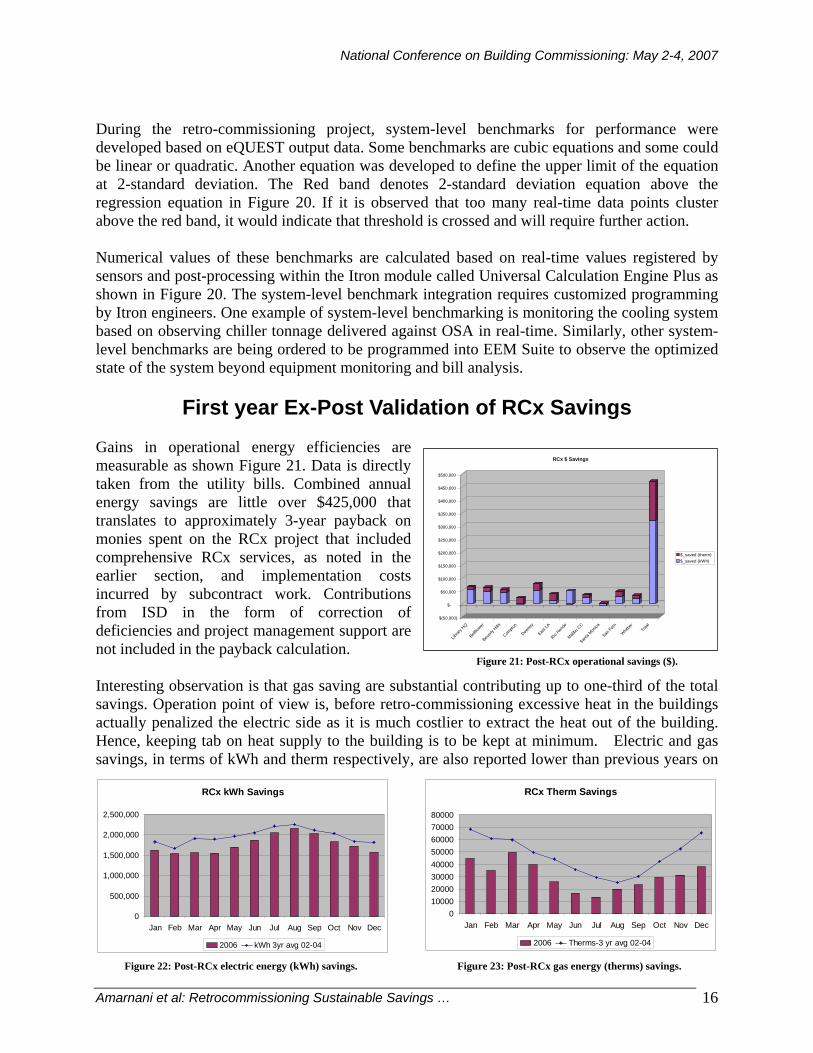
Gas sub-metering Performance At some facilities boiler load is sub-metered. Knowing that over 90% of the billed therms get utilized in the boilers for space heating, it’s easy to compare the bill with metered values to verify, as shown in Figure 19 against metered values as well as against benchmark therm usage. Meter-level benchmarks are usually less precise as it is hard to separate the effects of lighting and plug load draw. However, it could be a good indicator to document the changing operating conditions in the building. It is best if sub-meters could be installed and monitored for lighting and HVAC systems. Automated System-Level Benchmarks The County is now capturing the benefits of persistence in RCx savings by fully utilizing the capabilities of its EEMIS system. By integrating benchmarked data from eQUEST simulations and measured data through the data acquisition system, the County can efficiently analyze various data sets and present information in a systematic manner to support the persistence process. Traditionally, such analyses would involve manual computation of performance matrices of gas and electric EUI, kW per ton and ton-hours for chiller, Btu-hrs for boilers, and other parameters, by using spreadsheets on limited sample data. In Figure 20, it illustrates how the EEMIS approach allows the County to tap into the capabilities of the automated real time analyses of EEMIS data through customized computer algorithm. The process will efficiently gauge the performance of the facilities compared with system-level benchmarks. These benchmarks are being programmed to serve as an alerting function to initiate notification to facility managers when threshold is exceeded.
Figure 19: Whole building measured gas consumption.
Figure 20: RCx persistence process utilizing Universal Calculation Engine Plus (UCE+).
National Conference on Building Commissioning: May 2-4, 2007
Amarnani et al: Retrocommissioning Sustainable Savings … 16
During the retro-commissioning project, system-level benchmarks for performance were developed based on eQUEST output data. Some benchmarks are cubic equations and some could be linear or quadratic. Another equation was developed to define the upper limit of the equation at 2-standard deviation. The Red band denotes 2-standard deviation equation above the regression equation in Figure 20. If it is observed that too many real-time data points cluster above the red band, it would indicate that threshold is crossed and will require further action. Numerical values of these benchmarks are calculated based on real-time values registered by sensors and post-processing within the Itron module called Universal Calculation Engine Plus as shown in Figure 20. The system-level benchmark integration requires customized programming by Itron engineers. One example of system-level benchmarking is monitoring the cooling system based on observing chiller tonnage delivered against OSA in real-time. Similarly, other system-level benchmarks are being ordered to be programmed into EEM Suite to observe the optimized state of the system beyond equipment monitoring and bill analysis.
First year Ex-Post Validation of RCx Savings Gains in operational energy efficiencies are measurable as shown Figure 21. Data is directly taken from the utility bills. Combined annual energy savings are little over $425,000 that translates to approximately 3-year payback on monies spent on the RCx project that included comprehensive RCx services, as noted in the earlier section, and implementation costs incurred by subcontract work. Contributions from ISD in the form of correction of deficiencies and project management support are not included in the payback calculation. Interesting observation is that gas saving are substantial contributing up to one-third of the total savings. Operation point of view is, before retro-commissioning excessive heat in the buildings actually penalized the electric side as it is much costlier to extract the heat out of the building. Hence, keeping tab on heat supply to the building is to be kept at minimum. Electric and gas savings, in terms of kWh and therm respectively, are also reported lower than previous years on
RCx kWh Savings
0
500,000
1,000,000
1,500,000
2,000,000
2,500,000
Jan Feb Mar Apr May Jun Jul Aug Sep Oct Nov Dec
2006 kWh 3yr avg 02-04
Figure 22: Post-RCx electric energy (kWh) savings.
Figure 21: Post-RCx operational savings ($).
$(50,000)
$-
$50,000
$100,000
$150,000
$200,000
$250,000
$300,000
$350,000
$400,000
$450,000
$500,000
Librar
y HQ
Bellflo
wer
Beverl
y Hills
Compto
n
Downe
y
East L
A
Rio Hon
do
Malibu
CC
Santa
Monica
San Fern
Whit
tier
Total
RCx $ Savings
$_saved (therm) $_saved (kWh)
RCx Therm Savings
01000020000300004000050000600007000080000
Jan Feb Mar Apr May Jun Jul Aug Sep Oct Nov Dec
2006 Therms-3 yr avg 02-04
Figure 23: Post-RCx gas energy (therms) savings.
National Conference on Building Commissioning: May 2-4, 2007
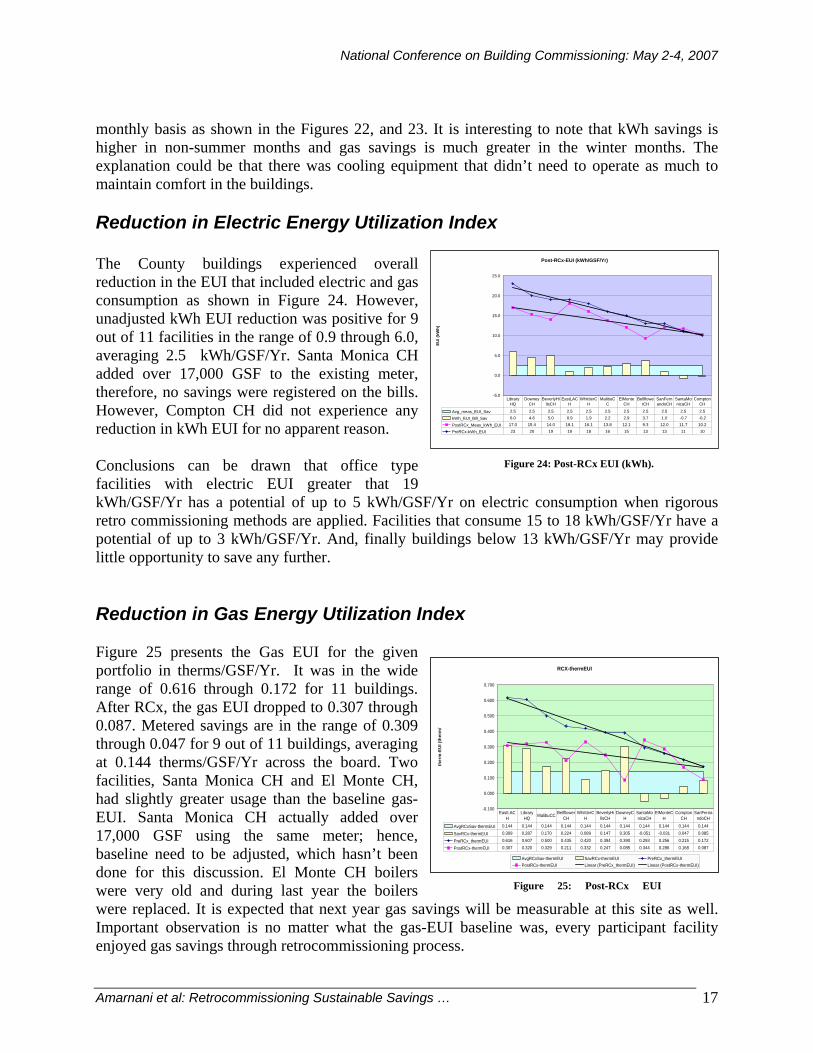
Amarnani et al: Retrocommissioning Sustainable Savings … 17
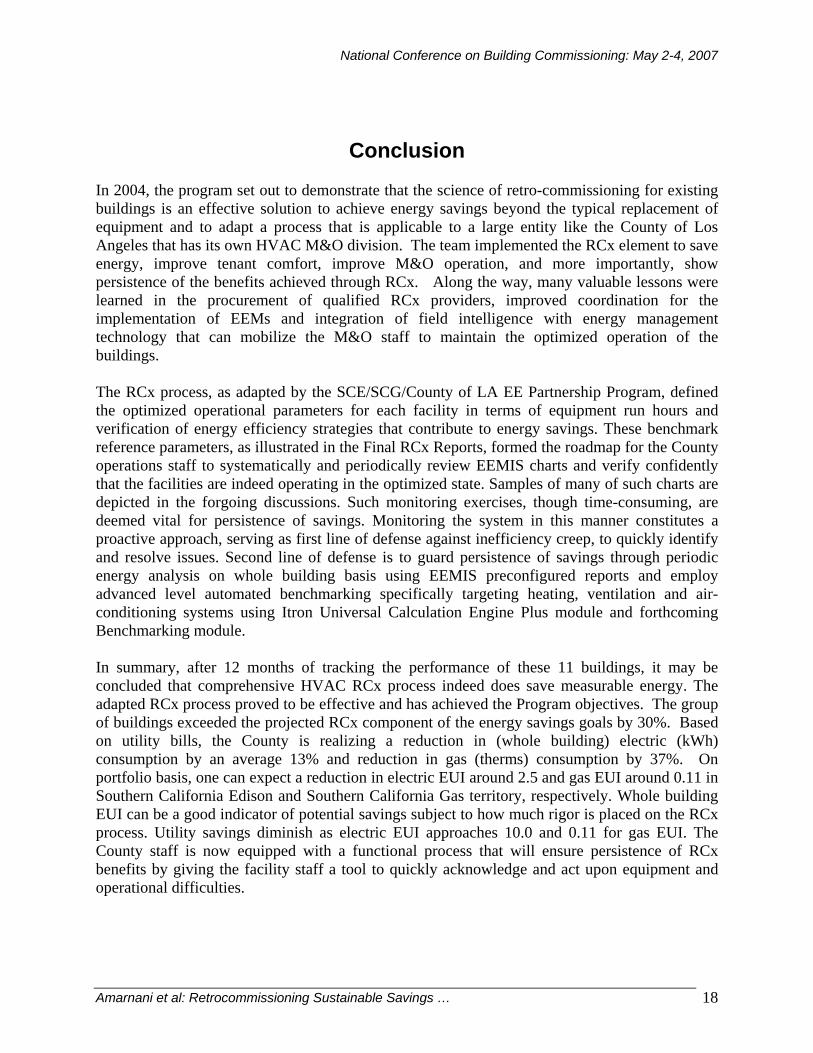
monthly basis as shown in the Figures 22, and 23. It is interesting to note that kWh savings is higher in non-summer months and gas savings is much greater in the winter months. The explanation could be that there was cooling equipment that didn’t need to operate as much to maintain comfort in the buildings. Reduction in Electric Energy Utilization Index The County buildings experienced overall reduction in the EUI that included electric and gas consumption as shown in Figure 24. However, unadjusted kWh EUI reduction was positive for 9 out of 11 facilities in the range of 0.9 through 6.0, averaging 2.5 kWh/GSF/Yr. Santa Monica CH added over 17,000 GSF to the existing meter, therefore, no savings were registered on the bills. However, Compton CH did not experience any reduction in kWh EUI for no apparent reason. Conclusions can be drawn that office type facilities with electric EUI greater that 19 kWh/GSF/Yr has a potential of up to 5 kWh/GSF/Yr on electric consumption when rigorous retro commissioning methods are applied. Facilities that consume 15 to 18 kWh/GSF/Yr have a potential of up to 3 kWh/GSF/Yr. And, finally buildings below 13 kWh/GSF/Yr may provide little opportunity to save any further. Reduction in Gas Energy Utilization Index Figure 25 presents the Gas EUI for the given portfolio in therms/GSF/Yr. It was in the wide range of 0.616 through 0.172 for 11 buildings. After RCx, the gas EUI dropped to 0.307 through 0.087. Metered savings are in the range of 0.309 through 0.047 for 9 out of 11 buildings, averaging at 0.144 therms/GSF/Yr across the board. Two facilities, Santa Monica CH and El Monte CH, had slightly greater usage than the baseline gas-EUI. Santa Monica CH actually added over 17,000 GSF using the same meter; hence, baseline need to be adjusted, which hasn’t been done for this discussion. El Monte CH boilers were very old and during last year the boilers were replaced. It is expected that next year gas savings will be measurable at this site as well. Important observation is no matter what the gas-EUI baseline was, every participant facility enjoyed gas savings through retrocommissioning process.
Post-RCx-EUI (kWh/GSF/Yr)
-5.0
0.0
5.0
10.0
15.0
20.0
25.0
EUI (
kWh)
Avg_meas_EUI_Sav 2.5 2.5 2.5 2.5 2.5 2.5 2.5 2.5 2.5 2.5 2.5
kWh_EUI_Bill_Sav 6.0 4.6 5.0 0.9 1.9 2.2 2.9 3.7 1.0 -0.7 -0.2
PostRCx_Meas_kWh_EUI 17.0 15.4 14.0 18.1 16.1 13.8 12.1 9.3 12.0 11.7 10.2
PreRCx-kWh_EUI 23 20 19 19 18 16 15 13 13 11 10
Library HQ
DowneyCH
BeverlyHillsCH
EastLACH
WhittierCH
MalibuCC
ElMonteCH
BellflowerCH
SanFernandoCH
SantaMonicaCH
ComptonCH
Figure 24: Post-RCx EUI (kWh).
RCX-thermEUI
-0.100
0.000
0.100
0.200
0.300
0.400
0.500
0.600
0.700
ther
m-E
UI (
ther
m/
AvgRCxSav-thermEUI SavRCx-thermEUI PreRCx_thermEUIPostRCx-thermEUI Linear (PreRCx_thermEUI) Linear (PostRCx-thermEUI)
AvgRCxSav-thermEUI 0.144 0.144 0.144 0.144 0.144 0.144 0.144 0.144 0.144 0.144 0.144
SavRCx-thermEUI 0.309 0.287 0.170 0.224 0.089 0.147 0.305 -0.051 -0.031 0.047 0.085
PreRCx_thermEUI 0.616 0.607 0.500 0.435 0.420 0.394 0.390 0.293 0.256 0.215 0.172
PostRCx-thermEUI 0.307 0.320 0.329 0.211 0.332 0.247 0.085 0.344 0.286 0.168 0.087
EastLACH
Library HQ MalibuCC Bellflower
CHWhittierC
HBeverlyHi
llsCHDowneyC
HSantaMonicaCH
ElMonteCH
ComptonCH
SanFernandoCH
Figure 25: Post-RCx EUI
National Conference on Building Commissioning: May 2-4, 2007
Amarnani et al: Retrocommissioning Sustainable Savings … 18
Conclusion
In 2004, the program set out to demonstrate that the science of retro-commissioning for existing buildings is an effective solution to achieve energy savings beyond the typical replacement of equipment and to adapt a process that is applicable to a large entity like the County of Los Angeles that has its own HVAC M&O division. The team implemented the RCx element to save energy, improve tenant comfort, improve M&O operation, and more importantly, show persistence of the benefits achieved through RCx. Along the way, many valuable lessons were learned in the procurement of qualified RCx providers, improved coordination for the implementation of EEMs and integration of field intelligence with energy management technology that can mobilize the M&O staff to maintain the optimized operation of the buildings. The RCx process, as adapted by the SCE/SCG/County of LA EE Partnership Program, defined the optimized operational parameters for each facility in terms of equipment run hours and verification of energy efficiency strategies that contribute to energy savings. These benchmark reference parameters, as illustrated in the Final RCx Reports, formed the roadmap for the County operations staff to systematically and periodically review EEMIS charts and verify confidently that the facilities are indeed operating in the optimized state. Samples of many of such charts are depicted in the forgoing discussions. Such monitoring exercises, though time-consuming, are deemed vital for persistence of savings. Monitoring the system in this manner constitutes a proactive approach, serving as first line of defense against inefficiency creep, to quickly identify and resolve issues. Second line of defense is to guard persistence of savings through periodic energy analysis on whole building basis using EEMIS preconfigured reports and employ advanced level automated benchmarking specifically targeting heating, ventilation and air-conditioning systems using Itron Universal Calculation Engine Plus module and forthcoming Benchmarking module. In summary, after 12 months of tracking the performance of these 11 buildings, it may be concluded that comprehensive HVAC RCx process indeed does save measurable energy. The adapted RCx process proved to be effective and has achieved the Program objectives. The group of buildings exceeded the projected RCx component of the energy savings goals by 30%. Based on utility bills, the County is realizing a reduction in (whole building) electric (kWh) consumption by an average 13% and reduction in gas (therms) consumption by 37%. On portfolio basis, one can expect a reduction in electric EUI around 2.5 and gas EUI around 0.11 in Southern California Edison and Southern California Gas territory, respectively. Whole building EUI can be a good indicator of potential savings subject to how much rigor is placed on the RCx process. Utility savings diminish as electric EUI approaches 10.0 and 0.11 for gas EUI. The County staff is now equipped with a functional process that will ensure persistence of RCx benefits by giving the facility staff a tool to quickly acknowledge and act upon equipment and operational difficulties.
National Conference on Building Commissioning: May 2-4, 2007
Amarnani et al: Retrocommissioning Sustainable Savings … 19
References Amarnani, N. and Roberts, B., “Value of Enterprise Energy Management Information System in Retro-commissioning (RCx) Program Los Angeles County Buildings”, County of Los Angeles, Itron Users’ Conference Palm Springs, CA. October 2006 http://www.itron.com/pages/uc06/ppt/eem_achenergyefficiency_namarnani.ppt#491,1 Kulakowski, S., “Case Study: Lessons Learned in Campus-Wide EEM Implementation”, Stanford University, Itron Users’ Conference Palm Springs CA October 2006 http://www.itron.com/pages/uc06/ppt/eem_lessonslearned_skulakowski.ppt Pierce, R.A., and Amarnani, N. “A Competitively Bid Retrocommissioning Project in the County of Los Angeles - A Model Process?”, Southern California Edison and County of Los Angeles, Proceedings of National Conference on Building Commissioning, San Francisco, CA, 2006 http://www.peci.org/ncbc/proceedings/2006/09_Pierce_NCBC2006.pdf Poeling, N. “Tuning Up the Retrocommissioning Process”, EMC Engineers, Proceedings of National Conference on Building Commissioning, San Francisco, CA, 2006 http://www.peci.org/ncbc/proceedings/2006/21_Poeling_NCBC2006.pdf