Embed Size (px)
Citation preview

RETENTION OF NEW GRADUATES TO THEIR FIRST PROFESSIONAL
ROLE: PERCEPTIONS OF THOSE THAT HAVE STAYED
A DISSERTATION IN NURSING
Presented to the Faculty of the University
of Missouri-Kansas City in partial fulfillment of the requirements for the degree
DOCTOR OF PHILOSOPHY
by Aimee McDonald
B.S.N. Rockhurst University and Research College of Nursing, 2002 M.S.N. Research College of Nursing, 2007
Kansas City, Missouri 2016

Copyright © 2016 Aimee McDonald
All Rights Reserved

iii
WHY GRADUATE NURSES STAY IN THEIR FIRST PROFESSIONAL ROLE
Aimee McDonald, Candidate for the Doctor of Philosophy Degree
University of Missouri - Kansas City, 2016
ABSTRACT
There is an inability to retain new graduate nurses in their initial positions.
Patricia Benner (1984) developed the From Novice to Expert Theory of nurse
development outlining the nurses’ transition through the developmental stages of novice,
advanced beginner, competent, proficient, and expert across time. There is little known
about the reason(s) why nurses remain in their initial position, as previous research has
focused on why nurse leave. To fill this gap in knowledge, nurses who have been
retained in their original practice area, responded to the Practice Environment Scale of
Nursing Work Index (PES-NWI) to provide their perceptions of what is right within their
professional environments.

iv
APPROVAL PAGE
The faculty listed below, appointed by the Dean of the School of Nursing and
Health Studies, have examined a dissertation titled, “Retention of new graduates to their
first professional role: Perceptions of those that have stayed”, presented by Aimee
McDonald, candidate for the Doctor of Philosophy degree, and hereby certify that in their
opinion it is worthy of acceptance.
SUPERVISORY COMMITTEE
Peggy Ward-Smith, RN, Ph.D., Committee Chair School of Nursing
Carolyn Barber, Ph.D. School of Education
Jane Peterson, Ph.D., R.N. School of Nursing
Carol Schmer, Ph.D., R.N. School of Nursing
Lynette M. Wheeler, D.N.P., R.N. Truman Medical Centers

v
CONTENTS ABSTRACT ....................................................................................................................... iii
TABLES .......................................................................................................................... viii
GRAPHS ............................................................................................................................ ix
ACKNOWLEDGEMENTS ............................................................................................... x
Chapter
1. INURSING ENVIRONEMENT ......................................................................................1
Background .............................................................................................................2
Purpose and Research Questions ............................................................................3
Significance .............................................................................................................3
2. REVIEW OF THE LITERATURE AND THEORETICAL FRAMEWORK ................4
Facilitators of Retention ..........................................................................................7
Barriers to Retention ...............................................................................................8
Theoretical Perspectives ........................................................................................21
3. METHODS ...................................................................................................................24
Study Activities.......................................................... ............................................25
Study Participants ..................................................................................................26
4. RESULTS .....................................................................................................................29
Plan of Analysis .....................................................................................................29
Research Question One .........................................................................................29
Research Question Two .........................................................................................30
Purpose ...................................................................................................................30
Demographic Description of Participants ..............................................................30
PES-NWI Score Characteristics ............................................................................33

vi
Participation in Hospital Affairs Variable ............................................................34
Quality of Care Variable ........................................................................................35
Leadership Variable ...............................................................................................36
Staffing Variable ....................................................................................................37
Nurse-physician Relationship Variable .................................................................38
Subscale Composite Score .....................................................................................39
Independent Sample t-Test ....................................................................................40
Variance Explained ................................................................................................41
Answering Research Questions .............................................................................43
5. CONCLUSIONS AND IMPLICATIONS .....................................................................45
Appendix
A. Tables ...........................................................................................................................48
B. Instrument Permission ................................................................................................69
C. Instrument ...................................................................................................................71
D. Demographic Questions ..............................................................................................73
E. UMKC IRB Application ..............................................................................................74
F. Committee Approval/Letters of Support .....................................................................75
G. HIPAA Application .....................................................................................................78
H. TMC Exempt Application............................................................................................79
I. Centerpoint IRB Application .......................................................................................83
J. Instrument Scoring .......................................................................................................84
K. Protocol Closure Confirmation ....................................................................................85
REFERENCES .................................................................................................................86

vii
VITA ...........................................................................................................................97

viii
TABLES
Tables Page
1. Urban Data .............................................................................................................33
2. Suburban Data ........................................................................................................34
3. Urban Length of Time in Present Position ............................................................48
4. Urban Age in Years ...............................................................................................49
5. Urban Gender .........................................................................................................50
6. Urban Level of Education ......................................................................................51
7. Urban Area of Practice...........................................................................................52
8. Urban Shifts per Week ...........................................................................................53
9. Suburban Length of Time in Present Position .......................................................54
10. Suburban Age in Years ..........................................................................................55
11. Suburban Level of Education.................................................................................56
12. Suburban Area of Practice .....................................................................................57
13. Group Statistics ......................................................................................................58
14. T-Test .....................................................................................................................59
15. Urban Correlations .................................................................................................61
16. Suburban Correlations ...........................................................................................63
17. Variance Explained ................................................................................................65
18. Component Matrix .................................................................................................66

ix
GRAPHS
Graphs Page
1. Combined Data Nurse Participation ......................................................................35
2. Combined Data Quality of Care ............................................................................36
3. Combined Data Nurse Manager Ability ................................................................37
4. Combined Data Nurse-Physician Relationships ...................................................38
5. Combined Data Staffing and Resource Adequacy.................................................39
6. Combined Data Component Scores ......................................................................40
7. Scree Plot ...............................................................................................................43

x
ACKNOWLEDGEMENTS
I have told students many times over the years that nursing is a team sport; it takes
the entire team to be successful. There is no place this is more accurate than when
working on a Doctorate of Philosophy where it took the support of my family, friends,
and colleagues to survive this journey.
My biggest support, my family, specifically my children who do not remember a
time when mom was not in school. I adore these kids who have grown up believing mom
was cool because she was working to achieve her dreams. I am so grateful to the two of
you. There are no words to express my love and appreciation for these amazing kids.
Thank you both!
To my parents, who have been baby sitters, cheer leaders, and support as I have
traversed this path. I too thank you. You have both always shown belief in me and in any
dream I possessed. Thank you for your unwavering faith, love, and support!
To my chair, Dr. Peggy Ward-Smith, you more than most have stood by me,
pushed me to do more and better when you knew I could, and shown me what it truly
means to persevere. To my committee members, Drs. Carolyn Barber, Jane Peterson,
Carol Schmer, and Lynette Wheeler thank you all for challenging me to grow as both a
nurse researcher and as a statistician. Your guidance was invaluable along this journey.
Thank you all!
Finally, I want to acknowledge my partner and the love of my life. You returned
to me late in this journey and have challenged me to get it done. Whether help with the
kids, allowing me time and space to work, or holding me up when I felt like it was all too
much, thank you!

xi
DEDICATION
This dissertation is dedicated to the five most important people in my world, my
parents, Rex Dixon and Janet Dixon, my children Emma and Liam, and the love of my
life, Billy. I am blessed to have had you all with me through this journey.
1
CHAPTER 1
NURSING ENVIRONMENT
The ongoing and persistent shortage of nurses (RNs) is anticipated to continue
over the next decade. Rossterre (2014) summarizes data from the American Association
of Colleges of Nursing (AACN) and the Bureau of Labor Statistics, which indicate a need
for just over a million new nurses by the year 2022. Yet previous reports from the
Bureau of Labor Statistics (2012) reflect the number of people entering the profession of
nursing will remain stagnate (Censullo, 2008; McDonald & Ward-Smith, 2012). In
addition to the shortage of RNs, Trepanier and associates (2012) suggest a turnover rate
among RNs to be as high as 75% within the first 12 months of hire. Of these nurses, it is
estimated that 8% leave the profession (Fiester, 2013).
Previous research has described why RNs leave their initial position, within their
initial 12 months (Bowles & Candela, 2005; Rother & Lavizzo-Mourey, 2009), but there
is a paucity of research describing the work experience of those that remain. According
to MacKusick and Minick (2010) work environment variables, such as an unfriendly
workplace, emotional distress related to patient care, and fatigue and exhaustion are the
most frequently cited reasons for RNs exiting their initial position. Other researchers
have also reported workplace variables, such as a satisfactory work environment, as the
principal cause of leaving one’s initial position (Kutney-Lee, Wu, Sloane, & Aiken,
2012; Tourangeau, Cranley, Laschinger, & Pachis, 2010; Van Bogaert, Clarke, Willems,
& Mondelaers, 2012). Patient outcomes and overall job satisfaction are other variables
within any practice environment; research by Kooker and Kamikawa (2010), Lake

2
(2007b), and Laschinger (2014), correlate a satisfactory work environment with increased
retention of RNs in their initial position.
Despite the results of these studies, which will be described in further detail in
chapter two, a clinical model describing or identifying critical variables has yet to be
developed. Obtaining data from RNs who have left their initial position provides one
portion of the phenomenon; what is wrong. The perspective of the RNs who stay is
needed to determine what is right. Data for this study will be obtained from RNs who
have remained in their initial clinical position for at least 12 months. These data will be
used to identify and describe the variables, which when present, enhance retention.
Background
Despite the efforts of the AACN (Rosseter, 2014), the Institute of Medicine
(2011), and the Robert Wood Johnson Foundation (2013) the inability to retain new
graduate RNs in their initial position remains. While interventions to retain students in
nursing programs and residency programs appear to be having an impact (Altier & Krsek,
2006; Melnyk & Fineout-Overholt, 2011), there is little known about the reason(s) why
nurses remain in their initial position. Interventions, aimed at impacting retention, have
included orientation and residency programs, transitions programs, internship and
preceptor programs, externship programs, and post-orientation programs (McDonald &
Ward-Smith, 2012). The AACN recommends Nurse Residency Programs as the
intervention of choice (Trossman, 2009). While each of these interventions report the
ability to decrease attrition, limitations and generalizability of the results prevent
widespread adaptation.
The purpose of this descriptive study is identify and describe variables, which in

3
the perception of RNs who have been in their initial position for at least 12 months,
results in their ability to remain. These data will address a gap in our knowledge; the
perception of the RN who stays, and provide a complete picture of the initial RN job
experience. Thus, interventions can be developed using research evidence, which
increases their effectiveness (Polit & Beck, 2012).
Purpose and Research Questions
The purpose of this dissertation study is to identify and describe variables, which
in the perception of RNs who have been in their initial position for at least 12 months,
result in the ability to remain. These data will address a gap in our knowledge; the
perception of the RN who stays, and provide a complete picture of the initial RN job
experience. Thus, interventions can be developed using research evidence, which
increases their effectiveness (Polit & Beck, 2012). The primary research questions for
the study to address the perception of the RN who stays are:
1) What constructs, when present in the practice environment, result in retention?
2) Does the type of healthcare facility alter the desired practice environment?
Significance
This study will provide information on what the workplace environment has done
right to retain RNs in the specific practice areas during crucial time of transition from
beginner to advanced beginner (Benner, 1892). Without retaining RNs within each
practice setting, there is no expert in the practice area, as it takes three to five years to
develop an expert (Benner, 1982). Once it is known what has been done right within the
practice setting, there is the potential to develop interventions aimed at duplicating these
interventions, thus increasing retention into a practice setting.
4
CHAPTER 2
REVIEW OF THE LITERATURE AND THEORETICAL FRAMEWORK
Patricia Benner (1982) formulated the nursing theory, Novice to Expert, based on
the Dreyfus Model of Skill Acquisition. At the time, Benner (1982) noted the increasing
use of technology and the increasing workload on the registered nurses (RNs), stating the
“…interchangeability of nursing personnel were considered easy answers to
turnover…responsibility of nursing care for patient welfare was ignored…” (p. 402).
Benner’s (1982) solution to the increasing professional demands on the nurse was to first
understand how the RN developed as a professional through five levels of skill
acquisition: novice, advanced beginner, competent, proficient, and expert. This transition
reflects the movement from reliance on what the RN is told to a reliance on one’s own
experiences as an RN when making professional decisions. To further understand the
process, Benner (1982) noted the RN begins with no experience as a novice, thus
decisions are all based upon a set of rules learned during the educational process. At the
novice level of skill acquisition, RNs have no frame of reference for the gray areas within
practice or the exceptions to the rules they have learned. The advanced beginner starts to
make connections between what they have learned as rules and what they have witnessed
in their own practice. Functioning within this level of practice, RNs cannot yet
distinguish clearly between levels of importance, thus everything is critical and relevant
in this stage. Competence, the third phase of acquisition, occurs for the RN after two to
three years of practice in the same setting. An RN within this phase can see that their
actions will impact their patient and the outcomes of that patient. As a practitioner has
more experiences within the expert stage gains further understanding on the big picture
5
outcomes, and how each person involved in the patient’s care will impact the outcomes
for that patient. At this point the RN has completed the transition into the profession.
This process of growth and development indicates the need for RNs to have such
opportunities within their professional practice. It is also important, according to Benner
(1982), to provide opportunities within a RNs practice for recognition and rewards,
including encouragement to specialize within an area of practice, leaving behind the
historical concept that nurses are interchangeable.
The situation of nursing turnover was not resolved with Benner’s revelations in
the 1980s. Instead, the problem is relevant today with the Institute of Medicine (IOM)
(2011) recommending that: RNs practice to utilize all their education and training; RNs
continue their education beyond entry into the profession; that RNs become a part of the
health care team; and that workplaces for RNs must improve their infrastructures (p. 1).
The American Association of Critical-Care Nurses (AACN) (2009) and American Nurses
Association (ANA) (Bleich, 2012) also indicate there is a need for supporting the RN
during the novice to expert transition, through the recommended use of nurse residency
programs. In order for any of these processes to be effective, a foundational
understanding of RNs perception of what is right within the transition needs to be
discovered. With this information, researchers can build more effective interventions to
increase nursing retention within initial employment positions.
Data collection for this study will consist of responses to the Practice
Environment Scale of the Nursing Work Index (PES-NWI) (Lake, 2002). This
instrument assesses facilitators and barriers to retention, with the sum score describing
the practice environment. Research results from Lake (2002) identified five factors that

6
serve as either a facilitator or a barrier to the nursing work environment. The facilitators
of retention are present with higher scores on the PES-NWI, while lower scores indicate
barriers toward retention exist (Lake, 2002). Constructs hypothesized as facilitators or
barrier of retention will be presented separately.
Other theories addressing the construct of retention include the Contingency
Theory (Loveridge, 1988), which focuses specifically at the relationship between
organization structure and its technology, showing organizations are only as effective as
the policy and procedure structure that supports practice. This theory specifically
measures instability, uncertainty, and variability of client conditions, economic impact of
turnover, organizational design at the unit level (decentralization and destandardization),
and the use of effective nursing practice. This theory was not chosen due to the narrow
focus on the unit and technology specific impact versus the broad practice environment
by specialty and all potential impacting factors.
Another theory considered was the Modeling and Role Modeling Theory (Arruda,
2005). This theory uses Maslow’s hierarchy of needs as the driver for human behavior,
specifically staff needs. Staff members who have the perception of unmet needs
(physiological, safety, love, affection, belonging, self-esteem, and transcendence) are as a
result unsatisfied, leading to organizational and professional separation. This theory
specifically looked at those who have separated a different population than the novice
who is engaged and retained within the organization.
Finally, Kanter’s 1977 Structural Empowerment theory, explains the factors,
which relate directly to turnover. The constructs measured within this theory include:
opportunity, structure of power, access to resources, information, and support (Kanter,

7
1977). As the theory has been utilized to specifically measure intent to stay (Nedd,
2006), this theory was the closest to answering the specific research questions. However,
as the theory does not focus specifically on the population variables of those transitioning
through the novice to expert phase, this theory too was not selected for this research.
Facilitators of Retention
In a comprehensive review of the literature, McDonald and Ward-Smith (2013)
found several effective methods to facilitate retention of the new graduate nurse. These
include transition programs, internship and preceptorship programs, externship programs,
postorientation programs, and residency programs. Each of these programs shares the
ability to support the new nurse in the transition from graduation (novice) to expert (an
RN retained in their position).
Specifically, transition programs are those that help the RN “transition” from the
classroom, through the licensure exam, and into the practice setting. Salt, Cummings,
and Profetto-McGrath (2008) found that programs supporting RNs through this transition
period might increase retention by as much as 50%. Salt and associates also found a
direct correlation with program length and retention, the longer the program, the higher
the retention.
Preceptorships and internship programs vary in length from a few as three
months, to those in excess of 12 months. Melnyk and Fineout-Overholt (2011)
determined preceptorships, or matching a new RN with an experienced one, is the most
common forms of program used for transition. Beauregard, Davis, and Kutash (2007)
noted that in offering a staggered approach to clinical care beyond the traditional
orientation increased nursing comfort and exposure across their orientation. This

8
program also allowed RNs to assess “fit” within each unit during orientation. Across the
four years of the program, data indicate a 93% rate of nursing retention.
Nursing residency programs are the favored program within the literature and are
supported by both the AACN (McGuinn, 2015) and the ANA (Bleich, 2012; Trossman,
2009). Though such programs have been utilized since the 1980s, as early as 2006 Altier
and Krsek documented both retention and satisfaction increase with the implementation
of nursing residency programs. In 2011, Melnyk and Fineout-Overholt performed a
longitudinal study of six academic health centers utilizing a consistent curriculum within
their nurse residency programs. Evaluating the participants, new graduate nurses, twice
during the program indicated both job satisfaction and retention increased significantly
during the first year of practice.
Barriers to Retention
Research has indicated that there are multiple barriers to nursing retention.
Evidence has linked nursing retention to multiple factors including the perception of the
environment (Bowels & Candela, 2005; Buffington, DeVine, Zwink, Sanders, & Fink,
2012; Laschinger, Grau, Finegan, & Wilk, 2010; Smith, Andrusyzyn, & Laschinger,
2010), the level of satisfaction of the employees, including engagement of staff and
ability to feel supported and encouraged by management (Buffington et al.; Friese and
Himes-Ferris, 2013; Laschinger, 2012; Purdy, Laschinger, Finegan, Kerr, & Olivera,
2010).
Items within the PES-NWI (Lake, 2002) assess only workplace variables that
contribute to retention. Personal variables also influence job retention, and these are not
captured by the PES-NWI. Thus, the PES-NWI is limited by the ability to only assess
9
barriers specific to the work environment.
Physical and Emotional Environment
Nursing work environments are complex, thus many things affect the ability to
provide care. Identified variables include: the physical and emotional work environment,
support and encouragement from patients, peers, and superiors, recognition or
appreciation for the care they provide, their relationship with the interdisciplinary team,
and having mentors within the same role (Buffington, DeVine, Zwink, Sanders, & Fink,
2012). The American Nurses’ Association [ANA] (2016) defines a work environment as
one that is “…safe, empowering, and satisfying.” Bowels and Candela (2005) found RNs
describe their work environments as negative places with high stress and management
that does not truly listen to the staff or their needs. This remains a current concern
(ANA, 2016) as there is a perception of caring from mangers and charge nurses;
however, the responses and actions from management personnel indicate they do not
listen to the concerns of nursing (Bowels & Candela, 2005). Kupperschmidt, Kientz,
Ward, and Reinholz (2010) note the healthy work environment also has to incorporate
successful communication from the RNs about their perceptions.
Another barrier to satisfaction within the workplace is incivility, a variable which
impacts both respect and empowerment, leading to burnout (Laschinger, et al., 2010;
Smith, et al., 2010). Laschinger and associates (2010) correlate burnout as the result of
bullying for the new RN. In an environment where bullying is prevalent toward the new
RN, as they do not have a high level of empowerment, burnout increases and satisfaction
and retention decrease (Laschinger et al., 2010). To add to the connection of burnout,
empowerment, satisfaction, and retention, Laschinger, Wong, and Grau (2013) showed

10
that authentic leadership increased empowerment and decreased burnout, having a
mediating affect.
These results bring the barriers to nursing retention full circle, showing the links
between leadership, environment, satisfaction, and retention. While personal variables,
such as marriage, childbirth, and relocation, contribute to retention issues that no
intervention can prevent, there are situational and environmental challenges that, if
addressed, may decrease their effect on retention. The personal variables are the result of
the developmental stage of new RNs – being at an age of identity exploration, where they
are generally instable, self-focused, and feel professionally and personally in-between,
not yet an adult, with an optimistic outlook toward the possibilities (Munsey, 2006).
Despite the stage-of-life, barriers to retention have been identified by previous research.
While these barriers exist, despite interventions aimed at decreasing or removing them,
new RNs are able to navigate past them to be successful. Data, describing this
phenomenon from their perspective, does not exit. This study will describe how, despite
these barriers, retention of the new RN, is possible.
Satisfaction
In 2012 Buffington et al. reported satisfaction as a barrier to retention within an
academic Magnet® organization. Specifically, management (support from, integrity of,
and professional development mentoring), workload (acuity of patients), staffing (number
of nurses per patient), compensation (salary and benefits), scheduling (inability to self-
schedule, weekend rotations, and holiday rotations), hours of shifts (12 hours in length),
and family needs were reasons nurses reported a decrease their satisfaction, and would
result in them leaving their present position (Buffington, 2012).

11
Satisfaction, as evaluated by the PES-NWI (Lake, 2002), assesses only
organizational structure variables. Lu, While, and Barribell (2005) identify additional
variables which impact overall job satisfaction beyond the organizational structure.
Despite this, satisfaction with the organizational structure appears to correlate highly with
retention.
Support
Friese and Himes-Ferris (2013) found similar barriers to retention within a
population of oncology nurses. Within this population, staffing was not a nurse to patient
ratio concern, but a concern with support resource adequacy and its use. However,
staffing in this population significantly impacted both intent to stay and satisfaction.
Friese and Himes-Ferris (2013) also concluded that management satisfaction and
empowerment, or the ability of the nurse to have some autonomy within their practice
and be an important part of the multi-disciplinary healthcare team, also impacted
satisfaction, thus retention.
Support, as operationalized within the PES-NWI (Lake, 2002), is limited the
perception of the nurse specific to management and supervisory support and staffing
ratios. However, Herzberg and Mausner (1959) show motivators that provide support,
thus satisfaction may be perceived through intrinsic factors, in addition to extrinsic
variables.
Empowerment
Manojlovich (2007) defines empowerment in nursing as being multifocal, from
both the environment and one’s own professional development. Kanter (1977) focused
on the relationship of power and the environment, empowerment coming from the formal

12
and informal power an individual holds within an organization. Formal power is defined
as coming from flexibility, visibility, and creativity within an organization and informal
power as coming from ones relationships both within and beyond the organization (Nedd,
2006).
Research results from Finegan and Laschinger (2005) conclude that outcomes
from empowerment of staff may be realized in improved trust and respect in the
workplace, thus increasing satisfaction and retention. When this combination of traits is
lacking, nurse satisfaction and retention rates were significantly lower. These results
have been replicated by subsequent research; productivity and patient outcomes were also
identified as outcomes when empowerment is present (Laschinger, 2012; Purdy, et al.,
2010).
Empowerment in the workplace should not be understated, yet retention has not
been directly linked to this variable. Empowerment is a multi-faceted variable,
influenced by cultural, educational, and situational conditions (Blegen, 1993; Hinshaw,
Smeltzer, & Atwood, 1987). Empowerment data obtained on the PES-NWI (Lake, 2002)
is situational and environmental specific to the clinical setting.
Study Instrument
The PES-NWI (Lake, 2002) has been utilized as a gauge of the environment in
which nurses’ practice (Warshawsky & Havens, 2011). In a comprehensive review of the
instruments use since 2002, Warshawsky and Havens (2011) found that the instruments
use has increased, with the current edition of the PES-NWI being utilized with primary
data sources. As of 2009, The Joint Commission began using the PES-NWI to determine
hospital staffing effectiveness and how it meets accreditation standards. The National

13
Quality Forum (2004) also utilizes the PES-NWI (Lake, 2002) to measure nursing care
within facilities. This instrument has been validated in cross sectional survey design
studies evaluating the practice environment and interventions to improve it.
The PES-NWI uses a 4-point Likert scale (1, strongly disagree, 4, strongly agree,
and no neutral response possible) (Lake, 2002a; Lake, 2007b; Warshawsky & Havens,
2011). Nurses are asked to rate their current practice environment from the perspective
of each participant. The PES-NWI has been used in 23 studies in the United States, 16 of
which correlated instrument scores and organizational variables (Warshawsky & Havens,
2011). All 23 studies cited by Warshawsky and Havens (2011) correlated the perceived
quality of the practice environment and nurse specific outcomes.
Significant positive correlations exist between the PES-NWI and nursing
empowerment, job enjoyment, and organizational commitment (Warshawsky & Havens,
2011). Results of studies utilizing the PES-NWI have found a statistically significant
correlation between nursing satisfaction and staffing, leadership/management, and the
relationship of the multidisciplinary team. Statistically negative correlations have been
found between the PES-NWI and burnout, dissatisfaction, and intent to leave their current
position (Warshawsky & Havens, 2011).
Nurse Practice Environment
The PES-NWI has been consistently used within research to evaluate the nursing
practice environment (Bruyneel et al., 2014; Friese & Himes-Ferris, 2013; Gardner,
Fogg, Thomas-Hawkins, & Latham, 2007; Gardner & Walton, 2011; Hamilton et al.,
2010; Hanrahan & Aiken, 2008; Havens, Warshawsky, & Vasey, 2012; Kelly, McHugh,
& Sloane, 2014; Lake & Friese, 2006; Lavoie-Tremblay, Paquet, Marchionni, &
14
Drevniok, 2011; Liou & Cheng, 2009; Liou & Grobe, 2008; McHugh et al., 2013;
Numminee et al., 2015; Quality Forum, 2004; Siu, Laschinger, & Finegan, 2008; The
Joint Commission, 2009; Walker, Fitzgerald, & Duff, 2014; Wang, Liu, & Wang, 2015).
International use of the scale is also prevalent, with the scale being utilized in Canada
(Siu et al., 2008), Belgium (Bruyneel et al., 2014), Finland (Nummimen et al., 2015),
Australia (Walker et al., 2014), and China (Wang et al., 2015). The PES-NWI is also
supported by the Magnet® programs and the Affordable Care Act (Lundmark, 2014;
Luzinski, 2012; Gardner et al., 2007; McHugh et al., 2013) due to the impact the
environment has shown to have on patient outcomes and nursing retention.
Within the PES-NWI there are five subscales: 1) nurse participation in hospital
affairs, 2) nurse foundations for quality of care, 3) nurse manager ability, leadership, and
support of nurses, 4) staffing support and resource adequacy and 5) collegial nurse-
physician relations (Lake, 2002). The PES-NWI is compiled of 31 items. Each subscale
is then Likert scored (1-4) scale, with scores above 2.5 indicating agreement with the
item content and those below 2.5 indicating disagreement with the item content. There
are nine items assessing nurse participation in hospital affairs, 10 items assessing nursing
foundations for quality of care, five items assessing nurse manager ability, leadership and
support of nurses, four items that assessing staffing and resource adequacy, and three
items assessing collegial nurse-physician relations. A composite score can also be
calculated using the mean of all the subscales (Lake, 2002a).
Lake and Friese (2006) completed a cross-sectional analysis of all the nursing
survey data from 1999 in Pennsylvania. In this evaluation, the practice environment was
assessed using the PES-NWI. Of the 136 hospitals within the state of Pennsylvania

15
included in the assessment only 17% were found to have positive practice environments.
Higher levels of satisfaction were found to correlate directly with the higher numbers of
RNs at the bedside (1.3 RNs per bed). Within Magnet® hospitals, the score were 2.5
standard deviations higher than other facilities. Overall, teaching hospitals had negative
practice environments by comparison (Lake & Friese, 2006).
Using the same Pennsylvania dataset from 1999, Hanrahan and Ailken (2008)
obtained a random sample of 50% (80,500 RNs) and achieved an N=43,000, or a 52%
response rate. Dividing the respondents into two subgroups, nonpsychiatric nurses
(n=11,527) and psychiatric nurses (n=456). Of this population, the psychiatric nurses
were found to have a mean age of 45 years, while the nonpsychiatric nurses had a mean
age of 40 years. PES-NWI results (n=444 and n=10,843) indicated within both groups
staffing levels were shifting, with an increase in the number of patients per RN,
psychiatric nurses mores than nonpsychiatric nurses. In addition, there are not enough
staff members to get the work done (p=.009), as recognized primarily by nonpsychiatric
nurses. Overall, 41% of nurses within this study were dissatisfied with their jobs
(Hanrahan & Aiken, 2008).
Kelly, McHugh, and Sloane (2014) used a cross-sectional research method to
obtain data from RNs within multiple states to evaluate the mortality of ventilated
patients in relation to their care environment. Study inclusion criteria required hospitals
to have more than 100 critical care admissions of Medicare patients across the two years
of the study, more than five nurses who responded to the survey working in a critical care
area, and patients who were 65 years and older and on mechanical ventilation during their
critical care stay. The PES-NWI composite score was utilized to classify the perception

16
of the work environment. The study results were obtained from data on 55,519 ventilated
patients across four states, in 303 hospitals. Among this population, there were an
average of 10.6 critical care nurses per hospital, staffing ratios averaged 2.15:1, half of
the critical care nurses had a bachelor’s degree or higher, and the average number of
years each nurse had at the bedside was 11.6. The overall averaged composite score for
the work environments was 2.73 (SD = 0.30). To further examine the environmental
perceptions, 24% of hospitals had better work environments, 49% had mixed work
environments, and 28% perceived their work environments to be worse. Study results
indicated that both nurse education (odds ratio [OR] = 0.98; p < 0.05) and nurse work
environment (OR = 0.89; p < 0.05) impact mortality. This indicated that your mortality
was reduced by 11% within hospital having good work environments (Kelly et al., 2014).
Liou and Cheng (2008) evaluated the practice environment of Asian RNs and
explored their intent to leave based on cultural perspectives. Using a cross-sectional
correlational design, the study participants were recruited using snowball sampling.
Asian RNs in this study perceived they worked in professional practice environments
(M=3.45; SD=0.86); however they did not perceive there were adequate levels of staffing
(M=2.79; SD=1.09). Overall, 94.3% of these RNs responded that they did not intend to
leave their current job. The study also found no significant correlation between intent to
leave and cultural perspective (p=.07 and .10) (Liou & Cheng, 2008).
Among Asian RNs working in the United Sates, Liou and Cheng (2009) validated
the PES-NWI with a Chronback’s alpha =.96. With an 71% response rate (n=231), from
a sample of 321 Asian nurses working in California and Texas, results from this sample
indicated a higher Chronbach’s alpha, with item correlation ranging from .49-.79 and a

17
mean of .66. Though Liou and Cheng (2009) determined the instrument to be valid
within this population, the researchers found a need to reconstruct four of the five factors
and rename one to address the cultural differences (Liou & Cheng, 2009).
Within the rural setting practice environment the PES-NWI has been used to
effectively describe the practice environment (Havens et al., 2012). In a convenience
sample of 1,937 rural RNs across six hospitals who had been employed within each
institution for more than three months were surveyed. With a response rate of 59%
(N=1,139) the results indicated a composite Cronbach’s alpha = .93. Within the study
participants self-identified their clinical practice area, with no area scoring higher than
any other across all five subscales. This study provided internal consistency for the PES-
NWI and found that overall, rural practice environments were perceived as favorable (M
= 2.78; SD=0.47) (Havens et al., 2012).
Ambulatory practice environments have also been evaluated using the PES-NWI
(Friese & Himes-Ferris, 2013). Using a cross-sectional survey design, the PES-NWI was
administered to 402 ambulatory oncology RNs. The survey response rate was 87.4%
(N=208). Of these respondents, only 12.6% (n=26) indicated intent to leave within the
next year. Upon calculation of data, 80.9% (n=168) were satisfied or very satisfied with
their current work environment (Fries & Himes-Ferris, 2013).
Within the inpatient setting, data were collected from oncology RNs by Shange
and colleagues (2013). A secondary data analysis was conducted using survey results
from 2006. With both oncology nurses (N=708) and medical-surgical nurses (N=3,339)
assessing their respective acute care practice environments. Oncology nurses reported
statistically higher satisfaction with their acute practice environments, increasing
18
retention and quality of care, and decreasing burnout (p<.001). In addition, oncology
nurses working in hospitals with mixed practice environments also had higher levels of
satisfaction with their practice environment (p<.01) (Shange et al., 2013).
As with nurses in specific practice environments, nurses in dialysis units
completed the PES-NWI in order to determine their practice environment perceptions
(Gardner et al., 2007). Gardner and colleagues (2007) surveyed 199 RNs working within
56 dialysis companies. The survey results indicated that RNs found their perception of
their practice environment to be positive (p=0.001). In addition, RNs working in dialysis
reported lower levels of intent to leave (less than 10%, p≤0.01). There was a significant
relationship between those nurses who had low perceptions of their practice environment
and those who had intent to leave within the next 12 months (p ≤ 0.05).
Among new RNs Lavoie-Tremblay et al. (2011) invited 485 RNs to complete the
PES-NWI online. With 150 completed surveys and a response rate of 31.3%, 145
surveys were then selected for study inclusion. Using chi-squared (p = .05) when the
PES-NWI subscales were correlated with intent to leave variables and age groups. The
results indicated when the PES-NWI score was low; the intent to quit was high, with
correlations ranging from -.15 to -.24 (Lavoie-Tremblay et al., 2011).
Siu and colleagues (2008) also used the PES-NWI to assess the practice
environment. Specifically, within the Ontario area, 678 RNs were surveyed to determine
their perception of their practice environments. Using a non-experimental predictive
design, observational data (Polit & Beck, 2012) correlated RNs feeling supported in their
professional practice (SD = 2.58), to being engaged in conflict management (SD = 3.51),
to perceiving effectiveness as a unit (SD = 4.07) and high personal self-evaluations (SD =
19
5.12). The data also showed that 20.3% of RNs were experiencing high levels of conflict
within their units (Siu et al., 2008).
Within Belgium, Bruyneel and colleagues (2014) used the PES-NWI to evaluate
mangers and staff perceptions of the work environment, using a cross-group comparison.
Response rates were reported by unit, and ranged from 100% to 27%, with 78 of the 87
units having greater than 50% response rates. Some items on the PES-NWI were found
to be impacted by the primary language of Dutch, and secondary language of French
among nursing staff. There were four items where managers had higher scores than staff,
indicating that career development, nurse-physician relationships, nursing support, and
quality of care were perceived more positively by those in management than the frontline
staff (Bruyneel et al., 2014).
Not only has the PES-NWI been used to assess the practice environment, but also
to compare the weekday and weekend practice environments (Hamilton et al., 2010). In
this study, the instrument was reduced to 13 items in order to only assess the practice
environment differences between weekends and weekdays. With an N=86, there were no
significant difference in the perceptions of the practice environment between weekdays
and weekends. Hamilton and colleagues (2010) went on to conduct focus interviews in
addition to the administration of the abbreviated PES-NWI. The focus interview results
indicated that the weekend and night staff had similar perceptions of their environment,
though the modified PES-NWI was not addressing the true environmental differences
(Hamilton et al., 2010).
Finland researchers (Numminen et al., 2015) specifically focused on the
perception of the practice environment for the newly licensed RN. The response rate was

20
30%, N=318. After a pilot study of 13 RNs, the PES-NWI was administered to 318 RNs,
to assess for translational differences in understanding the instrument. Overall practice
environment perceptions were positive (p ≤ 0.05). The correlation between the practice
environment and perceived competence was also significant (p ≤ 0.001), indicating RNs
with higher perceived levels of competence are more satisfied with their practice
environment (p = 0.005). The third key indicator from this study demonstrated the
relationship between satisfaction and intent to leave, with those satisfied with staffing and
the care they provide less likely to leave than those who were unsatisfied (p = 0.0257).
In Chinese hospitals RN burnout has also been assessed using the PES-NWI
(Wang et al., 2015). The only variation made to the PES-NWI was a direct translation
into Chinese. Within the study 900 RNs were sent surveys and 717 surveys were
returned and usable, achieving a 79.6% response rate. The reliability as determined by
the Chronbach’s alpha for the study was 0.96. Study results indicated moderate levels of
emotional exhaustion and depersonalization, and low levels of personal accomplishment
(p<0.05) (Wang et al., 2015).
Magnet® Characteristics and the Practice Environment
In 2011, Gardner and Walton held focus groups to assess the Magnet®
characteristics based on the results of the PES-NWI instrument completed by dialysis
nurses. In this study the nurses ranked the subscales as to their presence within their
current job. The focus group moderator then averaged the rating subscales to provide
each group the ability to focus on their areas of concern, with the intent of being heard
and recognized. Subscale characteristics were then ranked from most to least important
as quality of care, staffing adequacy, leadership ability and advocacy performance of

21
manager, engagement, and nurse-physician relationships. The study concluded that the
best practice for the hemodialysis groups would be to address the results of the PES-NWI
so RNs felt heard and saw that managers recognized their needs (Gardner & Walton,
2011).
McHugh and associates (2013) also evaluated the practice environment of 56
Magnet® and 508 non-Magnet hospitals. Magnet® hospitals were found to have a
statistically better work environment than non-Magnet hospitals (SD 0.46, p<0.001).
Magnet® hospitals also reported significantly higher levels of bachelor’s prepared nurses
(SD 0.39; p<0.001), higher numbers of specialty certifications (p<0.03), lower levels of
ancillary staff (p<0.03), and better overall staffing ratios (p=0.056) with 4.82 patients per
nurse versus the non-Magnet average of 5.03. Finally, Magnet® hospitals had
significantly fewer post-surgical deaths (p<0.001) and statistically fewer failure to rescue
deaths (p<0.001) (McHugh et al., 2012).
Australian nurses administered the PES-NWI in a purposeful sample, were
specific to the Magnet® organization (Walker et al., 2014). With translation to the
Australian practice context the PES-NWI was renamed the PES-AUS. With a 94%
response rate (N=492) results found mean values all greater than 2.5 for each subscale.
Thus researchers concluded the Magnet® culture of practice is synonymous with the high
satisfaction scores on the PES-NWI or PES-AUS (Walker et al., 2014).
Theoretical Perspectives
Patricia Benner’s (1982) nursing theory, Novice to Expert, is based on the
Dreyfus Model of Skill Acquisition. The theory explains the professional development
of the RN through five levels of skill acquisition: novice, advanced beginner, competent,

22
proficient, and expert. This transition reflects the movement form reliance on what the
RN is told in the educational setting (following the rules as a novice) to a reliance on
one’s own clinical experiences (synthesizing information from both learned knowledge
and experiences to feel comfortable in decision making) (Benner, 1982).
Kanter’s (1977; 1993) Theory of Structural Empowerment provides a framework
for the relationship between work environment and the variables that impact the
environment. The theory shows the relationship between the components of power
(resources and information) and opportunity (growth and mobility) (Laschinger 1996;
Kanter 1977; Kanter 1993). Kanter (1977 and 1993) also linked ones access to these
components to the degree of formal and informal power the person possessed within an
organization. Thus the level of power or empowerment impacts, employee beliefs and
behaviors within the work environment (Laschinger, 1996; Kanter, 1977; Kanter, 1993).
This chapter provided a review of the literature with respect to the utilization of
the PES-NWI to assess RN perceptions in various nursing environments (Bruyneel et al.,
2014; Friese & Himes-Ferris, 2013; Gardner, Fogg, Thomas-Hawkins, & Latham, 2007;
Gardner & Walton, 2011; Hamilton et al., 2010; Hanrahan & Aiken, 2008; Havens,
Warshawsky, & Vasey, 2012; Kelly, McHugh, & Sloane, 2014; Lake & Friese, 2006;
Lavoie-Tremblay, Paquet, Marchionni, & Drevniok, 2011; Liou & Cheng, 2009; Liou &
Grobe, 2008; McHugh et al., 2013; Numminee et al., 2015; Quality Forum, 2004; Siu,
Laschinger, & Finegan, 2008; The Joint Commission, 2009; Walker, Fitzgerald, & Duff,
2014; Wang, Liu, & Wang, 2015). Consistently the higher satisfaction RNs perceive, the
more likely they are to remain in their position. In addition, detailing the theories of
Benner (1982) and Kanter (1977; 1993) provide the growth process of the RN as they

23
develop as a practitioner and the connections between environment and perceptions of the
RN.

24
CHAPTER 3
METHODS
A review of the literature has identified several studies (Kooker & Kamikawa,
2010; Kutney-Lee et al., 2013; Laschinger, 2014; Laschinger, et al., 2009; Tourangeau, et
al., 2010A; Tourangeau, et al., 2010B; Van Bogaert, et al., 2012), which focus on
professional practice areas and describe why nurses leave their initial job. The majority
of these studies explored (Laschinger, 2014; Laschinger, et al., 2009), described (Kooker
& Kamikawa, 2010; Van Bogaert, et al., 2012), or correlated (Kutney-Lee, et al., 2013;
Tourangeau, et al., 2010A; Tourangeau, et al., 2010B; Van Bogaert, et al., 2009) the
practice environment to attrition. Synthesizing the research instruments used in these
studies, and comparing the subscales, items, and intent, was performed. Data for this
dissertation will consist of responses on the Practice Environment Scale of the Nursing
Work Index (PES-NWI) (Lake 2002a; 2007b), administered to a new population.
The PES-NWI is a modification of the original Nursing Work Index (NWI),
which was developed by Kramer and Hafner (1989). The original NWI was not
developed specifically for the practice environment, thus of the 65 items, only 48 items
are capable of describing the nuances specific to the practice environment. After
modification, the PES-NWI consists of 31 items encompassing 5 subscales. The
subscales are: nurse participation in hospital affairs; nursing foundations for quality of
care; nurse manager ability, leadership, and support of nurses; staffing and resource
adequacy; and collegial nurse-physician relations (Lake, 2002a).
The PES-NWI has been utilized to evaluate “…nurse burnout, satisfaction, intent
to leave, turnover, needle stick injuries, and work related disability…” in addition to

25
links between the subscales and nursing quality of care (Lake, 2007b, p. 110S). As of
2006, Lake (2007b) reports that over 500 hospitals are using the PES-NWI as part of the
annual nurse survey. However, this is a survey administered to all nurses within a
facility, not a specific population. Permission to use the instrument has been secured
(Appendix A).
The intent of this descriptive comparative study is to administer the PES-NWI to
registered nurses (RNs) employed at urban and suburban Midwestern acute care
hospitals. The planned study population will consist of RNs who have been in their
initial post-graduation job at least 12 months. The intent of administering this instrument
to this study population is to answer the following research questions: 1) What constructs,
when present in the practice environment, result in retention?; and 2) Does the type of
healthcare facility alter the desired practice environment?
Study Activities
Study approval was secured from the University of Missouri-Kansas City
(UMKC) Social Sciences Institutional Review Board (SSIRB) (Appendix D), which is
the acting SSIRB of record for Truman Medical Centers (TMC) (Appendix G). Approval
for this study at Centerpoint Medical Center was covered through a consortium
agreement between HealthMidwest and UMKC SSIRB (Appendix H). Once these
approvals were obtained, the study proposal was reviewed by the nurse research
committee at each study site. No study activity occurred until all approvals and
endorsements were completed.
Study data consisted of responses on the PES-NWI scale and minimal
demographic data. The demographic data were used to ensure appropriateness of study

26
participation and to describe each study group. These data included length of time at
present position, age, gender, type of nursing degree, type of clinical setting, and on
average, how many shifts per week are worked. The survey was administered as
appropriate at each study site, enabling the researcher to compare and contrast study
participants demographically. Data collection occurred over three weeks, with reminders
sent as needed.
Study data for the urban hospital was collected using SurveyMonkeyTM, an
electronic web-based tool. SurveyMonkeyTM offers the services of anonymous data
collection, secure servers, ease of data downloads, and survey access limitation of once
per user (SurveyMonkeyTM, 2011) at study site A (urban hospital). At study site B
(suburban hospital) a paper version of the study was mailed to the participant’s home
address with postage paid return envelope.
Study Participants
Study participation was limited to consented RNs continuously employed in the
same clinical practice area, for at least 12 months, at one of the study sites, since initial
licensure, as identified by nursing administration. Each participant must work an average
of one shift per week, not be on any type of medical or educational leave, have no
disciplinary action pending, have not submitted a letter of resignation, and whose primary
work duties include providing direct patient care. Anecdotal review indicates that there
were 57 potential participants at the urban healthcare facility and 45 potential participants
at the suburban site. Anticipating a 75% response rate, study data will consist of 76
participants. This will provide the ability to detect a moderate effect size (0.50) with a
power of .80 (Bannon, 2014). Staffing challenges, including overtime situations, high
27
patient acuity, and administrative changes reduced the number of actual participants to
50. According to Dusseldorf (2014) this provides the ability to detect a moderate effect
size (0.50) with a power of .60. Thus, application of these results should be done with
caution. Comparing and contrasting the responses from each study site may achieve less
power.
These individuals were initially identified using job classification and work
history information. Once all study approvals were secured, a request to the Nursing
Administration Department at each study site was submitted. Using the study inclusion
and exclusion criteria, potential participants were identified by the organization, who
provided the appropriate contact information for each potential participant.
For data collection at study site A, the urban location, emails were sent from the
Principal Investigator (PI) to the password protected employer provided email address
routinely used for communication, describing the study, detailing the steps to
participation, the time required to complete all study activities, and contact information of
the researcher. The SurveyMonkeyTM link was imbedded in this email. If participation
was desired, the participant was instructed to click on the link and complete the study
survey. Consent was implied when the participant submitted their responses. Instructions
were reiterated in the reminder email.
For data collection at study site B, the suburban location, the PI mailed a packet,
as there is no routine organizational email process. Within this packet was a letter,
describing the study, detailing the steps for participation, the time required to complete
all study activities, and contact information of the researcher. Surveys were also included

28
in the packet for interested participants to complete and return via the postage paid,
addressed envelope. Consent was implied if the participant mailed their responses.
Data from each study site was maintained separately. Once the study site was
closed, urban data were transferred from SurveyMonkeyTM and suburban data from the
paper surveys into a study specific Statistical Package for the Social Sciences (SPSS) file.
The study data were managed as outlined by the authors (Lake, 2002a).
Post data collection, the total number of missing datum was calculated (0.5%).
All missing data were replaced with an item calculated mean (Barladi & Enders, 2010).
Once developed, the data sets were maintained on the password protected professional
computer of the chairperson.
29
CHAPTER 4
RESULTS
Plan of Analysis
All data were manually entered into the Statistical Package for the Social Sciences
(SPSS). Missing data were assessed using listwise deletion or a complete case analysis;
calculated means were used as supplemental data (Howell, 2008). Each study population
was described demographically. Data from each study site were analyzed separately
(urban and suburban), then statistically compared and contrasted (urban versus suburban).
The responses for each data item were tested for normality, linearity, and homogeneity of
variance. The reliability of the study data was calculated, with the standard deviation
(SD) included.
Research Question One
What constructs, when present in the practice environment, result in retention?
This question was answered using descriptive statistics, specifically the frequency of
responses to each item. This determined the importance of each item, in the perception
of the participant, and its influence in their ability to remain in their initial job. Once this
was determined, the study data were transferred into component specific subscales, as
defined by the authors (Lake, 2002a). Item responses were then ranked within each
subscale. This provided data reflective of the importance of items within the PES-NWI
and within each subscale, in the perception of each participant. Exploratory factor
analysis was used to develop a model, describing the practice environment by these
participants. This model was compared to the published PES-NWI data.

30
Research Question Two
Does the type of healthcare facility alter the desired practice environment? This
question will be answered by comparing and contrasting the data sets from each study
site. Visual comparisons were performed of the ranked order of importance for each
item, and subscale items, from each study site. Since study data was obtained from two
study sites, which are independent of each other, independent sample t-tests were used to
determine if differences exist. Initially, the t-test was performed on the calculated
composite score, then for the subscale scores.
Purpose
The purpose of this descriptive study was to describe what it is that nursing
organizations value that enables new graduates to remain with an organization beyond
their initial year of practice. Administering the PES-NWI (Lake, 2002) to two separate
populations, one urban and one suburban, population differences were ascertained. This
chapter will present the (a) demographic description of each study population, (b) the
specific findings for each population based upon variable scores, (c) composite score
findings for each population, (d) identify interventions appropriate for each setting, (e)
identify specific site interventions, and (f) compare the findings to previous data.
Demographic Description of the Participants
Within the urban study site, 57 survey emails were sent and 28 responses were
received, a 49% response rate. The suburban study site provided 102 addresses of
potential participants. Of this initial study population, 33 potential participants failed to
meet the study inclusion criteria, resulting in a potential study population of 69.
Responses were received from 22 participants resulting in a 31% response rate. While

31
low, and under the anticipated response rate, this is consistent with internet and mailed
surveys (Polit & Beck, 2012).
Within the urban population, of 1,064 data, there were four missing responses for
length of time at present position (0.38%), one for a nurse manager who is a good
manager and leader (0.09%), one for praise and recognition for a job well done (0.09%),
one for a chief nursing officer equal in power and authority to other top level hospital
executives (0.09%), and one for a clear philosophy of nursing that pervades the patient
care environment (0.09%). For all missing urban data (0.75%) the mean of the responses
for that item was calculated and used as the response per instrument instructions (Lake,
2002). This is consistent with recommendations from Polit and Beck (2012) that set the
cut-off for missing data at 17% to retain accurate analysis.
Suburban responses were missing two responses for length of time at current
position (0.25%), one response for a nurse manager who is a good manager and leader
(0.12%), and one response for a chief nursing officer equal in power and authority to
other top-level hospital executives (0.12%), of 814 data. As with the urban data and
consistent with instrument instructions (Lake, 2002), means of each item were substituted
for no response data (0.49%) prior to analysis. The percent of missing suburban data also
remains below the 17% cut-off in order to achieve accurate statistical analysis (Polit &
Beck, 2012).
Demographic data were collected on length of time at present position, age,
gender, the type of nursing degree held, the clinical setting each participant practiced in,
and how many shifts per week were worked on average. Participants of each population
were primarily female, with the urban population (n = 28, 90%), and all female in the

32
suburban population (n = 22, 100%). Only the urban population had any male
respondents (n = 3, 10%).
Within the urban population, participants were younger than the suburban one.
The urban participants were primarily between 18-22 years old (n = 10, 32.3%) while the
majority of the suburban population was 38-42 years old (n = 7, 31.8%). Nurse
participants at the suburban location also tended to stay in their positions longer, with an
average length of stay in their present position of 35.9 months, in comparison to the
urban population averaged of 30.45 months.
The urban population reported higher levels of education, with 74.2% (n = 23)
having a bachelor’s degree. Within the suburban population, only 68.2% (n = 15) of
nurses possessed a bachelor’s degree. The urban population reported fewer associate
degree nurses (n = 4, 12.9%) than the suburban location (n = 5, 22.7%) and no diploma
nurses, while the suburban location reported one (4.5%). Each location had one
respondent who had obtained a master’s degree (urban = 3.2%; suburban = 4.5%).
Practice areas were more diverse within the urban population, reporting nurses
working in: emergency department (n = 3, 9.7%), medical-surgical (n = 4, 12.9%),
telemetry (n = 3, 19.4%), critical care (n = 6, 19.4%), surgery (n = 2, 6.5%), labor and
delivery (n = 6, 19.4%), neonatal intensive care (n = 1, 3.2%), outpatient clinics (n = 1,
3.2%), and inpatient float pool (n = 2, 6.5%). Suburban respondents reported only
working in medical surgical (n = 11, 50%), telemetry (n = 10, 45.5%), and critical care (n
= 1, 4.5%) areas.
Results of the demographic data analysis reveal similarities in the sample groups.
The sets were essentially equivalent based upon demographic responses. Both

33
populations were primarily female and had similar education levels. The largest
difference, respondents at the urban location were younger and less experienced than
those at the suburban population and practiced in a wider variety of areas.
PES-NWI Score Characteristics
Prior to determining normality each item was reverse coded to obtain subscale
scores according to the author (Lake, 2002). Where items were previously scored, 1 =
strongly agree and 4 = strongly disagree, each score was subtracted from 5 to reverse.
After reversal mean scores were obtained across the item level for each variable subscale.
Higher scores now indicate higher levels of agreement, thus increased satisfaction with
the measured variable.
Normality of distribution scores was determined on each of the variables for both
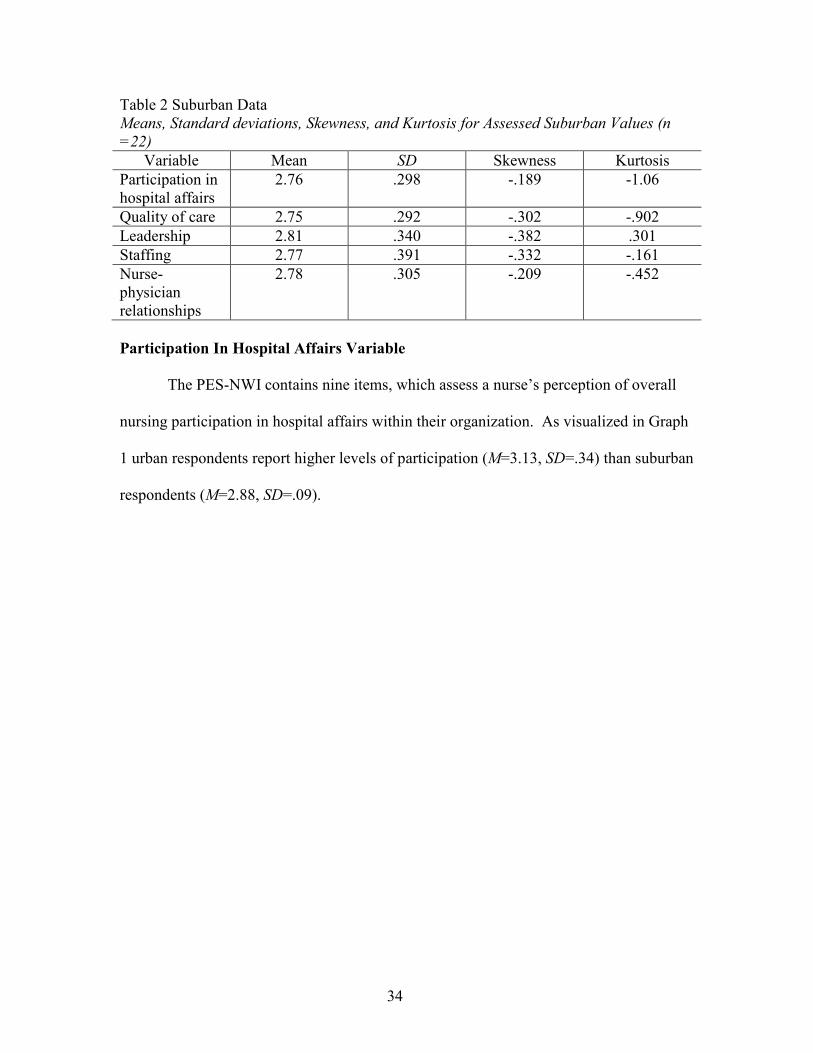
the urban and suburban populations. After examination of data, mean, standard
deviation, skewness, and kurtosis were determined and are present in the tables below.
Analysis of Shapiro-Wilk indicated all variables to be at the lower bound of true
significance with p<.05 and Kolmogorov-Smirnov indicated true significance, p>.05.
Table 1 Urban Data Means, Standard deviations, Skewness, and Kurtosis for Assessed Urban Values (n = 31)
Variable Mean SD Skewness Kurtosis
Participation in hospital affairs
3.12 .339 .339 -.495
Quality of care 3.12 .346 .249 -.346
Leadership 3.15 .379 .044 -.862
Staffing 3.07 .369 -.271 -.603
Nurse-physician relationships
3.13 .360 .325 -.686
34
Table 2 Suburban Data Means, Standard deviations, Skewness, and Kurtosis for Assessed Suburban Values (n
=22)
Variable Mean SD Skewness Kurtosis
Participation in hospital affairs
2.76 .298 -.189 -1.06
Quality of care 2.75 .292 -.302 -.902
Leadership 2.81 .340 -.382 .301
Staffing 2.77 .391 -.332 -.161
Nurse-physician relationships
2.78 .305 -.209 -.452
Participation In Hospital Affairs Variable
The PES-NWI contains nine items, which assess a nurse’s perception of overall
nursing participation in hospital affairs within their organization. As visualized in Graph
1 urban respondents report higher levels of participation (M=3.13, SD=.34) than suburban
respondents (M=2.88, SD=.09).

35
Graph 1 Combined Data Nurse Participation
Quality of Care Variable
Nursing foundations for quality of care was assessed on the PES-NWI using 10
items. There was a significant correlation between age and the quality of care provided
within the urban population as indicated by a One-Way ANOVA (Appendix A) F(18, 10)
= 2.91, p<.05. Additionally, the One-Way ANOVA (Appendix A) indicated significance
between type of nursing degree and perceived quality of care F(1, 26) = .642, p<.05.

36
Graph 2 Combined Data Quality of Care
Leadership Variable
Individual nurse perceptions of nurse management ability, leadership, and support
of nurses was assessed on the mean of five items. Urban respondents reported higher
perceived levels of nurse manager leadership, ability, and support of nurses (M=3.12,
SD=0.39) than the suburban population (M=2.8, SD=0.35).

37
Graph 3 Combined Data Nurse Manager Ability
Staffing Variable
Nurse perceptions of staffing were assessed using the mean of four items on the
PES-NWI. Consistently, urban respondents perceived more satisfaction with unit staffing
and resource adequacy (M=3.09, SD=0.37) than suburban counterparts (M=2.77,
SD=0.4).
38
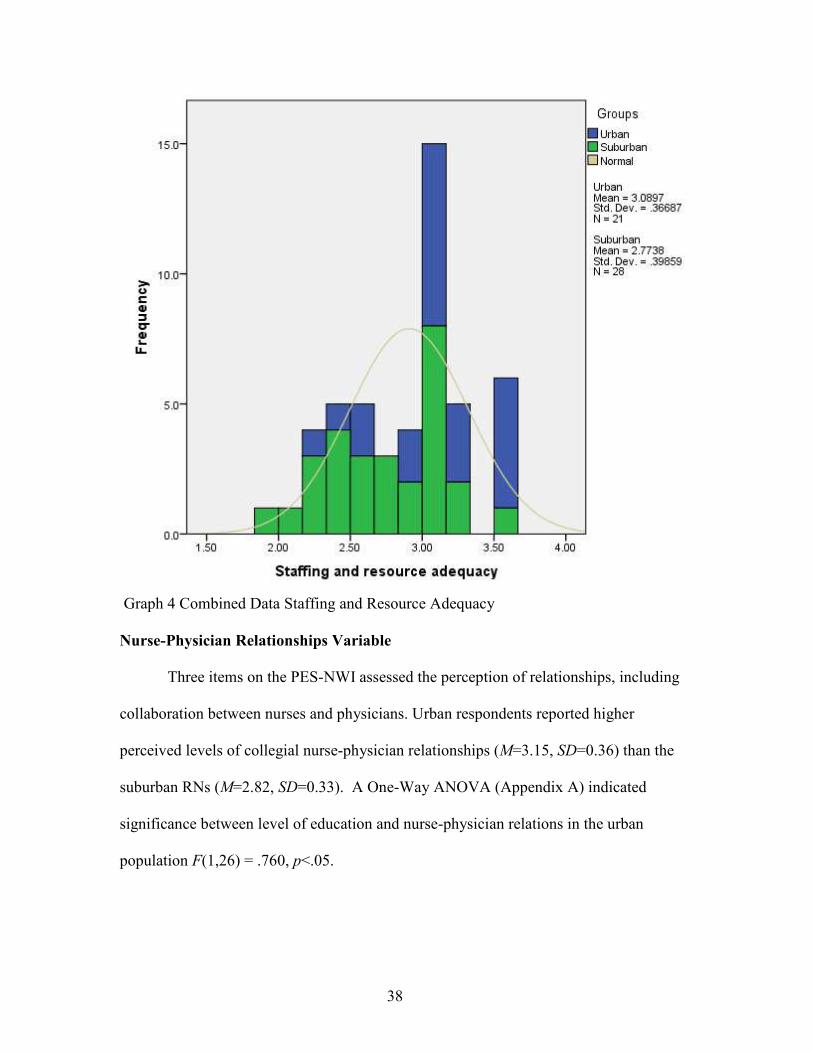
Graph 4 Combined Data Staffing and Resource Adequacy
Nurse-Physician Relationships Variable
Three items on the PES-NWI assessed the perception of relationships, including
collaboration between nurses and physicians. Urban respondents reported higher
perceived levels of collegial nurse-physician relationships (M=3.15, SD=0.36) than the
suburban RNs (M=2.82, SD=0.33). A One-Way ANOVA (Appendix A) indicated
significance between level of education and nurse-physician relations in the urban
population F(1,26) = .760, p<.05.

39
Graph 5 Combined Data Nurse-Physician Relations
Subscale Composite Score
Finally, the composite score is calculated as the mean of the five subscale scores
in order to reflect the subscales, not the individual items. Urban RNs obtained higher
composite scores (M=3.13, SD=0.36) than suburban RNs (M=2.85, SD=0.16). This is
consistent with higher reported scores on the five subscales.

40
Graph 6 Combined Data Composite Scores
Group Similarities and Differences
An ANOVA and an independent sample t-test were performed to compare the
urban and suburban populations. Nurse participation in hospital affairs F = 22.9, p = .0,
is significant, thus the groups are not equal in participation when comparing urban and
suburban sites (Polit & Beck, 2012). In all other subscales, nursing foundations for
quality of care (F = 0.40, p = .84), nurse manager ability, leadership, and support of
nurses (F = .25, p = .62), staffing and resource adequacy (F = .46, p = .50), and collegial
nurse-physician relations (F = .00, p = .95) there are no significant variance in those who

41
are retained to work in an urban versus suburban hospital. However, when examining the
composite scores there is a significant difference between urban and suburban nurses (F
= 12.5, p = .00).
Based upon α .05, each of the five subscales and the composite score were
significant. This is consistent with the previous use of the instrument, with mean scores
of 2.48 to 3.17 (Warshawsky & Havens, 2010). As these results demonstrate (Appendix
A), nurses who have been retained within their organizations have higher levels of
satisfaction on the subscales and composite score of the PES-NWI (Lake, 2002).
Variance Explained
A principal components factor analysis was conducted, concluding the first seven
factors in the analysis explain70.35% of the variance (Table 17). Of the seven
components, component one, explained 32.64% of the variance. Praise and recognition
for a job well done had a primary loading of 0.79, a supervisory staff that is supportive
of nurses (0.75), active staff development or continuing education programs for nurses
(0.74), an active quality assurance program (0.72), opportunities for advancement (.71),
and a clear philosophy of nursing that pervades the patient care environment (0.70).
Component two, explaining an additional 9.5% of the variance (Table 17) with
the highest loading factors adequate support services allow me to spend time with my
patients (0.67), enough staff to get the work done (0.67), and enough registered nurses
to provide quality patient care (0.64). Beyond component two the impact of each
additional component was greatly reduced, though relevant (Graph 19) with component
three explaining 7.79% of the variance, component four 6.6%, component five 5.35%,
component six 4.59%, and component seven 3.89%.

42
The highest loading factors within component three are physicians and nurses
have a good working relationship (-0.79) and a lot of team work between nurses and
physicians (-0.71). Both were negative indicating that lower scores on the variables
result in higher scores on the factor (Polit & Beck, 2012). In addition, high scores on
working with nurses who are clinically competent (0.48), enough registered nurses to
provide quality patient care (0.39), a chief nursing officer (CNO) who is highly visible
and accessible to staff (0.37), and a CNO equal in power and authority to other top-level
hospital executives (0.33). Factor four positive components included high standards of
nursing care are expected by the administration (0.58) and a preceptor program for
newly hired RNs (0.47). In addition to negative components use of nursing diagnosis (-
0.52) and written up-to-date care plans for all patients (-0.41).
Factor five had fewer high loading factors than the previous components,
aligning with the reduced amount of variance explained by each of the additional factors
(Polit & Beck, 2012). Factor five components also included high standards of nursing
care are expected by the administration (.41) and a clear philosophy of nursing that
pervades the patient care environment (0.35). Component six included two negative
factors a nurse manager who is a good leader (-0.38) and a CNO who is highly
accessible and visible to staff (-0.37) and one positive, patience care assignments that
foster continuity of care (i.e. the same nurse cares for the patient from one day to the
next) (0.43). Finally, component seven also contained negative factors, enough time
and opportunity to discuss patient care (-0.55) and active staff development or
continuing education (-0.45).

43
Graph 7 Scree Plot
Answering Research Questions
Correlation calculations were performed and were close to zero for both the urban
(Table 15) and suburban populations (Table 16). Correlations were close to zero, though
both negative and positive, making this a non-linear correlation (Polit & Beck, 2012)
between demographics and the subscales on the PES-NWI. There were no significant
correlations between demographics and scores on the PES-NWI. The subscales on the
PES-NWI are however significant with each other. This demonstrates the instrument
ability to predict levels of satisfaction (Polit & Beck, 2012).
44
What constructs, when present in the practice environment, result in retention?
High scores, defined as greater than 2.5, on the PES-NWI subscales, are
indicative of higher levels of satisfaction (Lake, 2002), and are present in both the urban
(M=3.13, SD=.36) and suburban population (M=2.85, SD=.16). Thus in an organization
with higher perceived levels of nurse participation in hospital affairs, nursing foundations
for quality of care, nurse manager ability, leadership, and support of nurses, staffing and
resource adequacy, and collegial nurse-physician relations nurses are more likely to be
retained in the organization.
Does the type of healthcare facility alter the desired practice environment?
Urban nurses in a teaching hospital reported higher levels of satisfaction (M=3.13,
SD=.36) than nurses in the suburban non-academic center (M=2.85, SD=.16). Nurses in
this population worked in a wider variety of practice areas, there was gender diversity
present, and nurses were traditionally younger than in the suburban population.

45
CHAPTER 5
CONCLUSIONS AND IMPLICATIONS
With turnover as high as 75% within the first 12 months of hire (Trepanier et al.,
2012) and the organizational cost of replacement exceeding $64,000 per registered nurse
(RN) (RWJF, 2015), there is a need to determine what is done right within the profession
to retain RNs. Previous research has clarified why nurses leave, citing the lack of
friendliness in the workplace, the emotional and physical toil of providing patient care,
and overall exhaustion (Kutney-Lee et al., 2012; Tourangeau et al., 2010; Van Bogaert et
al., 2012). The Practice Environment Scale of the Nursing Work Index (PES-NWI)
describes the practice environment based on scores on five subscales and the composite
score of all subscales (Lake, 2002). The subscales include (1) nurse participation in
hospital affairs, (2) nurse foundations for quality of care, (3) nurse manager ability,
leadership, and support of nurses, (4) staffing support and resource adequacy, and (5)
collegial nurse-physician relations (Lake, 2002).
Each of these participants were retained in their respective practice environments
for greater that 12 months, having higher satisfaction scores (>2.5) on the PES-NWI
aligned with previous findings that high scores on the PES-NWI is indicative of the
perceived quality of the practice environment (Warshawsky & Havens, 2011).
Suburban participants indicated they were older and had overall lower levels of
education. Having the minimum level of education to enter the profession, yet staying in
their initial practice area, may indicate a more stable population of RNs; however, further
evaluation is necessary. It could also be indicative of fewer options as many
46
organizations are following the Institute of Medicine (2011) recommendations that 55%
of RNs have at least a bachelor’s degree and hiring fewer associate degree nurses.
The finding of most interest, that the urban academic medical center had higher
levels across all subscales was unanticipated and inconsistent with previous findings
(Lake & Friese, 2006). As urban academic medical centers are:
…the preeminent institutions in the American health care system—are
interrelated entities comprising a medical school, its affiliated hospitals and
outpatient centers, and a faculty practice plan (FPP). Their unique missions are to
provide undergraduate and graduate medical education and training, conduct basic
science and clinical research on new medical practices and technologies, furnish
state-of-the-art medical care for patients with complex illnesses, and care for the
poor and medically indigent. Traditionally, AHCs have been leaders in their
communities and the health care delivery system, (Reuter, 1997, p. v).
According to this definition, nurses should experience more of the negative
environmental factors described by MacKusick and Minnick (2010), specifically high
levels of emotional distress, fatigue, and exhaustion. However, the results show that the
nurses who are retained have positive perceptions of their practice environments.
Based upon these findings next steps should elaborate on what nurses’ possess
that allows them to maintain a positive perception in a high stress, physically and
emotionally demanding environment. The environment may not be the key indicator, but
a skill set the RNs possess. Future research may focus on the resiliency of nurses to
determine if levels of resiliency correlate with the high scores on the PES-NWI and
retention in their initial practice areas. If there is a correlation, resiliency could be used

47
as part of a screening process prior to placing nurses in high stress environments. Skill
development cannot be the entire focus of the novice to expert development (Benner,
1982) but will need to incorporate organizational structure and resilience. In addition,
nurse internship programs should include resilient assessments and development within
their programs. Other future opportunities include developing interventions to increase
nurse participation and nursing foundations for care, as well as promoting collegial nurse-
physician relations, and strong leadership programs to improve nurse perceptions of their
practice environment.

48
Appendix A Tables
Table 3 Urban Length of Time in Present Position
ANOVA
Sum of
Squares df
Mean
Square F Sig.
Nurse
participation in
hospital affairs
Between
Groups 2.018 18 .112 2.565 .076
Within Groups .394 9 .044
Total 2.412 27
Nursing
foundations for
quality care
Between
Groups 2.021 18 .112 2.763 .061
Within Groups .366 9 .041
Total 2.387 27
Nurse manager
ability,
leadership, and
support of
nurses
Between
Groups 2.677 18 .149 2.377 .093
Within Groups .563 9 .063
Total 3.240 27
Staffing and
resource
adequacy
Between
Groups 3.157 18 .175 1.394 .313
Within Groups 1.133 9 .126
Total 4.290 27
Collegial
nurse-
physician
relations
Between
Groups 2.180 18 .121 2.564 .076
Within Groups .425 9 .047
Total 2.605 27
Composite
score
Between
Groups 2.307 18 .128 2.187 .116
Within Groups .528 9 .059
Total 2.835 27

49
49Urban Age in Years
ANOVA
Sum of
Squares df
Mean
Square F Sig.
Nurse
participation in
hospital affairs
Between
Groups .208 4 .052 .542 .707
Within
Groups 2.204 23 .096
Total 2.412 27
Nursing
foundations for
quality care
Between
Groups .281 4 .070 .767 .558
Within
Groups 2.106 23 .092
Total 2.387 27
Nurse manager
ability,
leadership, and
support of
nurses
Between
Groups .280 4 .070 .544 .705
Within
Groups 2.960 23 .129
Total 3.240 27
Staffing and
resource
adequacy
Between
Groups .436 4 .109 .650 .633
Within
Groups 3.854 23 .168
Total 4.290 27
Collegial
nurse-
physician
relations
Between
Groups .197 4 .049 .471 .757
Within
Groups 2.408 23 .105
Total 2.605 27
Composite
score
Between
Groups .268 4 .067 .599 .667
Within
Groups 2.567 23 .112
Total 2.835 27

50
Table 5 Urban Gender
ANOVA
Sum of
Squares df
Mean
Square F Sig.
Nurse
participation
in hospital
affairs
Between
Groups .037 1 .037 .400 .532
Within
Groups 2.375 26 .091
Total 2.412 27
Nursing
foundations
for quality
care
Between
Groups .057 1 .057 .639 .431
Within
Groups 2.330 26 .090
Total 2.387 27
Nurse
manager
ability,
leadership,
and support of
nurses
Between
Groups .033 1 .033 .265 .611
Within
Groups 3.207 26 .123
Total 3.240 27
Staffing and
resource
adequacy
Between
Groups .003 1 .003 .021 .887
Within
Groups 4.286 26 .165
Total 4.290 27
Collegial
nurse-
physician
relations
Between
Groups .074 1 .074 .757 .392
Within
Groups 2.531 26 .097
Total 2.605 27
Composite
score
Between
Groups .035 1 .035 .329 .571
Within
Groups 2.799 26 .108
Total 2.835 27

51
Table 6 Urban Level of Education
ANOVA
Sum of
Squares df
Mean
Square F Sig.
Nurse
participation in
hospital affairs
Between
Groups .035 2 .017 .183 .834
Within
Groups 2.377 25 .095
Total 2.412 27
Nursing
foundations for
quality care
Between
Groups .062 2 .031 .332 .721
Within
Groups 2.325 25 .093
Total 2.387 27
Nurse manager
ability,
leadership, and
support of
nurses
Between
Groups .110 2 .055 .437 .651
Within
Groups 3.131 25 .125
Total 3.240 27
Staffing and
resource
adequacy
Between
Groups .398 2 .199
1.27
8 .296
Within
Groups 3.892 25 .156
Total 4.290 27
Collegial
nurse-
physician
relations
Between
Groups .063 2 .031 .308 .738
Within
Groups 2.543 25 .102
Total 2.605 27
Composite
score
Between
Groups .103 2 .052 .473 .628
Within
Groups 2.731 25 .109
Total 2.835 27
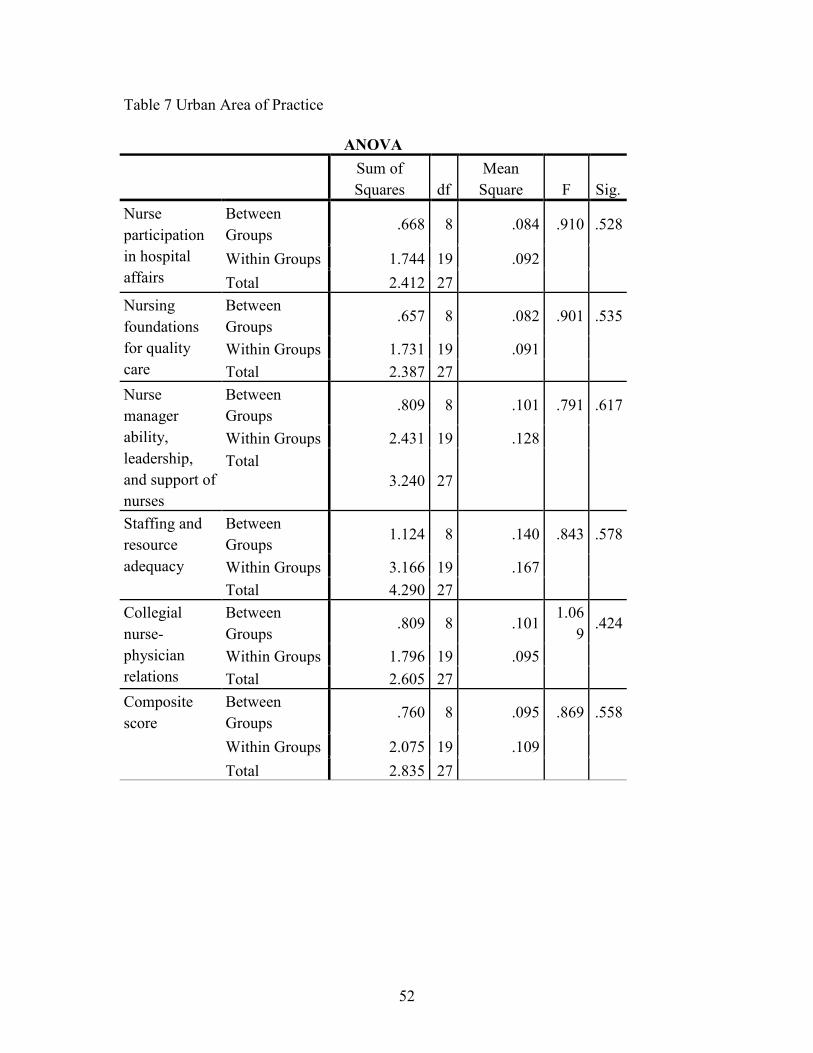
52
Table 7 Urban Area of Practice
ANOVA
Sum of
Squares df
Mean
Square F Sig.
Nurse
participation
in hospital
affairs
Between
Groups .668 8 .084 .910 .528
Within Groups 1.744 19 .092
Total 2.412 27
Nursing
foundations
for quality
care
Between
Groups .657 8 .082 .901 .535
Within Groups 1.731 19 .091
Total 2.387 27
Nurse
manager
ability,
leadership,
and support of
nurses
Between
Groups .809 8 .101 .791 .617
Within Groups 2.431 19 .128
Total
3.240 27
Staffing and
resource
adequacy
Between
Groups 1.124 8 .140 .843 .578
Within Groups 3.166 19 .167
Total 4.290 27
Collegial
nurse-
physician
relations
Between
Groups .809 8 .101
1.06
9 .424
Within Groups 1.796 19 .095
Total 2.605 27
Composite
score
Between
Groups .760 8 .095 .869 .558
Within Groups 2.075 19 .109
Total 2.835 27
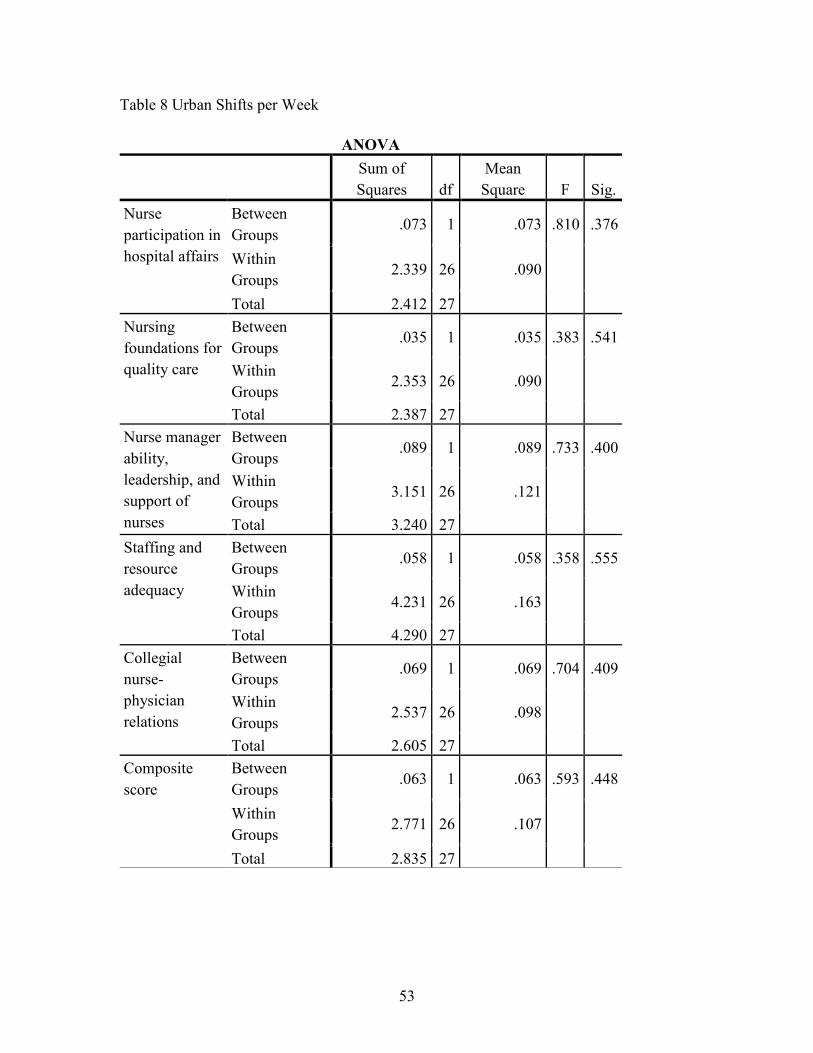
53
Table 8 Urban Shifts per Week
ANOVA
Sum of
Squares df
Mean
Square F Sig.
Nurse
participation in
hospital affairs
Between
Groups .073 1 .073 .810 .376
Within
Groups 2.339 26 .090
Total 2.412 27
Nursing
foundations for
quality care
Between
Groups .035 1 .035 .383 .541
Within
Groups 2.353 26 .090
Total 2.387 27
Nurse manager
ability,
leadership, and
support of
nurses
Between
Groups .089 1 .089 .733 .400
Within
Groups 3.151 26 .121
Total 3.240 27
Staffing and
resource
adequacy
Between
Groups .058 1 .058 .358 .555
Within
Groups 4.231 26 .163
Total 4.290 27
Collegial
nurse-
physician
relations
Between
Groups .069 1 .069 .704 .409
Within
Groups 2.537 26 .098
Total 2.605 27
Composite
score
Between
Groups .063 1 .063 .593 .448
Within
Groups 2.771 26 .107
Total 2.835 27
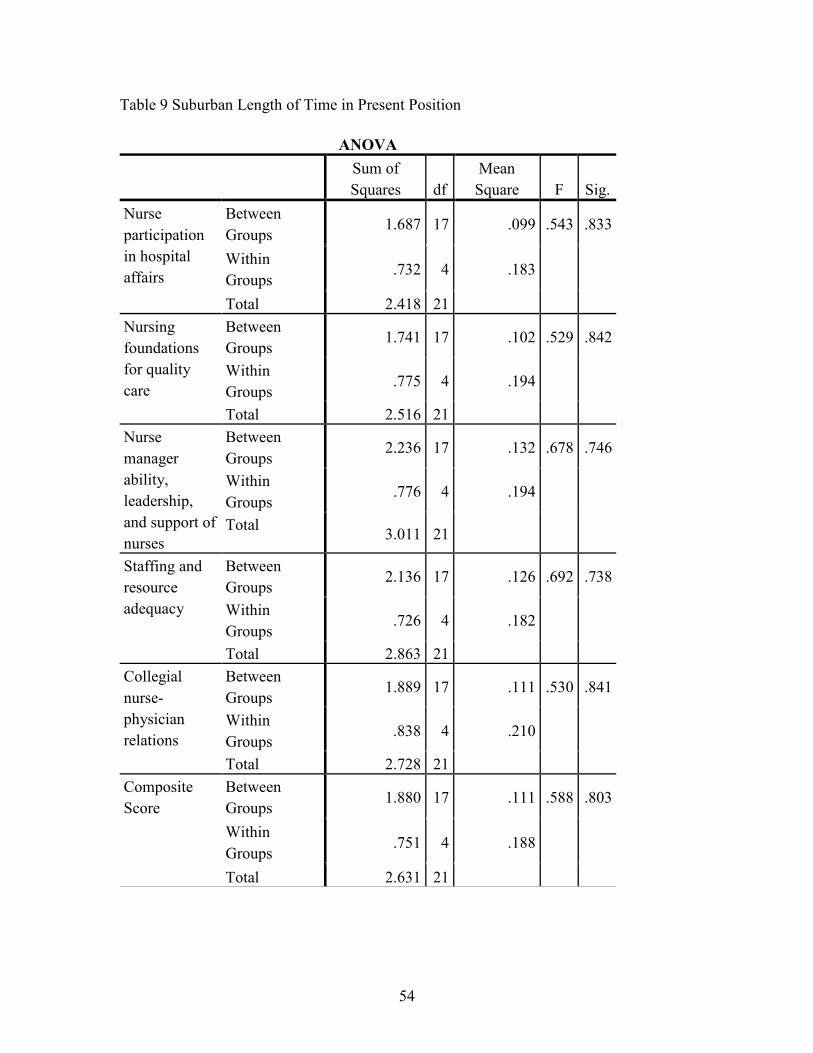
54
Table 9 Suburban Length of Time in Present Position
ANOVA
Sum of
Squares df
Mean
Square F Sig.
Nurse
participation
in hospital
affairs
Between
Groups 1.687 17 .099 .543 .833
Within
Groups .732 4 .183
Total 2.418 21
Nursing
foundations
for quality
care
Between
Groups 1.741 17 .102 .529 .842
Within
Groups .775 4 .194
Total 2.516 21
Nurse
manager
ability,
leadership,
and support of
nurses
Between
Groups 2.236 17 .132 .678 .746
Within
Groups .776 4 .194
Total 3.011 21
Staffing and
resource
adequacy
Between
Groups 2.136 17 .126 .692 .738
Within
Groups .726 4 .182
Total 2.863 21
Collegial
nurse-
physician
relations
Between
Groups 1.889 17 .111 .530 .841
Within
Groups .838 4 .210
Total 2.728 21
Composite
Score
Between
Groups 1.880 17 .111 .588 .803
Within
Groups .751 4 .188
Total 2.631 21
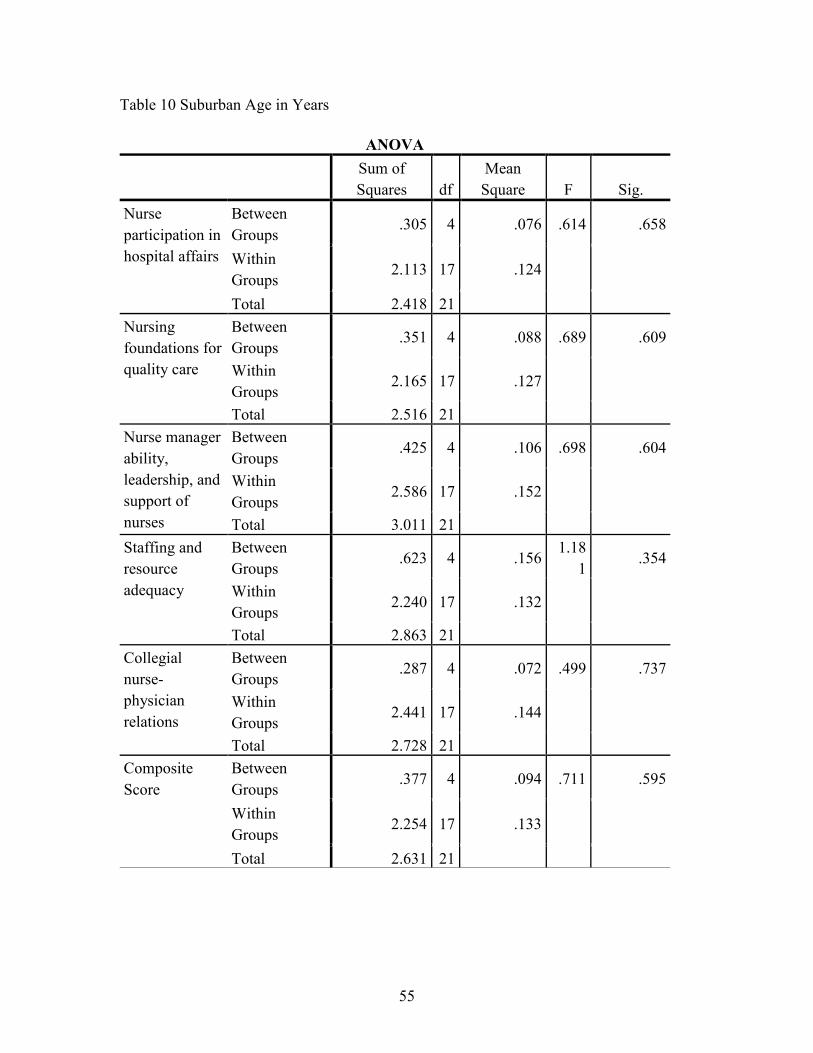
55
Table 10 Suburban Age in Years
ANOVA
Sum of
Squares df
Mean
Square F Sig.
Nurse
participation in
hospital affairs
Between
Groups .305 4 .076 .614 .658
Within
Groups 2.113 17 .124
Total 2.418 21
Nursing
foundations for
quality care
Between
Groups .351 4 .088 .689 .609
Within
Groups 2.165 17 .127
Total 2.516 21
Nurse manager
ability,
leadership, and
support of
nurses
Between
Groups .425 4 .106 .698 .604
Within
Groups 2.586 17 .152
Total 3.011 21
Staffing and
resource
adequacy
Between
Groups .623 4 .156
1.18
1 .354
Within
Groups 2.240 17 .132
Total 2.863 21
Collegial
nurse-
physician
relations
Between
Groups .287 4 .072 .499 .737
Within
Groups 2.441 17 .144
Total 2.728 21
Composite
Score
Between
Groups .377 4 .094 .711 .595
Within
Groups 2.254 17 .133
Total 2.631 21
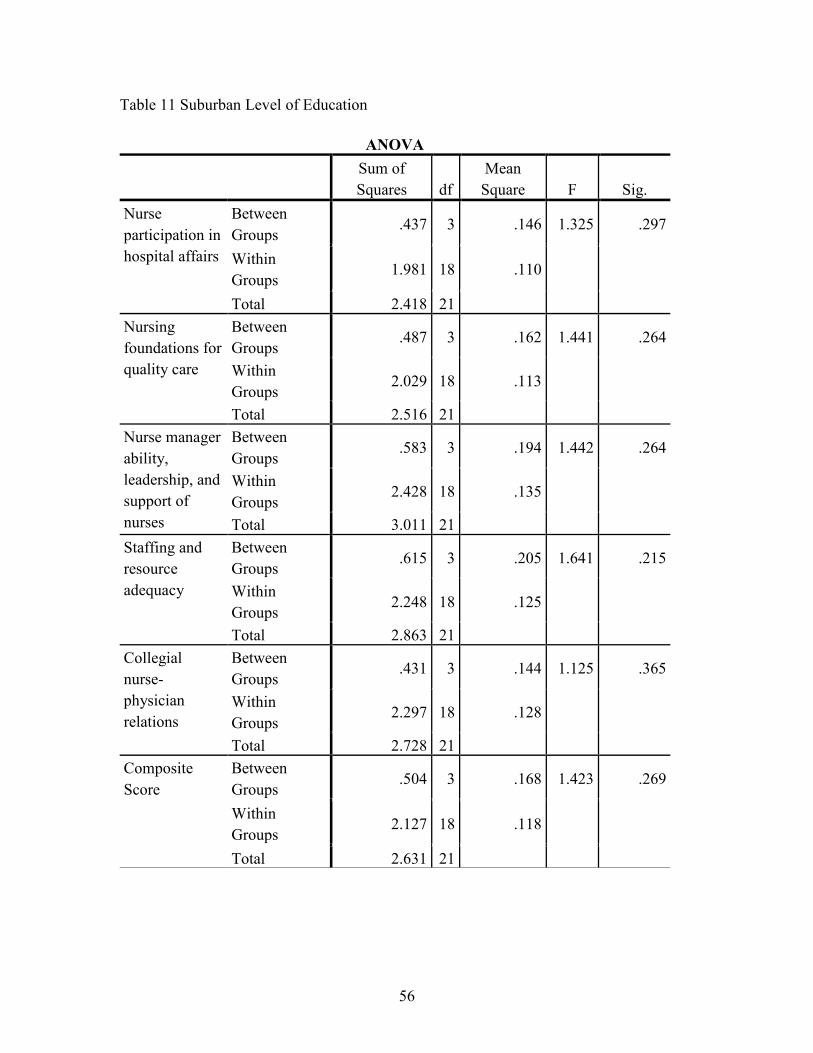
56
Table 11 Suburban Level of Education
ANOVA
Sum of
Squares df
Mean
Square F Sig.
Nurse
participation in
hospital affairs
Between
Groups .437 3 .146 1.325 .297
Within
Groups 1.981 18 .110
Total 2.418 21
Nursing
foundations for
quality care
Between
Groups .487 3 .162 1.441 .264
Within
Groups 2.029 18 .113
Total 2.516 21
Nurse manager
ability,
leadership, and
support of
nurses
Between
Groups .583 3 .194 1.442 .264
Within
Groups 2.428 18 .135
Total 3.011 21
Staffing and
resource
adequacy
Between
Groups .615 3 .205 1.641 .215
Within
Groups 2.248 18 .125
Total 2.863 21
Collegial
nurse-
physician
relations
Between
Groups .431 3 .144 1.125 .365
Within
Groups 2.297 18 .128
Total 2.728 21
Composite
Score
Between
Groups .504 3 .168 1.423 .269
Within
Groups 2.127 18 .118
Total 2.631 21

57
Table 12 Suburban Area of Practice
ANOVA
Sum of
Squares df
Mean
Square F Sig.
Nurse
participation in
hospital affairs
Between
Groups .328 2 .164 1.491 .250
Within
Groups 2.090 19 .110
Total 2.418 21
Nursing
foundations for
quality care
Between
Groups .321 2 .161 1.390 .273
Within
Groups 2.195 19 .116
Total 2.516 21
Nurse manager
ability,
leadership, and
support of
nurses
Between
Groups .531 2 .266 2.035 .158
Within
Groups 2.480 19 .131
Total 3.011 21
Staffing and
resource
adequacy
Between
Groups .642 2 .321 2.747 .090
Within
Groups 2.221 19 .117
Total 2.863 21
Collegial
nurse-
physician
relations
Between
Groups .400 2 .200 1.633 .222
Within
Groups 2.328 19 .123
Total 2.728 21
Composite
Score
Between
Groups .434 2 .217 1.875 .181
Within
Groups 2.197 19 .116
Total 2.631 21

58
Table 13 Group Statistics
Group Statistics
Groups
N Mean
Std.
Deviation
Std. Error
Mean
Nurse participation in
hospital affairs
1 21 3.1286 .34329 .07491
2 28 2.8826 .08695 .01643
Nursing foundations for
quality care
1 21 3.1289 .35093 .07658
2 28 2.7878 .31279 .05911
Nurse manager ability,
leadership, and support
of nurses
1 21 3.1661 .37863 .08262
2 28 2.8088 .34642 .06547
Staffing and resource
adequacy
1 21 3.0897 .36687 .08006
2 28 2.7738 .39859 .07533
Collegial nurse-
physician relations
1 21 3.1466 .36065 .07870
2 28 2.8253 .32770 .06193
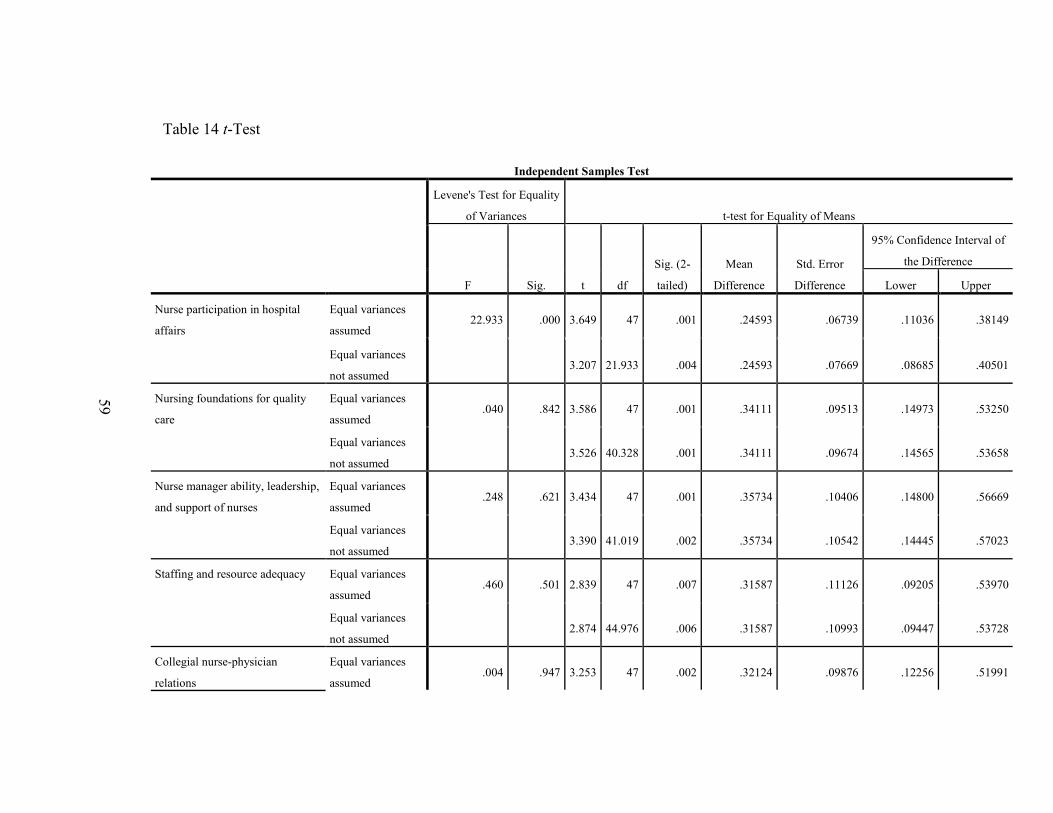
59
Table 14 t-Test
Independent Samples Test
Levene's Test for Equality
of Variances t-test for Equality of Means
F Sig. t df
Sig. (2-
tailed)
Mean
Difference
Std. Error
Difference
95% Confidence Interval of
the Difference
Lower Upper
Nurse participation in hospital
affairs
Equal variances
assumed 22.933 .000 3.649 47 .001 .24593 .06739 .11036 .38149
Equal variances
not assumed 3.207 21.933 .004 .24593 .07669 .08685 .40501
Nursing foundations for quality
care
Equal variances
assumed .040 .842 3.586 47 .001 .34111 .09513 .14973 .53250
Equal variances
not assumed 3.526 40.328 .001 .34111 .09674 .14565 .53658
Nurse manager ability, leadership,
and support of nurses
Equal variances
assumed .248 .621 3.434 47 .001 .35734 .10406 .14800 .56669
Equal variances
not assumed 3.390 41.019 .002 .35734 .10542 .14445 .57023
Staffing and resource adequacy Equal variances
assumed .460 .501 2.839 47 .007 .31587 .11126 .09205 .53970
Equal variances
not assumed 2.874 44.976 .006 .31587 .10993 .09447 .53728
Collegial nurse-physician
relations
Equal variances
assumed .004 .947 3.253 47 .002 .32124 .09876 .12256 .51991

60
Equal variances
not assumed 3.208 40.838 .003 .32124 .10014 .11897 .52351
Composite Score Equal variances
assumed 12.506 .001 3.698 47 .001 .28077 .07593 .12801 .43353
Equal variances
not assumed 3.362 26.407 .002 .28077 .08351 .10924 .45230

61
Table 15 Urban Correlations
Urban Correlations
Length of time at present position
(in months)?
What is your
age (in years)?
What is your
gender?
What type of nursing degree(s) do you have?
What type of clinical setting do you practice
in?
On average,
how many
shifts per week do
you work?
Nurse participation in hospital
affairs
Nursing foundations for quality
care
Nurse manager ability,
leadership, and support
of nurses
Staffing and
resource adequacy
Collegial nurse-
physician relations
Composite score
Length of time at present position (in months)?
Pearson Correlation
1 -.017 .136 .091 .042 .081 -.131 -.109 -.106 -.014 -.094 -.088
Sig. (2-tailed)
.932 .489 .646 .834 .681 .505 .582 .592 .942 .636 .655
N 28 28 28 28 28 28 28 28 28 28 28 28
What is your age (in years)?
Pearson Correlation
-.017 1 .089 -.184 -.169 .134 -.100 -.109 -.103 -.081 -.099 -.099
Sig. (2-tailed)
.932 .653 .350 .389 .497 .612 .582 .601 .682 .617 .615
N 28 28 28 28 28 28 28 28 28 28 28 28
What is your gender?
Pearson Correlation
.136 .089 1 .192 .214 -.181 -.123 -.155 -.100 -.028 -.168 -.112
Sig. (2-tailed)
.489 .653 .328 .275 .357 .532 .431 .611 .887 .392 .571
N 28 28 28 28 28 28 28 28 28 28 28 28
What type of nursing degree(s) do you have?
Pearson Correlation
.091 -.184 .192 1 .123 -.350 -.103 -.146 -.173 -.207 -.148 -.162
Sig. (2-tailed)
.646 .350 .328 .533 .068 .603 .458 .379 .290 .453 .410
N 28 28 28 28 28 28 28 28 28 28 28 28
What type of clinical setting do you practice in?
Pearson Correlation
.042 -.169 .214 .123 1 -.102 -.194 -.204 -.149 -.182 -.192 -.187
Sig. (2-tailed)
.834 .389 .275 .533 .606 .322 .298 .450 .353 .329 .342
N 28 28 28 28 28 28 28 28 28 28 28 28
On average, how many shifts per week do you
Pearson Correlation
.081 .134 -.181 -.350 -.102 1 -.174 -.120 -.166 -.116 -.162 -.149
Sig. (2-tailed)
.681 .497 .357 .068 .606 .376 .541 .400 .555 .409 .448

62
work? N 28 28 28 28 28 28 28 28 28 28 28 28
Nurse participation in hospital affairs
Pearson Correlation
-.131 -.100 -.123 -.103 -.194 -.174 1 .990** .973** .904** .982** .985**
Sig. (2-tailed)
.505 .612 .532 .603 .322 .376 .000 .000 .000 .000 .000
N 28 28 28 28 28 28 28 28 28 28 28 28
Nursing foundations for quality care
Pearson Correlation
-.109 -.109 -.155 -.146 -.204 -.120 .990** 1 .961** .893** .968** .977**
Sig. (2-tailed)
.582 .582 .431 .458 .298 .541 .000 .000 .000 .000 .000
N 28 28 28 28 28 28 28 28 28 28 28 28
Nurse manager ability, leadership, and support of nurses
Pearson Correlation
-.106 -.103 -.100 -.173 -.149 -.166 .973** .961** 1 .961** .983** .995**
Sig. (2-tailed)
.592 .601 .611 .379 .450 .400 .000 .000 .000 .000 .000
N 28 28 28 28 28 28 28 28 28 28 28 28
Staffing and resource adequacy
Pearson Correlation
-.014 -.081 -.028 -.207 -.182 -.116 .904** .893** .961** 1 .934** .961**
Sig. (2-tailed)
.942 .682 .887 .290 .353 .555 .000 .000 .000 .000 .000
N 28 28 28 28 28 28 28 28 28 28 28 28
Collegial nurse-physician relations
Pearson Correlation
-.094 -.099 -.168 -.148 -.192 -.162 .982** .968** .983** .934** 1 .990**
Sig. (2-tailed)
.636 .617 .392 .453 .329 .409 .000 .000 .000 .000 .000
N 28 28 28 28 28 28 28 28 28 28 28 28
Composite score
Pearson Correlation
-.088 -.099 -.112 -.162 -.187 -.149 .985** .977** .995** .961** .990** 1
Sig. (2-tailed)
.655 .615 .571 .410 .342 .448 .000 .000 .000 .000 .000
N 28 28 28 28 28 28 28 28 28 28 28 28
**. Correlation is significant at the 0.01 level (2-tailed).

63
Table 16 Suburban Correlations
Suburban Correlations
What is your age (in years)?
What is your
gender?
What is your level of nursing
education?
What type of clinical setting do
you practice in?
On average, how many shifts per week do
you work?
Nurse participation in hospital
affairs
Nursing foundations for quality
care
Nurse manager ability,
leadership, and support
of nurses
Staffing and
resource adequacy
Collegial nurse-
physician relations
Composite Score
What is your age (in years)?
Pearson Correlation
1 .a -.512* -.264 -.328 .117 .114 .186 .309 .121 .174
Sig. (2-tailed)
. .015 .235 .137 .605 .613 .407 .161 .592 .439
N 22 22 22 22 22 22 22 22 22 22 22
What is your gender?
Pearson Correlation
.a .a .a .a .a .a .a .a .a .a .a
Sig. (2-tailed)
. . . . . . . . . .
N 22 22 22 22 22 22 22 22 22 22 22
What is your level of nursing education?
Pearson Correlation
-.512* .a 1 .035 .112 -.094 -.095 -.077 -.169 -.101 -.109
Sig. (2-tailed)
.015 . .879 .620 .677 .676 .733 .452 .656 .630
N 22 22 22 22 22 22 22 22 22 22 22
What type of clinical setting do you practice in?
Pearson Correlation
-.264 .a .035 1 .322 -.207 -.207 -.193 -.190 -.176 -.197
Sig. (2-tailed)
.235 . .879 .144 .355 .355 .389 .396 .432 .379
N 22 22 22 22 22 22 22 22 22 22 22
On average, how many shifts per week do you work?
Pearson Correlation
-.328 .a .112 .322 1 .082 .086 .022 -.019 .093 .052
Sig. (2-tailed)
.137 . .620 .144 .715 .702 .922 .932 .680 .817
N 22 22 22 22 22 22 22 22 22 22 22
Nurse participation in hospital affairs
Pearson Correlation
.117 .a -.094 -.207 .082 1 .994** .977** .949** .984** .994**
Sig. (2-tailed)
.605 . .677 .355 .715 .000 .000 .000 .000 .000
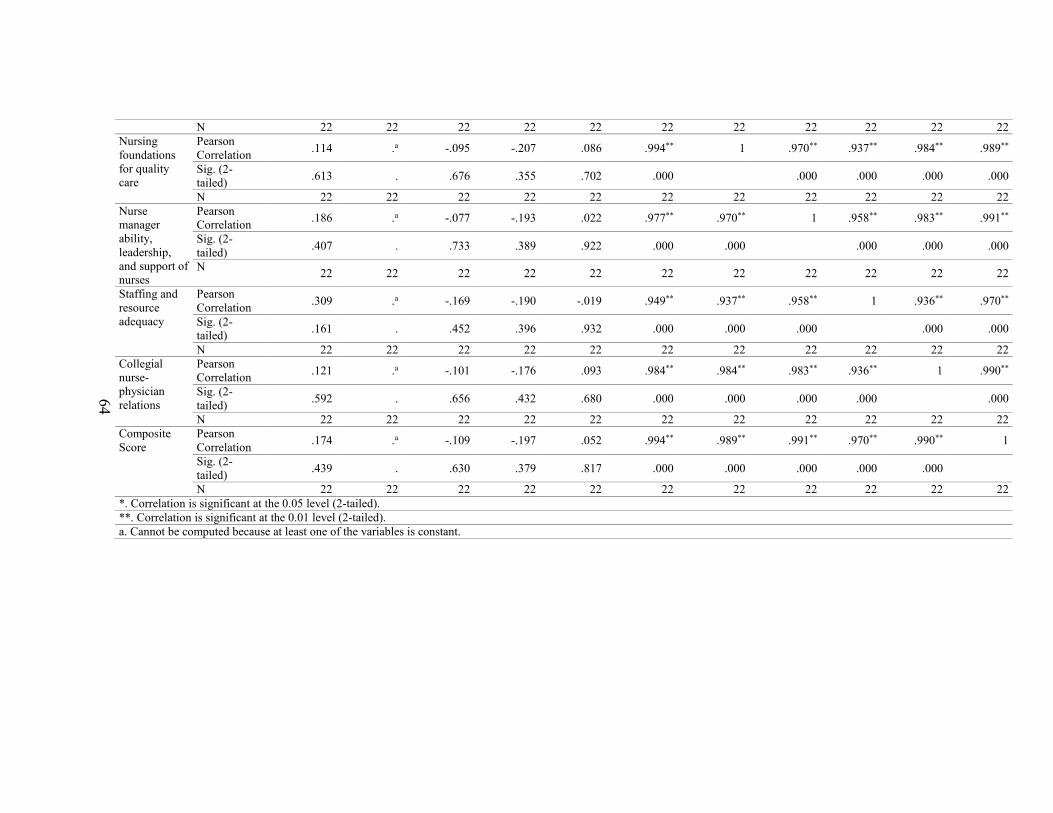
64
N 22 22 22 22 22 22 22 22 22 22 22
Nursing foundations for quality care
Pearson Correlation
.114 .a -.095 -.207 .086 .994** 1 .970** .937** .984** .989**
Sig. (2-tailed)
.613 . .676 .355 .702 .000 .000 .000 .000 .000
N 22 22 22 22 22 22 22 22 22 22 22
Nurse manager ability, leadership, and support of nurses
Pearson Correlation
.186 .a -.077 -.193 .022 .977** .970** 1 .958** .983** .991**
Sig. (2-tailed)
.407 . .733 .389 .922 .000 .000 .000 .000 .000
N 22 22 22 22 22 22 22 22 22 22 22
Staffing and resource adequacy
Pearson Correlation
.309 .a -.169 -.190 -.019 .949** .937** .958** 1 .936** .970**
Sig. (2-tailed)
.161 . .452 .396 .932 .000 .000 .000 .000 .000
N 22 22 22 22 22 22 22 22 22 22 22
Collegial nurse-physician relations
Pearson Correlation
.121 .a -.101 -.176 .093 .984** .984** .983** .936** 1 .990**
Sig. (2-tailed)
.592 . .656 .432 .680 .000 .000 .000 .000 .000
N 22 22 22 22 22 22 22 22 22 22 22
Composite Score
Pearson Correlation
.174 .a -.109 -.197 .052 .994** .989** .991** .970** .990** 1
Sig. (2-tailed)
.439 . .630 .379 .817 .000 .000 .000 .000 .000
N 22 22 22 22 22 22 22 22 22 22 22
*. Correlation is significant at the 0.05 level (2-tailed).
**. Correlation is significant at the 0.01 level (2-tailed).
a. Cannot be computed because at least one of the variables is constant.

65
Table 17 Variance Explained
Total Variance Explained
Component
Initial Eigenvalues Extraction Sums of Squared Loadings
Total % of Variance Cumulative % Total % of Variance Cumulative %
1 10.118 32.638 32.638 10.118 32.638 32.638
2 2.939 9.481 42.119 2.939 9.481 42.119
3 2.415 7.791 49.910 2.415 7.791 49.910
4 2.047 6.605 56.514 2.047 6.605 56.514
5 1.659 5.352 61.867 1.659 5.352 61.867
6 1.423 4.590 66.457 1.423 4.590 66.457
7 1.205 3.888 70.345 1.205 3.888 70.345
8 .988 3.186 73.531
9 .897 2.894 76.425
10 .854 2.755 79.180
11 .823 2.656 81.837
12 .764 2.464 84.301
13 .683 2.204 86.505
14 .664 2.143 88.647
15 .587 1.894 90.541
16 .490 1.580 92.121
17 .386 1.245 93.365
18 .348 1.122 94.488
19 .309 .996 95.484
20 .302 .976 96.460
21 .262 .844 97.303
22 .169 .546 97.849
23 .131 .422 98.271
24 .117 .378 98.649
25 .105 .340 98.989
26 .099 .318 99.307
27 .069 .223 99.530
28 .049 .159 99.689
29 .042 .135 99.824
30 .034 .108 99.933
31 .021 .067 100.000

66
Table 18 Component Matrix
Component Matrixa
Component
1 2 3 4 5 6 7
Adequate support services
allow me to spend time with my
patients.
.330 .672 .198 -.094 .187 -.105 -.060
Physicians and nurses have
good working relationships. .461 .029 -.738 .070 .217 -.001 .002
A supervisory staff that is
supportive of the nurses. .750 .144 -.176 .324 -.119 -.306 .008
Active staff development or
continuing education programs
for nurses.
.741 -.236 -.125 .103 .115 -.137 -.449
Career development/clinical
ladder opportunity. .623 -.199 .117 -.399 -.160 .182 -.044
Opportunity for staff nurses to
participate in policy decisions. .633 -.219 .093 -.134 -.268 -.186 -.326
Supervisors use mistakes as
learning opportunities, not
criticism.
.677 -.364 -.168 .200 -.190 .015 .169
Enough time and opportunity to
discuss patient care problems
with other nurses.
.583 .274 .301 .105 -.059 .036 -.546
Enough registered nurses to
provide quality patient care. .377 .636 .386 .332 -.099 .030 -.075
A nurse manager who is a good
manager and leader. .640 .186 .044 .200 -.263 -.383 .148
A chief nursing officer who is
highly visible and accessible to
staff.
.501 -.242 .366 -.108 .269 -.374 .230
Enough staff to get the work
done. .318 .666 .218 .325 -.056 .184 .066
Praise and recognition for a job
well done. .788 .063 -.019 -.120 -.066 -.011 .109
High standards of nursing care
are expected by the
administration.
.402 -.194 -.092 .582 .414 -.113 .007

67
A chief nursing officer equal in
power and authority to other
top-level hospital executives.
.544 -.326 .326 .166 .284 -.122 .011
A lot of team work between
nurses and physicians. .474 .291 -.700 .001 .181 .085 -.027
Opportunities for advancement. .711 -.026 .007 -.362 -.014 -.054 -.120
A clear philosophy of nursing
that pervades the patient care
environment.
.702 -.081 .110 -.057 .348 .201 -.056
Working with nurses who are
clinically competent. .399 -.143 .481 .040 .516 -.042 .102
A nurse manager who backs up
the nursing staff in decision
making, even if the conflict is
with a physician.
.657 -.090 -.191 .348 -.279 -.085 .224
Administration that listens and
responds to employee concerns. .606 .038 .098 -.238 -.060 -.270 .167
An active quality assurance
program. .715 .026 .202 -.047 .036 .180 .051
Staff nurses are involved in the
internal governance of the
hospital (e.g., practice and
policy committees).
.272 -.581 .114 .171 -.128 .337 .119
Collaboration (joint practice)
between nurses and physicians. .632 .187 -.517 -.005 .217 .091 -.084
A preceptor program for newly
hired RNs. .332 -.302 .042 .468 -.027 .551 -.081
Nursing care is based on a
nursing, rather than a medical,
model.
.502 .380 .060 -.175 .046 .207 .467
Staff nurses have the
opportunity to serve on hospital
and nursing committees.
.466 -.453 .162 -.046 -.217 .042 -.084
Nursing administrators consult
with staff on daily problems and
procedures.
.619 -.098 -.132 -.069 -.436 -.127 .190
Written, up-to-date nursing care
plans for all patients. .586 -.064 -.068 -.414 .353 .188 .173

68
Patient care assignments that
foster continuity of care, i.e.,
the same nurse cares for the
patient from one day to the
next.
.549 .248 .171 .026 -.253 .429 .076
Use of nursing diagnoses. .587 .122 -.107 -.517 -.087 .108 -.188
Extraction Method: Principal Component Analysis.
a. 7 components extracted.

69
Appendix B Instrument Permission
BA Barol, Andrea <[email protected]> Thu 8/7/2014 8:51 AM
PhD
To: McDonald, Aimee W. (UMKC-Student);
Dear Aimee McDonald:
Thank you for your inquiry. I am replying on behalf of Dr. Eileen Lake. Enclosed, please find the
instrument, scoring instructions, an article containing PES-NWI scores for ANCC Magnet
hospitals from 1998 in Table 1, and a Warshawsky & Haven article you may find useful. These
materials are sent to everyone who makes the request.
Dr. Lake’s permission is not needed as the instrument is in the public domain due to its
endorsement by the National Quality Forum in 2004 and re-endorsement in
2009: http://www.qualityforum.org/QPS/QPSTool.aspx?m=1129&e=3. However, if you prefer to
have Dr. Lake’s permission, this email serves as her permission.
Please direct any reply to Dr. Eileen Lake at [email protected]. If you need anything
else, feel free to write to us again.
Andrea Barol
Andrea Barol
Administrative Coordinator
Center for Health Outcomes and Policy Research
University of Pennsylvania School of Nursing
418 Curie Boulevard, Room 378
Philadelphia, PA 19104
215-898-4727 (Office)
215-573-2062 (Fax)
Visit our website at http://www.nursing.upenn.edu/chopr
From: McDonald, Aimee W. (UMKC-Student) [mailto:[email protected]] Sent: Friday, August 01, 2014 10:29 AM
To: Lake, Eileen Subject: PES-NWI
Dr. Lake,
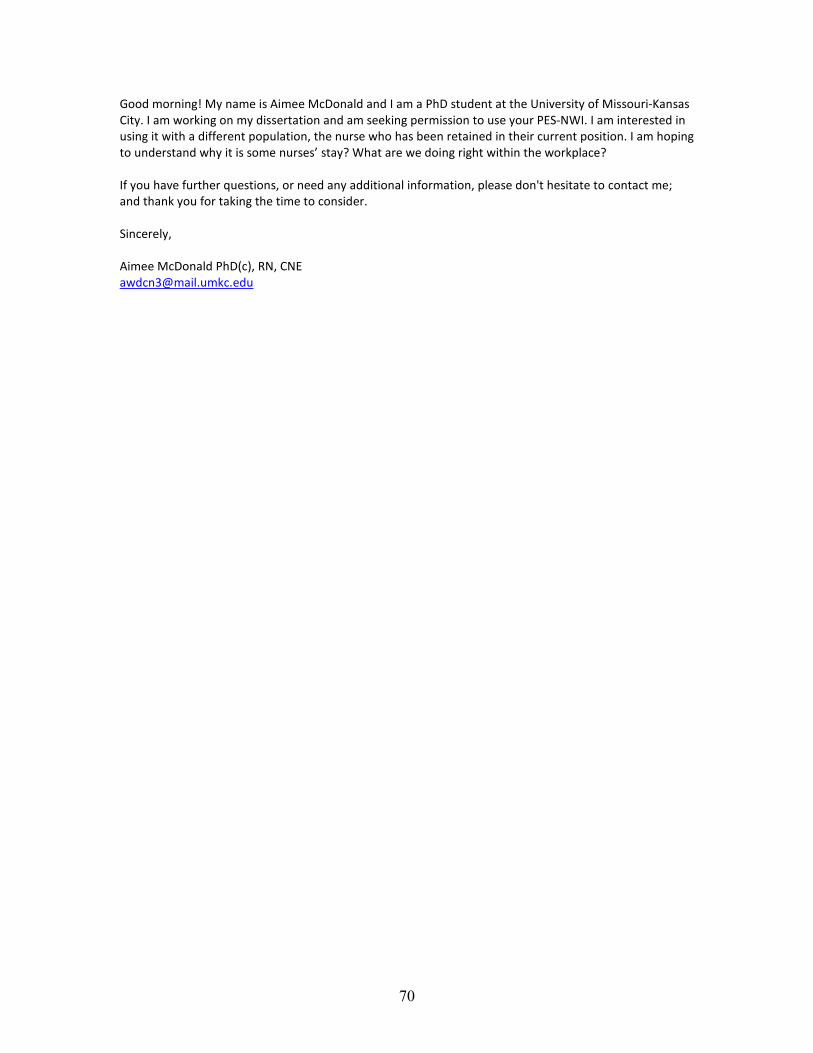
70
Good morning! My name is Aimee McDonald and I am a PhD student at the University of Missouri-Kansas
City. I am working on my dissertation and am seeking permission to use your PES-NWI. I am interested in
using it with a different population, the nurse who has been retained in their current position. I am hoping
to understand why it is some nurses’ stay? What are we doing right within the workplace?
If you have further questions, or need any additional information, please don't hesitate to contact me;
and thank you for taking the time to consider.
Sincerely,
Aimee McDonald PhD(c), RN, CNE
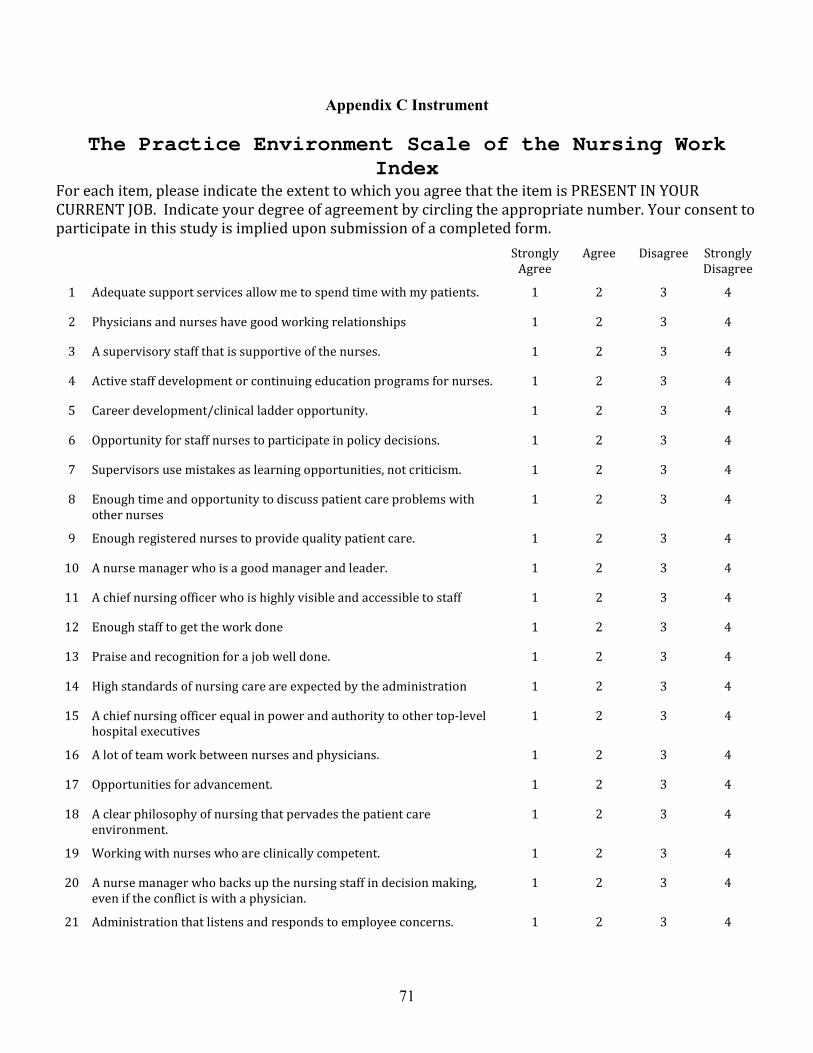
71
Appendix C Instrument
The Practice Environment Scale of the Nursing Work Index
For each item, please indicate the extent to which you agree that the item is PRESENT IN YOUR
CURRENT JOB. Indicate your degree of agreement by circling the appropriate number. Your consent to
participate in this study is implied upon submission of a completed form.
Strongly
Agree
Agree Disagree Strongly
Disagree
1 Adequate support services allow me to spend time with my patients. 1 2 3 4
2 Physicians and nurses have good working relationships 1 2 3 4
3 A supervisory staff that is supportive of the nurses. 1 2 3 4
4 Active staff development or continuing education programs for nurses. 1 2 3 4
5 Career development/clinical ladder opportunity. 1 2 3 4
6 Opportunity for staff nurses to participate in policy decisions. 1 2 3 4
7 Supervisors use mistakes as learning opportunities, not criticism. 1 2 3 4
8 Enough time and opportunity to discuss patient care problems with
other nurses
1 2 3 4
9 Enough registered nurses to provide quality patient care. 1 2 3 4
10 A nurse manager who is a good manager and leader. 1 2 3 4
11 A chief nursing officer who is highly visible and accessible to staff 1 2 3 4
12 Enough staff to get the work done 1 2 3 4
13 Praise and recognition for a job well done. 1 2 3 4
14 High standards of nursing care are expected by the administration 1 2 3 4
15 A chief nursing officer equal in power and authority to other top-level
hospital executives
1 2 3 4
16 A lot of team work between nurses and physicians. 1 2 3 4
17 Opportunities for advancement. 1 2 3 4
18 A clear philosophy of nursing that pervades the patient care
environment.
1 2 3 4
19 Working with nurses who are clinically competent. 1 2 3 4
20 A nurse manager who backs up the nursing staff in decision making,
even if the conflict is with a physician.
1 2 3 4
21 Administration that listens and responds to employee concerns. 1 2 3 4

72
22 An active quality assurance program. 1 2 3 4
23 Staff nurses are involved in the internal governance of the hospital (e.g.,
practice and policy committees).
1 2 3 4
24 Collaboration (joint practice) between nurses and physicians. 1 2 3 4
25 A preceptor program for newly hired RNs 1 2 3 4
26 Nursing care is based on a nursing, rather than a medical, model. 1 2 3 4
27 Staff nurses have the opportunity to serve on hospital and nursing
committees.
1 2 3 4
28 Nursing administrators consult with staff on daily problems and
procedures
1 2 3 4
29 Written, up-to-date nursing care plans for all patients. 1 2 3 4
30 Patient care assignments that foster continuity of care, i.e., the same
nurse cares for the patient from one day to the next.
1 2 3 4
31 Use of nursing diagnoses. 1 2 3 4
Source: Eileen T. Lake. “Development of the Practice Environment Scale of the
Nursing Work Index.” Research in Nursing & Health, May/June 2002; 25(3):
176-188.

73
Appendix D Demographic Questions
Length of time at present position (in months) __ Age _18-22 _23-27 _28-32 33-37 38-42
Gender: ___ Male___ Female
Type of nursing degree: ___ ADN ___ BSN ___ MSN
Type of clinical setting: ___ Critical Care ___ LDRP ___ NICU ___ ED ___ Medical-
Surgical ___ Telemetry ___ Outpatient Clinic ___ Behavioral Health
On average, how many shifts per week do you work? ___ >3 ___ 3-5 ___ 5-7
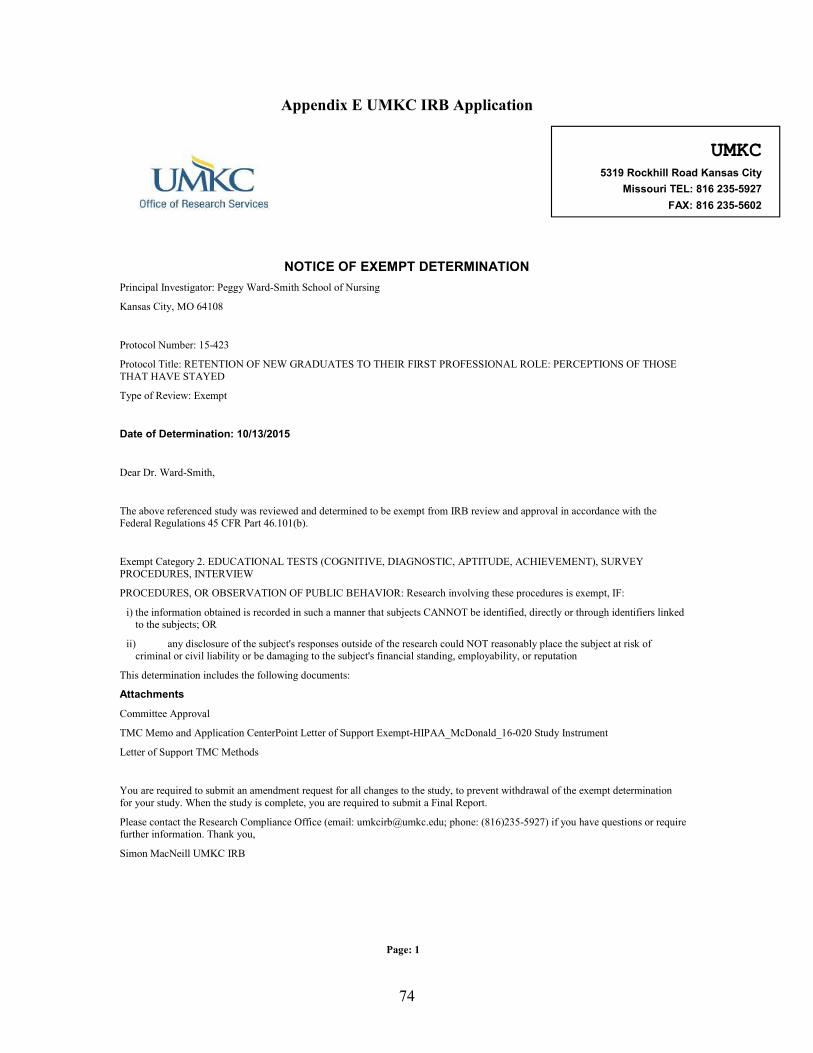
74
Appendix E UMKC IRB Application
NOTICE OF EXEMPT DETERMINATION
Principal Investigator: Peggy Ward-Smith School of Nursing
Kansas City, MO 64108
Protocol Number: 15-423
Protocol Title: RETENTION OF NEW GRADUATES TO THEIR FIRST PROFESSIONAL ROLE: PERCEPTIONS OF THOSE THAT HAVE STAYED
Type of Review: Exempt
Date of Determination: 10/13/2015
Dear Dr. Ward-Smith,
The above referenced study was reviewed and determined to be exempt from IRB review and approval in accordance with the Federal Regulations 45 CFR Part 46.101(b).
Exempt Category 2. EDUCATIONAL TESTS (COGNITIVE, DIAGNOSTIC, APTITUDE, ACHIEVEMENT), SURVEY PROCEDURES, INTERVIEW
PROCEDURES, OR OBSERVATION OF PUBLIC BEHAVIOR: Research involving these procedures is exempt, IF:
i) the information obtained is recorded in such a manner that subjects CANNOT be identified, directly or through identifiers linked to the subjects; OR
ii) any disclosure of the subject's responses outside of the research could NOT reasonably place the subject at risk of criminal or civil liability or be damaging to the subject's financial standing, employability, or reputation
This determination includes the following documents:
Attachments
Committee Approval
TMC Memo and Application CenterPoint Letter of Support Exempt-HIPAA_McDonald_16-020 Study Instrument
Letter of Support TMC Methods
You are required to submit an amendment request for all changes to the study, to prevent withdrawal of the exempt determination for your study. When the study is complete, you are required to submit a Final Report.
Please contact the Research Compliance Office (email: [email protected]; phone: (816)235-5927) if you have questions or require further information. Thank you,
Simon MacNeill UMKC IRB
Page: 1
UMKC 5319 Rockhill Road Kansas City
Missouri TEL: 816 235-5927
FAX: 816 235-5602

75
Appendix F Committee Approval/Letters of Support

76
Lynette M. Wheeler MSN, RN, FAAMA, FACCA, FABC Chief Nursing Officer Truman Medical Centers Nursing Administration Offices 2301 Holmes Street Kansas City, MO 64108 August 27, 2014
University of Missouri-Kansas City IRB Members Kansas City, MO 64068
To whom it may concern:
We are pleased to extend our support to Aimee McDonald PhD(c), RN, CNE in her research efforts to understand nursing retention. We approve of her study in principle and will allow her to contact study participants once IRB approval is obtained. It is our understanding that the secure email system will be used to facilitate this contact.
Sincerely,
Lynette M. Wheeler MSN, RN, FAAMA, FACCA, FABC Chief Nursing Officer Truman Medical Centers Nursing Administration Offices 2301 Holmes Street Kansas City, MO 64108

77

78
Appendix G HIPAA Application
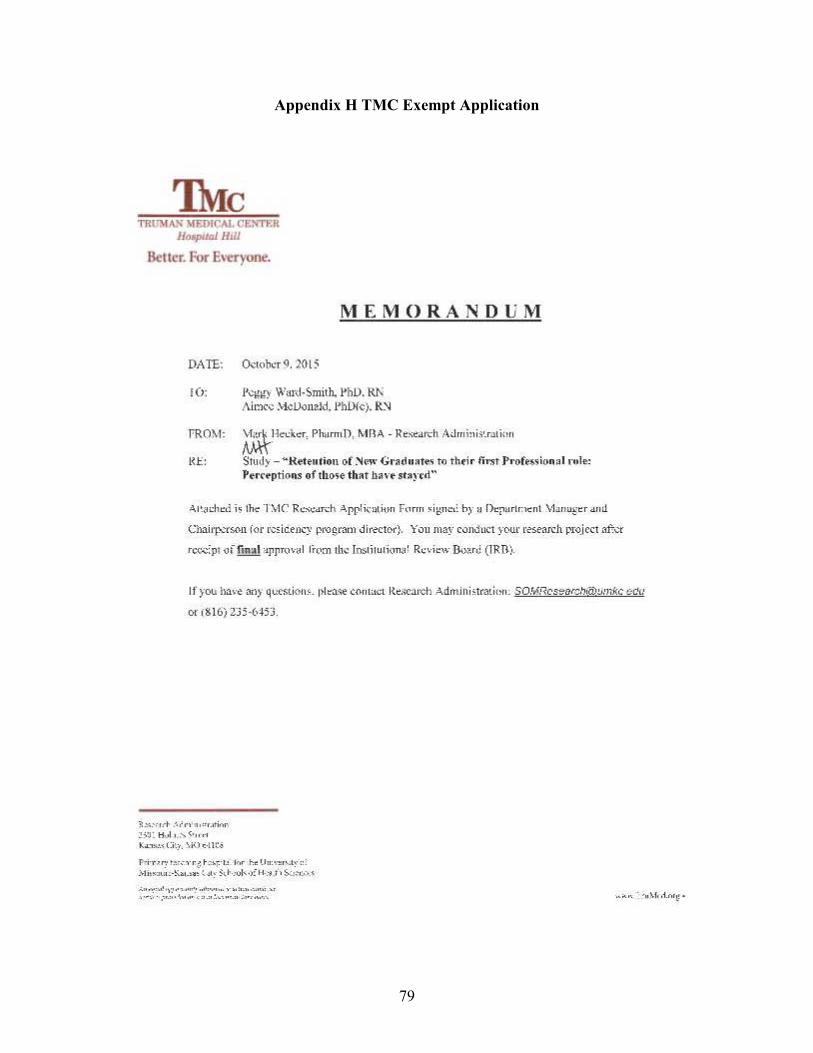
79
Appendix H TMC Exempt Application

80
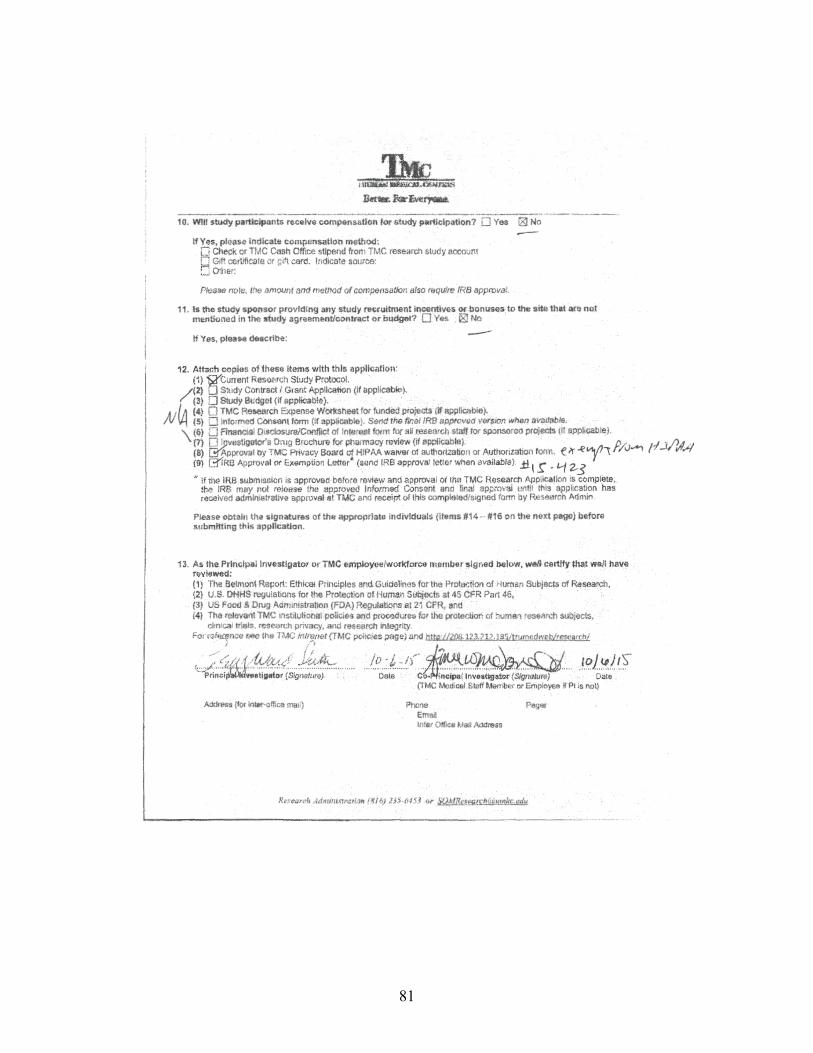
81

82

83
Appendix I CenterPoint IRB Application

84
Appendix J Instrument Scoring
SUBSCALES AND COMPONENT ITEMS
The Practice Environment Scale of the Nursing Work Index
Subscale Component items
Nurse Participation in Hospital Affairs 5, 6, 11, 15, 17, 21, 23, 27, 28
Nursing Foundations for Quality of Care 4, 14, 18, 19, 22, 25, 26, 29, 30,
31
Nurse Manager Ability, Leadership, and Support of
Nurses 3, 7, 10, 13, 20
Staffing and Resource Adequacy 1, 8, 9, 12
Collegial Nurse-Physician Relations 2, 16, 24
SCORING DIRECTIONS
Score each item so that higher numbers indicate greater agreement. Thus, if
Astrongly agree@ was coded 1, and Astrongly disagree@ was coded 4, you must first
reverse code (by subtracting each answer from 5) before calculating subscale
scores. Once the coding is in the right direction, calculate nurse-specific subscale
scores as the mean of the items in the subscale. The mean permits easy comparison
across subscales. For hospital-level scores, calculate the item-level means at the
hospital level. Then proceed with the standard computation for subscale scores.
This approach permits all nurse responses, including responses of nurses who did
not answer all items, to be included in the hospital score.
Calculate an overall PES-NWI “composite” score as the mean of the five subscale
scores. This approach gives equal weight to the subscales, rather than to the items.

85
Appendix K Protocol Closure Confirmation
15-423 Protocol Closed: Peggy Ward-Smith
Reply all| 5/26/2016
Ward-Smith, Peggy;
McDonald, Aimee W. (UMKC-Student);
UMKC IRB
PhD Protocol ID: 15-423 Principal Investigator: Peggy Ward-Smith Protocol Title: RETENTION OF NEW GRADUATES TO THEIR FIRST PROFESSIONAL ROLE: PERCEPTIONS OF THOSE THAT HAVE STAYED Review Type: M Department: School of Nursing The UMKC IRB has received the final report for your above referenced protocol. This is to confirm that your study is now closed. You may no longer have subjects enrolled and/or collect data under this protocol. Please contact the Research Compliance Office (email: [email protected]; phone: (816)235-5927) if you have questions or require further information.

86
References
Altier, M. E., & Krsek, C. A. (2006). Effects of a 1-year residency program on job
satisfaction and retention of new graduate nurses. Journal for Nurses in Staff
Development 22(2), 70-77.
American Nurses’ Association. [ANA]. (2016). Healthy work environment. Retrieved
from http://www.nursingworld.org/MainMenuCategories/WorkplaceSafety/
Healthy-Work-Environment
Arruda, E. H. (2005). Better retention through nursing theory. Nursing Management, 16-
18.
Bannon, W. (2014). The effect size: Advocating for a measure of magnitude. The STATS
Whisperer 4(3), 1.
Barladi, A. N., & Enders, C. K. (2010). An introduction to modern missing data analyses.
Journal of School Psychology, 48, 5-37.
Beauregard, M., Davis, J., & Kutash, M. (b). The graduate nurse rotational internship.
Journal of Nursing Administration, 37(3), 115-118.
Benner, P. (1982). From novice to expert. The American Journal of Nursing 82(3), 402-
407.
Bleich, M. R. (2012). In praise of nursing residency programs. American Nurse Today
7(5), 47-49.
Bowles, C., & Candela, L. (2005). First job experience of recent RN graduates:
Improving the work environment. Journal of Nursing Administration, 35(3), 130-
137.
Bratt, M. M. (2009). Retaining the next generation of nurses: The Wisconsin nurse

87
residency program provides a continuum of support. The Journal of Continuing
Education in Nursing, 40(9), 416-425.
Buffington, A., DeVine, D., Zwink, J., Sanders, C., & Fink, R. (2012). Factors affecting
nurse retention at an academic magnet hospital. JONA, 42(5), 273-281.
Bruyneel, L., Baoyue, L., Squires, A., Spotbeen, S., Meuleman, B., Lesaffre, E., &
Sermeus, W. (2014). Bayesian multilevel MIMIC modeling for studying
measurement invariance in cross-group comparisons. Medical Care 00(00), 1-11.
Casey, K., Fink, R., Krugman, M., & Propst, J. (2004). The graduate nurse experience.
JONA, 34(6), 303-311.
Censullo, J. L. (2008). The nursing shortage: Breach of ideology as an unexplored cause.
Advances in Nursing Science, 31(4), E11-E18.
Crowne, D. P., & Marlowe, D. A. (1960). A new scale of social desirability independent
of pathology. Journal of Consulting Psychology, 24, 351. Retrieved from
http://www.cengage.com/resource_uploads/downloads/0495092746_63626.pdf
Fiester, L. (2013). The RN work project: A national study to track career changes among
newly licensed registered nurses. Robert Wood Johnson Foundation. Retrieved
from http://www.rwjf.org/en/research-publications/find-rwjf-
research/2013/11/the-rn-work-project.html
Friese, C. R., & Himes-Ferris, L. (2013). Nursing practice environments and job
outcomes in ambulatory oncology settings. JONA 43(3), 149-154.
Gardner, J. K., Fogg, L., Thomas-Hawkins, C., & Latham, C. E. (2007). The
relationships between nurses’ perceptions of hemodialysis unit work environment
and nurse turnover, patient satisfaction, and hospitalizations. Nephrology Nursing
88
Journal 34(3), 271-281.
Gardner, J., & Walton, J. (2011). Striving to be heard and recognized: Nurse solutions for
improvement in the outpatient hemodialysis work environment. Nephrology
Nursing Journal 38(3), 239-253.
Hamilton, P., Eschiti, V., Mathur, S., Campbell, M., & Geneinhardt, G. (2010).
Expanding what we know about off-peak mortality in hospitals. JONA 40(3), 124-
128.
Hanrahan, N. P., & Aiken, L. H. (2008). Psychiatric nurse reports on the quality of
psychiatric care in general hospitals. Quality Management in Healthcare 17(3),
210-217.
Havens, D. S., Warshawsky, N., & Vasey, J. (2012). The nursing practice environment in
rural hospitals: Practice Environment Scale of the Nursing Work Index
assessment. JONA 42(11), 519-525.
Heinrich Heine Universitat Dusseldorf. (2014). G*power: Statistical power analyses for
Windows (Version 3.1.9.1) [software]. Retrieved from
http://www.gpower.hhu.de/en.html
Henshaw, A. S., Smeltzer, C. H., & Atwood, J. R. (1987). Innovative retention strategies
for nursing staff. Journal of Nursing Administration 17(6), 8-16.
Heslop, L., McIntyre, M., & Ives, G. (2001). Undergraduate student nurses’ expectations
and their self-reported preparedness for the graduate year role. Journal of
Advanced Nursing 36(5), 626-634.
Herzberg, F., & Mausner, B. (1959). The motivation to work. New York, NY: Wiley.
Howell, D. C. (2008). The analysis of missing data. In Owaithe, W., & Turner, S. (Eds.).

89
Handbook of social science methodology. (p. 208-224) London: Sage.
Institute of Medicine [IOM]. (2011). Initiative on the future of nursing. Retrieved from
http://www.thefutureofnursing.org/recommendations
Kanter, R.M. (1977). Men and Women of the Corporation. Basic Books, New York, NY.
Kanter, R.M. (1993). Men and Women of the Corporation, 2nd edn. Basic Books, New
York, NY.
Kelly, D. M., McHugh, M. D., & Sloane, D. M. (2014). Impact of critical care nursing on
30-day mortality of mechanically ventilated older adults. Critical Care Medicine
42(5), 1089-1095.
Kooker, B. M., & Kamikawa, C. (2010). Successful strategies to improve RN retention
and patient outcomes in a large medical centre in Hawaii. Journal of Clinical
Nursing 20, 34-39.
Kramer, M., & Hafner, L. P. (1989). Shared values: Impact on staff nurse satisfaction and
perceived productivity. Nursing Research 38(3), 172-177.
Kupperschmidt, B., Kientz, E., Ward, J., & Reinholz, B. (2010). A healthy work
environment: It begins with you. The Online Journal of Issues in Nursing, 1(15).
Retrieved from
http://www.nursingworld.org/MainMenuCategories/ANAMarketplace/ANAPerio
dicals/OJIN/TableofContents/Vol152010/No1Jan2010/A-Healthy-Work-
Environment-and-You.html?css=print
Kutney-Lee, A., Wu, E. S., Sloane, D. M., & Aiken, L. H. (2012). Changes in hospital
nurse work environments and nurse job outcomes: An analysis of panel data.
International Journal of Nursing Studies, 50, 195-201.

90
Lake, E. T. (2002a). Development of the practice scale of the nursing work index.
Research in Nursing & Health, 25, 176-188.
Lake, E. T. (2007b). The nursing practice environment: Measurement and evidence.
Medical Care Research and Review 64(2), 104S-122S.
Lake, E. T., & Friese, C. R. (2006). Variations in nursing practice environments: Relation
to staffing and hospital characteristics. Nursing Research 55(1), 1-9.
Laschinger, H. K. S. (2014). Impact of workplace mistreatment on patient safety risk and
nurse-assessed patient outcomes. Journal of Nursing Administration 44(5), 284-
290.
Laschinger, H. K. S. (2012). Job and career satisfaction and turnover intentions of newly
graduated nurses. Journal of Nursing Management 20(4), 472-484.
doi: 10.1111/j.1365-2834.2011.01293.x
Laschinger, H. K. S. (1996). A theoretical approach to studying work empowerment in
nursing: A review of studies testing Kanter's theory of structural power in
organizations. Nursing Administration Quarterly, 20(2), 25-41.
Laschinger, H. K. S., Almost, J., & Tuer-Hodes, D. (2003). Workplace empowerment
and Magnet hospital characteristics: Making the link. Journal of Nursing
Administration, 33, 410-422.
Laschinger, H. K. S., & Finegan, J. (2005). Using empowerment to build trust and respect
in the workplace: A strategy for addressing the nursing shortage. Nursing
Economic$, 23(1), 6-13.
Laschinger, H. K. S., Finegan, J., Shamian, J., & Wilk, P. (2003). Workplace
empowerment as a predictor of nurse burnout in restructured health care settings.

91
Longwoods Review, 1(3), 2-11.
Laschinger, H. K. S., Grau, A. L., Finegan, J., & Wilk, P. (2010). New graduate nurses’
experiences of bullying and burnout in hospital settings. Journal of Advanced
Nursing 66(12), 2732-2743. doi: 10.1111/j.1365-2648.2010.05420.x
Laschinger, H. K. S., Leiter, M., Day, A., & Gilin, D. (2009). Workplace empowerment,
incivility, and burnout: Impact on staff nurse recruitment and retention outcomes.
Journal of Nursing Management, 17, 302-311.
Lavoie-Tremblay, M., Paquet, M., Marchionni, C., & Drevniok, U. (2011). Turnover
intention among new nurses: A generational perspective. Journal for Nurses in
Staff Development 27(1), 39-45.
Liou, S., & Cheng, C. (2009). Using the Practice Environment Scale of the Nursing Work
Index on Asian nurses. Nursing Research 58(3), 218-225.
Liou, S., & Grobe, S. J. (2008). Perception of practice environment, organizational
commitment, and intention to leave among Asian nurses working in U.S.
hospitals. Journal for Nurses in Staff Development 24(6), 276-282.
Little, J. P., Ditmer, D., & Bashaw, M. A. (2013). New graduate nurse-residency. JONA
43(6), 361-366.
Loveridge, C. E. (1988). Contingency theory: Explaining staff nurse retention. JONA
18(6), 22-25.
Lu, H., While, A. E., & Barriball, K.L. (2005). Job satisfaction among nurses: A
literature review. International Journal of Nursing Students.
Manoljovich, M. (2007). Power and empowerment in nursing: Looking backward to
inform the future. The Online Journal of Issues in Nursing 12(1). Manuscript 1.

92
MacKusick, C. I., & Minick, P. (2010). Why are nurses leaving? Findings from an initial
qualitative study on nursing attrition. MEDSURG Nursing, 19(6), 335-340.
McDonald, A. W., & Ward-Smith, P. (2012). A review of evidenced based strategies to
retain nurses in the profession. Journal for Nurses in Staff Development 28(1),
E16-E20.
McGuinn, K. (2015). Leading initiatives: Nurse residency program. AACN online
newsletter. Retrieved from http://www.aacn.nche.edu/education-resources/nurse-
residency-program
McHugh, M. D., Kelly, L. A., Smith, H. L., Wu, E. S., Vanak, J. M., & Aiken, L. H.
(2013). Lower mortality in Magnet hospitals. Medical Care 51(5), 382-388.
Melnyk, B. M., & Fineout-Overholt, E. (2011). Evidence-based practice in nursing and
healthcare: A guide to best practice (2nd ed.). Philadelphia, PA: Lippincott,
Williams & Wilkins.
Munsey, C. (2006). Emerging adults: The in-between age. American Psychological
Association 37(6), 68.
National Quality Forum. (2004). National Quality Forum current NQF-endorsed
measures. Retrieved fromhttp://www.qualityforum.org/
Nedd, N. (2006). Perceptions of empowerment and intent to stay. Nursing Economics
24(1), 13-18.
Numminen, O., Ruoppa, E., Leino-Kilpi, H., Isoaho, H., Hupli, M., & Meretoja, R.
(2015). Practice environment and its association with professional competence
and work-related factors: Perception of newly graduated nurses. Journal of
Nursing Management, 1-11.
93
Olson-Sitki, K., Wendler, M. C., & Forbes, G. (2012). Evaluating the impact of a nurse
residency program for newly graduated registered nurses. The Journal of Nursing
Staff Development 28(4), 156-162.
Ortman, J. M., Velkoff, V. A., & Hogan, H. (2014). An aging nation: The older
population in the United States. U.S. Department of Commerce Economics and
Statics Administration. Retrieved from:
http://www.census.gov/prod/2014pubs/p25-1140.pdf
Polit, D. F., & Beck, C. T. (2012). Nursing research: Generating and assessing evidence
for nursing practice. (9th ed.). Philadelphia, PA: Wolters Kluwer Lippincott
Williams and Wilkins.
Pine, R., & Tart, K. (2007). Return on investment: Benefits and challenges of a
baccalaureate nurse residency program. Nursing Economic$ 25(1), 13-18, 39.
Purdy, N., Laschinger, H.K.S., Finegan, J., Kerr, M., & Olivera, F. (2010). Effects of
work environments on nurse and patient outcomes. Journal of Nursing
Management 18, 901-913.
Reuter, J. A. (1997). The financing of academic health centers: A chart book. Institute for
Healthcare Research and Policy, Georgetown University. Retrieved
from http://www.commonwealthfund.org/usr_doc/Reuter_financingahcs1.pdf
Robert Wood Johnson Foundation [RWJF]. (2015). Business case/cost of nurse turnover.
Retrieved from: http://www.rwjf.org/en/library/research/2009/07/wisdom-at-
work-retaining-experienced-nurses/business-case-cost-of-nurse-turnover.html
Rosster, R. (2014). Nursing shortage. AACN online newsletter. Retrieved from
http://www.aacn.nche.edu/media-relations/fact-sheets/nursing-shortage

94
Rother, J., & Lavizzo-Mourey, R. (2009). Addressing the nursing workforce: A critical
element for health reform. Health Affairs, 28(4), 620-624.
Salt, J., Cummings, G. G., & Profetto-McGrath, J. (2008). Increasing retention of new
graduate nurses: A systematic review of interventions by healthcare organizations.
Journal of Nursing Administration, 38(6), 287-296.
Shang, J., Friese, C. R., Wu, E., & Aiken, L. H. (2013). Nursing practice environment
and outcomes for oncology nursing. Cancer Nursing 36(3), 206-212.
Siu, H., Laschinger, H. K. S., Finegan, J. (2008). Nursing professional practice
environments: Setting the stage for constructive conflict resolution and work
effectiveness. Journal of Nursing Administration 38(5), 250-257.
Smith, L. M., Andrusyszyn, M. A., & Laschinger, H. K. S. (2010). Effects of workplace
incivility and empowerment on newly-graduated nurses’ organizational
commitment. Journal of Nursing Management 18, 1004-1015. doi:
10.1111/j.1365-2834.2010.01165.x
Spiva, L., Hart, P. L., Pruner, L., Johnson, D., Martin, K., Brakovich, B., McVay, F., &
Mendoza, S. G. (2013). Hearing the voices of the newly licensed RNs: The
transition to practice. The American Journal of Nursing, 113(11), 24-32.
SurveyMonkey. (2011). SurveyMonkey user manual. Retrieved from
http://help.surveymonkey.com/euf/assets/docs/pdf/UserManual.pdf?noIntercept/1
&session=L2F2LzEvdGltZS8xMzI4MDM2NTAxL3NpZC9JWG9DWHhQaw%
3D%3D
The Joint Commission. (2009). The Joint Commission current staffing effectiveness
standard PI.04.01.01. Retrieved fromhttp://www.jointcommission.org/standards

95
Tourangeau, A., Cranley, L., Laschinger, H. K. S., & Pachis, J. (2010A). Relationships
among leadership practices, work environments, staff communication, and
outcomes in long-term care. Journal of Nursing Management, 18, 1060-1072.
Tourangeau, A., Cummings, G., Cranley, L. A., Ferron, E. M., & Harvey, S. (2010B).
Determinants of hospital nurse intention to remain employed: Broadening our
understanding. Journal of Advanced Nursing 66(1), 22-32.
Trepanier, S., Early, S., Ulrich, B., & Cherry, B. (2012). New graduate nurse residency
program: A cost benefit analysis based n turnover and contract labor usage.
Nursing Economic$, 30(4), 207-214.
Trossman, S. (2009). Issues up close: Effective transitions. American Nurse Today, 4(6),
35-37.
United States Department of Labor. (2012). Bureau of Labor Statistics job outlook:
Healthcare: Registered nurses. Retrieved from
http://www.bls.gov/ooh/healthcare/registered-nurses.htm#tab-6
Universitat Dusseldorf. (2014). G*power: Statistical power analyses for Windows
(Version 3.1.9.1) [software]. Retrieved from http://www.gpower.hhu.de/en.html
Van Bogaert, P., Clarke, S., Willems, R. & Mondelaers, M. (2012). Staff engagement as
a target for managing work environments in psychiatric hospitals: Implications for
workforce stability and quality. Journal of Clinical Nursing 22, 1717-1728.
Van Bogaert, P., Meulemans, H., Calrke, S., Vermeyen, K., & Ven de Heyning, P.
(2009). Journal of Advanced Nursing, 65(10), 2175-2185.
Walker, K., Fitzgerald, K., & Duff, J. (2014). Supporting a healthy culture: Results of the
practice environment scale, Australia in a Magnet® designated hospital. Journal
96
of Nursing Administration 44(12), 653-658.
Wang, S., Liu, Y., & Wang, L. (2013). Nurse burnout: Personal and environmental
factors as predictors. International Journal of Nursing Practice 21, 78-86.
Warshawsky, N. E., & Havens, D. S. (2011). Global Use of the Practice Environment
Scale of the Nursing Work Index. Nursing Research, 60(1), 17–31.

97
Vita
Aimee McDonald obtained her Bachelor’s in Science and Nursing in 2002. She
began teaching in 2004 and also continued her education, completing her Master’s of
Science in Nursing, with a focus on Executive Leadership and a post-graduate certificate
in Nursing Education in 2007. Aimee continued to teach in nursing progressing from
teaching Licensed Practical Nursing students, to Associate Degree, and finally Bachelor’s
and graduate students.
Aimee has always enjoyed nursing research and has completed projects on patient
safety in relation to falls, No Tumbling After: A Multifaceted Approach to Patient Safety
and her Master’s education focused on the barriers to nursing students wanting to enter
the profession Factors Effecting Nursing Student Enrollment In Nursing Programs.
In addition to pursuing her own education and teaching, Aimee has also remained
active in practice, working as a staff nurse in progressive care, critical care float pool, and
progressing to a leadership role at North Kansas City Hospital.
During her program progression at the University of Kansas City-Missouri,
Aimee also published an article with her program chair, Peggy Ward-Smith, A Review of
Evidence-Based Strategies to Retain Graduate Nurses in the Profession in the Journal of
Nurses in Staff Development. In addition to publications Aimee has presented on several
key-nursing issues, including Interventions to Improve Graduate Nurse Retention (2014)
at the Midwest Nursing Research Society Student Poster Presentation, Interventions to
Improve Graduate Nurse Retention (2014) at the University of Missouri-Kansas City
Graduate Assistance Fund Luncheon. Prior to her work on nursing retention Aimee also
presented on Tackling the Tough Quality Issues of Anticoagulation to Falls Prevention

98
(2011) at the Cerner Health Conference, No Tumbling After: A Multifaceted Approach to
Patient Safety (2011) at the Missouri Excellence in Safe Care Awards where she also
accepted the award on behalf of North Kansas City Hospital, and on Factors Effecting
Nursing Student Enrollment In Nursing Programs at Research College of Nursing
Scholarship Day.