Embed Size (px)
Citation preview

September 13, 2017
REPORT #E17-357
Retail Products
Portfolio Market Test
Assessment
Prepared For NEEA:
Dulane Moran, Principal Evaluation Lead
Prepared by:
Research Into Action
Apex Analytics, LLC
Illume Advising, LLC
Northwest Energy Efficiency Alliance PHONE
503.688.5400 EMAIL

Retail Products Portfolio Market Test Assessment
Table of Contents | Page i
Table of Contents
Executive Summary .............................................................................................................. I
Key Findings ............................................................................................................................................ II
Conclusions and Recommendations ..................................................................................................... IV
1. Introduction ................................................................................................................... 1
1.1. Initiative Description and History ................................................................................................... 1
1.2. Market Test and the Initiative Life Cycle ........................................................................................ 2
1.3. RPP Market Test Objectives and Research Questions ................................................................... 2
1.4. Structure of This Report ................................................................................................................. 3
2. Methodology .................................................................................................................. 4
2.1. In-Depth Interviews ........................................................................................................................ 4
2.2. Initiative Data Analysis ................................................................................................................... 6
2.3. Literature Review ........................................................................................................................... 8
3. Findings .......................................................................................................................... 9
3.1. Objective 1: Improve Data Administration and Access .................................................................. 9
3.2. Objective 2: Build Scale through Retail and Extra-Regional Engagement ................................... 14
3.3. Objective 3: Improve Transparency and Streamline the Portfolio Management Process .......... 18
3.4. Objective 4: Build Consensus and Buy-in on Evaluation Activities and Approach ....................... 21
4. Conclusions and Recommendations ............................................................................ 28
Appendix A. Detailed RPP Work Group Interview Findings ......................................... A-1
A.1. About the RPP Work Group ........................................................................................................ A-1
A.2. Key Findings ................................................................................................................................. A-1
A.3. Objective – Achieve Clarity Around Stakeholder Expectations from RPP ................................... A-3
Appendix B. Detailed Program Data Characterization ................................................ B-1
B.1. Market Share of Efficient Products ............................................................................................. B-1
B.2. Retailer-level Sales ...................................................................................................................... B-4
B.3. Assortment .................................................................................................................................. B-6

Retail Products Portfolio Market Test Assessment
Table of Contents | Page ii
Appendix C. Detailed Baseline Analysis Findings ......................................................... C-1
C.1. Product Baselines – Data Limitations .......................................................................................... C-2
C.2. Findings ....................................................................................................................................... C-6
Appendix D. Detailed Literature Review Findings ....................................................... D-1
D.1. Trade Promotion Strategies ....................................................................................................... D-1
D.2. Measuring Effects of Trade Promotions..................................................................................... D-6
D.3. Retailer Decision Making Process .............................................................................................. D-7
Appendix E. Data Collection Instruments .................................................................... E-1
E.1. NEEA, Implementer, EPA, and Extra-Regional Program Sponsor Staff Interview Guide ............ E-1
E.2. RPP Work Group Member Interview Guide ................................................................................ E-6
E.3. Retailers Participating in the Northwest Only Interview Guide .................................................. E-8
List of Tables
Table 1: Status of Market Test Objectives as of May 1, 2017 ........................................................................ I
Table 2: Specific Research Questions............................................................................................................ 3
Table 3: IDI Sample ....................................................................................................................................... 4
Table 4: Data Administration and Access Research Questions .................................................................... 9
Table 5: Improvements to Data Portal Functionality .................................................................................. 10
Table 6: Scale Research Questions ............................................................................................................. 14
Table 7: Portfolio Management Process Research Questions .................................................................... 18
Table 8: Evaluation Research Questions ..................................................................................................... 21
Table 9: Products Included in Analysis of Historical Sales Data .................................................................. 25
Table 10: Sales Volume of Room Air Conditioner Models, March 2016 – February 2017 ........................ B-8
Table 11: Baseline Development Approaches ........................................................................................... C-1
Table 12: Historical Data Availability by Retailer and Product .................................................................. C-2
Table 13: Products for Included in Baseline Analysis ................................................................................. C-6
Table 14: T-test Difference of Sales-Weighted Means Qualified Product Market Share – Pre-initiative and Initiatives Periods ....................................................................................................................................... C-7
Table 15: Results of the Freezer Baseline Model Analysis ......................................................................... C-9

Retail Products Portfolio Market Test Assessment
Table of Contents | Page iii
Table 16: Results of the Dryer Baseline Model Analysis .......................................................................... C-11
Table 17: Summary Findings and Lift for Dryers ...................................................................................... C-12
Table 18: Trade Promotion Approaches ................................................................................................... D-2
List of Figures
Figure 1: NEEA RPP Pilot and ESRPP Program Sponsor Timeline .................................................................. 2
Figure 2: Updates to RPP Data Portal Over 2016 ........................................................................................ 12
Figure 3: Differences in Model Matching Findings Between RPP Data Portal and Energy Solutions Data Review for Products Sold Between March 2016 and January 2017 ........................................................... 13
Figure 4: Qualified Sales of ESRPP-only Products by Retailer, March 2016-January 2017 . Error! Bookmark not defined.
Figure 5: Qualified Sales of Products in Both NW RPP and ESRPP Portfolios by Retailer, March 2016-January 2017 .................................................................................................. Error! Bookmark not defined.
Figure 6: Example Baseline Market Share Curve ........................................................................................ 22
Figure 7: Distinct Models Matched by Retailer and Month ........................................................................ 26
Figure 8: Market Share of Qualified Products March 2016 – February 2017 ............................................ B-2
Figure 9: Difference between ENERGY STAR Market Share from RPP Sales Data and ENERGY STAR Unit Shipment Data ........................................................................................................................................... B-3
Figure 10: 5% of Highest-Volume Models as a Proportion of Total Category Sales .................................. B-3
Figure 11: Sales by Month of Three Highest Volume Air Cleaner and Air Conditioner Models March 2016 – January 2017 ........................................................................................................................................... B-4
Figure 12: Qualified Sales of ESRPP-only Products by Retailer, March 2016-January 2017 .............. B-Error! Bookmark not defined.
Figure 13: Qualified Sales of Products in Both NW RPP and ESRPP Portfolios by Retailer, March 2016-January 2017 ............................................................................................... B-Error! Bookmark not defined.
Figure 14: Qualified Products as a Proportion of Total Category Sales by Retailer, March 2016 – February 2017 ............................................................................................................ B-Error! Bookmark not defined.
Figure 15: Total Sales and Penetration of Qualified Products by Retailer for Air Cleaners and Air Conditioners ............................................................................................................................................... B-6
Figure 16: Qualified Products as a Proportion of All Products, March 2016 – February 2017 .................. B-8
Figure 17: Average Proportion of Assortment Added and Removed Monthly Across Retailers, April 2016 – January 2017 ........................................................................................................................................... B-9

Retail Products Portfolio Market Test Assessment
Table of Contents | Page iv
Figure 18: Average Monthly Models Selling at Least Five Units Added and Removed as a Proportion of Assortment Across Retailers, April 2016 – January 2017 .......................................................................... B-9
Figure 19: Change in Air Conditioner Assortment Across Retailers, April 2016 – January 2017 ............. B-10
Figure 20: Average Change in Monthly Assortment of Qualified Products as a Proportion of Total Assortment of Qualified Products by Retailer, April 2016 – January 2017. B-Error! Bookmark not defined.
Figure 21: Demonstration of Data Summarization Issues: Retailer Entrance and Exit from Reporting (Air Cleaners) ............................................................................................... C-Error! Bookmark not defined.
Figure 22: Demonstration of Data Summarization Issues: Retailer Pre-Initiative vs Initiative Period Sales Inconsistent Reporting ............................................................................................................................... C-3
Figure 23: Demonstration of Data Summarization Issues: Historical Market Share of Qualifying Air Cleaners ..................................................................................................................................................... C-5
Figure 24: Sales Weighted Average Qualified Product Market Share Across Evaluated Product Types – Pre-Initiative and Initiative Periods ........................................................................................................... C-7
Figure 25: Basic and Advanced Freezer Market Share - Pre-Initiative and Initiative Periods ................... C-8
Figure 26: Historical and Forecasted Market Share of Qualifying Freezers .............................................. C-9
Figure 27: Historical and Forecasted Market Share of Qualifying Dryers ................................................ C-10
Figure 28: Modeled No-Program and Program Dryer Market Share vs Actual Market Share of Qualifying Products ................................................................................................................................................... C-11

Retail Products Portfolio Market Test Assessment
Executive Summary | Page I
Executive Summary
This report presents findings from the Market Test Assessment (MTA) of the Northwest Energy Efficiency Alliance’s (NEEA’s) Retail Products Portfolio (RPP) initiative.
Through the RPP initiative, NEEA seeks to increase the energy efficiency of targeted consumer electronics and other plug load products that deliver cost effective energy savings through leveraged midstream intervention. To this end, NEEA offers incentives to participating retailers for each qualified product sold in order to influence decisions at the corporate level around product assortment. By influencing these decisions, the pilot seeks to both increase the likelihood that a consumer will select an efficient option when purchasing a targeted product and ultimately motivate manufacturers to increase the efficiency of their product designs in response to retailer demand. In order to increase the scale of the RPP offering and amplify the initiative’s influence on retailers, NEEA is participating in the national ENERGY STAR® Retail Products Platform (ESRPP) program, which coordinates efforts of program administrators around the United States offering RPP in their respective territories.
This Market Test Assessment verifies and documents the results of the market test, which seeks to provide final validation of an initiative’s intervention strategies, identify any gaps in the strategies, and answer any remaining questions of effectiveness before NEEA fully implements an initiative. It is important to note that the RPP Market Test extended over a period of approximately 18 months (NEEA developed the market test objectives late in 2015), and Market Test Assessment research occurred over 12 months. The initiative developed rapidly over the market test period. While this report documents the initiative’s experience during the market test, many of the challenges and issues the initiative faced early in the market test had been resolved by May 2017. NEEA identified four high-level objectives for the RPP market test. Table 1 lists these objectives and a brief summary of their status as of May 1, 2017.
Table 1: Status of Market Test Objectives as of May 1, 2017
Market Test Objectives Status as of May 1, 2017
Notes
Improve data administration and access to retailer full category data to improve market adoption and energy savings measurement.
Complete Initial challenges with the RPP data portal limited the utility of retailer sales data. Many of those challenges have been resolved, although opportunities for improvement remain, and NEEA will likely need ongoing support in energy savings measurement.
Build scale through retail and extra regional engagement.
Complete Both additional retailers and additional extra-regional program administrators plan to join RPP.
Improve transparency and streamline the Portfolio Management Process.
Complete NEEA has documented a process for product selection that has support of the RPP Work Group.
Build consensus and buy-in on evaluation activities and approach.
In Progress Many ESRPP program sponsors lack experience evaluating market transformation programs, and most are early in the process of evaluating their RPP pilots. It is not yet clear which evaluation approaches, if any, these organizations’ regulators will accept.

Retail Products Portfolio Market Test Assessment
Executive Summary | Page II
The evaluation team draws on three primary sources of data to address the objectives of the RPP MTA:
In-depth interviews with three groups of respondents:
• Staff involved in managing and implementing NEEA’s RPP initiative at NEEA, NEEA’s RPP implementation contractor, and the RPP data administrator.
• Energy efficiency program sponsors from outside the Northwest participating in ESRPP and ENERGY STAR staff involved in the ESRPP coordination effort.
• Staff members of NEEA’s funding utilities who are active in the RPP Work Group.
Analysis of initiative data, including both a characterization of the sales data available through the RPP data portal and an analysis to evaluate the feasibility of using the historical data the portal provides to determine whether a statistically significant lift has occurred in sales of qualified products.
A review of academic literature on assortment planning and trade promotions to identify any common practices that manufacturers and retailers might use to measure the effectiveness of trade promotions similar to RPP.
Key Findings
Improved Data Administration and Access
Program sponsors around the country have contracted with the recommended RPP data administrator, and this coordination has improved the data submission process for participating retailers. While the RPP data portal was not prepared to process retailer sales data in a way that met program sponsors’ needs at the time of ESRPP’s launch, data quality had improved substantially by May 2017. Some inconsistencies remain in model matching, particularly for products that are not subject to federal efficiency standards or have recently gone through an ENERGY STAR specification change, and in classifying products into bins. The RPP data portal also does not yet offer some functions that would further improve NEEA’s ability to track adoption of, and savings from, qualified products moving forward, like indicating which products would have qualified under past specifications.
Increased Scale
Through engagement with ESRPP, the scale and reach of the RPP initiative steadily increased during the market test. As of May 1, 2017, eight program administrators representing 18% of U.S. residential consumers had signed participation agreements with ESRPP.1 The program has also been able to engage additional retailers, including some not currently participating in RPP, who are willing to accept the initiative’s requirements. NEEA and other program sponsors are wary of stressing the initiative’s incentive budgets and infrastructure by expanding the retailer pool too quickly.
1 As of May 1, 2017, the program administrators participating in ESRPP were: Consolidated Edison (NY), Efficiency Vermont, Focus on
Energy (WI), NEEA, Pacific Gas and Electric (PG&E), Sacramento Municipal Utility District (SMUD), and Xcel Energy (MN and CO). Proportion of U.S. residential consumers is based on Energy Information Association (EIA) 861 data for 2015.

Retail Products Portfolio Market Test Assessment
Executive Summary | Page III
Program sponsors around the country have committed resources to ESRPP, drawn by the potential to achieve economies of scale through coordination with other program sponsors and expand market transformation program offerings. Program sponsor concerns over their ability to sufficiently demonstrate energy savings attributable to RPP and the loss of autonomy inherent in a coordinated program are potential barriers to the initiative’s ability to maintain its scale and continue to grow.
Transparent and Streamlined Portfolio Management Process
Selecting products to include in the RPP portfolio requires NEEA to balance the interests of two key groups: extra-regional program sponsors in order to coordinate offerings presented to retailers, and NEEA’s funding utilities in order to ensure the RPP portfolio is complementary to their existing program offerings:
NEEA and other program sponsors reported that national coordination of the product selection process was effective, although the process during 2016 took longer than some had hoped.
Building consensus among NEEA’s funding utilities on the products to include in 2017 required extensive stakeholder engagement in 2016 and resulted in a refined process document that lists the steps in decision-making and the timeframe for each decision. The stakeholders involved anticipate that this refined process will allow for smoother decision-making in the future.
The products selected for inclusion in RPP also have the potential to impact the benefits the initiative offers to participating retailers. Sales data indicate that the mix of products included in the portfolio can have important consequences for the amount of incentives a particular retailer earns from the initiative.
Build Consensus on Evaluation
Due to its early experience implementing an RPP pilot and market transformation-focused evaluation approach, NEEA is able to claim savings and has developed a framework for establishing baseline market shares. Other ESRPP program administrators are in the process of establishing approaches to evaluate the energy savings RPP generates. Assessing progress on acceptance of market transformation evaluation approaches among energy efficiency program sponsors (EEPS) and regulatory bodies will likely take time. Members of NEEA’s initiative team are participating in task forces focused on evaluation methods and contributing to a Uniform Methods Project chapter. Quantifying the effects of RPP is likely to be a challenge for program sponsors. It is difficult to measure the influence of midstream incentives like those RPP offers on sales of products to end-users; all of the traditional methods have notable drawbacks.
To test the feasibility of using market share estimates forecasted from the historical sales data displayed in the RPP data portal as an input to baseline estimates, we conducted an analysis to forecast market shares of the products included in the RPP portfolio in 2016. A variety of factors limited our ability to conduct this analysis, but most of these are a result of the transition in data administrators and other factors related to the launch of ESRPP, and are not expected to continue. The type of data available in the RPP data portal was sufficient to forecast market shares from historical data for air cleaners, freezers, and clothes dryers.

Retail Products Portfolio Market Test Assessment
Executive Summary | Page IV
In setting its baselines and estimating energy savings, NEEA takes a considerably more granular approach than the analysis conducted here, for example accounting for climate zones and differences in product classification bins, which sought to test the feasibility of a single input to a baseline estimate. NEEA contracted with Energy Solutions to assist in generating energy usage estimates for RPP products at the level of detail NEEA needs to create its savings estimates.
Conclusions and Recommendations
Based on these findings, we draw the following conclusions and recommendations:
Conclusion 1: While some challenges arose during the market test, those challenges appear to be resolved or are in the process of resolution. The most notable challenges were related to establishing RPP data portal and data management process and clarifying NEEA’s funding utilities’ role in the product selection process. The structure of ESRPP concentrates a great deal of responsibility with the data administrator, who is the only actor that can diagnose and address problems with the data and must respond to the needs of a diverse set of program sponsors. While the data administrator worked with NEEA and other program administrators to refine the data portal, NEEA needed additional consultant support to analyze the data and generate energy usage estimates. To some extent, this additional support provided information the data portal is designed to provide. However, this support also provided NEEA with analysis at the level of granularity it needs to generate energy savings estimates, a function that will likely remain necessary even as the data portal improves. While some of NEEA’s funding utilities expressed dissatisfaction with NEEA’s communication around the selection of products for the 2017 RPP portfolio, conducted in 2016, a product selection process established and documented in late 2016 is expected to provide adequate input for NEEA’s funding utilities in the future.
• Recommendation 1: Continue to monitor, and work with the data administrator to improve, the quality of the sales data displayed in the RPP data portal, including addressing duplicate model numbers, ensuring that model matching is effective, and identifying and addressing outliers and anomalies.
• Recommendation 2: Plan for future consultant support in analyzing sales data to develop energy usage estimates.
• Recommendation 3: Consider working with other ESRPP program administrators to contract with a third-party that could take the necessary steps to access raw sales data. This contractor could then conduct quality control checks on the data portal and run analyses not possible using aggregated data to support evaluation of RPP’s outcomes
• Recommendation 4: Continue to proactively communicate with RPP Work Group members around product selection and other key initiative decisions.
Conclusion 2: The ability of ESRPP program sponsors outside the Northwest to estimate the energy savings RPP generates, and justifying those estimates to regulators, remains the greatest risk to the initiative’s continued growth. The need to show influence to justify the energy savings RPP generates was one of the primary concerns ESRPP program sponsors outside the Northwest reported in interviews during the summer of 2016. Most program sponsors have time to develop an evaluation approach, and many have made progress in evaluation planning
Retail Products Portfolio Market Test Assessment
Executive Summary | Page V
since their interviews. However, effectively evaluating an initiative like RPP is complex, and requires consideration of:
• The full range of factors that might affect a baseline market share: The data portal is designed to provide sufficient data to forecast market shares for efficient products using the historical sales data the ESRPP participation agreement requires retailers to submit, but these market share forecasts are best used as one input among many to a baseline estimate.
• The full range of initiative outcomes: including its influence on accelerating or strengthening energy efficiency standards and specifications.
• Interim outcomes: Given that RPP requires the greatest investment early in its implementation while delivering much of its benefit over the long term, it is important to assess interim outcomes, like changes to retailers’ assortments, in addition to the changes in market share of efficient products that are ultimately expected to follow.
Given this complexity and the limited experience of the interviewed ESRPP program sponsors outside the Northwest in evaluating market transformation efforts, it may be difficult for some to convince regulators accustomed to downstream, resource acquisition programs of RPP’s value. Without a process for connecting observed shifts in the market to RPP incentives that satisfies ESRPP program sponsors’ regulators, RPP may not be able to maintain the scale it has achieved and continue to expand. With its long experience implementing and evaluating market transformation programs, NEEA can continue to support other program sponsors in identifying appropriate ways to assess RPP’s progress and effectiveness.
• Recommendation 5: Investigate the potential to obtain more detail on retailers’ assortments from sales data submissions, including visibility into assortment by retailer (including both qualified and non-qualified products).2 These assortment lists do not need to include sales volume; monitoring changes in the proportion of qualified products in a retailer’s assortment provides an indicator of the initiative’s influence on assortment decisions that may appear before those changes result in a shift in market share.
• Recommendation 6: Continue to advise other ESRPP program sponsors in market transformation evaluation approaches. Ways NEEA can offer its expertise to other program sponsors include:
Sharing information about NEEA’s baseline approach through forums like the ESRPP Evaluation, Measurement, and Verification (EM&V) Task Group, participation in efforts to define standard evaluation approaches for midstream market transformation programs through State and Local Energy Efficiency Action Network (SEE Action) and the Uniform Methods Project, and presentations at industry conferences.
Making NEEA staff available to advise or consult with other program administrators, their regulators, or their evaluators on baseline approaches as opportunities to do so arise.
2 A list of the unique models a given retailer sold in a given month can serve as a proxy for that retailer’s assortment, providing similar
information to what a shelf survey would capture.

Retail Products Portfolio Market Test Assessment
Introduction | Page 1
1. Introduction
The Northwest Energy Efficiency Alliance (NEEA) contracted with Research Into Action, Inc. and its team members Apex Analytics LLC and Illume Advising LLC (the research team) to assess the Retail Products Portfolio (RPP) initiative’s progress against its market test objectives. This report presents findings from our assessment.
1.1. Initiative Description and History
Through the RPP initiative, NEEA seeks to increase the energy efficiency of targeted consumer electronics and other plug load products that deliver cost effective energy savings through leveraged midstream intervention. To this end, NEEA offers incentives to participating retailers for each qualified product sold. These incentives seek to increase the gross margin retailers earn from selling efficient products relative to inefficient alternatives, and thus influence the retailers to favor efficient products in corporate level decisions around product assortment.
By influencing retailer decisions, the initiative seeks to increase the likelihood that a consumer will select an efficient option when purchasing a targeted product. At the same time, the initiative anticipates that manufacturers will recognize an increase in retailer demand for efficient products and increase the efficiency of their product designs. NEEA also anticipates that the increased market share of qualified products resulting from the initiative’s influence on retailers and manufacturers will allow the initiative to successfully advocate for more stringent efficiency standards and specifications, further influencing the market for the targeted products.
The RPP initiative builds on the retailer relationships and experience NEEA developed through a previous TV Initiative to expand both the range of targeted products and the number of retailer participants. Through the RPP market test NEEA seeks to increase the efficiency of sound bars, room air cleaners, freezers, electric dryers, room air conditioners, and ultra-high definition televisions.
Because retailers generally make decisions about assortment at a national level, partnerships with other program administrators are important to the success of RPP. By partnering with other program administrators NEEA can increase the scale of RPP so that retailers are eligible for incentives on sales of qualified products in a larger portion of their market, making those incentives more likely to influence assortment decisions. NEEA was an early leader in piloting RPP, beginning the effort in late 2013. Building on the experience of NEEA and other early adopters (including Pacific Gas and Electric [PG&E]) U.S. Environmental Protection Agency (EPA) launched a national ENERGY STAR® Retail Products Platform (ESRPP) coordinating effort. Through this effort RPP has worked to standardize retailer participation agreements and sales data reporting and management, and to coordinate evaluation needs across program administrators. NEEA decided to join this national effort in late 2015.
Figure 1 provides a detailed timeline of RPP events, including the onboarding of additional ESRPP Program Sponsors and the proportion of U.S. ratepayers the participating program administrators serve.

Retail Products Portfolio Market Test Assessment
Introduction | Page 2
Figure 1: NEEA RPP Pilot and ESRPP Program Sponsor Timeline (as of May 1, 2017)
Note: PG&E: Pacific Gas & Electric, SMUD: Sacramento Municipal Utility District. The New Jersey Clean Energy Program (NJCEP) joined
ESRPP in September 2016, but had to drop the program at the end of 2016 when funding was not renewed for 2017 and is not included in this figure.
1.2. Market Test and the Initiative Life Cycle
NEEA uses a stage-gate process called the Initiative Life Cycle to develop its initiatives. The Initiative Life Cycle consists of six progressive stages, starting with Scanning and Concept Identification to identify new opportunities, extending through Market Development and eventually culminating in Long-Term Monitoring of markets post NEEA intervention. The market test is part of Strategy Testing and Finalization, the final stage before an initiative fully scales up to Market Development.
The market test provides validation of an initiative’s intervention strategies, identifies any gaps in the strategies, and answers any remaining questions of effectiveness before NEEA fully implements an initiative. The Market Test Assessment (MTA) verifies and documents the results of the market test. Thus, a market test assessment is different from other types of evaluations in that it focuses on the effectiveness of initiative processes and systems to a greater extent than on the initiative’s early influence on the market.
1.3. RPP Market Test Objectives and Research Questions
NEEA identified four high-level objectives for the market test:
Improve data administration and access to retailer full category data to improve market adoption and energy savings measurement.
Build scale through retail and extra regional engagement.
Improve transparency and streamline the Portfolio Management Process.
NEEA, PG&E, Efficiency Vermont
Focus on Energy, SMUD
Xcel ConEdison
0%
10%
20%
30%
40%
50%
60%
70%
Per
cen
t o
f U
S R
esid
enti
al C
ust
om
ers
NEEA RPP Pilot
ESRPP Potential
ESRPP
2017 into July 2013 through 2015

Retail Products Portfolio Market Test Assessment
Introduction | Page 3
Build consensus and buy-in on evaluation activities and approach.
NEEA identified specific research objectives associated with each market test objective. Table 2 lists the specific research questions associated with each market test objective.
Table 2: Specific Research Questions
Objective Research Questions
Improve data administration and access to retailer full category data to improve market adoption and energy savings measurement
Do energy efficiency program sponsors (EEPS) contract with recommended data administrator?
Do retailers comply with the terms of the retailer agreement and provide historical full category product sales data?
Is there improved efficiency and accuracy of sales forecasts and energy savings estimates?
Is there indication of movement in the market such [as] percentage of market share of incented energy-efficient products?
Build scale through retail and extra regional engagement
Are retailers willing to provide full category sales data and implementation plans?
Do additional retailers express interest in joining ENERGY STAR® RPP?
Do extra-regional (non-NEEA) EEPS commit resources?
Improve transparency and streamline the Portfolio Management Process
Do the developed tools that interact with the data administration process and other inputs improve the efficiency of the Product Selection Process?
Do NW stakeholders feel their filter criteria and own program needs are taken into account in the Product Selection Process with less effort on their part?
Are we able to execute a Product Selection Process that meets NEEA stakeholders' needs and aligns well with the national product selection process?
Build consensus and buy-in on evaluation activities and approach
Are we able to start accumulating savings?
Is there clear indication of growing acceptance of a market transformation evaluation approach among EEPS and regulatory bodies?
Are success metrics proposed and validated?
In addition to the research questions that NEEA defined, the evaluation team identified additional research questions within each market test objective to guide our analysis.
1.4. Structure of This Report
This report begins with a summary of the key data collection and analysis activities on which the Market Test Assessment findings are based. Following this discussion, we present key findings related to each of NEEA’s Market Test Objectives. Finally, we present conclusions and recommendations based on our findings. Detailed findings from each data collection and analysis activity are available in the appendices.

Retail Products Portfolio Market Test Assessment
Methodology | Page 4
2. Methodology
The evaluation team drew on three primary sources of data to address the objectives of the RPP MTA: In-depth interviews, analysis of retailer-reported sales data, and secondary research. This chapter provides a detailed description of each of the data collection activities that inform this report.
2.1. In-Depth Interviews
To address the objectives of the MTA, we interviewed individuals representing a wide range of market actors and stakeholders connected to RPP. Table 3 summarizes the types of respondents interviewed within each population and the number of completed interviews.
Table 3: IDI Sample
Population Respondent Type Number of Completes
Coordinated with ESRPP
NEEA RPP Staff NEEA program and planning staff 3 No
RPP Implementation and Evaluation Consultants
Data administrator staff, implementation contractor staff, baseline estimation support contractor staff
3 No
NEEA Stakeholders (RPP Work Group members)
Utility sector managers, program managers
10 No
Other Program Sponsors’ RPP Staff Program managers 6 No
EPA ENERGY STAR Staff Program managers 1 No
Participating Retailers Sustainability staff, Product merchants, marketing staff
ESRPP Participants 3 Yes
NEEA Only Participants 1 No
2.1.1. NEEA RPP Staff, Implementers, and Evaluation Consultants
We conducted interviews with four contacts that were involved in NEEA’s RPP program planning or implementation: NEEA’s Initiative Manager and Product Manager for RPP, NEEA’s RPP implementation contractor, and the RPP data administrator. The focus of these interviews was to assess how NEEA could improve RPP data administration and access, build scale for RPP, streamline the portfolio management process, and build consensus and buy-in on the evaluation of RPP.

Retail Products Portfolio Market Test Assessment
Methodology | Page 5
2.1.2. RPP Work Group Members
We conducted interviews with ten Work Group members representing utilities across the region.3 We developed the sample for these interviews in collaboration with NEEA staff, who provided an annotated list of Work Group members that prioritized interview candidates. NEEA’s prioritizations were based on each person’s level of activity on the Work Group, and geographic location. We designed our sample to 1) speak with a diversity of stakeholders across NEEA’s region including large, small, urban, and rural utilities, and 2) solicit feedback from those utilities who were most actively involved with the RPP Work Group.
Each of the ten respondents had participated first-hand in the Work Group, with eight of the ten being active participants for two years or more.4 Respondents’ levels of involvement ranged from being a self-described “listener” who “speaks up when we’re asked to,” to several members who reported being consistently, heavily engaged.
We interviewed Work Group members in December 2016. At NEEA’s request, we delayed interviews with Work Group members until NEEA and the Work Group had resolved some uncertainty related to the product selection process.
2.1.3. Other Program Sponsors’ RPP Staff
We completed interviews with Program Managers from five of the ten organizations engaged with ESRPP in the summer of 2016, as well as a staff member of one program sponsor’s regulator. ESRPP Program sponsor interviews focused on organizations that had signed on, or were in the process of signing on, to the national program in 2016. The perspective of these organizations likely differs from that of organizations that had previously operated RPP pilots and might be more comparable to the perspectives of organizations that join as the program’s scale grows. We also interviewed a key individual involved in RPP coordination efforts at the EPA. We conducted these interviews in August and September of 2016. Given the pace of development of ESRPP, program sponsors’ experiences may have changed since the time of these interviews. Where possible, we have sought to provide updates drawing on information shared in ESRPP Evaluation, Measurement, and Verification (EM&V) Task Group meetings.
2.1.4. Participating Retailers
As part of their participation agreement, retailers participating in ESRPP agree to make merchants available for one, 45-minute evaluation interview each year. EPA coordinated these interviews, and the evaluation team provided input on the data collection instruments that guided these interviews. EPA also coordinated interviews with retailer sustainability staff.
The research team also attempted to interview retailers participating only in the Northwest (NW)-only component of the program. In doing so, we sought to speak with both merchants responsible for the
3 One respondent was able to complete only approximately half of the interview, answering through question 11 of 23.
4 The remaining two had participated for one year and 1.5 years.

Retail Products Portfolio Market Test Assessment
Methodology | Page 6
relevant product categories and sustainability staff. However, we were only able to conduct an interview with one retailer, while the other two retailers were unavailable or did not wish to participate.
2.2. Initiative Data Analysis
2.2.1. Sales Data Characterization
We analyzed data on RPP participating retailers’ sales in NEEA territory for sales that occurred between March 2016 and February 2017. Our characterization of the sales data focused on three areas important to initiative management and evaluation: the market share of efficient products, differences in sales between retailers, and assortment.
We conducted these analyses using data available through the RPP Data Portal. The data available through the portal is subject to limitations specified in the ESRPP retailer participation agreements. According to these limitations, model-level sales data for non-qualified products are available only when aggregated across three or more retailers. Model-level sales data is available by retailer for qualified products, but not for unqualified products. The portal also reports qualified models as a proportion of all sales by retailer. In addition to the data presented in the RPP data portal, our sales data characterization incorporated the results of an independent model matching effort that Energy Solutions conducted as part of their work to help NEEA develop energy savings estimates for RPP products.
2.2.2. Baseline Analysis
As part of our assessment of NEEA’s market test objective of building consensus and buy-in on evaluation activities and approach, we conducted an analysis of historical sales trends in order to forecast the market share of efficient products without initiative intervention. The RPP data portal is designed to support this type of analysis, and, by attempting to develop market share forecasts for the products included in the RPP portfolio in 2016, we sought to determine whether this approach would be feasible as a starting point for ESRPP program administrators to estimate baseline sales.
NEEA has developed and documented an approach for estimating market share baselines for RPP products. Historical sales data is one of several inputs to that baseline approach. This analysis is not intended as an assessment of, or alternative to, NEEA’s baseline-setting approach. Given the limitations of forecasts based on historical data, it is important for baseline estimates to account for additional factors like technological and market changes. In addition, in setting baselines and estimating energy savings, NEEA conducts much more granular analysis (for example, by climate zone and product classification bin) than this broad, product-level analysis. This analysis sought to test the feasibility of forecasting market shares of efficient products absent program intervention as an input to a potential future consensus evaluation approach.
Our analysis focused on forecasting the market share of qualified products, defined as the percentage of program qualified sales relative to overall reported sales.5 To determine whether the portal data could
5 As defined in the ICF online retailer product database dashboard, “The penetration is calculated by taking the total qualified products and
dividing by the total number of products sold per category. Unverified products are not included in the calculation.” https://www.retailproductsplatform.com/

Retail Products Portfolio Market Test Assessment
Methodology | Page 7
be used to generate market share forecasts absent initiative influence, and whether differences between these forecasts and actual market share may be attributed to RPP, the team examined the sales-weighted mean market share of qualified products for the pre-initiative period and the period during which the initiative offered incentives on the targeted products. It is important to note that NEEA expects shifts in market share of qualified products to be a long-term outcome of RPP; the initiative is not expected to have a large effect on market share in the first few months after incentives are available, which is the period for which data were available for this analysis. Because our analysis sought to determine the feasibility of forecasting market shares based on the data available in the portal, we relied on the RPP data portal for all sales data.6
As a first step, we ran a simple comparison of means (t-test) between the pre-initiative sales data and data from the initiative period for the products available for the analysis. A t-test is helpful to determine if the mean annual market share is statistically different between pre-initiative and initiative periods.
For those products that met the sales modeling criteria, as will be discussed below, the team then ran an ordinary least squares (OLS) regression to determine the influence of (1) time and (2) the program on the market share of qualified products. Including the time variable in the model is important as this helps account for the general trend of market share in the period before program intervention. The functional form of the regression is shown in the equation below:
𝑌𝑡 = 𝛽0 + 𝛽1𝑇𝑖𝑚𝑒𝑡 + β2𝑃𝑟𝑜𝑔𝑟𝑎𝑚𝑡,𝑖 + εt
Where: 𝑌t = Market share in month t 𝑇𝑖𝑚𝑒t = Number of months from the beginning of the historical sales stream 𝑃𝑟𝑜𝑔𝑟𝑎𝑚t,i = Dummy (binary) variable representing pre-initiative (0) and initiative period (1) 𝛽0 = Model Intercept 𝛽1 = Secondary coefficient, represents the time-sensitive monthly change to the market share 𝛽2 = Primary coefficient of interest. Represents the change in market share due to program ε𝑡 = Model error term
To estimate the counterfactual, or what the market share of qualified products would have been in absence of the program, the evaluation team developed two separate forecasts: a forecast based on exponential smoothing, and a forecast based on including only the time variable in the above equation (removing the program-based variable). The advantage of an exponential smoothing forecast is that it places the greatest weight to the most recent month, with each previous month receiving exponentially smaller weight to the forecast. If there were clear indicators of seasonality (as was the case for air conditioners) or the team had access to additional years of sales data that showed evidence of seasonal or monthly sales trends, then these factors could also be added to the model to account for this.
To estimate potential market lift associated with program activities, the output from the modeled sales forecast with the initiative intervention is compared with the modeled forecast without initiative intervention. The difference between these two forecasts represents the absolute program-induced lift in market share of qualified products. As an example, if the initiative market share was 40% and the pre-initiative market share was 20%, then the absolute market lift would be 20%. The relative program
6 The primary data reports downloaded from the portal included: Qualifying Penetration by Retailer, Qualified Sales by Model, Qualifying
Penetration Percent.

Retail Products Portfolio Market Test Assessment
Methodology | Page 8
induced sales lift is represented by the absolute percentage of market share classified as lift divided by the actual initiative market share. Using the same example, the relative program sales lift would be 20% divided by 40%, or 50% (i.e., 50% of the initiative period sales reflected program influence). As a comparative cross-check, the team also compared the modeled market share with initiative intervention to the exponentially smoothed market share forecast for the same period without program intervention.
2.3. Literature Review
We conducted a literature review of academic literature on trade promotions best practices and evaluation methodology. This included a review of a variety of academic journals including: Marketing Science, the Journal of Marketing Research, and the Journal of Retailing.

Retail Products Portfolio Market Test Assessment
Findings | Page 9
3. Findings
This chapter provides a detailed description of our findings from the data collection activities described in Section 2. Findings are organized by market test objective.
3.1. Objective 1: Improve Data Administration and Access
NEEA defined four specific research questions related to the market test objective of improving data administration and access to full category data to improve market adoption and energy savings measurement. Table 4 lists those research questions and provides a brief summary of findings related to each.
Table 4: Data Administration and Access Research Questions
Research Question Findings
Do ESRPP program sponsors contract with the recommended data administrator?
Yes
Do retailers comply with the terms of the retail agreement and provide historical full category product sales data?
Yes
Is there improved efficiency and accuracy of sales forecasts and energy savings estimates?
Yes, after refinement of the data portal and with additional contractor support
Is there indication of movement in the market such as percentage of market share of incented energy-efficient products?
Yes, see section 3.4 for additional detail.
The following section provides a more detailed summary of findings related to data administration and access, including both the specific questions NEEA defined and broader findings.
Program sponsors around the country have contracted with the recommended RPP data administrator, and this coordination has improved the data submission process for participating retailers. NEEA and other organizations involved in developing the ESRPP effort anticipated that, if multiple program sponsors contracted with the same data administrator RPP would benefit from both economies of scale in data management and a streamlined process for retailers. Interviews with program sponsors participating in ESRPP found that most had contracted, or planned to contract, with the recommended data administrator. Only one of the interviewed program sponsors reported seeking an alternative, because of concerns over the cost of the recommended data administrator’s services. This program sponsor speculated that similar concerns may be preventing other small program administrators from joining ESRPP.
An interviewed RPP staff member reported that the data administrator had simplified the process of submitting sales data for participating retailers by smoothly integrating their system with the retailers’ data tracking systems to allow for easier transmission of data. Despite some initial glitches that resulted in the data administrator receiving incomplete data from one retailer, RPP staff members reported that

Retail Products Portfolio Market Test Assessment
Findings | Page 10
most participating retailers had regularly been providing sales data.7 The RPP data portal supports this finding.
At the time of ESRPP’s launch, the RPP data portal was not prepared to process retailer sales data in a way that met program sponsors’ needs. Following the launch of ESRPP, NEEA, other program sponsors, and the data administrator devoted considerable effort to developing and refining the data portal and ensuring data quality so the portal would meet program sponsors’ needs. NEEA staff noted that some effort refining the portal was to be expected in developing a new data system designed to serve multiple program sponsors. NEEA staff members and others reported seeking improvements to the functionality of the portal and increased clarity in the information it displayed, improvements in the quality of the data the portal presented, and improvements in the model matching process behind the data portal. Table 5 summarizes the areas in which NEEA and other program sponsors worked with the data administrator to improve the data portal in 2015.
Table 5: Improvements to Data Portal Functionality
Type of Revision Example Elements Addressed
Clarity and usability of reporting
• Clearly labeling reports
• Documenting how values are calculated
• Adding capability to specify time periods for reports and compare over time
Validity of data • Identifying and addressing anomalies from ongoing sales trends or expected seasonal changes
‒ Some reflect market activity (e.g. a retailer having a sale on an RPP product)
‒ Some result from incomplete data (e.g. technical problems resulting in one retailer’s data not completely uploading to the system)
Quality of data • Addressing differences in formatting of model numbers (e.g. separating groups of characters with dashes) between retailer uploads to de-duplicate model-level data
In addition to improving the functionality of the data portal, NEEA and other program administrators worked with the data administrator to improve the accuracy with which the administrator was able to match models included in retailer data submissions to the ENERGY STAR Qualified Product List (QPL) and other product databases. NEEA staff and other program administrators reported that the data administrator was initially unable to match a large number of models to determine whether they qualified for incentives. As prior evaluations of RPP and the TV Initiative have documented, these types
7 One Northwest-only retailer was unable to provide regular reporting of sales data. The initiative’s primary contact at this retailer, a
corporate sustainability staff member, did not have direct access to sales data and reported the internal coordination to obtain the data was challenging. NEEA ultimately dropped this retailer from the initiative.

Retail Products Portfolio Market Test Assessment
Findings | Page 11
of challenges are inherent to efforts to match models listed in retailer sales data to ENERGY STAR QPLs.8 Challenges that the data administrator experienced during the market test included:
Isolating products of types eligible for RPP incentives within retailer data submissions. Retailer data submissions included products outside of the specific devices for which RPP offers incentives. For example, air cleaner data included products like portable fans and replacement air cleaner filters as well as air cleaners themselves. The data administrator had to verify that a model number corresponded to a product eligible for RPP incentives before determining whether the model was ENERGY STAR.
Determining whether slight differences between model numbers reported in sales data and those listed on QPLs indicate product differences with implications for energy use. Manufacturers may make small alterations to model numbers to indicate superficial variations, like color, and retailers may add characters to a model number for use in their own tracking systems. As a result of these changes, a model number reported in a retailer’s sales data submission may not exactly match that model’s number as listed on the ENERGY STAR QPL. This limits the capabilities of automatic model matching processes, and requires manual oversight to verify that models that do not match are truly non-qualified.
Addressing month-to-month changes in the ENERGY STAR QPL. NEEA staff noted there can be considerable change in the ENERGY STAR QPL from month to month, with some models dropping off the list while others are added. This variation in the ENERGY STAR QPL would lead to a single model appearing as qualified for RPP incentives one month but not the next. As this challenge stems from changes to the ENERGY STAR QPL, rather than the process of matching models from retailer sales data, NEEA and other RPP program sponsors would need to work with EPA to address the underlying issue. The data administrator has little leverage over the ENERGY STAR QPL. Nonetheless, to smooth some of the variation in ENERGY STAR QPLs, the data administrator aggregates the current QPL with QPLs downloaded in each of the previous two months to match against each monthly data submission.
The prevalence of unmatched models and other data issues delayed incentive payments to ESRPP retailers until August of 2016, more than four months after the retailers signed their participation agreements. Staff noted that, even in August, they anticipated that further adjustments in the sales data would take place and influence their incentive payments. For example, a large adjustment in soundbar incentive payments was required in December 2016 to correct for errors in model matching. According to a NEEA staff member, “It was kind of [the retailer’s] problem, but it should have been caught by QC. It seemed like there should have been another level of QC on that, either manual or built-in to flag stuff like that.”
The data available through the RPP data portal alone were also not sufficient for NEEA to forecast the baseline market shares of qualified products and develop unit energy consumption estimates by product class and efficiency level. NEEA contracted with Energy Solutions to assist in these efforts, including independently matching the models listed in the RPP data portal to current and past ENERGY STAR QPLs. While NEEA staff reported that Energy Solutions’ analysis of the data displayed in the RPP data portal
8 Research Into Action, Inc., Apex Analytics, LLC, and ILLUME Advising, “Retail Products Portfolio Pilot Evaluation Final Report” (Portland,
OR: Northwest Energy Efficiency Alliance, March 3, 2016), http://neea.org/docs/default-source/reports/retail-products-portfolio-pilot-evaluation-final-report.pdf?sfvrsn=6.
Retail Products Portfolio Market Test Assessment
Findings | Page 12
had met their needs for developing energy consumption estimates, NEEA staff expressed hope that, as the data portal improved, it would no longer be necessary to independently match models to determine their efficiency level and product class.
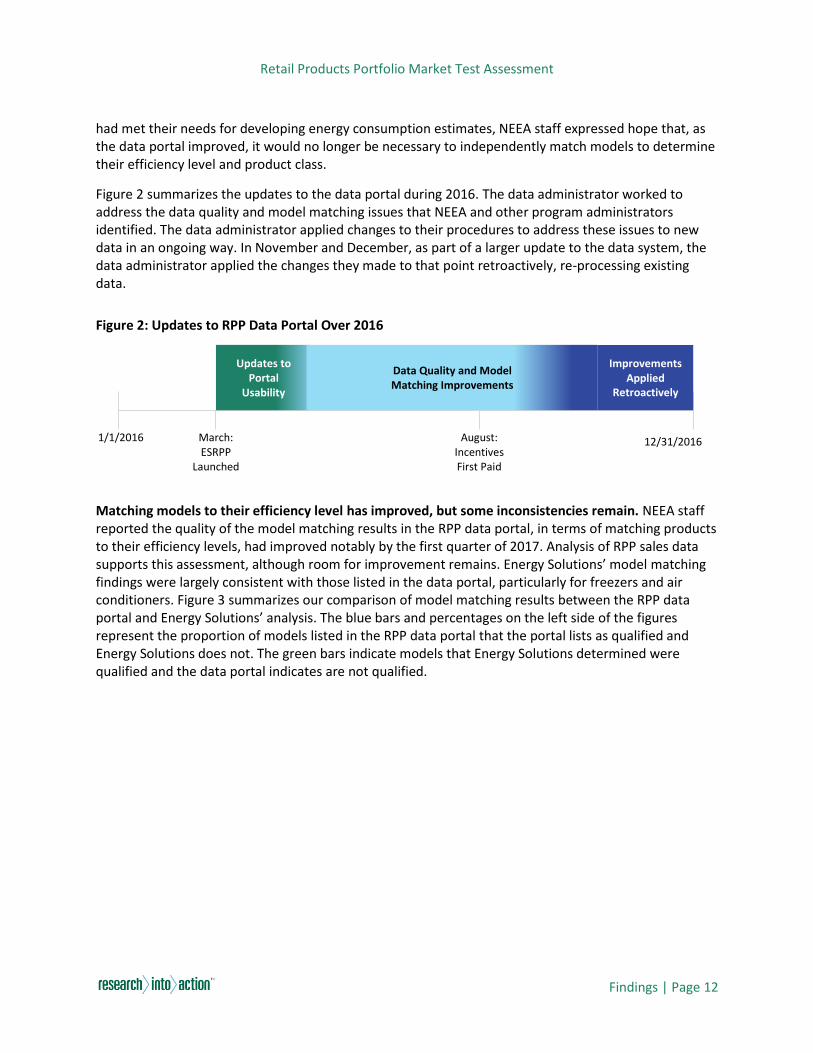
Figure 2 summarizes the updates to the data portal during 2016. The data administrator worked to address the data quality and model matching issues that NEEA and other program administrators identified. The data administrator applied changes to their procedures to address these issues to new data in an ongoing way. In November and December, as part of a larger update to the data system, the data administrator applied the changes they made to that point retroactively, re-processing existing data.
Figure 2: Updates to RPP Data Portal Over 2016
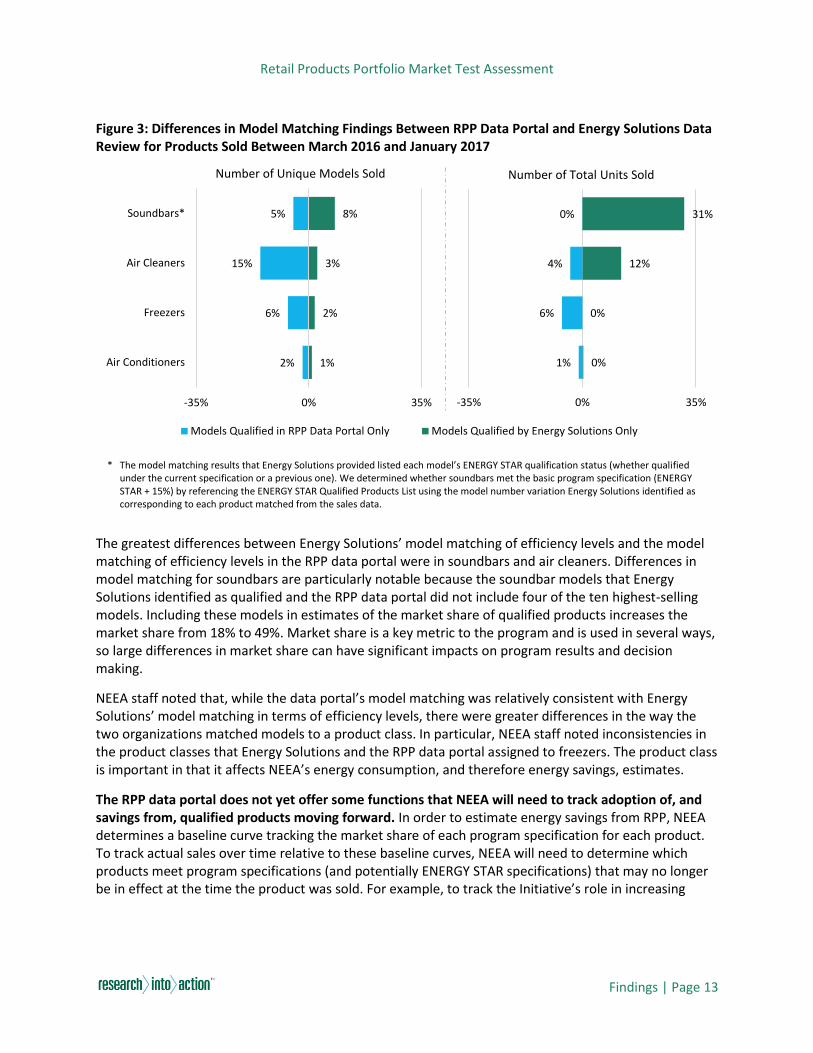
Matching models to their efficiency level has improved, but some inconsistencies remain. NEEA staff reported the quality of the model matching results in the RPP data portal, in terms of matching products to their efficiency levels, had improved notably by the first quarter of 2017. Analysis of RPP sales data supports this assessment, although room for improvement remains. Energy Solutions’ model matching findings were largely consistent with those listed in the data portal, particularly for freezers and air conditioners. Figure 3 summarizes our comparison of model matching results between the RPP data portal and Energy Solutions’ analysis. The blue bars and percentages on the left side of the figures represent the proportion of models listed in the RPP data portal that the portal lists as qualified and Energy Solutions does not. The green bars indicate models that Energy Solutions determined were qualified and the data portal indicates are not qualified.
March: ESRPP
Launched
August: Incentives First Paid
Updates to Portal
Usability
Data Quality and Model Matching Improvements
Improvements Applied
Retroactively
1/1/2016 12/31/2016
Retail Products Portfolio Market Test Assessment
Findings | Page 13
Figure 3: Differences in Model Matching Findings Between RPP Data Portal and Energy Solutions Data Review for Products Sold Between March 2016 and January 2017
* The model matching results that Energy Solutions provided listed each model’s ENERGY STAR qualification status (whether qualified
under the current specification or a previous one). We determined whether soundbars met the basic program specification (ENERGY STAR + 15%) by referencing the ENERGY STAR Qualified Products List using the model number variation Energy Solutions identified as corresponding to each product matched from the sales data.
The greatest differences between Energy Solutions’ model matching of efficiency levels and the model matching of efficiency levels in the RPP data portal were in soundbars and air cleaners. Differences in model matching for soundbars are particularly notable because the soundbar models that Energy Solutions identified as qualified and the RPP data portal did not include four of the ten highest-selling models. Including these models in estimates of the market share of qualified products increases the market share from 18% to 49%. Market share is a key metric to the program and is used in several ways, so large differences in market share can have significant impacts on program results and decision making.
NEEA staff noted that, while the data portal’s model matching was relatively consistent with Energy Solutions’ model matching in terms of efficiency levels, there were greater differences in the way the two organizations matched models to a product class. In particular, NEEA staff noted inconsistencies in the product classes that Energy Solutions and the RPP data portal assigned to freezers. The product class is important in that it affects NEEA’s energy consumption, and therefore energy savings, estimates.
The RPP data portal does not yet offer some functions that NEEA will need to track adoption of, and savings from, qualified products moving forward. In order to estimate energy savings from RPP, NEEA determines a baseline curve tracking the market share of each program specification for each product. To track actual sales over time relative to these baseline curves, NEEA will need to determine which products meet program specifications (and potentially ENERGY STAR specifications) that may no longer be in effect at the time the product was sold. For example, to track the Initiative’s role in increasing
1%
2%
3%
8%
-2%
-6%
-15%
-5%
-35% 0% 35%
Air Conditioners
Freezers
Air Cleaners
Soundbars*
Number of Unique Models Sold
Models Qualified in RPP Data Portal Only Models Qualified by Energy Solutions Only
0%
0%
12%
31%
-1%
-6%
-4%
0%
-35% 0% 35%
Number of Total Units Sold

Retail Products Portfolio Market Test Assessment
Findings | Page 14
uptake of basic tier air cleaners, NEEA will need to identify models that meet the 2016 specification (ENERGY STAR Version 1.2) even after a new ENERGY STAR specification takes effect.9
The RPP data portal does not currently provide information about a model’s qualification for specifications other than the one currently in effect. The model matching Energy Solutions conducted for NEEA identified models that qualified under prior ENERGY STAR specifications, although this appears to be a result of matching models to historical QPLs. Relying on current and historical QPLs may underestimate the market share of products that qualify under previous specifications. QPLs will not capture products that do not qualify under the current specification, but would have qualified under a previous specification, and came on the market after the specification changed. To more accurately determine whether a model qualifies under a particular specification, it would be necessary to gather sufficient data on the model and its energy use to independently determine whether the model meets a particular specification.
Obtaining the necessary data for these calculations will be easier for some products than others. For example, manufacturers must submit model-level energy data for products covered by federal and California state minimum efficiency standards. Energy data on models that do not qualify for ENERGY STAR for products not subject to minimum efficiency standards are typically more difficult to obtain, as there is unlikely to be a central source for these data. Matching models to the appropriate databases and gathering this type of product class and energy data was part of the work Energy Solutions did to support RPP in 2016. During the TV Initiative, Energy Solutions addressed a similar challenge, developing a methodology to map unmatched products to prior efficiency levels.
3.2. Objective 2: Build Scale through Retail and Extra-Regional Engagement
This section reviews the progress of NEEA’s RPP initiative in building scale in terms of both the number of retailers participating in the initiative and the number of program sponsors in ESRPP. NEEA developed three specific research questions related to building the scale of RPP. Table 6 lists these research questions and provides a brief summary of findings related to each.
Table 6: Scale Research Questions
Research Question Finding
Do retailers accept the terms of the ESRPP SOW template that includes a requirement to provide full category sales data and implementation plans?
Yes
Do additional retailers express interest in joining ENERGY STAR RPP? Yes
Do extra-regional (non-NEEA) program sponsors commit resources? Yes
9 For some products, NEEA and other RPP program sponsors establish two qualifying efficiency tiers and corresponding incentive levels: a
basic tier designed to incentivize efficient products over inefficient ones, and an advanced tier designed to drive uptake of the most efficient products available. According to an internal document dated November 4, 2016, titled “RPP Product Portfolio Management Process,” NEEA seeks to set qualification criteria for RPP incentives so that the basic tier achieves a market share between 15% and 35% and the advanced tier, if applicable, achieves a market share between 5% and 15%.

Retail Products Portfolio Market Test Assessment
Findings | Page 15
The remainder of this section provides a more detailed review of the RPP initiative’s progress in building scale. It begins with a discussion of efforts to build scale in terms of retail engagement, followed by a discussion of efforts to build scale in terms of the number of participating program administrators.
3.2.1. Retail Engagement
The RPP initiative maintains NEEA’s relationships with retailers that partnered with NEEA since the TV Initiative. Three of those retailers also participate in the national ESRPP program. Over time, NEEA staff and other ESRPP program sponsors plan to increase the RPP retailer pool to capture a greater portion of the market for the targeted products. By directly influencing retailers that make up a large share of the market for the targeted products, RPP is better positioned to achieve its goal of transforming the market as a whole.
Because retailers make assortment decisions on a national scale, the potential for an initiative serving a single utility service territory, or even a single region, to affect those decisions is limited. ESRPP coordinates program offerings across multiple program sponsors with the goal of engaging program sponsors that, together, cover a sufficient portion of the participating retailers’ markets to make the program more influential in national-level retailer decisions. Coordination among program sponsors has the added benefit of simplifying participation for retailers, who need to track only one set of program requirements and reporting needs to participate in multiple program sponsor territories, thus increasing their willingness to participate.
Retailers, including some not currently participating in RPP, have shown willingness to accept the initiative’s requirements. To facilitate the product selection process, evaluation, and general program management of RPP, NEEA and other program administrators require ESRPP retailers to provide:
Current sales data, including sales of both qualified and non-qualified models (full category sales data),
Historical full category sales data for the 12 months prior to a product’s introduction to the program, and
Annual implementation plans detailing the steps the retailer will take to increase sales of qualified products.
Despite some program sponsors’ initial concerns that retailers would not agree to these conditions, almost all of the participating retailers complied with the program requirements in 2016, providing the required sales data and ESRPP retailers providing implementation plans.10 As noted in the previous section, limits to data accessibility appear to reflect challenges with the data transfer and management processes, rather than a failure on the retailers’ part to comply with the initiative’s requirements.
The retailers participating in ESRPP also submitted implementation plans in 2016. These plans are not central to NEEA’s efforts to assess RPP’s progress. In assessing RPP, NEEA focuses on the initiative’s
10 One retailer participating in the Northwest, but not in the larger ESRPP program, was unable to reliably provide sales data, and NEEA
ultimately dropped them from the initiative. Based on interview findings, this inability to reliably provide data appears to reflect an organizational structure that limited the Initiative’s primary contact at the retailer’s access to data, rather than an organizational unwillingness to comply with the requirement to provide data.

Retail Products Portfolio Market Test Assessment
Findings | Page 16
potential to influence retailers’ assortment decisions and increase the stringency of efficiency standards and specifications. The store-level promotional efforts retailers are likely to detail in their implementation plans are not a primary focus of NEEA’s RPP initiative.
Nonetheless, ESRPP program designers anticipate that these plans could aid more resource acquisition-focused program sponsors in evaluating ESRPP by identifying the specific actions retailers will take to increase sales of qualified products. Verifying that retailers comply with these plans could allow evaluators and program administrators to demonstrate that retailers had taken action to increase sales of qualified products, supporting RPP’s ability to demonstrate its influence on retailer promotional behavior and link this to an increase in market share of efficient models. While retailers complied with the requirement to submit plans in 2016, one ESRPP program sponsor reported the plans were not as detailed as expected, and implementation staff noted that some program sponsors had expressed a desire for more detailed implementation plans.
One additional retailer joined ESRPP in the spring of 2017 and a second is expected to join the initiative by the end of 2017, indicating that willingness to accept the initiative’s requirements is not limited to the retailers already participating. NEEA and other program sponsors have been reluctant to open participation to too wide a group of retailers too quickly. NEEA staff expressed concern that increasing the retailer pool quickly could stress incentive budgets and overwhelm the initiative’s infrastructure, which is still in development.
Academic research on retailer participation in trade promotions that manufacturers offer suggests that the relationship NEEA, its implementation contractor, and the ESRPP program more generally, develops with retailers is important to their participation. Research has shown that the nature of the relationships between individuals at a retailer’s firm and a manufacturer’s firm are one variable that may impact a retailer’s participation in trade promotions. However, researchers found that the presence of strong relationships does not diminish the importance of other variables, such as incentives and reporting requirements.11
3.2.2. Extra-Regional Program Sponsor Engagement
The potential to achieve economies of scale through coordination with other program sponsors and expand market transformation program offerings has motivated program sponsors to participate in ESRPP and commit resources to the program. Five out of six Program Sponsors mentioned that the opportunity to engage more effectively with national retailers was a benefit of ESRPP. One program sponsor expects these economies of scale to make the program more effective, saying, “The more we pool our incentives across the country, we have the opportunity for greater influence on what the retailers and manufacturers do. As local programs have limited effectiveness in truly causing market transformation, that is the important part.”
Program sponsors also want to be engaged in RPP because they see it as an opportunity to participate in midstream and market transformation programs. The four program sponsors that mentioned these benefits anticipate midstream market transformation programs could influence adoption of efficient products at a lower cost than downstream approaches that provide rebates directly to consumers
11 Murray, et. Al. 1998. Managing Promotion Program Participation within Manufacturer-Retailer Relationships. Journal of Marketing.

Retail Products Portfolio Market Test Assessment
Findings | Page 17
through applications or point-of-purchase discounts. Program sponsors mentioned that for some products, the declining value of incentives provided to consumers are less effective for influencing consumer choice and that incentive money may be more influential in a midstream approach. According to one sponsor, “For us, a potential big benefit is moving away from downstream rebates, which are very costly.” There is also general interest in market transformation programs. One program sponsor said, “Market transformation is intriguing to take part in – to see if this is the future of energy efficiency or what role will this play moving forward – one of the bigger motivators.”
ESRPP Program sponsors remain concerned about their ability to sufficiently demonstrate energy savings attributable to RPP and the loss of autonomy inherent in a coordinated program. At the time of their interviews, in the summer of 2016, few of the interviewed program sponsors had established what evaluation methods they would use to evaluate RPP. Three Program Sponsors specifically mentioned their concerns about whether they would be able to show savings, noting that they must do so in order to continue offering the program. Most of the interviewed Program Sponsors (four of five) noted that there was still time to establish evaluation methods and that they were beginning discussions internally or planned to hire third party consultants to help answer these questions. In updates on their evaluation efforts to the ESRPP EM&V task group in March 2017, program sponsors reported progress on evaluating ESRPP. For example, one program sponsor was in the process of developing an evaluation plan, while another reported a process evaluation was nearly complete and planned to evaluate impacts later in 2017.
One Program Sponsor noted that, for their stakeholders, showing program benefits was particularly important as incentives move upstream. This program sponsor indicated that since their efficiency programs are supposed to benefit the ratepayers that fund them, the program had an added impetus to demonstrate the program’s influence on the market if the incentive did not go to the ratepayer directly. While this concern remains unresolved, most program sponsors expressed confidence that, with the help of additional data and consultant expertise, they will determine an appropriate and effective evaluation method.
Loss of autonomy over program design and retailer relationships was another common concern program sponsors expressed. Referring to Navitas’ management of ESRPP retailer relationships, one program sponsor said, “We have all those layers between us and the retailer, it gets difficult to have a role in influencing approaches as much as we might like, and to bring lessons learned in from other programs or things that are region-specific… It gets a little removed – you lose some control.” This program sponsor suggested they would use in-store activities to incorporate more region-specific elements. Two Program Sponsors also expressed concern that ESRPP retailer agreements favor retailers. One of these sponsors noted that this resulted in difficulty in removing stores that refused to participate in store-level promotions from the program, and challenges in obtaining sales data at the granularity they would like.

Retail Products Portfolio Market Test Assessment
Findings | Page 18
3.3. Objective 3: Improve Transparency and Streamline the Portfolio Management Process
Selecting products to include in the Initiative’s portfolio is a key annual activity that NEEA undertakes in managing RPP. In selecting products for RPP, NEEA must coordinate with the larger ESRPP effort. By uniting multiple program sponsors around a single set of measures, ESRPP seeks to increase its scale, and therefore its ability to influence retailer decisions. Offering a common set of measures facilitates the process for retailers by eliminating the need to track which sponsor incentivizes which products and under what specifications. In addition to extra-regional coordination, product selection is also important to NEEA’s funding utilities, which are concerned about potential overlap with their downstream appliance incentives and track RPP activities as part of their role as NEEA funders.
NEEA defined three specific research questions related to the portfolio management process that address both the need for coordination regionally and with program sponsors outside the region. Table 7 lists these questions and briefly states related findings.
Table 7: Portfolio Management Process Research Questions
Research Question Finding
Do the developed tools that interact with the data administration process and other inputs improve the efficiency of the product selection process?
Yes
Do NEEA stakeholders feel their filter criteria and own program needs are taken into account in the Product Selection Process with less effort on their part?
While this was challenging in 2016, NEEA stakeholders anticipate the process will more easily account for their needs in the future.
Are we able to execute a Product Selection Process that meets NEEA stakeholders’ needs and aligns well with the national product selection process?
See above. The “RPP Portfolio Management Process” document NEEA produced is
expected to support this.
The remainder of this section provides a more detailed review of findings related to the portfolio management process.
NEEA and other program sponsors reported that national coordination of the product selection process was effective, although the annual 2016 process ultimately took longer than some had hoped. ESRPP program sponsors collaborated through the ESRPP Products Task Force to select products for the 2017 portfolio. The task force used a consensus-based approach, without a formal governance structure or voting process. The interviewed ESRPP program sponsors reported that they felt they had sufficient input to the product selection process through participation on the task force. Program sponsors also noted that task force members had taken a collaborative approach to product selection, demonstrating willingness to include products in the portfolio that may not have been ideal for their own service territories.
NEEA staff reported that participants in the ESRPP program had developed a standard workbook listing the information necessary to evaluate a product for inclusion in RPP. Recognizing the potential benefit of RPP incentives on high-volume products, participating retailers also voluntarily provided sales data for

Retail Products Portfolio Market Test Assessment
Findings | Page 19
two products under consideration for the 2017 RPP portfolio (clothes washers and refrigerators) to assist in program administrators’ decision-making.
While ESRPP program sponsors expressed satisfaction with the product selection process during interviews in August 2016, the full process ultimately took considerably longer than anticipated. The interviewed program sponsors reported they expected the product selection process for 2017 to be completed in the fall of 2016. While program sponsors settled on the products to add to the portfolio relatively early in the process, the need to refine the data portal delayed the analysis necessary to set incentive tiers. Ultimately, the 2017 ESRPP portfolio was not finalized until February of 2017; changes took effect April 1, 2017 as planned.
Sales data indicate that the mix of products included in the RPP portfolio can have important consequences for the amount of incentives a particular retailer earns from the initiative. In the ESRPP product selection process, each year NEEA and other participating program sponsors generate a preliminary list of potential products to add to the existing portfolio the following year, and each participating retailer ranks each product according to their interest in including it in the initiative. The ESRPP Products Task Force takes these rankings into account as they conduct additional research on the proposed products and ultimately determine which products to include.
Initiative staff and implementers reported that retailers’ rankings primarily reflect the volume of units of each product each retailer sells. One implementation staff member suggested that, in order to maximize the total amount of incentives they could earn, retailers consider the amount of the incentive they anticipate program sponsors might offer in their product rankings in addition to the volume of products they sell. NEEA staff were skeptical that retailers could accurately predict the per-unit incentives program sponsors would offer at the time they were asked to provide their product rankings.
In all of the product categories NEEA included in RPP during the market test, a single retailer was responsible for more than 40% of the qualified products sold. In the most extreme case, a single retailer sold 90% of the qualified products in one category. Individual retailers were somewhat less dominant in product categories for which there were a larger number of participating retailers. NEEA staff noted that retailer market shares for a particular product could vary considerably from year-to-year, and the dominant retailer could change from one year to the next.
ESRPP program sponsors reported prioritizing product factors that contribute to energy savings potential in product selection: the per-unit energy savings, the total volume of sales, and the existing market share of qualified products. Documents describing the ESRPP product selection process also cite a product’s widespread applicability in a residential setting and retail sales as a desirable feature.
Program sponsors differed from retailers in that they reported prioritizing the market share of efficient products as a key consideration in product selection. Consistent with other program sponsors’ reports, NEEA staff emphasized that the existing market share of qualified products was particularly important; even with high sales volume and large per-unit energy savings, there may be little additional energy savings potential if the market share of qualified products is already high. NEEA and other program sponsors identified a market share between 15% and 35% as a target for products qualifying for basic tier RPP incentives and between 5% and 15% as a target for products qualifying for advanced tier incentives.

Retail Products Portfolio Market Test Assessment
Findings | Page 20
Building consensus among NEEA’s funding utilities on the products to include in 2017 was challenging for NEEA staff, but these stakeholders anticipate that the processes NEEA has put in place will allow for smoother decision-making in the future. Funding utilities collaborate with NEEA staff to ensure that RPP is in alignment with their energy efficiency goals through participation in the RPP Utility Work Group (the Work Group). Work Group members expressed dissatisfaction with NEEA’s communication around the process of selecting products to include in the RPP portfolio in 2017.
Work Group members had concerns about the specific products NEEA proposed to include in the RPP portfolio in 2017, particularly products proposed for the RPP portfolio for which some utilities provide downstream customer incentives. These Work Group members expressed concern that offering incentives for these products through both RPP and their downstream programs would complicate evaluation, making it more difficult to attribute savings to their downstream efforts. According to one Work Group member, offering RPP incentives for a product that a downstream program covers “complicates things. It’s hard to track. It confuses our evaluation and our confidence in that product.”
Work Group members also reported that removing these products from their downstream programs would diminish their ability to directly interact with their customers, who might not recognize that their utility was supporting the targeted technology. One Work Group member described direct interaction with customers as “equally important to savings.”
Among the interviewed Work Group members, those representing larger, more urban-based utilities tended to articulate greater concerns with the initiative’s portfolio. This is due in part to their size and ability to dedicate staff to retail products programs and offer customer incentives on a wider range of products, thereby increasing the likelihood of having an overlapping product with RPP.
Work Group members reported that NEEA staff were able to explain their reasoning for including the proposed products in the 2017 portfolio in a way that adequately addressed the Work Group members’ concerns. However, Work Group members expressed dissatisfaction that many of these explanations seemed to come after NEEA had already made the decision, rather than in consultation with the Work Group during the decision-making process. Articulating this view, one Work Group member said “They brought in products that are part of existing utility programs. They did that prior to satisfactorily explaining how RPP interacts with regional utility programs. We’ve done a lot of work now to explore that, but the way it was proposed to us, it was the cart before the horse in terms of bringing their funders along.”
Two of the ten interviewed workgroup members also expressed dissatisfaction with the way in which NEEA had communicated with them during the product selection process. These workgroup members reported they did not feel NEEA was receptive to their concerns. Both reported that NEEA’s efforts to communicate one-on-one felt like a “divide and conquer approach,” designed to pressure them into acquiescing to NEEA’s choices, rather than recognizing and addressing their concerns.
NEEA staff held a number of meetings and discussions to address Work Group members’ concerns, and ultimately collaborated with Work Group members to create a guidance document that outlined a protocol for subsequent RPP decision-making, entitled “RPP Product Portfolio Management Process.” This document lists criteria to consider in selecting products for RPP and setting program efficiency tiers and associated incentives for qualified products. It also outlines, step-by-step, the process NEEA will complete each year to select products for inclusion in the subsequent year’s RPP portfolio, and specifies points in the process at which the Work Group will provide input. The interviewed Work Group

Retail Products Portfolio Market Test Assessment
Findings | Page 21
members reported satisfaction that this document presented a shared understanding of the RPP decision-making process, and anticipate that it will resolve communication challenges around product selection.
3.4. Objective 4: Build Consensus and Buy-in on Evaluation Activities and Approach
As an organization focused on market transformation, NEEA has developed approaches for forecasting baseline market shares of efficient products and estimating energy savings for midstream market transformation initiatives like RPP. However, most of the other ESRPP program sponsors have little experience evaluating market transformation programs, particularly ones that seek to directly influence the behaviors of midstream market actors rather than end-users. To continue offering the ESRPP program in the long term, and thus for RPP to maintain its scale, these program sponsors need to build consensus around, and gain buy-in from their regulators on, an approach to evaluate RPP’s impacts.
Table 8 lists the three research questions NEEA defined around evaluation activities and approaches and briefly summarizes findings related to each.
Table 8: Evaluation Research Questions
Research Question Finding
Is NEEA able to start accumulating savings? Yes
Is there clear indication of growing acceptance of a market transformation evaluation approach among program sponsors and regulatory bodies?
In Progress
Are success metrics proposed and validated? Yes
The rest of this section provides additional detail on findings related to evaluation activities and approaches that program sponsors outside the NW might use to evaluate RPP.
Due to its early experience implementing an RPP pilot and market transformation-focused evaluation approach, NEEA is further along in the process of evaluating the effects of RPP than other program sponsors. NEEA’s logic model for RPP lists market progress indicators NEEA plans to track to evaluate the success of the initiative. NEEA has also documented a set of guidelines for developing baseline curves for products in the RPP portfolio. NEEA’s approach incorporates historical sales data, industry forecasts, data on federal efficiency standards and ENERGY STAR specifications, and market characterization findings to estimate the key inputs to a baseline adoption curve based on diffusion of innovation theory. NEEA refines these baseline curves as an initiative progresses and additional data become available. As Figure 4 demonstrates, by comparing the actual change in the market share of efficient products over time to these baseline adoption curves, NEEA can estimate both the total energy savings resulting from adoption of efficient products and the incremental portion created by RPP. Using these baselines, NEEA has begun accumulating savings for RPP. NEEA reported 2014 and 2015 savings in its 2015 Annual Report and 2016 savings in its 2016 annual report.

Retail Products Portfolio Market Test Assessment
Findings | Page 22
Figure 4: Example Baseline Market Share Curve
Source: Guidelines for Developing NEEA Baselines for the Retail Products Portfolio (RPP) document, provided by NEEA
Most other program sponsors participating in ESRPP did not yet have concrete evaluation plans in place at the time of their interviews. In interviews during August and September of 2016, some ESRPP program sponsors discussed establishing baselines using geographic comparisons or historical sales data to estimate the increase in sales of qualified products, although none had settled on a specific approach.
Only one of the interviewed ESRPP program sponsors had experience evaluating market transformation programs, and three program sponsors expressed concern about their ability to estimate energy savings associated with RPP incentives in a way their regulators would accept. Most of the interviewed program sponsors indicated they had time to establish evaluation methods for ESRPP; they were not under pressure to prove savings in 2016. Nonetheless, program sponsors indicated that gaining acceptance for an evaluation approach would be important, with one saying, “This year [2016] is described as evaluating the way we evaluate – we will have to land on an evaluation method as we continue on in 2017.”
It is difficult to measure the influence of midstream incentives like those RPP offers on sales of products to end-users. RPP’s participation agreements and data portal are designed to allow for an analysis of program influence using a forecasted baseline based on sales prior to a product entering the Initiative’s portfolio. Participating retailers are required to submit 12 months of historical sales data for each product to facilitate this analysis.
Estimating baselines from historical data is more practical for RPP than common alternatives. For example, an approach based on comparing sales by participating retailers to sales from a cohort of non-participating retailers would pose significant challenges both in identifying a comparable group of non-participating retailers and in obtaining the necessary sales data. A comparison of sales in a demographically-similar region without ESRPP activity would be easier to implement, but would not capture RPP’s effects on retailer decisions made at the national level, thus potentially missing a large portion of the initiative’s influence.
Mar
ket
Shar
e
Time
Market Share Baseline Market Adoption
Co
-Cre
ated

Retail Products Portfolio Market Test Assessment
Findings | Page 23
Nonetheless, there are important drawbacks to estimating baselines from historical data, primarily related to historical data’s inability to capture changes in the market independent of the initiative. These types of comparisons also require a level of consistency between pre-program period and the program period in the retailers submitting data and the products and efficiency levels eligible for incentives that can be difficult to achieve given day-to-day market changes and the constraints of managing a program. For example, a change in the ENERGY STAR specification during the pre-program period could require a relatively complex model matching process to determine which models qualified under the previous specification would have met the specification in place when the Initiative took effect.
Given these challenges with using historical sales data to estimate a baseline, NEEA staff consider historical sales data as one among many factors used in setting a baseline. As noted above, NEEA’s baseline approach incorporates multiple data sources, including ways product characteristics might influence adoption and market characterization findings related to anticipated market trends, in addition to historical sales data, to estimate baselines. NEEA staff also noted that the assortment changes RPP seeks to influence may occur over a relatively long timeframe. Thus, baseline forecasts should extend over multiple years.
Academic literature on manufacturers’ trade promotions to retailers does not identify evaluation approaches that overcome the challenges listed above. The incentives RPP offers to retailers are similar to incentives manufacturers offer to promote their own products through trade promotions. While manufacturers often track the outcomes of their trade promotions differently from RPP program sponsors, for example by tracking shipments to retailers rather than sales to end users, academic literature on trade promotions suggests that manufacturers share many of the challenges of RPP program sponsors in measuring the effectiveness of these promotions. Literature on evaluation of trade promotions is limited, and many of the available studies evaluate the effects of trade promotions in terms of profits for the manufacturer or retailer, rather than sales of a particular group of products. For retailers and manufacturers, maximizing profits are the main objective.12 As a result, economic incentives, such as trade promotions, are evaluated in terms of their effect on the three main actors in the supply chain:
The manufacturer that offers the incentive
The retailer that develops the optimal pricing and ordering policy for each manufacturer incentive
Final customer who is the ultimate purchaser of the merchandise13
Manufacturers think about the effectiveness of their trade promotions in terms of return on investment. Manufacturers typically offer trade promotions over a temporary period. Therefore, manufacturers can track the incremental volume of shipments to retailers before, during and after the event to calculate the return on their investment.14 While not all manufacturers track consumer sales, trade promotions
12 Demirag, et. Al. 2009. The Effects of Customer Rebates and Retailer Incentives on Manufacturer Profits and Sales. Wiley InterScience.
13 Arcelus, F.J., and Srinivasan, G. 2003. Scanbacks and Direct Rebates: Manufacturer’s Tools Against Forward Buying. International
Transactions in Operational Research. 10. Pp 619 – 635.
14 http://spendmatters.com/2011/10/27/all-promotions-are-not-created-equal-measuring-the-effectiveness-of-trade-promotion-spend/

Retail Products Portfolio Market Test Assessment
Findings | Page 24
are often designed to be consumer-facing, with the intention of generating a greater volume of consumers sales. While it could be valuable for manufacturers to track the increase in sales resulting from trade promotions, academic literature provides little insight on how they might go about doing so. Because manufacturers typically do not have access to data on sales to end-users, they must rely on third parties to supply sales data for a given period. This can be difficult when internal shipment data is not aligned with promotional and sales data and when there are overlapping promotions.15
The majority of academic literature of the evaluation of trade promotions focuses on using theoretical models to analyze the effects of trade promotions on specific market actors under specific conditions. Techniques for determining effectiveness of trade promotions strategies include using game theory and creating mathematical models to assess the impact of different trade promotions and strategies on manufacturer and retailer profits.16 These models consider variables including market potential, price sensitivity of customers, pass through rates, and stocking capacity. Much of this research focuses on the theoretical effectiveness on trade promotions, rather than the practical approaches to measuring market lift.
The data available through the RPP data portal should support forecasting a baseline from historical sales data in future program years, but a variety of factors related to the launch of ESRPP limited our ability to conduct this analysis for 2016 products. Most ESRPP program sponsors outside the NW are not far enough along in their evaluation of RPP to have developed a consensus on effective evaluation activities or approaches. However, as noted above, the RPP data portal is designed to support a baseline forecast based on historical sales data. To assess the feasibility of this approach, we sought to estimate baseline market shares for the products included in NEEA’s 2016 RPP portfolio based solely on the data provided through the RPP data portal.
As noted above, a baseline estimate based on historical data alone may not accurately account for trends or changes in the market that the historical data do not reflect. NEEA’s baseline approach uses historical sales data as one input among many to address these challenges. Many of the ESRPP program sponsors lack experience evaluating market transformation initiatives, and while it is important that they also consider external factors, historical sales data are likely to form a basis for many of their baseline forecasts. Our analysis sought to determine whether an approach that builds on a forecast from historical data could eventually become a consensus approach among ESRPP program sponsors.
The pre-program sales data limited both the retailers we were able to include in market share forecasts and the products for which we were able to generate forecasts. Ultimately, sufficient data were available through the data portal to forecast market shares of efficient products using historical sales data only for freezers, dryers, and air cleaners, and within those categories only for sales at two participating retailers.17 A variety of factors, summarized in Table 9, prevented us from including the remaining products and retailers in the analysis, but most of these should not impact market share forecasts in the future.
15 http://www.targetmarketingmag.com/article/4-steps-measuring-roi-specific-promotional-campaigns/all/
16 Kumar, et. Al. 2011. Effectiveness of Trade Promotions: Analyzing the determinants of Retail Pass-Through. Marketing Science. Vol 20,
Issue 4.
17 As noted above, we sought to assess the feasibility of conducting these analyses using the data available through the RPP data portal only.
NEEA was able to estimate baselines for a wider range of products drawing on additional analysis from their consultant, Energy Solutions.

Retail Products Portfolio Market Test Assessment
Findings | Page 25
Table 9: Products Included in Analysis of Historical Sales Data
Product Included in Analysis Limitations (as of April 2017)
Air Cleaners Yes Historical data not available for retailers responsible for a large portion of qualified sales during initiative period
Clothes Dryers Yes One retailer removed from analysis due to incomplete data
Freezers Yes
Air Conditioners No Historical qualification criteria inconsistent with initiative criteria due to ENERGY STAR specification change
Soundbars No No historical data available in data portal
Televisions No
Differences in participation agreements between retailers participating only in the Northwest and those participating in ESRPP and the data displayed in the RPP data portal limited the number of retailers we could include in baseline estimates. The ESRPP retailer participation agreement requires retailers to submit 12 months of historical sales data for each product the initiative includes. NEEA did not add any new products in 2016 for retailers participating only in the Northwest, who had already been submitting sales data through their participation in the RPP pilot. As a result, this requirement did not apply to the NEEA-only retailers. However, the RPP data portal displays only the historical data that ESRPP retailers submitted in compliance with their participation agreements.18 As a result, we could not include the NEEA-only retailers in our analysis.
An analysis of the pre-program data available in the data portal also suggests that the historical data one ESRPP retailer submitted were incomplete. For both freezers and dryers, the number of models (both qualified and non-qualified) included in this retailer’s sales data increases notably in March 2016, the month their participation agreement took effect, while the number of models in other retailers’ data submissions were much more stable over time (Figure 5). As a result, we removed this retailer’s data from the analysis. Interviewed NEEA staff members described early challenges this retailer faced in transmitting data to the data administrator, and this incomplete historical sales data may reflect these challenges. Nonetheless, it is important that the data portal continue to provide sufficient granularity in the data that evaluators can remove individual retailers from the analysis, as other issues with individual data submissions are likely to arise in the future.
18 Displaying only pre-program data retailers submitted as part of their participation agreements allows for greater consistency in
comparisons of sales over time, as NEEA used a different data administrator in 2015 and the two administrators likely differ somewhat in their data handling and model matching procedures, likely resulting in minor differences in the data they report. If one were to include NEEA’s pilot data in this type of analysis, it would be necessary to identify and resolve differences in the datasets.

Retail Products Portfolio Market Test Assessment
Findings | Page 26
Figure 5: Distinct Models Matched by Retailer and Month
We were unable to include soundbars and televisions in our analysis because data on sales of these products prior to January 2016 were not available through the data portal at the time we conducted the analysis. As noted above, NEEA had historical sales data for these products as a result of their inclusion in the RPP pilot, but the purpose of our analysis was to test the feasibility of estimating baselines from historical data included in the portal.
Finally, the ENERGY STAR specification for room air conditioners changed in October 2015. The RPP data portal lists models as qualified based on the ENERGY STAR specification in place at the time they were sold. As a result, an air conditioner sold in July 2015 that the data portal classified as basic tier would have qualified under the ENERGY STAR Version 3.0 specification, while an air conditioner sold in July 2016 and classified as basic tier would have qualified under ENERGY STAR Version 4.0. Given this difference between the definition of a qualified product in the pre-initiative period and during the Initiative, a comparison of the market share of qualified air conditioners during the two-time periods would not be meaningful.
The type of data available in the RPP data portal was sufficient to forecast market shares of efficient products from historical data, although more pre-program data points would provide more precise estimates. Three products, air cleaners, dryers, and freezers, had sufficient pre-program data to forecast market shares from historical data, although, as noted above, we had to exclude one retailer from the analysis for dryers and freezers. For these products, the reports the data portal displayed were sufficient to allow us to use historical data to forecast market shares of efficient products in the absence of RPP incentives and compare those forecasts to actual sales during 2016. These forecasts represent one potential input into a baseline estimate for the products included in RPP.
An initial analysis of air cleaner data found that the market share of qualified products declined slightly from 88% in 2015 to 76% in 2016. We interpret this decline in market share as an indication that the initiative did not have an incremental influence on uptake of efficient air cleaners in 2016. It is important to note that NEEA provided RPP incentives on air cleaners through its RPP pilot in 2015, so data on 2015 market share would reflect the pilot’s influence.

Retail Products Portfolio Market Test Assessment
Findings | Page 27
We conducted three types of analysis to forecast market shares of qualified freezers and dryers for comparison with reported sales data during 2016.19 First, we conducted a t-test to determine whether the differences between the market share of efficient products for 2015 and 2016 were statistically significant. The differences were significant for dryers and basic tier freezers. Second, we used an exponential smoothing approach to generate a sales forecast for 2016 from the 2015 sales data, which included the upper and lower limits of a 90% confidence interval (CI). Finally, we used a regression model to estimate the effects of both time and the availability of RPP incentives on sales.
The findings of the forecast using exponential smoothing were largely consistent with the findings from the regression model. The analysis found a statistically significant market lift of 6% for dryers, while lift in the market share of qualified freezers was not statistically significant. Appendix C presents these analyses in detail. It is important to note that we conducted these analyses at the product category level; we did not examine changes in market share of efficient products among individual product classes within the broader product category as NEEA does in its baseline forecasts. This type of analysis would require using the model-level data the portal provides, which are aggregated across retailers. We were unable to use these data in our analysis given the need to eliminate one retailer from the analysis due to their submission of incomplete historical sales data.
While the analysis found a statistically significant increase in the market share of qualified dryers, the confidence interval around that estimate is relatively wide, ranging from approximately 3% to approximately 8%. This is a result of the relatively small number of data points available to include in the analysis; drawing on a larger number of data points, for example by using weekly rather than monthly data or including two years of pre-program data, would allow for greater precision in estimates.
It is also important to acknowledge the limitations of this type of analysis. First, a single year of data with the initiative in place is likely not sufficient to fully assess changes in the market resulting from RPP. For example, it may take time for retailers to recognize the potential of the initiative’s incentives and fully incorporate them into their assortment decisions. Once retailers do so, it will take further time for sufficient turnover in the assortment to occur that RPP-influenced assortment decisions begin to make a notable impact on sales of qualified products. Other market changes that RPP seeks to bring about, like increased stringency of energy efficiency standards and specifications, also occur over longer timeframes.
A second limitation is that historical sales may not reflect some factors that affect the uptake of energy efficient products. For example, the EPA released the first ENERGY STAR specification for dryers relatively recently, and the cost to manufacturers of adding the components needed to meet that specification is relatively low. The impact of these factors may not be fully captured in historical sales data. Given these limitations, forecasts of the market share of efficient products based on historical sales data are likely to be most accurate for relatively stable, well-established products not undergoing rapid technological changes, and it remains important to consider other factors than historical sales in baseline setting.
19 In its baseline analysis, NEEA considers 2014 as the baseline year for dryers, although it did not begin offering incentives on ENERGY STAR
dryers until 2016.

Retail Products Portfolio Market Test Assessment
Conclusions and Recommendations | Page 28
4. Conclusions and Recommendations
Based on the key findings presented above, we draw two conclusions and associated recommendations.
Conclusion 1: While some challenges arose during the market test, those challenges appear to have been resolved or are in the process of resolution.
The most notable challenges that arose during RPP’s market test were related to the RPP data portal and data management process and NEEA’s funding utilities’ role in the product selection process. NEEA and other ESRPP program sponsors identified a variety of improvements to both the usability of the RPP data portal and the quality of the data displayed (for example, removing duplicate model numbers and addressing outlier values), which the data administrator implemented. NEEA staff reported that the data available through the portal has improved notably following these changes.
The challenges that arose with the data portal reflect the concentration of responsibility that RPP’s structure places on the data administrator. NEEA staff and other ESRPP program sponsors may identify problems and anomalies with the data. However, the ESRPP participation agreements limit access to raw sales data to the data administrator and implementer. As a result, the data administrator is the only actor capable of diagnosing and addressing data issues that program sponsors identify, and, in doing so, the data administrator must respond to the needs of a diverse set of program sponsors. Thus, addressing data issues can be a relatively long and labor-intensive process.
NEEA chose to work with a consultant to generate energy usage estimates for RPP products. To some extent this decision reflected the challenges with the data portal. This consultant matched models to the ENERGY STAR qualified products list and other data sources to identify their efficiency levels and classifications, information the data portal is designed to provide. NEEA staff noted that, while they may be able to rely on the data portal’s model matching to a greater extent in the future as the portal improves, additional consultant support would likely remain necessary to provide analysis at the level of granularity that NEEA needs to estimate energy savings from RPP.
Analysis for this report found that, for most products, assigning models to their efficiency levels was relatively consistent between the data portal and follow on analyses. There were greater discrepancies among products like air cleaners and soundbars that are not subject to federal standards or room air conditioners, which recently went through an ENERGY STAR specification change. NEEA staff reported that there was more variation between the data portal and Energy Solutions’ analysis in assigning products to their classification bins than to their efficiency levels.
In interviews conducted late in 2016, staff members of funding utilities that make up the RPP Work Group expressed concern about aspects of the initiative and frustration with NEEA’s communication of certain initiative decisions in the product selection process. Nonetheless, Work Group members reported that NEEA had addressed their concerns and were optimistic that the process described in the RPP Product Portfolio Management Process document would give them adequate input to the process in the future.
Recommendation 1: Continue to monitor sales data, and work with the data administrator to improve the quality of the sales data displayed in the RPP data portal, including addressing

Retail Products Portfolio Market Test Assessment
Conclusions and Recommendations | Page 29
duplicate model numbers, ensuring that model matching is effective, and identifying and addressing outliers and anomalies.
Recommendation 2: Plan for future consultant support in analyzing sales data to develop energy usage estimates.
Recommendation 3: Given the concentration of responsibility with the data administrator, consider working with other ESRPP program administrators to contract with a third-party that could take the necessary steps to access raw sales data. This contractor could then conduct quality control checks on the data portal and run analyses not possible using aggregated data to support evaluation of RPP’s outcomes.
Recommendation 4: Continue to proactively communicate with RPP Work Group members around product selection and other key initiative decisions. Ensure that this communication:
• Clearly acknowledges and directly addresses Work Group members’ concerns, providing them an opportunity to have input before a decision is made.
• Clarifies the relationship between RPP and downstream incentives, particularly as the initiative shifts away from its early focus on products providing small per-unit energy savings.
• Clarifies the type of sales data NEEA will be able to provide to funding utilities.
Conclusion 2: The ability of ESRPP program sponsors outside the Northwest to estimate the energy savings RPP generates, and justify those estimates to regulators, remains the greatest risk to the initiative’s continued growth.
The need to show influence to justify the energy savings RPP generates was one of the primary concerns ESRPP program sponsors outside the Northwest reported. Few ESRPP program sponsors had concrete plans for evaluating the initiative in 2016, and few had experience evaluating market transformation efforts. While most program sponsors have time to develop an evaluation approach, and many have made progress since their interviews in 2016, it will likely be difficult for some to convince regulators accustomed to downstream, resource acquisition programs of RPP’s value.
Assuming data quality continues to improve, the RPP data portal should provide sufficient data to forecast market shares for efficient products using the historical sales data the ESRPP participation agreement requires retailers to submit. An approach that supplements these forecasts with market data and adjusts them to reflect characteristics of each RPP product is likely the most promising way for program sponsors to quantify the effects of RPP. Nonetheless, ESRPP sponsors outside the Northwest may face further challenges in gaining regulators’ support for a market transformation approach that requires the greatest cost in the early years of implementation and provides much of its benefit over time. It is also important to note that the process of using historical data to estimate a baseline becomes more complex beyond the first year a product is eligible for incentives and as efficiency tiers or specifications continue to change. Further, evaluation must consider the full range of outcomes that RPP brings about, including its influence on product standards and specifications related to energy efficiency.
Additional data on retailers’ assortments could help NEEA and other program sponsors quantify RPP’s effects and justify its benefits. A best practice in evaluating behavior change programs is to measure effects as close to the targeted behavior as possible. Fundamentally, RPP seeks to change retailers’

Retail Products Portfolio Market Test Assessment
Conclusions and Recommendations | Page 30
behavior, and a change in the proportion of qualified models included in the retailer’s assortment is a more direct outcome of the initiative’s incentive payments than the change in sales of qualified products that will likely follow. Clearly demonstrating the initiative’s influence on indicators like changes in assortment and promotion may help convince skeptical regulators to accept estimates of the increase in qualified sales attributable to RPP.
NEEA has developed a process for estimating energy savings attributable to RPP that meets the organization’s needs. However, without a process for connecting observed shifts in the market to RPP incentives that satisfies ESRPP program sponsors’ regulators, the initiative may not be able to maintain the scale it has achieved in terms of extra-regional program sponsor participation and continue to expand. With its long experience implementing and evaluating market transformation programs, NEEA can continue to support other program sponsors in identifying appropriate ways to assess RPP’s progress and effectiveness.
Recommendation 5: Investigate the potential to obtain more detail on retailers’ product assortments from sales data submissions, including visibility into assortment by retailer (including both qualified and non-qualified products). These assortment lists (i.e. lists of unique models included in sales data submissions) do not need to include sales volume. Monitoring changes in the proportion of qualified products in retailers’ assortments provides an indicator of the initiative’s influence on retailer decisions that may appear before sales data begins to reflect changes in market share of qualified products.
Recommendation 6: Continue to advise other ESRPP program sponsors in market transformation evaluation approaches. Some ways NEEA can offer its expertise to other program sponsors include:
• Sharing information about NEEA’s baseline approach through forums like the ESRPP EM&V Task Group, participation in efforts to define standard evaluation approaches for midstream market transformation programs, and presentations at industry conferences.
• Making NEEA staff available to advise or consult with other program administrators, their regulators, or their evaluators on baseline approaches as opportunities to do so arise.

Retail Products Portfolio Market Test Assessment
Detailed RPP Work Group Interview Findings | Page A-1
Appendix A. Detailed RPP Work Group Interview Findings
This section presents detailed findings from interviews with Retail Products Portfolio (RPP) Work Group members.
A.1. About the RPP Work Group
In 2013, Northwest Energy Efficiency Alliance (NEEA) established the RPP Utility Work Group (Work Group) to foster collaboration between funding utilities and NEEA staff in regard to the Retail Product Portfolio (RPP) initiative and to ensure that the initiative is in alignment with member utilities’ energy efficiency goals. A Statement of Purpose document described the purpose of the Work Group as “To leverage regional stakeholder knowledge, input and feedback on the strategic direction for NEEA’s RPP initiative.” The document went on to list the primary roles of the Work Group as to:
Provide input and guidance on Initiative implementation design and strategy, including portfolio product mix
Work towards regional alignment on Initiative strategies, marketing efforts, incentives, and coordination with existing programs
Provide feedback to the Initiative Manager
Assist in identifying and collectively finding solutions to market barriers.20
The Work Group currently has approximately 20 members representing 11 of NEEA’s funding utilities as well as Bonneville Power Administration and Energy Trust of Oregon. Members’ level of engagement with the Work Group vary; about half of the members are actively involved, attending meetings and readily providing feedback to NEEA. The other half are less active in the Work Group, most commonly due to resource constraints at their respective utilities.
A.2. Key Findings
We asked RPP Work Group members to provide their perspectives on a variety of aspects of the RPP initiative, from their desired outcomes, satisfaction, and concerns with RPP to their points of view on NEEA’s portfolio management and communication processes as they relate to RPP. In this section, we provide a summary of findings from these interviews, organized by research objective and issue.
20 NEEA memo addressed to members of the Northwest Regional Retail Collaborative, written by former NEEA staff Leslie Mestman, January
2014.

Retail Products Portfolio Market Test Assessment
Detailed RPP Work Group Interview Findings | Page A-2
A.2.1. Objective – Improve Transparency and Streamline Portfolio Management Process
One of the early challenges NEEA faced with RPP was arriving at a Work Group consensus regarding key initiative decisions such as which products to include in the portfolio, and whether to remain regionally-focused or partner with the national ENERGY STAR® Retail Products Platform (ESRPP) effort, launched in 2016.
Several work group members indicated that, in the latter part of 2016, they had concerns about how these key decisions were made and that they raised concerns directly with NEEA staff. As a follow-up to these concerns, NEEA staff reviewed and discussed the issues with the work group, the Residential Advisory Committee, and the Regional Portfolio Advisory Committee. These discussions resulted in revisions to a guidance document that outlined a protocol for subsequent RPP decision-making, entitled RPP Product Portfolio Management Process. Work Group members all expressed satisfaction with the outcome of this document, which they viewed as a shared understanding of the process.
A.2.2. Stakeholder Perception of NEEA’s Product Selection Process and Criteria
Work Group members expressed a range of perspectives related to NEEA’s product selection process over 2015 and 2016, but the general theme was that Work Group members are now satisfied with the process, thanks in large part to the RPP Product Portfolio Management Process document. However, several (6 of 10) respondents voiced dissatisfaction with NEEA staff’s handling of key decisions early in the pilot phase of the initiative.21 The tone of these responses ranged from mild concern and apprehension to deep frustration. The two decisions that generated the most consternation were 1) the decision to partner with the national ESRPP effort, and 2) the decision to include products in the portfolio for which some utilities provide downstream customer incentives. Those respondents who expressed concerns over partnering with the national effort most often cited concerns about a loss of local control as a result of working under the ESRPP umbrella. Those concerned about product selection expressed concern about the potential for double counting savings and complicating their evaluations on products that overlap between utilities and RPP.
Generally speaking, the larger, more urban-based utilities tended to articulate greater concerns with the initiative’s portfolio. This is due in part to their size and ability to dedicate staff to products programs, and their ability to offer customer incentives on a wider range of products, thereby increasing the likelihood of having an overlapping product with RPP.
A.2.3. Utility Expectations of Product Selection Process
As mentioned above, Work Group members are now in agreement with the protocols defined in the RPP Product Portfolio Management Process document. Going forward, they expect that NEEA staff will communicate any plans to diverge from the agreed-upon criteria to the Work Group early in the process, and get buy-in from the group before making any decisions. This includes getting their buy-in and consensus on the products that will be included in the portfolio.
21 We did not ask Work Group members to specify the dates they were referring to when they referenced the pilot phase. NEEA’s RPP pilot
took place in 2014, but stakeholders may continue to refer to the initiative as “in a pilot phase.”

Retail Products Portfolio Market Test Assessment
Detailed RPP Work Group Interview Findings | Page A-3
A.2.4. Effectiveness of NEEA’s Communication to the RPP Work Group
Interview respondents consistently expressed a desire for NEEA staff to communicate more proactively with the Work Group, especially around key decision points that affect the initiative. All of the respondents conveyed recognition of NEEA staff’s hard work, and many were complimentary of how clear their explanations were around decisions that they considered controversial. But these compliments came with the caveat that until recently, the explanations – as helpful and clear as they were – came after NEEA had already made the decisions. One respondent, in reference to NEEA’s decision to partner with ESRPP, said “NEEA made a fantastic case of why we needed to expand, if only they could have done that from the very beginning.”
When asked for specific suggestions for how communication could be improved, four of the ten respondents had no suggestions, with one saying, “No, they do a good job,” and another saying, “They are always asking for our input. If someone has feedback, they’re listening.”
The other respondents offered varied suggestions for how communication could be improved, including the following:
There is too much time between meetings, and not enough communication going on during that time. Provide more interim communication, for example, “Here’s what we agreed to, here’s what’s next…”
Work from a core set of documents; it can be difficult to go back and find notes from prior meetings.
Provide a large regional perspective and context to the Work Group. For example, that standard utility programs for appliances are going away.
Have an open mind when there’s disagreement; handle it in a constructive fashion. It’s to be expected that when you have a working group, you’re not always going to have a unanimous perspective.
Be transparent with us.
A.3. Objective – Achieve Clarity Around Stakeholder Expectations from RPP
A key objective of these interviews was to understand Work Group members’ expectations and desires for RPP. We asked them several questions along these lines – to describe their vision of a successful RPP; what benefits they expect to receive from RPP; how RPP fits into other retail products programs they support; what types of data they expect to receive from RPP; and how that data might provide value to their organization.
A.3.1.1. Desired Outcomes
To gauge respondents’ hopes for RPP, we asked them: In an ideal world, what does a successful RPP look like to you? While responses varied, they all aligned with the initiative’s stated outcomes in its logic model. Different Work Group members cited different components of the program theory, but an

Retail Products Portfolio Market Test Assessment
Detailed RPP Work Group Interview Findings | Page A-4
overarching theme for the “ideal world” initiative emerged: midstream action to drive market transformation, thus achieving cost-effective savings on measures with too little savings to run downstream utility programs.
Specific responses included:
It would save a lot of money, and really would transform the market, [if] we PROVE that has happened, it will be successful.
To be a great mechanism to incent measures that don’t have enough savings to run a program on a utility basis.
When NEEA can work upstream and work through issues that are hard for one-off utilities to do, we see that benefit.
Success for me would be NEEA leveraging all the upstream [opportunities to influence the market] but staying out of the downstream.22
Success for me is RPP bringing in huge savings for funding utilities and everyone in the region. That’s glossing over the metrics – I report on programmatic savings, but a successful RPP is lots of savings and retailers are happy. My real concerns are that we’re working with the same retailers; in some cases – they’re going to like RPP better than me!
While there was a lot of consistency between the program theory and Work Group desires, some of the respondent “ideal world” scenarios reflect remaining uncertainty over the relationship between RPP and downstream programs targeting the same products. NEEA staff should also be aware of Work Group concerns that retailers will prefer the RPP model over their programs, and prepare the Work Group for the potential that, indeed, retailers may decide that RPP is the only model they will support in the future.
A.3.1.2. Data Needs of Stakeholders
We asked about the data Work Group members expect to get from NEEA via RPP, and what value this additional information might provide to their organizations. Generally speaking, interviewees expressed a limited interest in the additional data they expect to receive through RPP. Of the nine respondents that answered the question, only three could articulate a specific benefit of receiving full category sales data, citing examples such as gaining a better understanding of the market, not having to rely on customer reports of products sold, helping to identify “sweet spots” for incentive amounts on certain products, and informing market baselines. Two additional respondents reported they expect to receive full category sales data for the products in the portfolio, but could not articulate any specific benefits they anticipated those data would provide. The other four indicated that they weren’t sure what types of data to expect.
22 This quotation refers to a respondent’s preference that NEEA leave customer rebates to utilities to manage, but work to improve the
availability of efficient products in all of the supply chain upstream from retail – which may also include market activities typically classified as “midstream.”

Retail Products Portfolio Market Test Assessment
Detailed RPP Work Group Interview Findings | Page A-5
Most respondents said they didn’t know what they would do with the data once they had it. Some said that in theory, having full category sales data would be nice, but they were not sure they would have the staffing needed to make use of it.
NEEA should work to ensure that Work Group members understand exactly what data they will receive. When asked: “What additional information or data you are expecting to get from NEEA via RPP?” four (of 10) interviewees said they expected to “get” or “see” full category sales data. While they did not indicate exactly what “full category” meant to them, the evaluation teams’ impression was that they expected to see detailed data on all sales by category by retailer. NEEA’s contracts with the retailers and the data administrator stipulate that total sales data (that is, qualified + non-qualified sales) for any product category and time period can only be shared if three or more retailers’ sales can be aggregated. Given that only one of the ten interviewees said s/he expected to receive “aggregated sales data, not by retailer,” NEEA may wish to confirm that the Work Group members clearly understand what will be provided to manage expectations.
A.3.1.3. How RPP Fits into Other Regional Retail Products Programs
One of the questions we asked Work Group members was how RPP initiative efforts will fit into their existing retail programs. Half of the ten interviewees saw RPP positively, as complimentary to their existing retail programs. Four mentioned some variation of an expectation that RPP would provide increased availability of qualifying products for their customers to choose from. A fifth Work Group member said RPP pursues products that are too costly for them to support directly, which was also seen as positive.
Three respondents either said the initiative did not fit with their current efforts, or they weren’t sure. Those who did not think it fit with their current retail efforts mentioned their perceived difficulty in marketing RPP-supported products to their customers, and expressed concern that RPP would diminish their ability to directly interact with their customers. These respondents expressed concern that their customers might not recognize that their utility is supporting the targeted technology.
Finally, two respondents expressed trepidation about RPP as it relates to their existing retail products efforts. One said, “It complicates things. It’s hard to track. It confuses our evaluation and our confidence in that product.” The other expressed concern about how working upstream removes a layer of contact with their customers. This Work Group member said, “We are always looking for ways to interact with our customers. It’s equally important to savings.”
A.3.1.4. Stakeholder Concerns Around RPP
Through our interviews with these ten Work Group members, we heard that the RPP Product Portfolio Management Process document – and the process used to produce it – was very successful in quelling many of the initial concerns among Work Group members. Respondents consistently said they understand the program theory, and they heard and understood NEEA staff’s explanations for the decisions to partner with ESRPP and to include products that already exist in some regional utility program portfolios. However, there still seems to be some concern around the following issues:
Proof of market transformation. Some cited TVs as example, and expressed a desire to see that level of success again, yet had doubts about finding the right products to make it possible.

Retail Products Portfolio Market Test Assessment
Detailed RPP Work Group Interview Findings | Page A-6
Loss of local control – e.g. Local utilities not having a say in some decisions, such as retailer agreements.
Loss of direct touch with customers – i.e. Midstream activity is not as clearly tied to local utilities, and utilities rely on direct customer engagement to build relationships and maintain customer satisfaction.
Product assortment – concerns that RPP is only targeting “really, really expensive refrigerators” and not looking to transform the refrigerator market as a whole.
Although NEEA staff have addressed most of these concerns, it will be useful to keep these issues in mind during future Work Group meetings.
A.3.1.5. Stakeholder Satisfaction with RPP
Finally, Work Group members communicated a complicated set of perspectives and feelings around RPP. Nearly all interviewees acknowledged that NEEA staff have worked very hard to meet a competing set of demands in designing and implementing the RPP initiative. Work Group members are now satisfied with the current framework for selecting products, based on the consensus-based development of the RPP Product Portfolio Management Process. Some utility representatives were more satisfied than others related to communication, as discussed above, and there are still several outstanding questions among the Work Group related to how effective the initiative will ultimately be. The primary area of concern centers around the evaluability of RPP and whether its success will be proven satisfactorily. Specifically, Work Group members mentioned the difficulty of evaluating market transformation initiatives, and some said it is an “open question” whether RPP’s concept will be proven.

Retail Products Portfolio Market Test Assessment
Detailed Program Data Characterization | Page B-1
Appendix B. Detailed Program Data Characterization
This section presents a detailed characterization of the sales data available through the RPP data portal. It examines the data to draw insights in three areas important for initiative management and evaluation: the market share of qualified products, sales of qualified products at the retailer level, and retailers’ assortment decisions.
B.1. Market Share of Efficient Products
RPP ultimately seeks to increase the proportion of efficient products that participating retailers sell. As a result, tracking the market penetration of program-qualified products is an important function of the sales data provided by participating retailers.
B.1.1. Data Limitations
Recognizing the importance of tracking market penetration of efficient products, the RPP data platform is designed to provide this capability both in aggregate and at the retailer level for each product. The key limitation in the data system’s ability to track market penetration of efficient products is in the accuracy with which the data administrator can match the models listed in retailer sales data submissions to the ENERGY STAR qualified products lists. As previous evaluations of NEEA’s RPP pilot and TV Initiative have found, model matching can be challenging. Manufacturers may alter model numbers slightly to reflect cosmetic differences between products that do not have implications for energy use. Retailers may also make slight alterations to model numbers for tracking in their own systems.
For most RPP products, the basic tier qualification is ENERGY STAR, but for two products (soundbars and TVs) NEEA has set basic tier qualification levels more stringent than the ENERGY STAR specification. When the basic RPP tier is above ENERGY STAR, the data portal does not differentiate between products that do not qualify for RPP incentives but nonetheless meet the basic ENERGY STAR specification and those that do not qualify for ENERGY STAR. Thus, for these products, the data portal does not allow for estimates of overall ENERGY STAR market share. These estimates are helpful to NEEA as it seeks to influence the ENERGY STAR specification development process and are currently calculated through subsequent analysis done outside of the portal.
B.1.2. Findings
NEEA seeks to set qualification criteria for RPP incentives so that the basic tier achieves a market share between 15% and 35% and the advanced tier achieves a market share between 5% and 15%.23 As Figure 6 shows, most of the products in the RPP portfolio fell within these ranges in 2016. As discussed further
23 NEEA, “RPP Product Portfolio Management Process,” November 4, 2016.

Retail Products Portfolio Market Test Assessment
Detailed Program Data Characterization | Page B-2
below, the high market share of advanced tier air cleaners reflects a very high volume of sales of a single model. NEEA staff reported that, in setting the program specification for televisions, they anticipated achieving a market share of approximately 10%, but some higher volume models that staff anticipated would meet the specification did not.
Figure 6: Market Share of Qualified Products March 2016 – February 2017
Source: NEEA RPP Data Portal
ENERGY STAR Unit Shipment Data Reports, which the U.S. Environmental Protection Agency (EPA) publishes each year, provide a point of comparison to validate and evaluate estimates of market share of ENERGY STAR products from retailer sales data. Given their differences in methodology and coverage, market share estimates from Unit Shipment Data and estimates from RPP sales data are unlikely to match exactly.24 Nonetheless, comparing market share estimates from the Unit Shipment data to RPP sales data can help to identify areas in which RPP retailers differ from the wider market or where additional model matching may be necessary.
Figure 7 illustrates the extent to which RPP sales data calculated ENERGY STAR market share differs from 2015 ENERGY STAR-estimated unit shipment data, by product. The difference in market share estimates for dryers likely reflects the relatively recent release of the ENERGY STAR specification for dryers, which took effect at the beginning of 2015. The higher market share in the RPP sales data, which reflects sales in 2016, is likely a result of manufacturers adapting additional products to meet the specification over time. The year over year variations for the remaining products is less clear.
24 The Unit Shipment Data Reports are based on self-reported shipment data from manufacturers producing ENERGY STAR products. As a
result, they cover a broader geography (the United States as a whole) and portion of the market than RPP sales data, which covers only the Northwest and only retailers participating in RPP. Additionally, while manufacturers’ shipments are likely to closely parallel sales, the two metrics are not equal.
60%
15%
25%
37% 33% 3%
17%0.4%
0%
100%
Air Cleaners Air Conditioners Dryers Soundbars Freezers Televisions
Qu
alif
ied
Pro
du
cts
as a
Pro
po
rtio
n o
f To
tal S
ales
Advanced Tier Basic Tier

Retail Products Portfolio Market Test Assessment
Detailed Program Data Characterization | Page B-3
Figure 7: Difference between ENERGY STAR Market Share from RPP Sales Data and ENERGY STAR Unit Shipment Data
Sales data indicate that high-volume models can have a notable impact on the overall market share of qualified products. For all of the products in NEEA’s RPP portfolio in 2016, the five percent of models that sold in the highest volume accounted for more than 45% of total sales in the category (Figure 8).
Figure 8: 5% of Highest-Volume Models as a Proportion of Total Category Sales
The concentration of sales among the highest-volume models is particularly notable for air cleaners and air conditioners, and further analysis of these products reveals that a few models contributed to a large portion of sales for these products. For example, a single air cleaner model accounted for more than half
15%
29% 30%33%
85%
17%
0%
100%
Dryers Air Cleaners Freezers
Qu
alif
ied
Pro
du
cts
as a
Pro
po
rtio
n o
f To
tal S
ales
ENERGY STAR Unit Shipment Data (2015) RPP Sales Data (Mar. 2016 - Feb. 2017)
75% 73%
59%55% 54%
46%
0%
100%
Air Cleaners(n=113)
Air Conditioners(n=208)
Dryers (n=501) Televisions(n=1295)
Soundbars(n=272)
Freezers (n=108)
Sale
s o
f 5
% o
f H
igh
est-
Vo
lum
e M
od
els
as a
Pro
po
rtio
n o
f To
tal C
ateg
ory

Retail Products Portfolio Market Test Assessment
Detailed Program Data Characterization | Page B-4
of all sales in the category between March 2016 and February 2017, and in some months this model accounted for more than three-fourths of the category sales. In general, air conditioner sales were more evenly distributed, although a single model sold in very high volume in August, accounting for more than 70% of category sales in that month. Figure 9 shows sales of the three air cleaner and air conditioner models that sold in the highest volume relative to all other models.
Figure 9: Sales by Month of Three Highest Volume Air Cleaner and Air Conditioner Models March 2016 – January 2017
The high-volume air cleaner model qualified under RPP’s advanced tier and, as noted above, contributed to a high market share of qualified products in the RPP sales data. The air conditioner model that sold in such high volume in August qualified under a previous version of the ENERGY STAR specification, but did not meet the Version 4 specification, which was the RPP qualification criteria in 2016. While that model is not qualified, if it were the market share of qualified air conditioners would increase from 37% to 64%, illustrating the impact that individual high-volume models can have on the market share of qualified products.
B.2. Retailer-level Sales
The participating retailers are the primary market actors that NEEA seeks to influence with RPP incentives. As a result, it is important for both program management and evaluation to track each retailer’s sales of qualified products as a proportion of their total sales in each of the targeted categories.
B.2.1. Data Limitations
The RPP data portal provides access to the overall penetration of qualified products as a proportion of all sales within a category for each retailer, on a monthly basis. As the portal presents the data, while
0
500
1000
1500
2000
2500
3000
3500
4000
Un
its
Sold
Air Cleaners
Model 1 Model 2 Model 3 All Others
0
2000
4000
6000
8000
10000
12000
Un
its
Sold
Air Conditioners
Model 1 Model 2 Model 3 All Others

Retail Products Portfolio Market Test Assessment
Detailed Program Data Characterization | Page B-5
possible to aggregate a retailer’s penetration figures across multiple months, it is difficult because sales volumes vary from month to month. Therefore, a simple average may not provide an accurate assessment of the overall penetration.
While model-level data on sales of qualified products and the proportion of a retailer’s overall category sales that those products comprise is valuable, greater visibility of model-level data among non-qualified models could further benefit NEEA, if retailers would agree to provide it. As the previous section notes, a small number of high-volume models can have a notable impact on sales in a product category as a whole. These models are likely to have an even greater impact on the category sales of the subset of retailers that assort them, but unless the high-volume models qualify for RPP incentives, the data portal does not indicate which retailers sell them. This type of information could help NEEA understand which types of models are particularly important to address in motivating a given retailer to increase the proportion of qualified products they sell. A potential next step in addressing these concerns would be to obtain full category assortment data by retailer.
B.2.2. Findings
The share of qualified products that each participating retailer sold reflect differences in the types of products on which each retailer focuses. In all the product categories NEEA included in RPP during the market test, a single retailer was responsible for more than 40% of the qualified products sold. In the most extreme case, a single retailer sold 90% of the qualified products in one category. Individual retailers were somewhat less dominant in product categories for which there were a larger number of participating retailers, but, as noted above, the retailer selling the largest number of qualified units sold 43% of the qualified products or more in all categories. The proportion of units sold that qualified for RPP incentives in each product category varied across retailers. In three product categories, the proportion of qualified products sold by the retailer with the greatest penetration was at least twice that of the retailer with the lowest penetration. Nonetheless, no single retailer consistently led in penetration of qualified products across categories.
With a relatively small number of retailers participating in RPP, it is difficult to identify patterns between the total volume of a retailer’s sales in a product category and the proportion of that retailer’s sales that qualify for RPP incentives. Nonetheless, the data suggest a relationship between sales volume and qualified product penetration for some products. For air cleaners and air conditioners, the relationship between category sales volume and qualified product penetration appears to be direct: retailers who sold a larger volume of products also generally had a greater penetration of qualified products. The lowest-volume retailers of soundbars had the greatest penetration of qualified products, but this pattern does not hold for higher-volume retailers. No patterns between category sales volume and penetration of qualified products are apparent for the remaining products.

Retail Products Portfolio Market Test Assessment
Detailed Program Data Characterization | Page B-6
Figure 10: Total Sales and Penetration of Qualified Products by Retailer for Air Cleaners and Air Conditioners
B.3. Assortment
A key outcome of RPP incentives is to motivate retailers to alter their assortments of the targeted products. Sales data provides insight into participating retailers’ product assortments, with a few key limitations.
B.3.1. Data Limitations
The first limitation is common to any effort to use sales data to assess assortment: while the set of unique models sold in a month is a reasonable proxy for the assortment of models retailers carried, it is imperfect. It is possible that during that month a participating retailer did not sell any units of a model they assorted, and that model would therefore not be captured in the sales data. For example, a retailer may assort and display a particularly highly-featured, high-end product to draw customers into the category, anticipating that relatively few would buy that particular model. Likewise, a retailer may sell a model that is not part of their regular, in-store assortment, for example a return of a product originally purchased on the retailer’s website that the retailer resells in the store.
Other challenges in using sales data to assess retailers’ assortments of RPP products stem from the ESRPP data agreements and the limitations they place on the data portal. Full category sales data are not available at the retailer level. As a result, it is possible to assess differences in assortment of qualified products between retailers, but not to determine any differences in overall assortment between retailers or to see how a specific retailer’s assortment might change. Identifying these types of retailer-specific changes could help NEEA better understand differences between retailers and better focus retailer outreach efforts.
Qu
alif
ied
Sal
es a
s a
Pro
po
rtio
n o
f To
tal
Cat
ego
ry S
ales
Air Cleaners
Penetration of Qualified Products Units Sold
Retailer Retailer Retailer Retailer
Tota
l Un
its
Sold
Air Conditioners
Retailer Retailer Retailer

Retail Products Portfolio Market Test Assessment
Detailed Program Data Characterization | Page B-7
Store-specific data could provide a further level of granularity, which is not available through the existing data agreements. A store-level analysis of assortment could help validate RPP’s focus on the participating retailers’ corporate-level merchant teams. RPP is designed to affect these corporate-level teams on the understanding that their decisions determine assortments across stores, leaving little room for store-level variation. While retailer interviews have consistently supported this assumption, a store-level analysis of assortment could provide further validation and quantify the level of variation that exists. Because changes in assortment are expected to be a primary result of RPP’s incentives, an assessment of RPP’s influence based on sales of qualified products using comparison areas without RPP activity would only provide meaningful findings if there is sufficient variation in assortment across stores and regions.25
A shelf survey of a sample of locations for each participating retailer has the potential to overcome many of these data challenges. By assessing assortment directly, a shelf survey would not face the uncertainty inherent in using the list of unique models sold as a proxy for assortment. Shelf survey data would also not face the restrictions on retailer-level and store-level data that the ESRPP data agreement imposes. However, this may be a manageable level of uncertainty given the high cost of the shelf survey. It may also be worthwhile for NEEA and future evaluators to investigate whether it would be possible to obtain retailer- or even store-level assortment data from sales data without major changes to the data agreements. For example, a list of the unique models (both qualified and non-qualified) each retailer reported selling each month could provide valuable insight, even if model-level sales data were not available for the non-qualified products.26
B.3.2. Findings
B.3.2.1. Relationship Between Assortment and Sales
For most products, the proportion of qualified models in the participating retailers’ collective assortments closely parallels the proportion of units sold that qualify for RPP incentives. Two exceptions are advanced tier air cleaners and air conditioners. For both products, the proportion of sales that qualified for incentives is considerably larger than the proportion of unique models, indicating that qualified models sold in higher volume than non-qualified models.
25 While NEEA is not planning to use this approach, other extra-regional ESRPP sponsors may deploy this. Confirming the extent to which
assortment varies would confirm whether or not this is a viable analytical approach.
26 If NEEA were to pursue this, it would be important to put constraints on which models are included in the count. A notable number of
models appear in the sales data only as returns (reflecting negative numbers of units sold), or in very low volumes (for example with than 5 units sold per month). Including these models may obscure trends related to more prominent models.

Retail Products Portfolio Market Test Assessment
Detailed Program Data Characterization | Page B-8
Figure 11: Qualified Products as a Proportion of All Products, March 2016 – February 2017
As discussed in Section B.1.2, much of the difference between assortment and sales of advanced tier air cleaners stems from a single model, which qualified for the advanced tier and sold in very high volumes. The difference between air conditioner models assorted and qualified air conditioner sales reflects a large number of non-qualified air conditioner models that sold in low volume. As Table 10 shows, more than two-thirds of the non-qualified room air conditioner models listed in the sales data sold fewer than 10 units between March 2016 and February 2017, while fewer than 20% of qualified models sold in such low volume.
Table 10: Sales Volume of Room Air Conditioner Models, March 2016 – February 2017
Units Sold
Qualified Models Non-Qualified Models
Count Percent Count Percent
Less than 10 4 18% 130 71%
10 to 99 units 8 36% 27 15%
100 to 999 units 6 27% 25 14%
More than 1000 units 4 18% 0 0%
B.3.2.2. Change in Assortment
Overall, assortments were largely stable for most products between April 2016 and January 2017, with the number of models added and the number of models removed each month ranging from approximately 5% to 15% of the overall number of models sold (Figure 12). Two products, air conditioners and dryers, saw notably larger changes in assortment than the other products.
27%
11%
28%35%
21%
10%
1%
60%
37%
25%
33%
17% 15%
3%
0%
100%
Air Cleaners(Advanced Tier)
AirConditioners
Air Cleaners(Basic Tier)
Dryers Freezers Soundbars(Advanced Tier)
Soundbars(Basic tier)
Pro
po
rtio
n Q
ual
ifie
d
Unique Models Assorted Units Sold

Retail Products Portfolio Market Test Assessment
Detailed Program Data Characterization | Page B-9
Figure 12: Average Proportion of Assortment Added and Removed Monthly Across Retailers, April 2016 – January 2017
For all products, a notable portion of this variation in assortment reflects models that sell in very low volumes. Among models selling at least five units in a month, only between 1% and 6% of the models sold were added or removed each month for most products (Figure 13). The variation in dryer assortment, in particular, appears to reflect a relatively large number of models selling in very low volumes. When we remove models selling fewer than five units in any given month from the analysis, the average change in dryer assortment falls in line with that of freezers and air cleaners.
Figure 13: Average Monthly Models Selling at Least Five Units Added and Removed as a Proportion of Assortment Across Retailers, April 2016 – January 2017
28%
18%
11% 10% 11%
-12%
-7%-5% -6%
-4%
16%
11%
6% 4%7%
-15%
-10%
-5%
0%
5%
10%
15%
20%
25%
30%
Air Conditioners Dryers Soundbars Freezers Air Cleaners
Ave
rage
Pro
po
rtio
n o
f M
on
thly
Ass
ort
men
t
Models Added Models Removed Net Change
15%
6%4% 3% 2%
-9%
-1% -2% -1% -1%
6%5%
2% 2% 2%
-10%
-5%
0%
5%
10%
15%
20%
Air Conditioners Soundbars Dryers Freezers Air Cleaners
Models Added Models Removed Net Change

Retail Products Portfolio Market Test Assessment
Detailed Program Data Characterization | Page B-10
Even with low-selling models removed from the analysis, air conditioners show the greatest variation in assortment among the RPP products. This level of change is consistent with the seasonal nature of the air conditioner market, with large numbers of new models entering assortments in the spring and summer and retailers removing models from assortments more gradually through the fall.
Figure 14: Change in Air Conditioner Assortment Across Retailers, April 2016 – January 2017
Aside from seasonal variation in the air conditioner market, there was relatively minor variation in the extent to which each of the participating retailers changed their assortments of qualified products between April 2016 and January 2017. This consistency in qualified assortment is notable given that variation in assortment may be a component of a retailer’s business strategy. For example, one academic research paper on assortment planning notes that one of the participating retailers “offers relatively few stock keeping units (SKUs) within a category but constantly changes the SKUs offered. [This retailer] pursues this strategy to make opportunistic buys of high-quality items that it sells to customers at low prices.”27
27 Murali Mantrala et al., “Why Is Assortment Planning so Difficult for Retailers? A Framework and Research Agenda,” Journal of Retailing 85,
no. 1 (2009): 71–83.
-20
-10
0
10
20
30
40
50
60
70
Nu
mb
er o
f M
od
els
Added Removed Net Change

Retail Products Portfolio Market Test Assessment
Detailed Baseline Analysis Findings | Page C-1
Appendix C. Detailed Baseline Analysis Findings
One of the primary objectives of the RPP is to transform the market for appliances and electronics by increasing the market share of efficient models. Because of the invisibility of the incentives to consumers and the difficulty of knowing what the market allocation of program qualified sales would have been in absence of program intervention (the counterfactual), there are a several common approaches (or combination of those listed below) used to assess program influence:
Non-Participating Retailer Comparison Group: Relying on sales data, establish the percentage of qualifying product sales are for the same categories in other retailers that are not part of the program, during the same time frame.
Pre-Initiative Baseline: Relying on sales data, establish the percentage of qualifying product sales for the same retailers immediately before program inception to establish a baseline.
Retailer Interviews: To understand how participating and potentially non-participating retailers believe the incentives have impacted the market.
Shelf-stocking Surveys: Across participating and non-participating retailers to establish baseline and program-participating assortments.
There are advantages and shortcomings to each of the approaches listed above. This study used the pre-initiative baseline approach because non-participating retailer data is too difficult to procure and retailer requirements for program participation included stipulations for retailers to provide one-year pre-initiative sales data.28 A review of these are shown in Table 11 below.
Table 11: Baseline Development Approaches
Approach Advantages Disadvantages
Non-participating retailer baselines
Sales data from comparable retailers not in the program
Difficulty in procuring sales data, retailer specific assortment and decision making
Pre-initiative baselines
Sales data from same retailers, relative ease of procuring data (provided
established agreements)
Shifting economic conditions, cannibalization, halo effects, data availability, assignments,
seasonality, and weather-sensitive appliances
Retailer interviews
Feedback directly from partners, closest to market and aware of nuances
Reporting bias, lack of competition behavior, can only provide educated guess as to attribution
Consumer surveys Feedback directly from consumers Reporting bias, what if scenario = large uncertainty
Shelf stocking Determine assortment, both pre-initiative and non-participating retailers
Expensive, assortment may not equal sales, national purchasing assortment (low variance
among same retailers)
28 Previous research conducted for the RPP Pilot included retailer interviews. For ESRPP, these interviews were completed through a
nationally coordinated effort and are included in results described in previous sections.

Retail Products Portfolio Market Test Assessment
Detailed Baseline Analysis Findings | Page C-2
C.1. Product Baselines – Data Limitations
As noted above, relying on sales data as the basis to form the baseline condition involves a certain degree of uncertainty. To reduce this uncertainty, it is important that the data used to estimate the baseline condition be as closely parallel as possible to the initiative data against which it will be compared. After reviewing the sales data, we identified three key factors that limited the comparability between the historical sales data and the data submitted during the market test period:
Differing sources of pre-initiative data
Inconsistent retailer participants/different set of retailers in pre-initiative and the initiative periods
Changing qualification specifications (ENERGY STAR)
The sections that follow provide additional detail on each of these limitations, as well as additional factors with the potential to complicate the process of developing a baseline from historical sales data.
C.1.1. Sources of Historical Data
NEEA offered incentives for televisions, soundbars, and air cleaners through its RPP pilot in 2015, and gathered sales data for those products from the retailers participating in the pilot. These data constitute one potential historical dataset that one could use to forecast a baseline against which to compare 2016 sales which involved a greater involvement of extra-regional program sponsors. However, this would not be a true baseline against which to estimate pre-intervention conditions, as it would reflect initiative influence from the incentives NEEA offered in 2015. In addition to the pilot data already provided to NEEA, the three retailers participating in the national ESRPP program submitted 12 months of historical sales data for all the products included in ESRPP in 2016, as the ESRPP participation agreement requires. These data constitute a second historical dataset that one could use to forecast a baseline for 2016 sales. As Table 12 shows, these two datasets overlap for some products and some retailers.
Table 12: Historical Data Availability by Retailer and Product
ESRPP Retailers
NEEA-only Retailers
Products in 2015 NEEA RPP pilot
• Televisions
• Soundbars
• Air cleaners
NEEA RPP pilot data
ESRPP historical data
NEEA RPP pilot data only
Products added in 2016
• Clothes dryers
• Freezers
• Room air conditioners
ESRPP historical data only N/A: Retailers Not Participating in Category

Retail Products Portfolio Market Test Assessment
Detailed Baseline Analysis Findings | Page C-3
NEEA transitioned to a new RPP data administrator at the beginning of 2016. As a result, the data management and model matching processes used on the RPP pilot data differ from the processes used on the historical sales data that the ESRPP retailers submitted, which the current data administrator processed. At the time of our analysis, NEEA and the data administrator had not reconciled differences between the two datasets and incorporated the RPP pilot data into the data portal. The data portal displayed only historical data that retailers participating in the ESRPP program submitted; thus, no historical data were available for the NEEA-only retailers. Historical data, via the data portal, were also unavailable for soundbars and televisions for all retailers. The cause of this lack of data is not clear, but may be related to these products’ inclusion in NEEA’s RPP pilot.
C.1.2. Retailers Providing Data
As noted above, the data portal did not include historical sales data for the retailers participating only in the Northwest. For some products, this greatly limits the relevance of a comparison between the overall market share of qualified products in the pre-initiative period with the market share during the initiative because the NEEA-only retailers represent a notable portion of the market. Sales data from one of these retailers further complicates the comparison, as this retailer did not reliably provide data and ultimately exited the initiative. Interpreting market share requires understanding the total proportion of the market represented by the participating retailers.
In addition to the lack of pre-initiative sales data listed in the data portal from the NEEA-only retailers, analysis of the historical sales data suggests that one ESRPP retailer’s historical sales data submission was incomplete. For both freezers and dryers, the number of unique models included in this retailer’s historical data is considerably lower than the number included in data submissions during the initiative. In contrast, other retailers’ reported sales of a much more consistent number of unique models before and during the initiative (Figure 15).
Figure 15: Demonstration of Data Summarization Issues: Inconsistencies in Unique Models Included in Retailer Pre-Initiative vs Initiative Period Sales Reporting
Un
iqu
e M
od
els
Sold
Time
Freezers
ESRPP Participation Agreement Signed
Un
iqu
e M
od
els
Sold
Time
Dryers ESRPP Participation Agreement Signed

Retail Products Portfolio Market Test Assessment
Detailed Baseline Analysis Findings | Page C-4
Due to the inconsistency in this retailer’s data, we removed this retailer from our analysis to estimate baseline market shares for qualifying freezers and dryers and from our comparison of those baseline estimates to sales during the initiative. We considered using a similar approach to remove the NEEA-only retailers from our analysis of air cleaner market share, although the large proportion of qualified sales attributable to those retailers calls into question the relevance of a comparison that ignores them. Ultimately, however, there was no increase in market share of qualified products among the remaining retailers between 2015 and 2016.
C.1.3. ENERGY STAR Specification Changes
To be relevant as a comparison against models sold during the initiative, a baseline estimated from historical data must estimate the market share of products meeting the same specification the initiative incentivized. However, the RPP data portal lists models as qualified based on the ENERGY STAR specification in place at the time they were sold. As a result, if the ENERGY STAR specification changes during the year prior to a product’s addition to the RPP portfolio, products classified as basic or advanced tier in the data portal may not meet the same specification as products with the same classification sold during the initiative. For example, the room air conditioner specification changed in October 2015. As a result, an air conditioner sold in July 2015 that the data portal classified as basic tier would have qualified under the ENERGY STAR Version 3.0 specification, while an air conditioner sold in July 2016 and classified as basic tier would have qualified under ENERGY STAR Version 4.0. NEEA is currently working to identify a solution to this challenge.
C.1.4. Additional Challenges
In order to drive the market to greater efficiency levels, RPP defines two qualification tiers for some products: a basic tier and an advanced tier. Ideally, we would estimate baselines independently for each tier, which is what we have done here. However, in some cases retailers’ actions may motivate consumers to select an advanced tier model rather than a basic tier one, or vice versa, rather than simply choosing a qualified model over a non-qualified one. Thus, one tier may cannibalize the market share of the other tier. For example, Figure 16 shows historical air cleaner sales across the pre-initiative and initiative periods. While basic tier sales decline from 2015 to 2016, advanced tier sales increase. Overall, qualified sales (including both tiers) declines slightly between the pre-initiative (2015 sales, at 88%) and initiative (2016, at 80%) periods (as denoted in the red line below). This potential cannibalization complicates any analysis of the initiative’s influence on sales of each tier of qualified products.

Retail Products Portfolio Market Test Assessment
Detailed Baseline Analysis Findings | Page C-5
Figure 16: Demonstration of Data Summarization Issues: Historical Market Share of Qualifying Air Cleaners
A variety of other factors exogenous to the initiative influence market-level sales, including, at a high-level, competitive retailer and manufacturer behaviors, the retail environment, and the general economic conditions at the time. In many cases, these factors affect sales of both efficient and inefficient products. Thus, while they may affect the volume of qualified products sold, they will have a more limited impact on market share of qualified products. Nonetheless, it is possible that certain factors can act more strongly on some segments of the market than others. Some more specific non-program, market-level factors that affect sales include the following:
Seasonality – this is particularly evident for air conditioners (where over 97% of sales occur between April and September).
Weather – again, this is particularly evident for air conditioners, where consumers are considerably less price and product sensitive during extreme heat wave events and tend to purchase whatever is available in the store coincident with a heat-wave.
Promotions – could include retailer or manufacturer-specific marketing activities independent of the program.
Product lifecycle – the degree with which model assortments are turned-over and number of unique models.
Halo effects – represents the bias shown by customers toward certain products because of a favorable experience with other products made by the same manufacturer.
0%
20%
40%
60%
80%
100%
120%
Mar
ket
Shar
e
Basic-Pre Basic-Post Adv-Pre Adv-Post Tot QPSTotal Market ShareAdv-Initiative Period
Basic-Initiative Period

Retail Products Portfolio Market Test Assessment
Detailed Baseline Analysis Findings | Page C-6
Low sales volumes – some products experience lower sales volumes and therefore sales data shows considerably higher variance across monthly market share of qualified products (a small shift in qualified sales could have a large impact on the market share of qualified products).
This RPP research cannot attempt to quantify each of the issues listed above, though some of the findings do show evidence of their presence. The team will focus on reviewing the two measures that met sufficient criteria to be included in the analysis in the following section.
C.2. Findings
As a result of the data limitations described in sections C1.1, C1.2, and C1.3, we limited our market lift analysis to air cleaners, clothes dryers, and freezers (as noted above, the analysis excluded sales from one retailer due to the inconsistent reporting of pre-initiative sales data). Table 13 lists the limitations that applied to each product and whether we were able to include the product in the baseline analysis despite those limitations. The findings from these products are presented below.
Table 13: Products for Included in Baseline Analysis
Product Included in Analysis Limitations
Air Cleaners Yes Historical data not available for retailers responsible for a large portion of qualified sales during initiative period
Clothes Dryers Yes One retailer removed from analysis due to incomplete data
Freezers Yes
Air Conditioners No Historical qualification criteria inconsistent with initiative criteria due to ENERGY STAR specification change
Soundbars No No historical data available in data portal
Televisions No
As noted above, the overall market share of qualified air cleaners (including both basic and advanced tier models) declined slightly between 2015 and 2016. As the purpose of the pre/post comparison is to determine the portion of an increase in sales of qualified products attributable to the Initiative, we did not conduct further analyses to model a baseline for air cleaners.
The dryers data reported only a single product-tier type (basic efficiency level), while freezers showed two tiers (Figure 23). Dryers showed an increase in market share, from 20% in the pre-period to 30% in the post period. Freezers, on the other hand, showed a slight increase in market share for the basic efficiency level (from 22% to 25%), while the advanced freezer sales declined to zero within the entire initiative period.29 The decline in advanced freezer sales is indicative of the initiative market share occasionally being dependent on a select few models: only two specific models were responsible for the advanced tier market share in 2015.
29 A more detailed explanation of the composite versus basic tier analysis for freezers is included in the next section.

Retail Products Portfolio Market Test Assessment
Detailed Baseline Analysis Findings | Page C-7
Figure 17: Sales Weighted Average Qualified Product Market Share Across Evaluated Product Types – Pre-Initiative and Initiative Periods
For freezers, a statistical comparison of means (t-test) was first administered on the overall market share across tiers, and the initiative period market share was shown to be lower than the pre, but the difference between the means was not statistically significant. Secondly, the t-test was run on the basic tier freezers alone. Basic tier freezers showed higher 2016 market share and this difference was significant. Dryers (basic) showed both higher initiative period market share (30% vs 20% pre-initiative) and the difference was statistically significant. The results of the t-tests are shown in Table 14 below.
Table 14: T-test Difference of Sales-Weighted Means Qualified Product Market Share – Pre-initiative and Initiatives Periods
Criteria Freezers (Basic) Dryers (Basic)
Pre-initiative market share 22% 20%
Initiative period market share 25% 30%
P-value 0.036 0.000
Statistically significant @ 90% Yes Yes
A more in-depth review of the baseline analysis is included for each of the RPP product-types below.
C.2.1. Freezers
Overall, efficient freezers showed declining market share during the pre-initiative 2015 period, though the majority of the decline can be explained by the loss of advanced tier sales towards the second half of 2015. This decline in sales could be evidence of cannibalization, since the basic tier models market share
0%
5%
10%
15%
20%
25%
30%
35%
Basic Advanced Basic Advanced
Dryer Freezer
Mar
ket
Shar
e
Pre-Program Average QPP Post-Program Average QPPPre-Initiative Average Market Share Initiative Period Average Market Share

Retail Products Portfolio Market Test Assessment
Detailed Baseline Analysis Findings | Page C-8
showed a slight increase in sales level after advanced models sales fell to zero. It is important to note that capturing time-based trends across the pre-initiative period is important in case the initiative period market share is lower than the pre-period. Figure 18 below shows the pre-initiative and initiative period monthly qualifying percentage sales between the basic and advanced tiers. One additional data point that should be acknowledged is that freezers also showed lower ENERGY STAR sales percentages than the 2015 ENERGY STAR unit shipment reported.
Figure 18: Basic and Advanced Freezer Market Share - Pre-Initiative and Initiative Periods
Freezers met most of the key criteria for establishing robust pre-initiative baseline sales, with the exception of potential cross-product cannibalization and the inconsistent reporting from one ESRPP retailer:
A consistent group of retailers reported sales over the pre-initiative and initiative-timeframe.
The mean initiative period market share was statistically different from the pre-initiative market share (for the basic tier), but the corresponding decline in advanced tier could be evidence of cannibalization.
There were no changes to the product qualification criteria during the pre-post timeframe.
The actual 2016 qualified market share fell outside of the sales-model predicted qualified market share range.
Next, the team created a forecast based on the exponential-smoothing technique which included 90% confidence interval upper and lower limits to the forecast. Figure 19 below compares the forecasted market share to the actual market share for qualifying freezers during the pre- initiative and initiative periods. As can be seen in this graphic, the actual initiative period market share falls below the predicted
0%
10%
20%
30%
40%
50%
60%
70%
Basic-Pre Advanced-Pre Basic-Post Advanced-PostAdvanced
Initiative Period
Basic
Initiative Period

Retail Products Portfolio Market Test Assessment
Detailed Baseline Analysis Findings | Page C-9
market share and still within the confidence interval. This is preliminary indication that there is no clear evidence for early-stage program influence for the initiative period RPP sales data, though establishing this baseline will help determine whether there is still a longer-term sales shift that may be attributable to the program intervention.
Figure 19: Historical and Forecasted Market Share of Qualifying Freezers
The basic freezer tier market share was input into the regression model both with and without program support.30 The results of the modeled data, shown with the actual market share, are shown in Table 15 below. The model results show that the initiative period change in sales was not statistically significant (p-value of 0.497).
Table 15: Results of the Freezer Baseline Model Analysis
coefficient standard error t stat p-value Lower CI Upper CI
Intercept 0.199 0.012 17.296 0.000 0.179 0.219
Month 0.003 0.001 2.192 0.040 0.001 0.006
Program (0.013) 0.019 (0.691) 0.497 (0.046) 0.020
30 We removed from data from the ESRPP Retailer that did not provide complete data
0%
5%
10%
15%
20%
25%
30%
35%
40%
Pre-QPP Forecast QPP Lower CI Upper CI Post QPPActual Initiative PeriodMarket Share
Pre-Initiative Market Share
ForecastMarket Share

Retail Products Portfolio Market Test Assessment
Detailed Baseline Analysis Findings | Page C-10
C.2.2. Dryers
Dryers was the only product that met almost all the key criteria for establishing robust pre-initiative baseline sales:
A consistent group of retailers reported sales over the pre-initiative and initiative periods (though one ESRPP retailer had to be removed from the analysis due to unreliable pre-initiative sales).
There were no changes to the qualification criteria (ENERGY STAR specification) during the pre/post timeframe.31
No sales cannibalization was evident since one of the tiers showed sales.
The product classification was constant across the pre/post periods.
Figure 20 below shows the historical and forecasted (using exponential smoothing) dryer sales from all participating retailers that had reported reliable pre-initiative and initiative period sales.32 As can be seen in the chart, dryers showed some evidence of market lift, with the actual initiative period sales well outside (and above) the confidence interval of the forecasted non-program market share.
Figure 20: Historical and Forecasted Market Share of Qualifying Dryers
31 The ENERGY STAR dryer specification took effect on January 1, 2015, before pre-initiative data.
32 We removed from data from the ESRPP Retailer that did not provide complete data
0%
5%
10%
15%
20%
25%
30%
35%
40%
Pre-QPP Forecast QPP Lower CI Upper CI Actual Post QPPActual Initiative Period Market Share
Pre-Initiative Market Share
Forecast Market Share

Retail Products Portfolio Market Test Assessment
Detailed Baseline Analysis Findings | Page C-11
The basic dryer tier market share data were input into the regression model both with and without program support. The results of the modeled data, shown with the actual market share data, are shown in Figure 21 below. The delta between the predicted or modeled-program market share and the actual is the market lift potentially attributable to RPP. The predicted baseline sales for the same initiative period, but modeled in absence of any program intervention, showed a sales-weighted average market share of 24%, while the exponentially smoothed forecasted qualified market share showed sales-weighted market share of 26% (the higher market share reflecting the higher market share towards the end of the pre-initiative period). The modeled and actual initiative period market share with program intervention showed a sales-weighted market share of 30%.
Table 16: Results of the Dryer Baseline Model Analysis
coefficient standard error t stat p-value Lower CI Upper CI
Intercept 0.171 0.014 11.871 0.000 0.146 0.196
Month 0.004 0.002 2.216 0.038 0.001 0.007
Program 0.056 0.023 2.474 0.022 0.017 0.095
Figure 21: Modeled No-Program and Program Dryer Market Share vs Actual Market Share of Qualifying Products
The absolute program-attributable lift for dryers is the actual market share of qualified dryers (30%) minus the predicted (24%), or 6%. To convert the absolute lift to relative lift, we divide the absolute lift (6%) by the actual market share (30%), and derive a relative value of 19%. In other words, 19% of all the
0%
5%
10%
15%
20%
25%
30%
35%
40%
Modeled Program Modeled No Program Actual

Retail Products Portfolio Market Test Assessment
Detailed Baseline Analysis Findings | Page C-12
qualified dryer sales from the retailers included in the analysis may be associated with RPP program intervention.
These findings are encouraging, though should be viewed as more directional in nature. As can be seen in Table 17 below, the relative RPP lift shows a wide confidence interval, which is to be expected given the degree of uncertainty due to the presence of only 12 pre-initiative monthly data points and 11 initiative period points. These findings have demonstrated the potential proof of concept of establishing pre-initiative baseline sales. Consistent with the objectives of the market test assessment, this work sought to demonstrate one for program analysis, though caution should be made about solely relying on the initiative period sales lift estimates for these products, not only due to the notable issues discussed in this report, but also recognizing that there are other important market progress indicators (e.g., relationships with retailers) that will proceed measured lift in sales of efficient products.
Table 17: Summary Findings and Lift for Dryers
Criteria Dryers (Basic)
Modeled Initiative period market share 24%
Actual Initiative period market share 30%
R-square 0.98
P-value (Program) 0.02
Statistically significant @ 90% Yes
RPP Absolute Lift 6%
RPP Relative Lift 19%
RPP Relative Lift Lower and Upper Confidence Interval 11%-26%

Retail Products Portfolio Market Test Assessment
Detailed Literature Review Findings | Page D-1
Appendix D. Detailed Literature Review Findings
The purpose of this academic literature review was to investigate how and if trade promotion strategies might be used for RPP, gain insights from trade promotions on potential approaches to measuring the effects of approaches similar to RPP, and to investigate factors that go into retailer decision making.
D.1. Trade Promotion Strategies
D.1.1. Use of trade promotions
Trade promotions are ubiquitous in the retail industry, yet they are not well understood and have been consistently under-reported by manufacturers.33 Manufacturer budgets for trade promotions exceed budgets for any other marketing activity in retail? By manufacturers? A 2008 article in Marketing Science journal estimated that in the consumer goods industry, manufacturers spend 13% of sales on trade promotions, compared to 6% and 4% for advertising and media respectively.34
Historically, manufacturers and other market actors have viewed trade promotions as inefficient, yet they continue to use the practice. This is due, at least in part, to the pressures of manufacturer competition. Manufacturers report that they must offer trade promotions because their competition offers them, and if they did not offer trade promotions their competitors would take business away from them.35 Other explanations offered in this analysis included manufacturers desire to: limit encroachment by a store brand, decrease intensity of competition between manufacturers, and price discriminate between large and small retailers.36
Supply chain management focuses on matching supply and demand through production flexibility, lead-time management, and channel coordination. However, according to a 2009 article in Naval Research Logistics, there has been a recent focus on manipulating demand or supply through the use of dynamic pricing or promotions to achieve higher profits. This research found that promotions have been frequently used by many in different industries as a means to increase sales, revenues, and market
33 Mottner, S., et. Al. 2011. Trade Promotions and Suppliers’ Market Power. American Journal of Economics and Business Administration 3
(3): 460-472, 2011
34 Cui, T., et. Al. 2008. A Price Discrimination Model of Trade Promotions. Marketing Science. Vol 27, No. 5, September-October 2008, pp.
779 – 795.
35 Cui, T., et. Al. 2008. A Price Discrimination Model of Trade Promotions. Marketing Science. Vol 27, No. 5, September-October 2008, pp.
779 – 795.
36 Cui, T., et. Al. 2008. A Price Discrimination Model of Trade Promotions. Marketing Science. Vol 27, No. 5, September-October 2008, pp.
779 – 795.

Retail Products Portfolio Market Test Assessment
Detailed Literature Review Findings | Page D-2
share by increasing consumers' awareness of their brand, or to reduce inventories of slow moving items. Trade promotions may encourage dealers to advertise to their customers to generate more sales.37
A 1998 article in the Journal of Marketing examines the importance of retailer and manufacturer relationships in trade promotions. While the authors recognize that these relationships are important, they conclude that this does not diminish the importance of incentives and these relationships are less important than the financial benefits.38
D.1.2. Types of trade promotions
There are many different types of trade promotions and each type has pros and cons to various parties in the supply chain. These strategies have the potential to influence the price, promotion, and assortment of qualified products. Trade promotion strategies generally fall into one of four categories: performance-based, off-invoice, and marketing/market lift (see Table 18). Since RPP incentive are directed to retailers, in Table 1 we summarize the pros and cons of each trade promotion strategy from the retailer perspective. While off-invoice allowances account for the majority of trade promotions in the retail industry,39 this is not a common approach for efficiency programs. RPP’s strategy falls in the performance-based sales incentive category.
Table 18: Trade Promotion Approaches
Strategy Description
Pros and Cons for Retailers
Pros Cons
Performance-based sales incentives
Incentivize each qualified product sold in the program's service area.
• Incentives are predictable and can be incorporated into profit and revenue forecasts.
• Typically, more restrictive than off-invoice incentives.
• May reduce gross revenues, even if profit impact is neutral or positive.*
• Require sharing of sales data.
Off-invoice incentives
Discount or incentivize each qualified product ordered.
• Often preferred by retailers
• Retailer not required to pass full discount through to consumers.
• Retailer may purchase discounted items to sell at full price after promotion.
• Does not require sharing of sales data.
37 Demirag, et. Al. 2009. The Effects of Customer Rebates and Retailer Incentives on Manufacturer Profits and Sales. Wiley InterScience.
38 Murry, J.P., and Heide, J.B. 1998. Managing Promotion Program Participation Within Manufacturer-Retailer Relationships. Journal of
Marketing Vol 62 pp. 58- 68.
39 Blattberg, R.C. and S.A. Neslin (1990), Sales Promotions: Concepts Methods and Strategies, Prentice Hall; Hess, J., M. Armstrong and E.
Gerstner (1995), “To Deal or Not to Deal: Trade Dealing with Opportunistic Retailer,” Working Paper.

Retail Products Portfolio Market Test Assessment
Detailed Literature Review Findings | Page D-3
Strategy Description
Pros and Cons for Retailers
Pros Cons
Market lift incentives/ Marketing Allowances
Incentivize each qualified product sold in the program's service area above a pre-defined baseline level. Or allowances for featuring products in advertisements or displays
• Provides retailer with freedom to determine most effective strategies for increasing sales of qualified products.
• Risk that actions taken to increase sales of qualified products will not receive compensation due to inaccurate baselines or unforeseen market forces.
* Gross revenues are the product of the number of products sold by the sales price; they do not include incentives from energy efficiency programs. Thus, even though they may have a neutral or positive impact on profits, program strategies that reduce the price of qualified products may have a negative impact on a retailer’s revenues if the reduced price does not result in a sufficient increase in sales to make up for the reduced sales price.
One report indicated that there is evidence of substantial differences in trade promotion outcomes (pricing, ordering, and profits) between performance-based and off-invoice incentives. Using market experiments, a Management Science article found that due to demand uncertainty, wholesale and retail price were higher, retailer order quantity, manufacturer and retailer profit, and trade promotion discount were lower when the same amount of trade promotions are allocated to performance based incentives compared off-invoice incentives. Although manufacturers share some cost by offering off-invoice trade promotions when consumer demand is unexpectedly low, this loss is completely borne by the retailer when the trade promotion discount is allocated to performance based incentives.40 This article also offered that market experiments may be a useful approach to examine trade promotion decisions in the supply chain. Especially considering that companies are often reluctant to share data on their trade promotion practices and they don’t have a unified or consistent procedure to report these expenditures.41
ENERGY STAR provides guidance on using midstream incentives to promote certified consumer electronics. The ENERGY STAR guidance document identifies four keys to successful midstream CE programs:
Leverage ENERGY STAR as a common communication platform and basis for technical specifications
Develop a strategic relationship with retailers
Collaborate with other program sponsors to design and implement programs
Focus early on program evaluation, measurement and verification (EM&V)”42
40 Yuan, H., et Al. 2013. Trade Promotion Decisions Under Demand Uncertainty: A Market Experiment Approach. Management Science pp. 1 - 16
41 Yuan, H., et Al. 2013. Trade Promotion Decisions Under Demand Uncertainty: A Market Experiment Approach. Management Science pp. 1 - 16
42 ENERGY STAR. How to Use Midstream Incentives to Promote ENERGY STAR Certified Consumer Electronics.
Retail Products Portfolio Market Test Assessment
Detailed Literature Review Findings | Page D-4
ENERGY STAR also suggests positioning programs as expansions on the ‘traditional’ midstream program model. These expansions include shared and accelerated incentives. Shared incentives indicate at least some of the retailer incentive would pass through to the consumer. This expansion has the potential to positively affect net-to-gross and Total Resource Cost Tests and could help prove attribution. Accelerated incentives provide a higher payment at the beginning of the year. Since consumer electronics is such a fast-changing market, accelerated incentives can help programs avoid paying incentives later in the year when market penetration of efficient products is often very high.43
A 2001 article in the Journal of Retailing discussed the potential benefit of trade promotions to both retailers and manufacturers. According to this research review, manufactures offer trade promotions because they optimize profitability, even when retailer pass through is low (Silva-Risso, Bucklin, and Morrison (1999)).44 Trade promotion also helps alleviate the “double marginalization” problem by increasing total channel profit and manufacturer profit. According to the paper, “Double marginalization occurs when the manufacturer and retailer each set their prices to maximize their own individual profit instead of the total channel profit. The result is that manufacturer and retailer prices are set too high and total sales, total channel profit, and the manufacturer profit are all below optional levels.”
Some researchers suggested that a combination of both trade and consumer promotions provide the most benefit to the supply chain. With a combination of trade and consumer promotion, total channel profit is increased beyond what would be attained without either type, or with one type alone (Gerstner and Hess (1995)). Other researchers suggested that pay for performance trade promotions are more effective at coordinating the channel than others (Ailawadi, Farris, and Shames (1999)). At the time of this article, the market was trending towards pay for performance trade promotions which alleviates forward buying45 and pass-through46 problems for manufacturers.
Neither the manufacturer or the retailer always prefers one form (per unit customer or retailer rebate) of trade promotion over another.47 Demigrag (2009) found that when there is no uncertainty in the demand, or the demand is deterministic, retailer incentives increase the manufacturer’s profits. When the market potential is high, a customer rebate can be more profitable than the retailer incentive.48
Retailer pass through rate and forward buying are common challenges manufacturers face when deciding to provide trade promotions. The fight against forward buying and retailer pass through rates was a common trend in the literature. Retailer pass through rate is the percentage of trade promotion passed through to consumers. Pay for performance incentives helps the manufacturers keep track of the retailers pricing policies at the point of sale, and tie its discount policy to the magnitude of the retailer’s
43 ENERGY STAR. How to Use Midstream Incentives to Promote ENERGY STAR Certified Consumer Electronics.
44 Ailawadi, K. L. 2001. The Retail Power-Performance Conundrum: What Have We Learned? Journal of Retailing 77 pp 299-318
45 Forward buying is the practice of buying more stock than retailers would otherwise at a point in time, because the manufacturer is
offering a temporary discount. Retailers will purchase the item in bulk and keep any excess in storage.
46 Pass through is the proportion of a trade promotion that retailers may opt to pass on to the end customer.
47 G. Aydin and E.L. Porteus, “Manufacturer-to-retailer versus manufacturer-to-consumer rebates in a supply chain,” Retail Supply Chain
Management, N. Agrawal and S. Smith (Editors), Springer, New Jersey, 2009, pp. 237–270.
48 Demirag, et. Al. 2009. The Effects of Customer Rebates and Retailer Incentives on Manufacturer Profits and Sales. Wiley InterScience.

Retail Products Portfolio Market Test Assessment
Detailed Literature Review Findings | Page D-5
pass through to the final customers.49 Forward buying is when retailers purchase in quantities larger than demand to benefit from the manufacturer’s temporary promotions.50
D.1.3. Downstream incentives
For RPP, incentives are truly mid-stream and there is no expectation of pass through to the customers. However, for trade promotions this is not the case and manufacturers want retailers to pass the savings through to the customers. Retailer pass through rate is the percentage of trade promotion passed through to consumers. Articles approaching trade promotions from the manufacturer perspective call low retailer pass through rates ‘retailer opportunism.’51
Retailer opportunism and forward buying are common challenges manufacturers face when deciding to provide trade promotions, but are not necessarily issues for RPP. Forward buying is when retailers purchase in quantities larger than demand to benefit from the manufacturer’s temporary promotions.52
Researchers considered the effect of manufacturer provided rebates in the form of customer mail-in rebates and instant rebates on manufacturer and retailer profits. Their results indicated that mail in rebates always benefit the manufacturer. This is because not all customers end up claiming the rebate, particularly when the rebate is relatively small. Instant rebates do not necessarily benefit the manufacturer, because, in effect, all customers will claim the rebate. In terms of retailer profit, if the rebate does benefit the retailer, the benefit is due to the increase in demand, not necessarily by the increase in the selling price. When the rebate is mail in and not everyone claims the rebate, retailers tend to order more than they would if there was no rebate. A similar study found similar results. When there is a downstream rebate, manufacturer and retailer profits increase. The retailer’s profit increases because of the increase in demand, even though their margins are less than they would be if they did not pass through the incentive.53
49 Arcelus, F.J., and Srinivasan, G. 2003. Scanbacks and Direct Rebates: Manufacturer’s Tools Against Forward Buying. International
Transactions in Operational Research. 10. Pp 619 – 635.
50 Demirag, et. Al. 2009. The Effects of Customer Rebates and Retailer Incentives on Manufacturer Profits and Sales. Wiley InterScience.
51 Kumar, et. Al. 2011. Effectiveness of Trade Promotions: Analyzing the determinants of Retail Pass-Through. Marketing Science. Vol 20,
Issue 4.
52 Demirag, et. Al. 2009. The Effects of Customer Rebates and Retailer Incentives on Manufacturer Profits and Sales. Wiley InterScience.
53 Chen, X., et. Al. 2007. The Impact of Manufacturer Rebates on Supply Chain Profits. Wiley InterScience.

Retail Products Portfolio Market Test Assessment
Detailed Literature Review Findings | Page D-6
D.2. Measuring Effects of Trade Promotions
Literature on evaluation of trade promotions is limited, and of the information that is available, many researchers evaluate the effects of trade promotions in terms of profits for the manufacturer or retailer. For retailers and manufacturers, maximizing profits are the main objective.54 Economic incentives such as trade promotions are evaluated in terms of their effect on the three main actors in the supply chain:
The manufacturer that offers the incentive
The retailer that develops the optimal pricing and ordering policy for each manufacturer incentive
Final customer who is the ultimate purchaser of the merchandise55
Manufacturers think about the effectiveness of their trade promotions in terms of return on investment. Trade promotions for manufactures are generally associated with a temporary period. Therefore, manufacturers track incremental shipment volume before, during and after the event to calculate the return on their investment. Manufacturers can take that incremental volume and multiply it by contribution margins and subtract promotional costs, then divide by promotional costs to calculate return on investment.56 While not all manufacturers do track consumer sales, trade promotions are often designed to be consumer-facing, and the intention is to generate greater volume and consumers sales, and in return more orders from retailers so it is something manufacturers should be tracking. How they might measure the incremental sales volume, other than pre-and-post event, is unclear as they must rely on third parties to supply sales data for a given period. Some aspects that make this difficult is when internal shipment data is not aligned with promotional and sales data and when there are overlapping promotions.57
The majority of academic literature on the evaluation of trade promotions focuses on using theoretical models to analyze the effects of trade promotions on market actors under specific conditions. Such techniques for determining effectiveness of trade promotions strategies include using game theory and creating mathematical models to assess the impact of different trade promotions and strategies on manufacturer and retailer profits.58 These models consider such variables as market potential, price sensitivity of customers, pass through rates, stocking capacity, etc. Much of this research focuses on the theoretical effectiveness on trade promotions, rather than the practical approaches to measuring market lift.
54 Demirag, et. Al. 2009. The Effects of Customer Rebates and Retailer Incentives on Manufacturer Profits and Sales. Wiley InterScience.
55 Arcelus, F.J., and Srinivasan, G. 2003. Scanbacks and Direct Rebates: Manufacturer’s Tools Against Forward Buying. International
Transactions in Operational Research. 10. Pp 619 – 635.
56 http://spendmatters.com/2011/10/27/all-promotions-are-not-created-equal-measuring-the-effectiveness-of-trade-promotion-spend/
57 http://www.targetmarketingmag.com/article/4-steps-measuring-roi-specific-promotional-campaigns/all/
58 Kumar, et. Al. 2011. Effectiveness of Trade Promotions: Analyzing the determinants of Retail Pass-Through. Marketing Science. Vol 20,
Issue 4.

Retail Products Portfolio Market Test Assessment
Detailed Literature Review Findings | Page D-7
Some examples of these techniques include a 2007 article in Wiley InterScience that investigated the effect of manufacturer provided downstream rebates on supply chain profits. The authors used a model that involved a two-stage supply chain with a manufacturer and its exclusive retailer, and their assumptions included a single product which faces uncertain and price-sensitive demand. They considered the effect of manufacturer provided rebates on manufacturer and retailer profits. When there is a downstream rebate, manufacturer and retailer profits increase, but the retailer’s profit increases because of the increase in demand, even though their margins decrease.59 Another article used ‘a simple game-theoretic framework’ to examine the strategic considerations that underlie a retailer’s decision to pass-through a trade deal.60
While the literature review did not reveal a standard method for evaluating the effectiveness of trade promotions, other insights on retailer assortment practices may provide insights and a potential method of analysis. A 2012 Harvard Business Review article described a new approach to help retailers calculate ideal assortment. This approach groups products by their key features and projects sales within each feature set grouping.61 With the right data reports, combining these projections with pricing data could provide an alternative methodology in which the evaluation team identifies the theoretical product assortment that would maximize revenue for each retailer (i.e. “what would have happened absent RPP”).
D.3. Retailer Decision Making Process
RPP incentives and trade promotions are designed to influence retailer’s product assortment practices. Product assortment can be very complicated and is a constant challenge for retailers, but is essential for success. Fisher and Vaidyanathan’s Harvard Business Review article described current product assortment practices as “much more art than science.”62 Retailers attempt to offer a balance of variety, depth, and quantity. However, inventory costs and capacity constraints exist. Because of these constraints, retailers must make decisions about trade-offs between variety, depth and quantity.63 Consumer research findings reveal that the retail management’s assortment planning problem is far more complex and challenging than many previously though, highlighting the continuing need for research that can help retail executives manage and allocate assortments. 64 Academic research and the analytical solutions offered to industry deal almost exclusively with questions about depth. Yet variety,
59 Chen, X., et. Al. 2007. The Impact of Manufacturer Rebates on Supply Chain Profits. Wiley InterScience.
60 Kumar, et. Al. 2011. Effectiveness of Trade Promotions: Analyzing the determinants of Retail Pass-Through. Marketing Science. Vol 20,
Issue 4.
61 Fisher and Vaidyanathan, 2012. https://hbr.org/2012/11/which-products-should-you-stock
62 Fisher and Vaidyanathan, 2012. https://hbr.org/2012/11/which-products-should-you-stock
63 Mantrala, M. K. et. Al. 2009. Why is Assortment Planning So Difficult for Retailers? A Framework and Research Agenda. Journal of Retailing
85.1, pp 71 – 83.
64 Mantrala, M. K. et. Al. 2009. Why is Assortment Planning So Difficult for Retailers? A Framework and Research Agenda. Journal of Retailing
85.1, pp 71 – 83.

Retail Products Portfolio Market Test Assessment
Detailed Literature Review Findings | Page D-8
depth, and quantity decisions are interrelated, making it important for researchers and practitioners to find solutions that integrate all three. 65
An important part of retailer decision making also includes category management. Category management involves the distributor process of managing categories as strategic business units, producing enhanced business results by focusing on delivering consumer value. An article focusing on grocery sales practices provides some insights into category management. Lower prices, more aggressive promotion, more varied assortments and a strong store brand program all improve category performance. The key drivers of category performance differ depending on the role that the category plays in the portfolio of both the consumer and the retailer. If we were to categorize RPP products by these definitions, most of the products covered in RPP would fall into the low frequency low penetration (fill-ins) category or the low frequency high penetration (variety enhancers) category. Products such as soundbars and air cleaners have relatively low penetration and are not bought often, whereas products such as refrigerators and clothes washers are also only purchased every several years, but have a higher household penetration. According to this research, fill-ins benefit more than others from display activity. And variety enhancers benefit from temporary price reductions compared to others.66 These types of products may also benefit from depth/ breadth of assortment and brand share variance compared to high frequency/high penetration (staples) items.
65 Mantrala, M. K. et. Al. 2009. Why is Assortment Planning So Difficult for Retailers? A Framework and Research Agenda. Journal of Retailing
85.1, pp 71 – 83.
66 Dhar, S. K., et. Al. 2001. Effective Category Management Depends on the Role of the Category. Journal of Retailing 77. Pp 165 – 184.
Retail Products Portfolio Market Test Assessment
Data Collection Instruments | Page E-1
Appendix E. Data Collection Instruments
E.1. NEEA, Implementer, EPA, and Extra-Regional Program Sponsor Staff Interview Guide
E.1.1. Introduction
Thank you for taking the time to speak with me today. As I mentioned in my [phone call/email], we’re working with NEEA to document and understand how RPP is working as it expands and links to national efforts. Your perspective is important for us to understand and will inform our assessment of NEEA’s RPP Market Test.
I anticipate we will need about 45 minutes. Is this a good time, or should we schedule time in the next week or so?
Would you mind if I record our conversation? The recording is just to help with my note taking. We won’t report anything in a way that would identify any individual respondent.
E.1.2. Respondent Role [ASK ALL]
[ASK ALL] Q1. What is your role related to RPP or ESRPP?
[ASK ALL] Q2. Who do you work with most closely to manage or deliver RPP? How does their role relate to
yours?
E.1.3. Data Administration [ASK ALL]
I’d like to ask about data administration for RPP/ESRPP.
[ASK ALL] Q3. What types of data do you access as part of your activities with RPP or ESRPP?
1. What are the primary data points or indicators you are monitoring? 2. What types of reports do you receive? 3. Are there key data points you wish you had but don’t currently have? 4. Are you confident in the accuracy of the data you receive? 5. Do you generate sales forecasts and energy savings estimates from the data provided
through ESRPP?
[NEEA:] Q4. How has the level of effort required for you to generate sales forecasts and energy savings
estimates changed?
1. How do you assess the accuracy of those estimates?

Retail Products Portfolio Market Test Assessment
Data Collection Instruments | Page E-2
2. Has the accuracy of those estimates changed?
[NEEA AND ENERGY EFFICIENCY PROGRAM SPONSORS (EEPS):] Q5. How is the existing data platform working for you?
[NEEA AND EEPS:] Q6. Do you have any concerns about the data platform?
E.1.4. Product Selection Criteria [ASK NEEA and EEPS]
Next, I’d like to talk about the decision making process for onboarding/off boarding products to RPP.
[NEEA, EPA, AND EEPS] Q7. Please walk me through the process you use to select new products to include in RPP. Which
product criteria are most important to consider?
1. What characteristics of a product category are important to consider when deciding whether to include in RPP?
2. [If not addressed:] What makes a product a good fit for RPP? What makes it a poor fit? 3. What tools or inputs help with the product selection process? 4. What additional tools or inputs would make decision-making process more efficient?
[NEEA, EPA, AND EEPS] Q8. How is product selection coordinated between different program administrators involved in
ESRPP?
1. How, if at all, were you involved in the 2017 product selection process? 2. What are the primary drivers behind new products? 3. Did [your organization] have sufficient influence in the process?
[NEEA AND EEPS] Q9. How are your stakeholders’ criteria and own program needs taken into account during this
process?
1. How involved are your stakeholders [if needed, like regulators and, in NEEA’s case, funders] in this process?
[NAVITAS AND EPA] Q10. What process do you anticipate using to flag products for removal from RPP?
1. What will be the key criteria that indicate a product is ready to be removed? 2. What role will participating program sponsors play in that process? 3. Will participating sponsors need to agree to remove a product? If so, how many of them
need to agree: is a majority sufficient, do you need consensus, or something else?
[NEEA AND EEPS] Q11. What are the indicators that it may be time to remove a product from the RPP?
1. Is this consistent with your understanding of the indicators that might drive removal from ESRPP?
2. How involved are your stakeholders in this process?

Retail Products Portfolio Market Test Assessment
Data Collection Instruments | Page E-3
[NEEA AND NAVITAS] Q12. What differences, if any, have you noticed in the ways retailers respond to RPP incentives on
different products?
1. [If not addressed:] Are there some types of products for which retailers seem more interested in RPP incentives than others? Which ones? Why do you think that is?
2. How, if at all, do the retailers’ interests play into your decisions about which products to include in the product mix?
[ASK ALL] Q13. How, if at all, does RPP influence the market in a way that a series of individual programs
focused on each of the targeted products would not? That is, does RPP’s offering a portfolio of products make the program more than the sum of its parts?
1. How, if at all, does the composition of the portfolio influence RPP’s ability to deliver these benefits?
2. Is this something you consider when selecting products to include in the RPP product mix?
E.1.5. Current RPP Product Categories [ASK ALL]
[ASK NEEA, NAVITAS, ICF, AND EPA] Q14. In which product categories, if any, have you already seen indications that RPP is having an
influence on retailers’ decision making?
1. What indicators of RPP’s influence have you seen? (probe for specifics) 2. Why do you think those products might be shifting faster than others? 3. Which products do you think will be slowest to shift in response to RPP/ESRPP? Why do you
think the assortment and sales of this/these products will be slower?
E.1.6. Building Scale [ASK ALL]
[EEPS] Q15. What factors motivated you to adopt ESRPP: what do you see as the greatest benefits the
program is likely to offer?
[EEPS] Q16. What concerns, if any, did you have about adopting RPP?
1. What were the biggest concerns of your regulators, intervenors, or other stakeholders? 2. How did you overcome them? 3. What might be barriers for other program administrators to adopt RPP?
[NEEA, EEPS, EPA] Q17. What are the biggest benefits you see in a national effort?
[NEEA, EEPS, EPA] Q18. What are your biggest concerns about participating in a nationally coordinated program?

Retail Products Portfolio Market Test Assessment
Data Collection Instruments | Page E-4
[NAVITAS AND EPA] Q19. What were participating retailers’ biggest concerns about complying with the terms of the
national program SOW template?
[NEEA, NAVITAS, EPA] Q20. Have you had discussions with retailers that are not currently participating in ESRPP/RPP about
joining the program?
1. Are those additional retailers interested in joining ESRPP? Why or why not? 2. [If not addressed:] What are their greatest concerns about joining ESRPP?
E.1.7. Evaluation and Metrics [ASK ALL]
[NEEA] Q21. Our understanding is that NEEA has been able to start accumulating savings associated with
RPP. What areas of uncertainty, if any, remain around RPP’s energy savings?
1. How confident are you in existing baselines? 2. What types of on-going information do you need to confirm baselines for RPP-promoted
products?
[NEEA] Q22. Do you anticipate any changes in the RPP logic this year?
1. What are the most important changes you are considering? 2. When do you think those changes will be complete?
[EEPS] Q23. Has your organization evaluated market transformation programs before?
1. [If so:] What types of evaluation approaches have you found successful in evaluating market transformation programs?
2. Which of those approaches, if any, do you think are best suited to RPP? Why do you say that?
[EEPS] Q24. We recognize that there are different evaluation requirements for each organization that is
participating. Which evaluation methods do you anticipate using?
[EEPS] Q25. What concerns, if any, do you have about evaluating RPP? (Probe to distinguish between internal
concerns and those of regulators/stakeholders)
1. How, if at all, can the program overcome those concerns?
[EEPS] Q26. [If not addressed:] How confident are you that your regulator and other stakeholders will accept
your evaluation findings for RPP?

Retail Products Portfolio Market Test Assessment
Data Collection Instruments | Page E-5
E.1.8. Closing [ASK ALL]
I just have a few more, general questions as we wrap up the interview.
[NEEA AND EEPS] Q27. What would a successful ESRPP/RPP look like to you?
[NEEA AND EEPS] Q28. What benefits do you expect to gain from RPP?
[ASK ALL] Q29. What do you see as your organization’s long-term role in RPP?
[ASK ALL] Q30. Those are all the questions I have. Is there anything we haven’t discussed that you would like to
share about RPP?

Retail Products Portfolio Market Test Assessment
Data Collection Instruments | Page E-6
E.2. RPP Work Group Member Interview Guide
E.2.1. Introduction [FOR INTERVIEWERS]
Thanks again for taking the time to talk with us. As I said in my [phone call/email], we’re conducting research to help NEEA understand Work Group member’s perceptions of the strengths and weaknesses of RPP as it exists today. During today’s interview, I’d like to hear your perspective on several aspects of RPP, including your expectations, experience with the RPP Work Group, how RPP aligns with other retail products programs, and any general observations you may have. Your insights and experiences with these topics will help NEEA identify emerging or persistent issues with RPP from your perspective.
Do you mind if I record the call? The recording is purely to help with my note-taking. We won’t share it with NEEA or anyone else, and we won’t report anything in a way that would identify you.
E.2.2. Stakeholder Background with RPP
1. First, how long have you been involved in the NEEA RPP Work Group?
2. What is your role at [ORGANIZATION]?
3. Can you please describe [ORGANIZATION]’s level of involvement with RPP to date?
E.2.3. Expectations from RPP
4. In an ideal world, what does a successful RPP look like for you?
5. What benefits do you expect to receive from RPP?
6. How does RPP fit into other retail products promotions your organization supports?
7. What types of market data do you currently get from retailers (outside RPP)?
8. What additional information or data you are expecting to get from NEEA via RPP?
9. How might this additional information or data provide value to [ORGANIZATION]?
E.2.4. Level of Engagement with RPP Participation
10. How would you describe the time commitment required to participate in the RPP work group? Would you say it’s too much, too little, or about right?

Retail Products Portfolio Market Test Assessment
Data Collection Instruments | Page E-7
11. Do you plan to integrate RPP products into existing or planned retail-based programs or other activities (training, outreach)?
a. [If yes] How so?
b. [If no] Why not?
12. Does [ORGANIZATION] plan to pursue any in-store marketing efforts for RPP?
a. [If yes] What kinds of efforts are you considering (or planning)?
b. [If no] Why not?
E.2.5. Satisfaction and Concerns with RPP 13. How would you describe the current status of RPP at NEEA?
14. Has [ORGANIZATION] had any concerns about RPP in the past? Please explain.
15. To what extent have those concerns been addressed?
16. Are there any new or emerging concerns about RPP, from your perspective?
17. Is the information you receive from NEEA about the status and progress of RPP sufficient for your needs? Please explain.
18. Do you have any suggestions for how NEEA could improve communication with the RPP work group?
E.2.6. Product Selection
Next, I have a few questions about the process of adding products to the portfolio.
19. Was the information and rationale that NEEA provided for the 2017 product selection sufficient?
20. Did you have any concerns or questions about the 2017 products proposed?
21. To what extent were these addressed during the process?
22. Is there anything you’d like to see changed about the Product Selection Process? Please explain.
23. How do you think the region could best leverage the relationships and retail data platform built through RPP?
Those were all the questions we prepared. Is there anything we haven’t discussed that you think would help us understand your experience with RPP?

Retail Products Portfolio Market Test Assessment
Data Collection Instruments | Page E-8
E.3. Retailers Participating in the Northwest Only Interview Guide
E.3.1. Introduction
Thank you for taking the time to speak with me today. As I mentioned in my [phone call/email], we’re working with the Northwest Energy Efficiency Alliance to document and understand how the Retail Products Portfolio Initiative is working and help them find ways to improve the program. Your perspective is important for us to understand and will inform our assessment.
I anticipate we will need about 30 minutes. Is this a good time, or should we schedule time in the next week or so?
Would you mind if I record our conversation? The recording is just to help with my note taking. We won’t report anything in a way that would identify any individual respondent.
E.3.2. Respondent Role [ASK ALL]
Q1. What is your role at [retailer name]?
Q2. [If merchant] Which product categories do you cover in your role as a [merchandiser/buyer] for [retailer name]?
E.3.3. Administration
Q3. Generally, how is your engagement with NEEA going for your organization?
1. What benefits did you expect to gain from your engagement with NEEA? 2. To what extent are you seeing the benefits you expected? 3. What unexpected challenges have you experienced, if any?
Q4. How much time do you spend on RPP in a typical month?
1. Is that level of effort reasonable?
Q5. Do you interact with Navitas, the contractor supporting NEEA’s retail program?
1. How frequently are you in contact with Navitas? 2. Do you typically reach out to them, or is it more common that they initiate the contact? 3. What are the most common reasons that you reach out to Navitas?
Q6. What concerns, if any, did you have about the commitments associated with NEEA’s retail program?
1. [If had concerns] How did you overcome those concerns?
E.3.4. RPP Incentives
Q7. How has your engagement with NEEA affected ordering decisions you/merchants made in either 2015?

Retail Products Portfolio Market Test Assessment
Data Collection Instruments | Page E-9
Q8. What about 2016?
Q9. What, if anything, has [XORG] done to increase sales of products that qualify for RPP incentives? [Probe to address all applicable product categories and for specific examples, including when these activities occurred]
1. [If not addressed:] How has the availability of incentives influenced your assortment decisions?
2. [If not addressed:] Have you done any special promotional activities focused on products that qualify for incentives?
3. Do you track the results of those efforts, in terms of sales of qualified products? 4. [If so:] What effects have you seen?
Q10. Thinking about the things you consider in your decisions about soundbars relative to what you consider in your decisions about ultra-high-definition (UHD) TVs [as applicable: or air cleaners], how might NEEA’s incentives influence your decisions in one product category differently from your decisions in another?
1. [If so:] What, if anything, about a product makes RPP incentives more or less influential on your assortment and promotion decisions?
Q11. How is the way you engage with NEEA’s program different now that it includes multiple products, rather than just TVs?
1. How, if at all, have the people you communicate with about the program internally changed?
2. Are there any additional products for which you think RPP incentives could have a particularly important impact on increasing the availability of efficient options?
3. If incentives were no longer available for one of the products in the RPP portfolio, what, if anything, would you do differently?
4. Are there some products for which your behavior would change more if they were not incented through RPP than others? Which ones? Why?
Q12. How similar are RPP incentives to the manufacturer trade promotions you typically see?
1. How does RPP differ from other types of trade promotions?
E.3.5. Product Trends
Q13. How, if at all, are sales trends changing for soundbars? What about UHD TVs? [Costco and Target:] What about air cleaners?
[For each product, probe to find out:]
1. Are overall category sales changing? 2. Are there changes in the technologies or features that are selling? (Probe specifically energy
efficient) 3. What is driving those changes? 4. What effect does [feature/technology] have on [product] energy use? 5. Is the energy consumption of [product] changing?

Retail Products Portfolio Market Test Assessment
Data Collection Instruments | Page E-10
6. Overall, how do you expect the energy use of [product] to change in the next few years? Why do you say that?
Q14. [If not addressed] Which product categories have seen the most change?
1. What are the most important factors driving that change?
E.3.6. Regional Differences
Q15. What proportion of the models in your [product] assortment vary from one store to another?
1. Is there a core group of models that you make sure are in all stores? 2. If differences between stores exist, who makes the decision for any given store? 3. How do you determine whether to offer a model in one store but not another? 4. How, if at all, does the region of the country where the store is located factor into that
decision?
Q16. [If not addressed in Q15:] What types of merchandising and assortment decisions does your organization make at a national level, and what types does it make at a regional level?
1. Are there some products that are more regionally-driven than others? 2. Who makes these decisions at the regional level?
E.3.7. Building Scale
Q17. Are you aware of any other, similar programs being offered in other parts of the country?
1. [If yes:] Have any of those programs approached you about participation? 2. [If yes:] Are you participating? Why or why not? 3. [If participating:] How has your experience with [that/those] program(s) compared with
your experience with NEEA? What works better? What is more challenging?
Q18. Are you interested in continuing to engage with NEEA on efforts like this? Why or why not?
E.3.8. Closing
Q19. Those are all the questions I have for you, is there anything else you think I should know as we assess the effectiveness of NEEA’s retail product portfolio?