Embed Size (px)
Citation preview
JANUARY - SEPTEMBER 2017. FERROVIAL, S.A. AND SUBSIDIARIES
GENERAL OVERVIEW In the results for the first nine months of 2017, the same trend as in previous quarters has prevailed: positive performance of infrastruc-ture assets (407ETR, HAH and AGS), with solid growth in traffic vol-umes and greater contribution from dividends (EUR366mn vs. EUR327mn in 9M 2016).
The combined Construction and Services order book is close to EUR30,000mn (including JVs), down -11.2% vs. December 2016, af-fected by the decline in the Amey order book (-17.3%), where tender monitoring and gaining improved margins are being prioritised.
The consolidated results performed well in 9M 2017, with revenues (+19.5%) and EBITDA (+9.5%) both up, helped by the contribution from Broadspectrum, which has been consolidated since June 2016. In comparable terms, revenues grew +8.6% and EBITDA remained in line with 9M 2016.
MAIN CORPORATE TRANSACTIONS IN 9M 2017:
In September 2017, Cintra, along with the other Managed Lanes partners (Meridiam and APG) has acquired the Dallas Fire&Police Pension Scheme’s stake in NTE (10%) and LBJ (7%). Cintra ac-quired 6.3% in NTE and 3.6% in LBJ, and now holds 62.97% in NTE and 54.6% in LBJ. Cintra paid USD107mn for the stake (NTE: USD65mn and LBJ: USD42mn).
In June 2016, Cintra agreed the sale of 51% of the Norte Litoral toll road and 49% of the Algarve toll road, in which it would retain a re-spective 49% and 48% stake. The sale of Norte Litoral was com-pleted on 21 April 2017 (EUR104mn) and Algarve on 26 September 2017 (EUR58mn).
On 31 March 2017, 1 million shares in Budimex were sold (3.9% of its share capital), which had no impact on Ferrovial's profit and loss account, as it retains a controlling share (55.1%). The transaction was completed for a cash impact of +EUR59mn (PLN252mn).
MAIN FINANCIAL EVENTS:
In September, 407ETR issued CAD800mn bonds: CAD500mn 27 year bonds (maturing in 2044) & a 3.65% coupon CAD300mn 5 year bonds (maturing in 2022) & a 2.47% coupon Announced the early payment of a CAD300mn bond, maturing in
November 2017. 1Q 2017 saw the completion of the refinancing of AGS, which has
led to the improvement of their financing structure, the extension of deadlines, partial repayment of shareholder debt and an increase in the amounts distributed among shareholders (GBP112mn distrib-uted in 9M 2017).
In March, Ferrovial issued EUR500mn of 8 year corporate bonds with an annual coupon of 1.375%.
In March, the 407ETR toll road announced a senior bonds issue of CAD250mn, maturing in 2033 (16 years to maturity) with an annual coupon of 3.43%.
MAIN INFRASTRUCTURE ASSETS:
Robust operational growth from equity consolidated assets: EBITDA in local currency: +12.3% at the 407ETR, +5.7% at Heathrow and +15.0% at AGS.
Greater distribution of funds in the main assets: 407ETR distributed dividends of CAD630mn in 9M2017
(EUR195mn were distributed to Ferrovial). A fourth dividend pay-ment for 2017 was confirmed in October, of CAD215mn.
ferrovial
RESULTS
JANUARY - SEPTEMBER 2017
Ferrovial, S.A. & Subsidiaries
26 October 2017
1
JANUARY - SEPTEMBER 2017. FERROVIAL, S.A. AND SUBSIDIARIES
Heathrow paid out GBP281mn, of which EUR79mn corresponded to Ferrovial.
AGS paid out GBP112mn (including GBP75mn in extraordinary div-idends after its refinancing). Ferrovial received EUR64mn in 9M 2017.
FINANCIAL POSITION:
The net cash position, excluding infrastructure projects, stood at EUR268mn at end-9M 2017 (EUR697mn at year-end 2016). Net project debt stood at EUR4,764mn (vs. EUR4,963mn in December 2016). Net consolidated debt reached EUR4,495mn (vs. EUR4,266mn in Decem-ber 2016).
BUSINESS PERFORMANCE
Toll Roads: Significant improvements in traffic volumes on the main toll roads, helped by the economic recovery though offset in part by the cal-endar effects (2016 was a leap year). 407ETR, the group’s main infra-structure asset, maintained its operating strength, with traffic growth of +2.7%, supported by the opening of the 407Ext I, which was toll-free up to 1 February 2017. The Managed Lanes in Texas continued to show con-siderable EBITDA growth (NTE +35.3% & LBJ +40.5%) supported by traffic & tariff growth.
Airports: In the first nine months of 2017, the number of passengers at Heathrow airport reached 59.1 million, +3.1% compared with the same period in 2016, breaking the record monthly figure for the eleventh time in a row. The airport also achieved a daily record, with 259,917 passen-gers flying on 30 June, the busiest day in the history of the airport. Traffic at AGS rose +5.7% (Glasgow +6.7%, Southampton +8.0%, Aberdeen +1.1%).
Construction: Revenue growth (+11.9%), with positive performance in all areas. However, profitability was down vs. 9M 2016 due to the number of major projects in their initial phases and the lower proportion of toll road concession contracts in the portfolio of projects currently underway. In addition, since 2Q 2017, losses have been recorded in two completed contracts, one in Colombia (due to an unfavourable ruling) and one in the United Kingdom. The order book increased +3.0% (in comparable terms) vs. December 2016 to EUR9,045mn (84% international) exclud-ing contract awards for EUR3,100mn, among which we would particu-larly note the I-66 managed lane (Virginia, USA) for approximately EUR1,800mn.
Services: Reported revenues (+25.9%) were positively impacted by the integration of Broadspectrum (contributing EUR1,959mn in revenue in 9M 2017, of which EUR1,732mn were obtained in Australia and New Zea-land and EUR228mn in America) and adversely affected by the weakness of the pound sterling and budgetary cuts in the United Kingdom. In the United Kingdom, Amey (EBITDA margin 2.6% vs. 1.1% in 9M 2016) has maintained its strategy for monitoring competitive tendering processes and focusing on improving contracts with low rates of return or, where relevant, withdrawing from unprofitable contracts. If current market conditions remain unchanged, the company maintains its view that prof-itability will continue to recover over the final quarter of the year and that forecasts will be met by the end of the year (an EBITDA margin of between 3% and 4%).
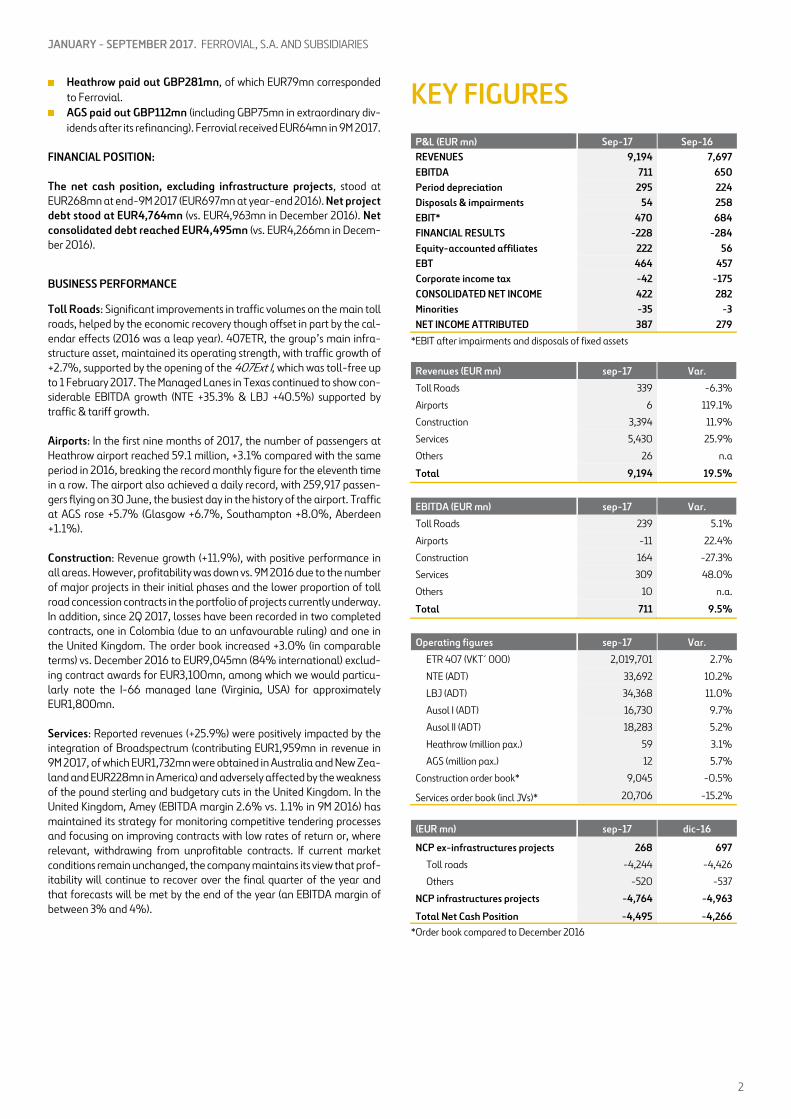
KEY FIGURES
P&L (EUR mn) Sep-17 Sep-16 REVENUES 9,194 7,697 EBITDA 711 650 Period depreciation 295 224 Disposals & impairments 54 258 EBIT* 470 684 FINANCIAL RESULTS -228 -284 Equity-accounted affiliates 222 56 EBT 464 457 Corporate income tax -42 -175 CONSOLIDATED NET INCOME 422 282 Minorities -35 -3 NET INCOME ATTRIBUTED 387 279
*EBIT after impairments and disposals of fixed assets
Revenues (EUR mn) sep-17 Var.
Toll Roads 339 -6.3%
Airports 6 119.1%
Construction 3,394 11.9%
Services 5,430 25.9%
Others 26 n.a
Total 9,194 19.5%
EBITDA (EUR mn) sep-17 Var.
Toll Roads 239 5.1%
Airports -11 22.4%
Construction 164 -27.3%
Services 309 48.0%
Others 10 n.a.
Total 711 9.5%
Operating figures sep-17 Var.
ETR 407 (VKT´ 000) 2,019,701 2.7%
NTE (ADT) 33,692 10.2%
LBJ (ADT) 34,368 11.0%
Ausol I (ADT) 16,730 9.7%
Ausol II (ADT) 18,283 5.2%
Heathrow (million pax.) 59 3.1%
AGS (million pax.) 12 5.7%
Construction order book* 9,045 -0.5%
Services order book (incl JVs)* 20,706 -15.2%
(EUR mn) sep-17 dic-16
NCP ex-infrastructures projects 268 697
Toll roads -4,244 -4,426
Others -520 -537
NCP infrastructures projects -4,764 -4,963
Total Net Cash Position -4,495 -4,266 *Order book compared to December 2016
2

JANUARY - SEPTEMBER 2017. FERROVIAL, S.A. AND SUBSIDIARIES
TOLL ROADS
(EUR million) sep-17 sep-16 Var. Like-for-Like
Revenues 339 361 -6.3% 11.8%
EBITDA 239 228 5.1% 20.6%
EBITDA margin 70.6% 63.0% EBIT 184 170 8.2% 19.2% EBIT margin 54.5% 47.2%
Revenues at the division grew +11.8% in comparable terms in 9M 2017, bolstered by the higher contribution from the Managed Lanes toll roads in the USA and by traffic growth for the majority of assets. In comparable terms, the division also posted EBITDA growth of +20.6%. The USA ac-counted for 37.5% of revenues and 43.1% of EBITDA in the period.
The comparable figures strip out the FX effect and the changes to the consolidation perimeter. Notably from the disposals of:
Chicago Skyway: Sale to a consortium of Canadian pension funds of Cintra’s 55% stake in this asset, for EUR230mn. The sale was completed in February 2016 (two months’ contribution in 2016).
Irish Toll Roads: sale of 46% of M4 and 75% of M3 to the Dutch fund DIF for EUR59mn. Ferrovial retains 20% in each, consolidated using the equity method. The sale was completed in February 2016 (two months’ contribution in 2016).
Norte Litoral & Algarve: In June 2016, Ferrovial reached an agree-ment with the Dutch fund DIF to sell a 51% stake in the Norte Litoral toll road and a 49% stake in the Algarve toll road, both to be con-solidated through equity method once the sale is completed.
Norte Litoral: the sale was completed in April 2017 (EUR104mn). Algarve: completed on 26 September 2017 (EUR58mn).
ASSETS IN OPERATION Traffic performance during 9M 2017 was very positive on Ferrovial’s main toll road, both from light and heavy traffic.
Canada: traffic on the 407ETR increased by +2.7% in the period (light traffic +2.5% and heavy traffic +6.1%), bolstered by the positive impact of the opening of the 407 East Extension Phase I toll road (open to traffic in June 2016, toll free until February 2017) and stronger eco-nomic growth in the Ontario region.
USA: traffic growth was driven by the positive performance of the Managed Lanes toll roads (NTE +10.2% and LBJ +11.0%), which are still in the ramp up phase.
Spain: positive trend driven by economic growth and the upturn in employment. Traffic on Ausol I increased by +9.7% over the period, de-spite a slight slowdown in 3Q (+8.1%) due to a temporary effect following the dockworker dispute in the Algeciras port (Andalucía) and a slowdown in tourism in the area after reaching an historic record high in summer of 2016.
Portugal: performance has been positive, aided by the economic re-covery and, in Azores (+7.0%) due to the increase of tourism on the back of the airline market liberalisation.
Ireland: positive performance based on the employment recovery. From 1 March 2016, following the completion of the sale of stakes in both the M3 and the M4 toll roads in Ireland, these two assets have been con-solidated by the equity method
(EUR million) Traffic (ADT) Revenues EBITDA EBITDA margin Net Debt 100% Global consolidation sep-17 sep-16 Var. sep-17 sep-16 Var. sep-17 sep-16 Var. sep-17 sep-16 sep-17 Particip. NTE 33,692 30,580 10.2% 61 49 25.6% 50 37 34.2% 81.9% 76.7% -874 63.0% LBJ 34,368 30,939 11.0% 65 49 32.7% 52 38 39.3% 80.4% 76.6% -1,239 54.6% NTE35W* 1 0 n.a. 0.3 0 188.3% 35.3% -568 53.7% I-77 * n.a. 0 0 n.a. -196 50.1% TOTAL USA 127 98 30.1% 103 75 37.6% -2,877 Ausol I 16,730 15,254 9.7% 50 46 8.1% 43 39 9.3% 85.7% 84.7% -467 80.0% Ausol II 18,283 17,371 5.2% Autema 17,770 16,486 7.8% 74 72 2.5% 67 66 2.9% 91.2% 90.8% -590 76.3% TOTAL SPAIN 124 118 4.7% 110 105 5.3% -1,057 Azores 9,979 9,327 7.0% 20 19 7.4% 17 16 10.0% 86.3% 84.3% -311 89.2% Algarve** 15,591 13,483 15.6% 27 29 -6.2% 24 26 -4.9% 89.0% 87.7% 48.0% Norte Litoral** 25,518 24,209 5.4% 14 34 -58.7% 12 30 -58.1% 89.2% 88.1% 49.0% Via Livre 10 10 3.5% 1 2 -5.9% 13.7% 15.1% 3 84.0% TOTAL PORTUGAL 72 92 -21.6% 56 73 -23.4% -309 DECONSOLIDATED TOLL ROADS IN 2016 41 12 TOTAL HEADQUARTERS 16 12 29.8% -29 -36 20.0% TOTAL CINTRA 339 361 -6.3% 239 228 4.9% -4,243
* Assets under construction. ** Algarve contribution to 26/09/2017 and Norte Litoral to 21/04/2017, when they then began to be consolidated by the equity method. *** Deconsolidated toll roads in 2016 (SH-130, Chicago Skyway and Irish Toll Roads, M3 & M4)
(EUR million) Traffic (ADT) Revenues EBITDA EBITDA margin Net Debt 100%
Equity accounted sep-17 sep-16 Var. sep-17 sep-16 Var. sep-17 sep-16 Var. sep-17 sep-16 sep-17 Particip.
407 ETR (VKT'000) 2,019,701 1,966,126 2.7% 643 571 12.6% 560 498 12.6% 87.1% 87.2% -4,673 43.2% M4 32,374 30,504 6.1% 21 20 6.5% 13 13 3.0% 62.7% 64.8% -98 20.0% M3 37,120 33,979 9.2% 17 17 2.6% 12 13 -4.3% 71.3% 76.4% -157 20.0% A-66 Benavente Zamora 18 17 1.9% 16 16 1.2% 91.6% 92.3% -163 25.0% Central Greece 13,026 12,157 7.1% 16 8 110.2% 11 3 270.9% 70.8% 40.1% -348 21.4% Ionian Roads 17,891 24,933 -28.2% 63 51 24.7% 35 35 0.8% 55.8% 69.1% -42 21.4% Serrano Park 4 4 2.9% 2 2 1.3% 60.8% 61.7% -44 50.0%
3

JANUARY - SEPTEMBER 2017. FERROVIAL, S.A. AND SUBSIDIARIES
407ETR
Profit and Loss Account
CAD million sep-17 sep-16 Var. Revenues 940 837 12.3% EBITDA 819 730 12.3%
EBITDA margin 87.1% 87.2% EBIT 741 650 13.9%
EBIT margin 78.8% 77.6% Financial results -257 -276 6.7% EBT 484 374 29.2% Corporate income tax -128 -99 -29.1% Net Income 355 275 29.2% Contribution to Ferrovial equity accounted result (EUR mn) 95 72 33.1%
Note: following Ferrovial’s disposal of 10% in 2010, the toll road switched to being accounted
for by the equity method, in line with the percentage stake controlled by Ferrovial (43.23%).
Revenues at 407ETR increased by +12.3% in local currency in 9M 2017. Toll revenues (93% of the total): grew by +12.4% to CAD875mn,
mainly due to the tariff increases applied since February 2017 and the improvement in traffic.
Fee revenues (6.4% of the total): reached CAD60mn (+19.7%), mainly due to starting to manage the 407 East Ext Phase I toll road, coupled with an increase in the number of transponders and higher tariffs.
Average revenues per journey rose +11.1% (CAD9.92 vs. CAD8.93 in the same period in 2016).
The toll road also recorded an increase in EBITDA of +12.3% in 9M 2017, with an EBITDA margin of 87.1%, in line with the same period in 2016 (87.2%).
Financial result: -CAD257mn, CAD19mn fewer expenses vs. 9M 2016 (+6.7%). Main components:
Interest expenses: -CAD270mn. CAD9mn higher than in Septem-ber 2016, largely due to the increase in debt, after the recent issu-ance of CAD800mn senior bonds in September 2017 and CAD250mn in March 2017.
Non-cash financial income linked to inflation: +CAD2mn vs-CAD24mn expenses in 9M 2016 (+CAD25mn improvement), due mainly to the positive impact of falling inflation over the first nine months of 2017, combined with the positive impact resulting from the increase in the discount rate.
Other financial income: +CAD10mn (vs. +CAD8mn in 9M 2016) due to greater returns on investment and higher average cash balance.
407ETR contributed EUR95mn to Ferrovial’s equity-accounted re-sults (+33.1% vs. 9M 2016), after the annual amortization of the good-will following the sale of 10% in 2010, which is being written down over the life of the asset on the basis of the traffic forecast.
Dividends 407ETR In the first nine months of 2017, 407ETR distributed dividends of CAD630mn, +8.1% vs. 9M 2016. Of these, EUR195mn were distributed to Ferrovial (EUR179mn in 9M 2016). At the October Board meeting, the 4Q 2017 dividend payment was approved in the amount of CAD215mn (+3.6% vs. 4Q 2016).
(CAD million) 2017 2016 2015 2014 2013 2012
1Q 207,5 187,5 188 175 100 87,5 2Q 207,5 187,5 188 175 130 87,5 3Q 215,0 207,5 188 175 200 87,5 4Q 215,0 207,5 188 205 250 337,5 Total 845 790 750 730 680 600
407ETR Traffic Traffic (kilometers travelled) rose +2.7%, with an increase in the number of journeys (+0.9%) and an increase in the average distance travelled (+1.9%). Traffic was affected by economic growth in the area and the opening of the 407 East Extension Phase I toll road since 20 June 2016, and which was toll-free until February 2017.
407ETR net debt The net debt figure for 407ETR at 30 September 2017 was CAD6,786mn (average cost of 4.45%). In September, 407ETR issued CAD800mn bonds and announced the early payment of a CAD300mn bond, matur-ing in November 2017.
40% of the debt matures in more than 20 years’ time. The next maturity dates will occur this year (CAD309mn), 2018 (CAD14mn) and 2019 (CAD15mn).
407ETR credit rating S&P: In S&P ratings issued on 31 May 2017, the company remained
at "A" (Senior Debt), "A-" (Junior Debt) and "BBB" (Subordinated Debt), with a stable outlook.
DBRS: In DBRS ratings issued on 4 November 2016, the company re-mained at "A" (Senior Debt), "A low" (Junior Debt) and "BBB" (Subor-dinated Debt), with a stable outlook.
407ETR Tariffs In 2017, tariffs were increased on 1 February and a new tariff structure was announced, involving different tariffs depending on the direction of travel (in addition to the segments based on area, day and time of travel which already was taking place). This change means that a straight com-parison cannot be made with the tariffs applied in 2016. Tariffs applied from 1 February for light vehicles (in CAD cents/km):
CAD (¢/km) Zone 1 Zone 2 Zone 3 Eastbound AM Peak Period:
35.97 35.97 34.65 Mon-Fri: 6am-7am, 9am-10am AM Peak Hours: Mon-Fri: 7am-9am 42.42 42.42 39.42 PM Peak Period:
35.95 37.32 37.32 Mon-Fri: 2:30pm-4pm, 6pm-7pm PM Peak Hours: Mon-Fri: 4pm-6pm 40.85 44.74 44.74 Westbound AM Peak Period:
34.65 35.97 35.97 Mon-Fri: 6am-7am, 9am-10am AM Peak Hours: Mon-Fri: 7am-9am 39.42 40.92 42.42 PM Peak Period:
37.32 37.32 35.95 Mon-Fri: 2:30pm-4pm, 6pm-7pm PM Peak Hours: Mon-Fri: 4pm-6pm 44.74 42.40 40.85 Midday Rate Weekdays 10am-2:30pm 30.88 30.88 30.88 Weekend & public holidays 11am-7pm 28.29 28.29 28.29 Off Peak Rate
22.48 22.48 22.48 Weekdays 7pm-6am, Weekend & public holidays 7pm-11am
For more information, please check the 407ETR MD&A report here
4
JANUARY - SEPTEMBER 2017. FERROVIAL, S.A. AND SUBSIDIARIES
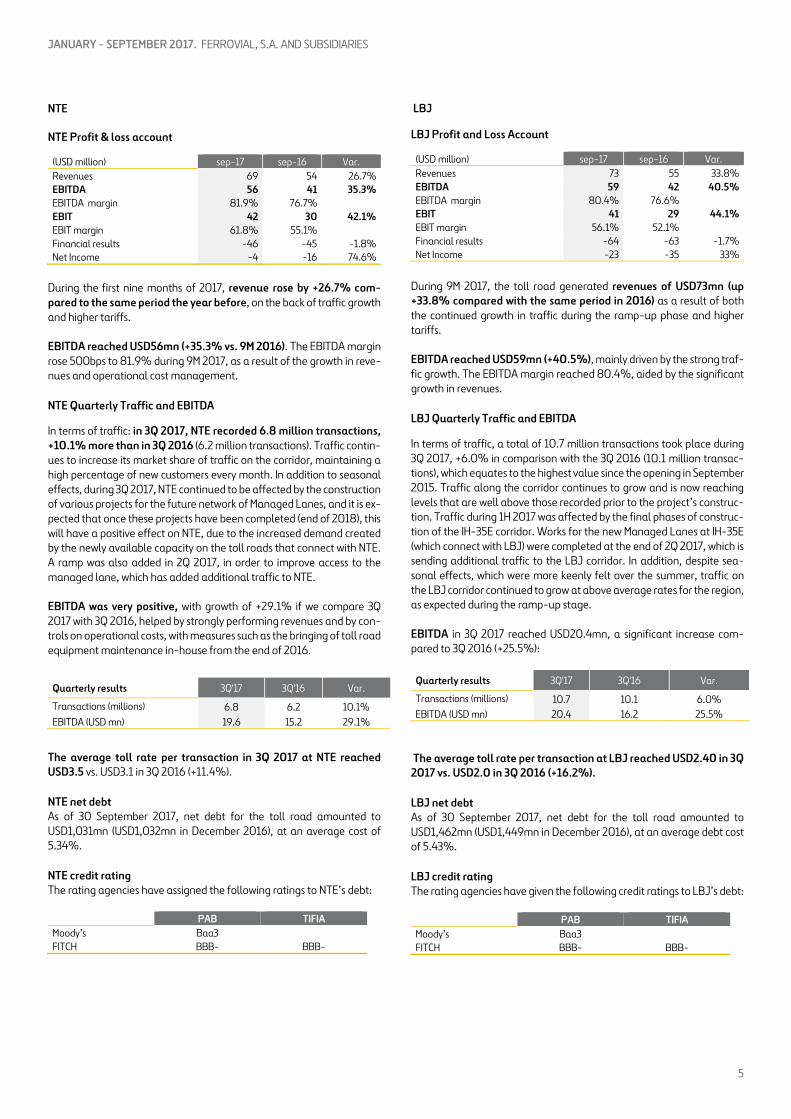
NTE
NTE Profit & loss account
(USD million) sep-17 sep-16 Var. Revenues 69 54 26.7% EBITDA 56 41 35.3% EBITDA margin 81.9% 76.7% EBIT 42 30 42.1% EBIT margin 61.8% 55.1% Financial results -46 -45 -1.8% Net Income -4 -16 74.6%
During the first nine months of 2017, revenue rose by +26.7% com-pared to the same period the year before, on the back of traffic growth and higher tariffs.
EBITDA reached USD56mn (+35.3% vs. 9M 2016). The EBITDA margin rose 500bps to 81.9% during 9M 2017, as a result of the growth in reve-nues and operational cost management.
NTE Quarterly Traffic and EBITDA
In terms of traffic: in 3Q 2017, NTE recorded 6.8 million transactions, +10.1% more than in 3Q 2016 (6.2 million transactions). Traffic contin-ues to increase its market share of traffic on the corridor, maintaining a high percentage of new customers every month. In addition to seasonal effects, during 3Q 2017, NTE continued to be affected by the construction of various projects for the future network of Managed Lanes, and it is ex-pected that once these projects have been completed (end of 2018), this will have a positive effect on NTE, due to the increased demand created by the newly available capacity on the toll roads that connect with NTE. A ramp was also added in 2Q 2017, in order to improve access to the managed lane, which has added additional traffic to NTE. EBITDA was very positive, with growth of +29.1% if we compare 3Q 2017 with 3Q 2016, helped by strongly performing revenues and by con-trols on operational costs, with measures such as the bringing of toll road equipment maintenance in-house from the end of 2016.
Quarterly results 3Q'17 3Q'16 Var.
Transactions (millions) 6.8 6.2 10.1% EBITDA (USD mn) 19.6 15.2 29.1%
The average toll rate per transaction in 3Q 2017 at NTE reached USD3.5 vs. USD3.1 in 3Q 2016 (+11.4%).
NTE net debt As of 30 September 2017, net debt for the toll road amounted to USD1,031mn (USD1,032mn in December 2016), at an average cost of 5.34%.
NTE credit rating The rating agencies have assigned the following ratings to NTE’s debt:
PAB TIFIA Moody’s Baa3 FITCH BBB- BBB-
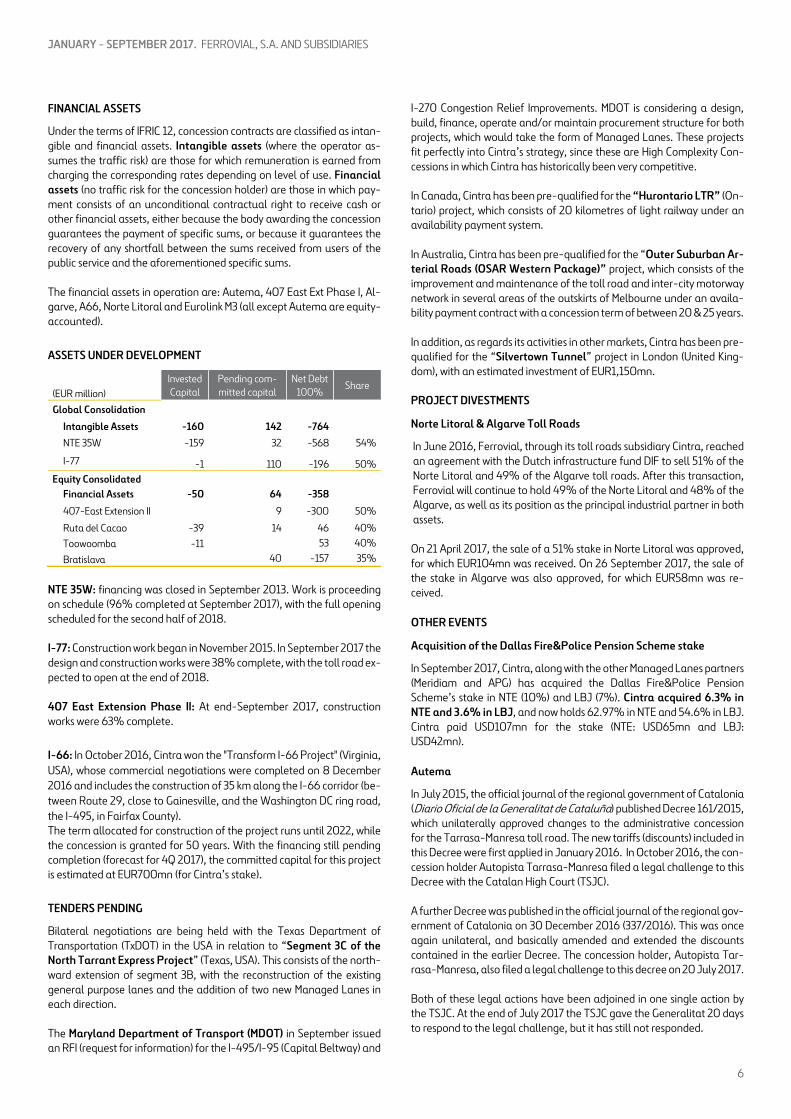
LBJ
LBJ Profit and Loss Account
(USD million) sep-17 sep-16 Var. Revenues 73 55 33.8% EBITDA 59 42 40.5% EBITDA margin 80.4% 76.6% EBIT 41 29 44.1% EBIT margin 56.1% 52.1% Financial results -64 -63 -1.7% Net Income -23 -35 33%
During 9M 2017, the toll road generated revenues of USD73mn (up +33.8% compared with the same period in 2016) as a result of both the continued growth in traffic during the ramp-up phase and higher tariffs.
EBITDA reached USD59mn (+40.5%), mainly driven by the strong traf-fic growth. The EBITDA margin reached 80.4%, aided by the significant growth in revenues.
LBJ Quarterly Traffic and EBITDA
In terms of traffic, a total of 10.7 million transactions took place during 3Q 2017, +6.0% in comparison with the 3Q 2016 (10.1 million transac-tions), which equates to the highest value since the opening in September 2015. Traffic along the corridor continues to grow and is now reaching levels that are well above those recorded prior to the project’s construc-tion. Traffic during 1H 2017 was affected by the final phases of construc-tion of the IH-35E corridor. Works for the new Managed Lanes at IH-35E (which connect with LBJ) were completed at the end of 2Q 2017, which is sending additional traffic to the LBJ corridor. In addition, despite sea-sonal effects, which were more keenly felt over the summer, traffic on the LBJ corridor continued to grow at above average rates for the region, as expected during the ramp-up stage.
EBITDA in 3Q 2017 reached USD20.4mn, a significant increase com-pared to 3Q 2016 (+25.5%):
Quarterly results 3Q'17 3Q'16 Var.
Transactions (millions) 10.7 10.1 6.0% EBITDA (USD mn) 20.4 16.2 25.5%
The average toll rate per transaction at LBJ reached USD2.40 in 3Q 2017 vs. USD2.0 in 3Q 2016 (+16.2%).
LBJ net debt As of 30 September 2017, net debt for the toll road amounted to USD1,462mn (USD1,449mn in December 2016), at an average debt cost of 5.43%.
LBJ credit rating The rating agencies have given the following credit ratings to LBJ’s debt:
PAB TIFIA Moody’s Baa3 FITCH BBB- BBB-
5
JANUARY - SEPTEMBER 2017. FERROVIAL, S.A. AND SUBSIDIARIES
FINANCIAL ASSETS
Under the terms of IFRIC 12, concession contracts are classified as intan-gible and financial assets. Intangible assets (where the operator as-sumes the traffic risk) are those for which remuneration is earned from charging the corresponding rates depending on level of use. Financial assets (no traffic risk for the concession holder) are those in which pay-ment consists of an unconditional contractual right to receive cash or other financial assets, either because the body awarding the concession guarantees the payment of specific sums, or because it guarantees the recovery of any shortfall between the sums received from users of the public service and the aforementioned specific sums.
The financial assets in operation are: Autema, 407 East Ext Phase I, Al-garve, A66, Norte Litoral and Eurolink M3 (all except Autema are equity-accounted).
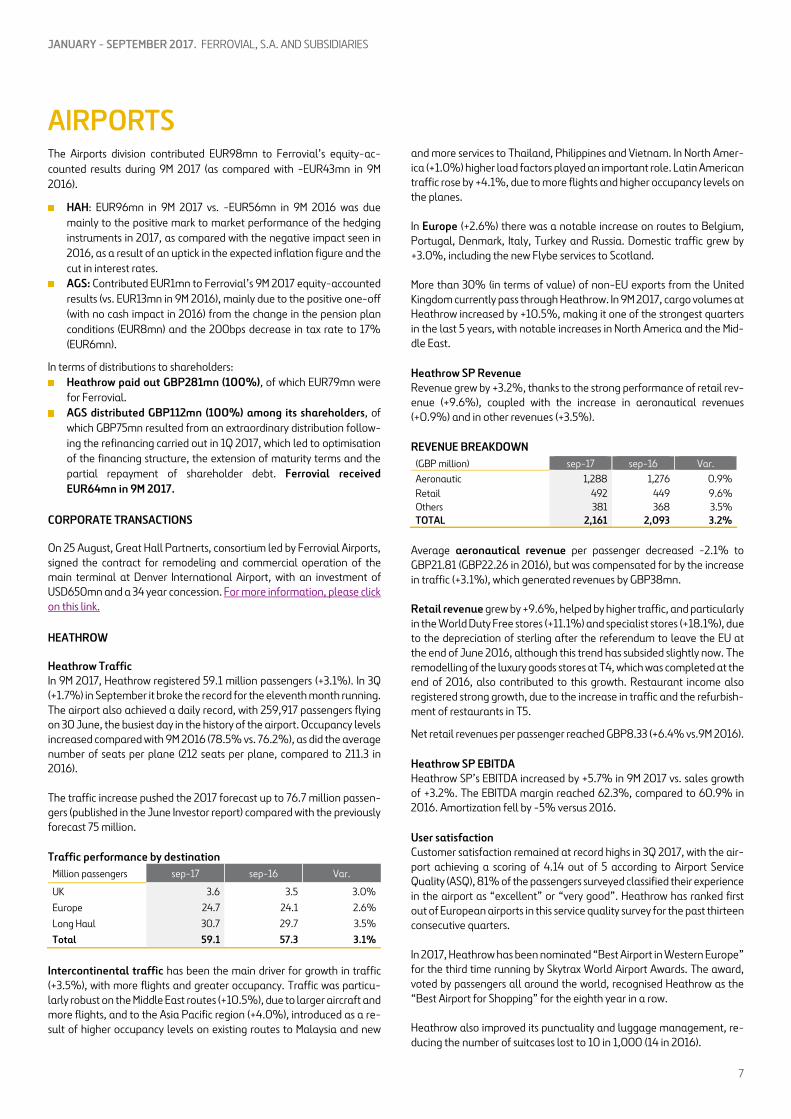
ASSETS UNDER DEVELOPMENT
(EUR million) Invested Capital
Pending com-mitted capital
Net Debt 100%
Share
Global Consolidation Intangible Assets -160 142 -764
NTE 35W -159 32 -568 54%
I-77 -1 110 -196 50% Equity Consolidated
Financial Assets -50 64 -358
407-East Extension II 9 -300 50%
Ruta del Cacao -39 14 46 40% Toowoomba -11 53 40%
Bratislava 40 -157 35%
NTE 35W: financing was closed in September 2013. Work is proceeding on schedule (96% completed at September 2017), with the full opening scheduled for the second half of 2018.
I-77: Construction work began in November 2015. In September 2017 the design and construction works were 38% complete, with the toll road ex-pected to open at the end of 2018.
407 East Extension Phase II: At end-September 2017, construction works were 63% complete.
I-66: In October 2016, Cintra won the "Transform I-66 Project" (Virginia, USA), whose commercial negotiations were completed on 8 December 2016 and includes the construction of 35 km along the I-66 corridor (be-tween Route 29, close to Gainesville, and the Washington DC ring road, the I-495, in Fairfax County). The term allocated for construction of the project runs until 2022, while the concession is granted for 50 years. With the financing still pending completion (forecast for 4Q 2017), the committed capital for this project is estimated at EUR700mn (for Cintra’s stake).
TENDERS PENDING
Bilateral negotiations are being held with the Texas Department of Transportation (TxDOT) in the USA in relation to “Segment 3C of the North Tarrant Express Project” (Texas, USA). This consists of the north-ward extension of segment 3B, with the reconstruction of the existing general purpose lanes and the addition of two new Managed Lanes in each direction.
The Maryland Department of Transport (MDOT) in September issued an RFI (request for information) for the I-495/I-95 (Capital Beltway) and
I-270 Congestion Relief Improvements. MDOT is considering a design, build, finance, operate and/or maintain procurement structure for both projects, which would take the form of Managed Lanes. These projects fit perfectly into Cintra’s strategy, since these are High Complexity Con-cessions in which Cintra has historically been very competitive.
In Canada, Cintra has been pre-qualified for the “Hurontario LTR” (On-tario) project, which consists of 20 kilometres of light railway under an availability payment system.
In Australia, Cintra has been pre-qualified for the “Outer Suburban Ar-terial Roads (OSAR Western Package)” project, which consists of the improvement and maintenance of the toll road and inter-city motorway network in several areas of the outskirts of Melbourne under an availa-bility payment contract with a concession term of between 20 & 25 years.
In addition, as regards its activities in other markets, Cintra has been pre-qualified for the “Silvertown Tunnel” project in London (United King-dom), with an estimated investment of EUR1,150mn.
PROJECT DIVESTMENTS
Norte Litoral & Algarve Toll Roads
In June 2016, Ferrovial, through its toll roads subsidiary Cintra, reached an agreement with the Dutch infrastructure fund DIF to sell 51% of the Norte Litoral and 49% of the Algarve toll roads. After this transaction, Ferrovial will continue to hold 49% of the Norte Litoral and 48% of the Algarve, as well as its position as the principal industrial partner in both assets.
On 21 April 2017, the sale of a 51% stake in Norte Litoral was approved, for which EUR104mn was received. On 26 September 2017, the sale of the stake in Algarve was also approved, for which EUR58mn was re-ceived.
OTHER EVENTS
Acquisition of the Dallas Fire&Police Pension Scheme stake
In September 2017, Cintra, along with the other Managed Lanes partners (Meridiam and APG) has acquired the Dallas Fire&Police Pension Scheme’s stake in NTE (10%) and LBJ (7%). Cintra acquired 6.3% in NTE and 3.6% in LBJ, and now holds 62.97% in NTE and 54.6% in LBJ. Cintra paid USD107mn for the stake (NTE: USD65mn and LBJ: USD42mn).
Autema
In July 2015, the official journal of the regional government of Catalonia (Diario Oficial de la Generalitat de Cataluña) published Decree 161/2015, which unilaterally approved changes to the administrative concession for the Tarrasa-Manresa toll road. The new tariffs (discounts) included in this Decree were first applied in January 2016. In October 2016, the con-cession holder Autopista Tarrasa-Manresa filed a legal challenge to this Decree with the Catalan High Court (TSJC).
A further Decree was published in the official journal of the regional gov-ernment of Catalonia on 30 December 2016 (337/2016). This was once again unilateral, and basically amended and extended the discounts contained in the earlier Decree. The concession holder, Autopista Tar-rasa-Manresa, also filed a legal challenge to this decree on 20 July 2017.
Both of these legal actions have been adjoined in one single action by the TSJC. At the end of July 2017 the TSJC gave the Generalitat 20 days to respond to the legal challenge, but it has still not responded.
6
JANUARY - SEPTEMBER 2017. FERROVIAL, S.A. AND SUBSIDIARIES
AIRPORTS The Airports division contributed EUR98mn to Ferrovial’s equity-ac-counted results during 9M 2017 (as compared with -EUR43mn in 9M 2016).
HAH: EUR96mn in 9M 2017 vs. -EUR56mn in 9M 2016 was due mainly to the positive mark to market performance of the hedging instruments in 2017, as compared with the negative impact seen in 2016, as a result of an uptick in the expected inflation figure and the cut in interest rates.
AGS: Contributed EUR1mn to Ferrovial’s 9M 2017 equity-accounted results (vs. EUR13mn in 9M 2016), mainly due to the positive one-off (with no cash impact in 2016) from the change in the pension plan conditions (EUR8mn) and the 200bps decrease in tax rate to 17% (EUR6mn).
In terms of distributions to shareholders: Heathrow paid out GBP281mn (100%), of which EUR79mn were
for Ferrovial. AGS distributed GBP112mn (100%) among its shareholders, of
which GBP75mn resulted from an extraordinary distribution follow-ing the refinancing carried out in 1Q 2017, which led to optimisation of the financing structure, the extension of maturity terms and the partial repayment of shareholder debt. Ferrovial received EUR64mn in 9M 2017.
CORPORATE TRANSACTIONS
On 25 August, Great Hall Partnerts, consortium led by Ferrovial Airports, signed the contract for remodeling and commercial operation of the main terminal at Denver International Airport, with an investment of USD650mn and a 34 year concession. For more information, please click on this link.
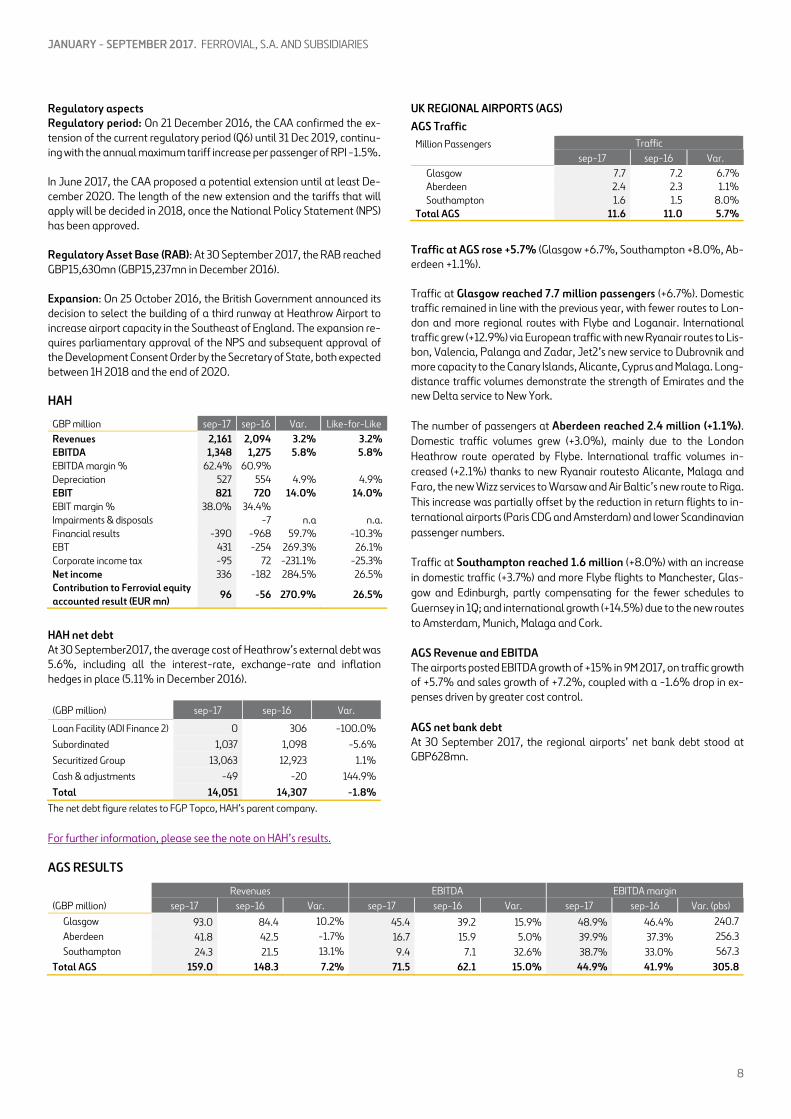
HEATHROW
Heathrow Traffic In 9M 2017, Heathrow registered 59.1 million passengers (+3.1%). In 3Q (+1.7%) in September it broke the record for the eleventh month running. The airport also achieved a daily record, with 259,917 passengers flying on 30 June, the busiest day in the history of the airport. Occupancy levels increased compared with 9M 2016 (78.5% vs. 76.2%), as did the average number of seats per plane (212 seats per plane, compared to 211.3 in 2016).
The traffic increase pushed the 2017 forecast up to 76.7 million passen-gers (published in the June Investor report) compared with the previously forecast 75 million.
Traffic performance by destination Million passengers sep-17 sep-16 Var.
UK 3.6 3.5 3.0% Europe 24.7 24.1 2.6% Long Haul 30.7 29.7 3.5% Total 59.1 57.3 3.1%
Intercontinental traffic has been the main driver for growth in traffic (+3.5%), with more flights and greater occupancy. Traffic was particu-larly robust on the Middle East routes (+10.5%), due to larger aircraft and more flights, and to the Asia Pacific region (+4.0%), introduced as a re-sult of higher occupancy levels on existing routes to Malaysia and new
and more services to Thailand, Philippines and Vietnam. In North Amer-ica (+1.0%) higher load factors played an important role. Latin American traffic rose by +4.1%, due to more flights and higher occupancy levels on the planes.
In Europe (+2.6%) there was a notable increase on routes to Belgium, Portugal, Denmark, Italy, Turkey and Russia. Domestic traffic grew by +3.0%, including the new Flybe services to Scotland. More than 30% (in terms of value) of non-EU exports from the United Kingdom currently pass through Heathrow. In 9M 2017, cargo volumes at Heathrow increased by +10.5%, making it one of the strongest quarters in the last 5 years, with notable increases in North America and the Mid-dle East.
Heathrow SP Revenue Revenue grew by +3.2%, thanks to the strong performance of retail rev-enue (+9.6%), coupled with the increase in aeronautical revenues (+0.9%) and in other revenues (+3.5%).
REVENUE BREAKDOWN (GBP million) sep-17 sep-16 Var. Aeronautic 1,288 1,276 0.9% Retail 492 449 9.6% Others 381 368 3.5% TOTAL 2,161 2,093 3.2%
Average aeronautical revenue per passenger decreased -2.1% to GBP21.81 (GBP22.26 in 2016), but was compensated for by the increase in traffic (+3.1%), which generated revenues by GBP38mn.
Retail revenue grew by +9.6%, helped by higher traffic, and particularly in the World Duty Free stores (+11.1%) and specialist stores (+18.1%), due to the depreciation of sterling after the referendum to leave the EU at the end of June 2016, although this trend has subsided slightly now. The remodelling of the luxury goods stores at T4, which was completed at the end of 2016, also contributed to this growth. Restaurant income also registered strong growth, due to the increase in traffic and the refurbish-ment of restaurants in T5.
Net retail revenues per passenger reached GBP8.33 (+6.4% vs.9M 2016).
Heathrow SP EBITDA Heathrow SP’s EBITDA increased by +5.7% in 9M 2017 vs. sales growth of +3.2%. The EBITDA margin reached 62.3%, compared to 60.9% in 2016. Amortization fell by -5% versus 2016.
User satisfaction Customer satisfaction remained at record highs in 3Q 2017, with the air-port achieving a scoring of 4.14 out of 5 according to Airport Service Quality (ASQ), 81% of the passengers surveyed classified their experience in the airport as “excellent” or “very good”. Heathrow has ranked first out of European airports in this service quality survey for the past thirteen consecutive quarters. In 2017, Heathrow has been nominated “Best Airport in Western Europe” for the third time running by Skytrax World Airport Awards. The award, voted by passengers all around the world, recognised Heathrow as the “Best Airport for Shopping” for the eighth year in a row. Heathrow also improved its punctuality and luggage management, re-ducing the number of suitcases lost to 10 in 1,000 (14 in 2016).
7
JANUARY - SEPTEMBER 2017. FERROVIAL, S.A. AND SUBSIDIARIES
Regulatory aspects Regulatory period: On 21 December 2016, the CAA confirmed the ex-tension of the current regulatory period (Q6) until 31 Dec 2019, continu-ing with the annual maximum tariff increase per passenger of RPI -1.5%.
In June 2017, the CAA proposed a potential extension until at least De-cember 2020. The length of the new extension and the tariffs that will apply will be decided in 2018, once the National Policy Statement (NPS) has been approved.
Regulatory Asset Base (RAB): At 30 September 2017, the RAB reached GBP15,630mn (GBP15,237mn in December 2016).
Expansion: On 25 October 2016, the British Government announced its decision to select the building of a third runway at Heathrow Airport to increase airport capacity in the Southeast of England. The expansion re-quires parliamentary approval of the NPS and subsequent approval of the Development Consent Order by the Secretary of State, both expected between 1H 2018 and the end of 2020.
HAH
GBP million sep-17 sep-16 Var. Like-for-Like Revenues 2,161 2,094 3.2% 3.2% EBITDA 1,348 1,275 5.8% 5.8% EBITDA margin % 62.4% 60.9% Depreciation 527 554 4.9% 4.9% EBIT 821 720 14.0% 14.0% EBIT margin % 38.0% 34.4% Impairments & disposals -7 n.a n.a. Financial results -390 -968 59.7% -10.3% EBT 431 -254 269.3% 26.1% Corporate income tax -95 72 -231.1% -25.3% Net income 336 -182 284.5% 26.5% Contribution to Ferrovial equity accounted result (EUR mn)
96 -56 270.9% 26.5%
HAH net debt At 30 September2017, the average cost of Heathrow’s external debt was 5.6%, including all the interest-rate, exchange-rate and inflation hedges in place (5.11% in December 2016).
(GBP million) sep-17 sep-16 Var.
Loan Facility (ADI Finance 2) 0 306 -100.0% Subordinated 1,037 1,098 -5.6% Securitized Group 13,063 12,923 1.1% Cash & adjustments -49 -20 144.9% Total 14,051 14,307 -1.8%
The net debt figure relates to FGP Topco, HAH’s parent company. For further information, please see the note on HAH’s results.
UK REGIONAL AIRPORTS (AGS) AGS Traffic
Million Passengers Traffic sep-17 sep-16 Var.
Glasgow 7.7 7.2 6.7% Aberdeen 2.4 2.3 1.1% Southampton 1.6 1.5 8.0%
Total AGS 11.6 11.0 5.7%
Traffic at AGS rose +5.7% (Glasgow +6.7%, Southampton +8.0%, Ab-erdeen +1.1%).
Traffic at Glasgow reached 7.7 million passengers (+6.7%). Domestic traffic remained in line with the previous year, with fewer routes to Lon-don and more regional routes with Flybe and Loganair. International traffic grew (+12.9%) via European traffic with new Ryanair routes to Lis-bon, Valencia, Palanga and Zadar, Jet2’s new service to Dubrovnik and more capacity to the Canary Islands, Alicante, Cyprus and Malaga. Long-distance traffic volumes demonstrate the strength of Emirates and the new Delta service to New York. The number of passengers at Aberdeen reached 2.4 million (+1.1%). Domestic traffic volumes grew (+3.0%), mainly due to the London Heathrow route operated by Flybe. International traffic volumes in-creased (+2.1%) thanks to new Ryanair routesto Alicante, Malaga and Faro, the new Wizz services to Warsaw and Air Baltic’s new route to Riga. This increase was partially offset by the reduction in return flights to in-ternational airports (Paris CDG and Amsterdam) and lower Scandinavian passenger numbers. Traffic at Southampton reached 1.6 million (+8.0%) with an increase in domestic traffic (+3.7%) and more Flybe flights to Manchester, Glas-gow and Edinburgh, partly compensating for the fewer schedules to Guernsey in 1Q; and international growth (+14.5%) due to the new routes to Amsterdam, Munich, Malaga and Cork.
AGS Revenue and EBITDA The airports posted EBITDA growth of +15% in 9M 2017, on traffic growth of +5.7% and sales growth of +7.2%, coupled with a -1.6% drop in ex-penses driven by greater cost control. AGS net bank debt At 30 September 2017, the regional airports’ net bank debt stood at GBP628mn.
AGS RESULTS
Revenues EBITDA EBITDA margin (GBP million) sep-17 sep-16 Var. sep-17 sep-16 Var. sep-17 sep-16 Var. (pbs)
Glasgow 93.0 84.4 10.2% 45.4 39.2 15.9% 48.9% 46.4% 240.7 Aberdeen 41.8 42.5 -1.7% 16.7 15.9 5.0% 39.9% 37.3% 256.3 Southampton 24.3 21.5 13.1% 9.4 7.1 32.6% 38.7% 33.0% 567.3
Total AGS 159.0 148.3 7.2% 71.5 62.1 15.0% 44.9% 41.9% 305.8
8

JANUARY - SEPTEMBER 2017. FERROVIAL, S.A. AND SUBSIDIARIES
CONSTRUCTION (EUR million) sep-17 sep-16 Var. Like-for-Like Revenues 3,394 3,033 11.9% 11.9% EBITDA 164 226 -27.3% -27.7% EBITDA margin 4.8% 7.4% EBIT 135 205 -34.2% -34.5% EBIT margin 4.0% 6.7% Order book* 9,045 9,088 -0.5% 3.0%
*Order book compared with December 2016
Revenues increased by +11.9% in comparable terms, with positive per-formance in all areas. International turnover was responsible for 83% of the division’s revenues, very much focused on the company’s traditional strategic markets: Poland (31% of revenues) and North America (29%).
Profitability declined compared to 9M 2016 (EBITDA margin 4.8% vs. 7.4%), due to large projects in their preliminary stages and a lower pro-portion of toll road concession contracts in the portfolio of projects cur-rently in course. In addition, losses were incurred in 2017 as the result of an unfavourable ruling on a project carried out in Colombia in 2012/2013 and losses from an already completed contract in the UK.
BUDIMEX (EUR million) sep-17 sep-16 Var. Like-for-Like Revenues 1,035 953 8.6% 6.3% EBITDA 93 70 32.9% 29.8% EBITDA margin 8.9% 7.3% EBIT 87 65 32.4% 29.3% EBIT margin 8.4% 6.9% Order book* 2,152 2,027 6.2% 3.9%
*Order book compared with December 2016
We highlight the sale of 3.9% of Budimex in 2017, and while this did not impact on Ferrovial’s profit and loss account, which retained its control-ling share (55.1%), it did have an impact on cash flow, +EUR59mn.
The same positive trend as previous years continues to be displayed. De-spite adverse weather conditions, revenues in comparable terms in-creased by +6.3% as a result of the faster completion of Industrial pro-jects and Residential and Non-Residential Construction. Profitability in-creased (+29.8% in EBITDA), primarily due to final payment on the in-frastructure projects that have been completed.
The order book remains very strong (EUR2,152mn) +3.9% vs. December 2016. In September 2017, contracting reached more than EUR1,100mn, of which approximately 53% relate to the signing of Civil Works contracts awarded under the 2014-2020 New Highway Plan. We would highlight the award of the Lagiewnicka Highway in Krakow (EUR154mn), and rail works for approximately EUR250mn. Budimex also has contracts that are currently pending signing or have been signed since 30 September 2017 worth a total of more than +EUR460mn.
WEBBER (EUR million) sep-17 sep-16 Var. Like-for-Like Revenues 586 524 11.9% 16.5% EBITDA 25 41 -40.3% -41.3% EBITDA margin 4.2% 7.9% EBIT 18 35 -49.9% -50.9% EBIT margin 3.0% 6.7% Order book* 1,371 1,084 26.5% 41.6%
*Order book compared with December 2016
Revenues were up +16.5% in comparable terms, thanks to the incorpo-ration of Pepper Lawson, a company that specialises in water projects and non-residential construction and which was acquired in March 2016 (and whose revenues in 9M 2017 totalled EUR127mn vs. EUR65mn in 9M
2016). The fall in the EBITDA margin to 4.2% was due to the lower pro-portion of toll road concession contracts in the portfolio of projects cur-rently in course.
The value of contracting so far this year has been extraordinarily high, close to EUR970mn (more than double the amount contracted for the whole of 2016), which has led to a growth in the order book of +41.6% in comparable terms.
FERROVIAL AGROMAN (EUR million) sep-17 sep-16 Var. Like-for-Like Revenues 1,773 1,557 13.9% 14.0% EBITDA 47 115 -59.1% -58.7% EBITDA margin 2.6% 7.4% EBIT 30 104 -70.8% -70.4% EBIT margin 1.7% 6.7% Order book* 5,522 5,977 -7.6% -3.9%
*Order book compared with December 2016
Turnover increased (+14.0%), driven by the award of new projects, though profitability decreased (EBITDA margin 2.6%) during 9M 2017, mainly as the result of losses resulting from an unfavourable ruling on a project carried out in Colombia in 2012/2013 and losses incurred in an already completed contract in the United Kingdom, due to tight comple-tion deadlines and failure to reach an agreement with the client on the implementation of alternative technical solutions. In addition, profita-bility was affected by the fact that several projects were executed in the initial stages, with lesser levels of complexity.
ORDER BOOK (EUR million) sep-17 dic-16 Var.
Civil work 6,930 7,088 -2.2% Residential work 430 344 25.0% Non-residential work 859 873 -1.6% Industrial 826 783 5.5% Total 9,045 9,088 -0.5%
*Order book compared with December 2016
The order book decreased by -0.5% on December 2016 (+3.0% LfL). The civil works segment remains the largest segment (at 77%), and very selective criteria are maintained when participating in tenders. The in-ternational order book amounted to EUR7,585mn, far greater than the domestic order book (EUR1,460mn), and represented 84% of the total.
The order book figure for September 2017 does not include pre-awarded contracts or contracts for which commercial or financial agreement has not been finalised. These amount to a total value of EUR3,100mn, of which we would note the I-66 Managed Lane in Virginia, which accounts for approximately EUR1,800mn, as well as Denver Airport for EUR550mn.
9
JANUARY - SEPTEMBER 2017. FERROVIAL, S.A. AND SUBSIDIARIES
SERVICES In 9M 2017, Services revenue reached EUR5,430mn (+25.9% compared to 2016). This growth was largely due to the contribution from Broad-spectrum, acquired in May 2016. With the incorporation of Broadspec-trum, Ferrovial Services not only accesses the Australian market, but also the North American market and strengthens mining activity in Chile. With the aim of optimising opportunities in the different geographical territo-ries, the American business was separated from Broadspectrum’s other activities from January 2017 and included under International Services.
In 9M 2017, Broadspectrum contributed a combined revenue of EUR1,959mn. As a result of the aforementioned organisational changes, its business is not reported jointly in this report. However, from the afore-mentioned figure, EUR1,732mn corresponds to revenues obtained in Australia and New Zealand and EUR228mn to revenues obtained in America, which will be incorporated into Ferrovial International Services.
Excluding the contribution from Broadspectrum, growth in revenues in comparable terms, i.e. excluding exchange rate effects and the incorpo-ration of Broadspectrum, is +4.1%. The main contributors to this growth are Ferrovial Services Spain (+8.8%) and Ferrovial Services International (+11%). The UK remains in line with growth of 0.5%.
The division’s EBITDA grew by +7.8% in comparable terms, driven by the improvement in the UK, which is reaping the rewards for the restructuring carried out in mid-2016.
In September, the order book reached EUR20,706mn, -13% vs. Decem-ber 2016 in comparable terms. This performance was due to various fac-tors, which will be commented on in their respective sections.
(EUR million) sep-17 sep-16 Var. Like-for-Like Revenues 5,430 4,314 25.9% 4.1% EBITDA 309 209 48.0% 7.8% EBITDA margin 5.7% 4.8% EBIT 102 66 54.3% 13.2% EBIT margin 1.9% 1.5% Order book* 18,954 22,205 -14.6% -12.4% JVs order book* 1,751 2,226 -21.3% -18.7% Global order book+JVs* 20,706 24,431 -15.2% -13.0%
*Order book compared with December 2016
SPAIN (EUR million) sep-17 sep-16 Var. Like-for-Like Revenues 1,410 1,296 8.8% 8.8% EBITDA 143 136 5.8% 4.6% EBITDA margin 10.2% 10.5% EBIT 75 70 6.9% 4.6% EBIT margin 5.3% 5.4% Order book* 5,008 5,450 -8.1% -8.1% JVs order book* 271 291 -6.8% -6.8% Global order book+JVs* 5,280 5,741 -8.0% -8.0%
*Order book compared with December 2016
Revenues in Spain grew by +8.8%, as compared with September 2016. The main reason for this growth is the expansion of both industrial activ-ity and consumption, driven by the improvement in macroeconomic con-ditions in Spain. In addition, the incorporation of several acquisitions in the industrial maintenance sector, account for +3.3% of this figure. These activities usually offer lower returns than the average. The EBITDA margin stood at 10.2% compared to 10.5% in 2016. This drop is due to an increase in industrial activity in which profitability is below to the cur-rent level.
The order book volume stood at EUR5,280mn in September 2017 (-8.0% compared with December 2016). The reduced size of the order book is directly related to the slowdown in competitive tendering pro-cesses, both in terms of the opportunities that are available in the mar-ketplace and as regards the award of contracts already bid for. As a con-sequence, a number of contracts have been deferred in the expectation that they will be tendered. In these cases, turnover levels are maintained, but the size of the order book is reduced as when one contract expires it is not renewed with a contract of equivalent value. Success rates in the available markets remain stable.
UNITED KINGDOM (EUR million) sep-17 sep-16 Var. Like-for-Like Revenues 1,949 2,092 -6.8% 0.5% EBITDA 50 24 111.0% 27.5% EBITDA margin 2.6% 1.1% EBIT 24 -7 n.s. 115.4% EBIT margin 1.2% -0.3% Order book* 8,725 10,636 -18.0% -15.4% JVs order book* 1,115 1,262 -11.7% -8.9% Global order book+JVs* 9,840 11,898 -17.3% -14.7%
*Order book compared with December 2016
The business climate in the United Kingdom continued to be affected by the budgetary restrictions imposed on public sector clients, which has had an impact on the number of opportunities that come on to the mar-ket. In turn, from a commercial point of view, the company continues to apply a strict selection policy regarding the opportunities for which bids are to be submitted. As a consequence, revenues are in line with the pre-vious year (+0.5% in comparable terms).
The company continues to focus on improving contracts with low rates of return, or withdrawing from unprofitable contracts where relevant, and on implementing the restructuring plan started in 2016. As a result mar-gins have continued to gradually recover and EBITDA now stands at 2.6%. If current market conditions continue, we expect to see ongoing improvement in margins in the last quarter of the year.
Negotiations with the Birmingham City Council have moved forward and both parties have signed a preliminary agreement in July. Both sides have until the end of the year to reach a final agreement. To date, legal costs amounting to €6mn have been incurred, and these have been charged against the allowance provision created in December 2015. The result from the Birmingham contract at September stands at -EUR5mn.
In September, the order book stood at EUR9,840mn (-14.7% LfL com-pared with December 2016). The trend in this area was marked by the stricter project selection process mentioned above, and by consumption in the business portfolio for utilities that will be offered for tender in 2019 and 2020, coinciding with the clients’ regulatory periods. The most im-portant contracts awarded this year are the waste collection contract in Surrey (EUR131mn, 10 years) and the contract to maintain the Manches-ter light railway (EUR181mn, 7 years). The latter of these two amounts corresponds to Amey’s 40% stake in the joint venture that will perform the contract.
10
JANUARY - SEPTEMBER 2017. FERROVIAL, S.A. AND SUBSIDIARIES
BROADSPECTRUM (AUSTRALIA AND NEW ZEALAND)
Broadspectrum Intangible
Broadspectrum
post intangible
(EUR million) sep-17 Amortiza-
tion amortization
Revenues 1,732 1,732 EBITDA 103 103 EBITDA margin 6.0% 6.0% EBIT 69 -63 5 EBIT margin 4.0% 0.3% Order book* 3,744 3,744 JVs order book* 278 278 Global order book+JVs* 4,022 4,022
*Order book compared with December 2016
Broadspectrum’s business in Australia and New Zealand is reported in this unit.
The company continues to work on exiting the immigration contracts and plans have been put in place to leave these contracts effectively on 31 October of this year. At the same time, actions are being implemented to improve profitability and adjust costs, in line with the contents of the acquisition plan.
The order book, which at December 2016 (excluding America) stood at EUR4,869mn, stood at EUR4,022mn in September (-14.9% in compa-rable terms). Tender activity is increasing, in line with the growth strat-egy. The company has identified opportunities worth EUR19,900mn. EUR5,800mn of offers are being studied and there are currently EUR3,200mn in the various stages of tendering. It should be pointed out that the large size of contracts and commercial practices in Australia means that projects take longer to mature than in other markets.
Notable among the contracts awarded this year are a contract to install optical fibre for our client Chorus in New Zealand (EUR169mn, 8 years), a contract to maintain a liquefied gas plant for our client Impex in Aus-tralia (EUR143mn, 5 years), and a renewed contract to maintain public schools in New South Wales (EUR101mn, 1 year). Award of the PPP for refurbishment and maintenance in Melbourne (Osas West) remains pending, with a portfolio worth an estimated AUD704mn.
INTERNATIONAL SERVICES
(EUR million) sep-17 sep-16 Var. Like-for-Like Revenues 339 98 245.4% 11.0% EBITDA 12 10 23.6% -26.7% EBITDA margin 3.5% 9.8% EBIT -3 3 -182.4% -146.2% EBIT margin -0.8% 3.2% Order book* 1,476 530 178.4% 0.3% JVs order book* 88 145 n.s. n.s. Global order book+JVs* 1,564 675 131.7% -12.7%
*Order book compared with December 2016
The Ferrovial International Services division has included Broadspec-trum’s business activity in America (North North America and Chile) since January 2017. The revenue contribution to September stood at EUR181mn in North America and EUR47mn Chile. The EBITDA margin for the business activity of both, at the date of publication, is 2%. As regards other countries, revenues and business developments as compared with 2016 are as follows: Poland +EUR41mn (+38.2%), Chile +EUR47mn (-3.4%) and Portugal +EUR23mn (+6.6%). In combination, and in comparable terms, revenues were up by +11% on 2016, while the EBITDA was EUR2.6mn lower than 2016, due to winter maintenance costs relating to the highway contracts in Poland in the first quarter of the year and due to losses of EUR1mn in Chile due to a maintenance con-tract that has now finished. The order book stood at EUR1,564mn (-12.7% LfL compared with 2016). The decline was primarily due to the sale of the Gateway JV in Canada (EUR188mn). Notable among the contracts awarded this year are the in-corporation of the Trans Formers order book (EUR67.5mn), a waste management company acquired in Poland in June and the tunnel maintenance contract in Washington DC (EUR22mn, 5 years).
11

JANUARY - SEPTEMBER 2017. FERROVIAL, S.A. AND SUBSIDIARIES
BALANCE SHEET
sep-17 dic-16
sep-17 dic-16
FIXED AND OTHER NON-CURRENT ASSETS 15,217 15,679 EQUITY 5,893 6,314 Consolidation goodwill 2,108 2,155 Capital & reserves attrib to the Company´s equity holders 5,184 5,597 Intangible assets 444 544 Minority interest 709 717 Investments in infrastructure projects 6,927 7,145 Deferred Income 1,028 1,118 Property 6 6 Plant and Equipment 694 731 NON-CURRENT LIABILITIES 10,441 10,421 Equity-consolidated companies 2,862 2,874 Pension provisions 137 174 Non-current financial assets 748 735 Other non current provisions 759 757
Long term investments with associated companies 343 374 Financial borrowings 7,984 7,874 Restricted Cash and other non-current assets 283 249 Financial borrowings on infrastructure projects 5,153 5,310 Other receivables 122 112 Financial borrowings other companies 2,831 2,564
Deferred taxes 1,117 1,057 Other borrowings 201 200 Derivative financial instruments at fair value 311 432 Deferred taxes 965 979 Derivative financial instruments at fair value 394 436 CURRENT ASSETS 7,300 7,745 Assets classified as held for sale 0 624 CURRENT LIABILITIES 5,155 5,570 Inventories 573 516 Liabilities classified as held for sale 0 440 Trade & other receivables 3,008 2,822 Financial borrowings 389 302
Trade receivable for sales and services 2,373 2,193 Financial borrowings on infrastructure projects 249 200 Other receivables 635 629 Financial borrowings other companies 139 102
Taxes assets on current profits 69 186 Derivative financial instruments at fair value 81 69 Cash and other temporary financial investments 3,614 3,578 Trade and other payables 3,840 3,895
Infrastructure project companies 338 277 Trades and payables 2,274 2,299 Restricted Cash 57 62 Other non comercial liabilities 1,566 1,596 Other cash and equivalents 281 215 Liabilities from corporate tax 112 150
Other companies 3,275 3,301 Trade provisions 734 715 Derivative financial instruments at fair value 36 18 TOTAL ASSETS 22,516 23,423 TOTAL LIABILITIES & EQUITY 22,516 23,423
As already mentioned in the consolidated annual accounts for 2016, the company has decided to bring the application of IFRS rule 15 (Revenue from Contracts with Customers) forward to the 2017 financial year. Application of this rule has had a negative impact on the company’s reserves to the value of -EUR259mn. For more details on the plan for the application of this rule and its expected impact, please see Note 2.2 of the interim consolidated accounts published in July 2017.
12
JANUARY - SEPTEMBER 2017. FERROVIAL, S.A. AND SUBSIDIARIES
CONSOLIDATED PROFIT AND LOSS ACCOUNT
(EUR million)
Before Fair value Adjustments
Fair value Adjustments
sep-17 Before Fair value
Adjustments Fair value
Adjustments sep-16
Revenues 9,194 9,194 7,697 7,697 Other income 4 4 4 4 Total income 9,198 9,198 7,701 7,701 COGS 8,487 8,487 7,051 7,051 EBITDA 711 711 650 650 EBITDA margin 7.7% 7.7% 8.4% 8.4% Period depreciation 295 295 224 224 EBIT (ex disposals & impairments) 416 416 425 425 EBIT (ex disposals & impairments) margin 4.5% 4.5% 5.5% 5.5% Disposals & impairments 47 7 54 279 -21 258 EBIT 462 7 470 705 -21 684 EBIT margin 5.0% 5.1% 9.2% 8.9% FINANCIAL RESULTS -264 36 -228 -274 -9 -284 Financial result from financings of infrastructures projects -194 -194 -238 -238 Derivatives, other fair value adjustments & other financial result
-5 -5 -6 -9 -15
Financial result from ex infra projects -24 -24 -34 -34 Derivatives, other fair value adjustments & other ex infra projects -41 36 -5 3 0 3 Equity-accounted affiliates 167 55 222 164 -107 56 EBT 365 98 464 594 -138 457 Corporate income tax -45 3 -42 -183 8 -175 NET INCOME FROM CONTINUED OPERATIONS 320 102 422 411 -130 282 Net income from discontinued operations CONSOLIDATED NET INCOME 320 102 422 411 -130 282 Minorities -34 0 -35 -4 1 -3 NET INCOME ATTRIBUTED 286 101 387 407 -128 279
13

JANUARY - SEPTEMBER 2017. FERROVIAL, S.A. AND SUBSIDIARIES
REVENUES (EUR million) sep-17 sep-16 Var. Like-for-Like Toll Roads 339 361 -6.3% 11.8% Airports 6 3 119.1% -65.9% Construction 3,394 3,033 11.9% 11.9% Services 5,430 4,314 25.9% 4.1% Others 26 -15 n.a n.a Total 9,194 7,697 19.5% 8.6%
EBITDA (EUR million) sep-17 sep-16 Var. Like-for-Like Toll Roads 239 228 5.1% 20.6% Airports -11 -14 22.4% -5.8% Construction 164 226 -27.3% -27.7% Services 309 209 48.0% 7.8% Others 10 1 n.a. n.a. Total 711 650 9.5% 0.0%
DEPRECIATION Depreciation increased +31.8% (or +13.1% LfL) to EUR295mn.
EBIT (before impairments and disposals of fixed assets)
(EUR million) sep-17 sep-16 Var. Like-for-Like Toll Roads 184 170 8.2% 19.2% Airports -12 -14 11.9% -5.8% Construction 135 205 -34.2% -34.5% Services 102 66 54.3% 13.2% Others 7 -1 n.a. n.a. Total 416 425 -2.3% -5.2%
For the purposes of analysis, all comments regarding EBIT are before impairments and fixed asset disposals.
DISPOSALS & IMPAIRMENTS Impairments and disposals of fixed assets amounted to +EUR54mn at end-September 2017, accounted for by the additional impairment ap-plied to Autema (-EUR27mn) and the capital gains on the sale of Norte Litoral (+EUR48mn) and Algarve (+EUR42mn). This figure stood at +EUR258mn for the same period in 2016, as it was affected by the capi-tal gains relating to the divestments in Chicago Skyway and Irish toll roads.
FINANCIAL RESULTS
(EUR million) sep-17 sep-16 Var. Infrastructure projects -194 -238 18.2% Ex infra projects -24 -34 28.9% Net financial result (financing) -218 -271 19.6% Infrastructure projects -5 -15 66.3% Ex infra projects -5 3 -242.1% Derivatives, other fair value adj & other financial result
-10 -12 17.8%
Financial Result -228 -284 19.5%
Financial expenses in 9M 2017 were less than the corresponding period in 2016, as a combination of the following impacts:
Financing result: EUR53mn drop in expenses to -EUR218mn. The change compared with 9M 2016 was primarily due to changes in the consolidation perimeter in the infrastructure projects: Deconsolidated assets in 2016: - Deconsolidation of Chicago Skyway (2 months’ contribution in
2016, which generated EUR20mn in costs). - Deconsolidation of the SH-130 toll road (deconsolidated at the
close of 2016, contributed EUR12mn in costs in 9M 2016). - Deconsolidation of debt in Irish toll roads (2 months’ global con-
solidation in 2016, generating EUR3mn in costs). Deconsolidated assets in 2017: - Deconsolidation of debt in Norte Litoral (4 months’ global con-
solidation in 2017 vs. 9 months contribution to September 2016, generating EUR4mn in financial expenses).
Result from derivatives and others: EUR2mn drop in financial ex-
penses to -EUR10mn in 9M 2017 vs. –EUR12mn in financial expenses in 9M 2016, comprised of: - As regards infrastructure projects, EUR10mn less in financial ex-
penses due mainly to the extraordinary negative impact caused in 9M 2016 by the removal of the Ausol derivative, due to the re-financing carried out in respect of this asset.
- In the non-project-related category, -EUR5mn in costs, mainly resulting from financial restructuring processes, among which the cancellation of Broadspectrum high bond yield stands out (8.375% annual interest cost). After the restructuring process, the average cost of debt of Broadspectrum stays below 6%.
EQUITY-ACCOUNTED RESULTS
(EUR million) sep-17 sep-16 Var. Toll Roads 106 79 35.2% Airports 98 -43 -8.9% Construction -1 0 -167.5% Services 19 21 -8.9% Total 222 56 n.s.
At net profit level, equity-accounted consolidated assets contributed EUR222mn after tax (against EUR56mn in the same period of 2016).
This improvement was due to the recovery of Heathrow’s contribution (+EUR96mn as compared with -EUR56mn in 9M 2016 due to the nega-tive impact of the fair value of the hedging instruments last year) and the positive performance of Toll Roads (net profit at 407ETR rose by +29.2%). AGS’s contribution decreased compared to 9M 2016 (EUR1mn vs. EUR13mn in 9M 2016), mainly due to the positive one-off with no cash impact in 2016 from the change in the pension plan conditions (EUR8mn) and the 200bps decrease in tax rate to 17% (EUR6mn) .
TAXES
Company tax for the first nine months of the year amounted to -EUR42mn compared with -EUR175mn at the close of 9M 2016, the latter having been impacted principally by the capital gains obtained from the divestment of Chicago and the Irish toll roads.
14

JANUARY - SEPTEMBER 2017. FERROVIAL, S.A. AND SUBSIDIARIES
There are also a series of impacts that one must take into consideration when calculating the effective corporation tax rate; the most relevant being:
Impact of the results of companies accounted for using the equity method which, pursuant to accounting legislation, are presented net of the related tax effect, in the amount of EUR222mn.
Capital gain from the sale of Portuguese toll roads, of which EUR91mn does not generate any cost with regard to Company Tax.
Losses at companies in the USA, consolidated by global integration, where the tax credit is exclusively recognised as the percentage stake when paying tax under a fiscal transparency regime, which gener-ates an adjustment of –EUR12mn, corresponding to tax credits as-signed to the remaining partners).
Following adjustment for these three items, the pre-tax result would amount to EUR163mn. The effective tax rate after the aforementioned adjustments would therefore stand at 26%.
NET RESULT
Net profit stood at EUR387mn at end-September 2017 (EUR279mn at September 2016). Net profit for 9M 2017 includes a series of extraordinary impacts:
Fair value adjustments for derivatives: +EUR75mn (this item resulted in a negative impact of –EUR113mn in 9M 2017), mainly impacted by the HAH derivatives as previously mentioned.
Capital gain after tax on the sale of Norte Litoral and Algarve: +EUR98mn (+EUR129mn was earned during the same period in 2016 from the sale of the Chicago and Irish toll roads).
Impairment at Autema: -EUR20mn (-EUR18mn in 9M 2016).
NET DEBT AND CORPORATE CREDIT RATING NET DEBT
The net cash position, excluding infrastructure projects, stood at EUR268mn at 30 September 2017 vs. EUR697mn in December 2016.
The main drivers of this change in the net cash position ex-infrastructure projects included the following:
Dividends received from projects (+EUR366mn): this figure is a +11.7% increase compared to the dividends received in 9M 2016 (EUR327mn). Notable was the contribution of EUR143mn made by Airports (as compared with EUR92mn in 9M 2016), affected mainly by the extraordinary dividend paid out by AGS following its refinanc-ing (AGS’s total contribution amounted to EUR64mn, of which EUR44mn was an extraordinary amount).
Cash flow from divestments amounting to +EUR233mn, of which EUR59mn equates to the sale of a stake in Budimex (sale of 1 million shares equivalent to a holding of 3.9%) and EUR104mn obtained after the sale of 51% of Norte Litoral and EUR58mn for the sale of 49% of Algarve.
Working capital consumption EUR200mn higher than in 9M 2016.
Total investments in the amount of -EUR288mn. Ferrovial shareholder remuneration amounting to -EUR313mn.
In addition, the payment to minorities in subsidiaries amounted to -EUR47mn.
Net project debt stood at EUR4,764mn (EUR4,963mn in December 2016). This net debt includes EUR764mn that relates to toll roads under construction (NTE 35W and I-77). The Group’s consolidated net debt at 30 September 2017 stood at EUR4,495mn (compared with EUR4,266mn in December 2016).
(EUR million) sep-17 dic-16 NCP ex-infrastructures projects 268 697
Toll roads -4,244 -4,426 Others -520 -537
NCP infrastructures projects -4,764 -4,963 Total Net Cash Position -4,495 -4,266
(EUR million) sep-17 dic-16 Gross financial debt -8,385 -8,093
Gross debt ex-infrastructure -2,983 -2,584 Gross debt infrastructure -5,402 -5,510
Gross Cash 3,890 3,827 Gross cash ex-infrastructure 3,268 3,301 Gross cash infrastructure 622 526
Total net financial position -4,495 -4,266
CORPORATE CREDIT RATING
Agency Rating Outlook S&P BBB Stable Fitch Ratings BBB Stable
EX-PROJECT DEBT MATURITIES
Year Corporate debt maturity 2017 7 2018 537 2019 76 2020 5 2021 - 2030 2.272 2031 - 2040 7 2041 - 2050 8
15

JANUARY - SEPTEMBER 2017. FERROVIAL, S.A. AND SUBSIDIARIES
SHAREHOLDER REMUNERATION 2016 - 2017 DIVIDEND
The company held its AGM on 5 April 2017. The AGM approved two capi-tal increases, by means of the issuance of new ordinary shares, with no issue premium, of the same class and series as those at present in circu-lation, charged to reserves.
These increases form part of the shareholder remuneration system known as the “Ferrovial Scrip Dividend”, which the company introduced in 2014, and which will replace the traditional complementary dividend payment for 2016 and the 2017 interim dividend.
The purpose of this programme is to offer to all the company’s share-holders the option, at their choice, of receiving free new shares in the Company, though without altering the company’s policy of paying its shareholders in cash, as they can alternatively opt to receive a cash pay-ment by means of selling the free rights that they receive against the shares they already own to the company (or selling them in the market).
The first of the scrip issues of this year (equivalent to the 2016 com-plementary dividend) took place in May 2017, with the following result:
Scrip Dividend Details May-17 Guaranteed set price to purchase rights 0.315 Number of rights to receive per new share 61 % of shareholders that chose shares as dividend 58.05% % of shareholders chose cash as dividend 41.95% Number of new shares issued 6,971,168 Number of rights purchased 307,307,195
At the Board Meeting on 24 October 2017, the terms of the second scrip issue were fixed (equivalent to the 2017 dividend on account). Subse-quently, and by means of filing a Significant Event, Ferrovial announced the fixed price at which it guarantees to buy the rights (EUR0.404 per right), the number of free rights required to receive one new share (45 rights) and the timetable for the transaction.
SHARE BUY-BACK AND CANCELLATION The AGM held on 5 April also approved a share capital reduction through the acquisition and subsequent cancellation of the company’s own shares. The aim of the programme was to contribute to the company’s shareholder remuneration policy by means of increasing earnings per share.
The above-mentioned share buy-back programme has a ceiling of EUR275mn, or 19 million shares. On the back of said agreement, in the first nine months of 2017 the number of shares bought-back reached 11,540,565. In addition to the above plan to buy back the company’s own shares, at end-September 2017, Ferrovial held 2,406,950 shares (acquired in 2016), and these are due to be amortized over the course of 2017.
Ferrovial’s share capital figure as of 30 September 2017 amounted to EUR147,903,928.40, all fully subscribed and paid up. The share capital comprises 739,519,642 ordinary shares of one single class, each with a par value of twenty euro cents (EUR0.20).
SHAREHOLDER STRUCTURE Significant holdings in the share capital of Ferrovial S.A., as detailed by the Spanish Stock Market Commission (CNMV):
Rijn Capital BV, (a company controlled by Rafael del Pino y Calvo-Sotelo): 20.1%
Menosmares, S.L.U., (a company controlled by María del Pino y Calvo-Sotelo): 8.1%
Siemprelara S.L.U., (a company controlled by Leopoldo del Pino y Calvo-Sotelo): 5.0%
Soziancor, S.L.U., (company controlled by Joaquin del Pino y Calvo-Sotelo): 2.6%.
On 22 March 2017, Blackrock notified the CNMV that it had changed its stake in Ferrovial S.A, which at the time of this report’s publication stands at 3.104%.
APPENDIX I: EXCHANGE-RATE MOVEMENTS Exchange rates expressed in units of currency per Euro, with negative variations representing euro depreciation and positive variations euro appreciation.
Exchange-rate Last (Balance sheet) Change 17/16 Exchange-rate Mean (P&L) Change 17/16 GBP 0.8812 1.80% 0.8727 7.93% US Dollar 1.1803 5.12% 1.1237 0.84% Canadian Dollar 1.4735 0.06% 1.4626 -0.26% Polish Zloty 4.3119 0.33% 4.2583 -2.14% Australian Dollar 1.5054 2.74% 1.4604 -2.55%
16

JANUARY - SEPTEMBER 2017. FERROVIAL, S.A. AND SUBSIDIARIES
APPENDIX II: SIGNIFICANT EVENTS 9M 2017 Ferrovial successfully completes a bond issue worth EUR500mn,
maturing on 31 March 2025. (22 March 2017)
Ferrovial Emisiones, S.A., a subsidiary of Ferrovial, has successfully completed the pricing of a EUR500mn bond issue maturing on 31 March 2025, guaranteed by Ferrovial. The bonds will give a coupon of 1.375% per year, payable on an annual basis. The price has been fixed at 99.295% of the nominal value of the bonds. The close and payment of the issuance was on 29 March 2017, pending the normal pre-conditions for this type of issuance.
Ferrovial expects to receive net proceeds of approximately EUR494mn, to be applied to general corporate needs.
Ferrovial communicates the resolutions of the 2017 AGM. (05 April 2017)
Ferrovial agrees a scrip issue charged to reserves as a means of implementing the Ferrovial Flexible Dividend system of share-holder remuneration. (04 May 2017)
At the same time, Ferrovial agreed to carry out a buy-back pro-gramme to reduce the company’s capital by means of the cancella-tion of treasury stock, with the purpose of supporting the company’s
shareholder remuneration policy by means of increasing earnings per share.
Ferrovial held an Investor Day in London to provide information on Cintra (highway division), publishing a presentation of its plans for the company for the investors and analysts who at-tended the event. (25 May 2017)
Ferrovial announced the closure of the period for trading the free rights assigned corresponding to the scrip issue for the purposes of implementing the Ferrovial Flexible Dividend shareholder re-muneration system. (26 May 2017)
At the end of this period on 23 May 2017, the holders of 58.05% of the rights (total of 425,241,256 rights) opted to receive new Ferrovial shares. The definitive number of ordinary shares with nominal value of EUR0.20/share issued in the capital increase thus amounts to 6,971,168. The holders of 41.95% of the rights have sold their rights to Ferrovial, which acquired a total of 307,307,195 rights (EUR96,801,766.43). The capital increase was closed on 26 May 2017.
APPENDIX III: EVENTS AFTER 9M 2017 CLOSEThe concession holder of the SH-130 toll road (USA), segments 5 and 6, has filed an arbitration claim against the company owned by Ferrovial Agroman (50%), and against the participants as joint guarantors. The arbitration claim relates to the contract for the design and construction of the SH-130 toll road signed in 2007, where construction works were completed in 2012. The concession holder claims that there were failings and defects during the construction, that it values at no less than USD130mn in total. The arbitration proceedings will be heard in accordance with International Chamber of Commerce rules. The construction company has stated on numerous occasions to the concession holder that it is not responsible for damage suffered by the toll road and that the failings are due to reasons beyond their control.
APPENDIX IV: ALTERNATIVE PERFORMANCE MEASURES The company presents its results in accordance with generally accepted accounting standards (IFRS). In addition, in the Financial Report released in September, the Management provides other financial measures that are not regulated under the IFRS, known as APMs (Alternative Performance Measures), in accordance with the Guidelines issued by the European Securities and Markets Authority (ESMA). The Management uses these APMs when taking decisions and evaluating the company’s performance. The following are the breakdowns required by the ESMA for each APM in respect of their definition and reconciliation, an explanation of their use and their comparison and consistency. More detailed information is provided on the corporate web page: http://www.ferrovial.com/es/accionistas-e-inversores/informacion-financiera/informacion-financiera-trimestral/
EBITDA = GROSS OPERATING RESULT
Definition: operating result before charges for fixed asset deprecia-tion.
Reconciliation: the company presents its EBITDA figure in its Con-solidated Profit and Loss Account (see the Consolidated Profit and Loss Account in the Interim Management Report and the Financial Report for September) as: Gross operating profit = Total Operating Revenues – Total Operating Expenses (excluding those relative to fixed assets depreciation and amortization which are reported in a separate line).
Explanation of use: EBITDA provides an analysis of the operating results excluding depreciation and amortization, as they are non-cash variables which can vary substantially from company to com-pany depending on accounting policies and the accounting value of the assets. EBITDA is the best approximation to pre-tax operating
cash flow and reflects cash generation before working capital varia-tion. One uses EBITDA as a starting point to calculate cash flow, add-ing the variation in working capital. Finally, it is an APM indicator which is widely used by investors when evaluating businesses (multi-ples valuation), as well as by rating agencies and creditors to evalu-ate the level of debt, comparing EBITDA with net debt.
Comparisons: the company presents comparisons with previous years.
Coherence: the criteria used to calculate EBITDA is the same as the previous year.
COMPARABLE ("LIKE-FOR-LIKE GROWTH")
Definition: relative year-on-year variation in comparable terms of the figures for revenues, EBITDA/EBIT, operating income and order
17
JANUARY - SEPTEMBER 2017. FERROVIAL, S.A. AND SUBSIDIARIES
book. The comparable is calculated by adjusting the present year and the previous one, in accordance with the following rules:
− Elimination of the exchange-rate effect, calculating the results of both periods at the rate in the current period.
− Elimination from the EBIT of both periods of the impact of fixed asset impairments and results from company disposals (corre-sponds with the figure reported in the line “Impairments and dis-posals of fixed assets”).
− In the case of company disposals and loss of control, the homog-enisation of the operating result is undertaken by eliminating the operating results of the sold company when the impact occurred in the previous year, or if it occurred in the year under analysis, considering the same amount of months in both periods.
− Elimination in both periods of restructuring costs.
− In acquisitions of new companies which are considered material, elimination in the current period of the operating results derived from those companies, except in the case where this elimination is not possible due to the high level of integration with other re-porting units (material companies are those where revenues represent ≥5% of the reporting unit’s revenues before the acqui-sition).
− Elimination in both periods of other non-recurrent impacts (mainly related to tax and human resources) considered relevant for a better understanding of the company’s underlying results.
− Note: the new contracts in the Toll Roads division coming into operation are not considered acquisitions and thus are not ad-justed in the comparable.
Reconciliation: comparable growth is set out in separate columns in the section headed Business Performance, under the heading Principal Amounts of the September Financial Report.
Explanation of use: Ferrovial uses the comparable to provide a more homogenous measure of the underlying profitability of its businesses, excluding those non recurrent elements which would in-duce a misinterpretation of the reported growth, impacts such as ex-change-rate movements or changes in the consolidation perimeter which distort the comparability of the information. Additionally, it also allows the Company to present homogenous information, thus ensuring its uniformity, providing a better understanding of the per-formance of each of its businesses.
Comparisons: the comparable breakdown is only shown for the cur-rent period compared with the previous period.
Coherence: the criteria used to calculate the comparable is the same as the previous year.
FAIR VALUE ADJUSTMENTS
Definition: the adjustments to the Consolidated P&L relative to pre-vious results derived from: changes in the fair value of derivatives and other financial assets and liabilities; asset impairment and the impact of the two above elements in the ‘equity-accounted results’.
Reconciliation: a detailed breakdown of the Adjustments for Fair Value is included in the Consolidated Profit and Loss Account (see the Consolidated Profit and Loss Account in the September Financial Report).
Explanation of use: the Fair Value Adjustments can be useful for investors and financial analysts when evaluating the underlying profitability of the company, as they can exclude elements that do
not generate cash and which can vary substantially from one year to another due to the accounting methodology used to calculate the fair value.
Comparisons: the company presents comparisons with previous years.
Coherence: the criteria used to calculate the Fair Value Adjust-ments is the same as last year.
NET CONSOLIDATED DEBT
Definition: this is the net total of Cash and cash equivalents (includ-ing cash that is restricted in the short and medium term), minus short- and long-term financial debts (bank borrowing and bonds), including the balance relating to exchange rate derivatives that cover both the issue of debt in currency other than the currency used by the issuing company and cash positions that are exposed to ex-change rate risk.
Reconciliation: a detailed breakdown of the reconciliation of this figure is given in the section headed Net Debt and Corporate Rating in the September Financial Report.
Explanation of use: this is a financial indicator used by investors, fi-nancial analysts, rating agencies, creditors and other parties to de-termine the company’s debt position. In addition, Ferrovial breaks down its net debt into two categories:
− Debt Net of Infrastructure Projects. This is the ring-fenced debt which has no recourse to the shareholder or with recourse lim-ited to the guarantees issued. This is the debt that corresponds to companies classified as Project companies.
− Net debt ex-Projects. This is the net debt from all other business areas, including holding companies in the Group and all the other businesses not classified as Project companies. The debt included in this calculation is mainly with recourse, and is thus the measure used by investors, financial analysts and rating agencies to assess the company’s leverage, financial strength, flexibility and risks.
Comparisons: the company presents comparisons with previous years.
Coherence: the criteria used to calculate the net debt is the same as last year.
ORDER BOOK
Definition: the revenues pending execution, which correspond to contracts which the Company has signed up to a certain date, and over which it has certainty on its future execution. The total revenues of a contract correspond to the price agreed or fee which correspond to the goods delivery and/or provision of services which have been agreed. If the implementation of a contract has its financing still pending, the revenues of said contract will not be added to the order book until the financing has been completed. The order book is cal-culated by adding the contracts of the current year to the balance of the contract order book of the previous year, then eliminating the revenues which have already been recognised in the current year.
Reconciliation: the order book is entered under Principal amounts in the Services and Construction Section in the Financial Report for September. There is no comparable measure in IFRS. Hence we do
18

JANUARY - SEPTEMBER 2017. FERROVIAL, S.A. AND SUBSIDIARIES
not provide a reconciliation of the order book with the financial statements.
Explanation of use: Management believes the order book is a useful indicator with respect to the Company’s future revenues.
Comparisons: the company presents comparisons with previous years.
Coherence: the criteria used to calculate the order book is the same as last year.
19