Embed Size (px)
Citation preview

IG Group Holdings plc H1 FY18 Results
RESULTS PRESENTATIONHalf Year Ended 30th November 2017

IG Group Holdings plc H1 FY18 Results
DISCLAIMER
2
This presentation, prepared by IG Group Holdings plc (the “Company”), may contain forward-looking statements about
the Company. Forward-looking statements involve known and unknown risks and uncertainties because they are beyond
the Company’s control and are based on current beliefs and expectations about future events, including the results of
operations, financial condition, liquidity, prospects, growth, strategies and dividend policy of the Company and the
industry in which it operates.
No assurance can be given that such future results will be achieved; actual events or results may differ materially as a
result of risks and uncertainties facing the Company. If the assumptions on which the Company bases its forward-
looking statements change, actual results may differ from those expressed in such statements. Forward-looking
statements speak only as of the date they are made and the Company undertakes no obligation to update these
forward-looking statements. Nothing in this presentation should be construed as a profit forecast.
Some numbers and period on period percentages in this presentation have been rounded or adjusted to ensure
consistency with the financial statements. This may lead to differences between subtotals and the sum of individual
numbers as presented.
Unless otherwise stated all results for FY15 are on underlying basis and the term ‘underlying’ reflects the results before
the impact of the Swiss franc event (Jan 2015).
FY18 relates to the financial year ending 31st May 2018, FY17 relates to the financial year ending 31st May 2017. H1
FY18 refers to half year ending 30th November 2017, H1 FY17 refers to half year ending 30th November 2016.

IG Group Holdings plc H1 FY18 Results
OVER 40 YEARS OF SUCCESS
Empower informed, decisive, adventurous people to access opportunities in the financial markets
3
IG CREATED THIS INDUSTRY WITH INNOVATION AT ITS CORE
IG has always targeted the financially sophisticated trader
The success of online advertising changed the accessible market and created new problems in the industry,
which the regulators are now looking to address
With a history of technological advancement and adaptation IG will continue to grow following this period of
regulatory change
IG’s client base is dominated by the sophisticated trader and this will remain the case in future
IG was founded
offering a contract on
the price of gold
Phone and software system
introduced to enable trades
to be entered straight on to
the computer system
First company in the
sector to launch an
online dealing platform
Launched first mobile
trading app with live
price streaming
Close Out Monitor (COM)
and tiered margining
developed following the
credit crunch
Launched browser based
platform, the first with no
plug-in requirement
1974
1991
1998
2003
2007
2010
2013
2017
First offered Bitcoin, now
one of six cryptocurrency
markets at IG
Rolled out IG Smart
Portfolio

IG Group Holdings plc H1 FY18 Results
FINANCIAL PERFORMANCE
FINANCIAL POSITION
OUR CLIENTS
OPERATIONAL DEVELOPMENTS
FUTURE REGULATION
FUTURE GROWTH
AGENDA

IG Group Holdings plc H1 FY18 Results
FINANCIAL PERFORMANCE

IG Group Holdings plc H1 FY18 Results
FY18 H1 SUMMARY
Record revenue and profit before tax performance
6
Net trading revenue £268.4m, up 10% on H1 FY17
Operating expenses excluding variable remuneration £117.6m down 7%
PBT £136.2m, up 29% with margin at 50.7%, up 7.7% points
Own funds generated from operations £139.0m, up 38%
Diluted EPS 29.3p, up 30%
Interim dividend of 9.69p which represents 30% of the prior year’s total dividend
FY18 H1 RESULTS
0
10
20
30
40
FY14 FY15 FY16 FY17 FY18
5 YEAR REVENUE, EPS AND DIVIDEND - Underlying1
1. FY15 excludes impact of Swiss franc event
0
100
200
300
400
500
600
FY14 FY15 FY16 FY17 FY18
REVENUE (£m)
0
10
20
30
40
50
FY14 FY15 FY16 FY17 FY18
EARNINGS PER SHARE (p) DIVIDEND PER SHARE (p)
H1 H2 Interim FinalH1 H2

IG Group Holdings plc H1 FY18 Results
Good revenue growth, good cost management, good margin
7
Net trading revenue up 10%
Net operating income up 10%
– Interest on client funds of <30 bps on
average balances of c.£1.25bn
– Betting duty at 1% of revenue, below
historical average
– US lead generation revenue from
DailyFX in other operating income
Operating expenses down 4%
PBT margin 50.7%, up 7.7% points, from
43.0% in H1 FY17
Effective tax rate 20.6%
INCOME STATEMENT
FY17
£m
FY16
£m
Net trading revenue
Net interest on client funds
Betting duty & FTT
Other operating income
Net operating income
Operating expenses
Net finance expense
PBT
Taxation
PAT
Effective rate of tax
Diluted EPS
Dividend per share
268.4
1.8
(2.7)
1.5
269.0
(132.5)
(0.3)
136.2
(28.1)
108.1
20.6%
29.3p
9.69p
244.9
1.8
(3.7)
0.5
243.5
(137.9)
(0.4)
105.2
(21.9)
83.3
20.8%
22.6p
9.42p
10%
10%
4%
29%
30%
30%
FY18 H1
£m
FY17 H1
£m
Yr on Yr
%

IG Group Holdings plc H1 FY18 Results
REVENUE AND ACTIVE CLIENTS
8
REVENUE AND CLIENT TRENDS1
OTC LEVERAGED REVENUE by asset class
1. Active clients represents any client who generated revenue through OTC Leveraged
trading, or were holding a Share Dealing or Investments position at the end of the period.
Multi-product clients are included in both numbers, with the overlap removed as shown
H1 FY18 H1 FY17
UK
EMEA
APAC
OTC Leveraged Derivatives
US
Share Dealing & Investments
GROUP
1%
14%
19%
9%
16%
85%
10%
115.0
67.0
55.6
237.6
6.3
1.0
244.9
116.7
76.6
66.0
259.3
7.3
1.8
268.4
UK
EMEA
APAC
OTC Leveraged Derivatives
US
Share Dealing & Investments
Multi-product clients
GROUP Unique Active Clients
ACTIVE CLIENTS
(11%)
1%
(1%)
(5%)
13%
119%
60%
7%
47,239
36,010
30,010
113,259
14,785
29,093
(5,244)
151,893
52,965
35,828
30,314
119,107
13,045
13,302
(3,278)
142,176
REVENUE (£m) H1 FY18 H1 FY17 Yr on Yr
REVENUE PER CLIENT (£) H1 FY18 H1 FY17
UK
EMEA
APAC
OTC Leveraged Derivatives
US
Share Dealing & Investments
GROUP
14%
14%
20%
15%
3%
(15%)
3%
2,470
2,128
2,200
2,290
492
62
1,767
2,171
1,871
1,834
1,995
480
73
1,722
Yr on Yr
Yr on Yr
Equity indices
Shares16%
40%24%
12%
Forex
Commodities
Options
8%
9% 16%
46%
16%
13%
H1FY18
H1FY17
Significant increase in OTC Leveraged revenue per client
Revenue from Cryptocurrencies (included
within Forex above) represented 5% of OTC
Leveraged revenue in H1 FY18 (H1 FY17:
<0.5%)

IG Group Holdings plc H1 FY18 Results
Client retention is fundamental to our success
9
DRIVERS OF REVENUE
Existing clients = (£23.6m)
REVENUE BRIDGES (£m)
Existing clients not trading Existing clients trading more (less)
Returning clients New clients
H1 FY17 H2 FY17
Other
H1 FY18
(8.7)
(20.4) 5.5
23.0
244.9
246.2
1.9
12.9
(18.4)
5.8
246.2
268.4(0.1)
22.0
Existing clients = £0.3m

IG Group Holdings plc H1 FY18 Results
REVENUE OPTIMISATION
Business model results in low variability in revenue
10
1. Excluding impact of Swiss franc event (Jan 15)
2. Including impact of Swiss franc event (Jan 15)
REVENUE VARIABILITY1
REVENUE PERFORMANCE2
Daily revenue (60 day rolling average)
Coefficient of variability (60 day rolling average)
REVENUE (£m) COEFFICIENT
0.0
0.5
1.0
1.5
2.0
2.5
-
0.5
1.0
1.5
2.0
2.5
FY11 FY12 FY13 FY14 FY15 FY16 FY17
REVENUE (£m)
10
20
30
40
50
60
70
80
0
Monthly reported revenue
Client commission, spread and financing
Revenue if fully hedged
Internalisation benefit No loss making days since Aug 2015
FY17FY15 FY18FY16FY180 0
IG Group Holdings plc H1 FY18 Results
0
500
1,000
1,500
2,000
2,500
3,000
3,500
4,000
FY14 FY15 FY16
Months from client first trade
FY17 FY18
MARKETING EFFECTIVENESS
11
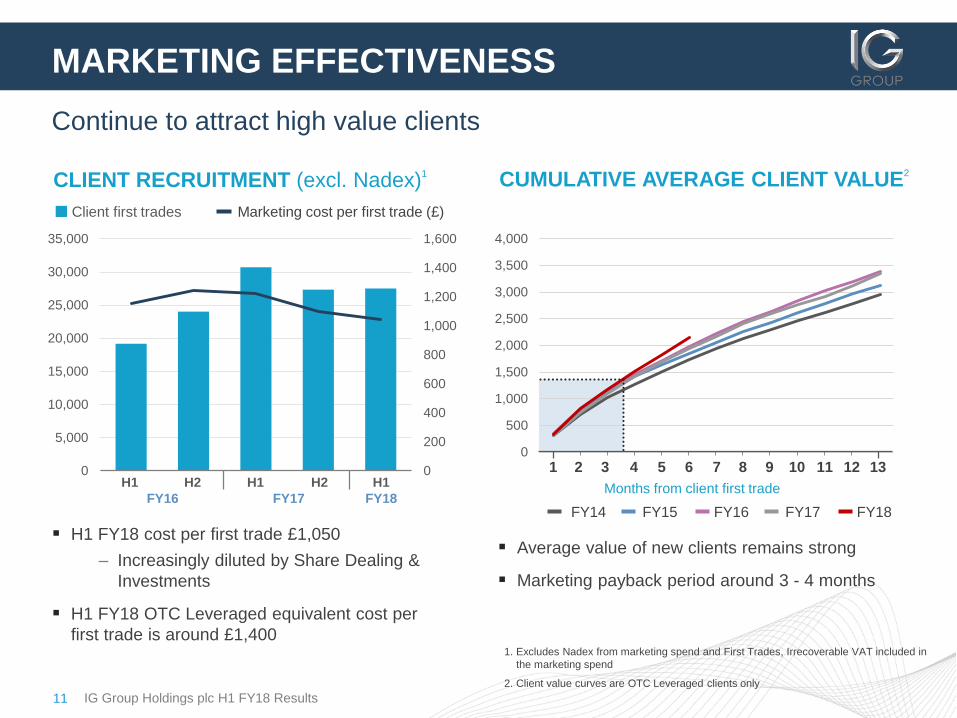
Continue to attract high value clients
CLIENT RECRUITMENT (excl. Nadex)1
H1 FY18 cost per first trade £1,050
– Increasingly diluted by Share Dealing &
Investments
H1 FY18 OTC Leveraged equivalent cost per
first trade is around £1,400
CUMULATIVE AVERAGE CLIENT VALUE2
Average value of new clients remains strong
Marketing payback period around 3 - 4 months
0
200
400
600
800
1,000
1,200
1,400
1,600
0
5,000
10,000
15,000
20,000
25,000
30,000
35,000
Client first trades Marketing cost per first trade (£)
H1 H2
FY16
H1 H2
FY17
H1
FY18
1 2 3 4 5 6 7 8 9 10 11 12
1. Excludes Nadex from marketing spend and First Trades, Irrecoverable VAT included in
the marketing spend
2. Client value curves are OTC Leveraged clients only
13

IG Group Holdings plc H1 FY18 Results
Good cost management in first half, no change to full year guidance
12
Increased headcount offset by lower
average cost per head
Advertising and marketing down 21%
– Reflects lower spend in Q1 YoY
– Q2 spend in line with Q2 last year
H2 costs will be higher than H1
– Regulatory fees
– Marketing
– Strategic initiatives
FY18 full year Operating expenses,
excluding variable remuneration, expected
to be similar to FY17
OPERATING EXPENSES
Fixed remuneration
Advertising and marketing
Other costs
Operating expenses
excl. variable remuneration
Variable remuneration
Total Operating expenses
0%
21%
2%
7%
(25%)
4%
(46.3)
(27.7)
(43.6)
(117.6)
(14.9)
(132.5)
FY17
£m
FY16
£m
H1 FY18
£m
H1 FY17
£m
Yr on Yr
%
(46.2)
(35.2)
(44.6)
(126.0)
(11.9)
(137.9)

IG Group Holdings plc H1 FY18 Results
FINANCIAL POSITION

IG Group Holdings plc H1 FY18 Results
OWN FUNDS
Good cash generation
14
MOVEMENT IN OWN FUNDSOWN FUNDS FLOW
FY17
£m
FY17
£m
FY16
£m
31 May 17
£m
31 May 16
£m
FY17
£m
FY16
£m
FY17
£m
FY16
£m
30 Nov 17
£m
30 Nov 16
£m
Operating profit
Depreciation and amortisation
Share based compensation
Change in working capital
Own funds generated
from operations
As % of Operating profit
Taxes paid
Net own funds generated from
operations
136.5
8.8
3.2
(9.5)
139.0
102%
(22.2)
116.8
105.6
7.5
4.5
(16.6)
101.0
96%
(23.0)
78.0
FY17
£m
FY17
£m
FY16
£m
30 Nov 17
£m
30 Nov 16
£m
Net own funds generated
from operations
Net financing
Investments
- Purchase of DailyFX
- Capital expenditure
- Purchase of own shares by EBT
Net own funds generated before
dividends
Dividends
Net own funds flow
Own funds at start of the year
Impact of movement
exchange rates
Own funds at end of period
116.8
-
(3.0)
(5.5)
(4.6)
103.7
(84.0)
19.7
614.3
(6.2)
627.8
78.0
0.2
(29.8)
(7.1)
(1.0)
40.3
(84.1)
(43.8)
587.7
9.1
553.0

IG Group Holdings plc H1 FY18 Results
BALANCE SHEET & LIQUIDITY
Strong financial position
15
Goodwill
Intangible assets
Property, plant and equipment
Fixed assets
Liquid asset buffer
Amounts at brokers
Cash in IG bank accounts
Own funds in client money
Liquid assets
Short term bank borrowing
Title Transfer funds
Client deposits at IG Bank SA
Own funds
Working capital
Tax payable
Deferred tax assets
Net assets / Shareholders’ funds
107.8
46.2
15.8
169.8
81.3
396.3
251.9
61.1
790.6
(50.0)
(69.1)
(43.7)
627.8
(36.9)
(18.5)
8.6
750.8
108.1
48.6
17.4
174.1
81.2
376.1
230.9
43.2
731.4
-
(60.0)
(57.1)
614.3
(49.1)
(13.1)
9.1
735.3
108.2
50.0
13.4
171.6
82.6
338.6
201.8
28.3
651.3
(50.0)
(28.6)
(19.7)
553.0
(39.1)
(12.2)
7.4
680.7
31 May 17
£m
30 Nov 16
£m
30 Nov 17
£m
Liquid assets
Broker margin requirement
Client deposits at IG Bank SA
Other non-UK liquid assets
Own funds in client money
Available liquidity at
end of period
of which is:
Held as liquid assets buffer
Interim dividend due
RCF Drawings
790.6
(370.7)
(43.7)
(105.8)
(61.1)
209.3
81.3
35.6
50.0
Committed RCF
Additional sources of liquidity
110.0
30 Nov 17
£m
AVAILABLE LIQUIDITYBALANCE SHEET
IG Group Holdings plc H1 FY18 Results
100
200
300
400
500
-
2,000
4,000
6,000
8,000
10,000
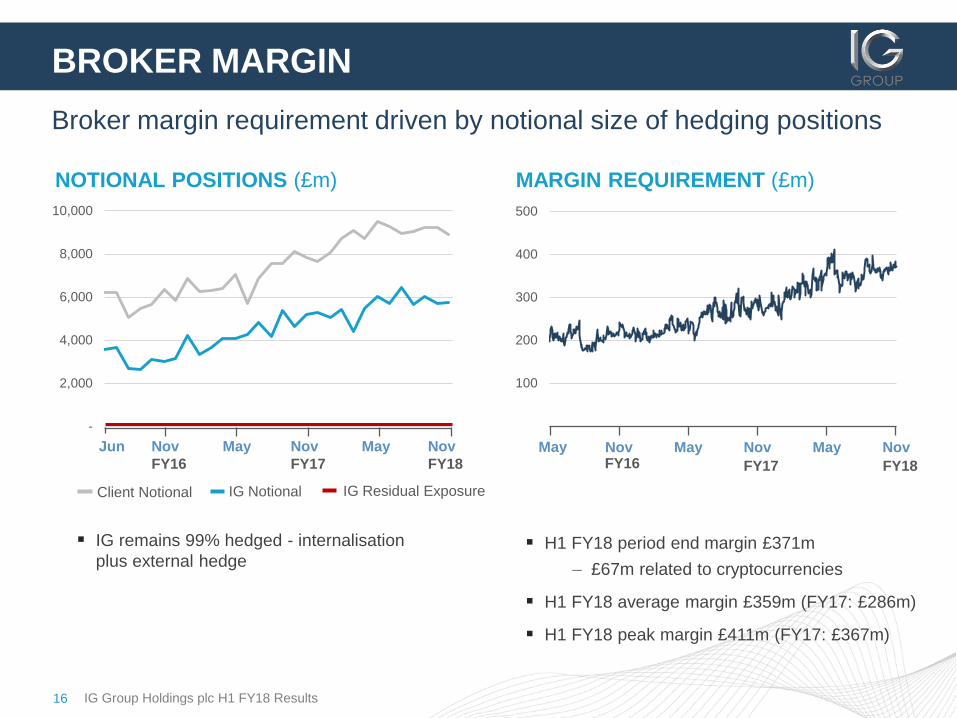
BROKER MARGIN
Broker margin requirement driven by notional size of hedging positions
16
NOTIONAL POSITIONS (£m)
IG remains 99% hedged - internalisation
plus external hedge H1 FY18 period end margin £371m
– £67m related to cryptocurrencies
H1 FY18 average margin £359m (FY17: £286m)
H1 FY18 peak margin £411m (FY17: £367m)
Client Notional IG Notional IG Residual Exposure
May Nov Nov
FY17FY16NovMay May
FY18
MARGIN REQUIREMENT (£m)
Jun Nov
FY16
Nov
FY18
Nov
FY17
MayMay

IG Group Holdings plc H1 FY18 Results
OUR CLIENTS

IG Group Holdings plc H1 FY18 Results
Client base is sophisticated and high value
18
50% revenue is generated by the most valuable c.2% of
clients, trading on average 3,800 times in H1 FY18
80% revenue is generated by the most valuable c.10%
of clients, trading on average 1,900 times in H1 FY18
These clients are all informed, decisive, adventurous,
prosperous individuals that fully understand our
products
They might be;
– A fund manager trading their own personal wealth
– An IT specialist who runs their own consultancy
– Self-made through property investments now
running a number of businesses and trading as
part of their daily routine
WHO ARE OUR CLIENTS
REVENUE FROM TRADING CLIENTS H1 FY181
< 2%8%
90%
Clients
50%
30%
Revenue
20%
1. OTC Leveraged Derivatives clients only

IG Group Holdings plc H1 FY18 Results
ESTABLISHED CLIENT BASE
19
Clients have typically traded with IG for over 3 years
CLIENT ATTRITION1
Underlying retention levels remain strong and in
line with historic cohorts
REVENUE BY CLIENT TENURE H1 FY181
FY15 FY17FY14 FY16
Months from client first trading
FY18
% of Revenue
10+ years
7 to 10 years
5 to 7 years
3 to 5 years
2 to 3 years
1 to 2 years
7 to 12 months
0 to 6 months
8%
18%
12%
12%
11%
19%
12%
8%
1. OTC Leveraged Derivatives clients only
50%
0%
20%
40%
60%
80%
100%
0 1 2 3 4 5 6 7 8 9 10 11 12

IG Group Holdings plc H1 FY18 Results
Retention and extension of our client relationships
20
Complementary products that expand IG’s
client offering
– Share Dealing & Investments
Aim to enhance the total value and extend the
lifespan of client relationships
Over 5,200 clients are now multi-product,
generating revenue from Leveraged trading
and holding stockbroking positions
Multi-product clients on average were 13%
more valuable than standard Leveraged
clients
BROAD PRODUCT OFFERING
MULTI-PRODUCT CLIENTS1
60%
72%
OTC Leveraged
Only
Multi- Product
£2,367
£2,681
H1 FY18 AVERAGE CLIENT VALUE1
OTC Leveraged
Only
Multi- Product
60%
72%
ACTIVE CLIENT RETENTION1,2
1. Cohort limited to clients from countries where IG offers Share Dealing & Investments products
2. The percentage of clients trading in H1 FY17 still trading in H1 FY18
IG Group Holdings plc H1 FY18 Results
Marketing is targeted and spend is discretionary
21
Define a clear target client for whose needs,
characteristics and objectives this financial
instrument is compatible
Our positive target market for a standard retail
account in the UK are clients who:
– Have previous experience trading derivatives
– Have sufficient levels of income and
investments
– Have a high risk appetite
– Are seeking to speculate on financial markets
or to hedge exposure held in other portfolios
IG will only accept clients who meet our
appropriateness and wealth criteria, in line with our
intended target market
CLIENT ACQUISITION
ONLINE MARKETING
Bid on key terms that associate positively
with this target market
Marketing spend is driven by in house
algorithms that are continually refined to
improve effectiveness
Ability to flex marketing spend according
to market conditions
Employ specialised onboarding teams to
assist clients through the application
process
TARGET MARKET

IG Group Holdings plc H1 FY18 Results
OPERATIONAL
DEVELOPMENTS

IG Group Holdings plc H1 FY18 Results23
Professional accounts provide the highest value and lowest regulatory concern
1. The images above are diagrammatical with the circle sizes showing approximate value to the company now and in the future for the EU & UK. Not to scale
ACCOUNT TYPES IN UK & EU
Accounts
Regulatory concern
Standard Retail
Account
LR Account
ProAccount
FUTURE1
NOW1
Accounts
ProAccount
LR Account
Historically the majority of IG’s clients and
revenue have come from accounts classified
as standard retail
With regulatory changes clients are now
migrating towards 2 account types
– Limited Risk
– Professional
Regulatory concern
The number of professional accounts will increase
and we believe the category will become the
largest revenue generator for the Group
Limited Risk accounts will increase in value as all
clients who do not elect to become professional
will need to migrate to a Limited Risk account

IG Group Holdings plc H1 FY18 Results
Growing professional categorisation
24
No current regulatory advantage for a client to
elect to be categorised as professional
In November an online process was rolled out to
enable clients who qualified to elect to become
professional
Prior to this, approximately 5% of IG’s UK and EU
revenue was generated by clients classified as
professional
– Clients categorised as professional on the
19th January generated over 25% of UK and
EU revenue over the previous 3 months
If leverage restrictions are implemented as
proposed we are on track for well over 50% of
revenues to be generated from professional clients
PROFESSIONAL CATEGORISATION IN UK & EU
UK & EU REVENUE1
HIGHER VALUE, LOWER RISK1
We have rejected over 50% of requests to
become professional to date
Just over 2,400 clients are categorised as
professional today
% Professional
1 Nov
2017
% Other
5%
95%
1. All figures in this slide refer to OTC Leveraged Derivatives EU and UK clients / revenues generated 3 months to December 2017
19 Jan
2018
<75%
>25%

IG Group Holdings plc H1 FY18 Results
LIMITED RISK ACCOUNTS AND ONBOARDING
It’s the right thing to do
25
2. BaFIN effective from August 2017
1. Limited Risk accounts include no negative accounts and those that limit the downside risk per trade plus provide a guaranteed no negative balance on the account
56% of new Leveraged first trades are now
Limited Risk
Excluding the US, 42% of first trades in H1
FY18 were Limited Risk
Limited Risk accounts are now the standard in
France and Germany2
– Both delivered good growth in the period
LIMITED RISK ACCOUNTS1
70%
30%
75%
25%
89%
11%69%
66%
34%
69%
31%
88%
12%100%
Implemented in June
Hard stop on appropriateness
Savings and income combination must meet pre-
determined criteria
– Non Leveraged accounts have lowest
requirements
– Standard retail account has highest
requirements
Reduced marketing spend initially to allow in house
algorithms to be optimised
Initial indications suggest new clients in the period
are more valuable than the prior period
APPROPRIATENESS & WEALTH HURDLES
Limited Risk Account
UK EMEA US
Standard Account
APAC
54%
46%
46%
54%
78%
22% 100%

IG Group Holdings plc H1 FY18 Results
REVIEW OF PARTNERS
Ensuring good client and market outcomes
26
Extensive technology programme to prepare
for MiFID II in excess of 10 man years
Wide ranging changes to reporting
requirements to deliver increased
transparency to clients
– Provision of data on product behaviour
– Transparency on risk
– Transparency on costs and charges
– Increase in transaction reporting from
24 to 65 fields
– Collection of NI and LEI identifiers
required for every individual and
corporate client respectively
MIFID AND PARTNER RELATIONSHIPS
IG requires that its partners offer the same quality
outcomes as IG
Reviewed all UK and EU relationships
– Global review to follow
Identified less than 25 UK and EU relationships that
met stringent new criteria and will be maintained
Partners must;
– Be committed to providing good client outcomes
– Have transparent and appropriate fee structures
– Be of sufficient scale
Every partner relationship will be closely monitored by
IG’s compliance team
PREPARATION FOR MIFID II

IG Group Holdings plc H1 FY18 Results
FUTURE REGULATION

IG Group Holdings plc H1 FY18 Results
We are closer to regulatory certainty
28
Following ESMA and FCA statements on December 18th and a “call for evidence” from ESMA on
January 18th we have clearer proposals and timings
Themes remain
Disproportionate leverage restrictions by asset class
Suitability of binary product
No negative balance protection by account
Automated margin close out from 50% of initial margin
ESMA are specifically looking at how cryptocurrencies fit within the MiFID framework and how best
to protect retail clients that trade this product
Standardised risk warning
Restriction on the offering of trading incentives
The call for evidence closes on 5th February 2018
IG will work determinedly to try to ensure regulators identify the best measures to achieve their aim of
improving client outcomes
EU AND UK REGULATION
OUR VIEW
X

IG Group Holdings plc H1 FY18 Results
0
200
400
600
800
1,000
1,200
1,400
1,600
Potential
Regulation
Mitigating
Action Potential Client Action
Leverage
limits
Live process
to enable
clients to
request
professional
categorisation
• Elect to be categorised as
professional
• Trade with less headroom
• Increase funding and trade as before
• Trade with an offshore entity
• Trade alternative products
• Trade less frequently or in smaller
size
Ban on
binaries
trading
Live process
to enable
clients to
request
professional
categorisation
• Elect to be categorised as
professional
• Trade with an offshore entity
• Trade alternative products
• Stop trading
Negative
balance
protection
Limited Risk
Account
• Elect to be categorised as
professional
• Trade with Limited Risk account and
utilise protections
• Trade with an offshore entity
• Trade alternative products
RESPONSES TO REGULATION
Retail clients affected by changes can take action
29
Impact
Margin requirement: Other assets
Margin requirement: Equities
CLIENT DEPOSITS (£m)
IG’s clients typically have significant
excess margin on their account
Client deposits and
Title Transfer
2015 2016 2017

IG Group Holdings plc H1 FY18 Results
Our clients have significant concerns
30
Clients have the power to respond to ESMA’s
‘Call for Evidence’
We have received over 2,000 responses to date
Responses are consistently negative
We are committed to giving our clients a voice
www.replytoesma.trading
RESPONSES TO REGULATION: CLIENTS
“The proposed measures will adversely affect
the business of reputable, honest and highly
professional providers …and drive many smaller
traders into the hands of unregulated and
unscrupulous operators.…. Again, the effects
may be precisely the opposite of those
intended.”
“These new measures are wholly
unnecessary. I have been a trader for over a
decade. Retail accounts such as those with IG
… offer an effective use of capital. I am fully
aware of the risks involved in speculation.
That is my responsibility.”
“These proposals are totally disproportionate to
the risk involved. This would severely restrict my
trading…. Whilst I understand the need to
protect investors, experienced traders like myself
are being unduly penalised by these proposals.”

IG Group Holdings plc H1 FY18 Results
FUTURE GROWTH

IG Group Holdings plc H1 FY18 Results32
Developing Multi-lateral Trading Facility (MTF) to
address the significant EU market in on exchange
Leveraged trading
On exchange market in Europe is significantly larger
than OTC providing an opportunity to appeal to a
wider client base
Product will be Limited Risk with a mandated
guaranteed stop
PRODUCT AND REGIONAL DEVELOPMENT
New development in Germany
EU SUBSIDIARY
Applying for BaFIN licence
Utilise existing base in Dusseldorf
Expand local team to include key
management, control and oversight
functions
Will serve as a regional hub for the EU
Completion in the next financial year
MTF
Total EU
Leverage Market
Total EU
CFD Market
IG’s
EU Share
EU MARKET (excl UK)

IG Group Holdings plc H1 FY18 Results
Application filed for US retail FX dealer licence
33
CEO has been appointed internally and recruitment for other key roles has begun
Consider the US margin FX market to be currently underserved following the exit of the largest competitor
Currently 85,000 active forex traders and approximately 25,000 new traders per year1, with only three
significant providers
Opportunity to build IG brand in the US in addition to Nadex
Utilise reach of DailyFX which achieves over one million unique visitors per month, of which c.18% are from
the US
– US visitors that convert into leads will go directly to IG’s US business once live
OPPORTUNITY IN THE US
1. Investment Trends US FX Report, released September 2017

IG Group Holdings plc H1 FY18 Results
Allocating resource to growth areas
34
Identify countries where opportunity is expanding and focus resources accordingly
Resulting in increased marketing allocation to APAC which is delivering consistent growth in revenue
Revenue in EMEA non-EU is growing well and contributing an increasing amount to Group performance
OPPORTUNITIES OUTSIDE THE EU
OTC LEVERAGED REVENUE OUTSIDE
UK & EU (£m)
30%
38%43%
33%30%
37%34% 29%
32% 33%
11%10% 9%
9% 9%
22% 18% 26% 28%
0%
20%
40%
60%
80%
100%20%
EVOLVING MARKETING FOCUS
APAC EMEA non-EU
20%
H1 H2FY15
H1 H2FY16
H1 H2FY17
H1FY18
0
20
40
60
80
100
USUK EMEA EU APACEMEA non-EU
H1 H2FY16
H1 H2FY17
H1FY18

IG Group Holdings plc H1 FY18 Results
Strong platform for growth
35
Record revenues and profit in H1 FY18
Active positioning for regulatory change
– If ESMA proposals had been in place in the previous financial year, we estimate a reduction in
revenue of less than 10%
Strong start to second half
– Operating costs to be higher in H2
Growth opportunities continue to exist outside of EU
Delivered a sustainable business for 40 years by placing good client outcomes at the heart of
everything we do
We will lead the way
CONCLUSION

IG Group Holdings plc H1 FY18 Results
APPENDICES

IG Group Holdings plc H1 FY18 Results
Leverage limits from ESMA Call for evidence – 18th January 2018
Leverage limits on the opening of a position by a retail client. The contemplated leverage limits would apply to
any payment made to a product provider for the purpose of entering into a CFD, excluding commission and
transaction fees. They would range from 30:1 to 5:1 to reflect the historical price behaviour of different classes
of underlying assets.
In particular:
For CFDs in major currency pairs1, which have relatively low historical volatility, a limit of 30:1 is being
considered
For CFDs in non-major currency pairs and major equity indices2, a limit of 20:1 is being considered
For CFDs in gold, a relatively stable commodity, a limit of 20:1 is being considered
For CFDs in commodities other than gold, and for CFDs in minor equity indices, a limit of 10:1 is being
considered; and
For individual equities, which tend to be relatively volatile, and for any underlying not otherwise listed above,
a limit of 5:1 is being considered
A leverage limit of 5:1 on the opening of a CFD implies that the client must post initial margin of at least 20% of
the initial exposure of the CFD.
Similarly, a leverage limit of 20:1 on the opening of a CFD implies that the client must post initial margin of at
least 5% of the initial exposure of the CFD
APPENDIX 1: ESMA Leverage Proposals
1. Any currency pair comprising any two of the following currencies: US Dollar, Euro, Japanese Yen, Pound Sterling, Canadian Dollar or Swiss Franc
2. Any of the following equity indices: Financial Times Stock Exchange 100 (FTSE 100); Cotation Assistée en Continu 40 (CAC 40); Deutsche Bourse AG German
Stock Index 30 (DAX30); Dow Jones Industrial Average (DJIA); Standard & Poors 500 (S&P 500); NASDAQ Composite Index (NASDAQ); Nikkei Index (Nikkei 225);
Standard & Poors / Australian Securities Exchange 200
37

IG Group Holdings plc H1 FY18 Results
APPENDIX 2: Full Year and Half Year analysis1
38
1. Unique active clients in each period with revenue stated as Net Trading Revenue
203.7
95.6
95.6
394.8
5.3
0.2
400.2
FY
106.4
53.1
50.3
209.8
4.8
0.3
214.8
222.3
117.3
104.7
444.3
11.2
0.8
456.3
116.0
64.2
54.4
234.5
6.4
0.5
241.5
FY16H1 FYH2
115.0
67.0
55.6
237.6
6.3
1.0
244.9
223.0
137.5
114.1
474.6
14.1
2.4
491.1
108.0
70.5
58.5
237.0
7.8
1.4
246.2
FY17H1 FYH2
102.1
48.1
45.3
195.5
1.9
(0.0)
197.4
101.5
47.5
50.3
199.3
3.4
0.2
202.8
FY15H1 H2
59.2
35.5
35.3
130.1
10.0
3.1
(1.5)
141.6
FY
46.1
30.5
30.1
106.7
9.1
4.0
(1.5)
118.2
59.9
41.6
36.4
137.9
15.2
6.7
(2.4)
157.5
48.0
34.2
29.3
111.5
10.6
6.7
(2.1)
126.7
FY16H1 FYH2
53.0
35.8
30.3
119.1
13.0
13.3
(3.3)
142.2
64.7
45.9
37.4
148.0
22.3
20.4
(5.0)
185.8
48.1
37.2
29.8
115.1
15.8
20.4
(4.3)
147.1
FY17H1 FYH2
46.8
26.3
28.3
101.5
5.1
0.9
(0.4)
107.1
46.8
29.0
29.0
104.8
7.9
3.1
(1.4)
114.3
FY15H1 H2
3,438
2,689
2,708
3,035
529
50
2,826
FY
2,307
1,743
1,671
1,966
527
71
1,818
3,710
2,821
2,879
3,223
734
122
2,897
2,419
1,876
1,856
2,104
607
80
1,907
FY16H1 FYH2
2,171
1,871
1,834
1,995
480
73
1,722
3,446
2,997
3,051
3,207
630
115
2,643
2,248
1,920
1,959
2,068
494
68
1,680
FY17H1 FYH2
2,181
1,829
1,599
1,927
379
(22)
1,844
2,171
1,639
1,732
1,902
426
57
1,774
FY15H1 H2
UK
EMEA
APAC
OTC Leveraged Derivatives
US
Share Dealing & Investments
GROUP
UK
EMEA
APAC
OTC Leveraged Derivatives
US
Share Dealing & Investments
Multi-product clients
GROUP UNIQUE ACTIVE CLIENTS
UK
EMEA
APAC
OTC Leveraged Derivatives
US
Share Dealing & Investments
GROUP
REVENUE (£m)
CLIENTS(‘000s)
REVENUE PER CLIENT (£)
116.7
76.6
66.0
259.3
7.3
1.8
268.4
FY18H1
47.2
36.0
30.0
113.3
14.8
29.1
(5.2)
151.9
FY18H1
2,470
2,128
2,200
2,290
492
62
1,767
FY18H1

IG Group Holdings plc H1 FY18 Results
APPENDIX 3: Quarterly analysis1
39
UK
EMEA
APAC
OTC Leveraged Derivatives
US
Share Dealing & Investments
GROUP
REVENUE (£m)
47.9
23.1
26.0
97.1
2.1
0.1
99.2
Q4
43.7
21.7
19.4
84.8
0.8
-
85.6
58.4
26.4
25.9
110.7
1.1
(0.0)
111.8
Q1 Q2 Q3
53.6
24.3
24.3
102.2
1.3
0.1
103.6
55.7
33.8
25.9
115.4
3.8
0.3
119.5
54.5
24.1
25.1
103.7
2.2
0.1
106.0
51.9
29.0
25.2
106.1
2.6
0.1
108.9
60.3
30.4
28.5
119.1
2.6
0.2
122.0
53.0
29.8
25.2
108.0
3.0
0.5
111.4
62.0
37.2
30.4
129.7
3.3
0.5
133.4
51.1
33.5
28.2
112.8
3.9
0.6
117.4
CLIENTS(‘000s) Q4Q1 Q2 Q3 Q4Q1 Q2 Q3 Q1 Q2 Q3
UK
EMEA
APAC
OTC Leveraged Derivatives
US
Share Dealing & Investments
GROUP
REVENUE PER CLIENT (£)
1,273
980
1,061
1,132
341
38
1,059
Q4
1,212
1,033
826
1,052
235
-
1,020
1,439
1,180
1,042
1,261
304
(22)
1,214
Q1 Q2 Q3
1,373
1,041
998
1,178
287
27
1,120
1,488
1,224
1,063
1,290
492
45
1,171
Q4
1,396
989
968
1,161
349
39
1,085
1,436
1,156
1,026
1,236
417
37
1,149
Q1 Q2 Q3
1,508
1,092
1,129
1,281
401
49
1,185
1,220
1,041
983
1,105
335
45
974
1,469
1,228
1,188
1,321
373
39
1,137
Q1 Q2 Q3
1,291
1,089
1,126
1,182
381
38
987
FY16 FY17FY15
FY16 FY17FY15
FY16 FY17FY15
37.6
23.6
24.5
85.8
6.1
3.1
(1.2)
93.7
36.1
21.0
23.5
80.6
3.3
-
-
83.9
40.6
22.4
24.8
87.8
3.8
0.9
(0.4)
92.1
39.1
23.4
24.3
86.8
4.5
2.1
(0.9)
92.4
37.4
27.6
24.4
89.4
7.6
6.7
(1.8)
102.0
39.1
24.3
25.9
89.3
6.2
3.4
(1.3)
97.6
36.1
25.1
24.6
85.8
6.2
4.0
(1.3)
94.7
40.0
27.8
25.2
93.0
6.6
4.9
(1.5)
103.0
43.4
28.7
25.6
97.7
9.0
10.3
(2.5)
114.5
42.2
30.3
25.6
98.1
8.7
13.3
(2.8)
117.3
39.6
30.8
25.0
95.4
10.3
16.4
(3.3)
118.9
UK
EMEA
APAC
OTC Leveraged Derivatives
US
Share Dealing & Investments
Multi-product clients
GROUP UNIQUE ACTIVE CLIENTS
Q4Q1 Q2 Q3 Q4Q1 Q2 Q3
56.9
37.0
30.3
124.2
3.9
0.8
128.8
Q4
1,430
1,174
1,197
1,285
345
37
1,035
Q4
39.8
31.5
25.3
96.6
11.2
20.4
(3.8)
124.4
58.8
39.0
33.1
130.9
3.4
0.9
135.2
57.9
37.7
32.9
128.4
3.8
0.9
133.2
Q1 Q2
1,498
1,293
1,316
1,384
333
35
1,082
1,502
1,265
1,291
1,369
385
33
1,038
Q1 Q2
39.2
30.2
25.2
94.6
10.3
24.2
(4.1)
124.9
38.6
29.8
25.5
93.8
10.0
29.1
(4.6)
128.3
Q1 Q2
FY18
FY18
FY18
1. Unique active clients in each period with revenue stated as Net Trading Revenue

IG Group Holdings plc H1 FY18 Results
APPENDIX 4: Regulatory Capital
40
FY16
£m
FY17
£m
FY17
£m
FY16
£m
30 Nov 17
£m
30 Nov 16
£m
Shareholders' Funds
less foreseeable declared dividends
less acquisition intangibles
less intangible assets
less deferred tax assets
Capital resources
Pillar 1 Risk Exposure Amounts (REA)
Total Pillar 1 REA
Capital Ratio
Required Capital Ratio
Pillar 1 minimum
Individual Capital Guidance (ICG)
ICG Requirement
Plus combined buffer requirement
Total Requirement (%)
Total Requirement - £m
Capital Headroom - £m
750.8
(35.6)
(107.8)
(46.2)
(8.6)
552.6
1,951.8
28.3%
8.0%
9.4%
17.4%
1.6%
19.0%
370.8
181.8
680.7
(34.6)
(108.2)
(50.0)
(7.4)
480.5
1,647.6
29.2%
8.0%
9.4%
17.4%
0.6%
18.0%
296.6
183.9
A
B
A/B = C
D
E
D+E = F
G
F+G = H
HxB = I
A-I

IG Group Holdings plc H1 FY18 Results
END