Embed Size (px)
Citation preview
�
Business and Employment Promotion
Hannover Region Business Enterprise Office J Guidance and Brokerage ServiceJ Location InformationJ Sites and Real Estate Advice
J Investment and Subsidy AdviceJ Crisis Contact Point
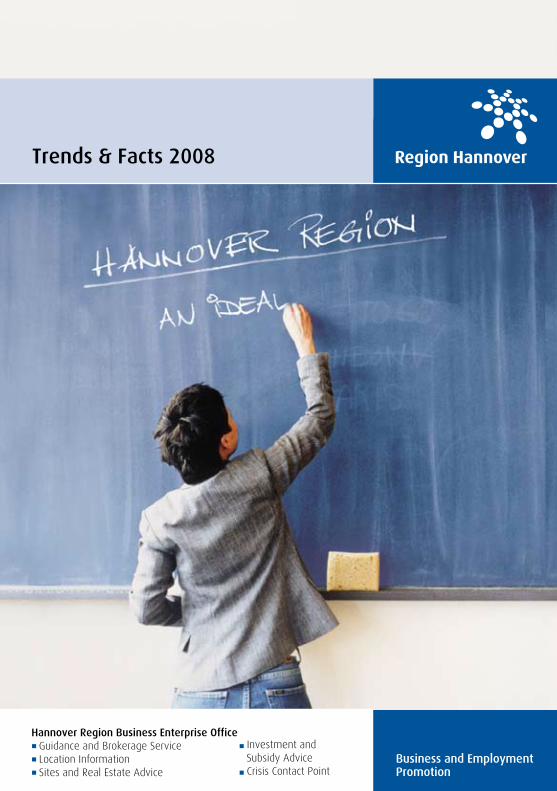
Trends & Facts 2008

Chapter Page
Location & infrastructure 3
Population 4
Employment 6
Mobility 8
Purchasing power 10
Businesses 12
Rents & prices for commercial properties 14
Taxes 15
Energy & waste management 16
Education & science 18
Quality of life & living 20
Childcare 22
Tourism 24
Fairs 26
A nationwide survey shows that Hannover Region has a great deal to offer – both as a place to work and live.This brochure, compiled by the Hannover Region Business Enterprise Office, presents some of the region’s key figures.As your central point of contact and service point for local and foreign businesses we would be happy to advise you on any questions you may have about this location – in addition to the information presented here. No matter whether you have a question regarding administrative matters, about investment and subsidy options available to your company, whether you are interested in land or property or require support in a crisis situation – we are here to help.
Location & infrastructure�2Contents

Inhabitants in the municipalities
�997 2007 total In %
Up to 20 yearsin %
20-60 yearsin %
Over 60 yearsin %
State Capital Hannover 522,574 516,166 -6,408 -1.23 16.8 58.4 24.8Barsinghausen 34,695 34,082 -613 -1.77 20.0 51.3 28.7Burgdorf 30,417 30,079 -338 -1.11 19.2 53.0 27.8Burgwedel 19,273 20,453 1,180 6.12 21.3 50.4 28.3Garbsen 62,813 62,827 14 0.02 20.3 52.3 27.4Gehrden 14,655 14,664 9 0.06 20.7 51.9 27.4Hemmingen 16,878 18,534 1,656 9.81 20.1 51.1 28.8Isernhagen 21,973 22,829 856 3.90 19.1 52.9 28.0Laatzen 37,388 40,034 2,646 7.08 18.6 53.6 27.8Langenhagen 49,449 51,529 2,080 4.21 19.3 53.6 27.1Lehrte 42,546 43,573 1,027 2.41 21.1 54.3 24.6Neustadt a. Rbge. 43,640 45,567 1,927 4.42 21.7 53.4 24.9Pattensen 12,965 13,913 948 7.31 20.5 52.0 27.5Ronnenberg 22,955 23,238 283 1.23 20.7 53.8 25.6Seelze 32,943 32,973 30 0.09 20.2 53.8 26.0Sehnde 18,939 22,708 3,769 19.90 22.1 55.3 22.6Springe 29,842 29,643 -199 -0.67 19.7 51.0 29.3Uetze 18,846 20,379 1,533 8.13 22.6 53.1 24.3Wedemark 26,581 29,154 2,573 9.68 21.0 53.7 25.3Wennigsen 13,092 14,114 1,022 7.81 21.4 51.5 27.1Wunstorf 40,528 41,682 1,154 2.85 21.1 53.7 25.2Hannover Region �,��2,992 �,�28,�4� �5,�49 �.�6 �8.8 55.4 25.8
Source: IES forecast, summer 2005/population data, Lower Saxony Office for Statistics (NLS)
The population of the municipalities in Hannover Region is anticipated to remain stable overall. Some areas are expected to experience a sharp increase in population figures due to large new housing areas.
Population development up to 2020
Municipality Change By age group
Population 54

The overall number of persons in employment has dipped only slightly. Some municipalities experienced a very dynamic development following impressive growth in jobs.
Employees liable to social security in Hannover Region per municipality
Municipality �997 2007 Total Change in %State Capital Hannover 279,345 268,606 -10,739 -3.84Barsinghausen 7,328 5,996 -1,332 -18.18Burgdorf 5,837 5,128 -709 -12.15Burgwedel 6,384 6,745 361 5.65Garbsen 10,504 11,600 1,096 10.43Gehrden 3,032 2,998 -34 -1.12Hemmingen 3,434 3,248 -186 -5.42Isernhagen 8,394 8,581 187 2.23Laatzen 13,548 15,391 1,843 13.60Langenhagen 26,779 28,123 1,344 5.02Lehrte 10,870 10,036 -834 -7.67Neustadt a. Rbge. 8,712 8,116 -596 -6.84Pattensen 3,235 3,074 -161 -4.98Ronnenberg 4,668 3,944 -724 -15.51Seelze 4,979 4,651 -328 -6.59Sehnde 3,197 4,677 1,480 46.29Springe 6,509 6,071 -438 -6.73Uetze 2,798 2,746 -52 -1.86Wedemark 5,046 5,983 937 18.57Wennigsen 1,996 2,051 55 2.76Wunstorf 10,641 10,919 278 2.61Hannover Region 427,2�6 4�8,684 -8,552 -2.00
Source: Lower Saxony Office for Statistics (NLS)
Hannover Region’s economic structure has a clear focus on thetertiary sector. This is complemented by a strong industrial base.
Employees liable to social security by business sector
Business sector �997total in %
2007total in %
Agriculture and forestry 2,335 0.5 2,303 0.6Processing industries, mining 107,357 25.1 77,151 18.4Building industry 25,175 5.9 17,924 4.3Retail, catering & hotel industry 65,626 15.4 76,032 18.2Transport, telecommunications 30,017 7.0 33,216 7.9Banking industry, insurance 25,187 5.9 21,208 5.1Service industry 171,539 40.2 190,850 45.6Hannover Region 427,2�6 �00.0 4�8,684 �00.0
Employees liable to social security by sector (as at �0 June 2007)
Source: Lower Saxony Office for Statistics (NLS)
Employment 76

The number of users emphasises the importance of Hannover as a traffic nodal point:– Hannover main station is used by approx. 250,000 persons every day.– The GVH public transport association moves 174 million passengers every year.– Hannover airport is used by 5.6 million people annually.
Conurbations such as Hamburg, Berlin, the Ruhr Area and Southern Germany are within easy reach:
Source: www.bahn.de (German Rail)
These cities are this close …
ICE journey time from Hannover to (in hh:mm)as at �9 December 2007Berlin 1:37Bremen 0:59Dortmund 1:38Frankfurt a. M. 2:19Hamburg 1:15Köln 2:38München 4:12Stuttgart 3:51
Inbound and outbound commuting in the municipalities, 2007
Live where you would want to live: Excellent public transport services keep journeys to work short. The map presents an overview of commuter traffic in Hannover Region.
Positive commuter balance > 1,500 commutersPositive commuter balance < 1,500 commuters Negative commuter balance
Source: Lower Saxony Office for Statistics (NLS)
Inbound commutersOutbound commuters
Hannover Region is located at the intersection of major north-south and east-west traffic routes. The mixture of motorways, railways, air traffic and inland shipping provides almost ideal connections.
Mobility 98
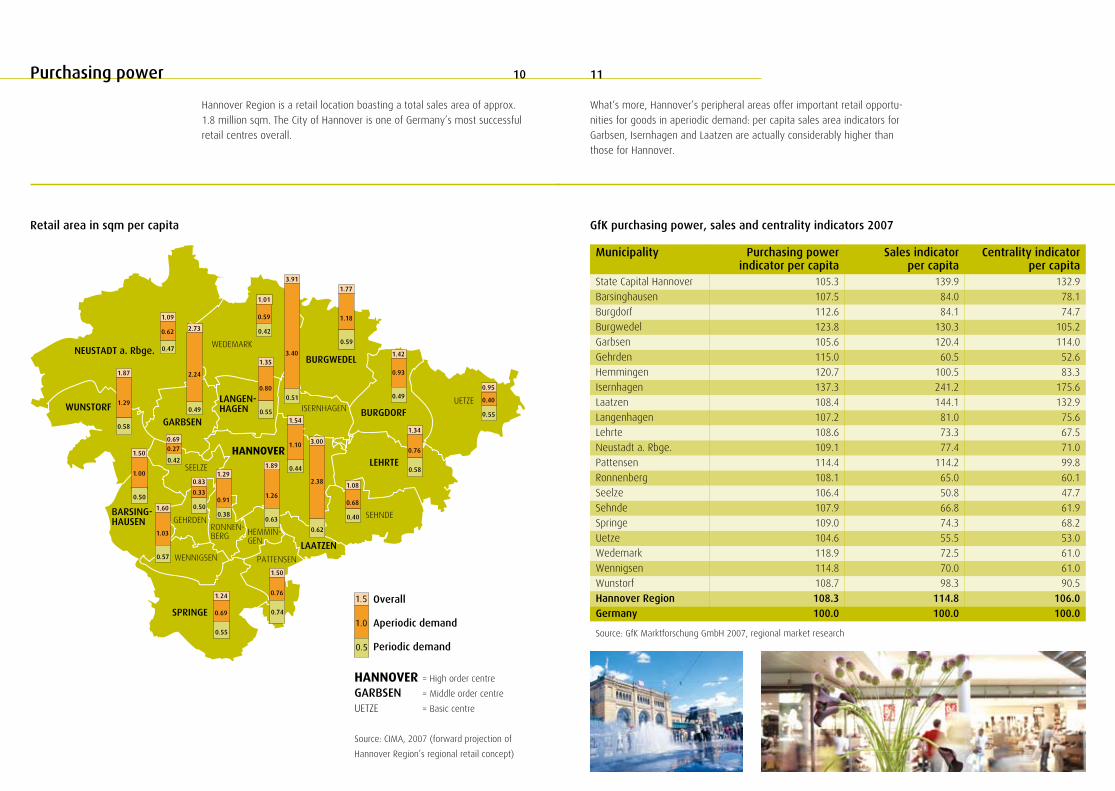
What‘s more, Hannover’s peripheral areas offer important retail opportu-nities for goods in aperiodic demand: per capita sales area indicators for Garbsen, Isernhagen and Laatzen are actually considerably higher than those for Hannover.
Municipality Purchasing power indicator per capita
Sales indicatorper capita
Centrality indicator per capita
State Capital Hannover 105.3 139.9 132.9Barsinghausen 107.5 84.0 78.1Burgdorf 112.6 84.1 74.7Burgwedel 123.8 130.3 105.2Garbsen 105.6 120.4 114.0Gehrden 115.0 60.5 52.6Hemmingen 120.7 100.5 83.3Isernhagen 137.3 241.2 175.6Laatzen 108.4 144.1 132.9Langenhagen 107.2 81.0 75.6Lehrte 108.6 73.3 67.5Neustadt a. Rbge. 109.1 77.4 71.0Pattensen 114.4 114.2 99.8Ronnenberg 108.1 65.0 60.1Seelze 106.4 50.8 47.7Sehnde 107.9 66.8 61.9Springe 109.0 74.3 68.2Uetze 104.6 55.5 53.0Wedemark 118.9 72.5 61.0Wennigsen 114.8 70.0 61.0Wunstorf 108.7 98.3 90.5Hannover Region �08.� ��4.8 �06.0Germany �00.0 �00.0 �00.0
GfK purchasing power, sales and centrality indicators 2007
Source: GfK Marktforschung GmbH 2007, regional market research
Retail area in sqm per capita
�����
��������
��������
����������
���������
�������
������
�����������
���������
����������
������
�������
�������
������
��������
���������
������������
�������
�����������������
��������
��������������
Hannover Region is a retail location boasting a total sales area of approx. 1.8 million sqm. The City of Hannover is one of Germany’s most successful retail centres overall.
Purchasing power ���0
Source: CIMA, 2007 (forward projection of
Hannover Region’s regional retail concept)
Overall
Aperiodic demand
Periodic demand
HANNOVER = High order centre
GARBSEN = Middle order centre
UETZE = Basic centre

Location factors of the persuasive kind: many big names are headquar-tered in Hannover, among them two DAX companies (Continental, TUI)and an MDAX company (Hannover Re Group).
TOP businesses in Hannover Region per employee, November 2007
Rank Ranking previous year**
Organisation Company HQ
Value generation in millions
2006
Employees* 2006
Industry
1. 1. TUI AG (K) Hannover 20,514.6 60,206 Tourism, shipping2. 2. ContiTech Holding
GmbH (K)Hannover 2,868.7 21,887 Automotive
supplier3. - Volkswagen Nutzfahr-
zeuge AGHannover 8,343.0 19,421 Road
vehicles4. 3. Dirk Rossmann GmbH Burgwedel 1,934.2 13,080 Wholesale/retail
(drugstore goods)5. 5. Continental AG Hannover 2,474.4 7,637 Automotive
supplier6. 6. TÜV Nord Gruppe (K) Hannover 637.0 6,878 Technical services7. - Medizinische Hoch-
schule HannoverHannover 312.6 6,336 Healthcare
8. - Nexans Deutschland AG Gruppe (K)
Hannover 953.2 5,816 Cable production
9. - Siemens AG Laatzen 1,115.8 5,420 Electrical engineering
10. 9. Konica Minolta Business Solutions Europe GmbH (K)
Langen- hagen
1,371.6 4,850 Manufacture and distribution of print and copying equipment
11. - E.ON Kraftwerke GmbH
Hannover 2,674.0 4,432 Power generation
12. 10. AGRAVIS Raiffeisen AG (K)
Hannover 3,926.0 3,881 Agricultural trading
13. 8. NORD/LB (K) Hannover 331.8 3,537 Financial services14. 13. Bahlsen Gruppe (K) Hannover 521.7 3,296 Food* including all staff of group companies (also outside Hannover Region)** only TOP 25 considered
Rank Ranking previous year**
Organisation Company HQ
Value generation in millions
2006
Employees* 2006
Industry
15. - VARTA Automotive AG (K)
Hannover 1,044.2 3,207 Battery/accumu-lator production
16. 16. WABCO GruppeHannover (K)
Hannover 1,072.0 2,919 Automotive suppler
17. 11. Solvay Deutschland (K) Hannover 1,329.1 2,710 Chemical industry18. 17. Verlagsgesellschaft
Madsack GmbH & Co. KG (K)
Hannover 458.9 2,675 Publishing
19. 14. Sparkasse Hannover Hannover 175.7 2,670 Financial services20. 19. Stadtwerke
Hannover AGHannover 1,813.9 2,559 Power generation
21. - E.ON IS GmbH (K) Hannover 559.2 2,484 Services to the power industry
22. 15. VHV Vereinigte Hannoversche Versi-cherung a.G. (K)
Hannover 223.5 2,469 Composite and life insurance
23. - K+S Salz GmbH Hannover 488.6 2,151 Production and distribution of salt products
24. 20. AWD Holding AG Hannover 733.5 2,013 Financial services25. 21. Hannover Rückver-
sicherung AG (K)Hannover 954.1 2,002 Re-insurance
Source: NordLB
* including all staff of group companies (also outside Hannover Region)** only TOP 25 considered
Businesses ���2
Having a stable balance between supply and demand helps keep pricesreasonable. For a detailed review of structural data please refer toHannover Region’s annual Property Market Report.
Commercial space on offer in Hannover Region 2008
Commercial space on offer (in ha)Available reserve areas, total 860.6of which immediately available(developed, valid building zone, public property)
235
of which immediately available and near motorway(max. 2 km from motorway)
130.9
Rents commercial property market 2007
Office rents Rents 2007 in €/sqmPeak rents city 12.00Average rent, city 9.50
Logistics rents Rents 2007 in €/sqmPeak rents, good new building 4.80Average rents 3.20
Retail rents Rents 2007 in €/sqmPeak rents city (top locations) 165.00Average rents city (top locations) 115.00
Source: Property Market Report 2007
Price levels, building land, commercial and industrial 2008
Location Basic Medium Good€/sqm
State Capital Hannover 70-90 100-130 150-200Peripheral area, near city 50-70 90-100 110-125Remaining peripheral area 30-40 50-70 80-100
Source: Property value market report, land market report 2008
Source: Hannover Region
Taxes
Tax rates in Hannover are not only much below those of other comparable German cities, such as Frankfurt. They have remained stable over many years.
City/municipality Land tax Land tax Trade taxA B
State Capital Hannover 530 530 460Barsinghausen 450 450 380Burgdorf 400 400 400Burgwedel 350 350 380Garbsen 398 398 398Gehrden 420 420 390Hemmingen 420 420 380Isernhagen 395 395 365Laatzen 420 420 420Langenhagen 385 385 430Lehrte 350 350 395Neustadt a. Rbge. 420 420 420Pattensen 400 400 390Ronnenberg 420 420 440Seelze 420 420 395Sehnde 420 400 410Springe 395 395 380Uetze 400 400 390Wedemark 370 370 370Wennigsen 400 400 400Wunstorf 410 410 380Average peripheral municipalities 402.2 401.2 395.7Average Hannover Region 408.2 407.� �98.7
Land and trade tax rates 2007
Source: Hannover Region
Rents & prices for commercial properties �5�4

Thoroughly persuasive location factors: The price levels charged by regional utilities for power and gas are favourable. Hannover is preparing for the future with its innovative renewable energy policy. 14 % of power is wind generated (6 % nationwide).
Selected power suppliers in conurbations (January 2008)Consumption 4,000 kWh/year, gross prices including VAT, oil tax/eco tax
Provider Tariff name City/Region Annual costs in €
City
N-ERGIE AG General tariff power standard
Central Franconia, parts of Upper Bavaria, Swabia
and Upper Palatinate
756.11 Nürnberg
Stadtwerke Hannover AG
General tariff power and comfort
City of Hannover and parts of Hannover Region
79�.64 Hannover
Stadtwerke München GmbH
Basic and substitute domestic supplies
München 803.75 München
Stadtwerke Düsseldorf AG General domestic tariff Düsseldorf 823.96 DüsseldorfVattenfall Europe Berlin AG & Co. KG
Berlin basic private power
Berlin 827.60 Berlin
Mainova Aktiengesellschaft
General Tariff MainovaClassic
Rhein-Main-Region 831.10 Frankfurt
Vattenfall Europe Hamburg AG
Hamburg basic private power
Hamburg 834.80 Hamburg
RheinEnergie AG Basic and substitute domestic supplies
Köln, Rhein-Ruhr 847.64 Köln
swb Vertrieb Bremen GmbH
General domestic tariff power standard basic
Bremen, Bremerhaven 852.80 Bremen
Dortmunder Energie- und Wasserversorgung GmbH
General domestic tariff power standard
Dortmund 859.79 Dortmund
EnBW Vertriebs- und Ser-vicegesellschaft mbH
Basic and substitute domestic supplies
Baden-Württemberg 871.44 Stuttgart
E.ON Avacon AG Niedersachsen
General tariff Alpha Lower Saxony
Parts of Hannover Region, central and southern
Lower Saxony
877.40 HannoverRegion
MVV Energie AG MVV Classica nationwide (business and industrial customers)
914.63 Mannheim
ENTEGA Vertrieb GmbH u. Co. KG
Entega basic power domestic
Darmstadt, Mainz, Südhessen 932.58 Darmstadt
Stadtwerke Leipzig GmbH General domestic tariff Leipzig 959.62 Leipzig
Gas charges of selected providers in conurbations (January 2008)Consumption 15,000 kWh/year, output power 10 kW
Provider Annual costs in €swb Bremen 931.98Mainova Aktiengesellschaft (Frankfurt/Main) 944.34EnBW Gas (Stuttgart) 960.90Stadtwerke Hannover 962.67RWE Rhein-Ruhr (Bad Kreuznach) 964.38N-ERGIE (Nürnberg) 974.97Dortmunder Energie- und Wasserversorgung 975.60RWE Westfalen-Weser-Ems (Ruhr-Lippe/Dortmund) 999.60RheinEnergie (Köln) 1,001.06Stadtwerke München 1,001.39E.ON Hanse (Hamburg) 1,006.56E.ON Avacon (Niedersachsen) �,0�6.20MVV Energie (Mannheim) 1,055.53Stadtwerke Düsseldorf 1,078.74ENSO Energie Sachsen-Ost GmbH (Dresden) 1,145.47Stadtwerke Leipzig 1,228.83
Source: www.verivox.de 1/2008
Charge comparison of waste management in selected cities
Source: Waste management providers, Hannover Region researchSource: Tariff monitor GET AG
Energy & waste management �7�6
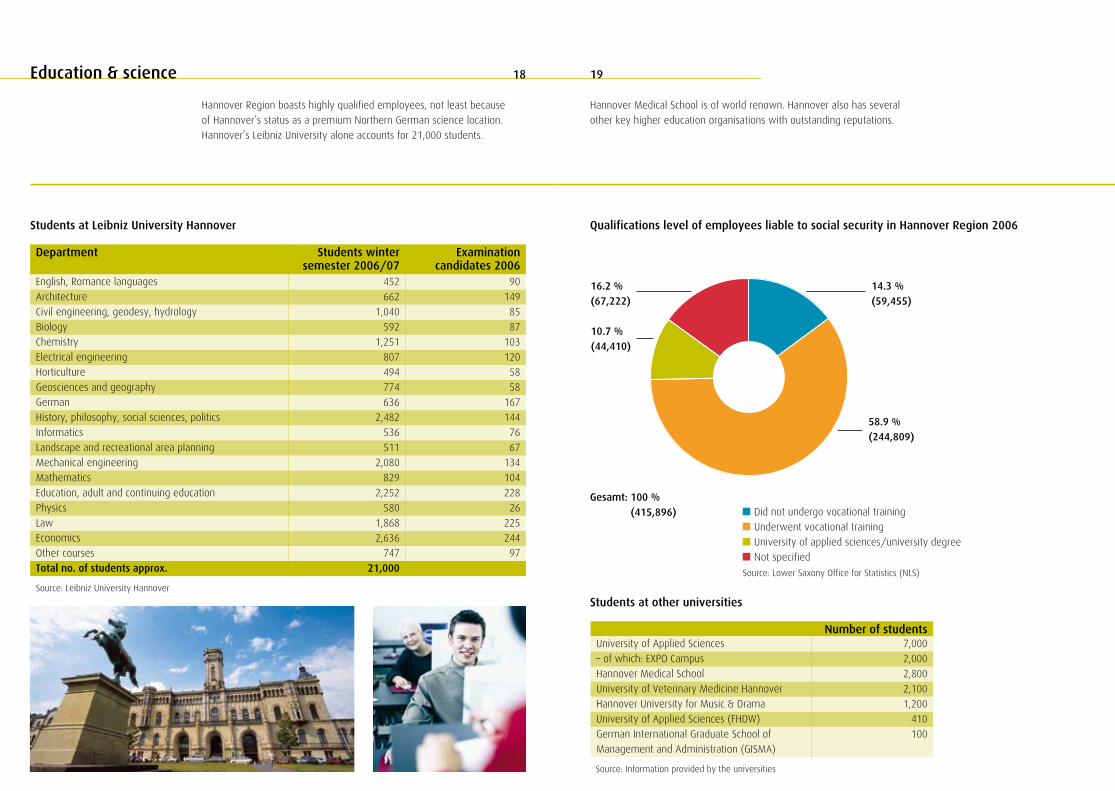
Hannover Region boasts highly qualified employees, not least because of Hannover’s status as a premium Northern German science location. Hannover’s Leibniz University alone accounts for 21,000 students.
Students at Leibniz University Hannover
Department Students winter semester 2006/07
Examination candidates 2006
English, Romance languages 452 90Architecture 662 149Civil engineering, geodesy, hydrology 1,040 85Biology 592 87Chemistry 1,251 103Electrical engineering 807 120Horticulture 494 58Geosciences and geography 774 58German 636 167History, philosophy, social sciences, politics 2,482 144Informatics 536 76Landscape and recreational area planning 511 67Mechanical engineering 2,080 134Mathematics 829 104Education, adult and continuing education 2,252 228Physics 580 26Law 1,868 225Economics 2,636 244Other courses 747 97Total no. of students approx. 2�,000
Source: Leibniz University Hannover
Number of studentsUniversity of Applied Sciences 7,000– of which: EXPO Campus 2,000Hannover Medical School 2,800University of Veterinary Medicine Hannover 2,100Hannover University for Music & Drama 1,200University of Applied Sciences (FHDW) 410German International Graduate School ofManagement and Administration (GISMA)
100
Students at other universities
Qualifications level of employees liable to social security in Hannover Region 2006
Source: Information provided by the universities
�4.� %(59,455)
58.9 %(244,809)
�0.7 %(44,4�0)
�6.2 %(67,222)
Gesamt: �00 % (4�5,896)
Hannover Medical School is of world renown. Hannover also has several other key higher education organisations with outstanding reputations.
Education & science �9�8
Source: Lower Saxony Office for Statistics (NLS)

Hannover really is a green city. This means that it offers a huge range of leisure and recreational activities both in the city centre and in its periphery, complemented by the rich tapestry of activity only a vibrant city can offer.
Price comparison
Source: HVB Expertise
The low price level overall compared with other cities, as demonstrated by rents and land prices, is also a key factor influencing the quality of life in Hannover Region.
Building land for single-family homes and duplexes 2008 (no development cost charges imposed)
Comparison of apartment rents in selected cities 2007New buildings up to �0 years and renovated old buildings, 70 sqm, good location, €/sqm
HannoverNürnbergDüsseldorfBerlinFrankfurt a. M.KölnStuttgartHamburgMünchen
6 7 8 9 10 11 12 13 14
Source: HVB Expertise
Typical prices for detached houses 2007�40 sqm, including 450 sqm land, good location, in EUR thousand
HannoverBerlinNürnbergDüsseldorfKölnHamburgFrankfurt a. M.StuttgartMünchen
200 300 400 500 600 700 800 900
Quality of life & living 2�20
Source: Land market report 2008, GLL Land Registry Office Hannover
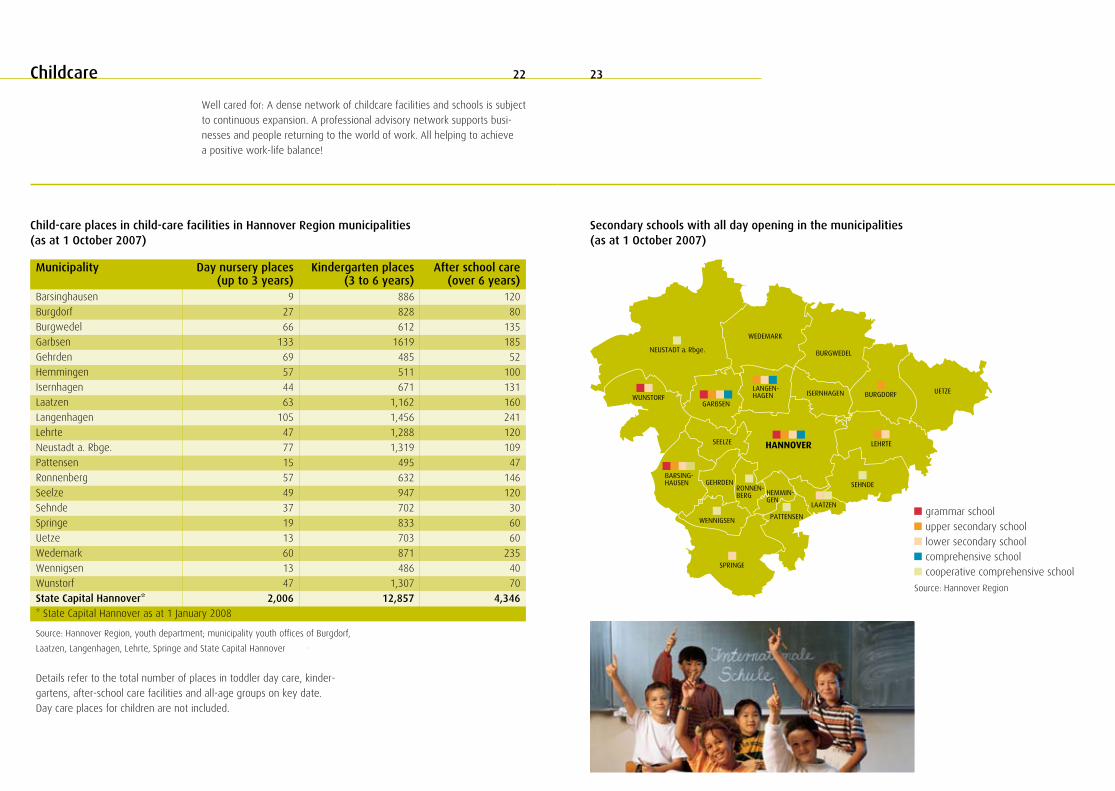
Well cared for: A dense network of childcare facilities and schools is subject to continuous expansion. A professional advisory network supports busi-nesses and people returning to the world of work. All helping to achieve a positive work-life balance!
Child-care places in child-care facilities in Hannover Region municipalities(as at � October 2007)
Secondary schools with all day opening in the municipalities(as at � October 2007)
* State Capital Hannover as at 1 January 2008
Municipality Day nursery places (up to � years)
Kindergarten places (� to 6 years)
After school care (over 6 years)
Barsinghausen 9 886 120Burgdorf 27 828 80Burgwedel 66 612 135Garbsen 133 1619 185Gehrden 69 485 52Hemmingen 57 511 100Isernhagen 44 671 131Laatzen 63 1,162 160Langenhagen 105 1,456 241Lehrte 47 1,288 120Neustadt a. Rbge. 77 1,319 109Pattensen 15 495 47Ronnenberg 57 632 146Seelze 49 947 120Sehnde 37 702 30Springe 19 833 60Uetze 13 703 60Wedemark 60 871 235Wennigsen 13 486 40Wunstorf 47 1,307 70State Capital Hannover* 2,006 �2,857 4,�46
Source: Hannover Region, youth department; municipality youth offices of Burgdorf,
Laatzen, Langenhagen, Lehrte, Springe and State Capital Hannover
Details refer to the total number of places in toddler day care, kinder-gartens, after-school care facilities and all-age groups on key date.Day care places for children are not included.
Childcare 2�22
Source: Hannover Region

Hannover Region has much to offer to both locals and visitors: highlights include over 40 different theatres, many museums and exhibitions, the Royal Gardens of Herrenhausen and Hannover Adventure Zoo – just asmall selection of highlights offered in this lively metropolitan area.
Overnight stays in 200� and 2006
Overnight stays per annum, millions* City 200� 2006
Change 200�-2006 in %
Hamburg 4.77 7.12 49.27Dresden 2.49 3.50 40.56Berlin 11.35 15.91 40.18Köln 3.26 4.38 34.36Hannover �.25 �.57 25.60Düsseldorf 2.39 2.90 21.34Frankfurt a. M. 4.3 5.09 18.37Stuttgart 2.18 2.57 17.89München 7.6 8.86 16.58
Source: Magic Cities Germany e. V.
* Lodgings with 9 plus beds
Source: Tourism Association Hannover Region e. V.
Visitor overnight stays in Hannover Region
Hannover’s peripheral area also has many places of interest. The castleat Marienburg, the Deister hills, the Lüneburger Heide heathland andSteinhude lake are perhaps the most famous in a region full of attractions.
Tourism 2524

Welcome to one of the world’s premium international fair locations.The world’s largest state-of-the-art fairground is not only host to theCeBIT computer fair and the Hannover Industry Fair, it is also the venuefor many other key trade fairs.
German fairgrounds, a comparison
Fairground Hall area (sqm) 2007
Outside areas (sqm) 2007
Turnover (€ million) 2007
Visitors, total 2007
Hannover 495,265 58,070 283 2,000,000Frankfurt a. M. 321,754 83,700 423 3,600,000Köln 284,000 100,000 216 2,035,000*Düsseldorf 263,888 43,000 304 1,297,000München/New Fair 180,000 255,000 266 2,400,000Berlin 160,000 100,000 145 1,556,000Nürnberg 160,000 60,000 123 1,240,000Essen 110,000 20,000 60 1,500,000Leipzig 101,200 69,998 76 1,240,000Hamburg 76,434 8,500 47 851,000
Source: AUMA (Association of the German Traide Fair Industry), fair organizer
Fair diary
International key trade fairs 2008 Domotex 12.01.-15.01.ABF 26.01.-03.02.CeBIT 03.03.-09.03.Hannover Messe 21.04.-25.04.CeMAT 27.05.-31.05.IAA Nutzfahrzeuge 25.09.-02.10.Biotechnica 07.10.-09.10.infa 18.10.-26.10.EuroBlech 21.10.-25.10.EuroTier 11.11.-14.11.Pferd & Jagd 04.12.-07.12.
Source: Deutsche Messe AG
Exhibitors 2007
Net area rented 2007 in sqm
Visitors 2007
Agritechnica* 2,168 182,529 340,756Altenpflege + ProPflege 747 26,130 35,151BioTechnica 863 13,029 13,000CeBIT (2008) 5,845 291,580 495,000CeMAT (target figs 2008) 1,100 80,000 50,000didacta (2006) 700 22,947 67,406Domotex 1,442 97,083 47,000EMO Hannover 2,120 180,158 166,500EuroBLECH (2006)** 1,409 76,200 64,353EuroTier (2006)* 1,488 150,000 116,000Hannover Messe (2008) 5,100 170,000 200,000IAA Nutzfahrzeuge (2006)*** 1,556 210,000 265,500Interschutz/Interpolice (2005) 1,215 68,582 136,601LIGNA Hannover 1,879 134,583 107,000
* Source: DLG (German Agricultural Society)
** Source: MackBrooks Exhibitions
*** Source: VDA (Association of the German Automotive Industry)
* 2006
Fairs 26 27

Need more information?Simply give us a call or look us up!
Hannover Region Business Enterprise Office
The Business Enterprise Officeis open Monday through Friday,from 9:00 am to 5:00 pm.Appointments can also be arranged outsidenormal office hours, please call.
Haus der WirtschaftsförderungPrinzenstraße 1230159 HannoverFreephone +49 (0) 800 616 0 616 Fax +49 (0) 511 6 16-2 34 53unternehmerbuero@region-hannover.dewww.unternehmerbuero-hannover.de