Embed Size (px)
Citation preview
Results of BRE Bank Group
Q2 2011
Franchise strength supporting robust performance
Management Board of BRE Bank S.A.
Presentation for Investors and Analysts
3 August 2011

2
Agenda
Summary of Q2/11
Analysis of Q2/11 Results
2011 Outlook
Appendix
Macroeconomic update
Detailed Results of Business Lines
Additional Information: Selected Financial Data

3
3
2
4
Highlights of Q2/11 in BRE Bank Group
Prudent approach to risk management � Recurrent cost of risk in Q2/11 at 93 bps and 84 bps in H1/11, NPL coverage ratio at 65%� Retail portfolio optimization reducing cost of risk to 57 bps in H1/11
Solid efficiency improved further � YoY income growth of 16.7% v. YoY cost growth of 9.5%;� H1/11 C/I ratio at 48.5% v. 49.1% in Q1/11 and 51.2% in H1/10
Adding new clients and increasing penetration� Number of retail clients up by 60K in Q2 and 305K YoY,
corporate client base up by 213 in Q2 and 610 YoY� Cross-selling ratio in retail banking at 2.99 v. 2.90 as of Q1/11
1Strength in core income continues� NII and NFC at PLN 751 M, up 23.3% YoY and 5.2% QoQ;� 5th consecutive quarter of core income growth

4
Q2/11 Q1/11 Change Q2/Q1 Q2/10
Core income1) 750.7 713.9 +5.2% 608.7
Total income2) 894.3 831.5 +7.6% 766.1
Total cost (428.6) (408.4) +5.0% (391.6)
Operating profit3) 465.7 423.1 +10.1% 374.5
Net provisions (58.6) (114.1) -48.6% (203.5)
Profit before tax 407.0 309.0 +31.7% 171.0
Net profit4) 313.2 229.7 +36.3% 131.4
ROE before tax 20.6% 18.0% +2.6 p.p. 14.0%
Total assets 88,706.9 89,049.8 -0.4% 88,911.4
CAR 16.08% 16.20% -12 bps 12.03%
Key Financials
1) Sum of Net interest income and Net fee & commission income 2) Including Net other operating income and cost;3) Before provisions; 4) Profit after tax and minorities
Note: Financial results presented include the impacts of the sale of NPL portfolio (for detailed impact of the transaction refer to page 10)
Analysis of Results, Q2/11

5
62.360.7
1.71.2 1.20.2-0.3
03/11 Individual
clients
Corporate
clients
Other (incl.
Public sector)
06/11
Summary of Q2/11 in BRE Bank Group
Development of Loans to Clients
Structure of Gross Loans Portfolio
as of 30 June 2011
Development of Gross Loans
(PLN B)
63.561.9
+8.5%
QoQ
Intermarket Bank and Magyar Factor (classified as AFS)
� Total gross loans up 2.6% QoQ (market: +4.5%);
excluding FX effects: up 0.4% QoQ (market +2.9%)
� Corporate loans down 1.3% QoQ (market: +4.8%);
excluding reverse repo transactions up 1.5% QoQ;loans to enterprises up 7.8% YTD (market +8.0%)
� Retail loans up 5.1% QoQ (market: +4.3%)
excluding FX effects and the effect of the sale
of NPL portfolio: up 2.3% QoQ (market: +1.9%)
BRE Bank 84.4%
+2.6%
-1.3%
QoQ
Accelerating retail loan growth
+5.1%
QoQ
Tr ansfinance
0.6%
BRE - Individual
clients
55.3%
BRE -
Cor por ate
clients
25.5%
Polfactor
1.0% Intermar ket
Bank & Magyar
Factor
1.9%
BRE Leasing
6.0%
BRE - Public
sector
2.4%
BRE Bank
Hipoteczny
6.1%
BRE - other s
1.2%

6
46.3 46.5
-0.6
+1.2
-0.4
03/11 Individual
clients
Corporate
clients
Public sector 06/11
Development of Deposit Base
� Growing balances of corporate and retail current accounts
� Solid pick-up in corporate deposit growth
� Retail deposit balances reflecting focus on margins
� ‘Real’ loan to deposit ratio at 86%
Summary of Q2/11 in BRE Bank Group
BRE Bank97.0%
Structure of Amounts Due to Clients
as of 30 June 2011
Development of Deposits
(PLN B)
+0.3%
Stable deposit base and sound liquidity
Intermarket Bank and Magyar Factor (classified as AFS)
+5.8%
QoQ
-2.4%
QoQ-40.7%
QoQ
0.20.2
46.746.5
BRE -
Cor por ate
clients
43.8%
BRE - Individual
clients
52.0%
Polfactor +
Tr ansfinance
0.1%DI BRE
2.0%
BRE Bank
Hipoteczny
0.4%
BRE - Public
sector
1.2%
Intermar ket
Bank + Magyar
Factor
0.5%

7
Deposits 1) (PLN B)Clients
� Further growth of corporate client base: up by 213 companies in Q2/11
and 610 YoY
� Project finance as main growth driver in corporate loans
� Strong performance in Transactional Banking and Structured Finance
Business Development: Corporates & Markets
Summary of Q2/2011 in BRE Bank Group
+23.2%+4.7%
+12.8%+1.6%
+2.9%
+1.5%
1) Excluding reverse repo and repo transactions; in Q1 and Q2 2011 including
Intermarket Bank and Magyar Factor (classified as AFS)
Loans 1) (PLN B)
22.9 23.2 23.6
Q2/10 Q1/11 Q2/11
Expanding client base and innovation driving sound business growth
16.3 17.8 20.1
Q2/10 Q1/11 Q2/11
13,026 13,423 13,636
Q2/10 Q1/11 Q2/11
Payment cards for corporates
� 30,000 Prepaid Cards for
Korona Kielce football club
� 14,000 eMoney Cards for the Open’er
Festival
� Joint product development by corporate and retail banking arms
Product innovations
IB offer enhancement
� Increasing revenues and cross-sell
of Treasury and FX products
� Leveraging on automatic product
platforms
� Full alignment of sales approach across IB, corporate banking and risk

8
Deposits (PLN B)Clients (thou.)
Business Development: Retail Banking
Summary of Q2/2011 in BRE Bank Group
-4.5%
-2.4%
+7.3%
+5.1%
Loans (PLN B)
35.333.532.9
Q2/10 Q1/11 Q2/11
26.1 25.5 24.9
Q2/10 Q1/11 Q2/11
3,486 3,731 3,791
Q2/10 Q1/11 Q2/11
� 60 K new retail clients added in Q2/11
� New non-mortgage loan sales up 25% QoQ, mortgages up 56% QoQ
� Cross-selling ratio at 2.99 up from 2.90 in Q1/11
� Balances on current accounts up 5.6% QoQ
Accelerating dynamics in new loan sales
+8.8%
+1.6%
Product innovations
Mobile banking
� mBank’s mobile transactional system
launched in June
� Broadest service functionality available to customers from day one
� mBank iPhone, iPad and Android
applications to be released in H2/11
� Multibank mobile platform
to be released in H2/11

9
Agenda
Summary of Q2/11
Analysis of Q2/11 Results
2011 Outlook
Appendix
Macroeconomic update
Detailed Results of Business Lines
Additional Information: Selected Financial Data

10
Sale of non-performing loan portfolio
407.0
316.7
+13.1-6.1 +1.5
+81.8
Recurrent profit
before tax Q2
2011
Net interest
income
Fee and
commission
income
Other operating
result
Loan loss
provisions
Reported profit
before tax Q2
2011
542.5
x Reported result
208.2 37.7 -58.6
� Benefiting from earlier prudent provisioning of the retail portfolio
� Nominal value of portfolio sold amounted to PLN 621.5M
� Gross value of retail loans decreasing by PLN 449.6M
� NPL portfolio sale added PLN 90.3 M to Q2/11 pre-tax profit
90.3
Calculation of recurrent profit before tax in Q2/11
(PLN M)
90.3 Total impact on P&L in Q2/11
Taking advantage of attractive market prices offered
Analysis of Results, Q2/11

11
766.1 831.5
542.5
894.3
37.7-2.5
105.82.7
208.2
Q2/10 Q1/11 Net Interest
Income
Net Fee and
Commission
Income
Dividend
Income
Net Trading
Income
Gains less
Losses from
Investment
Securities
Net Other
Operating
Result
Q2/11
Retail
Banking; PLN
491.1 M; 55%
Other and
Eliminations;
PLN 14.2 M;
2%
Trading and
Investment
Activity;
PLN 108.4 M;
12%
Corporates
and
Institutions;
PLN 280.6 M;
31%
Income of BRE Bank Group
+7.1%QoQ
+0.4%QoQ
+10.7%QoQ
� Recurrent income generation at the highest level ever
� NIM increasing to 2.5% supported by deposit margin increase and stable loan pricing
� Recurrent commission income continues to improve driven by credit growth, brokerage, credit cards,
insurance products as well as transactional banking
� Growth of net trading income helped by increased FX volatility, higher sales of FX mortgage loans,
interest rate hedging and corporate FX solutions
+16.7%
Analysis of Results, Q2/11
-41.5%QoQ
+43.3%QoQ
Income structure by Business Line in Q2/11BRE Bank Group Income QoQ & YoY
(PLN M)
+7.6%
Group income growth driven by all major revenue lines

12
428.7
201.1
408.4391.6142.6
60.924.0
Q2/10 Q1/11 Personnel
costs
Material
costs
Depre-
ciation
Other Q2/11
Costs of BRE Bank Group
� C/I ratio at 48.5% compared to 49.1% in Q1/11 and 51.2% in H1/10
� Overhead costs and depreciation up by 5.0% QoQ as a result of higher personnel and material costs;
increase of 9.5% YoY on higher accruals for performance related compensation
� Expenses supporting investment in current and future growth such as corporate network enhancement
and marketing spendings for new client acquisitions
+5.6%QoQ
+3.9%QoQ
+4.5%QoQ
+5.4%QoQ
+9.5%
Analysis of Results, Q2/11
Cost Structure by Business Line in Q2/11Overhead Costs + Depreciation of BRE Bank Group QoQ & YoY
(PLN M)
+5.0%
Business growth supporting efficiency improvement
Other and
Eliminations;
PLN 16.7 M;
4%
Retail
Banking; -
PLN 194.0 M;
45%
Corporates
and
Institutions;
PLN 167.8 M;
39%
Trading and
Investment
Activity; -
PLN 50.2 M;
12%

13
78.6 78.657.6
107.8-20.0
-20.0
56.5
95.7
81.8
Q2/10 Q1/11 Corporates &
Financial
Markets
Retail Banking Q2/11
Structure of Loan Loss Provisions
� Trends in Q2/11:
- Further improvement of financial standing
of corporate and retail clients
- Recurrent cost of risk up to 93 bps in Q2/11
- LLP level in corporate segment driven by
individual cases
- Very solid performance in the retail segment
even when excluding the sale of NPL portfolio
- Mortgage portfolio continues to perform strongly
� BRE Bank’s NPL ratio (old NBP rules)
down to 5.0% from 6.1% as of 03/11
� Impaired loans ratio of BRE Bank Group down
to 5.0% as of 06/11 from 5.6% as of 03/11
58.6
+36.5%QoQ
-/+
Analysis of Results, Q2/11
114.1
203.5
Corporates & Financial Markets Retail Banking
BRE Bank Group’s Impairment Losses on Loans and Advances
(PLN M)
-48.6%
Prudent provisioning amid improving risk parameters
Release of provisions – sale of NPL portfolio

14
Agenda
Summary of Q2/11
Analysis of Q2/11 Results
2011 Outlook
Appendix
Macroeconomic update
Detailed Results of Business Lines
Additional Information: Selected Financial Data

15
Strong capital adequacy and improving earnings
� Capital adequacy ratio and Tier 1 ratio at 16.08% and 10.7% respectively
� Retained earnings creating significant new capital; 114 bps for 2010
� Solid capital base to absorb new RWA requirements and support business growth
A resilient business model reflecting tightening regulatory environment
A liquid Basel 3 ready balance sheet
� LCR and NSFR > 100%
� Stable and broad deposit franchise
� Funding in place for FX loan portfolio
Client focused business model meeting regulatory requirements
� FX spreads charged to mortgage clients among lowest on the market
� Low client fee for direct repayment of instalments in FX
2011 Outlook – BRE Bank Group beyond Q2/11

16
3
2
4
Sound growth momentum;pace may be impacted if market turbulence persists
Core revenue growth as key driver of profitability improvement
Strong capital and ample liquidity to address growth opportunities and any potential regulatory tightening
1
2011 Outlook – BRE Bank Group beyond Q2/11
Continued implementation of 2010-2012 strategy

17
Agenda
Summary of Q2/11
Analysis of Q2/11 Results
2011 Outlook
Appendix
Macroeconomic update
Detailed Results of Business Lines
Additional Information: Selected Financial Data

18
49Trading and Investments: Market Share
43-45BRE Group’s historical performance19-20Macroeconomic update
Macroeconomic update & detailed Results of the Business Lines Page No.
Additional Information: Selected Financial Data & Business Environment
Page No.
BRE Bank Retail Banking 21-30 P&L acc. to IFRS 46
Summary of Q2/11 22 Profitability of the Business Lines 47
Customer Acquisition & Volume Trends 23-24 Results of subsidiaries 48
Acquisition of Microenterprises 25 Interest Income 49
Retail Deposits and Loans: Market Share 26 Commission Income 50
Mortgage Loans: Portfolio Structure & Quality 27 Trading Income 51
Distribution Network 28 Overhead Costs structure 52
BRE Ubezpieczenia (BRE Insurance) 29 Loans and Deposits 53
Clients & Volumes 30 LtD ratio 54
Corporates & Financial Markets 31-41 Balance Sheet Analysis – Currency structure 55
Summary of Q2/11 32 Balance Sheet Analysis - Assets 56
Corporates & Institutions: Clients, Loans and Deposits 33 Balance Sheet Analysis - Liabilities 57
Loans and Deposits: Market Share 34 Maturity of Long- and Midterm FX Loans 58
Client Base & development of Loans and Deposits 35 Capital Adequacy 59
Cash Management 36 Loan Loss Provisions & Portfolio quality 60
Products for local governments and Structured and Mezzanine Finance
products 37
Leasing and Factoring 38
BRE Bank Hipoteczny (Mortgage Bank) 40
Dom Inwestycyjny BRE Banku (DI BRE) 41
Appendix

19
Slower economic activity. Higher CHF/PLN and CPI may affect
consumers (estimated effect 0.4-1.2 pp. on consumption)
Exports,
imports,
(EUR)
(% YoY)
AppendixMacroeconomic update
Economic growth to moderate
GDP,
investment,
private
consumption
(% YoY)
Source: NBP
Investment activity has been picking up, but perspectives
moderated somewhat
Imports growing faster than exports Inflation peaked already but will remain on elevated levels.
Monetary tightening pushed back
Source: NBP
-40
-20
0
20
40
10-08 03-09 08-09 01-10 06-10 11-10 04-11
Imports (mln EUR) YoY Exports (mln EUR) YoY
CPI
target
band
0
1
2
3
4
5
6
7
01-0
1-07
01-0
4-07
01-0
7-07
01-1
0-07
01-0
1-08
01-0
4-08
01-0
7-08
01-1
0-08
01-0
1-09
01-0
4-09
01-0
7-09
01-1
0-09
01-0
1-10
01-0
4-10
01-0
7-10
01-1
0-10
01-0
1-11
01-0
4-11
CPI % YoY Core CPI % YoY NBP reference rate % YoY
CPI (% YoY),
NBP reference
rate (%)
Source: NBP, StatOffice
0
10
20
30
40
50
Jan-03 Jan-04 Jan-05 Jan-06 Jan-07 Jan-08 Jan-09 Jan-10 Jan-11
-20%
-10%
0%
10%
20%
30%
40%
New investment indicator (NBP, sa)
Corporate investment credit YoY (%)
Corporate
investment
credit
3.6 4.2 4.4 4.5 4.23.7 3.7 3.4 3.6
-2
0
2
4
6
8
10
12
Q2'10 Q4'10 Q2'11 f Q4'11 f Q2'12 f
GDP % y/yConsumption % y/yInvestment % y/y Source: StatOffice

20
90
92
94
96
98
100
102
104
106
108
07-10 09-10 11-10 01-11 03-11 05-11 07-11
EURCZK EURPLN EURHUF
High CPI inflation and negative real rates seen as risks for upbeat
households deposits growth forecasts. Loans still grow fast
(decrease due to statistical base effect)
Zloty stable due to MinFin activity, close to its current equilibrium
levels
Foreign investors keep exposure in CEE region. Stock exchanges
corrected lower but on low volumes
Strong rebound of corporate loans along with lower growth of
corporate deposits
Stabilization in the banking sector
Corporate loans
and deposits,
(% YoY)
Household loans
and deposits,
(% YoY)
Stock indices
PX (Czech Rep.)
BUX (Hungary)
WIG20 (Poland)
and S&P500 (USA)
01.01.2009=100
Source: Bloomberg Source: Bloomberg
CEE currencies
vs. EUR,
index
01.01.2010=100
AppendixMacroeconomic update
70
90
110
130
150
170
190
210
04-09 08-09 12-09 04-10 08-10 12-10 04-11
PX (Czech Rep.) BUX (Hungary)
WIG20 (Poland) S&P500 (USA)
0%
10%
20%
30%
40%
50%
60%
70%
80%
01/08 06/08 11/08 04/09 09/09 02/10 07/10 12/10 05/11
Deposits YoY (%) Loans YoY (%)
Mortgage loans YoY (%) Source: NBP
-15%
-10%
-5%
0%
5%
10%
15%
20%
25%
30%
35%
01/08 05/08 09/08 01/09 05/09 09/09 01/10 05/10 09/10 01/11 05/11
Deposits YoY (%) Loans YoY (%) Source: NBP

21
Detailed Results of the Business Lines Q2/11
Retail Banking
Appendix

22
322,0 322,0470,2 470,2
296,2 292,6
107,7
317.1322.0
107.70.0 20.0
40.5 194.020.9
Net interest
inco
me
Net
commission
inco
me
Trading
inco
me
Gains less
losses from
inve
stment
Net
provisions
Costs and
depreciation
Net other
operating
result
Profit before
tax
223.0
-7.5
81.1
0.8
19.7
324.6
69.3 57.5 70.9 56.984.2
108.2 114.6
15.0
98.5 89.9 94.4
45.6
124.396.0
163.2
125.2
193.0
-7.5-10.8-12.2-14.5-15.5-37.6-21.7-28.4-24.5-23.7-19.3-21.5-16.0-27.1
-6.7
Q1/07 Q2/07 Q3/07 Q4/07 Q1/08 Q2/08 Q3/08 Q4/08 Q1/09 Q2/09 Q3/09 Q4/09 Q1/10 Q2/10 Q3/10 Q4/10 Q1/11 Q2/11
BRE Bank Retail BankingSummary of Q2/11: Financial Results
Appendix
81.5108.8 151.08.072.761.574.0-8.795.386.768.229.8 114.370.957.569.3 186.3
Profit before Tax of the Segment
(by quarter, PLN M)
Retail Banking PL mBank CZ & SK
Structure of the Profit before Tax of Retail Banking1) in Q2/11
(PLN M)
Contributors to the Profit before Tax of Retail Banking in Q2/11
(PLN M)
1) Incl. BRE Ubezpieczenia, BRE Wealth Mgt., Aspiro and consolidation
adjustments
mBank/PL
mBank/CZ and SK
Multibank
Private Banking
Other1)
317.1

23
Data as at 30.06.2011 End of 03/11 Change End of 06/11
(M)
(PLN B)
clients +1.5%3.24 M 3.29 M
accounts + 1.0%4.6 M 4.6 M
-9.8%deposits (PLN)21.4 B 19.3 B
loans (PLN) +3.2%31.5 B 32.5 B
thereof:
mortgages (PLN)+7.0%24.4 B 26.1 B
BRE Bank Retail Banking (Poland) Customer Acquisition and Volume Trends
2.74.2
0.4
0.6
0
9
Customers Accounts
Appendix
mBank (Poland) MultiBank
Private Banking
14.7 13.6
5.0
17.31.7
0.7
0
5
10
15
20
25
30
35
Deposits Loans

24
accounts +1.9% 965.5 thou.947.4 thou.
deposits (EUR) +1.1% 0.92 B0.91 B
loans (EUR) +3.4% 381.0 M368.6 M
BRE Bank Retail Banking foreign operations (CZ/SK) Customer Acquisition and Volume Trends
Appendix
503.5 thou.492.1 thou. customers +2.3%
(thou.)
(EUR B)
Czech R. Slovakia
Data as at 30.06.2011 End of 03/11 Change End of 06/11
715.2
369.0
250.3
134.5
0
200
400
600
800
1 000
Customers Accounts
303.6
656.0
260.2
77.4
0
200
400
600
800
1 000
Deposits Loans

25
BRE Bank Retail BankingAcquisition of Microenterprises1)
1) Microenterprises imply self-employed individual customers
� Number of serviced microenterprises
up by 3.6 thousand in Q2/11
� PLN 3,067.1 M of loans granted to
microenterprises at the end of 06/11
out of which 1,797.6 M mortgage loans
Appendix
Volume of loans granted to microenterprises (PLN M) and number of
microenterprises (thou.)
399 thousand microenterprises serviced by BRE Bank Retail Banking
399.3395.7389.7382.9376.0367.1356.0
312.0
235.6
0
500
1 000
1 500
2 000
2 500
3 000
2007 2008 2009 03/10 06/10 09/10 12/10 03/11 06/11
0
100
200
300
400
500
non-morgage loans (LHS)
mortgage loans (LHS)
number of microenterprises at BRE Bank Retail Banking (RHS)
1,147.6 1,971.9 2,546.8 2,672.4 2,889.4 2,940.6 2,935.6 3,018.3 3,067.1
26
4.8%4.8%5.0%
5.2%5.3%
5.0%
4.7%
4.4%4.4%
5.1%5.2%
5.0%4.9%
4.6%4.4%
4.1%4.1%
3.8%
0
5
10
15
20
25
30
35
40
12/06
03/07
06/07
09/07
12/07
03/08
06/08
09/08
12/08
03/09
06/09
09/09
12/09
03/10
06/10
09/10
12/10
03/11
06/11
0%
1%
2%
3%
4%
5%
6%
7%
8%
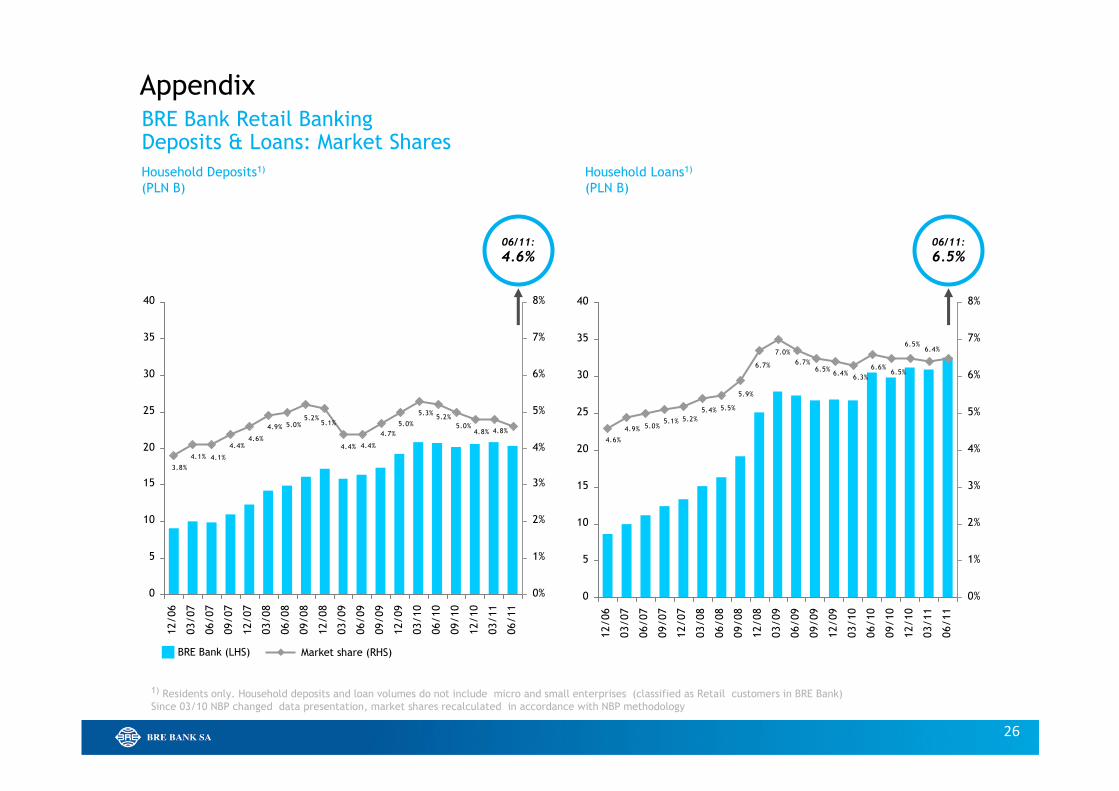
BRE Bank Retail BankingDeposits & Loans: Market Shares
Appendix
06/11:
4.6%
06/11:
6.5%
1) Residents only. Household deposits and loan volumes do not include micro and small enterprises (classified as Retail customers in BRE Bank)
Since 03/10 NBP changed data presentation, market shares recalculated in accordance with NBP methodology
Household Loans1)
(PLN B)
Household Deposits1)
(PLN B)
Market share (RHS)BRE Bank (LHS)
6.4%6.5%
6.5%6.6%
6.3%6.4%
6.5%6.7%
7.0%
6.7%
5.9%
5.5%5.4%
5.2%5.1%5.0%4.9%
4.6%
0
5
10
15
20
25
30
35
40
12/06
03/07
06/07
09/07
12/07
03/08
06/08
09/08
12/08
03/09
06/09
09/09
12/09
03/10
06/10
09/10
12/10
03/11
06/11
0%
1%
2%
3%
4%
5%
6%
7%
8%

27
BRE Bank Retail BankingMortgage Loans: Portfolio Structure and Quality
in Poland
As of 30.06.2011By loan type By currency
Appendix
in Poland, Czech Republic
& SlovakiaBalance-sheet value
(PLN B) 26.14
Average maturity
(years)22.59
Average value per loan
(PLN thou.)284.69
Average LTV
(%)82.06
NPL
(%)1.13
1) mBank-PL and MultiBank2) ‘Other’ includes mainly car loans, loans for goods, services and stocks
Currency Structure of Retail Banking Mortgage Loan Portfolio
(Household Loans) at 30.06.2011
Structure of the Retail Banking1) Loan Portfolio
(Household Loans) at 30.06.2011
BRE Bank’s Mortgage Loan Portfolio
(Retail Banking1) loans to individuals)
FX PLN
90%
14%
86%
10%
1%3%3%4%
89%
Mortgage Loans Credit LinesCredit Cards
Cash loans Other2)
FX Local currency
FX Local currency
20%
80%

28
6579 76 75 72 72 72 72 72
44
52 58 59 61 61 61 62 62
2007 2008 2009 Q1/10 Q2/10 Q3/10 Q4/10 Q1/11 Q2/11
15 16 23 23 23 24 24 25 25
61 6865 65 65 65 65 65 63
27
7754 46 42 33 26 21 18
2007 2008 2009 Q1/10 Q2/10 Q3/10 Q4/10 Q1/11 Q2/11
BRE Bank Retail BankingDistribution Network
Appendix
MultiBank Branches
(in Poland)
Aspiro Distribution Network
(in Poland)
Total (at the end of period): Total (at the end of period):
115122130134142161103 111 131109 134 134 133 133 133 134
� Aspiro is a financial intermediary company
� Aspiro enters into distribution agreements with the Bank
and other banks operating in the Polish market in order
to sell retail banking products via its distribution
network.
Significant part of the products sold by Aspiro are sourced
from BRE Bank.
� Since July 2009, Aspiro operates a distribution network.
As of 30 June 2011 the network comprises 106 locations
across Poland as well as 32 Agent Service Points.
Financial Centres Partner KiosksmKiosks Financial Services Centres Partnership Outlets
� MultiBank had a network of 134 branches at the end
of Q2/11.
106 134

29
26.5
13.6
Q2/10 Q2/11
BRE Bank Retail BankingBRE Ubezpieczenia (BRE Insurance)
Appendix
1) Gross profit of BRE Ubezpieczenia according to its statutory
financial statements (including deferred acquisition costs)
Bancassurance Retail
Gross Written Premium (PLN M)
Direct Insurance (Internet platform)
Gross Written Premium (PLN M)
Co-operation with BRE Leasing
Gross Written Premium (PLN M)
+96%
Profit before Tax1) (PLN M)
556.3
287.9
Q2/10 Q2/11
55.541.6
Q2/10 Q2/11
60.449.9
Q2/10 Q2/11
+93% +33% +21%
� Results in all lines of business improved; good record of claims
in insurance history and growth of written premiums
� BRE Bank Retail Banking Internet Platform – SUS and Insurance
Centre key figures in Q2/11:
- 154.3 thou. car insurance contracts
- 21.6 thou. travel insurance contracts
- PLN 55.5 M of premium written (total value of all insurances sold during period)

30
BRE Bank Retail Banking (Poland)Clients & volumes
Appendix
Deposits
(PLN B)
Clients
(thou.)
+1.5%
Loans total
(PLN B)
Mortgage loans
(PLN B)
493570 588 603 592 592 595 600
2,035 2,296 2,371 2,436 2,511 2,581 2,644 2,688
4
76 5
4555
12/08 12/09 03/10 06/10 09/10 12/10 03/11 06/11
14.113.613.713.213.411.711.810.9
18.417.114.915.014.1
16.7 17.4 17.3
0.70.6 0.6 0.7 0.7
0.60.60.5
12/08 12/09 03/10 06/10 09/10 12/10 03/11 06/11
MultiBank Private BankingmBank/PL
+6.9%+5.3%
-2.5%
14.614.714.213.810.9 12.7 13.8 14.0
4.45.2
5.7 5.5 5.2 5.1 5.0 4.72.52.1
2.3 2.1 2.0 1.8 1.7 1.6
12/08 12/09 03/10 06/10 09/10 12/10 03/11 06/11
11.711.011.210.711.09.59.69.2
12.2 12.5 13.215.0 14.7 15.3 15.2 16.3
0.40.40.40.40.4
0.30.30.3
12/08 12/09 03/10 06/10 09/10 12/10 03/11 06/11

31
Detailed Results of the Business Lines Q2/11
Corporates & Financial Markets
Appendix

32
168.6
117.2
167.6
11.5 14.0
-154.0
23.6
86.6
49.4
142.5128.2
92.4
137.7
Vectra
17.01)
30.51)
14.81)
Q1/08
Q2/08
Q3/08
Q4/08
Q1/09
Q2/09
Q3/09
Q4/09
Q1/10
Q2/10
Q3/10
Q4/10
Q1/11
Q2/11
223,4
324,1 324,1
391,7
313,1
95,2 95,2
223.4
92.4
0.0
2.5
2.3
217.9
78.665.1
100.6
Net interest inco
me
Net co
mmission inco
me
Dividend Inco
me
Trading inco
me
Inco
me on inve
stment secu
rities
Net provisions
Costs and depreciation
Net other operating result
Profit/loss before tax
Corporates and Financial Markets Summary of Q2/11: Financial Results
Appendix
Structure of the Result before Tax of the Segment in Q2/11
(PLN M)
Result before Tax of the Segment
(by quarter, PLN M)
1)Q1/08: Repayment of default loan Q2/10 and Q3/10 – partial sale of PZU
shareholding
321.0
137.2
81.1

33
15.417.3
4.73.9
31.03.2011 30.06.2011
14.3 14.5
11.6 11.1
31.03.2011 30.06.2011
Enterprises
acc. to NBP definition
Corporates and InstitutionsCustomer Acquisition and Volume Trends
Appendix
1) Incl. Intermarket Bank and Magyar Factor
Corporate Loans (PLN B)
Corporate Deposits (PLN B)
+213corporate clients13,423 13,636
-1.3%corporate loans (PLN)25.9 B 25.51) B
+1.4%
thereof:
loans for enterprises (PLN)
14.3 B 14.5 B
+5.8%corporate deposits (PLN)20.1 B 21.21) B
+12.8%
thereof:
deposits of enterprises (PLN)
15.4 B 17.3 B
End of 03/11 Change End of 06/11

34
4,00%
6,00%
8,00%
10,00%
12,00%
BRE Bank’s Market Share in Corporate Loans and Deposits 01/07
– 06/11
Corporates and InstitutionsLoans & Deposits: Market Share1)
Source: NBP reports
� PLN 17.3 B of corporate deposits in BRE Bank
at the end of Q2/11 (up by 12.8% QoQ)
� PLN 14.5 B of corporate loans in BRE Bank
at the end of Q2/11 (up by 1.4% QoQ)
1) I.e. enterprises according to NBP
(include only state, private and co-operative companies)
17.315.416.1
12.9 12.7 13.3 12.514.0
14.2 13.712.2
13.1 13.314.6 14.6 14.4 14.9
06/07
09/07
12/07
03/08
06/08
09/08
12/08
03/09
06/09
09/09
12/09
03/10
06/10
09/10
12/10
03/11
06/11
Appendix
14.514.313.513.714.013.614.0
14.715.115.514.6
13.713.512.8
11.511.010.1
06/07
09/07
12/07
03/08
06/08
09/08
12/08
03/09
06/09
09/09
12/09
03/10
06/10
09/10
12/10
03/11
06/11
Corporate1) Deposit Volume
(BRE Bank only, PLN B)
Corporate1) Loan Volume
(BRE Bank only, PLN B)
Corporate deposits Corporate loans
9.4%
6.2%

35
12/09 03/10 06/10 09/10 12/10 03/11 06/11
Corporate Clients’ Loan Volume
(BRE Bank, PLN B)
Corporate Clients:
Number and Structure
Corporates and Institutions Client Base and development of Loans and Deposits
Appendix
K1 898
K3
8,128
K3
8,111
K3
8,104
K3
8,138
K3
8,177
K3
8,238
K3
8,359
K2
4,132
K2
4,071
K2
3,993
K2
3,905
K2
3,679
K2
3,810
K2
3,860
K1 1,145K1 1,114K1 1,101K1 1,083K1 1,062K1 993
12/09 03/10 06/10 09/10 12/10 03/11 06/11
12,836 12,783 13,026 13,126 13,271
17.1 17.1 17.218.0
21.3
13%
39%
43%
5%11%
35%
48%
6% 12%
34%
49%
5%13%
32%
50%
5%
12%
31%
44%
13%
12/09 03/10 06/10 09/10 12/10 03/11 06/11
16.3 15.6 15.9 15.9
19.5
Customer segments K1, K2 and K3 include, besides enterprises, also public and non-
bank financial institutions (leasing and insurance companies, pension funds etc.)
K3 – is the segment of SMEs with annual sales between PLN 3 M and 30 M
K2 – is the segment of medium-sized corporations with annual sales
between PLN 30 M and PLN 500 M
K1 – is the segment of the largest corporations with annual sales
over PLN 500 M
Segments of corporate clients:
Reverse Repos & Repos
13,423
19.7
11%
13%
29%
47%
19.6
Corporate Clients’ Deposit Volume
(BRE Bank, PLN B)
11%
48%
39%
11%
49%
37% 37%
50%
11%
37%
49%
12%
31%
41%
11%
17% 14%
11%
42%
33%
2% 3% 2% 2%
13,63619.6
10%
12%
42%
36%
21.1
5%
12%
27%
56%

36
Number of Clients Using Cash
Consolidation Services
Direct Debit
(thou. of transactions)
Identification of Trade Payments
(M of transactions)
Cash Management –
Strategic Product Line Supporting
Long-Term Customer Relations
Corporates and InstitutionsCash Management
Appendix
Net Income on Cash Management
products
539 614
Q2/10 Q2/11
667835
Q2/10 Q2/11
2.172.45
Q2/10 Q2/11
+13.9% +25.1% +12.9%
+14.4%
2832
Q2/10 Q2/11

37
06/10 12/10 06/11
Volume of transactions with local governments
Corporates and InstitutionsProducts for local governments and Structured and Mezzanine Finance products
Appendix
� Volume of transactions with local governments
increased by 9.3% QoQ
� Market share of loans to public sector reached 4.6% at
the end of June 2011
v. 4.3% in Q1/11 and 1.2% in Q2/10.
Volume of Structured and Mezzanine Finance
Volume of transactions with local governments Volume of Structured and Mezzanine Finance
12/10 03/11 06/11
+13.5%
+9.3%
+13.3%
+19.5%
� Volume of Structured and Mezzanine Finance
increased by 13.3% YoY and 19.5% YTD
� In 2011, BRE Bank participated in 11 syndicated
loans, 1 guarantee (PLN 2,104 M) and 3 bilateral
loans (PLN 111.9 M).

38
Corporates and Institutions Leasing and Factoring
IntermarketGroup Companies1)
BRE Leasing
1) Companies consolidated by BRE Bank: Intermarket Bank AG, Transfinance a.s., Polfactor S.A. and Magyar Factor zRt.
� PLN 11.1 M pre-tax profit in Q2/11 vs. PLN 14.9 M in Q1/11
� Concluded leasing contracts:
- Total of PLN 623 M in Q2/11, +13.2% QoQ in total and +24.9%
QoQ on movables
� Decrease of gross profit in Q2/11 due to lower margins on new
sales compared to expired agreements
� After Q2/11, BRE Leasing ranked 3rd in the Polish market
with 8.7% market share
Profit before Tax (PLN M)
Profit before Tax (PLN M)
14.913.9
Q2/10 Q2/11
-18.0%
Appendix
� PLN 12.5 M pre-tax profit in Q2/11 (+47.0% QoQ);
supported by improving economic environment
� PLN 6.2 B of new sales in Q2/11 (+14.0% QoQ)
Increase of sales visible across all Group companies
Polfactor
� PLN 4.3 M pre-tax profit in Q2/11 (+13.9% QoQ)driven by increased sales and reduced loan loss provisions
� Sales at PLN 1.3 B in Q2/11 (+18.1% QoQ);
� Ranked 5th in the Polish Factoring Associationwith a market share of 8.1% in H1 2011
12.5
7.9
Q2/10 Q2/11
+59.0%

39
1) As at 31.05.2011; calculations based on own and NBP data.2) After Fitch Polska S.A., Rating & Rynek, 30.06.2011 and own calculations (without BGK road bonds).
Trading and InvestmentsMarket Shares
Treasury
Bills and Bonds
7.9%
IRS/FRA
16.7%
MarketBRE Bank
13.56%
#518.83%
#2
18.20%
#2
BRE Bank’s Market Share1)
in Investment Banking Services
BRE Bank in the Market of Non-Treasury Debt2)
at 30.06.2011 (PLN M)
5.5%
FX Spot & Forward
14,154
19,298
15,700
2,5753,634
2,129
Short-term Debt Corporate Debt Mid-term bank debt
Appendix

40
726 723 721 699691 672 662 640 629 624
3,727 3,637 3,493 3,349 3,142 3,195 3,070 3,075 3,119 3,156
51
74 6861 59
56 58 54 53 52
03/09 06/09 09/09 12/09 03/10 06/10 09/10 12/10 03/11 06/11
Loan Portfolio (PLN M)
Balance-sheet Exposure (net value)
Trading and InvestmentsBRE Bank Hipoteczny (BBH)
1) In July 2004 BRE Bank Hipoteczny stopped granting loans to retail customers.
The volume of housing loans represents the existing portfolio still managed by the Bank.
4,527 4,427 4,275 4,107 3,889 3,925
� BBH’s total balance-sheet (net value) and off-balance-
sheet loan portfolio at the end of Q2/11 stood at
PLN 4.44 B, up by 3.2% YoY.
� Housing developing loan portfolio at the end of Q2/11
at PLN 766.4 M (total net balance-sheet value and off-
balance-sheet).
� PLN 3.7 M profit before tax in Q2/11, down by 66% YoY
(PLN 11.0 M in Q2/10)
and down by 59% QoQ (PLN 9.1 M in Q1/11).
� C/I ratio increased from 45.3% at the end of 2010 to
49.4% in Q2/11.
3,787 3,769 3,800
Profit before tax
(PLN M)
Commercial loans Housing loans1)Local government loans
3.7
11.0
Q2/10 Q2/11
-66%
Appendix
3,831
41
5,3974,226 4,343 4,466 4,781 4,766
1,672
1,734 1,999 1,897 1,995 1,690
Q1/10 Q2/10 Q3/10 Q4/10 Q1/11 Q2/11
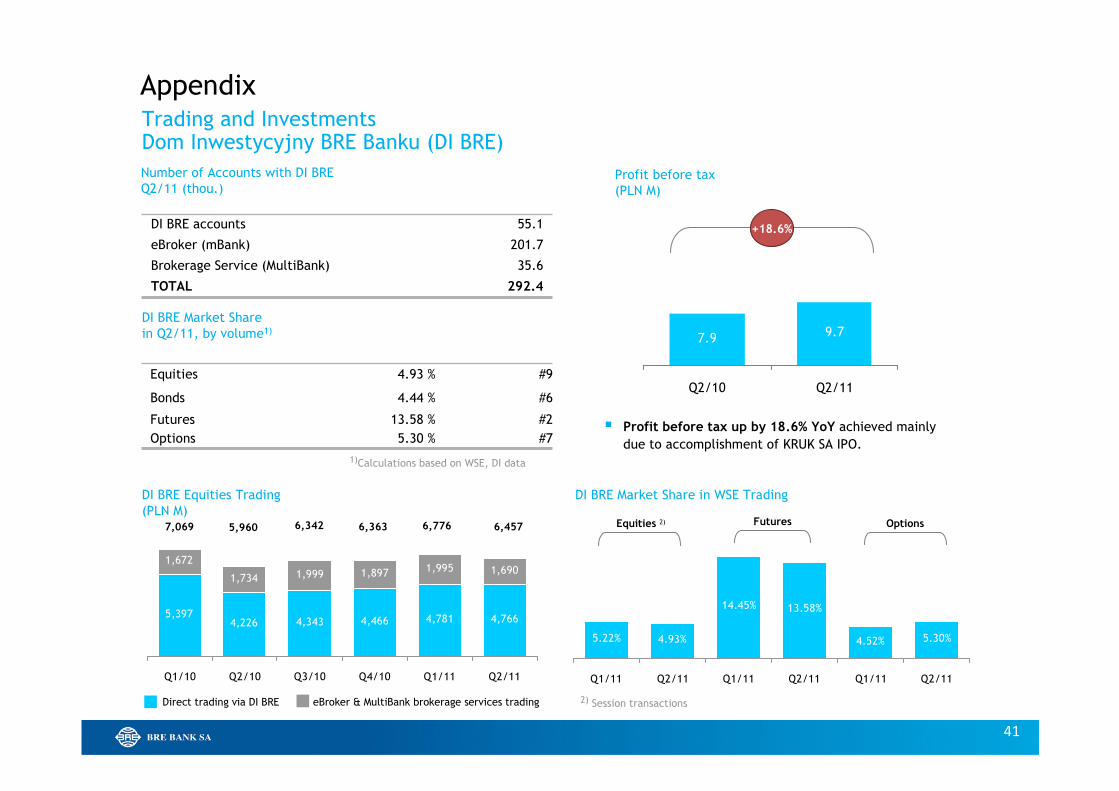
1)Calculations based on WSE, DI data
Equities 4.93 % #9
Bonds 4.44 % #6
Futures 13.58 % #2
Options 5.30 % #7
Trading and InvestmentsDom Inwestycyjny BRE Banku (DI BRE)
DI BRE accounts 55.1
eBroker (mBank) 201.7
Brokerage Service (MultiBank) 35.6
TOTAL 292.4
Equities 2) Futures Options7,069 5,960 6,342 6,363 6,776
� Profit before tax up by 18.6% YoY achieved mainly
due to accomplishment of KRUK SA IPO.
Number of Accounts with DI BRE
Q2/11 (thou.)
DI BRE Market Share
in Q2/11, by volume1)
Profit before tax
(PLN M)
9.77.9
Q2/10 Q2/11
DI BRE Equities Trading
(PLN M)
DI BRE Market Share in WSE Trading
eBroker & MultiBank brokerage services tradingDirect trading via DI BRE
+18.6%
Appendix
6,457
5.22% 4.93%
14.45% 13.58%
4.52% 5.30%
Q1/11 Q2/11 Q1/11 Q2/11 Q1/11 Q2/11
2) Session transactions

42
Additional Information: Selected Financial Data
Appendix

43
724.21,027.8
1,392.51,658.2 1,811.0
542.5436.3
2006 2007 2008 2009 2010 Q2/10 Q2/11
Fee and commission income
(PLN M)
Net interest income
(PLN M)
Trading and other income
(PLN M)
Total income
(PLN M)
2.1
416.4
564.2 551.5 594.7745.9
208.2172.4
2006 2007 2008 2009 2010 Q2/10 Q2/11
484.3610.0
742.4598.4 567.7
143.6157.4
2006 2007 2008 2009 2010 Q2/10 Q2/11
1,624.92,202.0
2,686.4 2,851.3 3,124.6
894.3766.7
2006 2007 2008 2009 2010 Q2/10 Q2/11
2.3 2.3 2.2 2.1 2.52.3
NIM
CAGR: +
12%
+24% +21
%
+17%
-9%
CAGR: +
14%CAGR: +
3%
CAGR: +
20%
BRE Group’s historical performance (1/3)
Appendix

44
Pre-provision income
(PLN M)
Operating costs
(PLN M)
Loan Loss Provisions
(PLN M)
Net profit
(PLN M)
1,044.41,279.6
1,550.1 1,544.8 1,617.3
428.7391.6
2006 2007 2008 2009 2010 Q2/10 Q2/11
580.6
922.41,136.3
1,306.5
1,885.5
465.7374.5
2006 2007 2008 2009 2010 Q2/10 Q2/11
58.6203.5
46.0 76.8269.1
1,097.1
634.8
2006 2007 2008 2009 2010 Q2/10 Q2/11
421.3
710.1856.9
128.9
641.6
124.3313.2
2006 2007 2008 2009 2010 Q2/10 Q2/11
Cost of risk (bps)
24 63 210 114 153 3927 20.8% 27.4% 3.2% 11.8% 10.8% 15.9%28.1%
ROE net
63.7% 55.1% 54.2% 51.8% 51.1% 48.5%55.5%
C/I ratio
CAGR: +
9%
+24%
+9%
CAGR: +
27%
-71%+15
2%
CAGR: +
9%
BRE Group’s historical performance (2/3)
Appendix

45
15.018.8 16.6 17.5 25.1
17.121.0
9.5
12.9 21.025.1
25.126.1
24.9
0.6
0.2
0.70.1
0.80.9
0.2
2006 2007 2008 2009 2010 Q2/10 Q2/11
Corporate clients Individual clients Public sector
+6%
Total gross loans1)
(PLN B)
Total assets
(PLN B)
Total deposits
(PLN B)Equity and CAR
(PLN M)
42.356.0
82.6 81.090.0 88.9 88.7
2006 2007 2008 2009 2010 Q2/10 Q2/11
7,599.46,674.7
7,077.3
4,271.24,048.0
2,622.23,441.3
2006 2007 2008 2009 2010 Q2/10 Q2/11
19.5 25.0 23.4 25.6 23.2 25.514.2
3.3
5.2 6.4 7.45.1 5.6
2.2
29.6
22.526.3
27.721.5
10.6
6.7
1.9
1.0
0.8
2.80.82.11.3
2006 2007 2008 2009 2010 Q2/10 Q2/11
Corporate loans Non-mortgage loans
Mortgage loans Public sector and other
61.854.453.034.423.9 57.9 63.5
47.142.837.832.424.7 44.0 46.5
CAGR: 1
6%-0.2%
CAGR: +
21%
CAGR: +
14%
CAR
10.39% 10.04% 11.50% 15.89% 12.03% 16.08%10.16%
CAGR: +
22%+14
%
+10%
1) Mortgage loans on quarterly basis acc. to management data
BRE Group’s historical performance(3/3)
Appendix

46
Additional Information: Selected Financial Data
Consolidated Profit and Loss Account under IFRS
PLN thou.By quarter
Q2/10 Q3/10 Q4/10 Q1/11 Q2/11
Net interest income 436,254 481,048 503,125 506,524 542,486
Net commission income 172,449 199,211 200,366 207,388 208,208
Dividend income 2,611 5,222 10 9 2,652
Net trading income 122,058 88,169 104,274 95,579 105,808
Gains less losses from investment securities 16,896 29,604 (1,352) (4,294) (2,511)
Other operating income 93,268 63,796 102,076 58,917 72,001
Net credit and loans impairment provisions (203,500) (128,230) (125,988) (114,110) (58,620)
Overhead costs (332,220) (358,253) (394,941) (349,783) (367,770)
Depreciation/Amortisation (59,334) (58,672) (59,711) (58,611) (60,881)
Other operating cost (77,477) (41,969) (64,053) (32,638) (34,338)
Operating profit 171,005 279,926 263,806 308,981 407,035
Profit before tax 171,005 279,926 263,806 308,981 407,035
Net profit attributable
to owners of BRE Bank124,251 206,453 195,482 229,708 313,171
Appendix

47
92.4
128.2
81.1
Q2/10 Q1/11 Q2/11
317.1
81.5
186.3
Q2/10 Q1/11 Q2/11
407.0
171.0
309.0
Q2/10 Q1/11 Q2/11
Appendix
Summary of Q2/2011 in BRE Bank Group - Profitability of the Business Segments
+31.7%
+138.0% +14.0%
-27.9%+70.2%
+289.1%
� Retail Banking with record high pre-tax profit supported by strong product sales, increasing clients’ activity and the disposal of non-performing loans
� Corporates and Financial Markets: solid recurrent performance impacted by prudent provisioning of individual cases
BRE Bank Group Retail Banking Corporates & Financial Markets
Quarterly Result before Tax by Business Segment
(PLN M)

48
4.0
25.6
5.6
27.4
6.3 5.1
17.0
22.5
6.76.2
12.8
9.48.0
6.3
28.226.0
16.6
4.11.1
16.6
BRE
Ubezpieczenia
BRE Leasing DI BRE BRE
Bank
Hipoteczny
Intermarket
Bank
Polfactor BRE WM Aspiro BRE.locum Other
-14.9 -54.3
66.5 75.2
386.1
119.4
Q2/10 Q2/11
Additional Information: Selected Financial DataResults of Subsidiaries
Profit before tax: 171.0
Profit before tax: 407.0
Appendix
Profit before Tax of Consolidated Subsidiaries
(PLN M)
Contribution of BRE Bank Group Subsidiaries to Profit before Tax in Q2/11
(PLN M)
Consolidation adjustments BRE BankSubsidiaries
H1/10 H1/11
� H1/2011 profit
before tax of
consolidated
subsidiaries at
PLN 129.1 M
v. PLN 126.4 M in
H1/10 (+2.2% YoY)
1) Excluding companies not consolidated in 2011: Tele- Tech Investments and BCF ( PLN 1.7M)

49
322,0
484,9548,2 542.5506.5
322.0
-2.8
162.9
60.6
Q1/11 Retail
Banking
Corporates
&
Institutions
Trading and
Investments
Other and
Eliminations
Q2/11
Corporates & Financial Markets
1) Margin calculated as net interest income to average income-earning assets
Additional Information: Selected Financial DataNet Interest Income & Margin
+7.1%
Q2/10 Q3/10 Q4/10 Q1/11 Q2/11
Cash and short-term deposits 5% 4% 4% 4% 4%
Investment securities 23% 24% 22% 22% 20%
Loans and advances 70% 71% 72% 71% 73%
Debt securities
held for trading
1% 1% 2% 2% 3%
Other 1% 0% 0% 1% 0% 3.6
2011
2.4
3 m3m 6m 9 m 12 m 3 m 6 m 9m 12 m 6 m
NIM 2.2 2.3 2.3 2.3 2.0 2.1 2.1 2.2 2.5
2009 2010
NII/RWA 2.6 3.0 3.0 3.0 2.9 3.1 3.4 3.5 3.6
859.7
Appendix
863.5 876.7 891.5
43.3 37.0 35.8 33.1 37.3
188.5200.2195.9205.8199.9
603.2 611.3 628.7 631.2 686.7
23.220.215.17.78.1
1.75.21.8
6.81.3
Q2/10 Q3/10 Q4/10 Q1/11 Q2/11
Interest Income Structure
(PLN M)
Net Interest Income, Q2/11 by Business Lines
(PLN M)
Interest Income Structure
(%)
Net Interest Margin (NIM at the end of period,%)1)
and NII/RWA ratio
937.5

50
107,7
184,9208,4
107.7
207.4 208.2
23.4 -0.1
77.2
Q1/11 Retail
Banking
Corporates
&
Institutions
Trading and
Investments
Other and
Eliminations
Q2/11
59.1 51.5 56.4 65.3 72.14.7
2.52.22.9 3.19.7 9.5 9.89.7 9.8
85.2 84.983.9
76.375.7
25.3 29.5 31.5 27.631.844.4 46.0
50.7 49.148.8
39.434.336.3
43.042.9
23.441.5
41.140.535.4
Q2/10 Q3/10 Q4/10 Q1/11 Q2/11
Additional Information: Selected Financial Data Commission Income
Q2/10 Q3/10 Q4/10 Q1/11 Q2/11
Credit related 21% 17% 18% 21% 22%
Portfolio management 1% 1% 1% 1% 1%
Guarantees and documentary transactions 3% 3% 3% 3% 3%
Payment cards 27% 28% 27% 25% 25%
Brokerage fees 9% 10% 10% 9% 10%
Accounts & money transfers 16% 15% 16% 16% 15%
Insurance activity 15% 14% 12% 11% 12%
Other (incl. custody) 8% 12% 13% 14% 12%
Appendix
282.7
Corporates & Financial Markets
+0.4%302.6 314.8 306.7
Commission Income Structure
(PLN M)
Commission Income Structure
(%)
Net Commission Income, Q2/11 by Business Lines
(PLN M)
330.0
51
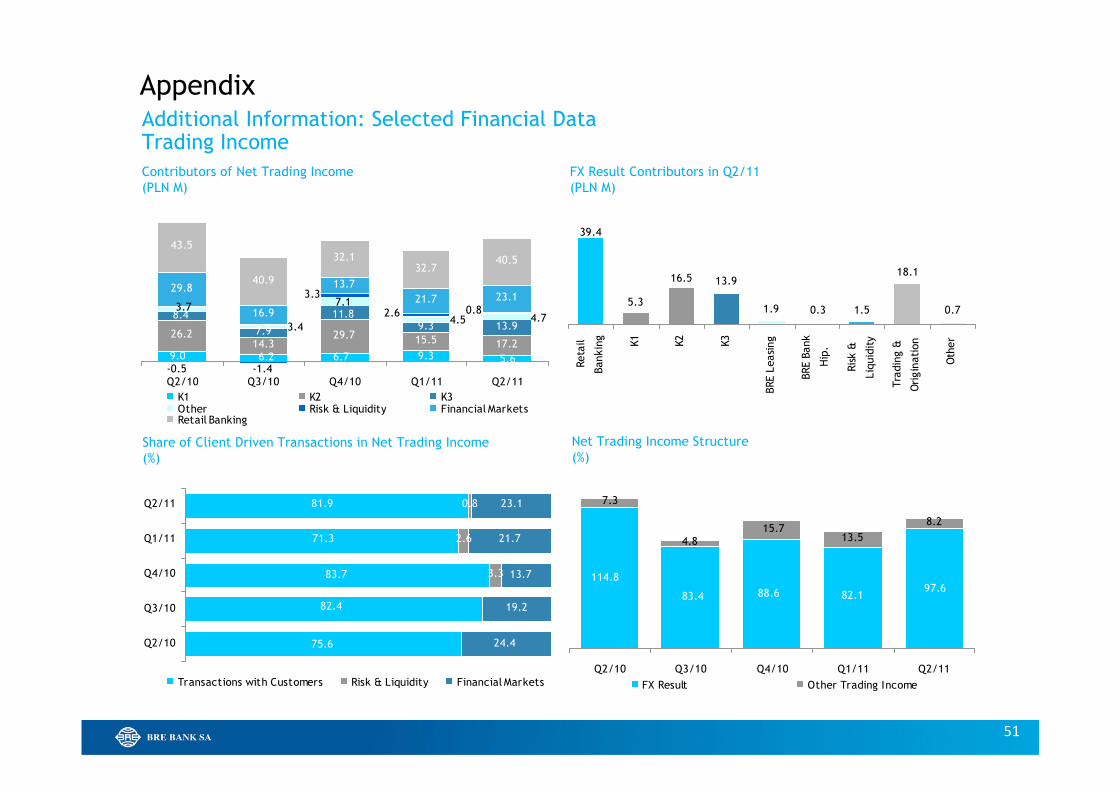
Additional Information: Selected Financial DataTrading Income
Appendix
Contributors of Net Trading Income
(PLN M)
Net Trading Income Structure
(%)
FX Result Contributors in Q2/11
(PLN M)
Share of Client Driven Transactions in Net Trading Income
(%)
9.0 6.2 6.7 9.3 5.6
29.714.3
26.215.5 17.2
8.4
7.9
11.89.3 13.93.4
7.1
4.74.53.7
-0.5 -1.4
3.3
2.6 0.8
23.121.7
13.7
16.9
29.8
43.5
40.9
32.132.7
40.5
Q2/10 Q3/10 Q4/10 Q1/11 Q2/11
K1 K2 K3Other Risk & Liquidity Financial MarketsRetail Banking
0.3 1.5
18.1
0.7
39.4
5.3
16.5 13.9
1.9
Retail
Banking
K1
K2
K3
BRE Leasing
BRE Bank
Hip.
Risk &
Liquidity
Trading &
Origination
Other
75.6
82.4
83.7
71.3
81.9
3.3
2.6
0.8
24.4
19.2
13.7
21.7
23.1
Q2/10
Q3/10
Q4/10
Q1/11
Q2/11
Transactions with Customers Risk & Liquidity Financial Markets
114.8
83.4 88.6 82.197.6
15.74.8
7.3
13.5
8.2
Q2/10 Q3/10 Q4/10 Q1/11 Q2/11
FX Result Other Trading Income

52
Additional Information: Selected Financial DataAdministrative Expenses Structure
Appendix
Structure of Administrative Expenses incl. Depreciation
(PLN M)
C/I Ratio of BRE Bank Group
(%, as at the end of period)
48.549.1
51.851.051.2
06/10 09/10 12/10 03/11 06/11
201.1190.5219.3194.2171.5
142.6136.5
145.6148.2
165.3
60.958.6
59.7
58.759.3
24.0
10.3
15.815.2 22.8
391.6 416.9 454.6 408.4 428.6
Q2/10 Q3/10 Q4/10 Q1/11 Q2/11
Personnel costs Maintenance Depreciation Other

53
46.546.444.0 44.5 47.1
0.22)
0.22)
06/10 09/10 12/10 03/11 06/11
60.158.2
59.455.6 54.61.2
2) 1.22)
06/10 09/10 12/10 03/11 06/11
Additional Information: Selected Financial DataLoans and Deposits
1) Data related to gross loans
Appendix
BRE Bank1) Market1)
QoQ +2.6% +4.5%
YoY +9.7% +8.3%
BRE Bank Market
QoQ +0.3% +1.6%
YoY +6.2% +8.0%
2) Intermarket Bank and Magyar Factor
Loans
(PLN B, net)
Deposits
(PLN B)
+10.2%
-1.8% +8.8% +0.0%
+1.3% +5.9% -1.3%
+6.2%
59.4 61.3
+3.2%
+0.3%
46.7

54
Loans Sources of financing
� The ratio of loans to deposits
stood at 131.3% in Q2/11
� However, funding policy for FX risk mitigation is
implemented
� BRE mid-term loans in CHF fund CHF-denominated
mortgages, therefore...
...the ‘real’ loan to deposit ratio
is 86.1%
LtD Ratio in BRE Bank Group
Deposits
FX loans from banks
Subordinated debt in CHFMortgage bonds
Additional Information: Selected Financial Data Loan to Deposit Ratio
Appendix
Structure of Financing Loans of BRE Bank Group
at 30.06.2011 (PLN B)
125.0 127.6 131.3
77.5 84.0 86.1
Q2/10 Q1/11 Q2/11 Q2/10 Q1/11 Q1/11
L/D - balance sheet L/D "real" ratio

55
40.638.1
43.5 43.139.8
18.821.119.7
18.022.5
8.1 8.88.8 9.1
9.5
1.8 1.81.9
1.71.73.5 3.53.2 3.1
3.2
03/10 09/10 12/10 03/11 06/11
24.725.525.422.021.6
22.421.2
22.4 21.2 22.1
10.69.28.4
7.97.7
1.9 1.6
1.71.7
1.61.8 1.9
1.9 1,91.9
06/10 09/10 12/10 03/11 06/11
AppendixAdditional Information: Selected Financial Data Balance Sheet Analysis – Currency Structure
06/10 09/10 12/10 03/11 06/11
PLN 39% 40% 43% 43% 40%
CHF 40% 39% 37% 36% 37%
EUR 14% 15% 14% 15% 17%
USD 4% 3% 3% 3% 3%
Other 3% 3% 3% 3% 3%
06/10 09/10 12/10 03/11 06/11
PLN 50% 52% 55% 57% 52%
CHF 30% 29% 28% 25% 30%
EUR 12% 12% 11% 12% 12%
USD 3% 2% 2% 2% 2%
Other 5% 5% 4% 4% 4%
1) incl. amounts due to other banks and customers and subordinated liabilities
61.3
Currency Structure of Loans
(PLN B)
Currency Structure of Amounts due to banks and customers1)
(PLN B)

56
55.6 54.659.4 58.2 60.1
2.53.0
5.5 4.3 2.80.70.8
1.6 1.8 1.41.91.5
1.2 1.01.0
18.919.2
18.8 16.1 16.7
1.22.61.81.6
3.1 4.33.84.8
3.73.3
1.2 1.2
06/10 09/10 12/10 03/11 06/11
Additional Information: Selected Financial Data Balance Sheet Analysis - Assets
1) Gross loans and advances to customers (excl. ‘other advances’)
2) Intermarket Bank and Magyar Factor (AFS)
06/10 09/10 12/10 03/11 06/11
Loans and advances to customers 63% 65% 66% 66% 68%
Loans and advances to banks 6% 3% 3% 5% 3%
Trading securities 1% 1% 2% 2% 2%
Derivative financial instruments 2% 2% 1% 1% 1%
Investment securities 21% 23% 21% 18% 19%
Pledged assets 3% 2% 2% 3% 1%
Other 4% 4% 5% 4% 5%
Non-current assets held for sale 0% 0% 0% 1% 1%
06/10 09/10 12/10 03/11 06/11
Corporate customers 41% 41% 42% 42% 40%
Retail customers 57% 56% 55% 54% 57%
Public sector 2% 3% 3% 3% 3%
Appendix
88.9 84.4 90.1 89.0
Structure of Assets
(PLN B)
Loans and Advances to Customers1)
Portfolio by Customer Category (PLN B)
22.6 23.2 25.6 24.6 24.3
1.2 2)1.2 2)
35.333.533.7
31.828.8
1.1
1.4
1.9 1.92.0
03/10 09/10 12/10 03/11 06/11
88.7

57
44.5 44.5 47.4 46.4 46.5
26.327.928.726.028.4
1.41.51.4
1.51.36.8
6.9
7.1 7.2 7.6
6.15.25.5
5.57.9
0.8 0.8
06/10 09/10 12/10 03/11 06/11
26.1 24.6 25.1 25.5 24.9
17.6 19.521.4 20.11) 21.21)
0.8 0.4
0.9 1.0 0.6
06/10 09/10 12/10 03/11 06/11
Additional Information: Selected Financial Data Balance Sheet Analysis - Liabilities
06/10 09/10 12/10 03/11 06/11
Liabilities to customers 49% 53% 52% 52% 52%
Liabilities to other banks 32% 31% 32% 31% 30%
Debt securities in issue 1% 2% 2% 2% 2%
Equity (total) 8% 8% 8% 8% 8%
Other 10% 6% 6% 6% 7%
Liabilities held for sale 0% 0% 0% 1% 1%
03/10 06/10 09/10 12/10 06/11
Retail customers 59% 55% 53% 55% 54%
Corporate customers 39% 44% 45% 43% 45%
Public sector 2% 1% 2% 2% 1%
Appendix
88.9 84.4 90.1 89.0
1) Incl. Intermarket Bank and Magyar Factor (LFS)
Structure of Liabilities
(PLN B)
Structure of Deposits
(PLN B)
88.7

58
Additional Information: Selected Financial Data Funding - Maturity of Long- and Midterm FX Loans
� Since 2010 mid-term loans in the amount
of CHF 3.0 B primarily maturing in 2010 and 2011
were extended to longer tenors
(up to 2013 - 2018)
� Asset liability profile in foreign currencies
significantly improved
� In H1/11 BRE Bank was granted 3 additional FX
loans: EUR 22.5 M, EUR 30 M and CHF 10 M
� BRE Bank repaid EUR 150 M and CHF 100 M
in H1/11
� By the end of 2011 BRE Bank will need to refinance PLN 1.7 B or 7.0% of long- and mid-term loans drawn in the past to fund FX lending(PLN 4.4 B or 17.9% by the end of 2012)
Appendix
Significant improvement of funding profile achieved
Maturity of Long- and Mid-term FX Loans by the end of 2012
(PLN B)
1.7 2.7
24.6
Total LT funding 2011 2012
repayments

59
0
10
20
30
40
50
60
70
Q1/06
Q2/06
Q3/06
Q4/06
Q1/07
Q2/07
Q3/07
Q4/07
Q1/08
Q2/08
Q3/08
Q4/08
Q1/09
Q2/09
Q3/09
Q4/09
Q1/10
Q2/10
Q3/10
Q4/10
Q1/11
Q2/11
0%
2%
4%
6%
8%
10%
12%
14%
16%
18%
RWA (PLN B; LHS) CAR (%; RHS)
Additional Information: Selected Financial Data BRE Bank Group’s Capital Adequacy Ratio (CAR) in Q2/11
� CAR at 16.08% in 06/11 compared to 16.20% in 03/11 and 12.03% in 06/10
� Core Tier 1 ratio at 10.70% compared to 11.01% in 03/11 and 6.68% in 06/10
� RWA at PLN 60.5B in 06/11compared to PLN 58.4B in 03/11 (+3.7%)
Appendix
11.01
Core Tier 1
10.70
Core Tier 1
-60 bps +48 bps
03/11 RWA increase in
Q1/11
Increase of own
funds
06/11
Relation between Capital Adequacy Ratio (CAR)
and Risk Weighted Assets (RWA)
Change of CAR under Basel II
Basel I Basel II
CAR at solid level of 16.08%; Core Tier 1 Ratio at 10.70% in 06/11
16.20% 16.08%

60
-22-46
-71
-131
-210
-249
-200-177
-204
-128 -126 -114
-59
-439
Q1/08 Q2/08Q3/08 Q4/08 Q1/09Q2/09 Q3/09 Q4/09 Q1/10Q2/10 Q3/10 Q4/10Q1/11 Q2/11
Specific provisions to the default
portfolio (coverage ratio) under IFRS
Additional Information: Selected Financial DataQuality of BRE Bank Group’s Loan Portfolio
Appendix
6.1
3.6
11.4
03/1103/09 06/09 09/09 12/09 03/10 06/10 09/10 12/10 06/11
Corporate 3.3 5.5 7.9 8.7 9.8 11.2 11.9 11.8 10.8
Retail 1.3 1.7 2.0 2.4 2.8 2.9 3.2 3.3 2.3
Total 2.0 3.0 4.1 4.6 5.2 5.5 5.9 5.9 5.0
-269.1 -1,097.1 -634.8
Quality of the Loan Portfolio of BRE Bank Group Impairment losses on loans and advances
(consolidated data, PLN M)
97.7% 97.8% 96.6% 95.3% 94.7% 94.0% 94.7% 94.4% 95.0%
2.3% 2.2% 3.4% 4.7% 5.3% 6.0% 5.3% 5.6% 5.0%
12/07 12/08 06/09 12/09 06/10 09/10 12/10 03/11 06/11
Performing loans Impaired loans
71% 59% 67% 68% 68% 64% 68% 68%
NPL in Corporate and Retail Loan Portfolios (under NBP rules1)) (%)
1)NPLs under NBP rules (balance-sheet NPLs to total loans)
65%

61
BRE Bank’s Investor Relations Officers at your service:
Visit our Investor Relations website:
www.brebank.pl
Wojciech Chmielewski
Head of Investor Relations
Secretariat: +48 22 829 15 15
Direct dial: +48 22 829 14 34
Fax: +48 22 829 04 88
E-mail: [email protected]
Joanna Filipkowska
Deputy Head of Investor Relations
Direct dial: +48 22 829 04 53
Fax: +48 22 829 02 97
E-mail: [email protected]
Contact