Embed Size (px)
Citation preview

Results from the 2013 NAQC Annual Survey
of Quitlines
Prepared by: Maria Rudie and Linda Bailey
February 2015
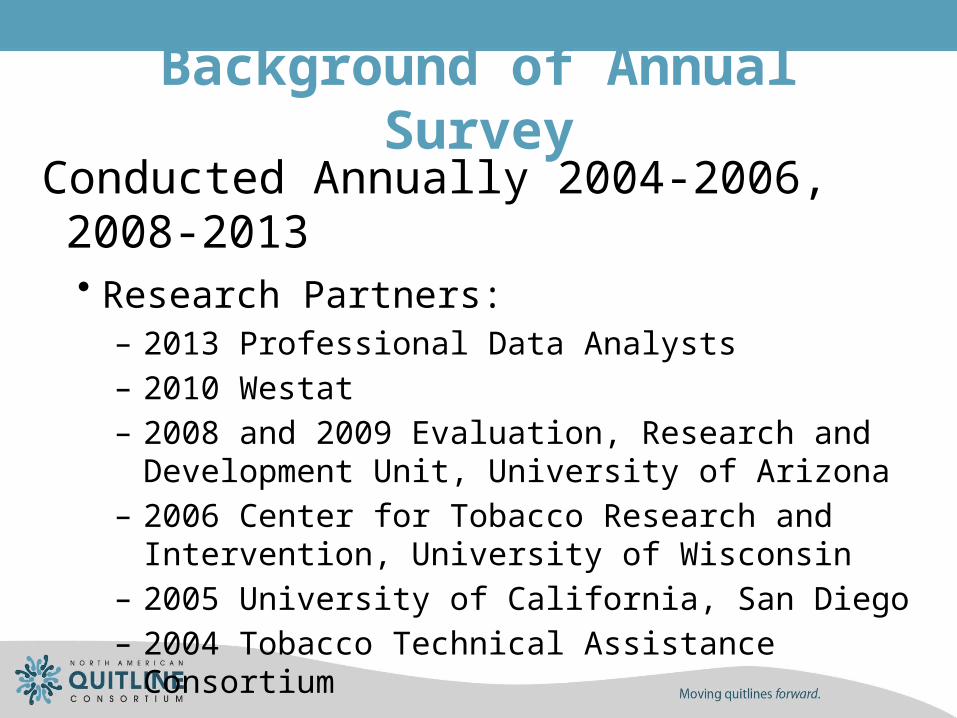
Background of Annual Survey
Conducted Annually 2004-2006, 2008-2013• Research Partners:
– 2013 Professional Data Analysts– 2010 Westat– 2008 and 2009 Evaluation, Research and Development
Unit, University of Arizona– 2006 Center for Tobacco Research and Intervention,
University of Wisconsin– 2005 University of California, San Diego– 2004 Tobacco Technical Assistance Consortium

FY2013 Annual Survey MethodsSurvey fielded from February 27 to April 4, 2014
• Web-based survey with email and telephone follow-up: General Information, services offered Quitline budgets Funding sources Impact of any budget changes Sustainability (Medicaid and Public-Private Partnerships) Utilization (including demographics of users) Evaluation
Data Cleaning & Analysis occurred from August, 2014 – January, 2015
Additional data from NAQC quitline profiles, CDC BRFSS and ACS 5 Year Population Estimates also included in analysis

FY2013 Annual Survey Response Rates
• 53 State Quitlines were asked to respond• 51 responded• Response Rate: 96.2%
• Note: The 12 Canadian quitlines were not included in the 2013 Annual Survey due to lack of Canadian funders.
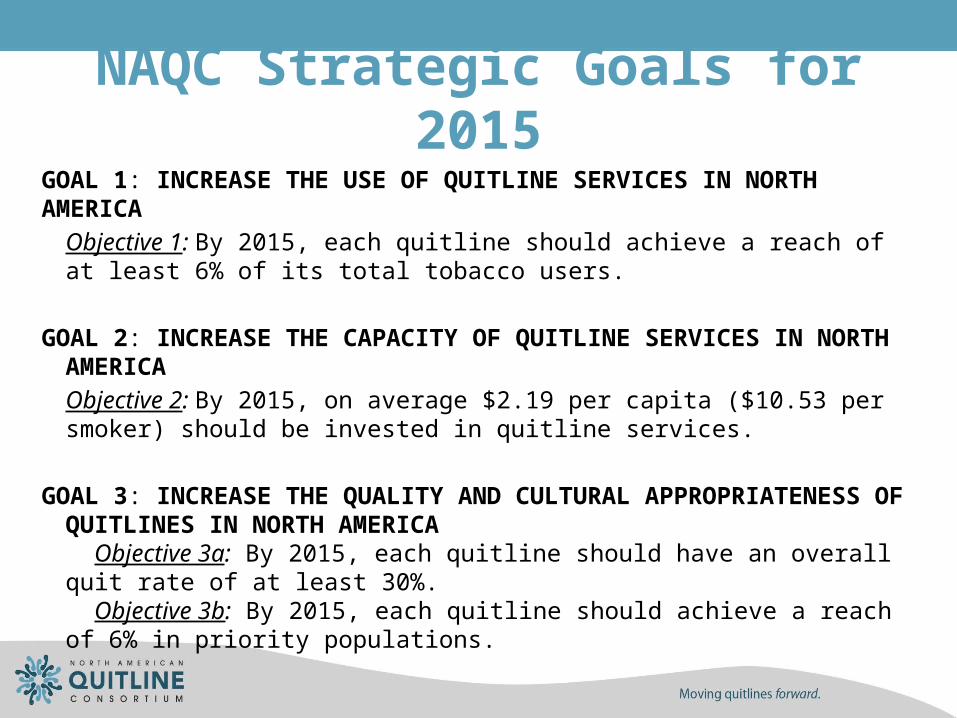
NAQC Strategic Goals for 2015GOAL 1: INCREASE THE USE OF QUITLINE SERVICES IN NORTH AMERICA
Objective 1: By 2015, each quitline should achieve a reach of at least 6% of its total tobacco users.
GOAL 2: INCREASE THE CAPACITY OF QUITLINE SERVICES IN NORTH AMERICA
Objective 2: By 2015, on average $2.19 per capita ($10.53 per smoker) should be invested in quitline services.
GOAL 3: INCREASE THE QUALITY AND CULTURAL APPROPRIATENESS OF QUITLINES IN NORTH AMERICA Objective 3a: By 2015, each quitline should have an overall quit rate of at least 30%. Objective 3b: By 2015, each quitline should achieve a reach of 6% in priority populations.

BUDGET

Budget Highlights from FY2013• 47 quitlines provided data on their budgets for
FY2013.
• The total sum of state quitline budgets was $125,468,946 (N=47).
• The median total quitline budget was $1,669,275 (N=47)
• Median budget for services & medications was $1,135,408 (N=42)
• Median Spending per Smoker was $1.69 (N=42)

State Quitline Budgets FY13 (N=47)
Budget Category
From Tobacco Control Programs
Median(Min – Max)
NFrom Other Sources
Median(Min – Max)
NTotal Median (Min –
Max)N
Total Quitline
$1,149,749($0 - $22,518,556)
43$221,356
($0 - $9,619,014)38
$1,669,275($173,432 -
$23,845,988)47
Services$704,755
($0 – 8,888,096)42
$96,380($0 - $1,504,996)
40$887,335($23,883 -
$8,888,096)41
Medications$187,085
($0 - $2,263,843)41
$0($0 – 610,000)
38$216,000
($0 - $2,263,843)41

Median and Total (sum) State Quitline Budgets
FY2007 FY2008 FY2009 FY2010 FY2011 FY2012 FY2013$0
$20,000,000
$40,000,000
$60,000,000
$80,000,000
$100,000,000
$120,000,000
$140,000,000
$0
$200,000
$400,000
$600,000
$800,000
$1,000,000
$1,200,000
$1,400,000
$1,600,000
$1,800,000
Total Quitline Budget (sum) Median Quitline Budget
To
tal Q
uitl
ine
Bu
dg
et
(su
m)
Me
dia
n Q
uitl
ine
Bu
dg
et

Median Budget for Services and Medications: State Quitlines FY2005 – FY2013
FY05 FY06 FY08 FY09 FY10 FY11 FY12 F13 $-
$200,000
$400,000
$600,000
$800,000
$1,000,000
$1,200,000
$621,697
$515,000
$890,075 $985,000
$1,096,768 $1,118,090
$995,353
$1,135,408
N=42
N=44 N=49 N=46
N=49N=51
N=50 N=44

Median State Quitline Spending* per Smoker FY2008-FY2013
*Medications & Services
FY08 FY09 FY10 FY11 FY12 FY13 NAQC Goal $-
$2.00
$4.00
$6.00
$8.00
$10.00
$12.00
$14.00
$16.00
$18.00
$20.00
$1.71 $1.78 $1.93 $1.73 $1.53 $1.69
$10.53
N=45 N=49N=50 N=50 N=43 N=42
Budget source FY2013 N =45
% of Quitlines Reporting
Budget Source
Budget Source
Sum
% of Total
Budget
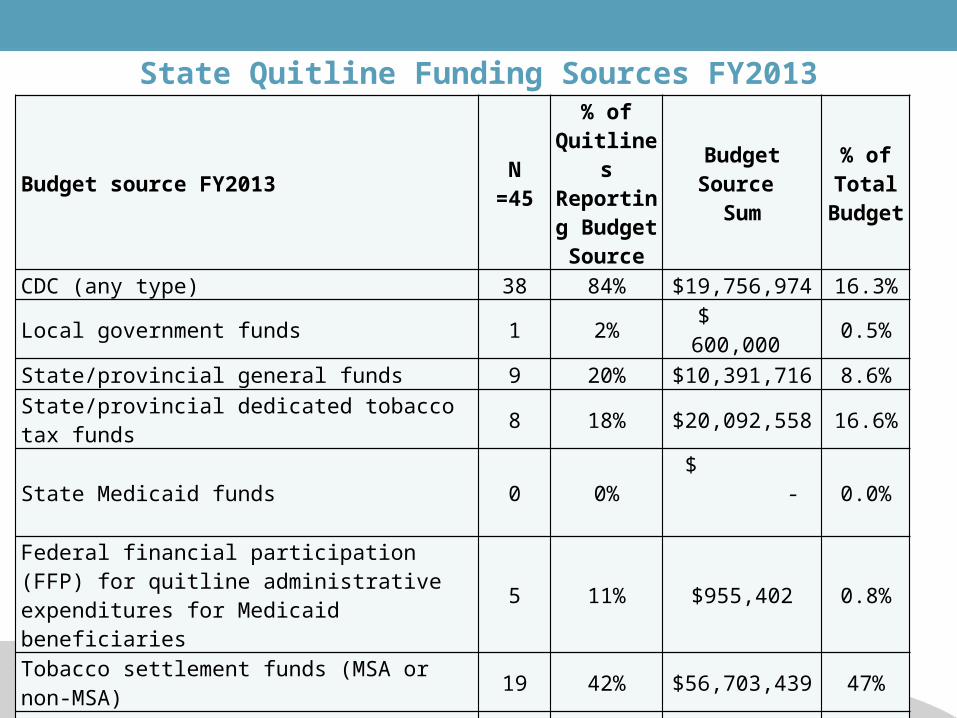
CDC (any type) 38 84% $19,756,974 16.3%Local government funds 1 2% $ 600,000 0.5%State/provincial general funds 9 20% $10,391,716 8.6%
State/provincial dedicated tobacco tax funds 8 18% $20,092,558 16.6%State Medicaid funds 0 0% $ - 0.0%Federal financial participation (FFP) for quitline administrative expenditures for Medicaid beneficiaries
5 11% $955,402 0.8%
Tobacco settlement funds (MSA or non-MSA) 19 42% $56,703,439 47%Federal Research grant 2 4% $5,371,795 4.4%Third party reimbursement through an employer 4 9% $551,554 0.5%Third party reimbursement through insurance company or health plan 3 7% $38,579 0%
Charitable foundation 1 2% $6,000 0%Non-governmental organization 1 2% $335,220 0.3%
State Quitline Funding Sources FY2013
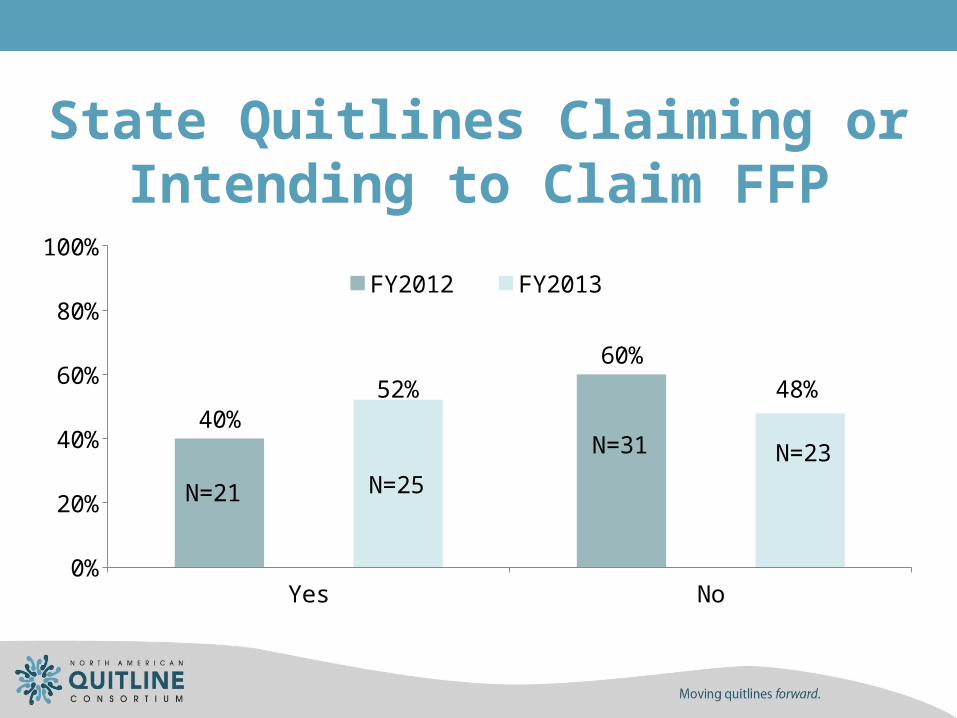
State Quitlines Claiming or Intending to Claim FFP
Yes No0%
10%20%30%40%50%60%70%80%90%
100%
40%
60%
FY2012 FY2013
N=21
N=31
52% 48%
N=21 N=25
N=31 N=23
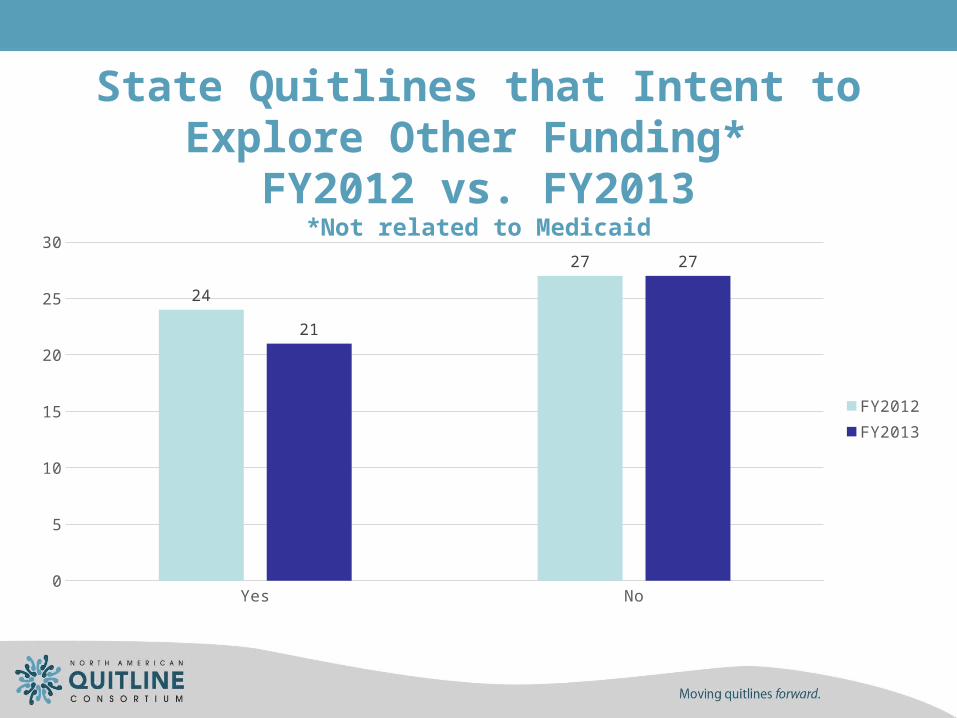
State Quitlines that Intent to Explore Other Funding*
FY2012 vs. FY2013*Not related to Medicaid
Yes No0
5
10
15
20
25
30
24
27
21
27
FY2012FY2013
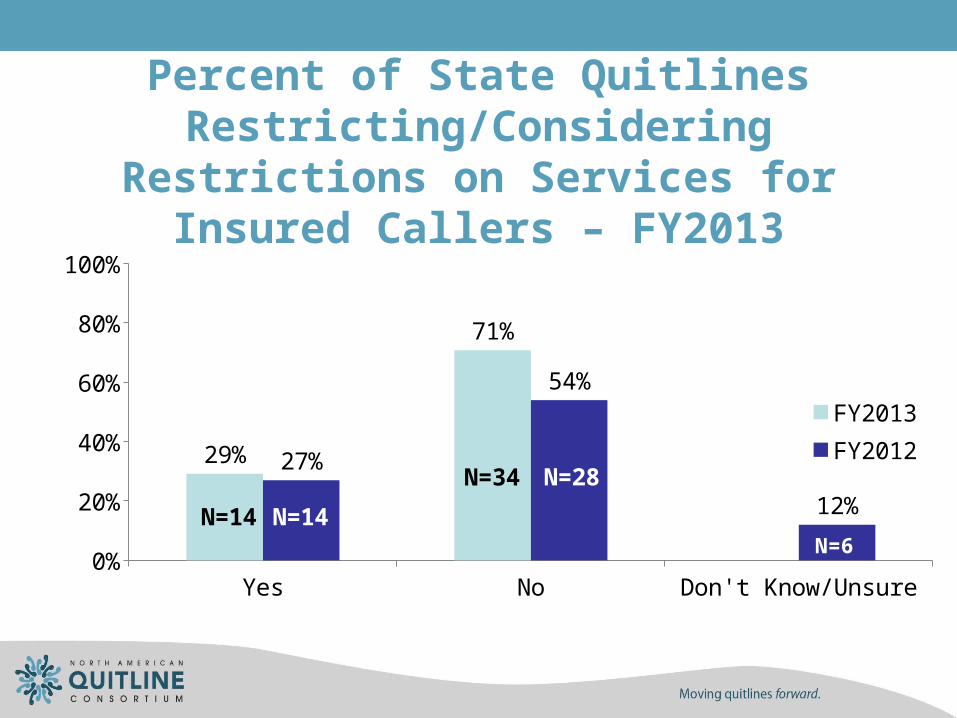
Percent of State Quitlines Restricting/Considering Restrictions on Services for Insured Callers – FY2013
Yes No Don't Know/Unsure0%
10%20%30%40%50%60%70%80%90%
100%
29%
71%
27%
54%
12%
FY2013FY2012
N=14
N=34
N=14
N=28
N=6
DESCRIPTION OF QUITLINE SERVICES
Data from:• Annual Survey
• NAQC Quitline Profiles

Description of NAQC Quitline Profile Data• NAQC Quitline Profile Website: http://map.naquitline.org/• Quitline Operations Profile Data Reported:
• Hours of Operation• Languages supported • Types of phone counseling• Web-based services• Medications• Eligibility criteria• Specialized materials offered• Providers referral program
• Contacts for NAQC staff that can assist states with
updates to state quitline profiles:Natalia Gromov
[email protected] Maria Rudie
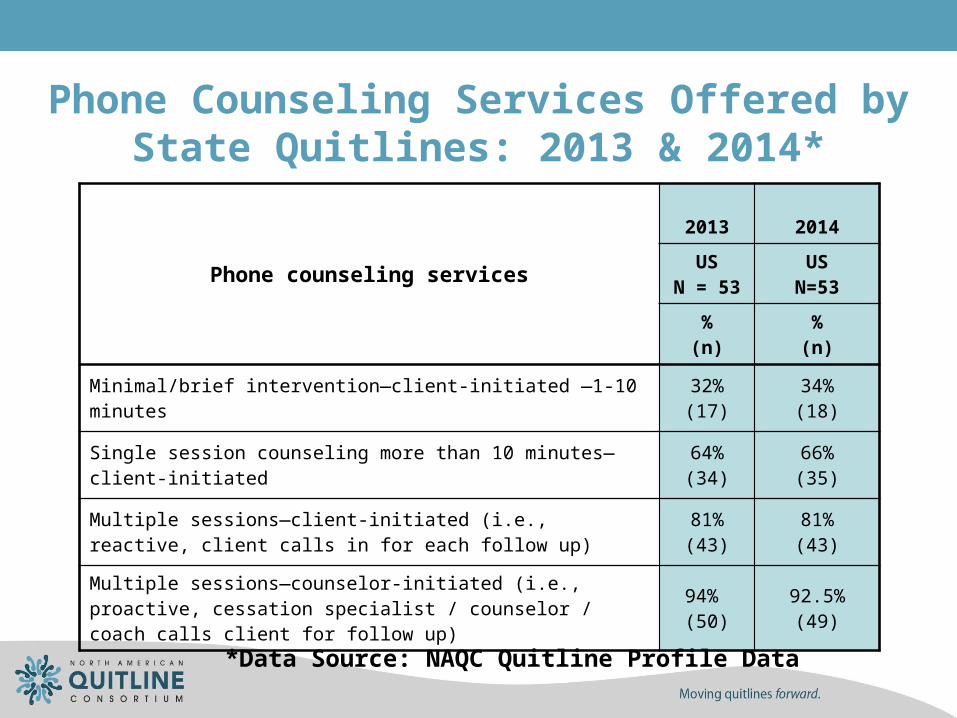
Phone Counseling Services Offered by State Quitlines: 2013 & 2014*
Phone counseling services
2013 2014
USN = 53
USN=53
%(n)
%(n)
Minimal/brief intervention—client-initiated —1-10 minutes32%(17)
34%(18)
Single session counseling more than 10 minutes—client-initiated64%(34)
66%(35)
Multiple sessions—client-initiated (i.e., reactive, client calls in for each follow up)
81%(43)
81%(43)
Multiple sessions—counselor-initiated (i.e., proactive, cessation specialist / counselor / coach calls client for follow up)
94% (50)
92.5%(49)
*Data Source: NAQC Quitline Profile Data

Web-based Programs Offered by State Quitlines: Comparison FY2012 to FY2013*
Internet-based services
FY2012 FY2013
US N=52
USN=51
% (n) % (n)
Information about the quitline 96% (50) 98%(49)
Information about tobacco cessation 94% (49) 94% (47)
Self-directed web-based intervention to help tobacco users quit 62% (32) 76%(38)
Text messaging 25% (13) 48%(24)
*Data Source: FY12 and FY13 Annual Surveys

Interactive FeaturesFY2012N = 52
FY2013N=51
% (n)
% (n)
Automated email messages56%(29)
67%(34)
Chat rooms60%(31)
63%(32)
Interactive counseling and/or email messaging to cessation specialist/counselor/ coach to help tobacco users quit
58%(30)
61%(31)
Interactive Features of Self-Directed Web-Based Programs: FY2012 to FY2013*
*Data Source: FY2012 & FY2013 Annual Surveys

Use of Interactive Voice Response (IVR)*
How IVR was Used FY2013 US (n=37)
Triage only 95% (n=35)
Handle provision of some requested services only
0% (n=0)
Both triage and handle some provision of requested services
5% (n=2)
Other 0% (n=0)
*Data Source: FY2013 Annual Survey
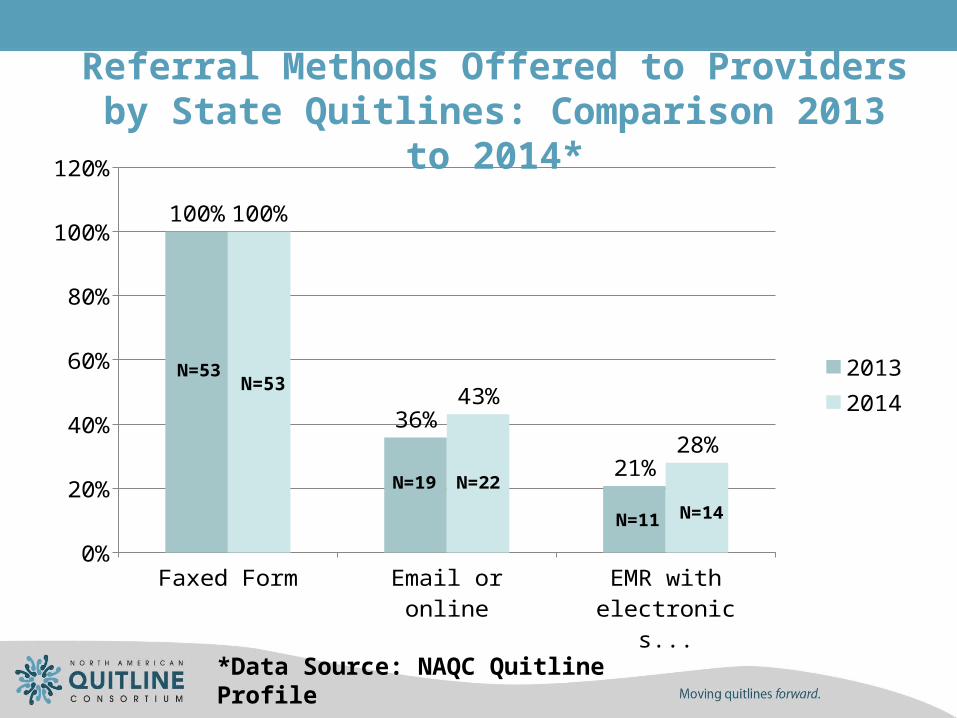
Referral Methods Offered to Providers by State Quitlines: Comparison 2013 to 2014*
0%
20%
40%
60%
80%
100%
120%
100%
36%
21%
100%
43%
28%
20132014
N=53
N=19 N=22
N=11 N=14
N=53
*Data Source: NAQC Quitline Profile

Services received
2013 2014
USN = 49
USN = 49
%(n)
%(n)
Quitline and/or referral brochures92%(45)
92%(45)
Customized referral/consent forms74%(36)
75%(37)
Patient progress reports49%(24)
47%(23)
Customized provider feedback reports59%(29)
63%(31)
Staff training63%(31)
65%(32)
Quitline/referral program newsletter10%(5)
10%(5)
State Quitline Services Available to Referring Providers: 2013 & 2014*
*Data Source: NAQC Quitline Profile 2013 & 2014

Provision of In-language Counseling for Languages Other than English: FY2013*
• 98% of state quitlines offer counseling in languages other than English.
• The vast majority (78%) of state quitlines offer “in-language menu prompt” for callers to indicated language preference.
• Top 5 languages offered by state quitlines based on # of people served in those languages.
• English• Spanish• Korean• Vietnamese• Mandarin
*Date Source: FY2013 Annual Survey

Primary Service Providers to State Quitline in 2013*
Alere
Wel
lbei
ng
Natio
nal J
ewish
Hea
lth JSI
ALA o
f Illin
ois
IQH
Roswel
l Par
k
Avera
McK
enna
n
beBet
ter H
ealth
Cerid
ian
Mai
neHea
lth, C
TI
Telem
edik
Unive
rsity
of A
rizon
a
UCSDUNR
0
5
10
15
20
25
30 27
10
3 2 2 2 1 1 1 1 1 1 1 1
*NAQC Quitline Profile 2013

Specialized Materials for Special Populations2013 vs. 2014*
Smok
eless
use
rs
Pregn
ant
Youth
<18
Racial
/Eth
nic P
ops
Chron
ic Hea
lth
LGBT
Low L
itera
cy
Youth
18-
25
Low S
ES/Med
icaid
55+
Men
tal H
ealth
Mult
iple
Addict
ions
Oth
er0%
20%
40%
60%
80%
100%
120%
2013 2014
*Data Source: NAQC Quitline Profile
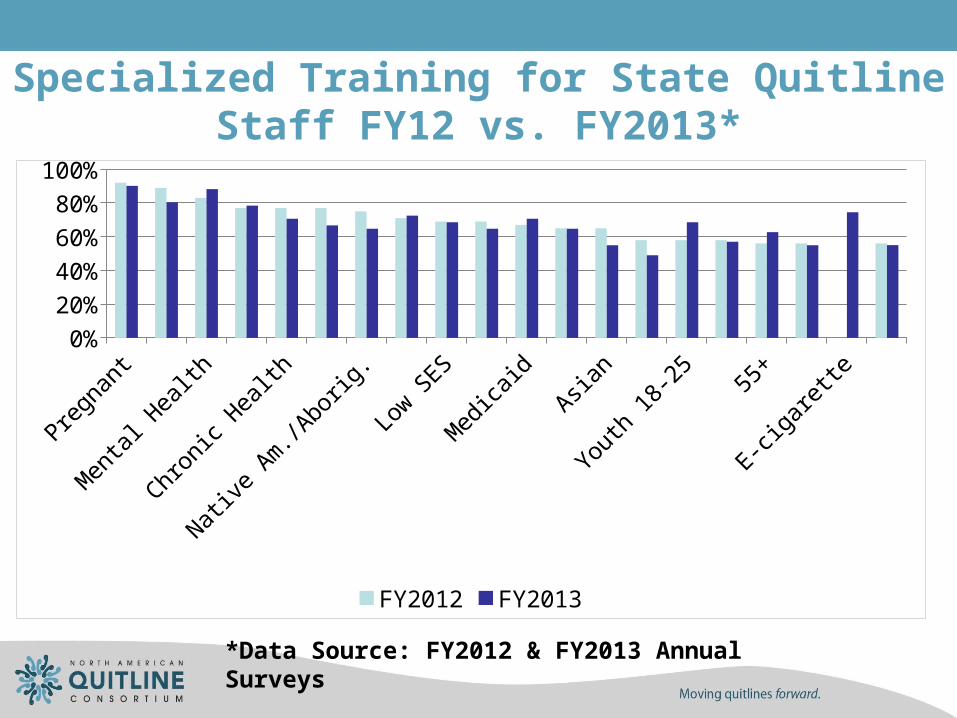
Specialized Training for State Quitline Staff FY12 vs. FY2013*
Pregn
ant
Smok
eless
use
rs
Men
tal H
ealth
Youth
<18
Chron
ic Hea
lth
Hispan
ic/La
tino
Native
Am
./Abo
rig.
LGBT
Low S
ES
Black/
Af Am
Med
icaid
Mult
iple
Addict
ionsAsia
n
Low L
itera
cy
Youth
18-
25
Native
Haw
. /Pac
if Isl
.55
+
Africa
n Im
migr
ant
E-ciga
rette
Oth
er0%
20%
40%
60%
80%
100%
FY2012 FY2013
*Data Source: FY2012 & FY2013 Annual Surveys
MEDICATIONS
Provision of Cessation Medication 2013 vs. 2014*
Patch Gum Lozenge Zyban Chantix Nasal Spray
Inhaler ANY Meds
2013: US (n=53)
Free 46 (87%)
34 (64%)
26(49%)
3(6%)
3(6%)
2(4%)
2(4%)
46(87%)
Discounted 1 (2%)
1 (2%)
1 (2%)
2(4%)
3(6%)
1 (2%)
1 (2%)
3(6%)
Voucher 1 (2%)
1 (2%)
1 (2%)
1 (2%)
3(6%)
1 (2%)
1 (2%)
3(6%)
2014: US (n=53)
Free 44(83%)
35(66%)
24(45%)
3(6%)
3(6%)
2(4%)
2(4%)
44(83%)
Discounted 4(8%)
4(8%)
4(8%)
5(9%)
4(8%)
2(4%)
2(4%)
5(9%)
Voucher 5(9%)
*Data Source: NAQC Quitline Profile

Percent of State Quitlines Providing Free Cessation Medication*
*Data Sources NAQC Profile Data
2006 2008 2009 2010 2011 2012 20130%
10%
20%
30%
40%
50%
60%
70%
80%
90%
100%
46%
70% 70%75%
83%87%
83%

UTILIZATION

Utilization: Total Direct Calls FY2012 vs. FY2013
Total Direct Calls
N Missing Min Max Median Mean Sum
FY12 US (N=53) 52 1 340 185,546 15,356 26,208 1,336,602
FY13 US (N=51) 46 5 431 215,128 16,520 28,879 1,328,478

FY2005 FY2006 FY2008 FY2009 FY2010 FY2011 FY2012 FY20130
200000
400000
600000
800000
1000000
1200000
1400000
1600000
0
2000
4000
6000
8000
10000
12000
14000
16000
18000
Total Calls Median # of Calls
Total & Median Calls to State Quitlines: FY2005 – FY2013

Average number of minutes of counseling and number of counseling calls completed
FY2012 vs. FY2013
Total Calls N Missing Min Max Average
FY12: US (N=52)
Average # of minutes of counseling
38 14 0 50 29.6
Average # of completed counseling calls
40 12 1 4 2.2
FY13: US (N=51)
Average # of minutes of counseling
41 10 0 54 26.88
Average # of completed counseling calls
42 9 1 4 2.3

Promotional Reach of State QuitlinesFY 2005-2013
FY05 FY06 FY08 FY09 FY10 FY11 FY12 FY130
100000
200000
300000
400000
500000
600000
0.00%
0.20%
0.40%
0.60%
0.80%
1.00%
1.20%
1.40%
Number of unique tobacco users (sum)
Reach (unique tobacco users calling divided by estimated number of smokers in the state or territory 2005 - 2013 BRFSS
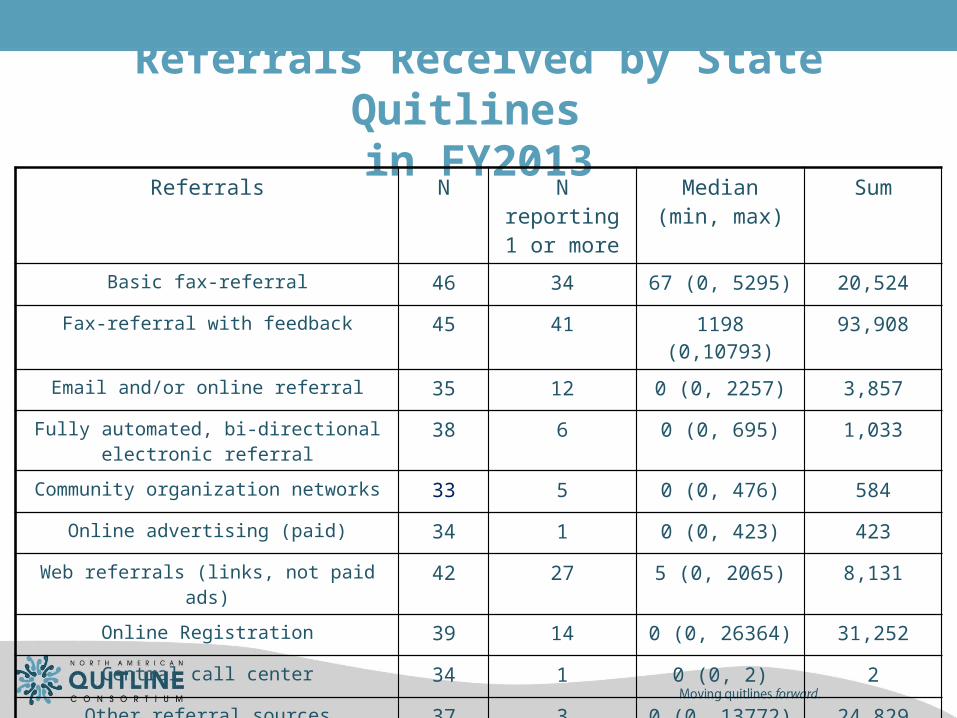
Referrals Received by State Quitlines in FY2013
Referrals N N reporting 1 or more
Median (min, max)
Sum
Basic fax-referral 46 34 67 (0, 5295) 20,524
Fax-referral with feedback 45 41 1198 (0,10793) 93,908
Email and/or online referral 35 12 0 (0, 2257) 3,857
Fully automated, bi-directional electronic referral
38 6 0 (0, 695) 1,033
Community organization networks 33 5 0 (0, 476) 584
Online advertising (paid) 34 1 0 (0, 423) 423
Web referrals (links, not paid ads) 42 27 5 (0, 2065) 8,131
Online Registration 39 14 0 (0, 26364) 31,252
Central call center 34 1 0 (0, 2) 2
Other referral sources 37 3 0 (0, 13772) 24,829
Total 47 47 1956 (8, 33196) 184,358

Sum of Referrals ReceivedFY2012 vs. FY2013
0
20,000
40,000
60,000
80,000
100,000
120,000
140,000
160,000
180,000
200,000
22
,37
5
84
,79
5
3,0
70
1,5
39
45
,28
8
10
,91
3
17
1,3
79
20
,52
4
93
,90
8
3,8
57
1,0
33
8,1
31 3
1,2
52
24
,82
9
18
4,3
58
FY2012 FY2013
State Quitline Referrals that Received Medications/Counseling
FY2012 vs. FY2013
NTotal
referrals
Total referrals receiving
counseling or medication
Proportion of referrals receiving
counseling or medication
FY2012 44 110,974 38,599 35%
FY2013 41 120,648 42,224 35%
N = number of quitlines reporting both total number of referrals and total referrals receiving counseling or medications.
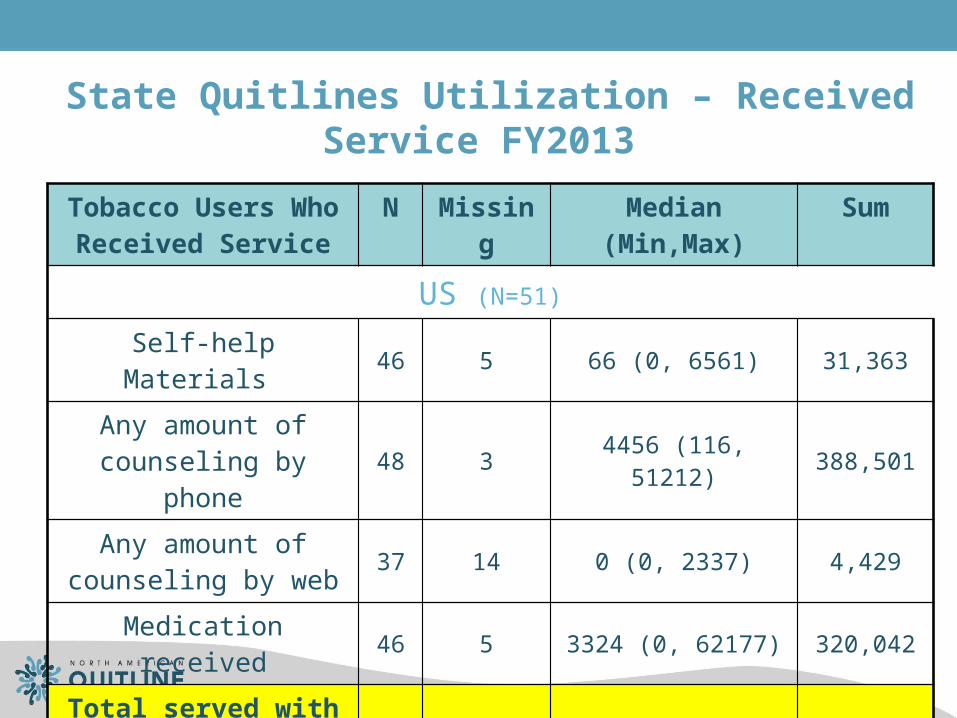
State Quitlines Utilization – Received Service FY2013
Tobacco Users Who Received Service
N Missing Median (Min,Max) Sum
US (N=51)
Self-help Materials 46 5 66 (0, 6561) 31,363
Any amount of counseling by phone 48 3 4456 (116, 51212) 388,501
Any amount of counseling by web
37 14 0 (0, 2337) 4,429
Medication received 46 5 3324 (0, 62177) 320,042
Total served with either counseling or
medications50 1 4712 (179, 66854) 446,373

State Quitlines: Ratio of Direct calls from Unique Tobacco Users to Referrals of Unique Tobacco Users
FY2012 to FY2013
FY2012 FY20130
0.51
1.52
2.53
3.54
4.55
4.4
3.5
1 1
Total unique tobacco users calling the quitlineTotal unique tobacco users referred

Completed Intake/Registrations for State Quitlines: FY2012 vs. FY2013
FY2012 FY2013440,000
460,000
480,000
500,000
520,000
540,000
560,000
580,000568,706
493,157N=49
N=47
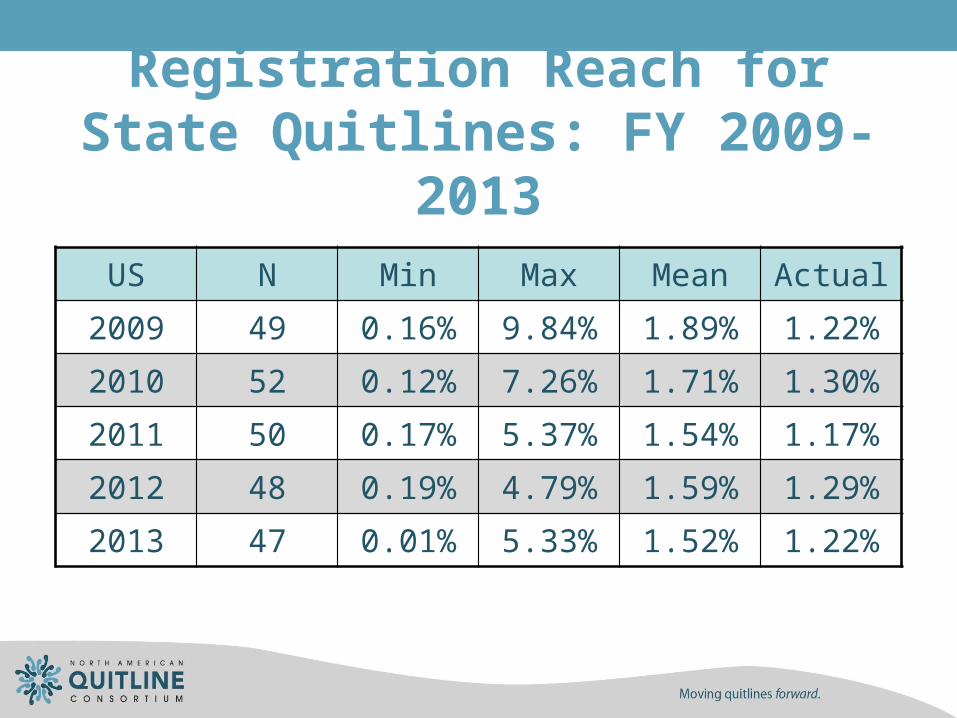
Registration Reach for State Quitlines: FY 2009-2013
US N Min Max Mean Actual
2009 49 0.16% 9.84% 1.89% 1.22%
2010 52 0.12% 7.26% 1.71% 1.30%
2011 50 0.17% 5.37% 1.54% 1.17%
2012 48 0.19% 4.79% 1.59% 1.29%
2013 47 0.01% 5.33% 1.52% 1.22%

Treatment Reach FY09-FY13
US N Min Max Mean Actual
2009 46 0.05% 7.25% 1.57% 1.19%
2010 50 0.05% 6.66% 1.45% 1.09%
2011 50 0.13% 4.30% 1.28% 0.98%
2012 48 0.16% 4.41% 1.32% 1.04%
2013 50 0.12% 4.70% 1.34% 1.08%

Treatment Reach of State Quitlines FY2011- FY2013
FY2011 FY2012 FY20130
50000
100000
150000
200000
250000
300000
350000
400000
450000
500000
0.00%
0.20%
0.40%
0.60%
0.80%
1.00%
1.20%
Number served (sum) Treatment reach
N=48N=50 N=50

Where are State Quitlines with Reach?
Reach Promotional reach (# of unique
tobacco users calling)
Reach (N)
Registration reach (# of unique
tobacco users completing an
intake) Reach (N)
Treatment reach (# of
unique tobacco users receiving evidence based
services) Reach (N)
FY2012 1.16% (43) 1.29% (48) 1.04% (48)
FY2013 1.07% (47) 1.22% (47) 1.08% (50)

Treatment reach and Spending per Smoker for State Quitlines: FY13
1 3 5 7 9 11 15 20 22 25 27 29 31 33 35 38 40 42 44 46 490.00%
0.50%
1.00%
1.50%
2.00%
2.50%
3.00%
3.50%
4.00%
4.50%
5.00%
$-
$2.00
$4.00
$6.00
$8.00
$10.00
$12.00
$14.00
$16.00
$18.00
2013 Treatment Reach (smokers) 2013 Spending per Smoker

0.00% 0.50% 1.00% 1.50% 2.00% 2.50% 3.00% 3.50% 4.00% 4.50% 5.00% $-
$2.00
$4.00
$6.00
$8.00
$10.00
$12.00
$14.00
$16.00
$18.00
f(x) = 245.611553205232 x + 0.294271507159402
Reach by SpendingLinear (Reach by Spending)
Best Fit Line:
Goal of 6% Tx Reach = $15.57/smoker
FY2013: State Quitline Treatment Reach by Spending per Smoker
DEMOGRAPHICS OF CALLERSNote: Our original intention was to ask quitlines to report
demographics on ONLY those tobacco users who received counseling or medications. Six state quitlines were only able to report on the population of tobacco users completing an intake questionnaire. Similar to FY2012, for FY2013 this
inconsistency in the numbers reported in this section may be slightly larger than the population who received counseling
or medications.

State Quitline Utilization: GenderFY2012 vs. FY2013
Quitline Number of Callers
N Missing Min Max Mean Sum
FY2012 (N=52)
Male 49 3 57 39,018 4,021 197,024
Female 49 3 80 41,502 5,603 274,525
FY2013 (N=51) Male 47 4 49 32,964 3,970 186,608
Female 47 4 70 36,471 5,610 263,692

State Quitline Utilization: AgeFY2012 vs. FY2013
Quitline Age of Callers
N Missing Min* Max** Mean***
FY2012 (N=52) 44 8 13 112 44.2
FY2013 (N=51) 42 9 12 113 44.9
• *Min = the least of the minimum ages reported
• **Max = the greatest of the maximum ages reported
• ***Mean = the average of the mean ages reported

State Quitline Utilization: Level of Education USFY2012 vs. FY2013
Quitline Number of Callers
N Missing Min Max Mean Sum
FY2012 (N=52)
< Grade 9 50 2 4 1,940 338 16,893
Grade 9-11, no degree 49 3 27 7,393 1,274 62,440
GED/HS degree 50 2 56 19,401 3,050 152,492
Some college or university 50 2 26 17,090 2,357 117,862
College or university degree 50 2 23 12,938 1,388 69,392
FY2013 (N=51)
< Grade 9 44 7 4 2,178 347 15,251
Grade 9-11, no degree 46 5 32 8,000 1,302 59,889
GED/HS degree 46 5 43 20,569 3,178 146,186
Some college or university 46 5 27 17,156 2,370 109,002
College or university degree 46 5 11 13,377 1,423 65,456

State Quitline Utilization: Race & EthnicityFY2013
Quitline Number of Callers
N Missing Min Max Mean Sum
FY2013 (N=51)
Hispanic or Latino 44 7 0 9,974 919 40,421
White 45 6 6 47,572 6,651 299,290
Black or African American
45 6 1 9,624 1,541 69,367
Asian 45 6 0 3,432 158 7,119
Native Hawaiian or Pacific Islander
43 8 0 1,061 39 1,687
American Indian or Alaskan Native
44 7 0 3,427 238 10,483
Other 45 6 6 6,146 517 23,279

State Quitline Utilization: EthnicityFY2012 vs. FY2013
10%
90%
FY2012
Hispanic/ LatinoNot Hispanic/ Latino
10%
90%
FY2013
Hispanic/LatinoNot Hispanic/Latino

State Quitline Utilization: RaceFY2012 vs. FY2013
72.8%
17.8%
1.4%0.5% 2.7% 4.8%
FY2012
White
Black or African Amer-ican
American Indian or Alaskan Native
Asian
Native Hawaiian or Pacific Islander
Other78.5%
10.3%
2.7%
1.9% 0.4% 6.1%
FY2013
White
Black or African Amer-ican
American Indian or Alaskan Native
Asian
Native Hawaiian or Pacific Islander
Other
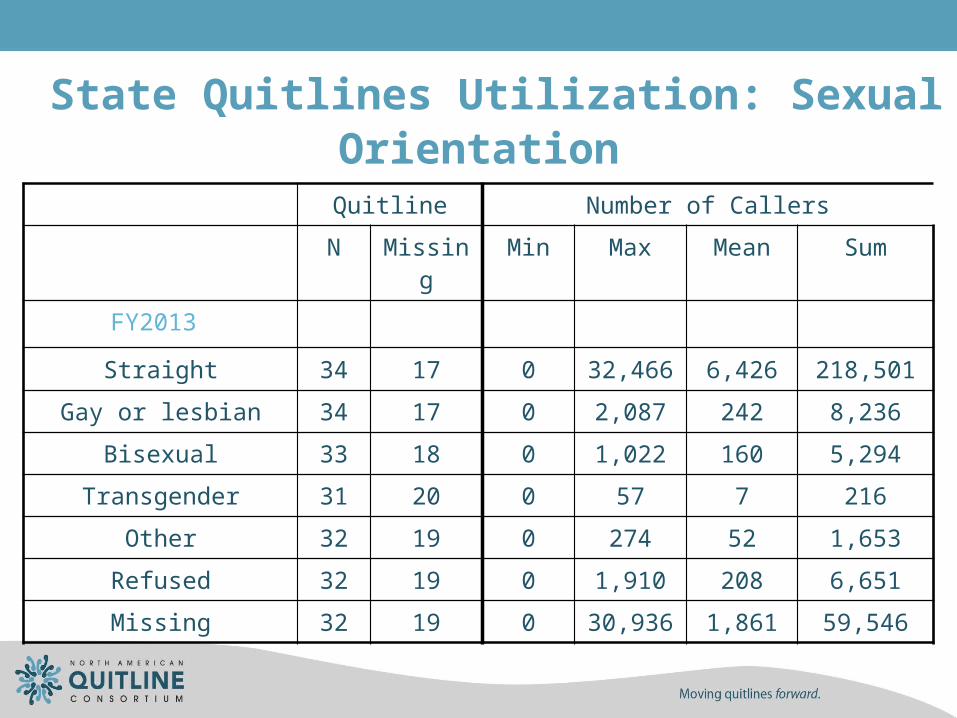
State Quitlines Utilization: Sexual Orientation
Quitline Number of Callers
N Missing Min Max Mean Sum
FY2013
Straight 34 17 0 32,466 6,426 218,501
Gay or lesbian 34 17 0 2,087 242 8,236
Bisexual 33 18 0 1,022 160 5,294
Transgender 31 20 0 57 7 216
Other 32 19 0 274 52 1,653
Refused 32 19 0 1,910 208 6,651
Missing 32 19 0 30,936 1,861 59,546

State Quitlines: Insurance Status of Callers FY2013
Quitline Number of Callers
Insurance Type N Missing Min Max Mean Sum
FY2013
None 43 8 28 28,607 3,404 146,391
Medicaid 44 7 41 17,602 2,518 110,779
Other Gov’t-provided insurance
(e.g., Medicare, Military)
44 7 3 8,307 1,188 49,875
Private 43 8 45 19,998 2,214 95,217

State Quitlines: Insurance Status of Callers FY2012 vs. FY2013
40%
24%
11%
25%
FY2012
Uninsured
Medicaid
Other Gov't
Private In-surance
36%
28%
12%
24%
FY2013
Uninsured
Medicaid
Other Gov't
Private In-surance

State Quitlines: Treatment Reach for Priority Populations
FY2011 – FY2013
FYOverall
Treatment Reach
Afr Am AI/AN Asian Latino <HS Ed
FY2011 0.98%1.09%(1>6%; 9>3%)
1.45%(1>6%; 6>3%)
0.39%(1>6%; 2>3%)
0.78%(1>6%; 1>3%)
0.72%(0>6%; 4>3%)
FY20121.04%
1.33%(2>6%; 9>3%)
1.63%(2>6%; 9>3%)
0.63% (1>6%; 1>3%)
0.85%(0>6%; 0>3%)
0.77%(0>6%; 1>3%)
FY2013 1.08%0.96
(0>6%;1>3%)
0.80%(0>6%;0>3%)
0.47%(0>6%;0>3%)
0.60%(0>6%;0>3%)
0.90%(0>6%;2>3%)

Screening for Chronic Health or Behavioral Health Conditions: State Quitlines
FY2012 vs. FY2013
.Number of state quitlines that screen
for chronic health or behavioral health conditions
N (%)
FY2012 (n=50) 41 (79%)
FY2013 (n=48) 40 (83.3%)

EVALUATION

Evaluation FY13• 36 state quitlines (68%) reported
evaluation data. • 30 state quitlines (83%) conducted
evaluation activities during calendar year 2013.
• 22 state quitlines (61%) surveyed tobacco users who registered for services beginning in 2012.
• 15 state quitlines (42%) extended registration into 2013.
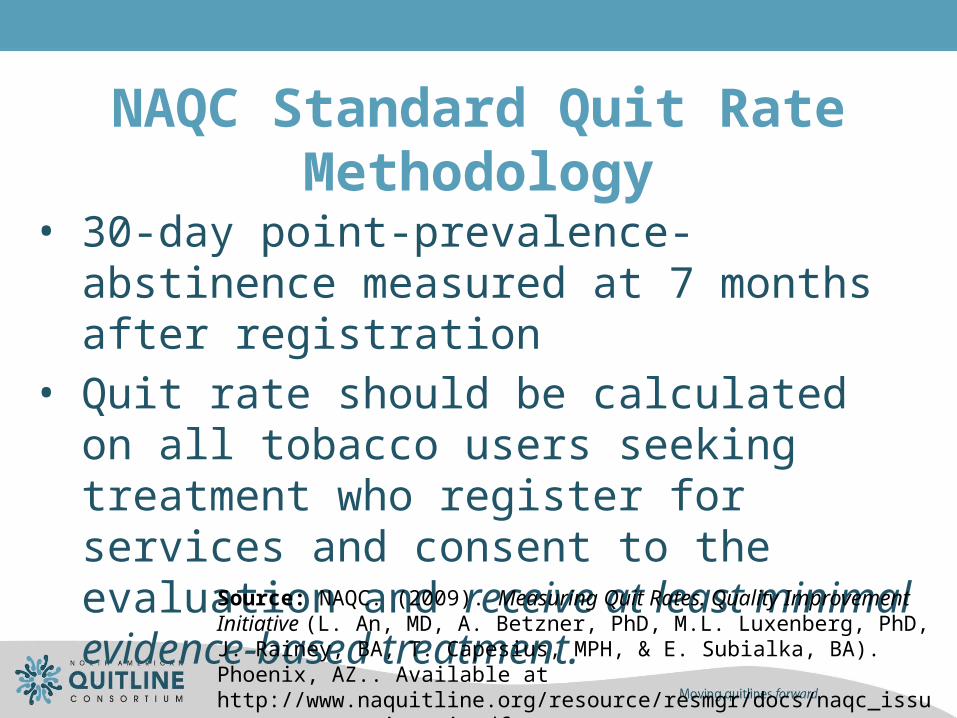
NAQC Standard Quit Rate Methodology
• 30-day point-prevalence-abstinence measured at 7 months after registration
• Quit rate should be calculated on all tobacco users seeking treatment who register for services and consent to the evaluation and receive at least minimal evidence-based treatment.
Source: NAQC. (2009). Measuring Quit Rates. Quality Improvement Initiative (L. An, MD, A. Betzner, PhD, M.L. Luxenberg, PhD, J. Rainey, BA, T. Capesius, MPH, & E. Subialka, BA). Phoenix, AZ.. Available at http://www.naquitline.org/resource/resmgr/docs/naqc_issuepaper_measuringqui.pdf

Quit Rate Context: FY2013• Consent rates averaged 93.7%, ranging
from 68.8% to 100% (n=31)• Response rates averaged 41.4%, ranging
from 13.2% to 58.8% (n=30)• 6 state quitlines reported a response rate of 50%
or greater, as recommended in the “Measuring Quit Rates” NAQC Issue Paper.
• Down from 11 state quitlines in FY2012.
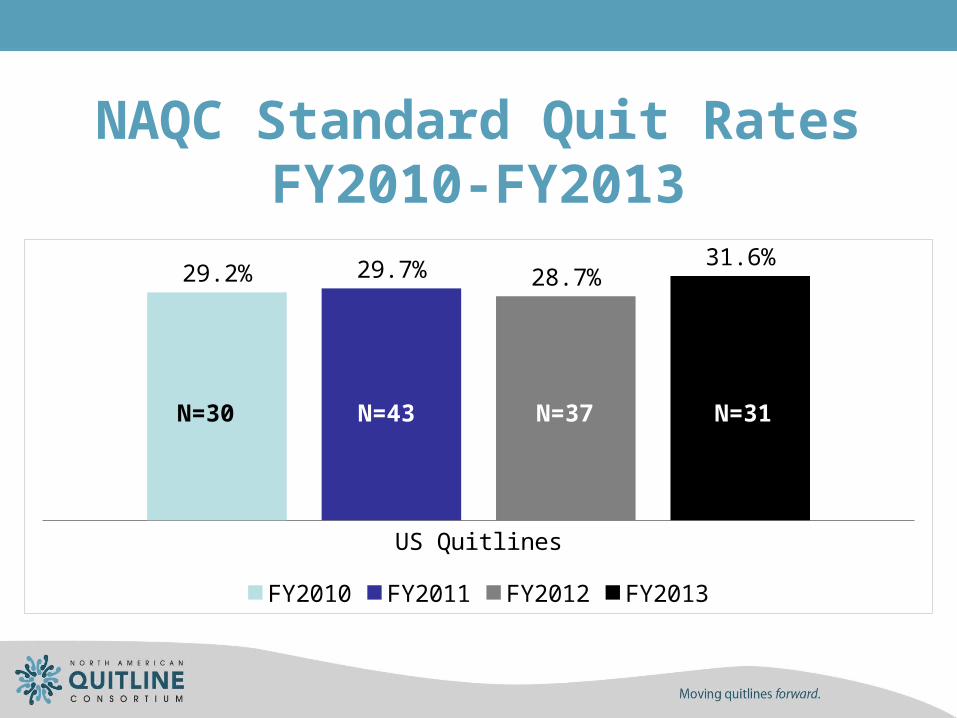
NAQC Standard Quit Rates FY2010-FY2013
US Quitlines
29.2% 29.7% 28.7%31.6%
FY2010 FY2011 FY2012 FY2013
N=30 N=43 N=37 N=31
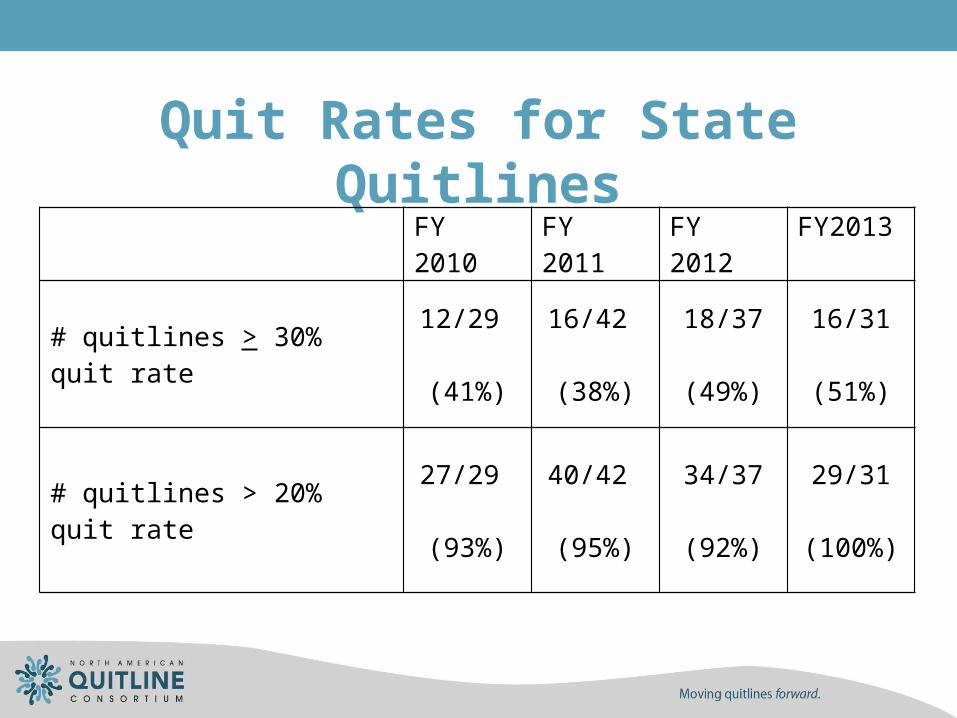
Quit Rates for State Quitlines FY 2010 FY 2011 FY 2012 FY2013
# quitlines > 30% quit rate12/29
(41%)
16/42
(38%)
18/37
(49%)
16/31
(51%)
# quitlines > 20% quit rate27/29
(93%)
40/42
(95%)
34/37
(92%)
29/31
(100%)
Resources• Final powerpoint presentation posted on the
2013 survey page• FY2013 benchmarking data have been sent
to individual quitlines• Quitline Profiles will be updated (metrics
section)• Deadline Extended to Thursday, April
30th to opt out of Benchmarking data update to NAQC Quitline Profiles.

Funding Sources for the FY 2013 NAQC Annual Survey of Quitlines
Centers for Disease Control and Prevention, Office on Smoking and Health
NAQC Membership Dues

Recommended Citation:
North American Quitline Consortium. 2013. Results from the 2013 NAQC Annual Survey of Quitlines.
Available at http://www.naquitline.org/?page=2013Survey

For more information on the survey or on NAQC’s data request and review process, please contact:
Maria Rudie, MPH Research Manager
North American Quitline Consortium3219 E. Camelback Road, #416
Phoenix, AZ 85018Ph: 800-398-5489 x702
Email: [email protected]