Embed Size (px)
Citation preview

© All Rights Reserved.
This material is confidential and property to IHH Healthcare Berhad. No part of this material
should be reproduced or published in any form by any means, nor should the material be
disclosed to third parties without the consent of IHH.
Results Briefing Presentation
2Q 2018
28 August 2018

2
Disclaimer
This document is and shall remain the exclusive property of IHH Healthcare Berhad (the “Company”) and nothing herein shall give, or shall be construed
as giving, to any party any right, title, ownership, interest, licence or any other right whatsoever in or to this document. Neither this document nor any part
thereof may be (i) copied, photocopied, duplicated or otherwise reproduced in any form or by any means; or (ii) redistributed, passed on or otherwise
disseminated, without the Company’s permission. Although care has been taken to ensure that the information in this document is accurate, and that the opinions expressed are fair and reasonable, the
information is subject to change without notice, its accuracy is not guaranteed, has not been independently verified and it may not contain all material
information concerning the Company and its subsidiaries and associate companies. None of the Company nor its subsidiaries or associate companies nor
any of its or their respective members, directors, officers, employees, affiliates or advisors make any representation or warranty (express or implied)
regarding, nor assumes any responsibility or liability for, the accuracy, reasonableness, fairness or completeness of, or any errors or omissions in, any
information contained herein. Accordingly, none of the above nor any other person accepts any liability (in negligence, or otherwise) for any loss arising
from or in connection with any use of this document or its contents. This document is for information purposes only and does not constitute or form part of any offer or invitation by or on behalf of the Company for sale or
subscription of or solicitation or invitation of any offer to or recommendation to buy or subscribe for any securities (“Securities”), nor shall it or any part of it
form the basis of or be relied on in connection with any contract, commitment or investment decision in relation to the Securities of the Company in
Malaysia, Singapore or any other jurisdiction. The information in this document does not take into consideration the investment objectives, financial
situation or particular needs of any particular investor, and should not be treated as giving investment advice. In addition, this document contains certain financial information and results of operation, and may also contain certain projections, plans, strategies, and
objectives of the Company, that are not statements of historical fact which would be treated as forward looking statements that reflect the Company’s
current views with respect to future events and financial performance. These views are based on a number of estimates and current assumptions which are
subject to business, economic, political and competitive uncertainties and contingencies as well as various risks which are in many cases outside the
control of the Company, and which may change over time and may cause actual events and the Company’s future results to be materially different than
expected or indicated by such statements. No assurance can be given that future events will occur, that projections will be achieved, or that the Company’s
assumptions are correct. Such forward‐looking statements are not guarantees of future performance and accordingly, the actual results, financial condition,
performance or achievements of the Company may differ materially from those anticipated by the Company in the forward looking statements. You are
cautioned not to place undue reliance on these forward looking statements. The Company does not undertake to provide you with access to any additional information or to update the information contained in the document or to
correct any inaccuracies therein which may become apparent.

3
Key Highlights for Q2 2018
Resilient core performance, PATMI (Excl EI) nearly triples Sustained organic growth on constant currency terms • Q2 2018 revenue down 4% year-on-year to RM2.7 billion; EBITDA down 1% to RM527.9
million on stronger Malaysian Ringgit • PATMI (Excl EI) at RM256.5 million in Q2 2018 given a low base last year; also driven by
stronger operational performance and boosted by foreign exchange gains
Strong balance sheet with prudent cash management: • Net gearing of 0.04 times with RM6.2 billion cash position • Cash flow from operations remained strong at RM951.5 million for the 1H 2018
Revenue
RM2.7 b (↓ 4%)
EBITDA
RM527.9 m (↓ 1%)
PATMI
RM165.1 m (↓ 48%)
PATMI (Excl EI)
RM256.5 m (↑ 197%)
© All Rights Reserved.
This material is confidential and property to IHH Healthcare Berhad. No part of this material
should be reproduced or published in any form by any means, nor should the material be
disclosed to third parties without the consent of IHH.
4
Financial Highlights

5
Sustained organic growth from existing operations
YoY growth eroded by stronger RM
RM'mil 2018 2017 Variance 2018 2017 Variance
Revenue 2,659.7 2,771.8 -4% 5,514.7 5,456.7 1%
EBITDA 527.9 535.8 -1% 1,136.8 1,101.4 3%
PATMI 165.1 316.6 -48% 222.3 786.6 -72%
PATMI (Excl EI) 256.5 86.2 197% 377.0 288.0 31%
QTD Jun YTD JunTotal Group Results
Q2 Commentary
• Revenue and EBITDA eroded by stronger RM upon translation of results from overseas operations.
• On constant currency, Revenue and EBITDA increased 14% and 13% respectively due to:
- Sustained organic growth at our existing operations; and
- Continuous ramp up of Gleneagles Hong Kong and Acibadem Altunizade (both opened in March 2017)
• PATMI decreased due to high base in Q2 2017 from the gain on disposal of remaining 4.78% equity stake in
Apollo Hospitals and higher FX losses from Acibadem’s non-Turkish Lira borrowing
• PATMI excluding exceptional items increased from a low base in Q2 2017 with the recognition of interest on
capital gains tax payable and additional tax provisions relating to prior years’ tax. The Group also recognised
FX gains on its USD cash balances.

RM'mil 2018 2017 Variance 2018 2017 Variance
Profit after tax and minority interests 165.1 316.6 -48% 222.3 786.6 -72%
Add back/(Less): Exceptional Items
Insurance compensation for Chennai flood 0.3 - (17.4) -
Gain on dispoal of quoted FVOCIi financial instruments
ii- (241.1) - (554.5)
Provision for financial guarantee given on a joint venture's
loan facilityiii
0.4 0.8 0.7 0.8
Exchange loss/(gain) on net borrowingsiv
189.2 20.8 349.0 114.8
189.9 (219.5) 332.4 (438.9)
Add/(less): Tax effects on exceptional items (37.8) (4.2) (69.8) (23.0)
152.0 (223.7) 262.6 (461.8)
Add/(less): Minority interest share of exceptional items (60.6) (6.7) (107.9) (36.7)
91.4 (230.3) 154.7 (498.6)
Profit after tax and minority interests
(Excluding exceptional itemsv) 256.5 86.2 197% 377.0 288.0 31%
Less: PATMI contribution from PLife REIT (17.5) (18.4) (32.6) (35.9)
Profit after tax and minority interests
(Excluding exceptional itemsv and PLife REIT) 239.0 67.8 NM 344.4 252.1 37%
YTD JunQTD Jun
6
Exceptional Items
Note:
i) Fair valued through other comprehensive income
ii) Gain on disposal of the Group’s 4.78% and 6.07% interest in Apollo Hospital Enterprise Limited in May 2017 and March 2017 respectively
iii) Proportionate share of corporate guarantee in relation to accrued interest on Khubchandani Hospital's loan
iv) Exchange differences arising from foreign currency denominated borrowings/payables net of foreign currency denominated cash/receivables, recognised
by Acibadem Holdings (As at 30 June 2018, Euro/TL=5.3092, USD/TL=4.5607)
v) Exceptional items, net of tax and non-controlling interests

As at
30 Jun 2018
As at
31 Dec 2017
RM'mil RM'mil
Total Assets 38,589 38,924
- Tangible Assets 26,029 25,954
- Intangible Assets
Goodwill 10,316 10,692
Other intangibles 2,245 2,278
Total Liabilities (13,584) (13,024)
Total Equity 25,006 25,901
Non-controlling Interests ("NCI") (1,663) (1,852)
Perpetual securities ("Perps") (2,156) (2,159)
Total Shareholders' Equity (excluding NCI and Perps) 21,187 21,890
Net Tangible Assets ("NTA") (excluding NCI and Perps) (A) 8,626 8,920
Total Debt (B) (7,246) (6,794)
Total Cash 6,193 6,079
Net Debt (C) (1,052) (715)
Net Debt / NTA (C)/(A) 0.12 0.08
Net Debt / Equity 0.04 0.03
Gross Debt / EBITDA* (times) (B)/(D) 3.13 2.98
Net Debt / EBITDA* (times) (C)/(D) 0.45 0.31
7 *: Based on last 12 months EBITDA
^: Excludes fixed deposits (>3 months) of R48.5 million (Dec 2017: RM163.6 million)
Healthy Balance Sheet

RM' mil
Projected
Disbursements
from Q3 2018
Pantai Hospital Kuala Lumpur Expansion 128.1
Pantai Hospital Ayer Keroh Expansion 153.5
Pantai Hospital Klang Expansion 155.8
Gleneagles Medini Greenfield 110.2
547.6
Gleneagles Hong Kong Hospital - 60% Greenfield 154.2
Gleneagles Shanghai Hospital - 70% Greenfield 581.8
Gleneagles Chengdu Hospital - 70% Brownfield 450.5
Gleneagles Nanjing Hospital - 60% Greenfield 89.3
1,121.6
Yangon Hospital - 52% Greenfield 341.8
IMU Expansion 29.1
Acibadem Maslak Expansion 95.2
Acibadem Atasehir Greenfield 203.4
Acibadem Kartal Greenfield 178.0
476.5
Total Unincurred Expansion Capital Expenditure 2,670.9 8
Expansion Capital Expenditure – Construction & Medical Equipment
*
*
*
*
*
Expect to invest approx. RM2.7 billion from Q3 2018 for the Group’s hospital projects
Funded from Malaysia’s operating cash flows
and new bank facilities, if required
*: Parkway will fund its share of the project cost
through its bank facility and the hospital
business partner will fund their respective
share. Amount shown is total capex
(% indicated shows the immediate holding
company’s ownership interest in these
hospitals)
Funded from Acibadem’s operating cash flows
and bank facilities
Based on the following exchange rates: 1 SGD : 2.9551 1TL : 0.9998 1 HKD : 0.5124 1 RMB : 0.6132 1 USD : 4.0216
^
^
^: Projects deferred

© All Rights Reserved.
This material is confidential and property to IHH Healthcare Berhad. No part of this material
should be reproduced or published in any form by any means, nor should the material be
disclosed to third parties without the consent of IHH.
9
Operational Highlights

10
Q2 2018 Operational Overview
Healthy revenue intensity across all home markets
1. Based on Singapore, Malaysia, India and Acibadem Holdings hospitals only. Excludes hospitals operated by joint venture companies, hospitals under hospital management agreements and other international hospitals.
2. Specialist fees not included in Singapore’s and Malaysia’s average revenue per inpatient admission
3. Based on a uniform exchange rate throughout the periods shown (SGD: 2.95508; INR:0.05895; TL:0.99982)
Inpatient Admission Volumes1 (Number)
Average Revenue per Inpatient Admission1 (RM)
Q12017
Q22017
Q12018
Q22018
27,720 28,034
29,120
30,502
PPL - MalaysiaPPL - Singapore2,3
Q12017
Q22017
Q12018
Q22018
5,861
6,179
6,427
6,701
PPL - MalaysiaPPL - Malaysia2
Q12017
Q22017
Q12018
Q22018
7,615 7,784
8,711 9,332
PPL - MalaysiaAcibadem2,3
Q12017
Q22017
Q12018
Q22018
7,280 7,252
7,907 7,939
PPL - MalaysiaPPL - India2,3
Q2 YoY Growth 0.4% Q2 YoY Growth -2.8% Q2 YoY Growth -5.5% Q2 YoY Growth 8.0%
Q2 YoY Growth 8.8% Q2 YoY Growth 8.4% Q2 YoY Growth 9.5% Q2 YoY Growth 19.9%
Q12017
Q22017
Q12018
Q22018
50,541
49,347
50,250
47,985
PPL - Malaysia
Q12017
Q22017
Q12018
Q22018
18,842 18,936
19,352 19,021
PPL - MalaysiaPPL - Singapore
Q12017
Q22017
Q12018
Q22018
52,581 52,995
60,166 57,239
PPL - MalaysiaAcibadem
Q12017
Q22017
Q12018
Q22018
16,008
17,194 17,075
16,242
PPL - MalaysiaPPL - India

11
Hospital Expansion Pipeline
2 projects due
to be completed
in 2018
2 projects due
to be completed
in 2019
4 projects due
to be completed
in 2020 and
beyond
Country Type Hospital Description
Malaysia Expansion Pantai Hospital Kuala Lumpur Block B Phase 2: 120 beds capacity
Turkey Expansion Acibadem Maslak 195 bed capacity
Country Type Hospital Description
China Greenfield Gleneagles Chengdu 350 bed capacity
China Greenfield Gleneagles Shanghai 450 bed capacity
Country Type Hospital Description
Malaysia Expansion Pantai Hospital Ayer Keroh 160 bed capacity (by 2020)
Malaysia Expansion Pantai Hospital Klang 140 bed capacity (by 2020)
Turkey Greenfield Acibadem Kartal, Istanbul 120 bed capacity
(To be evaluated)
Turkey Greenfield Acibadem Atasehir, Istanbul 128 bed capacity
(To be evaluated)

© All Rights Reserved.
This material is confidential and property to IHH Healthcare Berhad. No part of this material
should be reproduced or published in any form by any means, nor should the material be
disclosed to third parties without the consent of IHH.
12
Outlook and Key Takeaways

13
Outlook
Shifting demographics
in home and key
growth markets
Fast growing upper/
middle class in home
and key growth markets
Attract foreign patients
to established medical hubs
IHH will continue to draw from rapid growth over the past few years:
Expansion of existing and new facilities to support growth in demand for quality private healthcare:
Experienced
management team
with execution track
record
40-year track record
of delivering superior
clinical outcomes
Strong balance
sheet and
operating cash flows
Strong brands
and network
of hospitals
Strengthen service
offerings in existing
hospitals
Ramp up new hospitals
to achieve optimal
operating leverage
Consolidate newly
acquired assets
Prepare for progressive
opening of greenfields
hospitals
The Group remains resilient amid challenging operating environment expected for the year ahead:

14
The Group continued to deliver sustained organic growth as it ramps up new and existing
operations and maintained robust balance sheet through prudent cash management
Despite improved operational performance, EBITDA was partially eroded on a stronger Malaysian
Ringgit
Performance must be also viewed against a strong Q2 2017. Headline PATMI decreased against a
high base that included a one-off gain of RM241.1 million from the Apollo Hospitals stake
divestment
Positioning for sustainable growth through a differentiated portfolio strategy to maintain leadership,
explore new new markets, innovate, while driving organic operations.
Prudent cost management and assessment of growth opportunities to maximise value for investors
Remain well-placed to capture opportunities and manage near-term volatility:
India: Becoming a leading healthcare player in fast-growing India market: disciplined addition
of Fortis into IHH family; existing India operations ramping up to new level of excellence
Greater China: Growth pipeline will come onstream progressively
Turkey: Accelerating restructuring plans to reduce Acibadem’s foreign currency debt to
manage exposure to currency volatility
Resilient Core Financial Performance in Q2
Focused on delivering sustainable long-term value
Key Takeaways

© All Rights Reserved.
This material is confidential and property to IHH Healthcare Berhad. No part of this material
should be reproduced or published in any form by any means, nor should the material be
disclosed to third parties without the consent of IHH.
15
Questions & Answers

© All Rights Reserved.
This material is confidential and property to IHH Healthcare Berhad. No part of this material
should be reproduced or published in any form by any means, nor should the material be
disclosed to third parties without the consent of IHH.
16
Supplementary slides

17
Contribution across the Group
RM'mil
PPL-Singapore
PPL-Malaysia
PPL-China
PPL-HK
PPL-India
PPL-Others
Acibadem Holdings
IMU Health
REIT
Others
Check to highlights
Others, -20%
REIT, 12%
IMU Health, 12%
Acibadem Holdings, 10%
PPL-Others, -8%
PPL-India, -10%
PPL-HK, -55%
PPL-China, 5%
PPL-Malaysia, 40%
PPL-Singapore, 112%
-100% -50% 0% 50% 100% 150%
Others, 0%
REIT, 1%
IMU Health, 2%
Acibadem Holdings, 33%
PPL-Others, 2%
PPL-India, 6%
PPL-HK, 3%
PPL-China, 2%
PPL-Malaysia, 18%
PPL-Singapore, 34%
0% 10% 20% 30% 40%
Others, 0%
REIT, 1%
IMU Health, 2%
Acibadem Holdings, 34%
PPL-Others, 2%
PPL-India, 6%
PPL-HK, 1%
PPL-China, 2%
PPL-Malaysia, 16%
PPL-Singapore, 35%
0% 10% 20% 30% 40%
Others, -5%
REIT, 13%
IMU Health, 5%
Acibadem Holdings, 26%
PPL-Others, 2%
PPL-India, 1%
PPL-HK, -14%
PPL-China, 3%
PPL-Malaysia, 23%
PPL-Singapore, 47%
-20% -10% 0% 10% 20% 30% 40% 50% 60%
Others, -3%
REIT, 12%
IMU Health, 4%
Acibadem Holdings, 26%
PPL-Others, 0%
PPL-India, 0%
PPL-HK, -8%
PPL-China, 0%
PPL-Malaysia, 23%PPL-Singapore,
46%
-20% -10% 0% 10% 20% 30% 40% 50%
Others, -13%
REIT, 9%
IMU Health, 9%
Acibadem Holdings, 11%
PPL-Others, -4%
PPL-India, -6%
PPL-HK, -29%
PPL-China, -1%
PPL-Malaysia, 37% PPL-Singapore, 88%
-40% -20% 0% 20% 40% 60% 80% 100%
YTD 2018 PATMI (Excl EI)
YTD 2017 PATMI (Excl EI)
YTD 2018 Revenue YTD 2018 EBITDA
YTD 2017 Revenue YTD 2017 EBITDA

18
RM'mil 2018 2017 Variance 2018 2017 Variance
Revenue 2,626.5 2,737.3 -4% 5,448.8 5,389.6 1%
EBITDA 460.8 466.0 -1% 1,002.9 962.6 4%
PATMI 147.6 298.1 -50% 189.7 750.7 -75%
PATMI (Excl EI) 239.0 67.8 252% 344.4 252.1 37%
QTD Jun YTD JunExcluding PLife REIT’s Results
Sustained organic growth from existing operations
YoY growth eroded by stronger RM
19
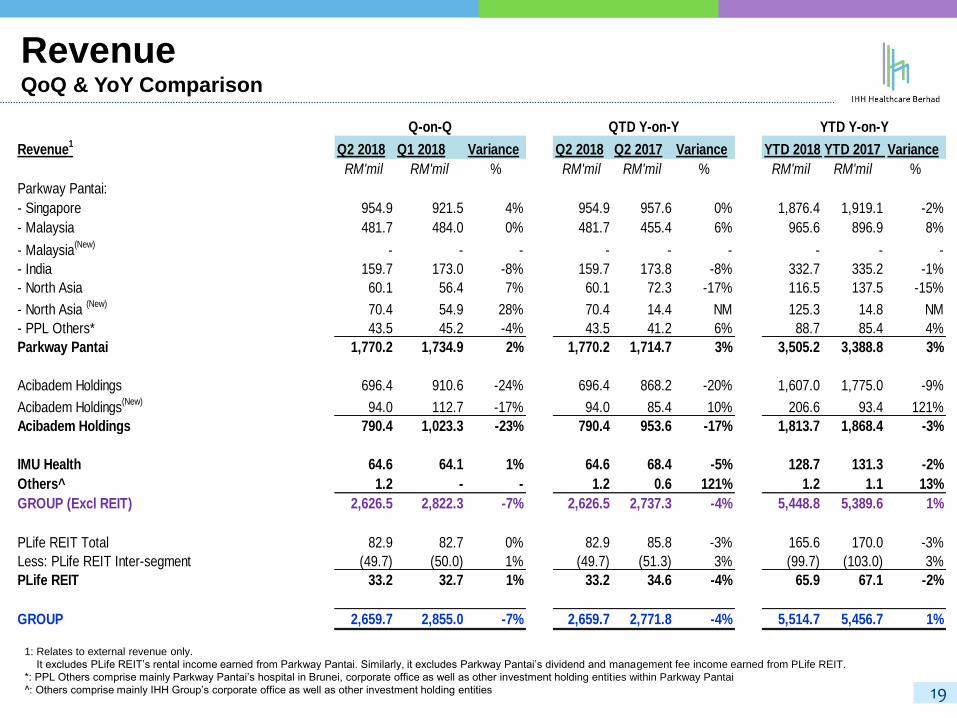
Revenue QoQ & YoY Comparison
Revenue1
Q2 2018 Q1 2018 Variance Q2 2018 Q2 2017 Variance YTD 2018 YTD 2017 Variance
RM'mil RM'mil % RM'mil RM'mil % RM'mil RM'mil %
Parkway Pantai:
- Singapore 954.9 921.5 4% 954.9 957.6 0% 1,876.4 1,919.1 -2%
- Malaysia 481.7 484.0 0% 481.7 455.4 6% 965.6 896.9 8%
- Malaysia(New)
- - - - - - - - -
- India 159.7 173.0 -8% 159.7 173.8 -8% 332.7 335.2 -1%
- North Asia 60.1 56.4 7% 60.1 72.3 -17% 116.5 137.5 -15%
- North Asia (New)
70.4 54.9 28% 70.4 14.4 NM 125.3 14.8 NM
- PPL Others* 43.5 45.2 -4% 43.5 41.2 6% 88.7 85.4 4%
Parkway Pantai 1,770.2 1,734.9 2% 1,770.2 1,714.7 3% 3,505.2 3,388.8 3%
Acibadem Holdings 696.4 910.6 -24% 696.4 868.2 -20% 1,607.0 1,775.0 -9%
Acibadem Holdings(New)
94.0 112.7 -17% 94.0 85.4 10% 206.6 93.4 121%
Acibadem Holdings 790.4 1,023.3 -23% 790.4 953.6 -17% 1,813.7 1,868.4 -3%
IMU Health 64.6 64.1 1% 64.6 68.4 -5% 128.7 131.3 -2%
Others^ 1.2 - - 1.2 0.6 121% 1.2 1.1 13%
GROUP (Excl REIT) 2,626.5 2,822.3 -7% 2,626.5 2,737.3 -4% 5,448.8 5,389.6 1%
PLife REIT Total 82.9 82.7 0% 82.9 85.8 -3% 165.6 170.0 -3%
Less: PLife REIT Inter-segment (49.7) (50.0) 1% (49.7) (51.3) 3% (99.7) (103.0) 3%
PLife REIT 33.2 32.7 1% 33.2 34.6 -4% 65.9 67.1 -2%
GROUP 2,659.7 2,855.0 -7% 2,659.7 2,771.8 -4% 5,514.7 5,456.7 1%
Q-on-Q QTD Y-on-Y YTD Y-on-Y
1: Relates to external revenue only.
It excludes PLife REIT’s rental income earned from Parkway Pantai. Similarly, it excludes Parkway Pantai’s dividend and management fee income earned from PLife REIT.
*: PPL Others comprise mainly Parkway Pantai’s hospital in Brunei, corporate office as well as other investment holding entities within Parkway Pantai
^: Others comprise mainly IHH Group’s corporate office as well as other investment holding entities

20
Revenue Q2 revenue eroded by strengthening RM
Revenue Variance (RM’mil)
The above figures excludes PLife REIT
Actual@ Constant
Currency
Parkway Pantai 3% 8%
Acibadem Holdings -3% 28%
IMU Health -2% -2%
IHH Group (Excl PLife REIT) 1% 15%
YTD'18 vs YTD'17
Revenue - QTD Variance
Revenue - YTD Variance
5,389.6
278.9
162.5
527.9
582.6 2.6
0.1 5,448.8
YTD 2017 Parkway Pantai Parkway Pantai(TranslationDifference)
AcibademHoldings
AcibademHoldings
(TranslationDifference)
IMU Health Others YTD 2018
2,737.3
140.3
84.8
247.8
410.9 3.7
0.7 2,626.5
QTD 2017 Parkway Pantai Parkway Pantai(TranslationDifference)
AcibademHoldings
AcibademHoldings
(TranslationDifference)
IMU Health Others QTD 2018
Actual@ Constant
Currency
Parkway Pantai 3% 8%
Acibadem Holdings -17% 26%
IMU Health -5% -5%
IHH Group (Excl PLife REIT) -4% 14%
Q2'18 vs Q2'17
21
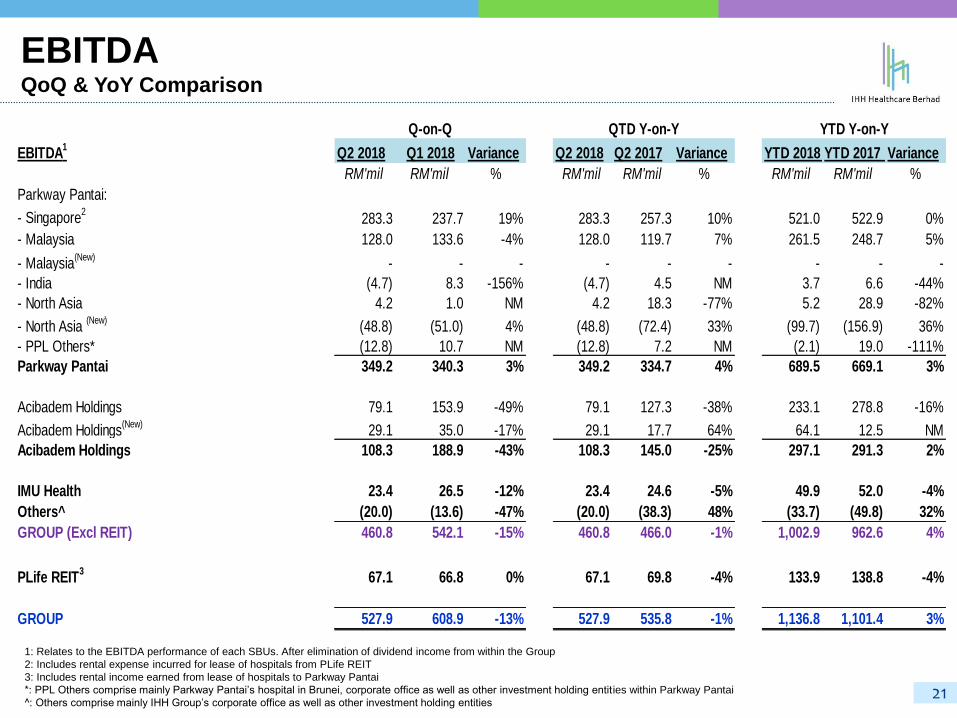
EBITDA QoQ & YoY Comparison
EBITDA1
Q2 2018 Q1 2018 Variance Q2 2018 Q2 2017 Variance YTD 2018 YTD 2017 Variance
RM'mil RM'mil % RM'mil RM'mil % RM'mil RM'mil %
Parkway Pantai:
- Singapore2
283.3 237.7 19% 283.3 257.3 10% 521.0 522.9 0%
- Malaysia 128.0 133.6 -4% 128.0 119.7 7% 261.5 248.7 5%
- Malaysia(New)
- - - - - - - - -
- India (4.7) 8.3 -156% (4.7) 4.5 NM 3.7 6.6 -44%
- North Asia 4.2 1.0 NM 4.2 18.3 -77% 5.2 28.9 -82%
- North Asia (New)
(48.8) (51.0) 4% (48.8) (72.4) 33% (99.7) (156.9) 36%
- PPL Others* (12.8) 10.7 NM (12.8) 7.2 NM (2.1) 19.0 -111%
Parkway Pantai 349.2 340.3 3% 349.2 334.7 4% 689.5 669.1 3%
Acibadem Holdings 79.1 153.9 -49% 79.1 127.3 -38% 233.1 278.8 -16%
Acibadem Holdings(New)
29.1 35.0 -17% 29.1 17.7 64% 64.1 12.5 NM
Acibadem Holdings 108.3 188.9 -43% 108.3 145.0 -25% 297.1 291.3 2%
IMU Health 23.4 26.5 -12% 23.4 24.6 -5% 49.9 52.0 -4%
Others^ (20.0) (13.6) -47% (20.0) (38.3) 48% (33.7) (49.8) 32%
GROUP (Excl REIT) 460.8 542.1 -15% 460.8 466.0 -1% 1,002.9 962.6 4%
PLife REIT3
67.1 66.8 0% 67.1 69.8 -4% 133.9 138.8 -4%
GROUP 527.9 608.9 -13% 527.9 535.8 -1% 1,136.8 1,101.4 3%
Q-on-Q QTD Y-on-Y YTD Y-on-Y
1: Relates to the EBITDA performance of each SBUs. After elimination of dividend income from within the Group
2: Includes rental expense incurred for lease of hospitals from PLife REIT
3: Includes rental income earned from lease of hospitals to Parkway Pantai
*: PPL Others comprise mainly Parkway Pantai’s hospital in Brunei, corporate office as well as other investment holding entities within Parkway Pantai
^: Others comprise mainly IHH Group’s corporate office as well as other investment holding entities
22
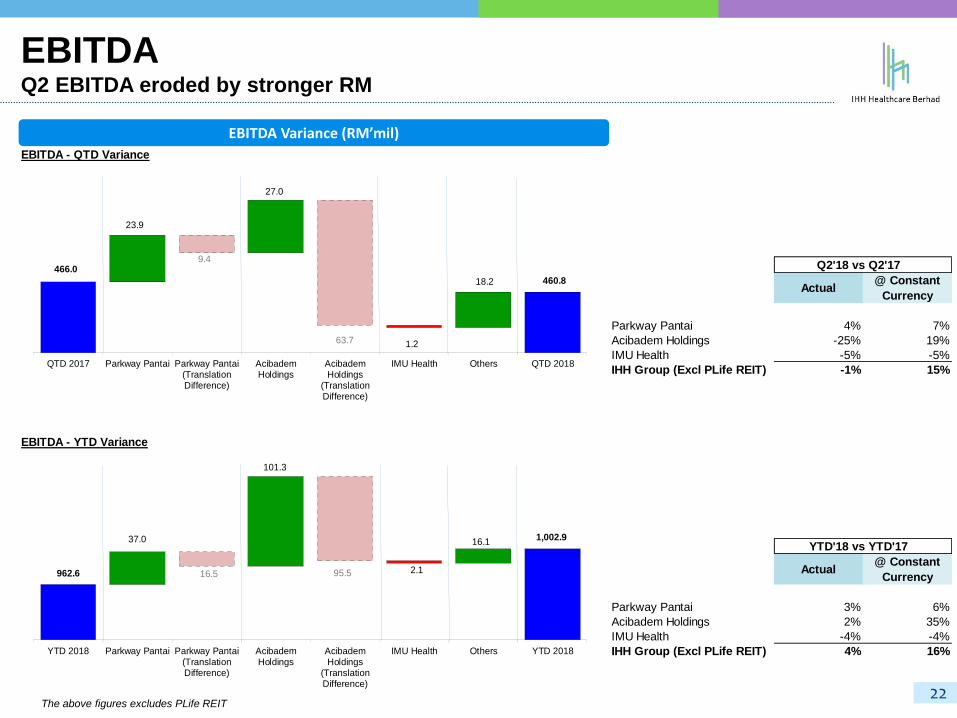
EBITDA Variance (RM’mil)
The above figures excludes PLife REIT
EBITDA Q2 EBITDA eroded by stronger RM
Actual@ Constant
Currency
Parkway Pantai 3% 6%
Acibadem Holdings 2% 35%
IMU Health -4% -4%
IHH Group (Excl PLife REIT) 4% 16%
YTD'18 vs YTD'17
EBITDA - QTD Variance
EBITDA - YTD Variance
Parkway Pantai
Acibadem Holdings
IMU Health
IHH Group (Excl PLife REIT)
Check:
962.6
37.0
16.5
101.3
95.5 2.1
16.11,002.9
YTD 2018 Parkway Pantai Parkway Pantai(TranslationDifference)
AcibademHoldings
AcibademHoldings
(TranslationDifference)
IMU Health Others YTD 2018
466.0
23.9
9.4
27.0
63.7 1.2
18.2 460.8
QTD 2017 Parkway Pantai Parkway Pantai(TranslationDifference)
AcibademHoldings
AcibademHoldings
(TranslationDifference)
IMU Health Others QTD 2018
Actual@ Constant
Currency
Parkway Pantai 4% 7%
Acibadem Holdings -25% 19%
IMU Health -5% -5%
IHH Group (Excl PLife REIT) -1% 15%
Q2'18 vs Q2'17
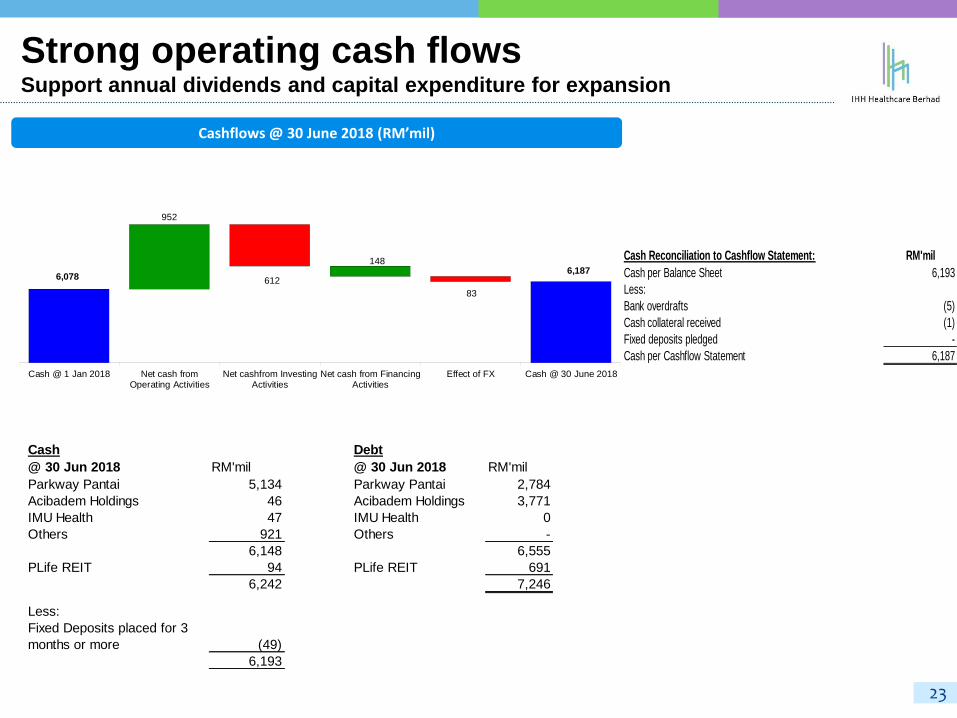
23
Strong operating cash flows Support annual dividends and capital expenditure for expansion
Cashflows @ 30 June 2018 (RM’mil)
Cash Reconciliation to Cashflow Statement: RM'mil
Cash per Balance Sheet 6,193
Less:
Bank overdrafts (5)
Cash collateral received (1)
Fixed deposits pledged -
Cash per Cashflow Statement 6,187
6,078
952
612
148
83
6,187
Cash @ 1 Jan 2018 Net cash fromOperating Activities
Net cashfrom InvestingActivities
Net cash from FinancingActivities
Effect of FX Cash @ 30 June 2018
Cash Debt
@ 30 Jun 2018 RM'mil @ 30 Jun 2018 RM'mil
Parkway Pantai 5,134 Parkway Pantai 2,784
Acibadem Holdings 46 Acibadem Holdings 3,771
IMU Health 47 IMU Health 0
Others 921 Others -
6,148 6,555
PLife REIT 94 PLife REIT 691
6,242 7,246
(49)
6,193
Less:
Fixed Deposits placed for 3
months or more