Embed Size (px)
Citation preview

www.msmsugar.com
AN
NU
AL
RE
PO
RT
20
19
MSM
MA
LAYSIA H
OLD
ING
S BER
HA
D
201101007583 (935722-K)
MSM MALAYSIA HOLDINGS BERHAD Registration No.: 201101007583 (935722-K)
Level 44, Menara FeldaPlatinum ParkNo. 11, Persiaran KLCC50088 Kuala LumpurTel No. : +603 2181 5018Fax No. : +603 2181 5015E-mail : [email protected]
A N N U A L R E P O R T 2 0 1 9
BalanceAttaining
This year’s cover depicts MSM Malaysia Holdings Berhad’s diverse product offerings within a balanced layout to reflect the Group’s commitment to seek new market opportunities to optimise on its current expanded production capabilities.
Challenged by increased competition due to the liberalisation of the country’s sugar industry and increased market supply conditions, MSM is steadfastly realising its global and domestic expansion plans and activating key strategies towards achieving a fortified and more balanced value chain. These include diversifying into new product lines and emerging a more strategic downstream presence through merger and acquisition explorations.
MSM’s Board of Directors and Senior Management, has approved the contents of this Annual Report, guided by the requirements of the MCCG 2017, Companies Act 2016, the Main Market Listing Requirements of Bursa Malaysia and Sustainability Guidelines. The financial report and statements have been audited by PricewaterhouseCoopers PLT and is approved free of qualifications. The Board acknowledges responsibility for ensuring the integrity recommendations of the annual report, following recommendation by the Audit Committee, responsible for oversight of the integrated annual report.
MSM’s integrated reporting process is intended to move beyond compliance to generate meaningful and inclusive discourse with our stakeholders with the aim of informing our strategy and building trust. We value feedback and welcome questions or comments on our reports. To share feedback, please contact our Investor Relations unit at +603 2181 5018 or e-mail us at [email protected].
Certain statements in this report regarding MSM’s operations may constitute forward-looking statements. These statements can be identified by key words such as “believes”, “estimates”, “anticipates”, “expects”, “intends”, “may”, “will”, “plans”, “outlook” and other words of similar meaning in connection with a discussion of future operating or financial performance. These statements relate to the plans, objectives, goals, strategies, future operations and performance of MSM. Actual results and outcomes may differ materially from those projected in any forward looking statements due to various events, risks, uncertainties and other factors. We neither intend to nor assume any obligation to update or revise any forward looking statements, whether as a result of new information, future events or otherwise.
The aim of MSM’s Annual Report is to provide a transparent, balanced and accessible narrative and analysis of our strategy, performance and prospects in relation to material, financial, economic, social, environmental and governance matters. Our reporting encompasses all material developments concerning MSM up until the approval of the annual financial statements. It focuses on MSM as a Group and encompasses our operating subsidiaries, i.e. MSM Prai Berhad, MSM Perlis Sdn Bhd, MSM Logistics Sdn Bhd and MSM Sugar Refinery (Johor) Sdn Bhd. Financial and non-financial data from our subsidiaries are consolidated for ease of reference. We have also included pertinent information that should assist stakeholders in making an informed assessment of MSM and how we are able to strategically create and sustain long-term stakeholder value.
The material matters and developments which are covered in the report were determined by taking into account the following considerations:
• Quantitative and qualitative criteria and factors in relation to MSM’s business and operations
• Matters critical to achieving our strategic objectives and creating long-term value for our stakeholders
• Matters covered in reports submitted to the Board of Directors for discussion or approval
• Material risks identified by our risk management process • Key stakeholders’ interests
All material matters and developments thereof for the reporting year under review can be found within Shaping Material Matters on page 10 and Management Discussion & Analysis (MD&A) from page 21 onwards.
ABOUT THIS REPORT
This report has been compiled in accordance with the concepts, guiding principles and content elements contained in the IIRC framework. This framework employs a reporting approach to create short, medium and long-term value as well as the connectivity and interdependencies of the six capitals, namely human, natural, manufactured, financial, intellectual, and social & relationship capital.
The report provides a complete and balanced review of MSM and its subsidiaries on the Economic, Environmental and Social (EES) performance within the context of its strategy, risks and opportunities for the period of 1 January 2019 to 31 December 2019.
This report adheres to the guidelines laid down within Bursa Malaysia Securities Berhad’s (Bursa Malaysia) Main Market Listing Requirements and Sustainability Guidelines. It also complies with requirements for EES reporting as outlined under the Global Reporting Initiative (GRI). Compliance with Malaysian legal requirements under the Companies Act 2016 and Malaysian Code on Corporate Governance 2017 (MCCG 2017) has also been adhered to.
SCOPE AND BOUNDARIES
ASSURANCE AND APPROVAL
FEEDBACK
FORWARD LOOKING STATEMENTS
DETERMINING MATERIALITY
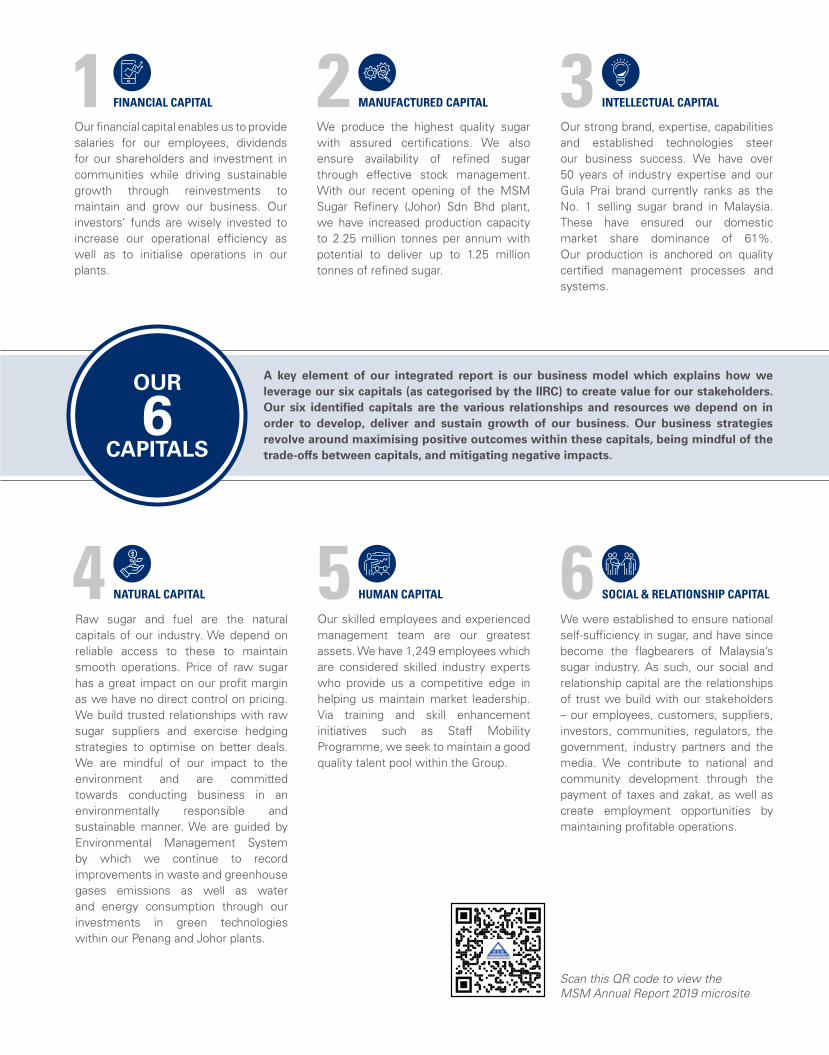
A key element of our integrated report is our business model which explains how we leverage our six capitals (as categorised by the IIRC) to create value for our stakeholders. Our six identified capitals are the various relationships and resources we depend on in order to develop, deliver and sustain growth of our business. Our business strategies revolve around maximising positive outcomes within these capitals, being mindful of the trade-offs between capitals, and mitigating negative impacts.
Scan this QR code to view the MSM Annual Report 2019 microsite
Raw sugar and fuel are the natural capitals of our industry. We depend on reliable access to these to maintain smooth operations. Price of raw sugar has a great impact on our profit margin as we have no direct control on pricing. We build trusted relationships with raw sugar suppliers and exercise hedging strategies to optimise on better deals. We are mindful of our impact to the environment and are committed towards conducting business in an environmentally responsible and sustainable manner. We are guided by Environmental Management System by which we continue to record improvements in waste and greenhouse gases emissions as well as water and energy consumption through our investments in green technologies within our Penang and Johor plants.
We were established to ensure national self-sufficiency in sugar, and have since become the flagbearers of Malaysia’s sugar industry. As such, our social and relationship capital are the relationships of trust we build with our stakeholders – our employees, customers, suppliers, investors, communities, regulators, the government, industry partners and the media. We contribute to national and community development through the payment of taxes and zakat, as well as create employment opportunities by maintaining profitable operations.
Our skilled employees and experienced management team are our greatest assets. We have 1,249 employees which are considered skilled industry experts who provide us a competitive edge in helping us maintain market leadership. Via training and skill enhancement initiatives such as Staff Mobility Programme, we seek to maintain a good quality talent pool within the Group.
We produce the highest quality sugar with assured certifications. We also ensure availability of refined sugar through effective stock management. With our recent opening of the MSM Sugar Refinery (Johor) Sdn Bhd plant, we have increased production capacity to 2.25 million tonnes per annum with potential to deliver up to 1.25 million tonnes of refined sugar.
Our financial capital enables us to provide salaries for our employees, dividends for our shareholders and investment in communities while driving sustainable growth through reinvestments to maintain and grow our business. Our investors’ funds are wisely invested to increase our operational efficiency as well as to initialise operations in our plants.
Our strong brand, expertise, capabilities and established technologies steer our business success. We have over 50 years of industry expertise and our Gula Prai brand currently ranks as the No. 1 selling sugar brand in Malaysia. These have ensured our domestic market share dominance of 61%. Our production is anchored on quality certified management processes and systems.
MANUFACTURED CAPITALFINANCIAL CAPITAL
NATURAL CAPITAL
INTELLECTUAL CAPITAL
SOCIAL & RELATIONSHIP CAPITALHUMAN CAPITAL
OUR
6CAPITALS
1
4
2
5
3
6
2MSM OVERVIEW14 Corporate Profile
• Vision, Mission and Values• Key Highlights
15 Corporate Milestones16 Corporate Structure17 Organisational Structure18 Corporate Information19 Key Moments20 Awards & Certifications
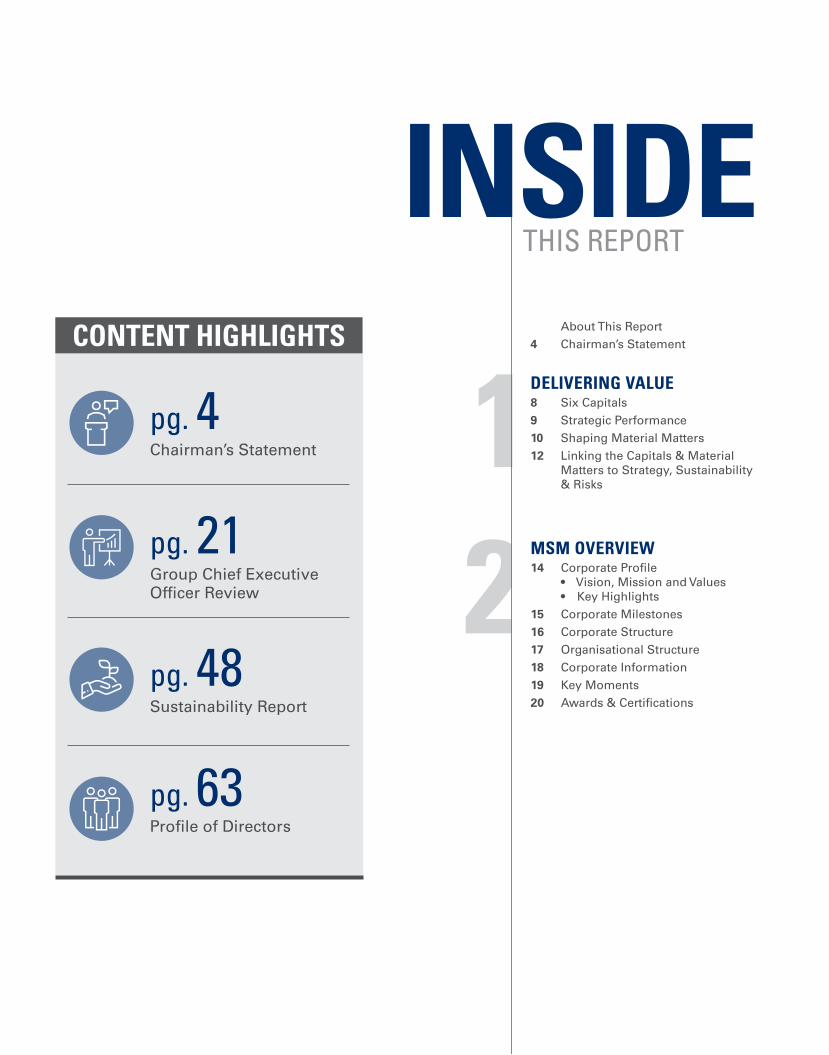
1CONTENT HIGHLIGHTS
pg. 4Chairman’s Statement
pg. 21Group Chief Executive Officer Review
pg. 48Sustainability Report
pg. 63Profile of Directors
About This Report4 Chairman’s Statement
DELIVERING VALUE 8 Six Capitals9 Strategic Performance10 Shaping Material Matters12 Linking the Capitals & Material
Matters to Strategy, Sustainability & Risks
THIS REPORTINSIDE
3
5
84
69
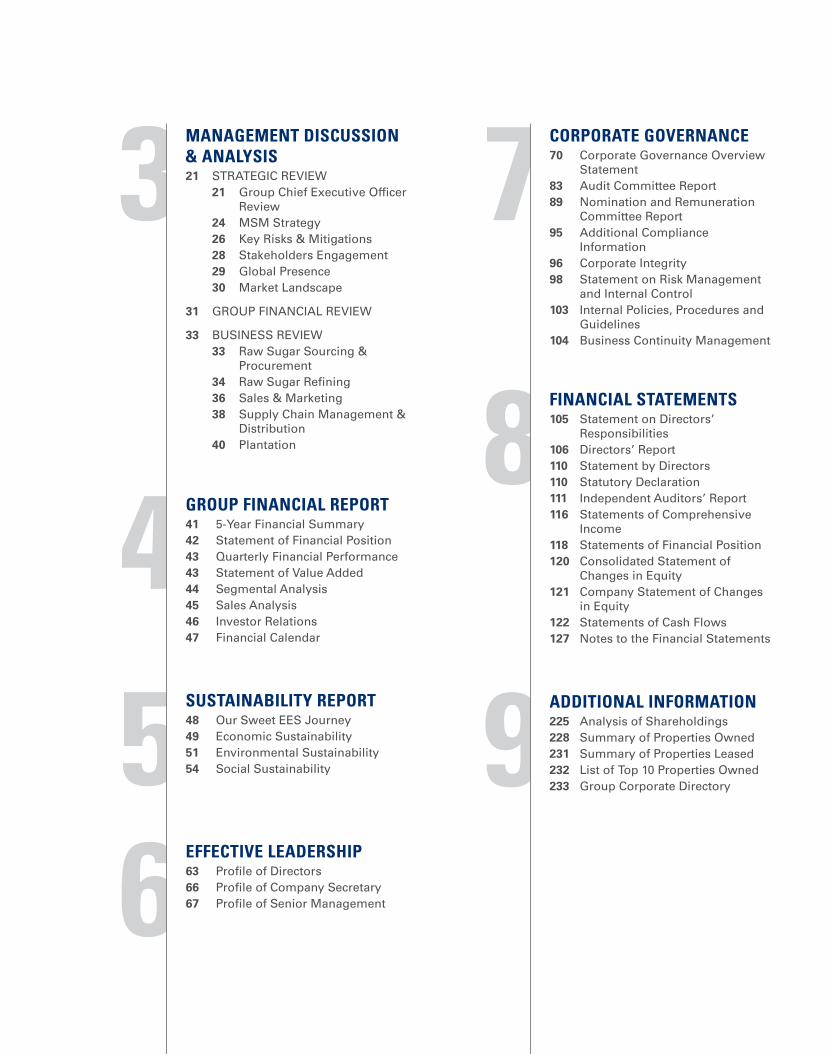
7MANAGEMENT DISCUSSION & ANALYSIS21 Strategic review
21 group chief executive Officer review
24 MSM Strategy26 Key risks & Mitigations28 Stakeholders engagement29 global Presence30 Market Landscape
31 grOUP FiNaNciaL review
33 BUSiNeSS review33 raw Sugar Sourcing &
Procurement34 raw Sugar refining36 Sales & Marketing38 Supply chain Management &
Distribution40 Plantation
GROUP FINANCIAL REPORT41 5-Year Financial Summary42 Statement of Financial Position43 Quarterly Financial Performance43 Statement of value added44 Segmental analysis45 Sales analysis46 investor relations47 Financial calendar
SUSTAINABILITY REPORT48 Our Sweet eeS Journey49 economic Sustainability51 environmental Sustainability54 Social Sustainability
EFFECTIVE LEADERSHIP63 Profile of Directors66 Profile of company Secretary67 Profile of Senior Management
CORPORATE GOVERNANCE70 corporate governance Overview
Statement83 audit committee report89 Nomination and remuneration
committee report95 additional compliance
information96 corporate integrity98 Statement on risk Management
and internal control103 internal Policies, Procedures and
guidelines104 Business continuity Management
FINANCIAL STATEMENTS105 Statement on Directors’
responsibilities106 Directors’ report110 Statement by Directors110 Statutory Declaration111 independent auditors’ report116 Statements of comprehensive
income118 Statements of Financial Position120 consolidated Statement of
changes in equity121 company Statement of changes
in equity122 Statements of cash Flows127 Notes to the Financial Statements
ADDITIONAL INFORMATION225 analysis of Shareholdings228 Summary of Properties Owned231 Summary of Properties Leased232 List of top 10 Properties Owned233 group corporate Directory
CHAIRMAN’S STATEMENT
DEAR VALUED STAKEHOLDERS,
MSM Malaysia Holdings Berhad (MSM) is today the eighth largest sugar refiner in the world by capacity, with the commercialisation of MSM Sugar Refinery (Johor) Sdn Bhd (MSM Johor) in April 2019. Whilst this may have been an advantageous situation under different circumstances, the truth of the matter is, in the prevailing market and with persistent national and industry-related challenges, this expanded capacity has not as yet delivered positive value to the Group and its stakeholders. The main reasons for this are, the continued sugar surplus in the global market which has adversely affected prices, and intensified competition within the domestic market as a result of the issuance of several approved import permits (APs) to non-refiners.
Keeping the situation in mind, your Board and Management are focused on Attaining Balance to strengthen MSM’s position as market leader and to build future sustainability.
In this regard, key progress was made in redirecting investments and efforts towards opportunities in the export market. Also, new controls have been put in place to ensure that speculative decision-making and previous errors of judgement will not be repeated.
2019 MARKET CHALLENGES
As predicted, the issue of new APs and the liberalisation of the local market has resulted in stiff competition, taking its toll on MSM’s financial performance in 2019. Revenue dropped 9% to RM2 billion in Financial Year (FY) 2019 from RM2.2 billion in FY 2018, while the Group registered a net loss of RM299.77 million in FY 2019, compared to a profit of RM35.66 million a year ago.
Both the nation’s sugar players experienced overcapacity in production levels as a result of new entrants flooding the local market. As running plants at an optimum level would have led to a stock build-up and an unnecessary tie-up of working capital, MSM focused on enhancing its business platform by seeking a strategic balance in the export market. This will also help to secure a more sustainable future for the Group going ahead.
SHAPING NEW STRENGTHS
As a result of the new operating challenges, the Group was able to reshape its thinking and approach, thus resulting in new achievements. In the second half of 2019, MSM Johor succeeded in the development of value-added products such as premix and liquid sugar. This extends the Group’s capabilities, increases product offerings and opens up new markets for growth.
REVENUE
RM2 billion
MSM MalaySia HoldingS BerHad | annual report 20194
AS A RESULT OF THE NEW OPERATING CHALLENGES,
THE GROUP WAS ABLE TO RESHAPE ITS THINKING AND
APPROACH, THUS RESULTING IN NEW ACHIEVEMENTS.
IN THE SECOND HALF OF 2019, MSM JOHOR SUCCEEDED
IN THE DEVELOPMENT OF VALUE-ADDED PRODUCTS
SUCH AS PREMIx AND LIqUID SUGAR. THIS ExTENDS THE
GROUP’S CAPABILITIES, INCREASES PRODUCT OFFERINGS
AND OPENS UP NEW MARKETS FOR GROWTH.
During the year, MSM also restructured its borrowings with lenders to more efficiently manage its cash flow. Furthermore, planned measures to streamline operations and strengthen its balance sheet were implemented. As a result, non-core assets or plantation land was monetised to pare down debt.
For the year ahead, the Board’s strategic direction for the Group continues to centre around the implementation of transformation plans through diversification into downstream segments. These include potential greenfield investments or mergers and acquisitions in food based businesses to further diversify the Group’s income stream and increase utilisation of MSM Johor’s capacity.
These strategic initiatives are expected to gradually bear fruit from 2020 onwards.
MANAGING RISKS AND ENSURING BUSINESS CONTINUITY
At Board level, focus for the year was directed on strengthening Risk Management and Business Continuity
Good governance continues to be a priority and towards this end, MSM has leveraged on governance activities organised by our parent company FGV Holdings Berhad, which allowed us to consolidate resources and limit the overlapping of efforts. The Group’s commitment to good corporate governance for the year culminated in the achievement of the Transparency and Integrity at FGV Group level. For the year 2020, MSM targets to pursue the corporate measures activities to comply with the MACC Section 17A.
COMMITMENT TO OUR STAKEHOLDERS
In order to protect the stability of the nation’s sugar supply, MSM continued to engage with authorities, to highlight the potential negative impacts of any sugar market liberalisation. These include potentially compromising our nation’s self-sustainability levels and strengths, especially since other countries continue to protect their respective sugar industries.
Management (BCM). We sought to improve Risk Management policies, tools and frameworks, taking into account concerns and views of various stakeholders.
Various mitigation steps have been taken depending on the type of risks registered in the MSM Risk Register. For example:
i) Risk of default due to tight cash flow is mitigated by an agreement to step up principal repayment and debt restructuring.
ii) Risk of excess supply of refined sugar is mitigated by revising and improving the Marketing Plan and Strategy. To this end, the sales team is aggressively working on penetrating new markets, optimising product segmentation and at the same time focusing on serving the existing market better.
iii) Risk of unfavourable raw sugar price movement continues to be mitigated by constant monitoring, hedging and responsive purchase at achievable profit target price points.
5
CHAIRMAN’S STATEMENT
The Board is aware, that if this situation is not managed well, MSM would have to implement alternative measures to safeguard the interests of our stakeholders, without taking into account national interests or Malaysian consumer interests. This will be a difficult decision to make, especially given MSM’s history as Malaysia’s first sugar refiner, one which has grown as part of the nation’s economic fabric since 1964.
Meanwhile, we have been actively engaging with fund managers, institutional shareholders and lenders to explain the change in the Group’s focus and to present our strategies moving forward.
We also actively engaged our customers to understand better how we could meet their needs and help with their challenges, and to improve service levels. As we enter new markets, we are also forging new relationships with different target segments to understand niche product requirements better.
LOOKING AHEAD
At the time of writing, the coronavirus (COVID-19) pandemic has taken its toll on global and domestic economy, has reached unprecedented heights. Many industries have been negatively impacted, particularly the travel and hospitality. The prolonged impact is yet to be determined, however, timely fiscal measures by the government, and the banking industry have been unleashed to help mitigate impact to the livelihoods going forward.
As MSM is a recognised producer of an essential item, impact on our refineries have been minimal at this stage. Trade remains unaffected and we have an ample stock at hand to tide over any disruptions to the supply chain.
Going forward, MSM’s first priorities are profitability and returning value to shareholders which we expect to achieve by optimising the expanded capacity we now have at hand with MSM Johor. If our traditional domestic market continues to present operating challenges, we must shift our focus towards the strategic optimisation of our resources to new markets and market segments. We are already working on healthy sweetener products in line with the change in consumer
demand. That gives us a broader platform to enhance MSM’s business position. Some of these new products are expected to be launched in the second quarter of 2020.
On the operational front, as growth opportunities in the near future are primarily linked to MSM Johor’s capacity for expansion of value added products, the intention moving ahead is to rationalise Group-wide capacity through consolidation of production in MSM Johor.
ACKNOWLEDGEMENTS
We have heard it said often enough that adversity offers us the opportunity to become more competitive and to prioritise differently. Over the last couple of years, that is exactly what you have seen the people in MSM do – they have reassessed the situation and recalibrated their objectives. While creating and providing value to all stakeholders will always be our main goal, the course we have set to reach these goals is now different. Our capacity to deliver will rest on the commitment and dedication of our people. They are the drivers of the turnaround as MSM responds to new market opportunities.
ON THE OPERATIONAL FRONT, AS GROWTH OPPORTUNITIES
IN THE NEAR FUTURE ARE PRIMARILY LINKED TO
MSM JOHOR’S CAPACITY FOR ExPANSION OF VALUE
ADDED PRODUCTS, THE INTENTION MOVING AHEAD
IS TO RATIONALISE GROUP-WIDE CAPACITY THROUGH
CONSOLIDATION OF PRODUCTION IN MSM JOHOR.
MSM MalaySia HoldingS BerHad | annual report 20196
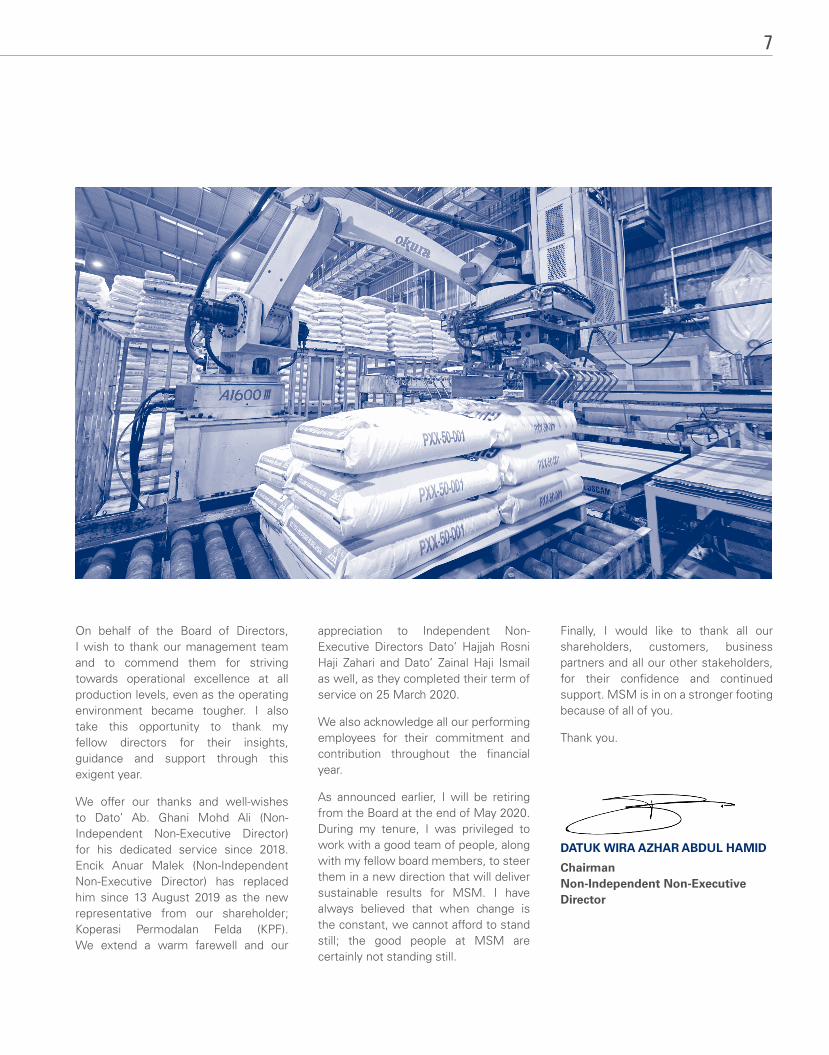
On behalf of the Board of Directors, I wish to thank our management team and to commend them for striving towards operational excellence at all production levels, even as the operating environment became tougher. I also take this opportunity to thank my fellow directors for their insights, guidance and support through this exigent year.
We offer our thanks and well-wishes to Dato’ Ab. Ghani Mohd Ali (Non-Independent Non-Executive Director) for his dedicated service since 2018. Encik Anuar Malek (Non-Independent Non-Executive Director) has replaced him since 13 August 2019 as the new representative from our shareholder; Koperasi Permodalan Felda (KPF). We extend a warm farewell and our
appreciation to Independent Non-Executive Directors Dato’ Hajjah Rosni Haji Zahari and Dato’ Zainal Haji Ismail as well, as they completed their term of service on 25 March 2020.
We also acknowledge all our performing employees for their commitment and contribution throughout the financial year.
As announced earlier, I will be retiring from the Board at the end of May 2020. During my tenure, I was privileged to work with a good team of people, along with my fellow board members, to steer them in a new direction that will deliver sustainable results for MSM. I have always believed that when change is the constant, we cannot afford to stand still; the good people at MSM are certainly not standing still.
Finally, I would like to thank all our shareholders, customers, business partners and all our other stakeholders, for their confidence and continued support. MSM is in on a stronger footing because of all of you.
Thank you.
DATUK WIRA AZHAR ABDUL HAMID
ChairmanNon-Independent Non-Executive Director
7
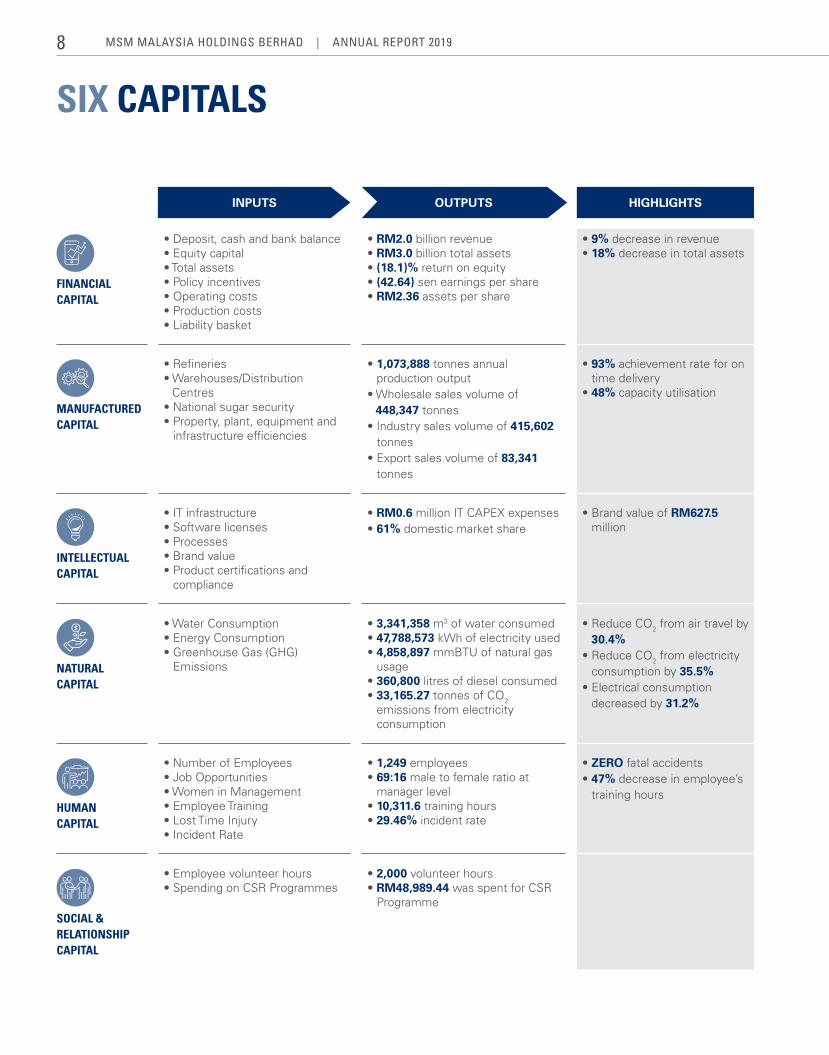
SIX CAPITALS
Inputs outputs hIghlIghts
FINANCIAL CAPITAL
• Deposit, cash and bank balance• Equity capital• Total assets• Policy incentives• Operating costs• Production costs• Liability basket
• RM2.0 billion revenue• RM3.0 billion total assets• (18.1)% return on equity• (42.64) sen earnings per share• RM2.36 assets per share
• 9% decrease in revenue • 18% decrease in total assets
MANUFACTURED CAPITAL
• Refineries• Warehouses/Distribution
Centres• National sugar security• Property, plant, equipment and
infrastructure efficiencies
• 1,073,888 tonnes annual production output
• Wholesale sales volume of 448,347 tonnes
• Industry sales volume of 415,602 tonnes
• Export sales volume of 83,341 tonnes
• 93% achievement rate for on time delivery
• 48% capacity utilisation
INTELLECTUAL CAPITAL
• IT infrastructure• Software licenses• Processes• Brand value• Product certifications and
compliance
• RM0.6 million IT CAPEX expenses• 61% domestic market share
• Brand value of RM627.5 million
NATURAL CAPITAL
• Water Consumption• Energy Consumption• Greenhouse Gas (GHG)
Emissions
• 3,341,358 m3 of water consumed• 47,788,573 kWh of electricity used• 4,858,897 mmBTU of natural gas
usage• 360,800 litres of diesel consumed• 33,165.27 tonnes of CO2
emissions from electricity consumption
• Reduce CO2 from air travel by 30.4%
• Reduce CO2 from electricity consumption by 35.5%
• Electrical consumption decreased by 31.2%
HUMAN CAPITAL
• Number of Employees• Job Opportunities• Women in Management• Employee Training• Lost Time Injury• Incident Rate
• 1,249 employees• 69:16 male to female ratio at
manager level• 10,311.6 training hours• 29.46% incident rate
• ZERo fatal accidents• 47% decrease in employee’s
training hours
SOCIAL & RELATIONSHIP CAPITAL
• Employee volunteer hours• Spending on CSR Programmes
• 2,000 volunteer hours• RM48,989.44 was spent for CSR
Programme
MSM MalaySia HoldingS BerHad | annual report 20198
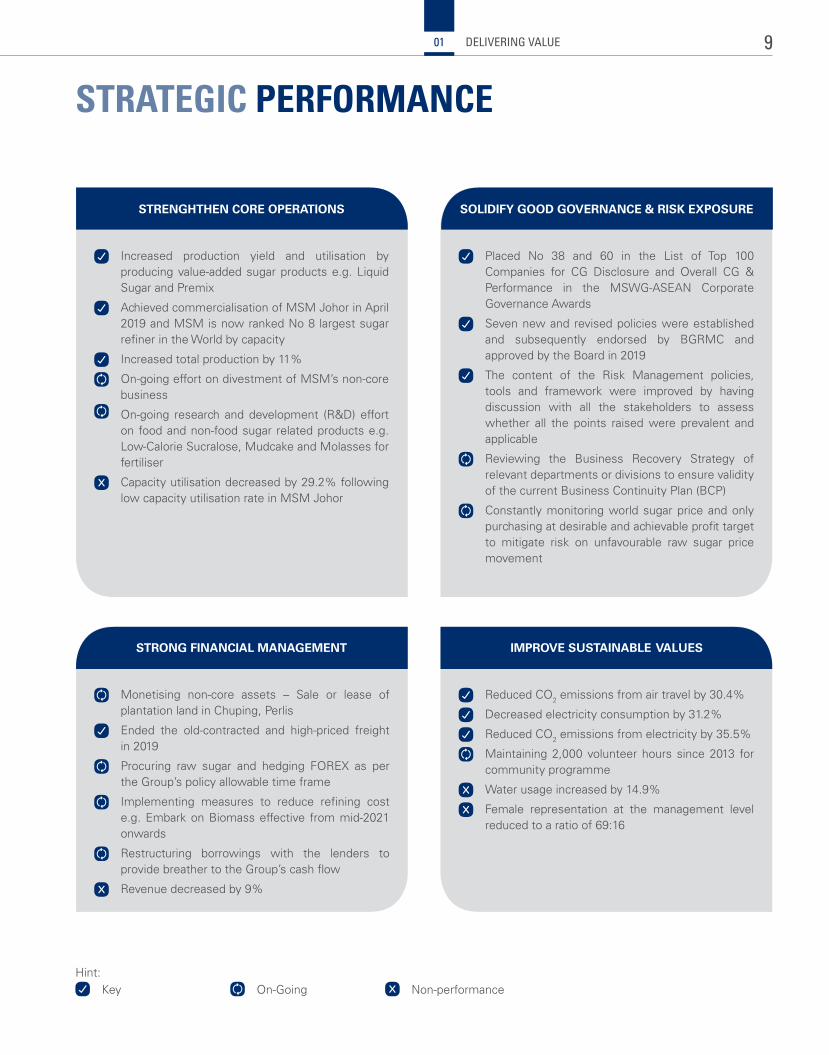
STRATEGIC PERFORMANCE
SOLIDIFY GOOD GOVERNANCE & RISK ExPOSURE
Increased production yield and utilisation by producing value-added sugar products e.g. Liquid Sugar and Premix
Achieved commercialisation of MSM Johor in April 2019 and MSM is now ranked No 8 largest sugar refiner in the World by capacity
Increased total production by 11%
On-going effort on divestment of MSM’s non-core business
On-going research and development (R&D) effort on food and non-food sugar related products e.g. Low-Calorie Sucralose, Mudcake and Molasses for fertiliser
Capacity utilisation decreased by 29.2% following low capacity utilisation rate in MSM Johor
Monetising non-core assets – Sale or lease of plantation land in Chuping, Perlis
Ended the old-contracted and high-priced freight in 2019
Procuring raw sugar and hedging FOREX as per the Group’s policy allowable time frame
Implementing measures to reduce refining cost e.g. Embark on Biomass effective from mid-2021 onwards
Restructuring borrowings with the lenders to provide breather to the Group’s cash flow
Revenue decreased by 9%
Placed No 38 and 60 in the List of Top 100 Companies for CG Disclosure and Overall CG & Performance in the MSWG-ASEAN Corporate Governance Awards
Seven new and revised policies were established and subsequently endorsed by BGRMC and approved by the Board in 2019
The content of the Risk Management policies, tools and framework were improved by having discussion with all the stakeholders to assess whether all the points raised were prevalent and applicable
Reviewing the Business Recovery Strategy of relevant departments or divisions to ensure validity of the current Business Continuity Plan (BCP)
Constantly monitoring world sugar price and only purchasing at desirable and achievable profit target to mitigate risk on unfavourable raw sugar price movement
Reduced CO2 emissions from air travel by 30.4%
Decreased electricity consumption by 31.2%
Reduced CO2 emissions from electricity by 35.5%
Maintaining 2,000 volunteer hours since 2013 for community programme
Water usage increased by 14.9%
Female representation at the management level reduced to a ratio of 69:16
STRENGHTHEN CORE OPERATIONS
IMPROVE SUSTAINABLE VALUESSTRONG FINANCIAL MANAGEMENT
Hint:
Key On-Going Non-performance
9DELIVERING VALUE01
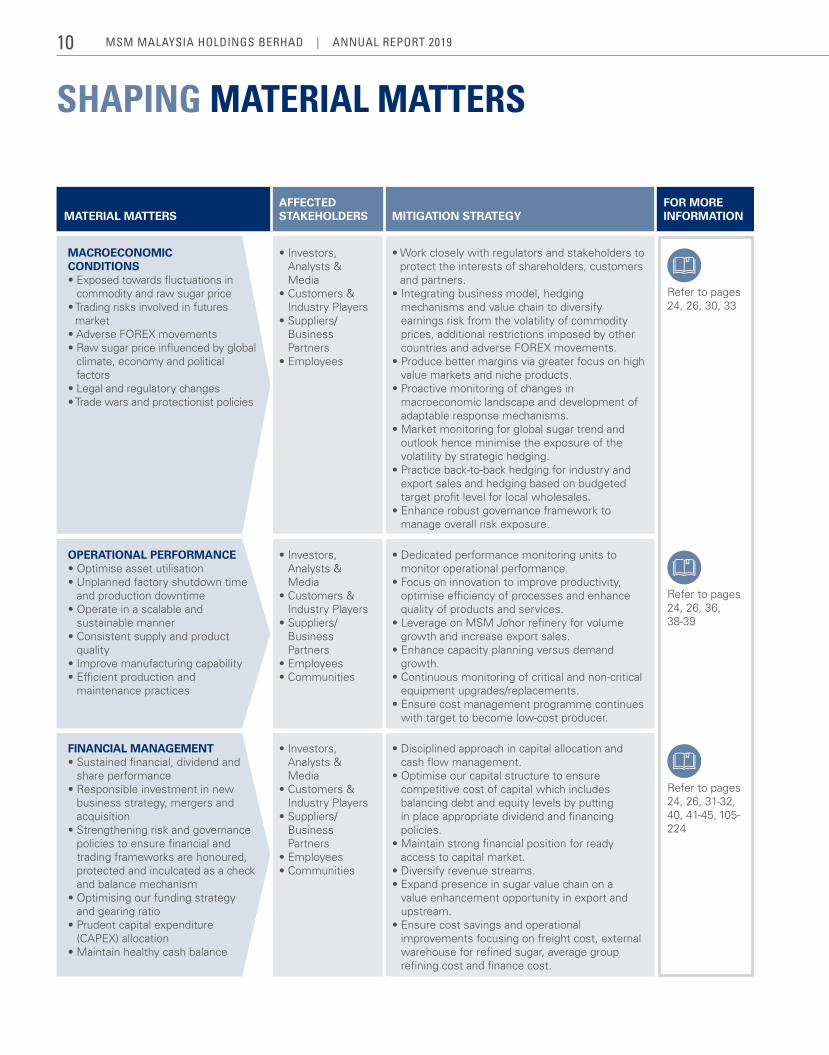
SHAPING MATERIAL MATTERS
MACROECONOMIC CONDITIONS• Exposed towards fluctuations in
commodity and raw sugar price• Trading risks involved in futures
market• Adverse FOREX movements• Raw sugar price influenced by global
climate, economy and political factors
• Legal and regulatory changes• Trade wars and protectionist policies
• Investors, Analysts & Media
• Customers & Industry Players
• Suppliers/Business Partners
• Employees
• Work closely with regulators and stakeholders to protect the interests of shareholders, customers and partners.
• Integrating business model, hedging mechanisms and value chain to diversify earnings risk from the volatility of commodity prices, additional restrictions imposed by other countries and adverse FOREX movements.
• Produce better margins via greater focus on high value markets and niche products.
• Proactive monitoring of changes in macroeconomic landscape and development of adaptable response mechanisms.
• Market monitoring for global sugar trend and outlook hence minimise the exposure of the volatility by strategic hedging.
• Practice back-to-back hedging for industry and export sales and hedging based on budgeted target profit level for local wholesales.
• Enhance robust governance framework to manage overall risk exposure.
Refer to pages 24, 26, 30, 33
OPERATIONAL PERFORMANCE• Optimise asset utilisation• Unplanned factory shutdown time
and production downtime• Operate in a scalable and
sustainable manner• Consistent supply and product
quality• Improve manufacturing capability• Efficient production and
maintenance practices
• Investors, Analysts & Media
• Customers & Industry Players
• Suppliers/ Business Partners
• Employees• Communities
• Dedicated performance monitoring units to monitor operational performance.
• Focus on innovation to improve productivity, optimise efficiency of processes and enhance quality of products and services.
• Leverage on MSM Johor refinery for volume growth and increase export sales.
• Enhance capacity planning versus demand growth.
• Continuous monitoring of critical and non-critical equipment upgrades/replacements.
• Ensure cost management programme continues with target to become low-cost producer.
Refer to pages 24, 26, 36, 38-39
FINANCIAL MANAGEMENT• Sustained financial, dividend and
share performance• Responsible investment in new
business strategy, mergers and acquisition
• Strengthening risk and governance policies to ensure financial and trading frameworks are honoured, protected and inculcated as a check and balance mechanism
• Optimising our funding strategy and gearing ratio
• Prudent capital expenditure (CAPEX) allocation
• Maintain healthy cash balance
• Investors, Analysts & Media
• Customers & Industry Players
• Suppliers/Business Partners
• Employees• Communities
• Disciplined approach in capital allocation and cash flow management.
• Optimise our capital structure to ensure competitive cost of capital which includes balancing debt and equity levels by putting in place appropriate dividend and financing policies.
• Maintain strong financial position for ready access to capital market.
• Diversify revenue streams.• Expand presence in sugar value chain on a
value enhancement opportunity in export and upstream.
• Ensure cost savings and operational improvements focusing on freight cost, external warehouse for refined sugar, average group refining cost and finance cost.
Refer to pages 24, 26, 31-32, 40, 41-45, 105-224
MATERIAL MATTERSAFFECTED STAKEHOLDERS MITIGATION STRATEGY
FOR MORE INFORMATION
MSM MalaySia HoldingS BerHad | annual report 201910
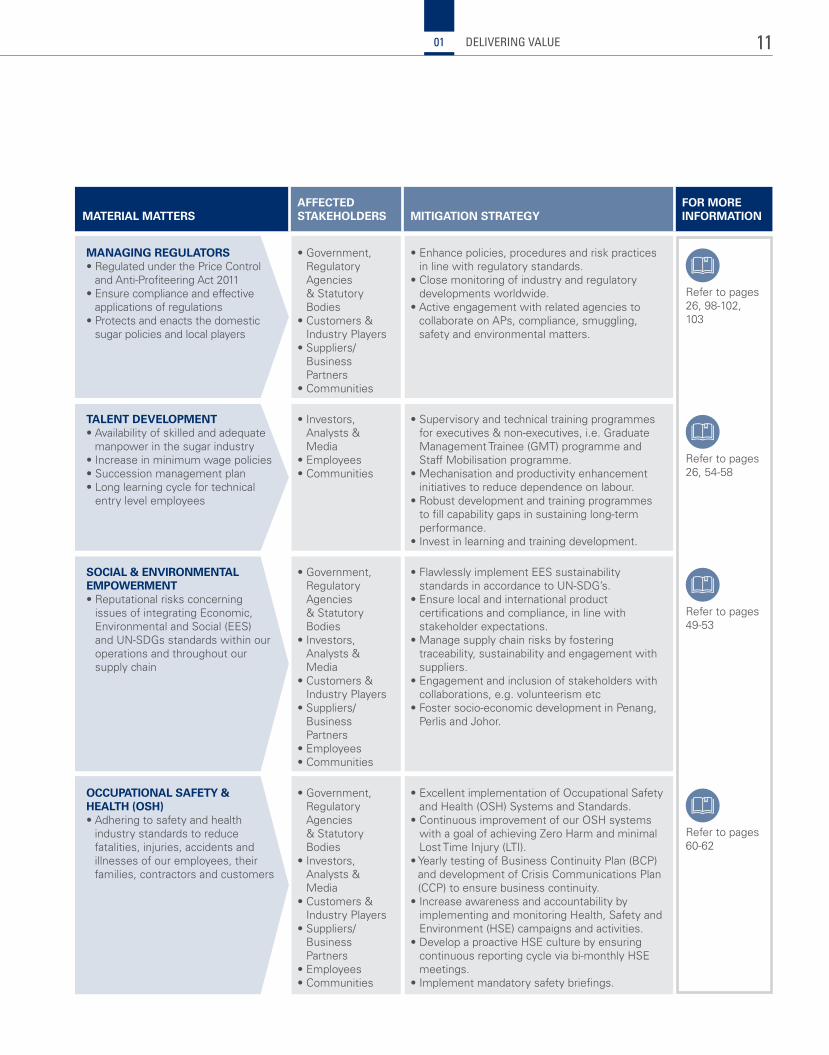
MANAGING REGULATORS• Regulated under the Price Control
and Anti-Profiteering Act 2011• Ensure compliance and effective
applications of regulations• Protects and enacts the domestic
sugar policies and local players
• Government, Regulatory Agencies & Statutory Bodies
• Customers & Industry Players
• Suppliers/Business Partners
• Communities
• Enhance policies, procedures and risk practices in line with regulatory standards.
• Close monitoring of industry and regulatory developments worldwide.
• Active engagement with related agencies to collaborate on APs, compliance, smuggling, safety and environmental matters.
Refer to pages 26, 98-102, 103
TALENT DEVELOPMENT• Availability of skilled and adequate
manpower in the sugar industry• Increase in minimum wage policies• Succession management plan• Long learning cycle for technical
entry level employees
• Investors, Analysts & Media
• Employees• Communities
• Supervisory and technical training programmes for executives & non-executives, i.e. Graduate Management Trainee (GMT) programme and Staff Mobilisation programme.
• Mechanisation and productivity enhancement initiatives to reduce dependence on labour.
• Robust development and training programmes to fill capability gaps in sustaining long-term performance.
• Invest in learning and training development.
Refer to pages 26, 54-58
SOCIAL & ENVIRONMENTAL EMPOWERMENT• Reputational risks concerning
issues of integrating Economic, Environmental and Social (EES) and UN-SDGs standards within our operations and throughout our supply chain
• Government, Regulatory Agencies & Statutory Bodies
• Investors, Analysts & Media
• Customers & Industry Players
• Suppliers/Business Partners
• Employees• Communities
• Flawlessly implement EES sustainability standards in accordance to UN-SDG’s.
• Ensure local and international product certifications and compliance, in line with stakeholder expectations.
• Manage supply chain risks by fostering traceability, sustainability and engagement with suppliers.
• Engagement and inclusion of stakeholders with collaborations, e.g. volunteerism etc
• Foster socio-economic development in Penang, Perlis and Johor.
Refer to pages 49-53
OCCUPATIONAL SAFETY & HEALTH (OSH) • Adhering to safety and health
industry standards to reduce fatalities, injuries, accidents and illnesses of our employees, their families, contractors and customers
• Government, Regulatory Agencies & Statutory Bodies
• Investors, Analysts & Media
• Customers & Industry Players
• Suppliers/Business Partners
• Employees• Communities
• Excellent implementation of Occupational Safety and Health (OSH) Systems and Standards.
• Continuous improvement of our OSH systems with a goal of achieving Zero Harm and minimal Lost Time Injury (LTI).
• Yearly testing of Business Continuity Plan (BCP) and development of Crisis Communications Plan (CCP) to ensure business continuity.
• Increase awareness and accountability by implementing and monitoring Health, Safety and Environment (HSE) campaigns and activities.
• Develop a proactive HSE culture by ensuring continuous reporting cycle via bi-monthly HSE meetings.
• Implement mandatory safety briefings.
Refer to pages 60-62
MATERIAL MATTERSAFFECTED STAKEHOLDERS MITIGATION STRATEGY
FOR MORE INFORMATION
11DELIVERING VALUE01
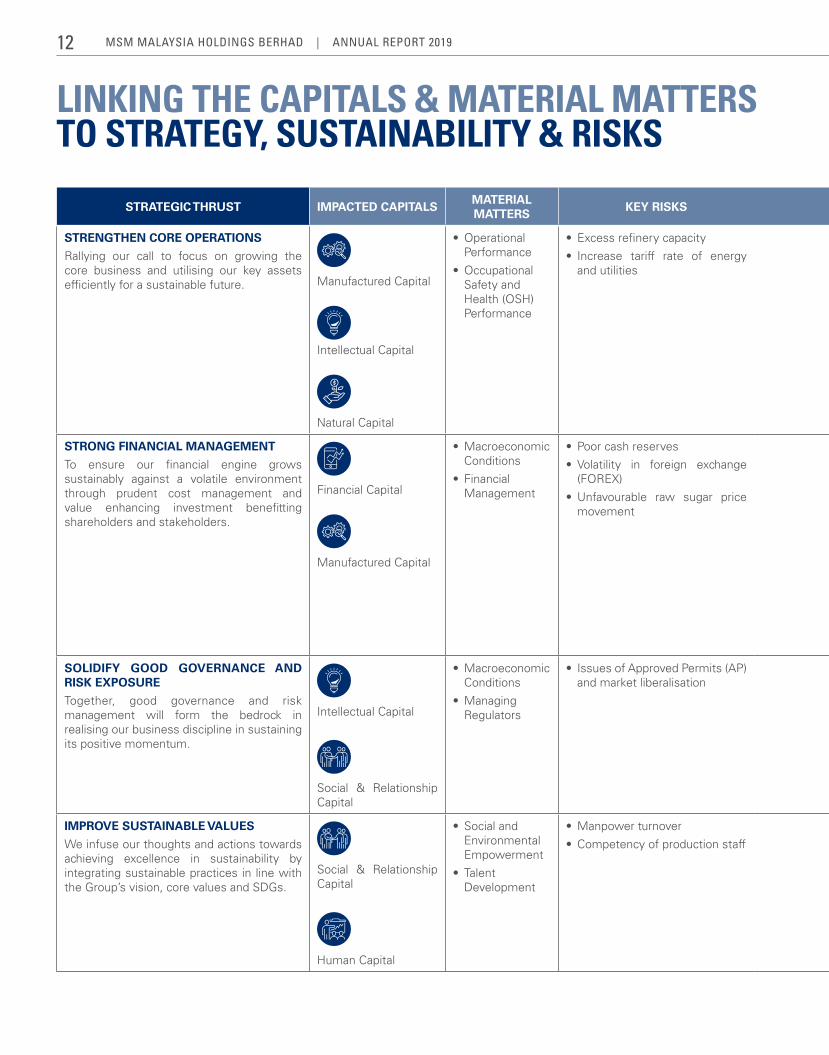
LINKING THE CAPITALS & MATERIAL MATTERS TO STRATEGY, SUSTAINABILITY & RISKS
STRATEGIC THRUST IMPACTED CAPITALSMATERIAL MATTERS
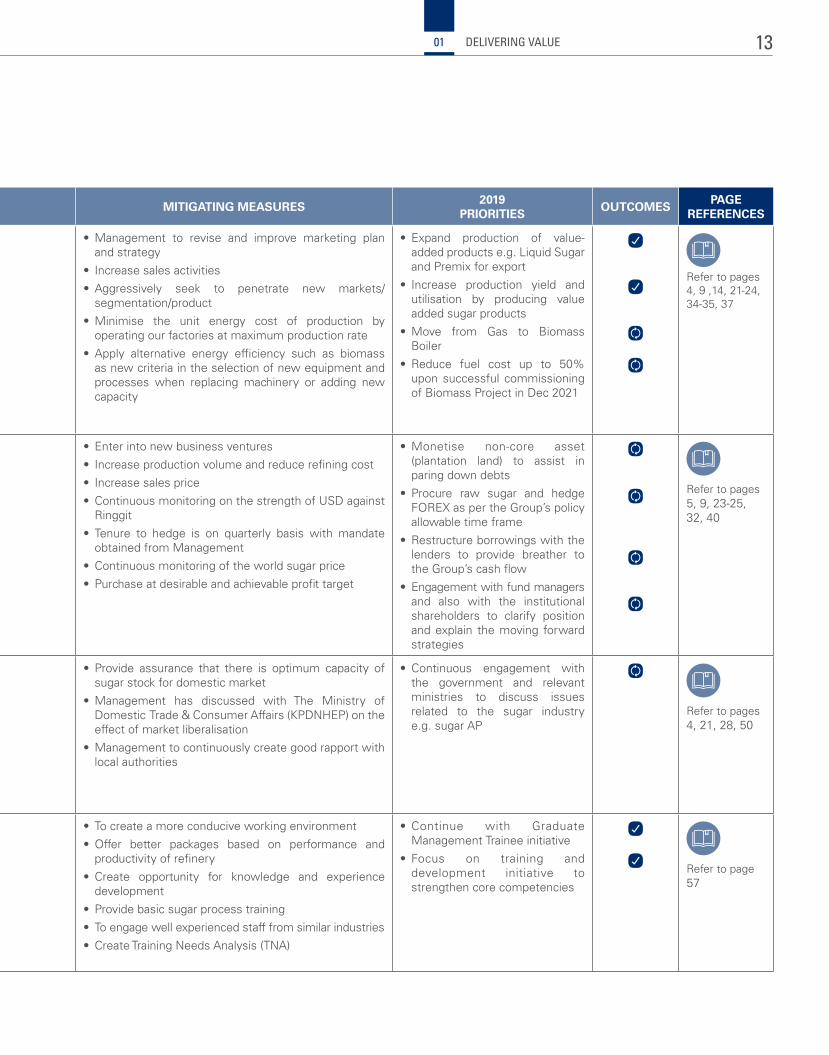
KEY RISKS MITIGATING MEASURES2019
PRIORITIESOUTCOMES
PAGE REFERENCES
STRENGTHEN CORE OPERATIONS
Rallying our call to focus on growing the core business and utilising our key assets efficiently for a sustainable future. Manufactured Capital
Intellectual Capital
Natural Capital
• Operational Performance
• Occupational Safety and Health (OSH) Performance
• Excess refinery capacity
• Increase tariff rate of energy and utilities
• Management to revise and improve marketing plan and strategy
• Increase sales activities
• Aggressively seek to penetrate new markets/ segmentation/product
• Minimise the unit energy cost of production by operating our factories at maximum production rate
• Apply alternative energy efficiency such as biomass as new criteria in the selection of new equipment and processes when replacing machinery or adding new capacity
• Expand production of value-added products e.g. Liquid Sugar and Premix for export
• Increase production yield and utilisation by producing value added sugar products
• Move from Gas to Biomass Boiler
• Reduce fuel cost up to 50% upon successful commissioning of Biomass Project in Dec 2021
Refer to pages 4, 9 ,14, 21-24, 34-35, 37
STRONG FINANCIAL MANAGEMENT
To ensure our financial engine grows sustainably against a volatile environment through prudent cost management and value enhancing investment benefitting shareholders and stakeholders.
Financial Capital
Manufactured Capital
• Macroeconomic Conditions
• Financial Management
• Poor cash reserves
• Volatility in foreign exchange (FOREX)
• Unfavourable raw sugar price movement
• Enter into new business ventures
• Increase production volume and reduce refining cost
• Increase sales price
• Continuous monitoring on the strength of USD against Ringgit
• Tenure to hedge is on quarterly basis with mandate obtained from Management
• Continuous monitoring of the world sugar price
• Purchase at desirable and achievable profit target
• Monetise non-core asset (plantation land) to assist in paring down debts
• Procure raw sugar and hedge FOREX as per the Group’s policy allowable time frame
• Restructure borrowings with the lenders to provide breather to the Group’s cash flow
• Engagement with fund managers and also with the institutional shareholders to clarify position and explain the moving forward strategies
Refer to pages 5, 9, 23-25, 32, 40
SOLIDIFY GOOD GOVERNANCE AND RISK ExPOSURE
Together, good governance and risk management will form the bedrock in realising our business discipline in sustaining its positive momentum.
Intellectual Capital
Social & Relationship Capital
• Macroeconomic Conditions
• Managing Regulators
• Issues of Approved Permits (AP) and market liberalisation
• Provide assurance that there is optimum capacity of sugar stock for domestic market
• Management has discussed with The Ministry of Domestic Trade & Consumer Affairs (KPDNHEP) on the effect of market liberalisation
• Management to continuously create good rapport with local authorities
• Continuous engagement with the government and relevant ministries to discuss issues related to the sugar industry e.g. sugar AP
Refer to pages 4, 21, 28, 50
IMPROVE SUSTAINABLE VALUES
We infuse our thoughts and actions towards achieving excellence in sustainability by integrating sustainable practices in line with the Group’s vision, core values and SDGs.
Social & Relationship Capital
Human Capital
• Social and Environmental Empowerment
• Talent Development
• Manpower turnover
• Competency of production staff
• To create a more conducive working environment
• Offer better packages based on performance and productivity of refinery
• Create opportunity for knowledge and experience development
• Provide basic sugar process training
• To engage well experienced staff from similar industries
• Create Training Needs Analysis (TNA)
• Continue with Graduate Management Trainee initiative
• Focus on training and development initiative to strengthen core competencies
Refer to page 57
MSM MalaySia HoldingS BerHad | annual report 201912
STRATEGIC THRUST IMPACTED CAPITALSMATERIAL MATTERS
KEY RISKS MITIGATING MEASURES2019
PRIORITIESOUTCOMES
PAGE REFERENCES
STRENGTHEN CORE OPERATIONS
Rallying our call to focus on growing the core business and utilising our key assets efficiently for a sustainable future. Manufactured Capital
Intellectual Capital
Natural Capital
• Operational Performance
• Occupational Safety and Health (OSH) Performance
• Excess refinery capacity
• Increase tariff rate of energy and utilities
• Management to revise and improve marketing plan and strategy
• Increase sales activities
• Aggressively seek to penetrate new markets/ segmentation/product
• Minimise the unit energy cost of production by operating our factories at maximum production rate
• Apply alternative energy efficiency such as biomass as new criteria in the selection of new equipment and processes when replacing machinery or adding new capacity
• Expand production of value-added products e.g. Liquid Sugar and Premix for export
• Increase production yield and utilisation by producing value added sugar products
• Move from Gas to Biomass Boiler
• Reduce fuel cost up to 50% upon successful commissioning of Biomass Project in Dec 2021
Refer to pages 4, 9 ,14, 21-24, 34-35, 37
STRONG FINANCIAL MANAGEMENT
To ensure our financial engine grows sustainably against a volatile environment through prudent cost management and value enhancing investment benefitting shareholders and stakeholders.
Financial Capital
Manufactured Capital
• Macroeconomic Conditions
• Financial Management
• Poor cash reserves
• Volatility in foreign exchange (FOREX)
• Unfavourable raw sugar price movement
• Enter into new business ventures
• Increase production volume and reduce refining cost
• Increase sales price
• Continuous monitoring on the strength of USD against Ringgit
• Tenure to hedge is on quarterly basis with mandate obtained from Management
• Continuous monitoring of the world sugar price
• Purchase at desirable and achievable profit target
• Monetise non-core asset (plantation land) to assist in paring down debts
• Procure raw sugar and hedge FOREX as per the Group’s policy allowable time frame
• Restructure borrowings with the lenders to provide breather to the Group’s cash flow
• Engagement with fund managers and also with the institutional shareholders to clarify position and explain the moving forward strategies
Refer to pages 5, 9, 23-25, 32, 40
SOLIDIFY GOOD GOVERNANCE AND RISK ExPOSURE
Together, good governance and risk management will form the bedrock in realising our business discipline in sustaining its positive momentum.
Intellectual Capital
Social & Relationship Capital
• Macroeconomic Conditions
• Managing Regulators
• Issues of Approved Permits (AP) and market liberalisation
• Provide assurance that there is optimum capacity of sugar stock for domestic market
• Management has discussed with The Ministry of Domestic Trade & Consumer Affairs (KPDNHEP) on the effect of market liberalisation
• Management to continuously create good rapport with local authorities
• Continuous engagement with the government and relevant ministries to discuss issues related to the sugar industry e.g. sugar AP
Refer to pages 4, 21, 28, 50
IMPROVE SUSTAINABLE VALUES
We infuse our thoughts and actions towards achieving excellence in sustainability by integrating sustainable practices in line with the Group’s vision, core values and SDGs.
Social & Relationship Capital
Human Capital
• Social and Environmental Empowerment
• Talent Development
• Manpower turnover
• Competency of production staff
• To create a more conducive working environment
• Offer better packages based on performance and productivity of refinery
• Create opportunity for knowledge and experience development
• Provide basic sugar process training
• To engage well experienced staff from similar industries
• Create Training Needs Analysis (TNA)
• Continue with Graduate Management Trainee initiative
• Focus on training and development initiative to strengthen core competencies
Refer to page 57
13DELIVERING VALUE01
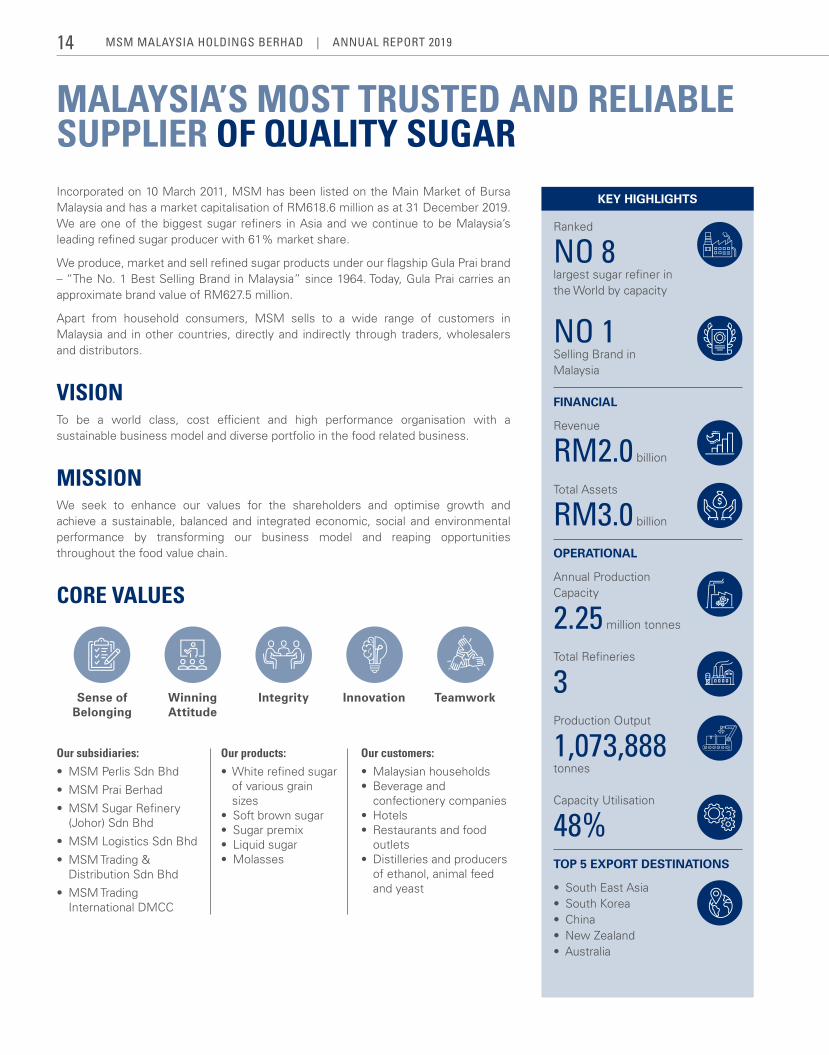
MALAYSIA’S MOST TRUSTED AND RELIABLE SUPPLIER OF QUALITY SUGAR
Ranked
NO 8 largest sugar refiner in the World by capacity
NO 1 Selling Brand in Malaysia
FINANCIAL
Revenue
RM2.0 billion
Total Assets
RM3.0 billion
OPERATIONAL
Annual Production Capacity
2.25 million tonnes
Total Refineries
3
Production Output
1,073,888 tonnes
Capacity Utilisation
48%TOP 5 ExPORT DESTINATIONS
• South East Asia • South Korea• China• New Zealand• Australia
Sense of Belonging
Winning Attitude
Integrity Innovation Teamwork
Our products:
• White refined sugar of various grain sizes
• Soft brown sugar• Sugar premix • Liquid sugar • Molasses
Our subsidiaries:
• MSM Perlis Sdn Bhd
• MSM Prai Berhad
• MSM Sugar Refinery (Johor) Sdn Bhd
• MSM Logistics Sdn Bhd
• MSM Trading & Distribution Sdn Bhd
• MSM Trading International DMCC
Our customers:
• Malaysian households• Beverage and
confectionery companies• Hotels• Restaurants and food
outlets• Distilleries and producers
of ethanol, animal feed and yeast
Incorporated on 10 March 2011, MSM has been listed on the Main Market of Bursa Malaysia and has a market capitalisation of RM618.6 million as at 31 December 2019. We are one of the biggest sugar refiners in Asia and we continue to be Malaysia’s leading refined sugar producer with 61% market share.
We produce, market and sell refined sugar products under our flagship Gula Prai brand – “The No. 1 Best Selling Brand in Malaysia” since 1964. Today, Gula Prai carries an approximate brand value of RM627.5 million.
Apart from household consumers, MSM sells to a wide range of customers in Malaysia and in other countries, directly and indirectly through traders, wholesalers and distributors.
VISIONTo be a world class, cost efficient and high performance organisation with a sustainable business model and diverse portfolio in the food related business.
MISSIONWe seek to enhance our values for the shareholders and optimise growth and achieve a sustainable, balanced and integrated economic, social and environmental performance by transforming our business model and reaping opportunities throughout the food value chain.
CORE VALUES
KEY HIGHLIGHTS
MSM MalaySia HoldingS BerHad | annual report 201914
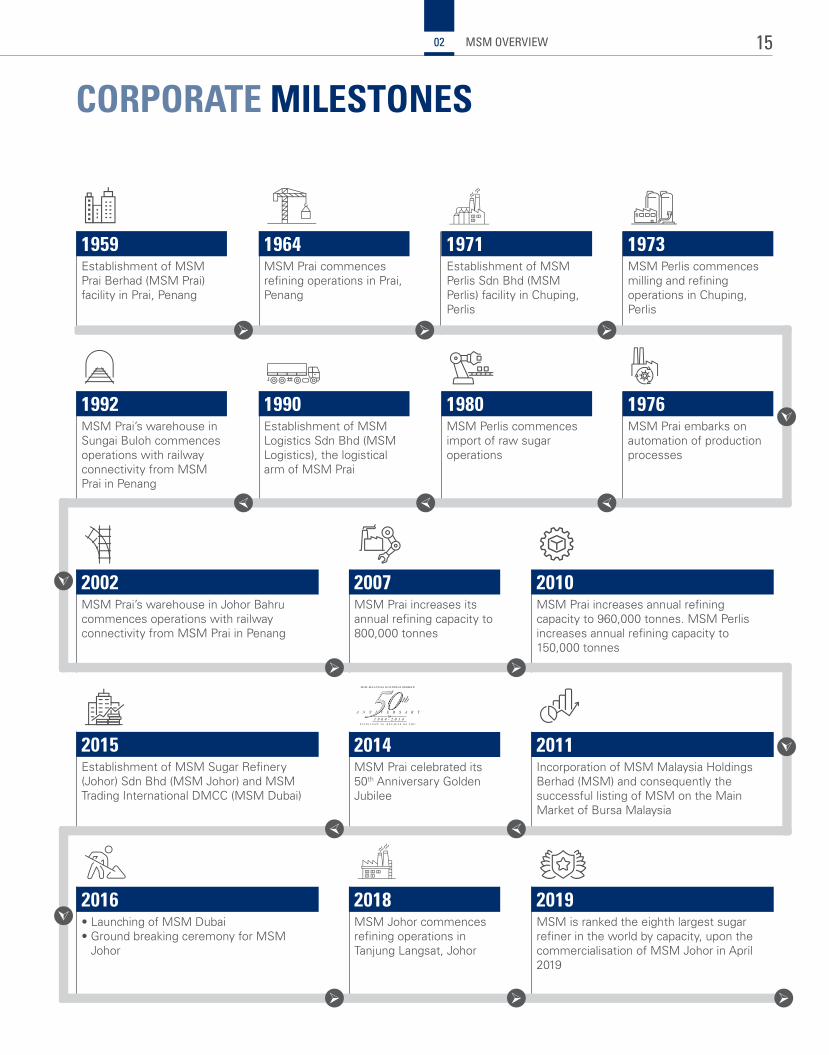
CORPORATE MILESTONES
1971Establishment of MSM Perlis Sdn Bhd (MSM Perlis) facility in Chuping, Perlis
1980MSM Perlis commences import of raw sugar operations
1990Establishment of MSM Logistics Sdn Bhd (MSM Logistics), the logistical arm of MSM Prai
1992MSM Prai’s warehouse in Sungai Buloh commences operations with railway connectivity from MSM Prai in Penang
2016• Launching of MSM Dubai• Ground breaking ceremony for MSM
Johor
2018MSM Johor commences refining operations in Tanjung Langsat, Johor
2019MSM is ranked the eighth largest sugar refiner in the world by capacity, upon the commercialisation of MSM Johor in April 2019
2002MSM Prai’s warehouse in Johor Bahru commences operations with railway connectivity from MSM Prai in Penang
2015Establishment of MSM Sugar Refinery (Johor) Sdn Bhd (MSM Johor) and MSM Trading International DMCC (MSM Dubai)
2010MSM Prai increases annual refining capacity to 960,000 tonnes. MSM Perlis increases annual refining capacity to 150,000 tonnes
2011Incorporation of MSM Malaysia Holdings Berhad (MSM) and consequently the successful listing of MSM on the Main Market of Bursa Malaysia
2007MSM Prai increases its annual refining capacity to 800,000 tonnes
2014MSM Prai celebrated its 50th Anniversary Golden Jubilee
1959Establishment of MSM Prai Berhad (MSM Prai) facility in Prai, Penang
1964MSM Prai commences refining operations in Prai, Penang
1973MSM Perlis commences milling and refining operations in Chuping, Perlis
1976MSM Prai embarks on automation of production processes
15MSM OVERVIEW02
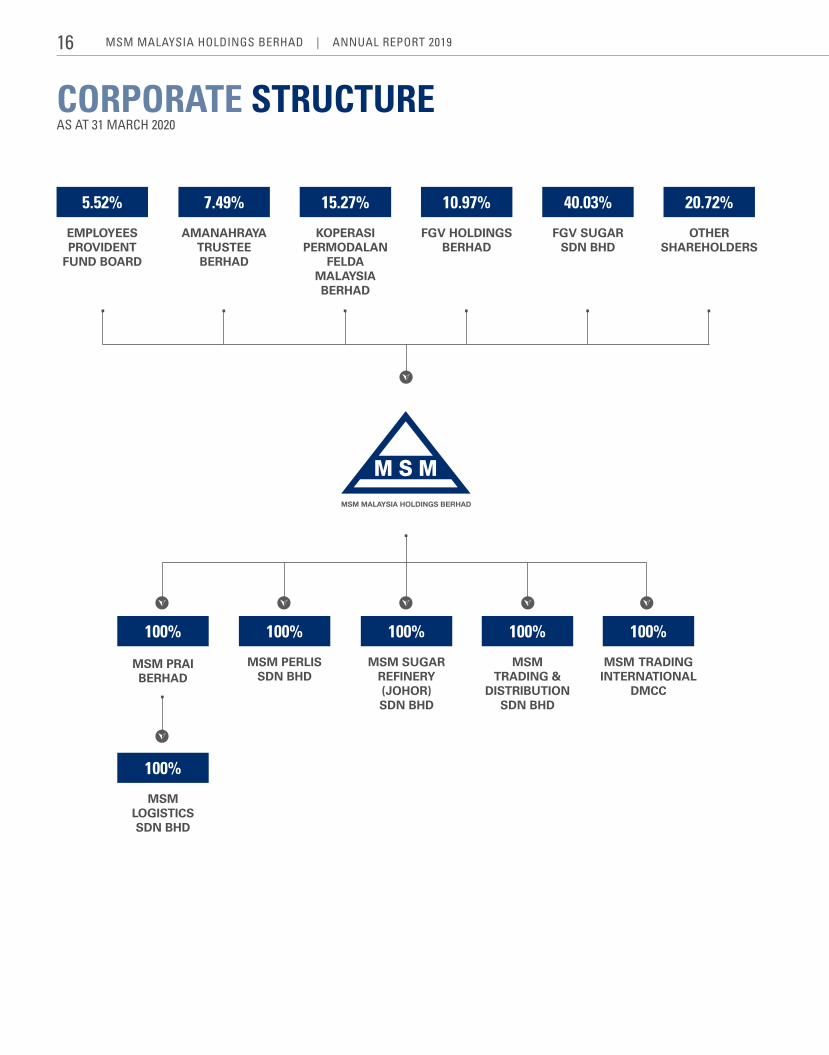
CORPORATE STRUCTUREAS AT 31 MARCH 2020
MSM PRAI BERHAD
MSM PERLIS SDN BHD
KOPERASI PERMODALAN
FELDA MALAYSIA BERHAD
EMPLOYEES PROVIDENT
FUND BOARD
FGV HOLDINGS BERHAD
AMANAHRAYA TRUSTEE BERHAD
OTHER SHAREHOLDERS
MSM SUGAR REFINERY (JOHOR) SDN BHD
MSM TRADING &
DISTRIBUTION SDN BHD
MSM TRADING INTERNATIONAL
DMCC
FGV SUGAR SDN BHD
MSM LOGISTICS SDN BHD
100% 100%
15.27%5.52% 10.97%7.49% 20.72%
100% 100% 100%
40.03%
100%
MSM MalaySia HoldingS BerHad | annual report 201916
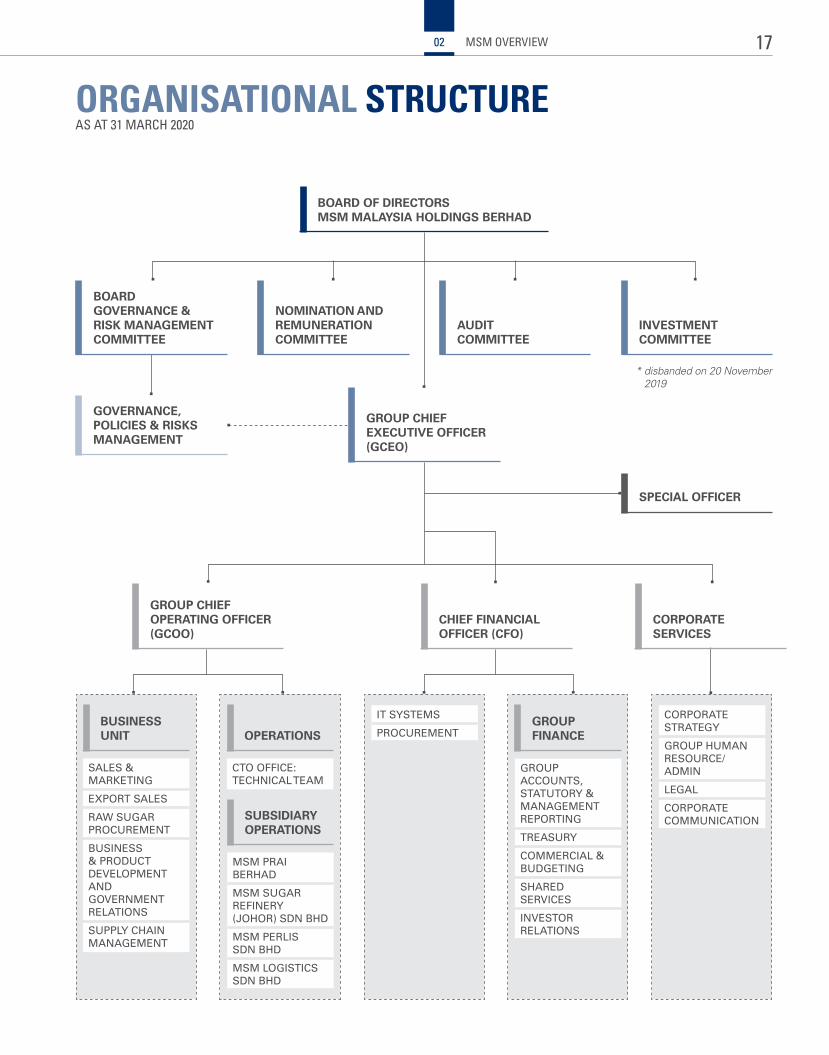
ORGANISATIONAL STRUCTUREAS AT 31 MARCH 2020
BOARD OF DIRECTORSMSM MALAYSIA HOLDINGS BERHAD
BOARD GOVERNANCE & RISK MANAGEMENT COMMITTEE
INVESTMENTCOMMITTEE
GOVERNANCE, POLICIES & RISKS MANAGEMENT
SPECIAL OFFICER
GROUP CHIEF OPERATING OFFICER (GCOO)
CHIEF FINANCIAL OFFICER (CFO)
CORPORATE SERVICES
NOMINATION ANDREMUNERATIONCOMMITTEE
GROUP CHIEF ExECUTIVE OFFICER (GCEO)
AUDITCOMMITTEE
BUSINESS UNIT
SUBSIDIARY OPERATIONS
GROUP FINANCEOPERATIONS
SALES & MARKETING
EXPORT SALES
RAw SUGAR PROCUREMENT
BUSINESS & PRODUCT DEVELOPMENT AND GOVERNMENT RELATIONS
SUPPLY CHAIN MANAGEMENT
MSM PRAI BERHAD
MSM SUGAR REFINERY (JOHOR) SDN BHD
MSM PERLIS SDN BHD
MSM LOGISTICS SDN BHD
GROUP ACCOUNTS, STATUTORY & MANAGEMENT REPORTING
TREASURY
COMMERCIAL & BUDGETING
SHARED SERVICES
INVESTOR RELATIONS
CORPORATE STRATEGY
GROUP HUMAN RESOURCE/ADMIN
LEGAL
CORPORATE COMMUNICATION
IT SYSTEMS
PROCUREMENT
CTO OFFICE: TECHNICAL TEAM
* disbanded on 20 November 2019
17MSM OVERVIEW02
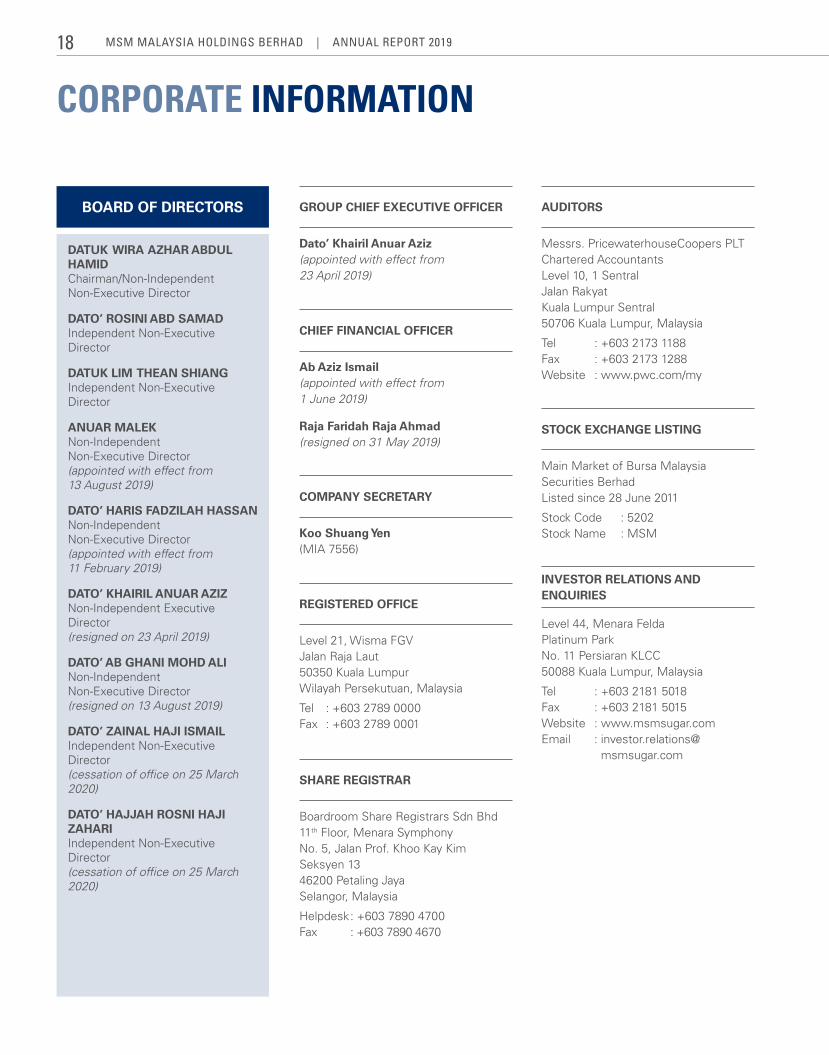
CORPORATE INFORMATION
DATUK WIRA AZHAR ABDUL HAMIDChairman/Non-IndependentNon-Executive Director
DATO’ ROSINI ABD SAMADIndependent Non-Executive Director
DATUK LIM THEAN SHIANGIndependent Non-Executive Director
ANUAR MALEKNon-Independent Non-Executive Director (appointed with effect from 13 August 2019)
DATO’ HARIS FADZILAH HASSANNon-Independent Non-Executive Director (appointed with effect from 11 February 2019)
DATO’ KHAIRIL ANUAR AZIZNon-Independent Executive Director (resigned on 23 April 2019)
DATO’ AB GHANI MOHD ALINon-Independent Non-Executive Director (resigned on 13 August 2019)
DATO’ ZAINAL HAJI ISMAILIndependent Non-Executive Director(cessation of office on 25 March2020)
DATO’ HAJJAH ROSNI HAJI ZAHARIIndependent Non-Executive Director (cessation of office on 25 March2020)
BOARD OF DIRECTORS GROUP CHIEF ExECUTIVE OFFICER
CHIEF FINANCIAL OFFICER
AUDITORS
STOCK ExCHANGE LISTING
INVESTOR RELATIONS AND ENqUIRIES
COMPANY SECRETARY
REGISTERED OFFICE
SHARE REGISTRAR
Dato’ Khairil Anuar Aziz(appointed with effect from 23 April 2019)
Ab Aziz Ismail(appointed with effect from 1 June 2019)
Raja Faridah Raja Ahmad(resigned on 31 May 2019)
Messrs. PricewaterhouseCoopers PLTChartered AccountantsLevel 10, 1 SentralJalan Rakyat Kuala Lumpur Sentral50706 Kuala Lumpur, Malaysia
Tel : +603 2173 1188Fax : +603 2173 1288Website : www.pwc.com/my
Main Market of Bursa Malaysia Securities BerhadListed since 28 June 2011
Stock Code : 5202Stock Name : MSM
Level 44, Menara FeldaPlatinum ParkNo. 11 Persiaran KLCC50088 Kuala Lumpur, Malaysia
Tel : +603 2181 5018Fax : +603 2181 5015Website : www.msmsugar.comEmail : investor.relations@
msmsugar.com
Koo Shuang Yen (MIA 7556)
Level 21, Wisma FGVJalan Raja Laut50350 Kuala Lumpur Wilayah Persekutuan, Malaysia
Tel : +603 2789 0000Fax : +603 2789 0001
Boardroom Share Registrars Sdn Bhd11th Floor, Menara SymphonyNo. 5, Jalan Prof. Khoo Kay Kim Seksyen 1346200 Petaling JayaSelangor, Malaysia
Helpdesk : +603 7890 4700Fax : +603 7890 4670
MSM MalaySia HoldingS BerHad | annual report 201918
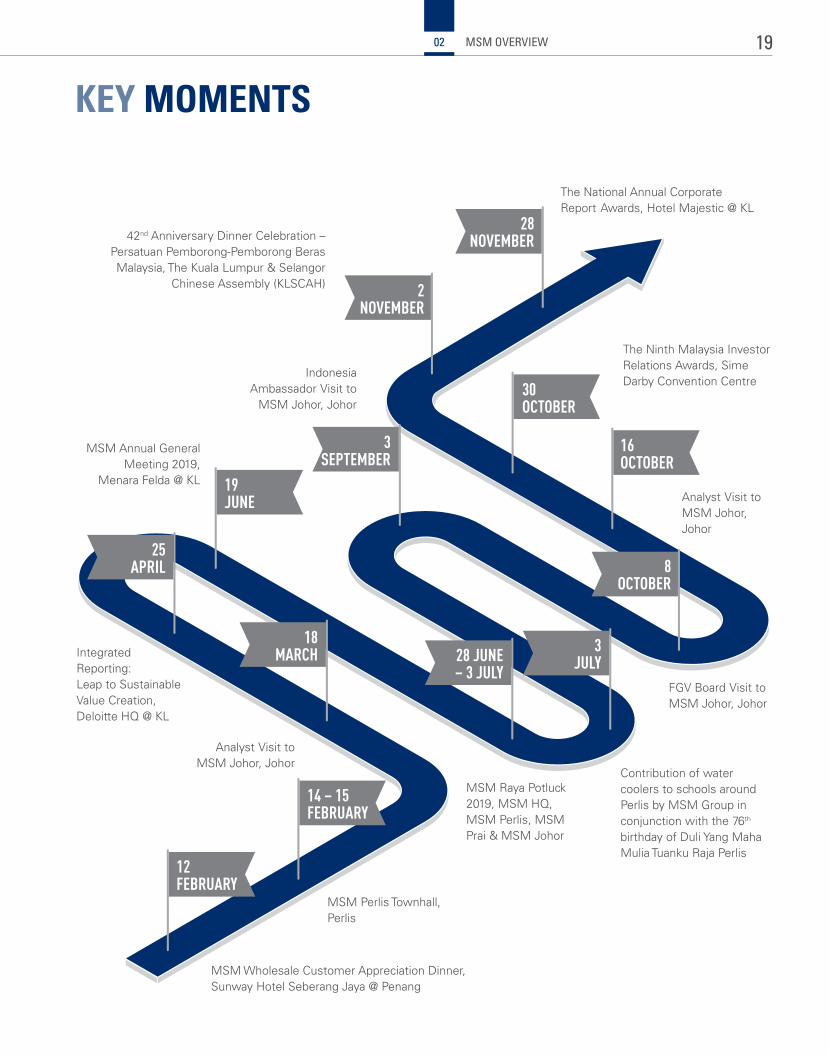
KEY MOMENTS
Integrated Reporting: Leap to Sustainable Value Creation, Deloitte HQ @ KL
MSM Annual General Meeting 2019,
Menara Felda @ KL
Contribution of water coolers to schools around Perlis by MSM Group in conjunction with the 76th birthday of Duli Yang Maha Mulia Tuanku Raja Perlis
42nd Anniversary Dinner Celebration –Persatuan Pemborong-Pemborong Beras Malaysia, The Kuala Lumpur & Selangor
Chinese Assembly (KLSCAH)
The National Annual Corporate Report Awards, Hotel Majestic @ KL
MSM Raya Potluck 2019, MSM HQ, MSM Perlis, MSM Prai & MSM Johor
12 FEBRUARY
14 – 15 FEBRUARY
19 JUNE
8 OCTOBER
16 OCTOBER
25 APRIL
18 MARCH 28 JUNE
– 3 JULY
3 SEPTEMBER
3 JULY
2 NOVEMBER
30 OCTOBER
28 NOVEMBER
MSM Wholesale Customer Appreciation Dinner, Sunway Hotel Seberang Jaya @ Penang
MSM Perlis Townhall, Perlis
Indonesia Ambassador Visit to
MSM Johor, Johor
FGV Board Visit to MSM Johor, Johor
Analyst Visit to MSM Johor, Johor
The Ninth Malaysia Investor Relations Awards, Sime Darby Convention Centre
Analyst Visit to MSM Johor, Johor
19MSM OVERVIEW02
AWARDS & CERTIFICATIONS
1. HALAL Jabatan Kemajuan Islam Malaysia (JAKIM) • To be recognised as Halal brand and to meet
customer requirement • To identify non-halal hazards and provide a
measure to control them
2. KOSHER Kushrut London Beth Din (KLBD) • To be recognised as Kosher brand • To meet the requirement of Kosher recognised
customers
3. ISO 9001 (qUALITY MANAGEMENT SYSTEM) • To ensure the quality of the management system
within the company and to meet customer requirement
• To cultivate continuous improvement within the organisation
4. HACCP (HAZARD ANALYSIS AND CRITICAL CONTROL POINT)
• To demonstrate company’s commitment to ensure the safety and quality of the product
5. ISO 22000 (FOOD SAFETY MANAGEMENT SYSTEM)
• To enhance food safety management system and product quality
• To meet customer requirement
6. FSSC 22000 (FOOD SAFETY SYSTEM CERTIFICATION)
• To meet growing customer requirements from GFSI recognised supplier and to ensure that the food safety hazards are able to be identified
7. PRODUCT CERTIFICATION SCHEME SIRIM • To demonstrate that the products are produced
in compliance with national and international standards, eliminating the need of further testing by purchaser or consumer
• To provide an independent assurance that products are manufactured under an effective system of testing, supervision and control which should result in improved production efficiency and reduced wastage and rejects
8. OCCUPATIONAL HEALTH & SAFETY ADVISORY SERVICES (OHSAS 18001)
OCCUPATIONAL HEALTH & SAFETY MANAGEMENT SYSTEM (MS 1722)
• To demonstrate company’s commitment to ensure the safety and quality of the workplace
9. GMP (GOOD MANUFACTURING PRACTICE) • To establish a system for ensuring that the
products are consistently produced according to a quality standard
10. MAKANAN SELAMAT TANGGUNGJAWAB INDUSTRI, MeSTI
Ministry of Health (MOH) • Complimentary certificate (fast track) after getting
HACCP
1. NATIONAL OCCUPATIONAL SAFETY & HEALTH ExCELLENCE AWARDS 2019 – DOSH
• Benchmark in Safety & Health
2. FGV AWARDS NIGHT 2019 Path Finder Awards (Sugar Sector):
• MSM Prai Berhad - Boiler Efficiency Improvement
• MSMPrai Berhad - Optimising Co-Generator Operation
• MSM Prai Berhad (Warehouse Sg Buloh) - Utilisation of ASRS
• MSMPerlisSdnBhd - 1 kg CGS Rebundling • MSM Sugar Refinery (Johor) Sdn Bhd -
Liquid Sugar Production
3. PRESIDENT’S FGV AWARD FOR SAFETY 2018/2019 – MSM PERLIS
i. Best Safety Project – 3rd Place ii. Best Safety & Health Committee – 4th Place
MSM MalaySia HoldingS BerHad | annual report 201920
GROUP CHIEF EXECUTIVE OFFICER REVIEW
In 2019, the combination of an extended glut in global sugar supply, the weakening ringgit, locked-in high raw sugar contracts and unexpected domestic policy shifts resulting in new competition, caught MSM Malaysia Holdings Berhad (MSM or the Group) off balance leading to weaker exports, production and margins for the year. A net loss of RM299.77 million was posted for the year ended 31 December 2019, from a net profit of RM35.66 million the previous year. However, the tide has turned. Having stabilised cash flow and rationalised Group-wide capacity through consolidation of production in MSM Johor, we are currently turning setbacks into strongpoints for MSM to kick-start a turnaround journey.
In the first half of the year MSM Refinery (Johor) Sdn Bhd (MSM Johor) kicked off to a smooth start despite the timing which was not providential. Our expanded production capacity created additional stress as sales orders reduced due to excess sugar supply from Thailand and India, and escalating competition domestically with the continued issuance of approved permits (AP) to import sugar. It also squeezed margins further, as MSM incurred 15% higher production cost due to lower capacity utilisation, start of depreciation, as well as the increase in gas tariffs in January and July 2019.
On the sales front, total revenue of RM2 billion for the year fell 9% year-on-year, in tandem with lower average selling price (ASP) and the decline in export volumes throughout the year. The negative margins arising from lower white sugar premium reduced export volume by 24%, however, the intense price competition did not affect our sales volume for wholesale and industry segments as we recorded 3% and 6% increase respectively and we managed to defend our market share of 61% domestically.
Against this backdrop, we decided to focus our efforts on ‘Attaining Balance’ which relates to the Group’s various strategic initiatives to achieve balanced cash flow management and production levels.
In a bid to retain operational excellence and market leadership, MSM managed to close the year with production output of 1.07 million tonnes, an increase of 11%, compared to output in 2018 of 964,739 tonnes.
IDENTIFYING STRENGTHS IN ADVERSITY
Though performance was impacted by extraneous factors, a few milestones were achieved during the year. With the commercialisation of MSM Johor in April 2019, MSM is now ranked the eighth largest sugar refiner in the world by capacity. The challenge of optimising this expanded capacity presented new opportunities for expansion into new markets. The team responded quickly, researching and developing value added products such as Premix and Liquid Sugar. It was a feather in our cap when these products were made available by MSM Johor within the second half of 2019.
We also further streamlined our business focus with the announced disposal of the Group’s Chuping plantation land parcels during the year, to F&N for RM156 million.
ATTAINING BALANCE ON THREE FRONTS:
OPERATIONS
With the full year operational availability of MSM Johor in 2019, there was a need to optimise utilisation and manage costs better.
CASH FLOW
We embarked on a cash flow driven approach in 2019 to be able to fulfil our borrowing obligations post commercialisation of MSM Johor in April 2019.
PRODUCTION
As MSM has excess capacity for domestic demand from three operating refineries (MSM Johor, MSM Prai, MSM Perlis), production between the refineries had to be agilely balanced, and at the same time we had to secure quality sales from the production.
21MANAGEMENT DISCUSSION & ANALYSIS03
GROUP CHIEF EXECUTIVE OFFICER REVIEW
However, on 9 April 2020, we have exercised our rights to rescind the sale and purchase agreement entered on 8 October 2019 since F&N has not fulfilled the first Condition Precedent by the expiry of the Conditional Period as well as the Extended Conditional Period.
With this new development, we will continuously lookout for new strategic plan to monetise this asset.
Another important plus was the expiry of the previous raw sugar contract in December 2019. This will benefit MSM in terms of strategic raw sugar procurement and potentially reduce our cash outflows and ensure the sustainable supply of best quality raw sugar stocks for all MSM’s refineries.
TRANSFORMING CHALLENGES INTO OPPORTUNITIES
The COVID-19 outbreak has triggered extreme reactions in the financial markets as it grapples with a cascading effect from business disruptions. Globally, restrictive movements and lockdown measures, factory shutdowns and the collapse of oil prices have been affecting supply chains. Coupled with the risks of escalated trade disputes, the upcoming US presidential elections and the lingering effects of tepid growth in 2019, a scenario of global recession looks very likely. According to Bank Negara Malaysia (BNM), GDP growth is expected to plummet, hovering between 2% and 0.5%, a drastic reduction from pre-Covid 19 forecasts.
The overall impact of the outbreak on the Malaysian economy is unprecedented and it is challenging to predict the economic and financial eventualities with a high degree of precision. Currently, at MSM, operations are as usual as sugar is classified as an essential item. Our supply chains are still intact and export possibilities have remained unaffected with no hiccups at ports for export. We are facing an overall slow demand on the domestic front with 10% to 15% reduction; however this is mitigated by increased export enquiries. As we move onwards, management is continuously monitoring
the situation and our strategies going ahead have considered mitigation actions to cushion the impact from likely expansion of the national Movement Control Order.
In times of adversity, the resilient will seek new opportunities, and that’s exactly what we did. Since committed service to the domestic market no longer serves the Group’s best interest, MSM is now working on sustainable growth strategies that include rationalising our production capacity, downstream product diversification, research and development on food and non-food sugar-related products, initiating cost saving energy projects, and strengthening selling prices for better margins.
Strategic transformation kicked off in the second half of 2019 with MSM Johor’s product diversification into Liquid Sugar and Premix for the export market. We have also developed a range of flavoured syrups that will be ready for launch soon. Following closely will be our exploration into the development of healthy sugar variants which are targeted for launch by the second quarter (Q2) of 2020. As a result of emerging trends among customers seeking healthier lifestyle choices, we see a growing market for lower calorie sugar variants domestically and are looking forward to achieving new milestones in the sugar industry with this venture.
The current focus on diversification also encompasses potential greenfield investments or mergers and acquisitions (M&A) into food-based businesses to diversify the Group’s income stream and increase utilisation of MSM Johor. This diversification into adjacent segments in the food sector will be the main focus for MSM in 2020.
Cost savings initiatives and improved efficiencies have also been prioritised. To reduce refining cost, a Biomass initiative in MSM Johor is set to be the key enabler in lowering fuel costs. It was approved by the Board in the fourth quarter (Q4) of 2019 and the installation of Phase 1 of the Biomass boiler is targeted to be completed in mid-2021 and Phase 2 by end-2021.
ANCHORING STRENGTHS
• 50 years of experience in sugar refining
• 8th largest stand-alone refiner in the world by capacity
• Dominant market share in Malaysia – 61%
• Strong brand position – “Gula Prai”
• Technical and Business know-how in producing high grade refined sugar – ICUMSA 45
• Port-fronting refineries (MSM Prai at Penang Port and MSM Johor at Tanjung Langsat Port)
REDEFINING OPPORTUNITIES
• Diversification into Non-Refined Sugar related business e.g. Confectionary, Condensed Milk, Flavoured Syrup
• Consolidate production in MSM Johor to increase utilisation
• Strategic Partnership – Equity participation and worldwide market expansion from MSM Johor
• Biomass Boiler initiative to lower production cost
• Value chain expansion via M&A or JV
• New Product Development e.g. Liquid Sugar, Premix, Food (Sucralose, Stevia)
• New Business Model e.g. Remove first layer Wholesalers from supply chain, OEM for Wholesale customers and cross border sales
• Operational Excellence – optimise cost, efficiency and productivity
• Disposal of non-core assets (Land Sales)
MSM MalaySia HoldingS BerHad | annual report 201922
Operationally, in supply and distribution, a new Wholesale Business Model is in the pipeline to create better supply chain efficiencies and maximise MSM’s domestic sales margin. MSM aims to deliver more sugar directly to customers once it has a better grasp in the domestic sugar supply chain. In addition, plans are in place to optimise logistic cost for effective sugar handling via outsourced trucks based on refinery location (MSM Johor, MSM Prai – Sg Buloh). The addition of barge vessels into the logistics line-up is also being explored to leverage on the prime locations of our port-fronting refineries and to reduce dependence on commercial rail systems.
Finally, but just as importantly, we intend to continue to improve raw sugar procurement using the “Just-In-Time” mechanism to enhance the Group’s cash flow and reduce storage costs.
By undertaking these strategic initiatives, we expect to return to profit in 2020 and anticipate that the positive momentum from 2020 will translate into a sustainable and improved bottom line especially when the long-term initiatives, such as the Biomass Boiler and food diversification initiatives, churn the desired results.
ACCELERATING FORWARD
The grey clouds looming over the sugar industry in 2019 seemed to have shifted in early 2020. However, at the time of writing, the world is facing new crises, including the corona virus pandemic, global level trade and market disruptions, and plummeting oil prices. If the spread of the virus is contained sooner rather than later, in 2020, we should be back on track and ready to face the world.
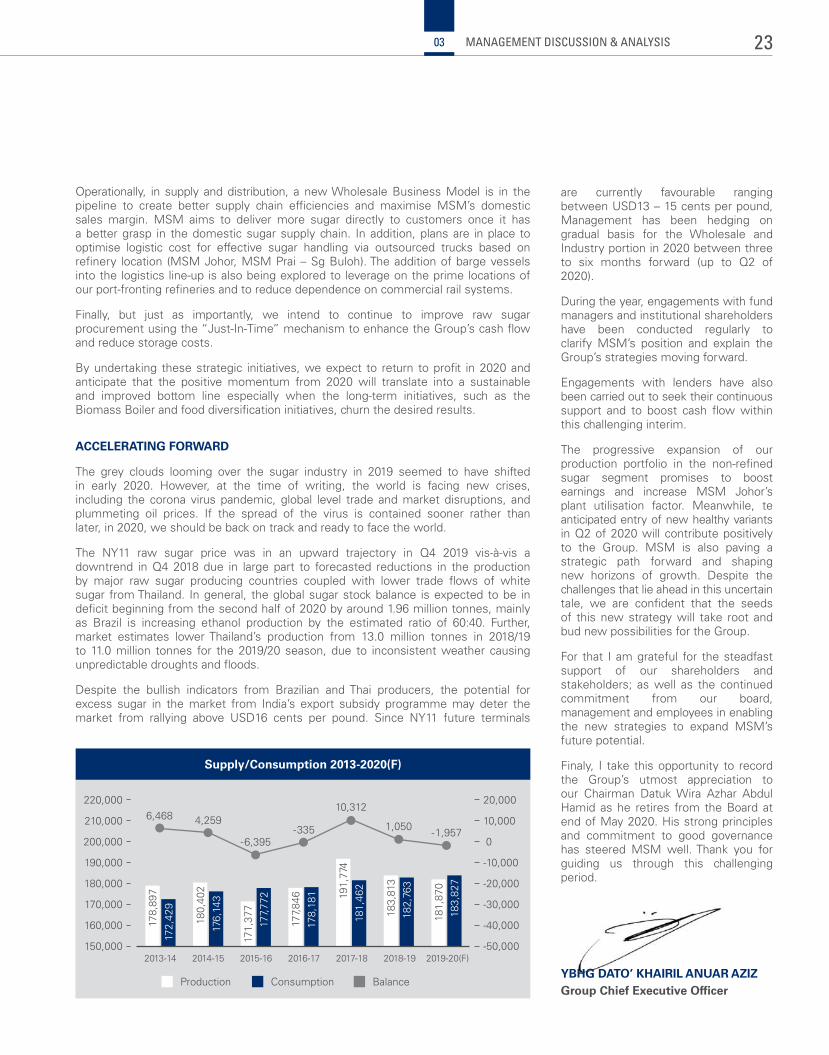
The NY11 raw sugar price was in an upward trajectory in Q4 2019 vis-à-vis a downtrend in Q4 2018 due in large part to forecasted reductions in the production by major raw sugar producing countries coupled with lower trade flows of white sugar from Thailand. In general, the global sugar stock balance is expected to be in deficit beginning from the second half of 2020 by around 1.96 million tonnes, mainly as Brazil is increasing ethanol production by the estimated ratio of 60:40. Further, market estimates lower Thailand’s production from 13.0 million tonnes in 2018/19 to 11.0 million tonnes for the 2019/20 season, due to inconsistent weather causing unpredictable droughts and floods.
Despite the bullish indicators from Brazilian and Thai producers, the potential for excess sugar in the market from India’s export subsidy programme may deter the market from rallying above USD16 cents per pound. Since NY11 future terminals
are currently favourable ranging between USD13 – 15 cents per pound, Management has been hedging on gradual basis for the Wholesale and Industry portion in 2020 between three to six months forward (up to Q2 of 2020).
During the year, engagements with fund managers and institutional shareholders have been conducted regularly to clarify MSM’s position and explain the Group’s strategies moving forward.
Engagements with lenders have also been carried out to seek their continuous support and to boost cash flow within this challenging interim.
The progressive expansion of our production portfolio in the non-refined sugar segment promises to boost earnings and increase MSM Johor’s plant utilisation factor. Meanwhile, te anticipated entry of new healthy variants in Q2 of 2020 will contribute positively to the Group. MSM is also paving a strategic path forward and shaping new horizons of growth. Despite the challenges that lie ahead in this uncertain tale, we are confident that the seeds of this new strategy will take root and bud new possibilities for the Group.
For that I am grateful for the steadfast support of our shareholders and stakeholders; as well as the continued commitment from our board, management and employees in enabling the new strategies to expand MSM’s future potential.
Finaly, I take this opportunity to record the Group’s utmost appreciation to our Chairman Datuk Wira Azhar Abdul Hamid as he retires from the Board at end of May 2020. His strong principles and commitment to good governance has steered MSM well. Thank you for guiding us through this challenging period.
YBHG DATO’ KHAIRIL ANUAR AZIZGroup Chief Executive Officer
Supply/Consumption 2013-2020(F)
Production BalanceConsumption
150,000
160,000
170,000
180,000
190,000
200,000
210,000
220,000
-50,000
-40,000
-30,000
-20,000
-10,000
0
10,000
20,000
2013-14 2014-15 2015-16 2016-17 2017-18 2018-19 2019-20(F)
178,
897
6,468 4,25910,312
1,050-6,395
-335 -1,957
180,
402
171,
377
177,
846 19
1,77
4
183,
813
181,
870
172,
429
176,
143
177,
772
178,
181
181,
462
182,
763
183,
827
23MANAGEMENT DISCUSSION & ANALYSIS03
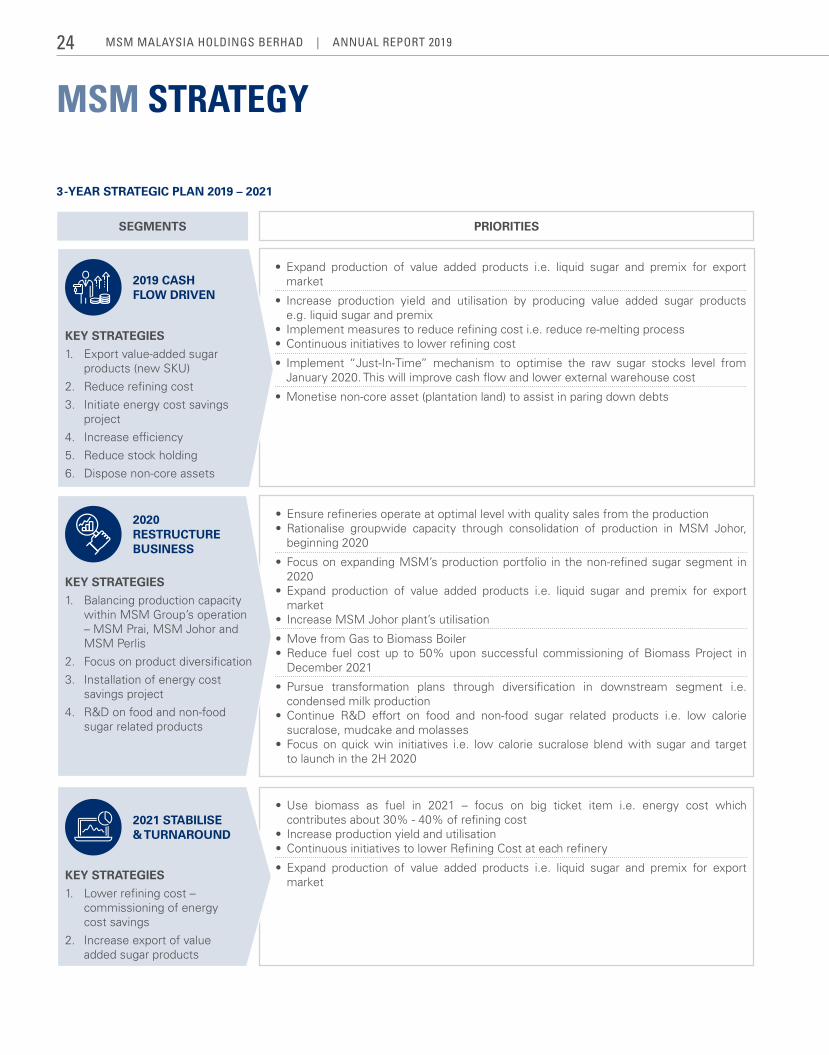
• Use biomass as fuel in 2021 – focus on big ticket item i.e. energy cost which contributes about 30% - 40% of refining cost
• Increase production yield and utilisation• Continuous initiatives to lower Refining Cost at each refinery
• Expand production of value added products i.e. liquid sugar and premix for export market
• Expand production of value added products i.e. liquid sugar and premix for export market
• Increase production yield and utilisation by producing value added sugar products e.g. liquid sugar and premix
• Implement measures to reduce refining cost i.e. reduce re-melting process• Continuous initiatives to lower refining cost
• Implement “Just-In-Time” mechanism to optimise the raw sugar stocks level from January 2020. This will improve cash flow and lower external warehouse cost
• Monetise non-core asset (plantation land) to assist in paring down debts
MSM STRATEGY
3-YEAR STRATEGIC PLAN 2019 – 2021
SEGMENTS PRIORITIES
• Ensure refineries operate at optimal level with quality sales from the production• Rationalise groupwide capacity through consolidation of production in MSM Johor,
beginning 2020
• Focus on expanding MSM’s production portfolio in the non-refined sugar segment in 2020
• Expand production of value added products i.e. liquid sugar and premix for export market
• Increase MSM Johor plant’s utilisation
• Move from Gas to Biomass Boiler• Reduce fuel cost up to 50% upon successful commissioning of Biomass Project in
December 2021
• Pursue transformation plans through diversification in downstream segment i.e. condensed milk production
• Continue R&D effort on food and non-food sugar related products i.e. low calorie sucralose, mudcake and molasses
• Focus on quick win initiatives i.e. low calorie sucralose blend with sugar and target to launch in the 2H 2020
KEY STRATEGIES
1. Export value-added sugar products (new SKU)
2. Reduce refining cost
3. Initiate energy cost savings project
4. Increase efficiency
5. Reduce stock holding
6. Dispose non-core assets
KEY STRATEGIES
1. Lower refining cost – commissioning of energy cost savings
2. Increase export of value added sugar products
2019 CASH FLOW DRIVEN
2021 STABILISE & TURNAROUND
KEY STRATEGIES
1. Balancing production capacity within MSM Group’s operation – MSM Prai, MSM Johor and MSM Perlis
2. Focus on product diversification
3. Installation of energy cost savings project
4. R&D on food and non-food sugar related products
2020 RESTRUCTURE BUSINESS
MSM MalaySia HoldingS BerHad | annual report 201924
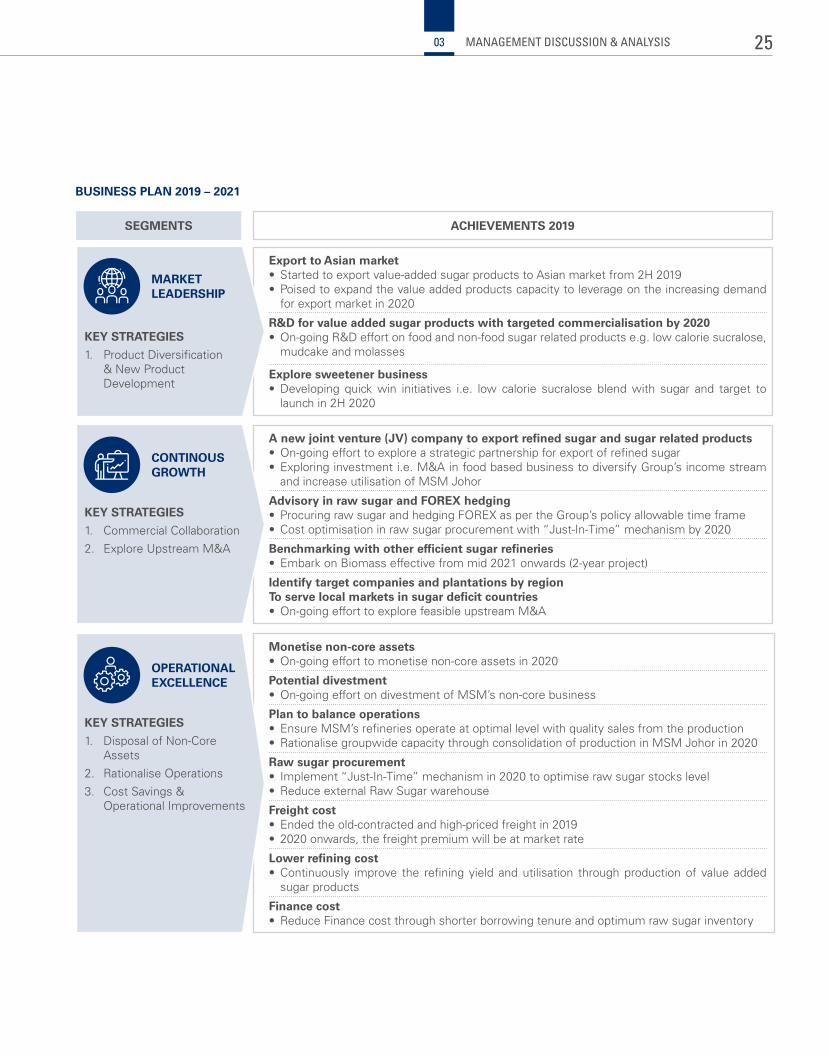
BUSINESS PLAN 2019 – 2021
ACHIEVEMENTS 2019SEGMENTS
Export to Asian market• Started to export value-added sugar products to Asian market from 2H 2019• Poised to expand the value added products capacity to leverage on the increasing demand
for export market in 2020
R&D for value added sugar products with targeted commercialisation by 2020• On-going R&D effort on food and non-food sugar related products e.g. low calorie sucralose,
mudcake and molasses
Explore sweetener business• Developing quick win initiatives i.e. low calorie sucralose blend with sugar and target to
launch in 2H 2020
A new joint venture (JV) company to export refined sugar and sugar related products• On-going effort to explore a strategic partnership for export of refined sugar• Exploring investment i.e. M&A in food based business to diversify Group’s income stream
and increase utilisation of MSM Johor
Advisory in raw sugar and FOREx hedging• Procuring raw sugar and hedging FOREX as per the Group’s policy allowable time frame• Cost optimisation in raw sugar procurement with “Just-In-Time” mechanism by 2020
Benchmarking with other efficient sugar refineries• Embark on Biomass effective from mid 2021 onwards (2-year project)
Identify target companies and plantations by regionTo serve local markets in sugar deficit countries• On-going effort to explore feasible upstream M&A
Monetise non-core assets• On-going effort to monetise non-core assets in 2020
Potential divestment• On-going effort on divestment of MSM’s non-core business
Plan to balance operations• Ensure MSM’s refineries operate at optimal level with quality sales from the production• Rationalise groupwide capacity through consolidation of production in MSM Johor in 2020
Raw sugar procurement• Implement “Just-In-Time” mechanism in 2020 to optimise raw sugar stocks level• Reduce external Raw Sugar warehouse
Freight cost• Ended the old-contracted and high-priced freight in 2019• 2020 onwards, the freight premium will be at market rate
Lower refining cost• Continuously improve the refining yield and utilisation through production of value added
sugar products
Finance cost• Reduce Finance cost through shorter borrowing tenure and optimum raw sugar inventory
MARKET LEADERSHIP
KEY STRATEGIES
1. Product Diversification & New Product Development
CONTINOUS GROWTH
KEY STRATEGIES
1. Commercial Collaboration
2. Explore Upstream M&A
OPERATIONAL ExCELLENCE
KEY STRATEGIES
1. Disposal of Non-Core Assets
2. Rationalise Operations
3. Cost Savings & Operational Improvements
25MANAGEMENT DISCUSSION & ANALYSIS03
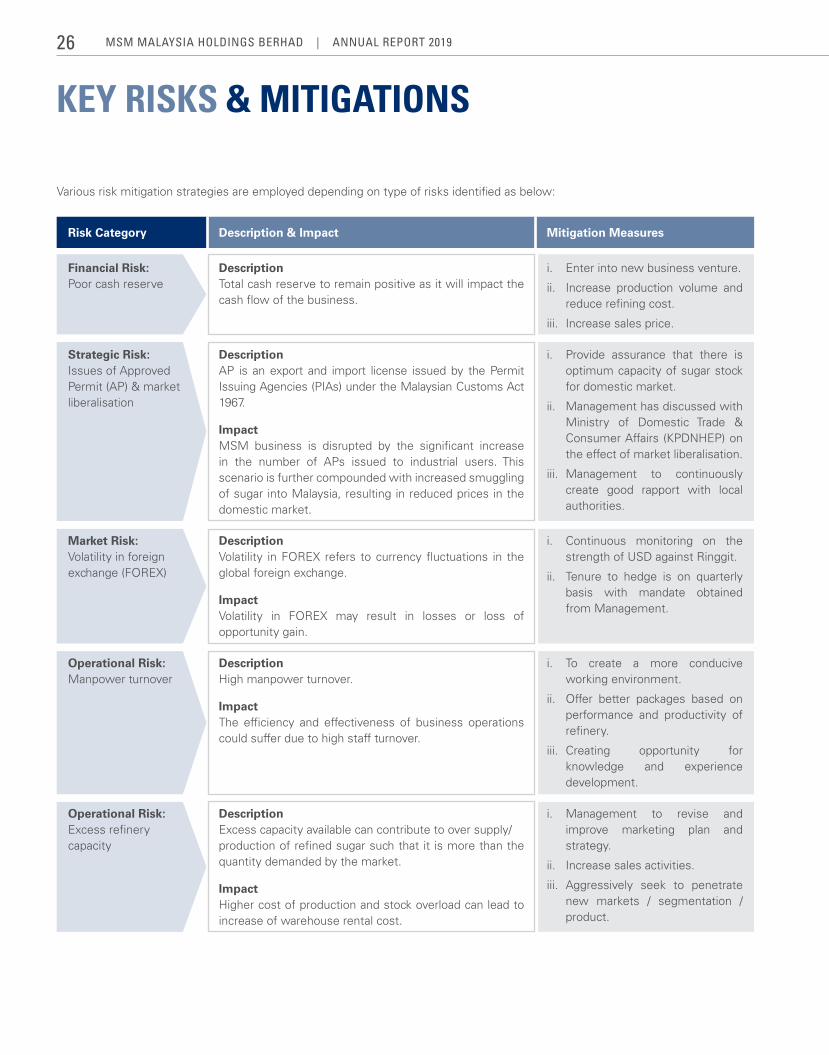
Risk Category Description & Impact Mitigation Measures
Financial Risk:Poor cash reserve
DescriptionTotal cash reserve to remain positive as it will impact the cash flow of the business.
i. Enter into new business venture.
ii. Increase production volume and reduce refining cost.
iii. Increase sales price.
Strategic Risk:Issues of Approved Permit (AP) & market liberalisation
DescriptionAP is an export and import license issued by the Permit Issuing Agencies (PIAs) under the Malaysian Customs Act 1967.
ImpactMSM business is disrupted by the significant increase in the number of APs issued to industrial users. This scenario is further compounded with increased smuggling of sugar into Malaysia, resulting in reduced prices in the domestic market.
i. Provide assurance that there is optimum capacity of sugar stock for domestic market.
ii. Management has discussed with Ministry of Domestic Trade & Consumer Affairs (KPDNHEP) on the effect of market liberalisation.
iii. Management to continuously create good rapport with local authorities.
Market Risk:Volatility in foreign exchange (FOREX)
DescriptionVolatility in FOREX refers to currency fluctuations in the global foreign exchange.
ImpactVolatility in FOREX may result in losses or loss of opportunity gain.
i. Continuous monitoring on the strength of USD against Ringgit.
ii. Tenure to hedge is on quarterly basis with mandate obtained from Management.
Operational Risk:Manpower turnover
Description High manpower turnover.
ImpactThe efficiency and effectiveness of business operations could suffer due to high staff turnover.
i. To create a more conducive working environment.
ii. Offer better packages based on performance and productivity of refinery.
iii. Creating opportunity for knowledge and experience development.
Operational Risk:Excess refinery capacity
DescriptionExcess capacity available can contribute to over supply/production of refined sugar such that it is more than the quantity demanded by the market.
ImpactHigher cost of production and stock overload can lead to increase of warehouse rental cost.
i. Management to revise and improve marketing plan and strategy.
ii. Increase sales activities.
iii. Aggressively seek to penetrate new markets / segmentation /product.
KEY RISKS & MITIGATIONS
Various risk mitigation strategies are employed depending on type of risks identified as below:
MSM MalaySia HoldingS BerHad | annual report 201926
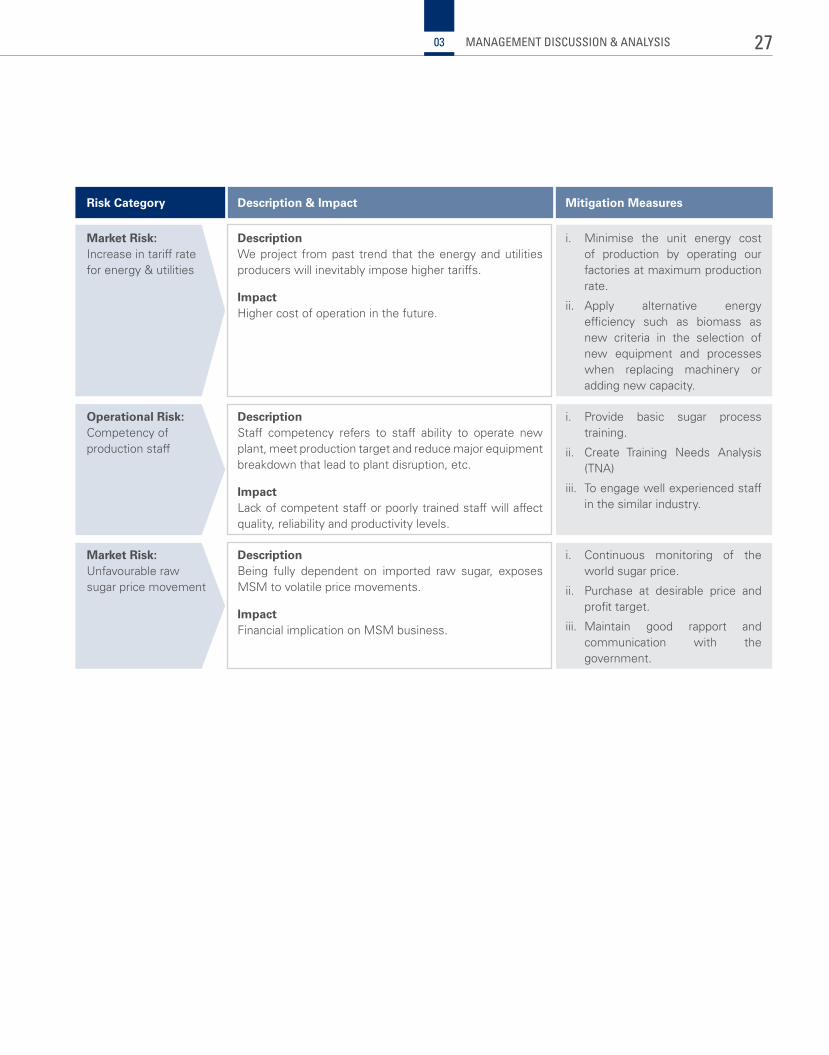
Risk Category Description & Impact Mitigation Measures
Market Risk:Increase in tariff rate for energy & utilities
DescriptionWe project from past trend that the energy and utilities producers will inevitably impose higher tariffs.
ImpactHigher cost of operation in the future.
i. Minimise the unit energy cost of production by operating our factories at maximum production rate.
ii. Apply alternative energy efficiency such as biomass as new criteria in the selection of new equipment and processes when replacing machinery or adding new capacity.
Operational Risk: Competency of production staff
DescriptionStaff competency refers to staff ability to operate new plant, meet production target and reduce major equipment breakdown that lead to plant disruption, etc.
ImpactLack of competent staff or poorly trained staff will affect quality, reliability and productivity levels.
i. Provide basic sugar process training.
ii. Create Training Needs Analysis (TNA)
iii. To engage well experienced staff in the similar industry.
Market Risk: Unfavourable raw sugar price movement
DescriptionBeing fully dependent on imported raw sugar, exposes MSM to volatile price movements.
ImpactFinancial implication on MSM business.
i. Continuous monitoring of the world sugar price.
ii. Purchase at desirable price and profit target.
iii. Maintain good rapport and communication with the government.
27MANAGEMENT DISCUSSION & ANALYSIS03
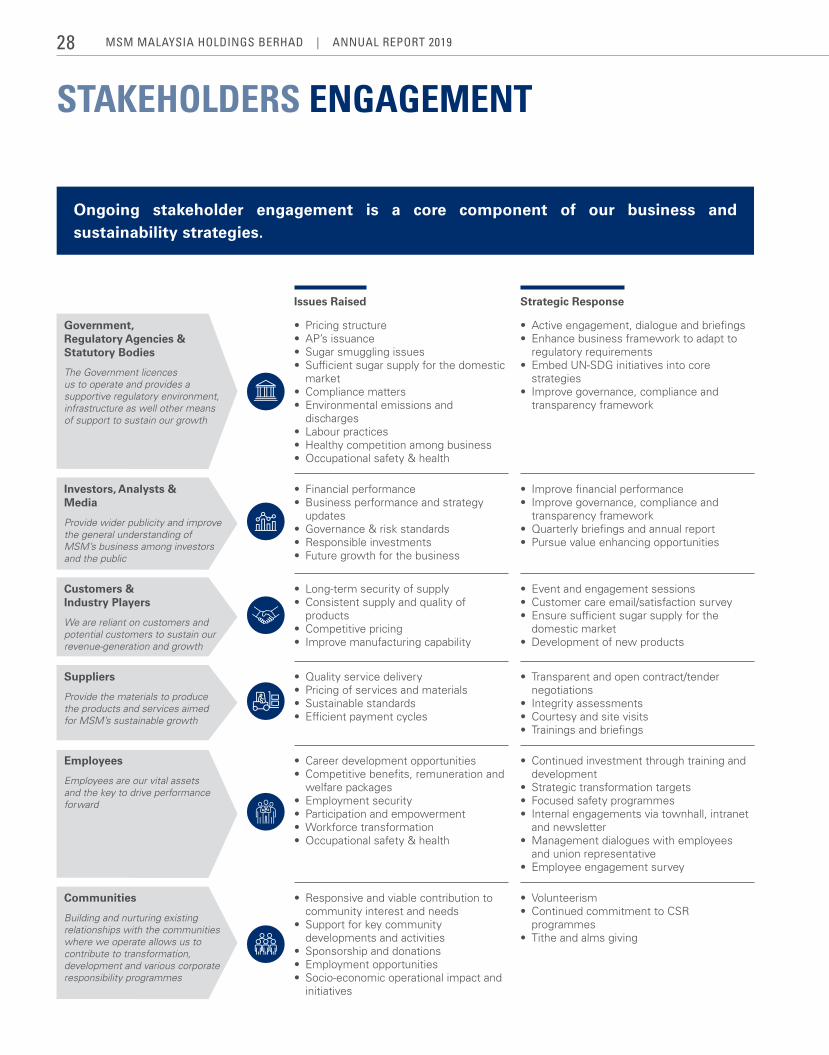
Issues Raised Strategic Response
Government, Regulatory Agencies & Statutory Bodies
The Government licences us to operate and provides a supportive regulatory environment, infrastructure as well other means of support to sustain our growth
• Pricing structure • AP’s issuance • Sugar smuggling issues • Sufficient sugar supply for the domestic
market • Compliance matters• Environmental emissions and
discharges • Labour practices • Healthy competition among business• Occupational safety & health
• Active engagement, dialogue and briefings• Enhance business framework to adapt to
regulatory requirements• Embed UN-SDG initiatives into core
strategies • Improve governance, compliance and
transparency framework
Investors, Analysts & Media
Provide wider publicity and improve the general understanding of MSM’s business among investors and the public
• Financial performance• Business performance and strategy
updates• Governance & risk standards• Responsible investments• Future growth for the business
• Improve financial performance• Improve governance, compliance and
transparency framework• Quarterly briefings and annual report• Pursue value enhancing opportunities
Customers & Industry Players
We are reliant on customers and potential customers to sustain our revenue-generation and growth
• Long-term security of supply• Consistent supply and quality of
products• Competitive pricing • Improve manufacturing capability
• Event and engagement sessions• Customer care email/satisfaction survey • Ensure sufficient sugar supply for the
domestic market• Development of new products
Suppliers
Provide the materials to produce the products and services aimed for MSM’s sustainable growth
• Quality service delivery • Pricing of services and materials • Sustainable standards• Efficient payment cycles
• Transparent and open contract/tender negotiations
• Integrity assessments • Courtesy and site visits • Trainings and briefings
Employees
Employees are our vital assets and the key to drive performance forward
• Career development opportunities • Competitive benefits, remuneration and
welfare packages• Employment security• Participation and empowerment• Workforce transformation• Occupational safety & health
• Continued investment through training and development
• Strategic transformation targets• Focused safety programmes• Internal engagements via townhall, intranet
and newsletter• Management dialogues with employees
and union representative• Employee engagement survey
Communities
Building and nurturing existing relationships with the communities where we operate allows us to contribute to transformation, development and various corporate responsibility programmes
• Responsive and viable contribution to community interest and needs
• Support for key community developments and activities
• Sponsorship and donations• Employment opportunities • Socio-economic operational impact and
initiatives
• Volunteerism• Continued commitment to CSR
programmes• Tithe and alms giving
STAKEHOLDERS ENGAGEMENT
Ongoing stakeholder engagement is a core component of our business and sustainability strategies.
MSM MalaySia HoldingS BerHad | annual report 201928
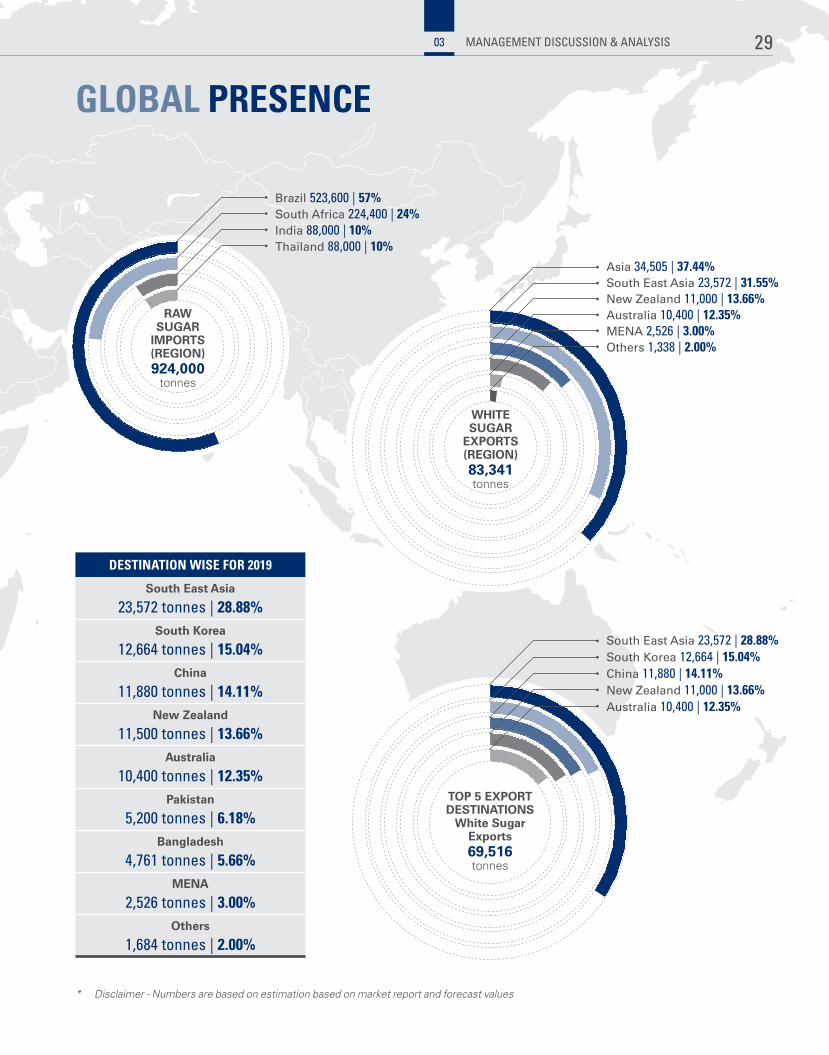
GLOBAL PRESENCE
DESTINATION WISE FOR 2019
South East Asia
23,572 tonnes | 28.88%South Korea
12,664 tonnes | 15.04%China
11,880 tonnes | 14.11%New Zealand
11,500 tonnes | 13.66%Australia
10,400 tonnes | 12.35%Pakistan
5,200 tonnes | 6.18%Bangladesh
4,761 tonnes | 5.66%MENA
2,526 tonnes | 3.00%Others
1,684 tonnes | 2.00%
South Africa 224,400 | 24%
Thailand 88,000 | 10%
RAW SUGAR
IMPORTS (REGION) 924,000
tonnes
Brazil 523,600 | 57%
India 88,000 | 10%
WHITE SUGAR
ExPORTS (REGION) 83,341tonnes
Australia 10,400 | 12.35%
Asia 34,505 | 37.44%South East Asia 23,572 | 31.55%New Zealand 11,000 | 13.66%
MENA 2,526 | 3.00%Others 1,338 | 2.00%
New Zealand 11,000 | 13.66%
South East Asia 23,572 | 28.88%South Korea 12,664 | 15.04%
TOP 5 ExPORT DESTINATIONS
White Sugar Exports 69,516tonnes
China 11,880 | 14.11%
Australia 10,400 | 12.35%
* Disclaimer - Numbers are based on estimation based on market report and forecast values
29MANAGEMENT DISCUSSION & ANALYSIS03
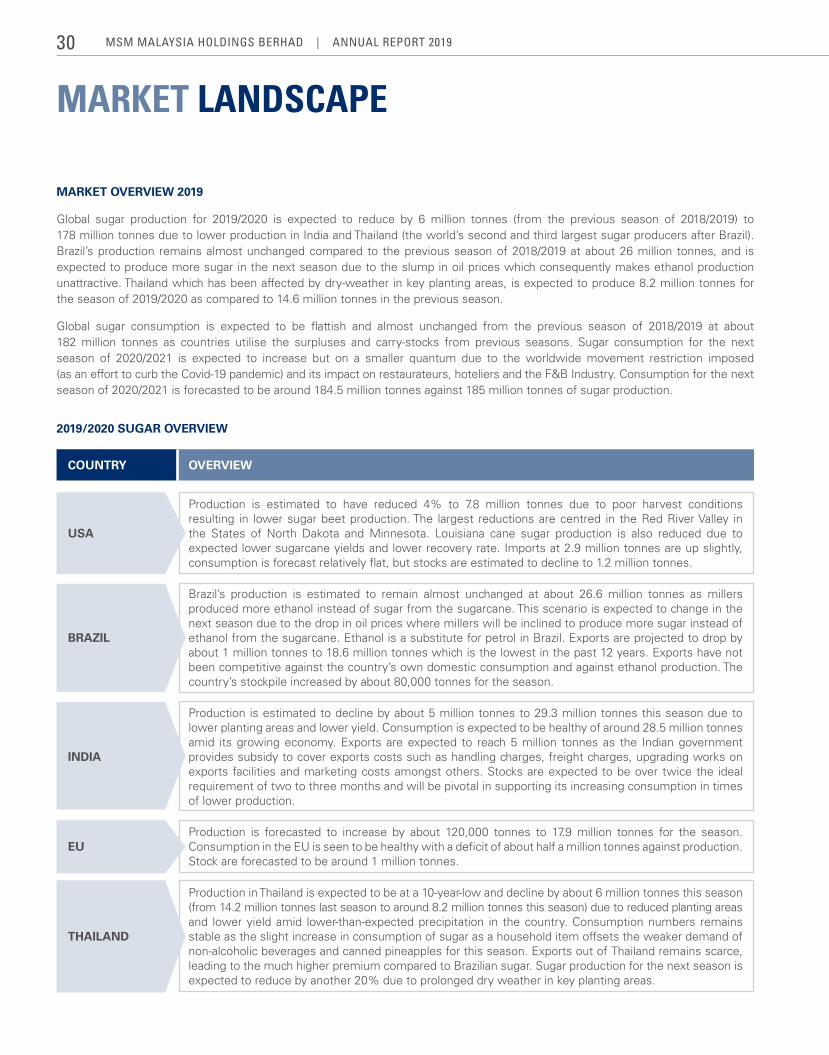
MARKET LANDSCAPE
MARKET OVERVIEW 2019
Global sugar production for 2019/2020 is expected to reduce by 6 million tonnes (from the previous season of 2018/2019) to 178 million tonnes due to lower production in India and Thailand (the world’s second and third largest sugar producers after Brazil). Brazil’s production remains almost unchanged compared to the previous season of 2018/2019 at about 26 million tonnes, and is expected to produce more sugar in the next season due to the slump in oil prices which consequently makes ethanol production unattractive. Thailand which has been affected by dry-weather in key planting areas, is expected to produce 8.2 million tonnes for the season of 2019/2020 as compared to 14.6 million tonnes in the previous season.
Global sugar consumption is expected to be flattish and almost unchanged from the previous season of 2018/2019 at about 182 million tonnes as countries utilise the surpluses and carry-stocks from previous seasons. Sugar consumption for the next season of 2020/2021 is expected to increase but on a smaller quantum due to the worldwide movement restriction imposed (as an effort to curb the Covid-19 pandemic) and its impact on restaurateurs, hoteliers and the F&B Industry. Consumption for the next season of 2020/2021 is forecasted to be around 184.5 million tonnes against 185 million tonnes of sugar production.
2019/2020 SUGAR OVERVIEW
COUNTRY OVERVIEW
USA
Production is estimated to have reduced 4% to 7.8 million tonnes due to poor harvest conditions resulting in lower sugar beet production. The largest reductions are centred in the Red River Valley in the States of North Dakota and Minnesota. Louisiana cane sugar production is also reduced due to expected lower sugarcane yields and lower recovery rate. Imports at 2.9 million tonnes are up slightly, consumption is forecast relatively flat, but stocks are estimated to decline to 1.2 million tonnes.
BRAZIL
Brazil’s production is estimated to remain almost unchanged at about 26.6 million tonnes as millers produced more ethanol instead of sugar from the sugarcane. This scenario is expected to change in the next season due to the drop in oil prices where millers will be inclined to produce more sugar instead of ethanol from the sugarcane. Ethanol is a substitute for petrol in Brazil. Exports are projected to drop by about 1 million tonnes to 18.6 million tonnes which is the lowest in the past 12 years. Exports have not been competitive against the country’s own domestic consumption and against ethanol production. The country’s stockpile increased by about 80,000 tonnes for the season.
INDIA
Production is estimated to decline by about 5 million tonnes to 29.3 million tonnes this season due to lower planting areas and lower yield. Consumption is expected to be healthy of around 28.5 million tonnes amid its growing economy. Exports are expected to reach 5 million tonnes as the Indian government provides subsidy to cover exports costs such as handling charges, freight charges, upgrading works on exports facilities and marketing costs amongst others. Stocks are expected to be over twice the ideal requirement of two to three months and will be pivotal in supporting its increasing consumption in times of lower production.
EUProduction is forecasted to increase by about 120,000 tonnes to 17.9 million tonnes for the season. Consumption in the EU is seen to be healthy with a deficit of about half a million tonnes against production. Stock are forecasted to be around 1 million tonnes.
THAILAND
Production in Thailand is expected to be at a 10-year-low and decline by about 6 million tonnes this season (from 14.2 million tonnes last season to around 8.2 million tonnes this season) due to reduced planting areas and lower yield amid lower-than-expected precipitation in the country. Consumption numbers remains stable as the slight increase in consumption of sugar as a household item offsets the weaker demand of non-alcoholic beverages and canned pineapples for this season. Exports out of Thailand remains scarce, leading to the much higher premium compared to Brazilian sugar. Sugar production for the next season is expected to reduce by another 20% due to prolonged dry weather in key planting areas.
MSM MalaySia HoldingS BerHad | annual report 201930
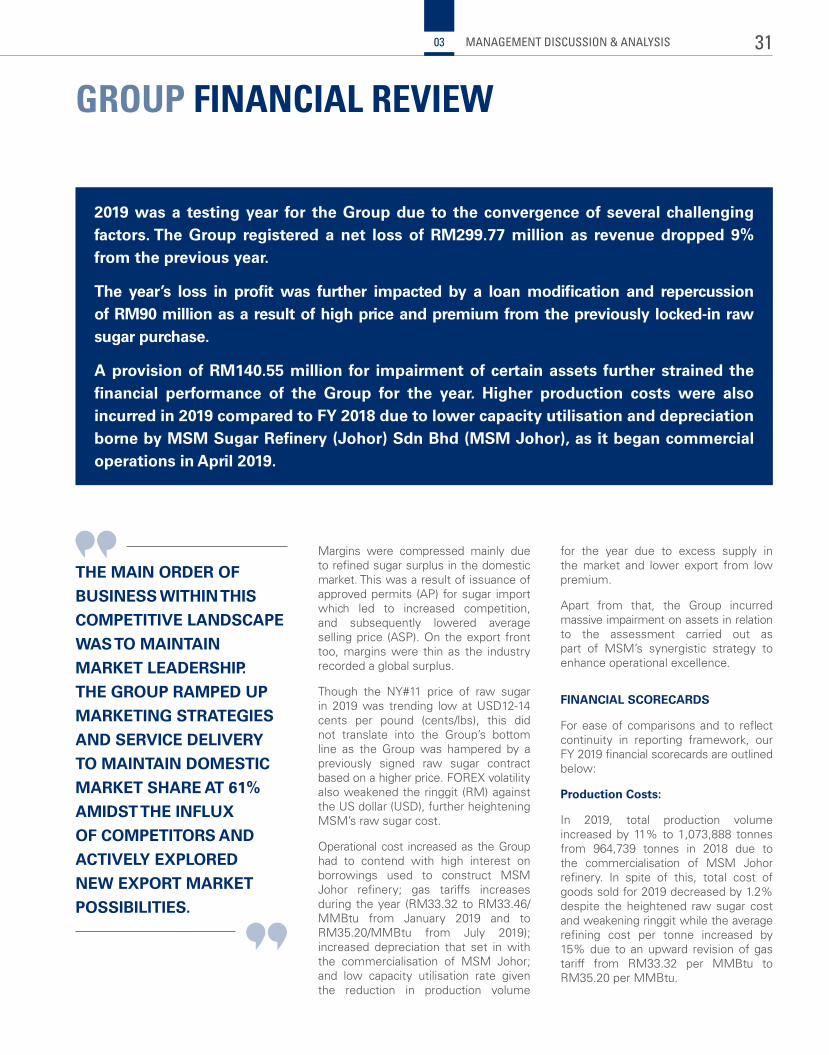
GROUP FINANCIAL REVIEW
Margins were compressed mainly due to refined sugar surplus in the domestic market. This was a result of issuance of approved permits (AP) for sugar import which led to increased competition, and subsequently lowered average selling price (ASP). On the export front too, margins were thin as the industry recorded a global surplus.
Though the NY#11 price of raw sugar in 2019 was trending low at USD12-14 cents per pound (cents/lbs), this did not translate into the Group’s bottom line as the Group was hampered by a previously signed raw sugar contract based on a higher price. FOREX volatility also weakened the ringgit (RM) against the US dollar (USD), further heightening MSM’s raw sugar cost.
Operational cost increased as the Group had to contend with high interest on borrowings used to construct MSM Johor refinery; gas tariffs increases during the year (RM33.32 to RM33.46/MMBtu from January 2019 and to RM35.20/MMBtu from July 2019); increased depreciation that set in with the commercialisation of MSM Johor; and low capacity utilisation rate given the reduction in production volume
THE MAIN ORDER OF
BUSINESS WITHIN THIS
COMPETITIVE LANDSCAPE
WAS TO MAINTAIN
MARKET LEADERSHIP.
THE GROUP RAMPED UP
MARKETING STRATEGIES
AND SERVICE DELIVERY
TO MAINTAIN DOMESTIC
MARKET SHARE AT 61%
AMIDST THE INFLUx
OF COMPETITORS AND
ACTIVELY ExPLORED
NEW ExPORT MARKET
POSSIBILITIES.
2019 was a testing year for the Group due to the convergence of several challenging factors. The Group registered a net loss of RM299.77 million as revenue dropped 9% from the previous year.
The year’s loss in profit was further impacted by a loan modification and repercussion of RM90 million as a result of high price and premium from the previously locked-in raw sugar purchase.
A provision of RM140.55 million for impairment of certain assets further strained the financial performance of the Group for the year. Higher production costs were also incurred in 2019 compared to FY 2018 due to lower capacity utilisation and depreciation borne by MSM Sugar Refinery (Johor) Sdn Bhd (MSM Johor), as it began commercial operations in April 2019.
for the year due to excess supply in the market and lower export from low premium.
Apart from that, the Group incurred massive impairment on assets in relation to the assessment carried out as part of MSM’s synergistic strategy to enhance operational excellence.
FINANCIAL SCORECARDS
For ease of comparisons and to reflect continuity in reporting framework, our FY 2019 financial scorecards are outlined below:
Production Costs:
In 2019, total production volume increased by 11% to 1,073,888 tonnes from 964,739 tonnes in 2018 due to the commercialisation of MSM Johor refinery. In spite of this, total cost of goods sold for 2019 decreased by 1.2% despite the heightened raw sugar cost and weakening ringgit while the average refining cost per tonne increased by 15% due to an upward revision of gas tariff from RM33.32 per MMBtu to RM35.20 per MMBtu.
31MANAGEMENT DISCUSSION & ANALYSIS03
GROUP FINANCIAL REVIEW
Assets:
During the year, MSM Perlis Sdn Bhd had signed an agreement with F&N Agrivalley Sdn Bhd for the sale of plantation land in Chuping, Perlis for RM156 million. Fixed assets have thus reduced due to reclassification of Chuping Plantation Land to Assets Held for Sale, and impairment on assets of RM140 million due to this change in Group’s strategy.
On 9 April 2020, MSM Perlis Sdn Bhd had exercised its rights to rescind the sale and purchase agreement. As of the date of this report, the Group continues with its plan to sell the plantation land and it is of the view that the sales consideration in the sale and purchase agreement with F&N of RM156,000,000 remains the most reflective market value to be used as fair value less costs to sell for the purposes of measurement of the assets held for sale.
Liabilities:
Liabilities have reduced in 2019 due to lower raw sugar stockholding which resulted in lower payables. Raw sugar stock reduced to 91,374 tonnes in December 2019 compared to December 2018 of 366,110 tonnes. In addition, long-term debts were restructured and rescheduled to ease cash flow over the short term.
Capital Resources
MSM’s gearing ratio was sustained at 36% in 2019, resulted primarily from borrowings for the construction of MSM Johor. But liabilities have reduced due to net repayment of borrowings during the year.
STRENGTHENING FINANCIAL SUSTAINABILITY
The main order of business within this competitive landscape was to maintain market leadership. The Group ramped up marketing strategies and service
delivery to maintain domestic market share at 61% amidst the influx of competitors and actively explored new export market possibilities. The latter led to introduction of value-added sugar products, such as premix and sugar syrup, to the Asian market in the second half of 2019. Strategic partnership opportunities for export and diversifying income stream were also explored to increase the utilisation of MSM Johor. Nonetheless, this still could not cover the targeted utilisation due to low premiums on the export front. The surplus situation had adversely impacted the export premium of refined sugar as a result of narrowing margins.
As part of MSM’s strategy to monetise non-core assets. In October 2019, we signed an agreement with F&N Agrivalley Sdn Bhd for the sale of plantation land in Chuping, Perlis. On 9 April 2020, MSM Perlis Sdn Bhd had exercised its rights to rescind the sale and purchase agreement entered on 8 October 2019. Despite the rescission, the Group believes that it will be able to settle its term loan based on its contractual due dates.
Further, towards improving cash flow, stockholding cost has been reduced significantly by reducing raw sugar stockholding. We managed to close 2019 at USD 13.15 cents/lbs due to the surplus production globally. Unfortunately, the surplus situation had affected refined sugar export premium and the market was trending at about RM1,400 – RM1,500 per tonne which was lower than the Group’s production cost.
2020 FINANCIAL PRIORITIES
Forecasts generally point to an impending sugar deficit in 2020, mainly from decrease in production from Thailand due to drought. This deficit is estimated to fetch up to 8 million tonnes, which puts projection for Raw Sugar NY#11 for 2020 between USD13 to 15 cents/lb.
Management’s main focus for the year will be to:
i) Restructure Group’s operation through consolidation of production
ii) Implement various initiatives to reduce operating cost mainly from energy consumption, logistics and distributions
iii) Maximise efficiency of the Group’s refineries
iv) Increase production of value-added products such as sugar syrup, fine syrup and premix mainly for export market
v) Diversify into food-related products for additional income streams
vi) Review MSM’s domestic business model to fatten sales margin
Moving forward, the Group remains cognizant of risks to our sales margin given the continued prevalence of APs for import sugar in the market. MSM continues to engage with the government and relevant authorities in monitoring the situation and advise them of the Group’s capabilities in meeting domestic market needs. Additionally, as the price of raw sugar and FOREX rates have a high impact on MSM’s margins, the Group is committed to close monitoring of the market to cautiously hedge within the Group’s mandate and policy.
In the meanwhile, MSM Group continues to review the domestic business model to fatten sales margin by increasing selling price to wholesalers and raising the premium for the Industry segment. In sustaining cash flow, the Group is leveraging on just-in-time raw sugar procurement while continuing to sell selected non-core assets to pare down borrowings.
MSM MalaySia HoldingS BerHad | annual report 201932
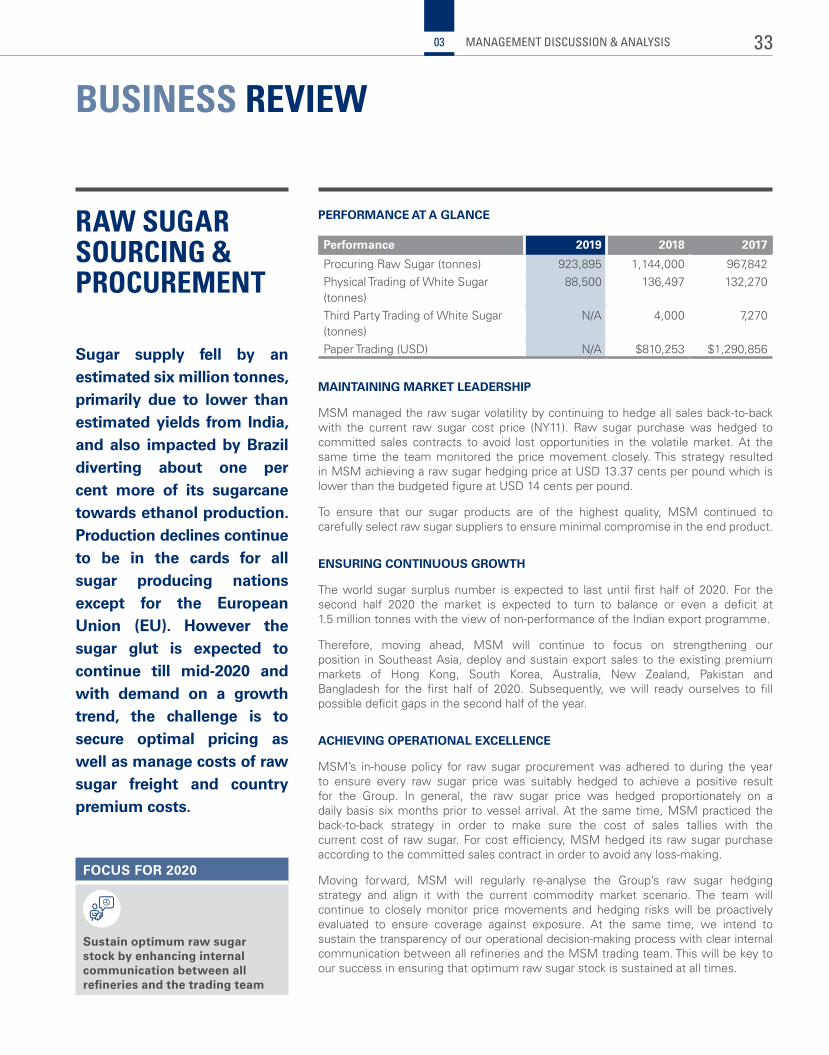
BUSINESS REVIEW
PERFORMANCE AT A GLANCE
Performance 2019 2018 2017
Procuring Raw Sugar (tonnes) 923,895 1,144,000 967,842Physical Trading of White Sugar (tonnes)
88,500 136,497 132,270
Third Party Trading of White Sugar (tonnes)
N/A 4,000 7,270
Paper Trading (USD) N/A $810,253 $1,290,856
MAINTAINING MARKET LEADERSHIP
MSM managed the raw sugar volatility by continuing to hedge all sales back-to-back with the current raw sugar cost price (NY11). Raw sugar purchase was hedged to committed sales contracts to avoid lost opportunities in the volatile market. At the same time the team monitored the price movement closely. This strategy resulted in MSM achieving a raw sugar hedging price at USD 13.37 cents per pound which is lower than the budgeted figure at USD 14 cents per pound.
To ensure that our sugar products are of the highest quality, MSM continued to carefully select raw sugar suppliers to ensure minimal compromise in the end product.
ENSURING CONTINUOUS GROWTH
The world sugar surplus number is expected to last until first half of 2020. For the second half 2020 the market is expected to turn to balance or even a deficit at 1.5 million tonnes with the view of non-performance of the Indian export programme.
Therefore, moving ahead, MSM will continue to focus on strengthening our position in Southeast Asia, deploy and sustain export sales to the existing premium markets of Hong Kong, South Korea, Australia, New Zealand, Pakistan and Bangladesh for the first half of 2020. Subsequently, we will ready ourselves to fill possible deficit gaps in the second half of the year.
ACHIEVING OPERATIONAL ExCELLENCE
MSM’s in-house policy for raw sugar procurement was adhered to during the year to ensure every raw sugar price was suitably hedged to achieve a positive result for the Group. In general, the raw sugar price was hedged proportionately on a daily basis six months prior to vessel arrival. At the same time, MSM practiced the back-to-back strategy in order to make sure the cost of sales tallies with the current cost of raw sugar. For cost efficiency, MSM hedged its raw sugar purchase according to the committed sales contract in order to avoid any loss-making.
Moving forward, MSM will regularly re-analyse the Group’s raw sugar hedging strategy and align it with the current commodity market scenario. The team will continue to closely monitor price movements and hedging risks will be proactively evaluated to ensure coverage against exposure. At the same time, we intend to sustain the transparency of our operational decision-making process with clear internal communication between all refineries and the MSM trading team. This will be key to our success in ensuring that optimum raw sugar stock is sustained at all times.
FOCUS FOR 2020
Sustain optimum raw sugar stock by enhancing internal communication between all refineries and the trading team
RAW SUGAR SOURCING & PROCUREMENT
Sugar supply fell by an estimated six million tonnes, primarily due to lower than estimated yields from India, and also impacted by Brazil diverting about one per cent more of its sugarcane towards ethanol production. Production declines continue to be in the cards for all sugar producing nations except for the European Union (EU). However the sugar glut is expected to continue till mid-2020 and with demand on a growth trend, the challenge is to secure optimal pricing as well as manage costs of raw sugar freight and country premium costs.
33MANAGEMENT DISCUSSION & ANALYSIS03
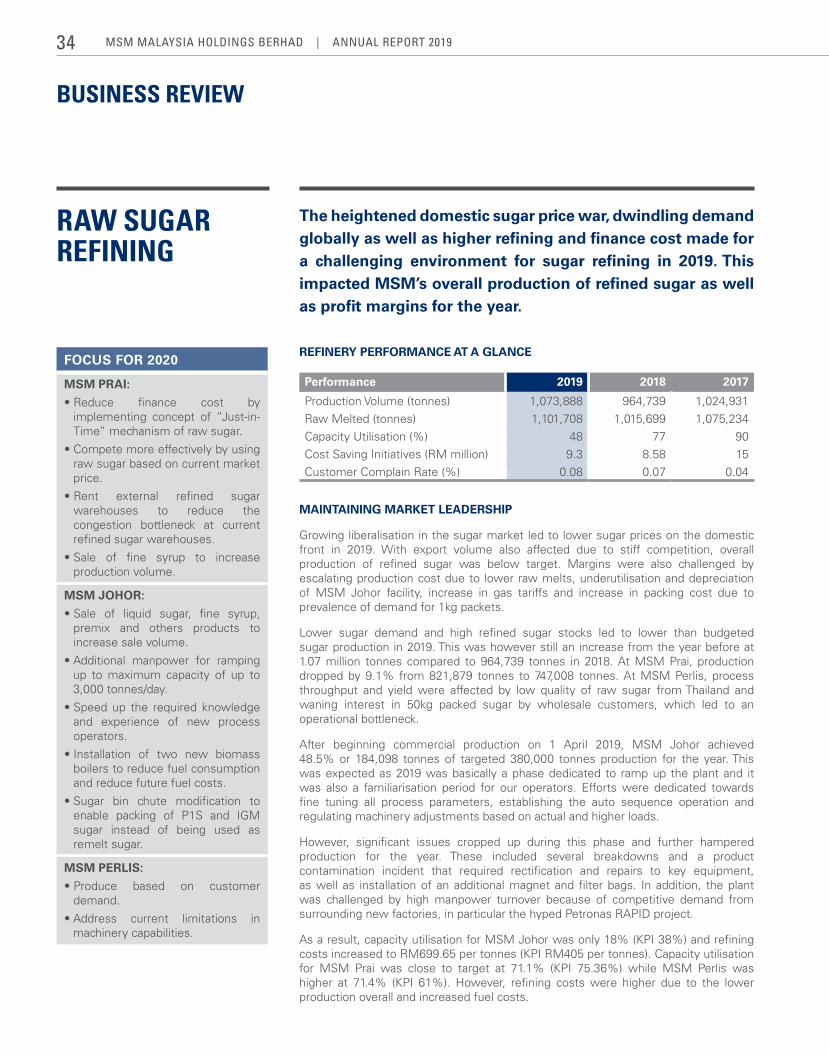
BUSINESS REVIEW
REFINERY PERFORMANCE AT A GLANCE
Performance 2019 2018 2017
Production Volume (tonnes) 1,073,888 964,739 1,024,931Raw Melted (tonnes) 1,101,708 1,015,699 1,075,234Capacity Utilisation (%) 48 77 90Cost Saving Initiatives (RM million) 9.3 8.58 15Customer Complain Rate (%) 0.08 0.07 0.04
MAINTAINING MARKET LEADERSHIP
Growing liberalisation in the sugar market led to lower sugar prices on the domestic front in 2019. With export volume also affected due to stiff competition, overall production of refined sugar was below target. Margins were also challenged by escalating production cost due to lower raw melts, underutilisation and depreciation of MSM Johor facility, increase in gas tariffs and increase in packing cost due to prevalence of demand for 1kg packets.
Lower sugar demand and high refined sugar stocks led to lower than budgeted sugar production in 2019. This was however still an increase from the year before at 1.07 million tonnes compared to 964,739 tonnes in 2018. At MSM Prai, production dropped by 9.1% from 821,879 tonnes to 747,008 tonnes. At MSM Perlis, process throughput and yield were affected by low quality of raw sugar from Thailand and waning interest in 50kg packed sugar by wholesale customers, which led to an operational bottleneck.
After beginning commercial production on 1 April 2019, MSM Johor achieved 48.5% or 184,098 tonnes of targeted 380,000 tonnes production for the year. This was expected as 2019 was basically a phase dedicated to ramp up the plant and it was also a familiarisation period for our operators. Efforts were dedicated towards fine tuning all process parameters, establishing the auto sequence operation and regulating machinery adjustments based on actual and higher loads.
However, significant issues cropped up during this phase and further hampered production for the year. These included several breakdowns and a product contamination incident that required rectification and repairs to key equipment, as well as installation of an additional magnet and filter bags. In addition, the plant was challenged by high manpower turnover because of competitive demand from surrounding new factories, in particular the hyped Petronas RAPID project.
As a result, capacity utilisation for MSM Johor was only 18% (KPI 38%) and refining costs increased to RM699.65 per tonnes (KPI RM405 per tonnes). Capacity utilisation for MSM Prai was close to target at 71.1% (KPI 75.36%) while MSM Perlis was higher at 71.4% (KPI 61%). However, refining costs were higher due to the lower production overall and increased fuel costs.
FOCUS FOR 2020
MSM PRAI:
• Reduce finance cost by implementing concept of “Just-in-Time” mechanism of raw sugar.
• Compete more effectively by using raw sugar based on current market price.
• Rent external refined sugar warehouses to reduce the congestion bottleneck at current refined sugar warehouses.
• Sale of fine syrup to increase production volume.
MSM JOHOR:
• Sale of liquid sugar, fine syrup, premix and others products to increase sale volume.
• Additional manpower for ramping up to maximum capacity of up to 3,000 tonnes/day.
• Speed up the required knowledge and experience of new process operators.
• Installation of two new biomass boilers to reduce fuel consumption and reduce future fuel costs.
• Sugar bin chute modification to enable packing of P1S and IGM sugar instead of being used as remelt sugar.
MSM PERLIS:
• Produce based on customer demand.
• Address current limitations in machinery capabilities.
RAW SUGAR REFINING
The heightened domestic sugar price war, dwindling demand globally as well as higher refining and finance cost made for a challenging environment for sugar refining in 2019. This impacted MSM’s overall production of refined sugar as well as profit margins for the year.
MSM MalaySia HoldingS BerHad | annual report 201934
Another reason for high production cost during the year was the yet unutilised old stock of raw sugar which came at a higher price than current stocks. Since raw sugar contributes 80 - 85% of production cost, this led to a substantially higher production than our competitors.
Moving forward, having completely consumed our old raw sugar stock, we are now in better position to compete with our competitors by using raw sugar based on current market price.
Another key area to be addressed going ahead is the reduction of future fuel costs. Fuel savings are anticipated with the installation of two new biomass boilers by 2021.
In order to maintain market leadership, MSM plans to be more competitive in price and secure consumer demand for its bestselling packet sizes. To optimise Johor capacity and capability, focus will be on increasing sales volume through development of new products such as liquid sugars, premix and flavoured syrups. Liquid sugar production capacity is targeted to increase from 3,500 tonnes/month to 20,000 tonnes/month; while the premix product capacity is targeted to grow from 180 tonnes/month to 1,200 tonnes/month.
ENSURING CONTINUOUS GROWTH
In line with the anticipated increase in production capacity, the refining division will need to prepare packing and storage capacity to prevent any possible bottleneck issues in our production process. Plans are underway towards constructing a new packing house and seeking more refined sugar warehouses.
Several strategies towards enhancing cost efficiency are also ongoing towards improving refining margins. These include managing operation of production lines based on silos and refined sugar stock levels to control operation cost; maximising usage of own power generation using Turbine Generator so as to reduce energy cost from Tenaga Nasional Berhad; and negotiations with vendors of packing materials for cost reduction.
At MSM Johor, rectification works are mostly completed and by end of 2019, operations has achieved better stability. The need for additional manpower is a priority in ramping up production to maximum capacity levels. Focus is also directed towards intensive training of new hires to ensure optimum plant processes in the near future.
The Johor plant will continue to raise export volume of sugar related product such as liquid sugar, fine syrup and premix product to expand market possibilities and build new strengths for MSM.
Once sale volume can be increased, lower refining cost and production cost can be achieved through higher daily melting rate as well as the increase in capacity utilisation.
ACHIEVING OPERATIONAL ExCELLENCE
The Group is proud of our safety achievements as we continue to improve operational excellence. Loss Time Injury (LTI) targets at all three plants were surpassed.
MSM Prai’s Safety team organised various safety activities including Fire Drill with Jabatan Bomba. Emergency Response Team (ERT) members were sent for Bomba trainings to equip the necessary skills in the event of fire and emergency situations. First aid training too was duly conducted. All this contributed to a Occupational, Safety & Health (OSH)Achievement in the plant’s operations with the number of accidents in 2019 dropped to 7 cases from 15 cases in 2018. During the year, usage of social media technology was also kicked off to disseminate information related factory operation for better coordination and response. In terms of leveraging on stakeholder engagements, the MSM Prai team also continued to strive for good rapport with KTM personnel to ensure smooth transfer of sugar from Prai to Sg Buloh by KTM train.
MSM Perlis achieved 1,133,091 hours without Lost Time Injury and won the FGV President’s Award For Safety 2018/2019 as well as achieved 3rd place for Best Safety Projectand 4th place for Best Safety & Health Committee. The refinery was also nominated for the National Occupational Safety and Health Excellence Award 2019 by the Department of Occupational Safety and Health of Malaysia.
Moving forward, MSM Perlis is committed to launch an array of safety programmes, risk assessments and departmental challenges to heighten safety awareness and inculcate safety first thinking as a culture.
Following the examples set by MSM Prai and MSM Perlis, MSM Johor has outlined its 2020 OSH goals as follows:
i) Target 400 and above EAR (Employee Action Request), compared to 306 items in 2019. This will catalyse prompt action to prevent potential hazards
ii) Reduce LTI cases by 50%, which means a maximum 3 cases instead of 6 cases as recorded in 2019
iii) Prepare for ISO1400 certification
iv 100% implementation of all legislation requirements such as noise monitoring and water analysis
v) 100% implementation and enforcement on safety compliance at site especially special work (hot work, confine space work, heavy lifting and working at height)
vi) 100% participation on safety improvements such as daily safety toolbox by department heads, leaders, area owners and operators
vii) Get started on safety ownership programme familiarisation
viii) Conduct related internal and external safety training
35MANAGEMENT DISCUSSION & ANALYSIS03
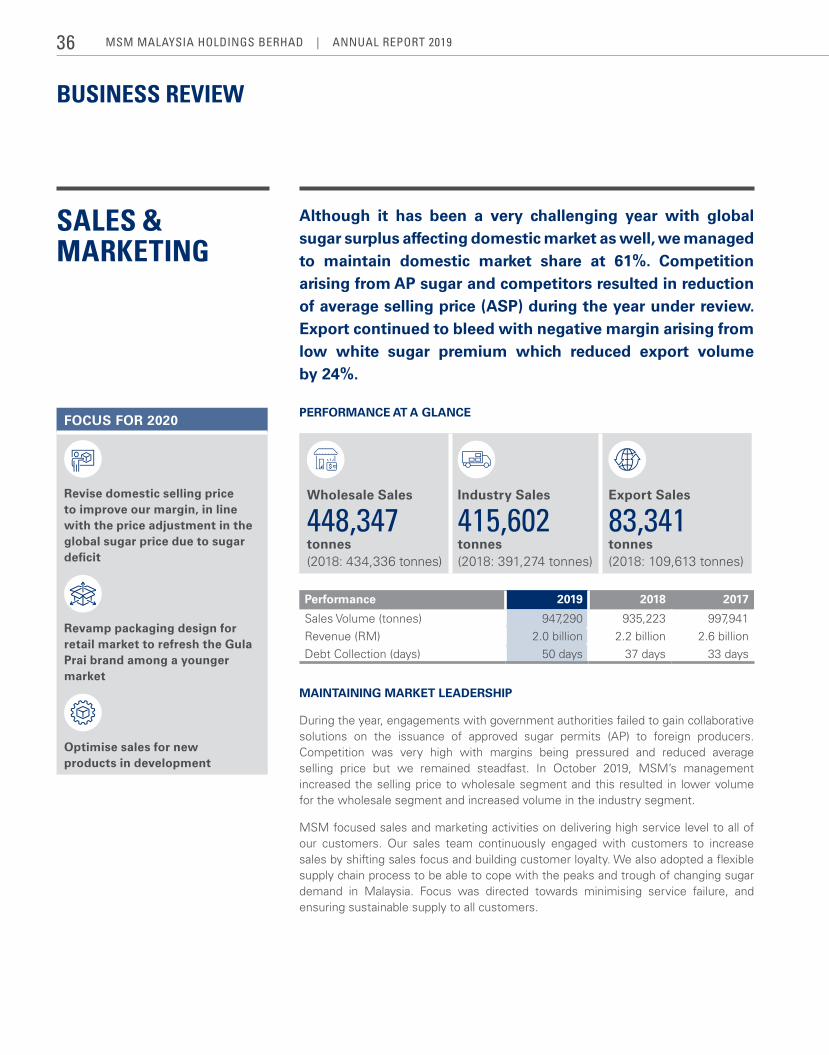
BUSINESS REVIEW
PERFORMANCE AT A GLANCE
Wholesale Sales
448,347 tonnes (2018: 434,336 tonnes)
Industry Sales
415,602 tonnes (2018: 391,274 tonnes)
Export Sales
83,341 tonnes (2018: 109,613 tonnes)
Performance 2019 2018 2017
Sales Volume (tonnes) 947,290 935,223 997,941Revenue (RM) 2.0 billion 2.2 billion 2.6 billionDebt Collection (days) 50 days 37 days 33 days
MAINTAINING MARKET LEADERSHIP
During the year, engagements with government authorities failed to gain collaborative solutions on the issuance of approved sugar permits (AP) to foreign producers. Competition was very high with margins being pressured and reduced average selling price but we remained steadfast. In October 2019, MSM’s management increased the selling price to wholesale segment and this resulted in lower volume for the wholesale segment and increased volume in the industry segment.
MSM focused sales and marketing activities on delivering high service level to all of our customers. Our sales team continuously engaged with customers to increase sales by shifting sales focus and building customer loyalty. We also adopted a flexible supply chain process to be able to cope with the peaks and trough of changing sugar demand in Malaysia. Focus was directed towards minimising service failure, and ensuring sustainable supply to all customers.
SALES & MARKETING
Although it has been a very challenging year with global sugar surplus affecting domestic market as well, we managed to maintain domestic market share at 61%. Competition arising from AP sugar and competitors resulted in reduction of average selling price (ASP) during the year under review. Export continued to bleed with negative margin arising from low white sugar premium which reduced export volume by 24%.
FOCUS FOR 2020
Revise domestic selling price to improve our margin, in line with the price adjustment in the global sugar price due to sugar deficit
Revamp packaging design for retail market to refresh the Gula Prai brand among a younger market
Optimise sales for new products in development
MSM MalaySia HoldingS BerHad | annual report 201936
Highlights for the year included an increase in penetration to high traffic outlets such as Speedmart 99, and introducing a smaller pack size to meet consumer demands for a more convenient packaging.
Moving towards 2020, MSM is embarking on product diversification on food and non-food sugar related products. With the sugar industry exposed to more threats especially from the health-concern community/organisation and therefore there is a need for us to diversify our business accordingly. We have already embarking on product diversification with continuous R&D effort on food and non-food sugar related products such as low calorie sucralose, mudcake and molasses. We are also exploring on potential to venture into downstream segment such as condensed milk and chocolate.
To-date, we have started exporting molasses to Asia-Pacific countries, targeting dairy farms and livestock companies in various packaging to get better margins.
ENSURING CONTINUOUS GROWTH
In ensuring continuous growth, MSM is focusing on current strategies to enhance service levels, increase penetration into high traffic outlets, introduce new packing sizes as well as new products such as the premix and liquid sugar launched during the year. More product opportunities are being explored as we move into 2020. With the emergence
of new lifestyle trends on healthy eating and more conscious nutrition, MSM is mindful that a growing number of groups are advocating drastic reduction in sugar from their diet. As Malaysia’s leading sugar producer, MSM has begun a venture to introduce a new healthy range of sugar products in-line with emerging aspirations of most Malaysians to lead a healthy lifestyle. These healthier sugar variants are targeted to be launched in 2020.
Building on current strengths, the sales team also continues to leverage on MSM refined sugar’s repute as a high quality premium sugar and the preferred type of sugar for industries.
ACHIEVING OPERATIONAL ExCELLENCE
During the year, operational efficiency continued to be enhanced through better demarcation of customer to warehouse, whereby customers from the Northern region drew stocks from our Prai refinery, whilst customers from the Central region were served from the Sungai Buloh warehouse. This demarcation has proven its worth in achieving cost efficiency as well. Moving forward, in achieving operational excellence, the sales and marketing team will continuously engage with customers to realise further improvements in service level.
37MANAGEMENT DISCUSSION & ANALYSIS03
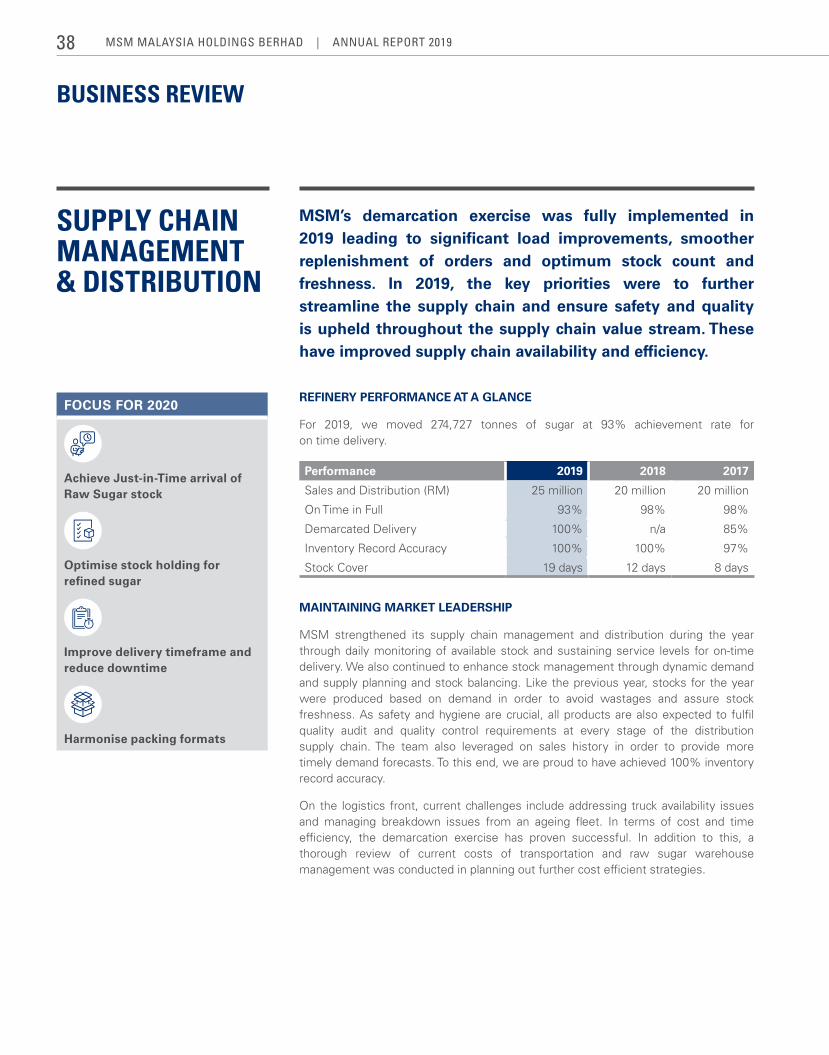
BUSINESS REVIEW
REFINERY PERFORMANCE AT A GLANCE
For 2019, we moved 274,727 tonnes of sugar at 93% achievement rate for on time delivery.
Performance 2019 2018 2017
Sales and Distribution (RM) 25 million 20 million 20 million
On Time in Full 93% 98% 98%
Demarcated Delivery 100% n/a 85%
Inventory Record Accuracy 100% 100% 97%
Stock Cover 19 days 12 days 8 days
MAINTAINING MARKET LEADERSHIP
MSM strengthened its supply chain management and distribution during the year through daily monitoring of available stock and sustaining service levels for on-time delivery. We also continued to enhance stock management through dynamic demand and supply planning and stock balancing. Like the previous year, stocks for the year were produced based on demand in order to avoid wastages and assure stock freshness. As safety and hygiene are crucial, all products are also expected to fulfil quality audit and quality control requirements at every stage of the distribution supply chain. The team also leveraged on sales history in order to provide more timely demand forecasts. To this end, we are proud to have achieved 100% inventory record accuracy.
On the logistics front, current challenges include addressing truck availability issues and managing breakdown issues from an ageing fleet. In terms of cost and time efficiency, the demarcation exercise has proven successful. In addition to this, a thorough review of current costs of transportation and raw sugar warehouse management was conducted in planning out further cost efficient strategies.
FOCUS FOR 2020
Achieve Just-in-Time arrival of Raw Sugar stock
Optimise stock holding for refined sugar
Improve delivery timeframe and reduce downtime
Harmonise packing formats
SUPPLY CHAIN MANAGEMENT & DISTRIBUTION
MSM’s demarcation exercise was fully implemented in 2019 leading to significant load improvements, smoother replenishment of orders and optimum stock count and freshness. In 2019, the key priorities were to further streamline the supply chain and ensure safety and quality is upheld throughout the supply chain value stream. These have improved supply chain availability and efficiency.
MSM MalaySia HoldingS BerHad | annual report 201938
Other key challenges observed were the risk of daily business disruptions due to reliance on train systems that are out of our direct control and unforeseen stock management glitches with high and long stockholding period for slow moving variants and added warehousing when customers do not observe requested order dates. These require more perceptive forecasting and greater customer engagement initiatives going forward.
Building on customer relationships, an audit was conducted and a review held to identify service gaps so as to be able to fulfil expectations better.
ENSURING CONTINUOUS GROWTH
With increased focus on product diversity going forward, MSM continues to be proactive in planning responsive distribution and logistics strategies to meet future market challenges. A Supply Chain Blueprint for the next five years has been outlined towards identifying the best way forward in identified areas of our operations such as Stock, Distribution, Warehouse and Customer Service.
Dynamic demand and supply planning with stocks produced based on demand has seen less wastage and better stock management and thus will continue to be implemented and enhanced going forward. For raw sugar, just in time stock strategy will continue to be practiced so as to save on warehousing costs for purchase loading. For refined sugar, MSM is working to harmonise packing formats to reduce inventory of dedicated stock-keeping units (SKUs) for specific customers and save on packing material. Greater packing efficiency is also being sought by collaborating more closely with packers. While we continue to seek more competitive warehouse rates, warehousing cost is to be better managed by optimising internal warehouse via a racking system and reducing pallet rental costs by keeping pallet management as an option for customers.
New distribution strategies are in the pipeline with possible exploration of using barges in addition to the current trucking and railway systems, direct delivery to door-to-door customers, direct coverage to consumer market segment instead of retailers, and further refinement of the demarcation exercise. Last but not least, improvement to customer forecast are being planned through the introduction of new requirements.
ACHIEVING OPERATIONAL ExCELLENCE
MSM has set the ball rolling for further improvements in operational excellence through better integration of supply chain activities and by upgrading systems and processes. Standard operating procedures have been implemented and will be enforced towards business improvement and in ensuring better governance and transparency. These will positively impact selection and performance of third party logistic providers and other vendors. In addition, several communication matrixes have been established to improve collaborations between our sales, distribution and logistics teams as well as with customers. At the same time, reviews with external parties in our chain of activities are ongoing to seek better alignment and in coming up with effective contingency plans.
39MANAGEMENT DISCUSSION & ANALYSIS03
BUSINESS REVIEW
PERFORMANCE AT A GLANCE
Performance 2019 2018 2017
Rubber Replacement (seedlings) 0 19,696 232,222Fertiliser Cost (RM) 0 184/ha 421/haDevelopment Cost (RM) 1,035/ha 2,736/ha 3,261/haMango Planting Area (ha) 0 10.7 7.4
DISPOSAL OF ASSET
MSM’s plantation sector in year 2019 faced cash flow constraints and adverse climate not conducive for planting and replacement. Given the cumulative years of low returns on this segment, Plantation was identified as candidate under the Group’s Monetising Non-Core Assets strategy.
The Board had approved the disposal of plantation land measuring 4,454 ha to any interested parties by way of open tender on January 2019. On 8 October 2019, MSM signed a sales and purchase agreement with F&N Agrivalley Sdn Bhd for the sale of plantation land in Chuping, Perlis for RM156 million. There are conditions precedent which must be fulfilled before the deal is concluded. However, on 9 April 2020, MSM Perlis Sdn Bhd has exercised its rights to rescind the sale and purchase agreement since F&N has not fulfilled the first Condition Precedent by the expiry of the Conditional Period as well as the Extended Conditional Period. With this new development, we will continuously keep a lookout for a new strategic plan to monetise this asset.
The entire process was conducted in a transparent manner. We were clear from the outset that the disposal should bring benefit not just to MSM but also to the state of Perlis and the communities that live in the area, to balance commercial and social values. The disposal is in the best interest of the Group as the land generates negligible revenues but requires unsustainable financial commitments due to the high operating costs of maintaining the plantation activities.
All retrenched employees are fairly compensated and some of them have been retained to assist in completing the paperwork and assets disposal before the ultimate closure of the plantation division.
PLANTATION
A core priority during a challenging 2019 was the need to accumulate sufficient cash flow to service our debt post completion of MSM Johor refinery. Amongst the many stop-gap initiative implemented, was the need to monetise non-core assets such as plantations. With Board approval of the disposal and in anticipation of the closure, the main planting and maintenance activities namely replacement and manuring were stopped altogether during the year under review.
MSM MalaySia HoldingS BerHad | annual report 201940
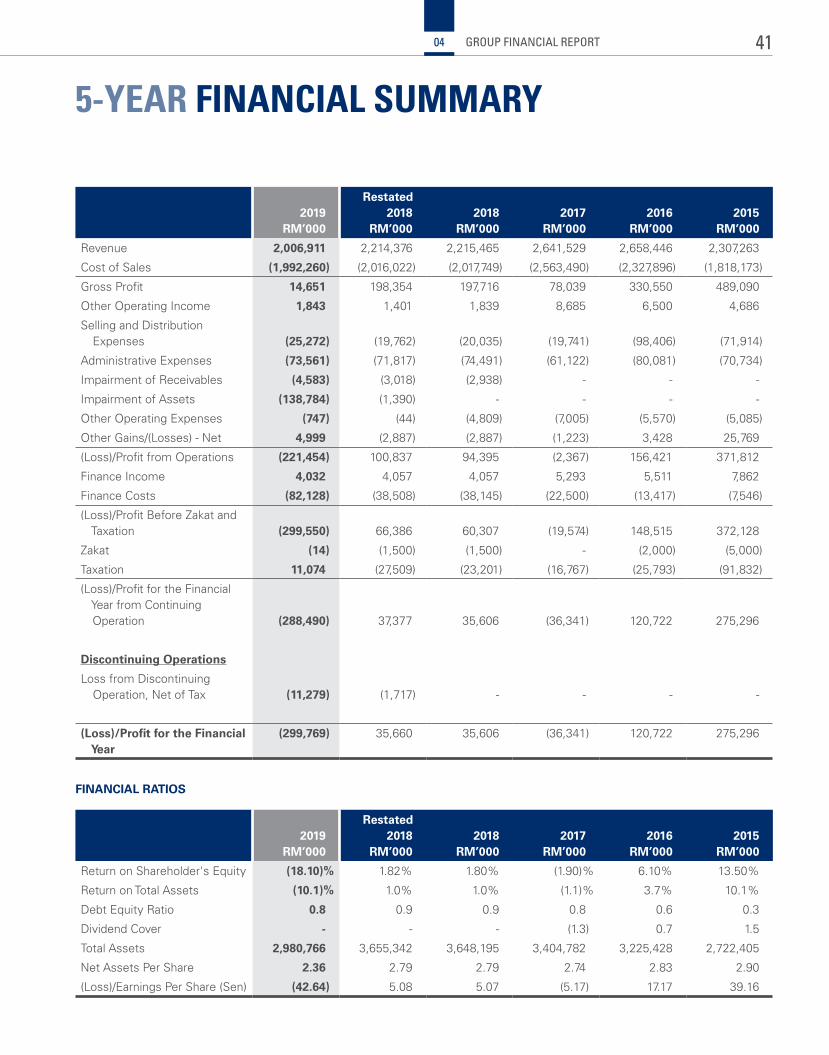
5-YEAR FINANCIAL SUMMARY
2019RM’000
Restated2018
RM’0002018
RM’0002017
RM’0002016
RM’0002015
RM’000
Revenue 2,006,911 2,214,376 2,215,465 2,641,529 2,658,446 2,307,263
Cost of Sales (1,992,260) (2,016,022) (2,017,749) (2,563,490) (2,327,896) (1,818,173)
Gross Profit 14,651 198,354 197,716 78,039 330,550 489,090
Other Operating Income 1,843 1,401 1,839 8,685 6,500 4,686
Selling and Distribution Expenses (25,272) (19,762) (20,035) (19,741) (98,406) (71,914)
Administrative Expenses (73,561) (71,817) (74,491) (61,122) (80,081) (70,734)
Impairment of Receivables (4,583) (3,018) (2,938) - - -
Impairment of Assets (138,784) (1,390) - - - -
Other Operating Expenses (747) (44) (4,809) (7,005) (5,570) (5,085)
Other Gains/(Losses) - Net 4,999 (2,887) (2,887) (1,223) 3,428 25,769
(Loss)/Profit from Operations (221,454) 100,837 94,395 (2,367) 156,421 371,812
Finance Income 4,032 4,057 4,057 5,293 5,511 7,862
Finance Costs (82,128) (38,508) (38,145) (22,500) (13,417) (7,546)
(Loss)/Profit Before Zakat and Taxation (299,550) 66,386 60,307 (19,574) 148,515 372,128
Zakat (14) (1,500) (1,500) - (2,000) (5,000)
Taxation 11,074 (27,509) (23,201) (16,767) (25,793) (91,832)
(Loss)/Profit for the Financial Year from Continuing Operation (288,490) 37,377 35,606 (36,341) 120,722 275,296
Discontinuing Operations
Loss from Discontinuing Operation, Net of Tax (11,279) (1,717) - - - -
(Loss)/Profit for the Financial Year
(299,769) 35,660 35,606 (36,341) 120,722 275,296
FINANCIAL RATIOS
2019RM’000
Restated2018
RM’0002018
RM’0002017
RM’0002016
RM’0002015
RM’000
Return on Shareholder's Equity (18.10)% 1.82% 1.80% (1.90)% 6.10% 13.50%
Return on Total Assets (10.1)% 1.0% 1.0% (1.1)% 3.7% 10.1%
Debt Equity Ratio 0.8 0.9 0.9 0.8 0.6 0.3
Dividend Cover - - - (1.3) 0.7 1.5
Total Assets 2,980,766 3,655,342 3,648,195 3,404,782 3,225,428 2,722,405
Net Assets Per Share 2.36 2.79 2.79 2.74 2.83 2.90
(Loss)/Earnings Per Share (Sen) (42.64) 5.08 5.07 (5.17) 17.17 39.16
41GROUP FINANCIAL REPORT04
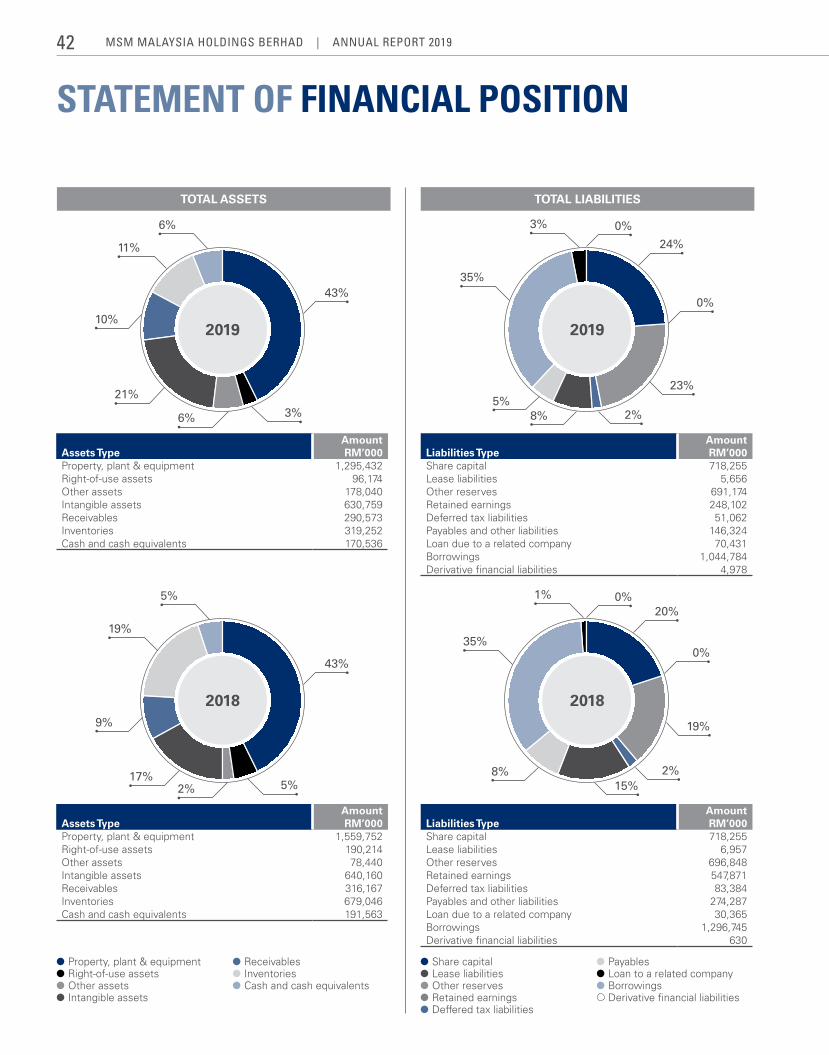
STATEMENT OF FINANCIAL POSITION
5%
6%
1%
35%
35%
3%
43%
43%
20%
24%
0%
0%
0%
0%
19%
11%
19%
23%
2%15%
2%
17%2%
21%
6%
5%
3%
9%
10%
8%
5%8%
2018
2019
2018
2019
TOTAL ASSETS TOTAL LIABILITIES
Assets TypeAmountRM’000
Property, plant & equipment 1,295,432Right-of-use assets 96,174Other assets 178,040Intangible assets 630,759Receivables 290,573Inventories 319,252Cash and cash equivalents 170,536
Assets TypeAmountRM’000
Property, plant & equipment 1,559,752Right-of-use assets 190,214Other assets 78,440Intangible assets 640,160Receivables 316,167Inventories 679,046Cash and cash equivalents 191,563
Liabilities TypeAmountRM’000
Share capital 718,255Lease liabilities 6,957Other reserves 696,848Retained earnings 547,871Deferred tax liabilities 83,384Payables and other liabilities 274,287Loan due to a related company 30,365Borrowings 1,296,745Derivative financial liabilities 630
Liabilities TypeAmountRM’000
Share capital 718,255Lease liabilities 5,656Other reserves 691,174Retained earnings 248,102Deferred tax liabilities 51,062Payables and other liabilities 146,324Loan due to a related company 70,431Borrowings 1,044,784Derivative financial liabilities 4,978
Property, plant & equipment Right-of-use assets Other assets Intangible assets
Receivables Inventories Cash and cash equivalents
Share capital Lease liabilities Other reserves Retained earnings Deffered tax liabilities
Payables Loan to a related company Borrowings Derivative financial liabilities
MSM MalaySia HoldingS BerHad | annual report 201942
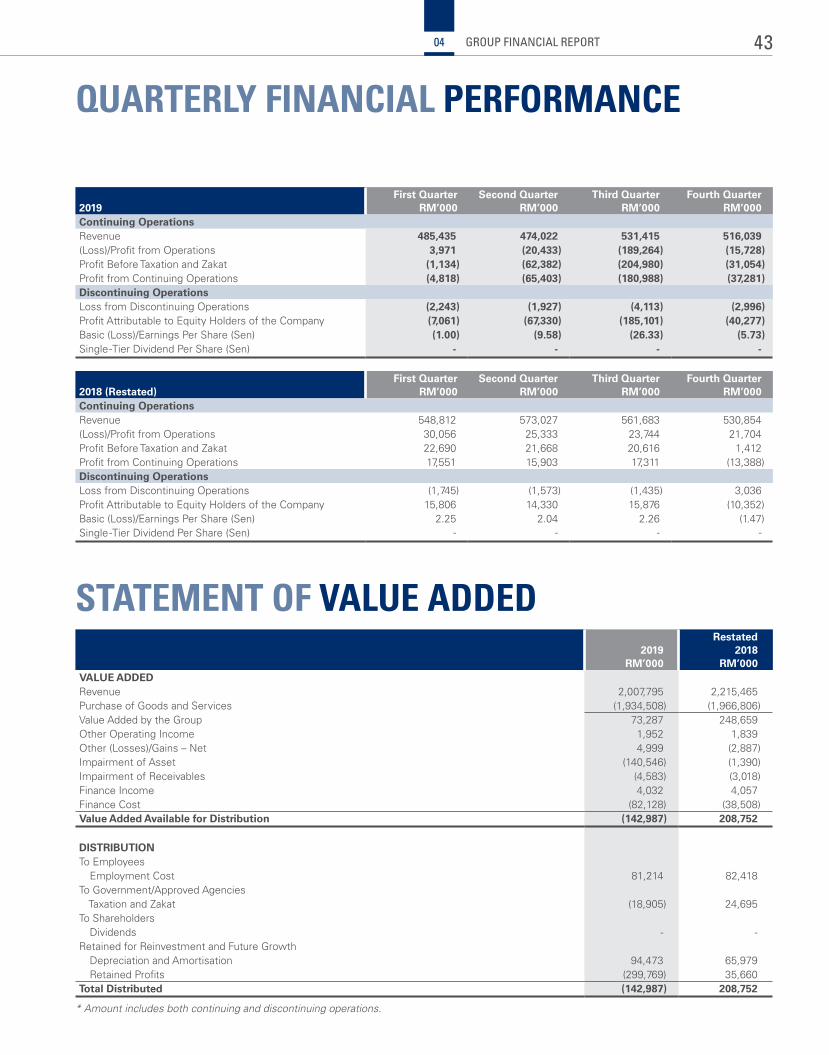
QUARTERLY FINANCIAL PERFORMANCE
STATEMENT OF VALUE ADDED
2019First quarter
RM’000Second quarter
RM’000Third quarter
RM’000Fourth quarter
RM’000Continuing OperationsRevenue 485,435 474,022 531,415 516,039 (Loss)/Profit from Operations 3,971 (20,433) (189,264) (15,728)Profit Before Taxation and Zakat (1,134) (62,382) (204,980) (31,054)Profit from Continuing Operations (4,818) (65,403) (180,988) (37,281)Discontinuing OperationsLoss from Discontinuing Operations (2,243) (1,927) (4,113) (2,996)Profit Attributable to Equity Holders of the Company (7,061) (67,330) (185,101) (40,277)Basic (Loss)/Earnings Per Share (Sen) (1.00) (9.58) (26.33) (5.73)Single-Tier Dividend Per Share (Sen) - - - -
2018 (Restated)First quarter
RM’000Second quarter
RM’000Third quarter
RM’000Fourth quarter
RM’000Continuing OperationsRevenue 548,812 573,027 561,683 530,854 (Loss)/Profit from Operations 30,056 25,333 23,744 21,704 Profit Before Taxation and Zakat 22,690 21,668 20,616 1,412 Profit from Continuing Operations 17,551 15,903 17,311 (13,388)Discontinuing OperationsLoss from Discontinuing Operations (1,745) (1,573) (1,435) 3,036 Profit Attributable to Equity Holders of the Company 15,806 14,330 15,876 (10,352)Basic (Loss)/Earnings Per Share (Sen) 2.25 2.04 2.26 (1.47)Single-Tier Dividend Per Share (Sen) - - - -
2019 RM’000
Restated2018
RM’000 VALUE ADDEDRevenue 2,007,795 2,215,465 Purchase of Goods and Services (1,934,508) (1,966,806)Value Added by the Group 73,287 248,659 Other Operating Income 1,952 1,839 Other (Losses)/Gains – Net 4,999 (2,887)Impairment of Asset (140,546) (1,390)Impairment of Receivables (4,583) (3,018)Finance Income 4,032 4,057 Finance Cost (82,128) (38,508)Value Added Available for Distribution (142,987) 208,752
DISTRIBUTIONTo Employees Employment Cost 81,214 82,418 To Government/Approved Agencies Taxation and Zakat (18,905) 24,695 To Shareholders Dividends - - Retained for Reinvestment and Future Growth Depreciation and Amortisation 94,473 65,979 Retained Profits (299,769) 35,660 Total Distributed (142,987) 208,752
* Amount includes both continuing and discontinuing operations.
4304 GROUP FINANCIAL REPORT
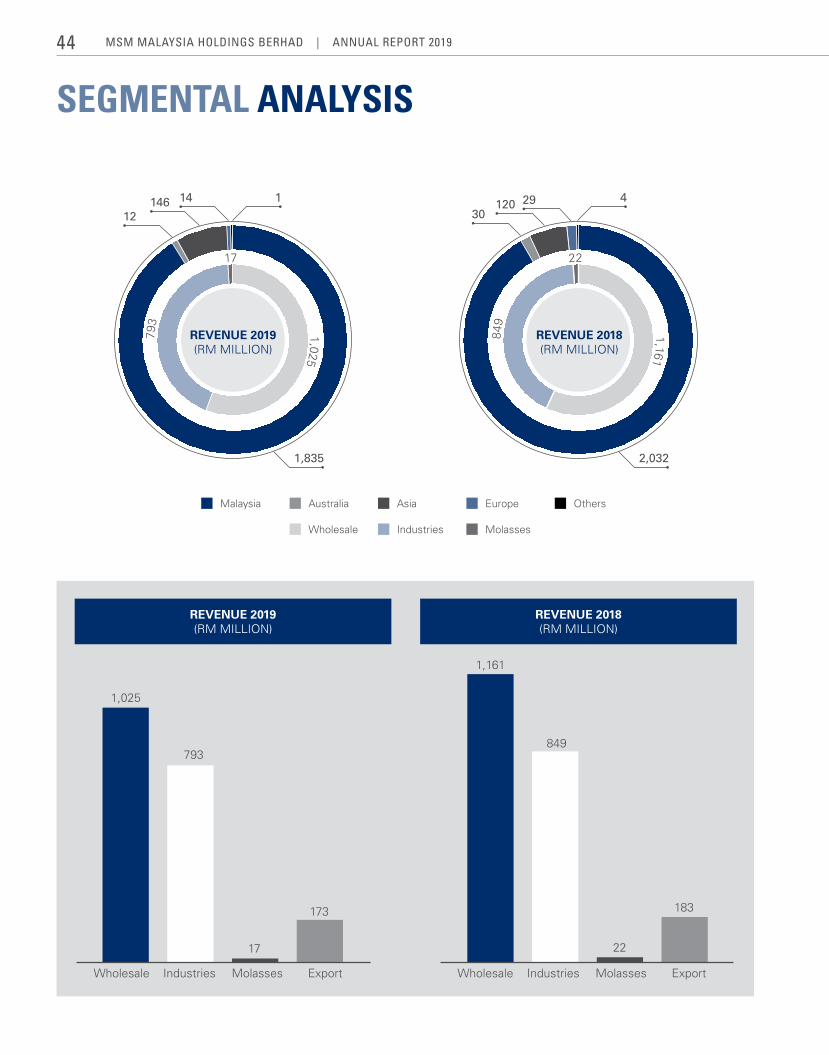
SEGMENTAL ANALYSIS
Asia Europe OthersMalaysia Australia
MolassesWholesale Industries
REVENUE 2019 (RM MILLION)
REVENUE 2018 (RM MILLION)
146 14 1 4
12 30120 29
1,835 2,032
REVENUE 2019 (RM MILLION)
REVENUE 2018 (RM MILLION)
793
849
1,025
1,161
17 22
Wholesale Industries Molasses Export Wholesale Industries Molasses Export
1,025
1,161
793849
22
183
17
173
MSM MalaySia HoldingS BerHad | annual report 201944
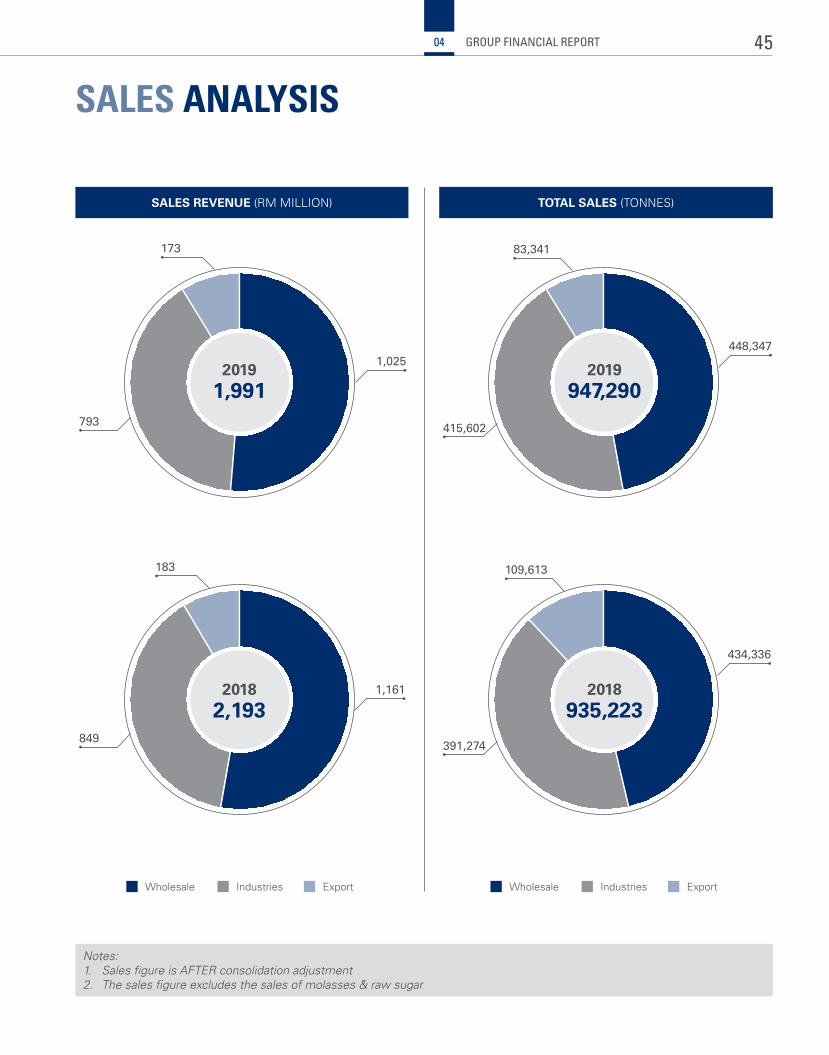
SALES ANALYSIS
SALES REVENUE (RM MILLION) TOTAL SALES (TONNES)
Wholesale Industries Export Wholesale Industries Export
Notes: 1. Sales figure is AFTER consolidation adjustment2. The sales figure excludes the sales of molasses & raw sugar
1,025448,347
434,336
1,161
173 83,341
109,613183
793 415,602
391,274 849
20191,991
20182,193
2019947,290
2018935,223
4504 GROUP FINANCIAL REPORT
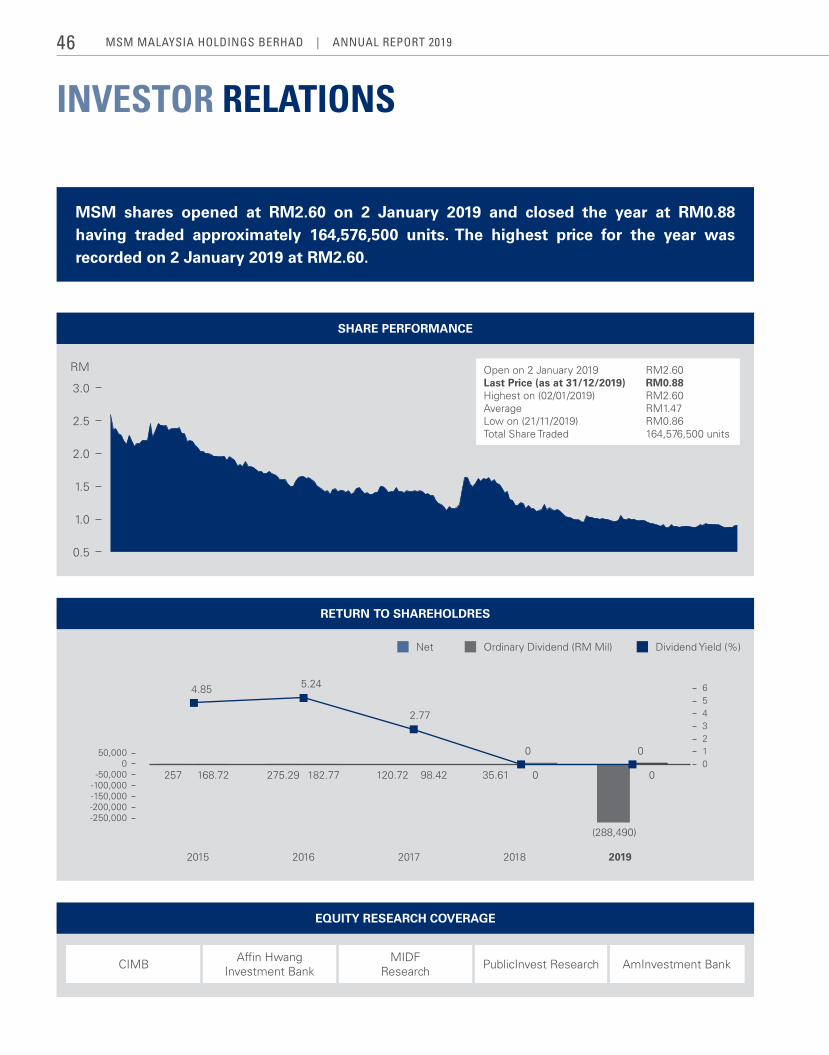
INVESTOR RELATIONS
MSM shares opened at RM2.60 on 2 January 2019 and closed the year at RM0.88 having traded approximately 164,576,500 units. The highest price for the year was recorded on 2 January 2019 at RM2.60.
SHARE PERFORMANCE
RETURN TO SHAREHOLDRES
EqUITY RESEARCH COVERAGE
CIMB Affin Hwang Investment Bank
MIDF Research PublicInvest Research AmInvestment Bank
Open on 2 January 2019 RM2.60Last Price (as at 31/12/2019) RM0.88Highest on (02/01/2019) RM2.60Average RM1.47Low on (21/11/2019) RM0.86Total Share Traded 164,576,500 units
Net Ordinary Dividend (RM Mil) Dividend Yield (%)
2015 2016 2017 2018 2019
-300,000-250,000-200,000-150,000-100,000-50,000
050,000
0123456
0.5
1.0
1.5
2.0
2.5
3.0
RM
257
4.85 5.24
2.77
0 0
275.29 120.72 35.61
(288,490)
168.72 182.77 98.42 0 0
MSM MalaySia HoldingS BerHad | annual report 201946
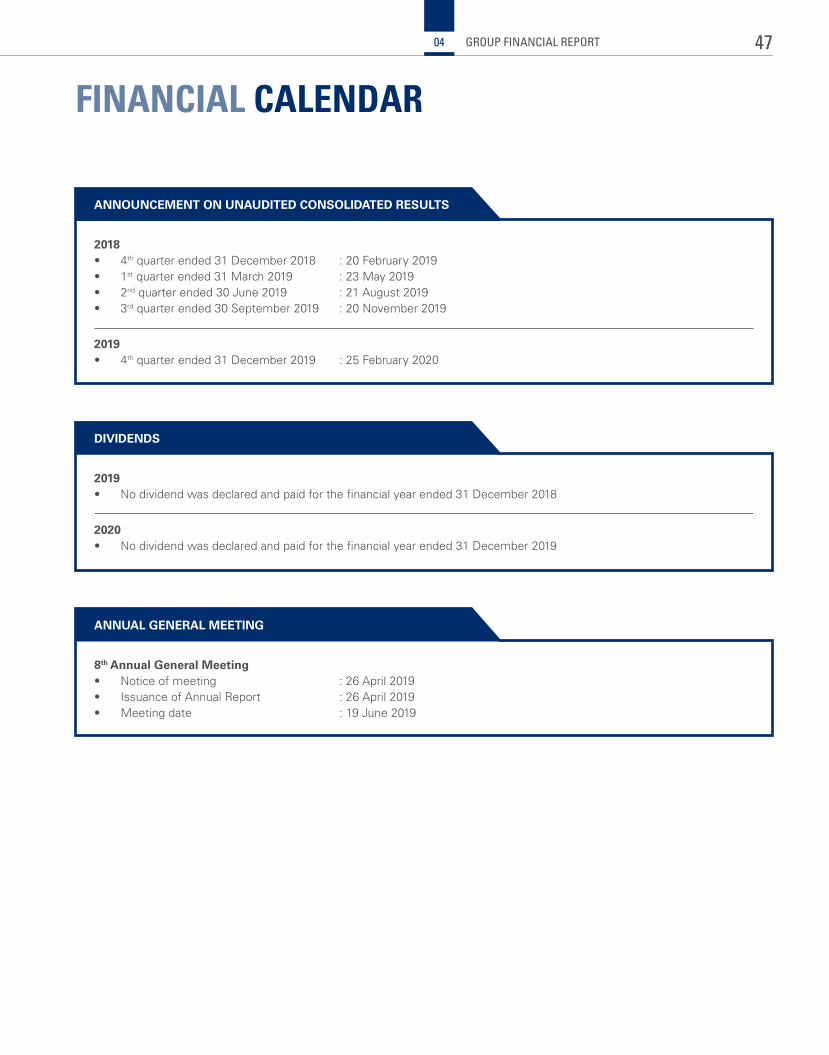
FINANCIAL CALENDAR
ANNOUNCEMENT ON UNAUDITED CONSOLIDATED RESULTS
DIVIDENDS
ANNUAL GENERAL MEETING
2018• 4th quarter ended 31 December 2018 : 20 February 2019• 1st quarter ended 31 March 2019 : 23 May 2019• 2nd quarter ended 30 June 2019 : 21 August 2019• 3rd quarter ended 30 September 2019 : 20 November 2019
2019• 4th quarter ended 31 December 2019 : 25 February 2020
2019• No dividend was declared and paid for the financial year ended 31 December 2018
2020 • No dividend was declared and paid for the financial year ended 31 December 2019
8th Annual General Meeting• Notice of meeting : 26 April 2019• Issuance of Annual Report : 26 April 2019• Meeting date : 19 June 2019
4704 GROUP FINANCIAL REPORT
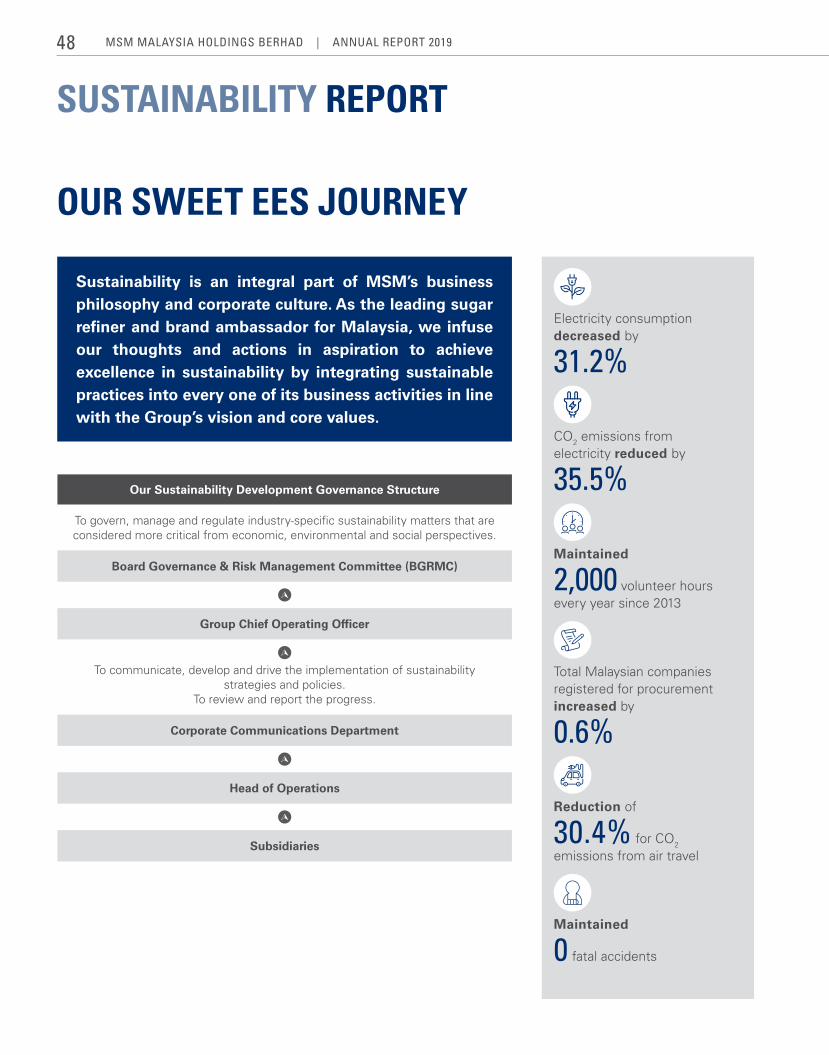
SUSTAINABILITY REPORT
To communicate, develop and drive the implementation of sustainability strategies and policies.
To review and report the progress.
OUR SWEET EES JOURNEY
Sustainability is an integral part of MSM’s business philosophy and corporate culture. As the leading sugar refiner and brand ambassador for Malaysia, we infuse our thoughts and actions in aspiration to achieve excellence in sustainability by integrating sustainable practices into every one of its business activities in line with the Group’s vision and core values.
Our Sustainability Development Governance Structure
Board Governance & Risk Management Committee (BGRMC)
Group Chief Operating Officer
Corporate Communications Department
Head of Operations
Subsidiaries
To govern, manage and regulate industry-specific sustainability matters that are considered more critical from economic, environmental and social perspectives.
Electricity consumption decreased by
31.2%
CO2 emissions from electricity reduced by
35.5%
Maintained
2,000 volunteer hours every year since 2013
Total Malaysian companies registered for procurement increased by
0.6%
Reduction of
30.4% for CO2 emissions from air travel
Maintained
0 fatal accidents
MSM MalaySia HoldingS BerHad | annual report 201948
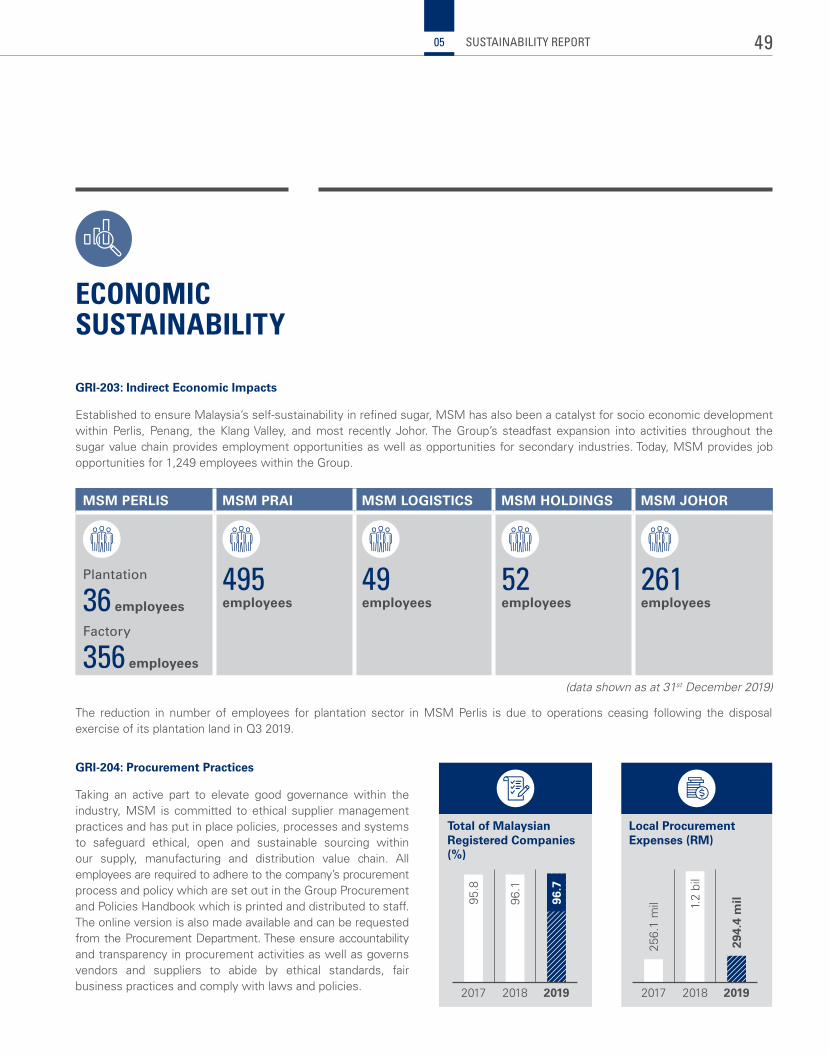
ECONOMIC SUSTAINABILITY
MSM PERLIS MSM PRAI MSM LOGISTICS MSM HOLDINGS MSM JOHOR
Plantation
36 employees
Factory
356 employees
495 employees
49 employees
52 employees
261 employees
GRI-204: Procurement Practices
Taking an active part to elevate good governance within the industry, MSM is committed to ethical supplier management practices and has put in place policies, processes and systems to safeguard ethical, open and sustainable sourcing within our supply, manufacturing and distribution value chain. All employees are required to adhere to the company’s procurement process and policy which are set out in the Group Procurement and Policies Handbook which is printed and distributed to staff. The online version is also made available and can be requested from the Procurement Department. These ensure accountability and transparency in procurement activities as well as governs vendors and suppliers to abide by ethical standards, fair business practices and comply with laws and policies.
Total of Malaysian Registered Companies (%)
Local Procurement Expenses (RM)
2017 2018 2019 2017 2018 2019
95.8
96.1
96.7
256.
1 m
il 1.2
bil
294.
4 m
il
GRI-203: Indirect Economic Impacts
Established to ensure Malaysia’s self-sustainability in refined sugar, MSM has also been a catalyst for socio economic development within Perlis, Penang, the Klang Valley, and most recently Johor. The Group’s steadfast expansion into activities throughout the sugar value chain provides employment opportunities as well as opportunities for secondary industries. Today, MSM provides job opportunities for 1,249 employees within the Group.
The reduction in number of employees for plantation sector in MSM Perlis is due to operations ceasing following the disposal exercise of its plantation land in Q3 2019.
(data shown as at 31st December 2019)
49SUSTAINABILITY REPORT05
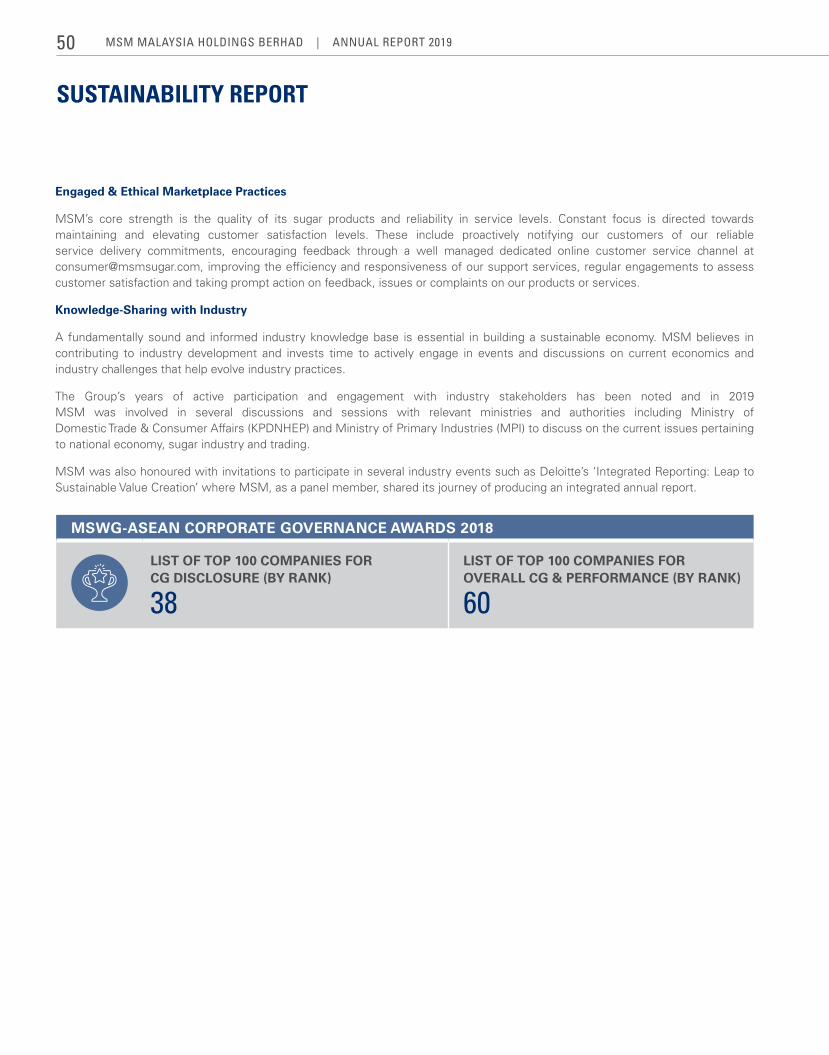
SUSTAINABILITY REPORT
Engaged & Ethical Marketplace Practices
MSM’s core strength is the quality of its sugar products and reliability in service levels. Constant focus is directed towards maintaining and elevating customer satisfaction levels. These include proactively notifying our customers of our reliable service delivery commitments, encouraging feedback through a well managed dedicated online customer service channel at [email protected], improving the efficiency and responsiveness of our support services, regular engagements to assess customer satisfaction and taking prompt action on feedback, issues or complaints on our products or services.
Knowledge-Sharing with Industry
A fundamentally sound and informed industry knowledge base is essential in building a sustainable economy. MSM believes in contributing to industry development and invests time to actively engage in events and discussions on current economics and industry challenges that help evolve industry practices.
The Group’s years of active participation and engagement with industry stakeholders has been noted and in 2019 MSM was involved in several discussions and sessions with relevant ministries and authorities including Ministry of Domestic Trade & Consumer Affairs (KPDNHEP) and Ministry of Primary Industries (MPI) to discuss on the current issues pertaining to national economy, sugar industry and trading.
MSM was also honoured with invitations to participate in several industry events such as Deloitte’s ‘Integrated Reporting: Leap to Sustainable Value Creation’ where MSM, as a panel member, shared its journey of producing an integrated annual report.
MSWG-ASEAN CORPORATE GOVERNANCE AWARDS 2018
LIST OF TOP 100 COMPANIES FOR CG DISCLOSURE (BY RANK)
38
LIST OF TOP 100 COMPANIES FOR OVERALL CG & PERFORMANCE (BY RANK)
60
MSM MalaySia HoldingS BerHad | annual report 201950
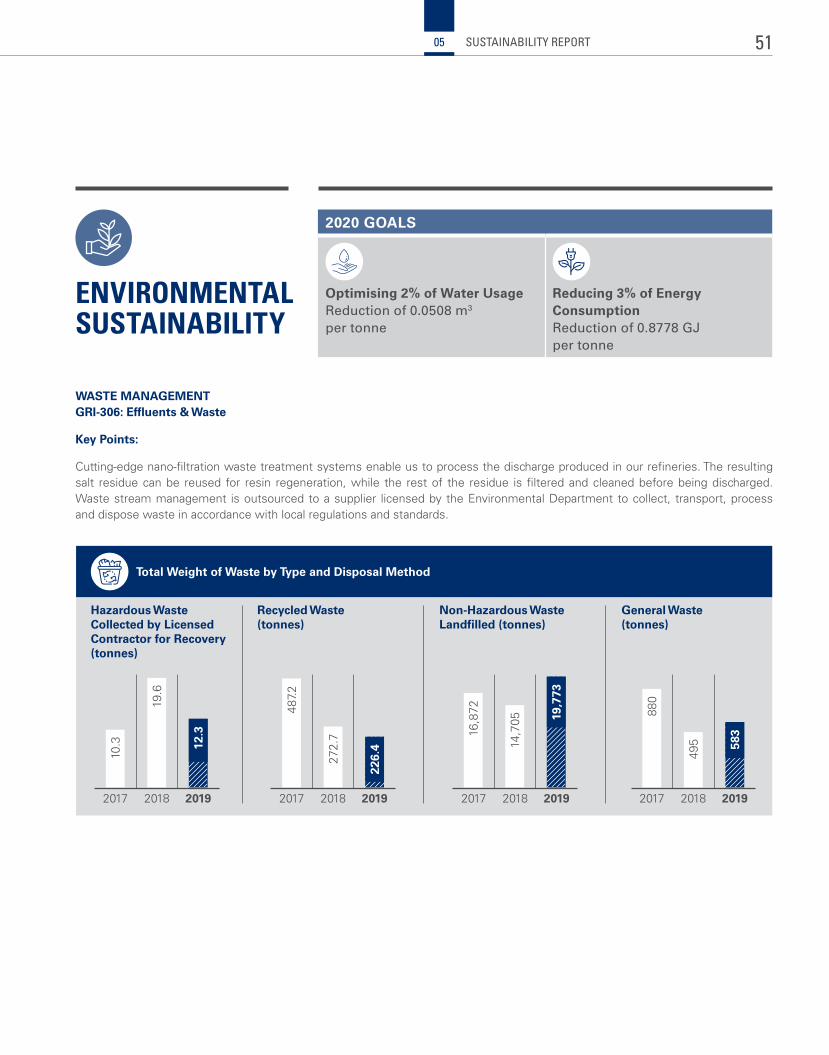
ENVIRONMENTAL SUSTAINABILITY
WASTE MANAGEMENTGRI-306: Effluents & Waste
Key Points:
Cutting-edge nano-filtration waste treatment systems enable us to process the discharge produced in our refineries. The resulting salt residue can be reused for resin regeneration, while the rest of the residue is filtered and cleaned before being discharged. Waste stream management is outsourced to a supplier licensed by the Environmental Department to collect, transport, process and dispose waste in accordance with local regulations and standards.
2020 GOALS
Optimising 2% of Water UsageReduction of 0.0508 m3 per tonne
Reducing 3% of Energy ConsumptionReduction of 0.8778 GJ per tonne
Total Weight of Waste by Type and Disposal Method
Hazardous Waste Collected by Licensed Contractor for Recovery (tonnes)
Recycled Waste (tonnes)
Non-Hazardous Waste Landfilled (tonnes)
General Waste (tonnes)
2017 2018 2019 2017 2018 2019 2017 2018 2019 2017 2018 2019
10.3
19.6
12.3
487.
2
272.
7
226.
4
16,8
72
14,7
05 19,7
73
880
495 58
3
51SUSTAINABILITY REPORT05
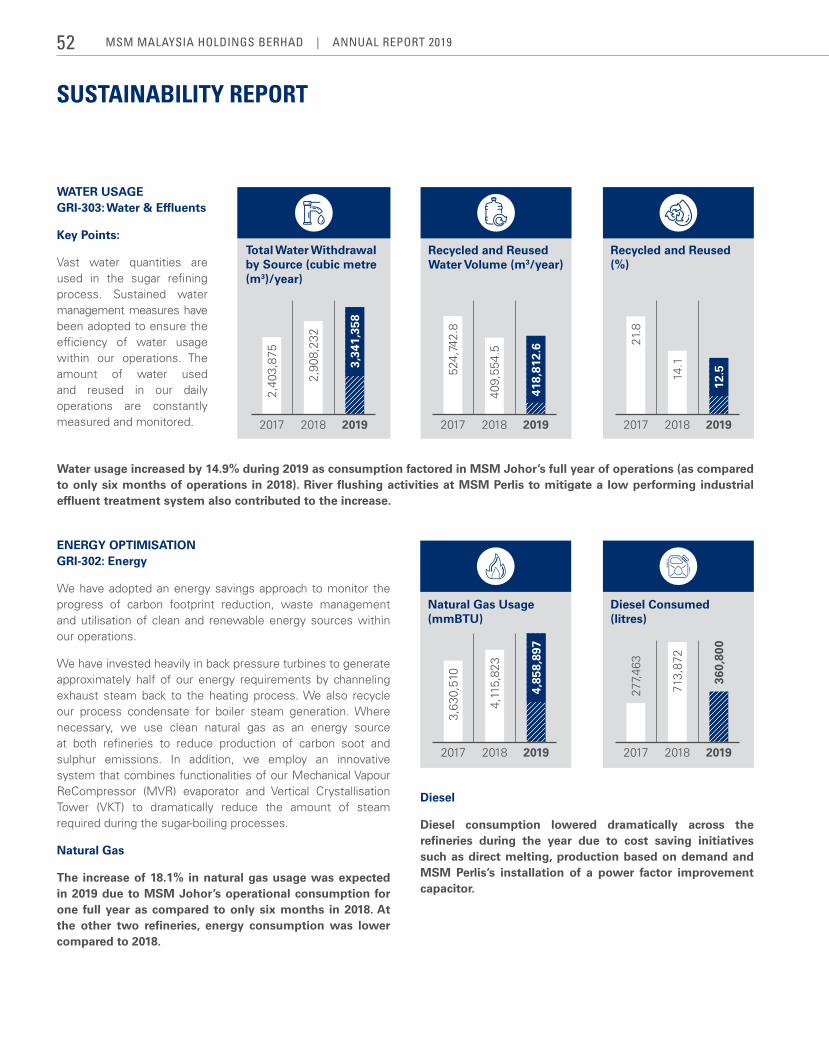
SUSTAINABILITY REPORT
Recycled and Reused (%)
Natural Gas Usage (mmBTU)
Diesel Consumed (litres)
WATER USAGEGRI-303: Water & Effluents
Key Points:
Vast water quantities are used in the sugar refining process. Sustained water management measures have been adopted to ensure the efficiency of water usage within our operations. The amount of water used and reused in our daily operations are constantly measured and monitored.
ENERGY OPTIMISATIONGRI-302: Energy
We have adopted an energy savings approach to monitor the progress of carbon footprint reduction, waste management and utilisation of clean and renewable energy sources within our operations.
We have invested heavily in back pressure turbines to generate approximately half of our energy requirements by channeling exhaust steam back to the heating process. We also recycle our process condensate for boiler steam generation. Where necessary, we use clean natural gas as an energy source at both refineries to reduce production of carbon soot and sulphur emissions. In addition, we employ an innovative system that combines functionalities of our Mechanical Vapour ReCompressor (MVR) evaporator and Vertical Crystallisation Tower (VKT) to dramatically reduce the amount of steam required during the sugar-boiling processes.
Natural Gas
The increase of 18.1% in natural gas usage was expected in 2019 due to MSM Johor’s operational consumption for one full year as compared to only six months in 2018. At the other two refineries, energy consumption was lower compared to 2018.
Total Water Withdrawal by Source (cubic metre (m3)/year)
Recycled and Reused Water Volume (m3/year)
2017 2018 2019 2017 2018 2019 2017 2018 2019
2017 2018 2019 2017 2018 2019
2,40
3,87
5
2,90
8,23
2
3,34
1,35
8
524,
742.
8
409,
554.
5
418,
812.
6 21.8
3,63
0,51
0
277,
463
14.1
4,11
5,82
3
713,
872
12.5
4,85
8,89
7
360,
800
Diesel
Diesel consumption lowered dramatically across the refineries during the year due to cost saving initiatives such as direct melting, production based on demand and MSM Perlis’s installation of a power factor improvement capacitor.
Water usage increased by 14.9% during 2019 as consumption factored in MSM Johor’s full year of operations (as compared to only six months of operations in 2018). River flushing activities at MSM Perlis to mitigate a low performing industrial effluent treatment system also contributed to the increase.
MSM MalaySia HoldingS BerHad | annual report 201952
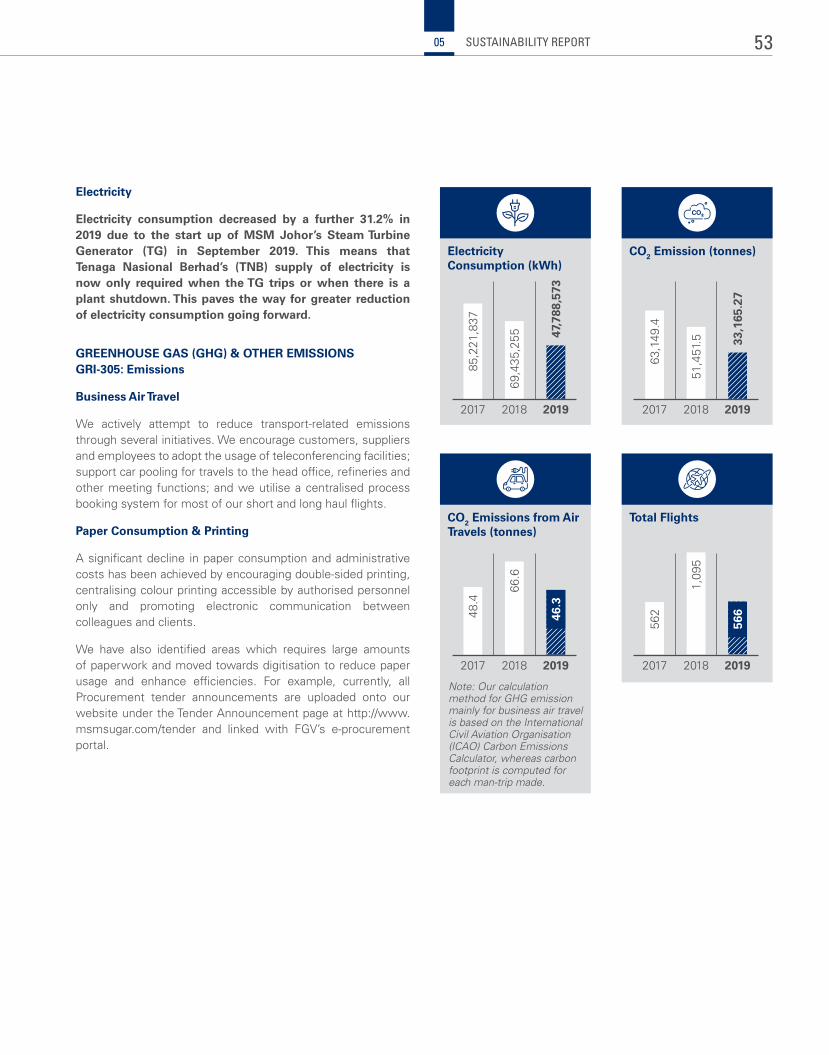
Electricity Consumption (kWh)
CO2 Emission (tonnes)
CO2 Emissions from Air Travels (tonnes)
Total Flights
2017 2018 2019 2017 2018 2019
2017 2018 2019 2017 2018 2019
85,2
21,8
37
63,1
49.4
48.4
562
69,4
35,2
55
51,4
51.5
66.6
1,09
5
47,7
88,5
73
33,1
65.2
7
46.3
566
Electricity
Electricity consumption decreased by a further 31.2% in 2019 due to the start up of MSM Johor’s Steam Turbine Generator (TG) in September 2019. This means that Tenaga Nasional Berhad’s (TNB) supply of electricity is now only required when the TG trips or when there is a plant shutdown. This paves the way for greater reduction of electricity consumption going forward.
GREENHOUSE GAS (GHG) & OTHER EMISSIONSGRI-305: Emissions
Business Air Travel
We actively attempt to reduce transport-related emissions through several initiatives. We encourage customers, suppliers and employees to adopt the usage of teleconferencing facilities; support car pooling for travels to the head office, refineries and other meeting functions; and we utilise a centralised process booking system for most of our short and long haul flights.
Paper Consumption & Printing
A significant decline in paper consumption and administrative costs has been achieved by encouraging double-sided printing, centralising colour printing accessible by authorised personnel only and promoting electronic communication between colleagues and clients.
We have also identified areas which requires large amounts of paperwork and moved towards digitisation to reduce paper usage and enhance efficiencies. For example, currently, all Procurement tender announcements are uploaded onto our website under the Tender Announcement page at http://www.msmsugar.com/tender and linked with FGV’s e-procurement portal.
Note: Our calculation method for GHG emission mainly for business air travel is based on the International Civil Aviation Organisation (ICAO) Carbon Emissions Calculator, whereas carbon footprint is computed for each man-trip made.
53SUSTAINABILITY REPORT05
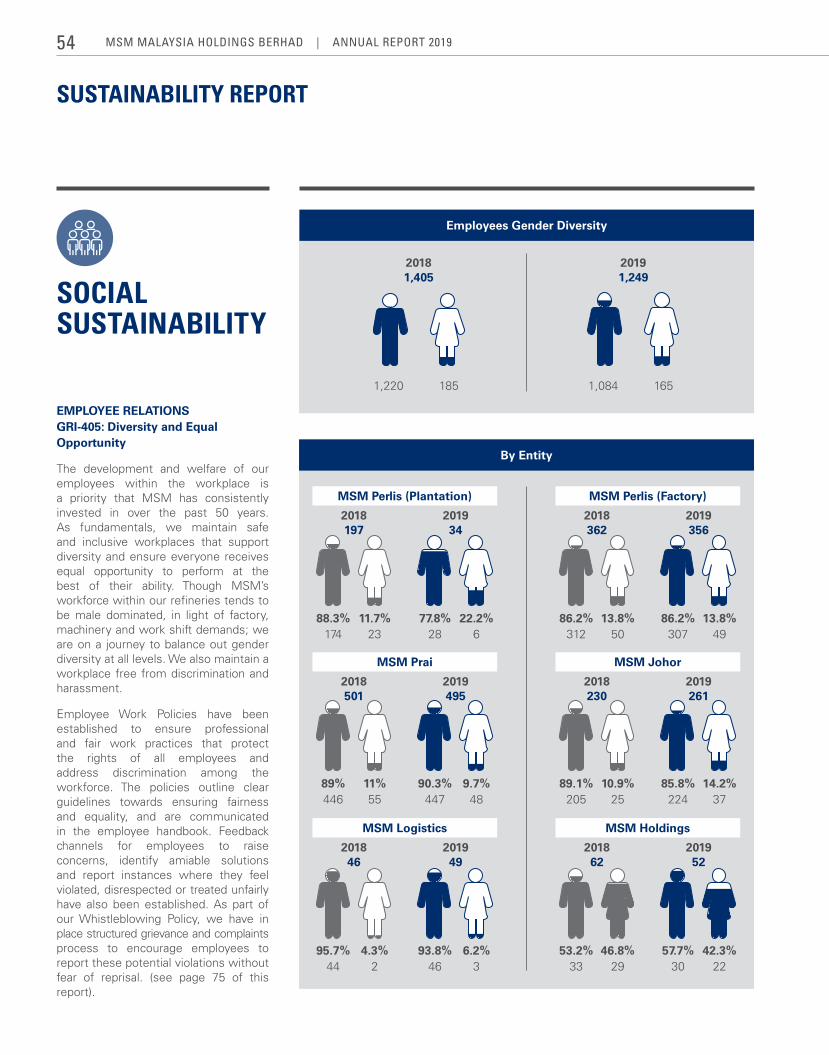
SUSTAINABILITY REPORT
EMPLOYEE RELATIONSGRI-405: Diversity and Equal Opportunity
The development and welfare of our employees within the workplace is a priority that MSM has consistently invested in over the past 50 years. As fundamentals, we maintain safe and inclusive workplaces that support diversity and ensure everyone receives equal opportunity to perform at the best of their ability. Though MSM’s workforce within our refineries tends to be male dominated, in light of factory, machinery and work shift demands; we are on a journey to balance out gender diversity at all levels. We also maintain a workplace free from discrimination and harassment.
Employee Work Policies have been established to ensure professional and fair work practices that protect the rights of all employees and address discrimination among the workforce. The policies outline clear guidelines towards ensuring fairness and equality, and are communicated in the employee handbook. Feedback channels for employees to raise concerns, identify amiable solutions and report instances where they feel violated, disrespected or treated unfairly have also been established. As part of our Whistleblowing Policy, we have in place structured grievance and complaints process to encourage employees to report these potential violations without fear of reprisal. (see page 75 of this report).
SOCIAL SUSTAINABILITY
By Entity
MSM Perlis (Plantation)
2018197
201934
MSM Perlis (Factory)
2018362
2019356
MSM Prai
2018501
2019495
MSM Johor
2018230
2019261
MSM Logistics
201846
201949
MSM Holdings
201862
201952
88.3% 11.7% 77.8% 22.2%174 23 28 6
Employees Gender Diversity
20181,405
20191,249
1,220 185 1,084 165
89% 11% 90.3% 9.7%446 55 447 48
95.7% 4.3% 93.8% 6.2%44 2 46 3
86.2% 13.8% 86.2% 13.8%312 50 307 49
89.1% 10.9% 85.8% 14.2%205 25 224 37
53.2% 46.8% 57.7% 42.3%33 29 30 22
MSM MalaySia HoldingS BerHad | annual report 201954
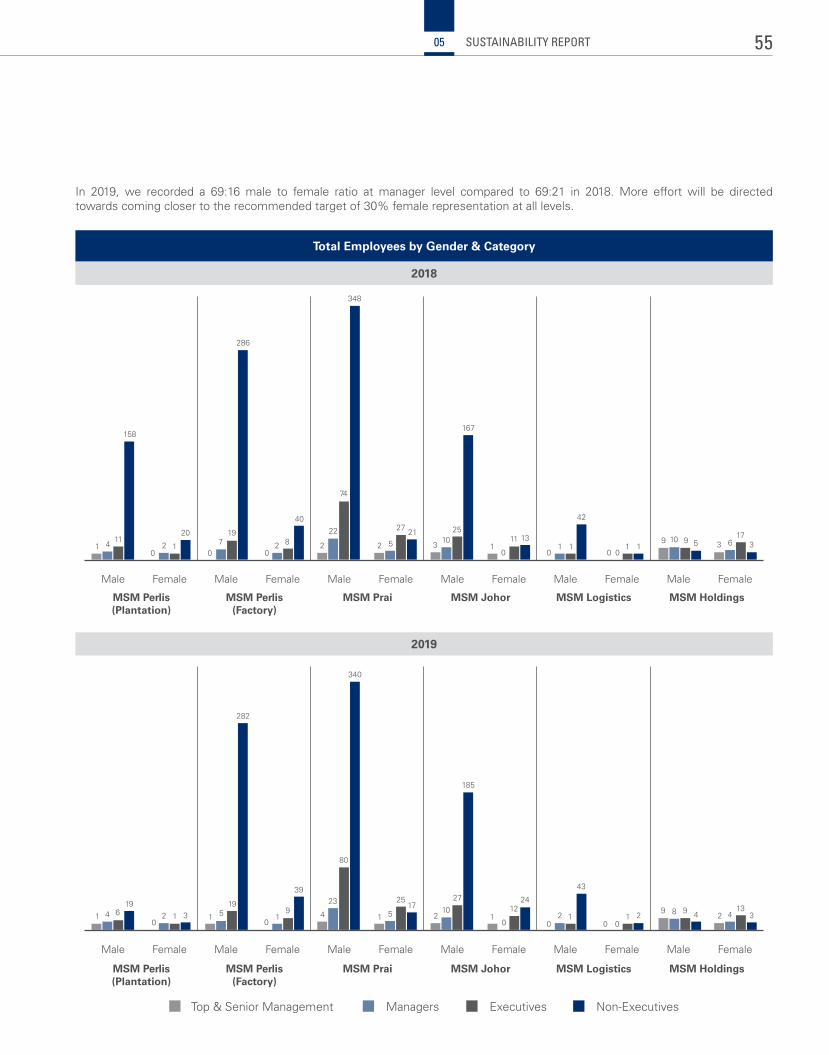
Total Employees by Gender & Category
Male Female Male Female Male Female Male Female Male Female Male Female
Male Female Male Female Male Female Male Female Male Female Male Female
Top & Senior Management Managers Executives Non-Executives
MSM Perlis (Plantation)
MSM Perlis (Factory)
MSM Prai MSM Johor MSM Logistics MSM Holdings
MSM Perlis (Plantation)
MSM Perlis (Factory)
MSM Prai MSM Johor MSM Logistics MSM Holdings
2018
2019
1
10
10
4
23
80
1 1 2 10
1224
0 0 02 1 1
9 8 9 4 2 413
32
43
10
27
185
5
2517
9
39
519
282
340
2 1 34 619
0 0 02 2 2 5
27 21
3 10 0 0 0
1 19 10 9 5 3 36
171 1
42
11 131025
167
22
74
348
8
40
719
286
2 1
204
11
158
In 2019, we recorded a 69:16 male to female ratio at manager level compared to 69:21 in 2018. More effort will be directed towards coming closer to the recommended target of 30% female representation at all levels.
55SUSTAINABILITY REPORT05
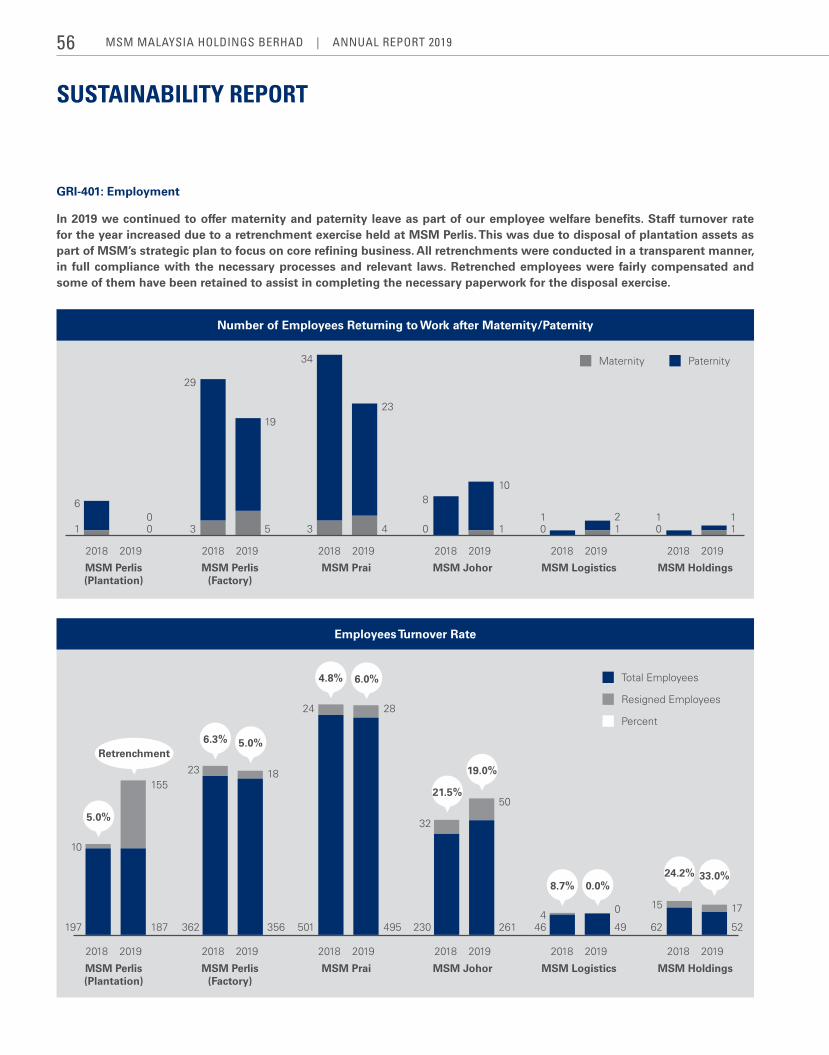
SUSTAINABILITY REPORT
Number of Employees Returning to Work after Maternity/Paternity
GRI-401: Employment
In 2019 we continued to offer maternity and paternity leave as part of our employee welfare benefits. Staff turnover rate for the year increased due to a retrenchment exercise held at MSM Perlis. This was due to disposal of plantation assets as part of MSM’s strategic plan to focus on core refining business. All retrenchments were conducted in a transparent manner, in full compliance with the necessary processes and relevant laws. Retrenched employees were fairly compensated and some of them have been retained to assist in completing the necessary paperwork for the disposal exercise.
Maternity Paternity
MSM Perlis (Plantation)
MSM Perlis (Factory)
MSM Prai MSM Johor MSM Logistics MSM Holdings
01 0 01 1
03 30
6 8
29
34
5 4 1 12
11
1923
10
2018 2019 2018 2019 2018 2019 2018 2019 2018 20192018 2019
Employees Turnover Rate
MSM Perlis (Plantation)
MSM Perlis (Factory)
MSM Prai MSM Johor MSM Logistics MSM Holdings
187 356 495 261 49 52197 362 230 46 62501
15518
28
50
0 17
10
23
32
415
24
Retrenchment
5.0%
6.3%
4.8%
21.5%
19.0%
8.7% 0.0%24.2% 33.0%
6.0%
5.0%
Total Employees
Resigned Employees
Percent
2018 2019 2018 2019 2018 2019 2018 2019 2018 20192018 2019
MSM MalaySia HoldingS BerHad | annual report 201956
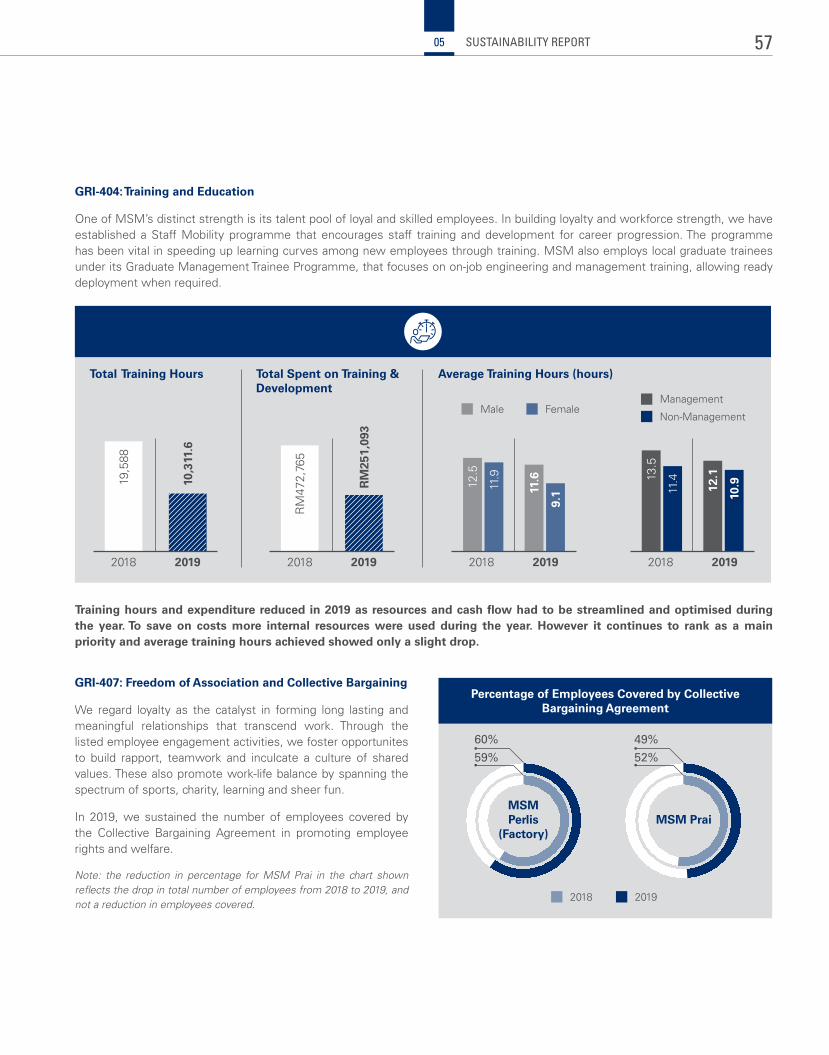
GRI-404: Training and Education
One of MSM’s distinct strength is its talent pool of loyal and skilled employees. In building loyalty and workforce strength, we have established a Staff Mobility programme that encourages staff training and development for career progression. The programme has been vital in speeding up learning curves among new employees through training. MSM also employs local graduate trainees under its Graduate Management Trainee Programme, that focuses on on-job engineering and management training, allowing ready deployment when required.
Training hours and expenditure reduced in 2019 as resources and cash flow had to be streamlined and optimised during the year. To save on costs more internal resources were used during the year. However it continues to rank as a main priority and average training hours achieved showed only a slight drop.
Total Training Hours Total Spent on Training & Development
Average Training Hours (hours)
2018 2019 2018 2019 2018 2019 2018 2019
19,5
88
RM
472,
765
10,3
11.6
RM
251,
093
11.6
12.1
12.5 13
.5
9.1 10
.911.9
11.4
Male Female
2018 2019
Management
Non-Management
GRI-407: Freedom of Association and Collective Bargaining
We regard loyalty as the catalyst in forming long lasting and meaningful relationships that transcend work. Through the listed employee engagement activities, we foster opportunites to build rapport, teamwork and inculcate a culture of shared values. These also promote work-life balance by spanning the spectrum of sports, charity, learning and sheer fun.
In 2019, we sustained the number of employees covered by the Collective Bargaining Agreement in promoting employee rights and welfare.
Note: the reduction in percentage for MSM Prai in the chart shown reflects the drop in total number of employees from 2018 to 2019, and not a reduction in employees covered.
MSM Prai
Percentage of Employees Covered by Collective Bargaining Agreement
MSM Perlis
(Factory)
60% 49%
59% 52%
57SUSTAINABILITY REPORT05
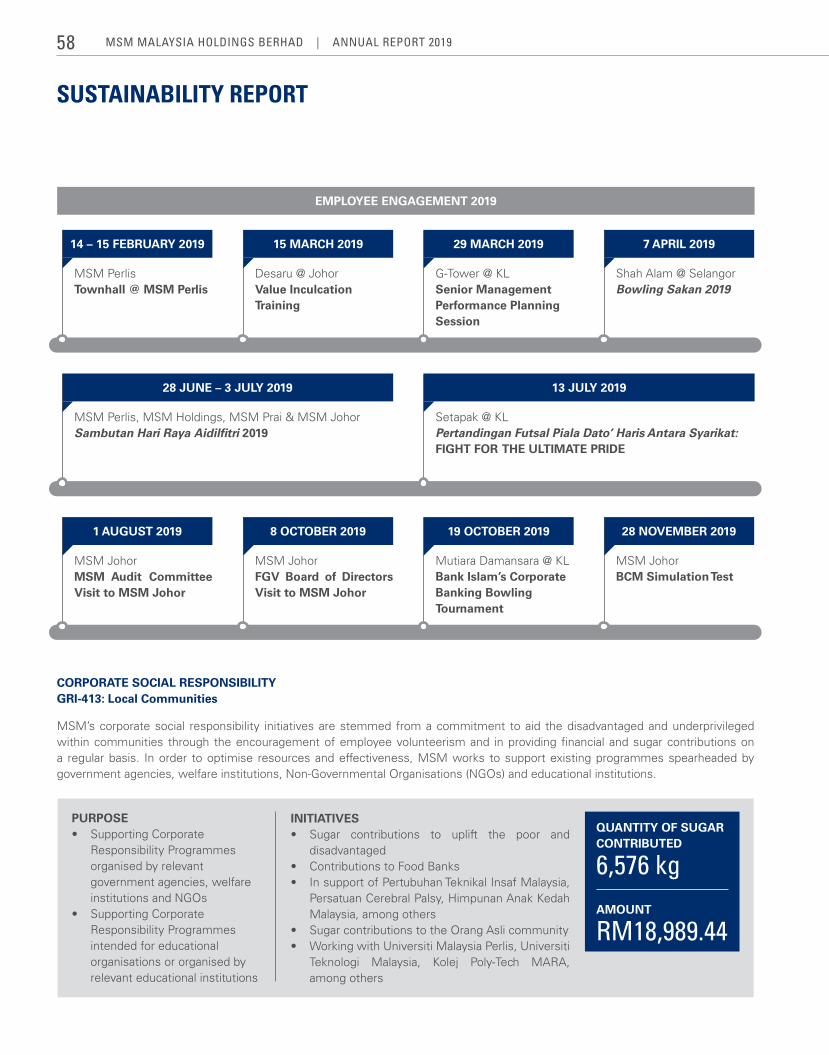
SUSTAINABILITY REPORT
EMPLOYEE ENGAGEMENT 2019
CORPORATE SOCIAL RESPONSIBILITY GRI-413: Local Communities
MSM’s corporate social responsibility initiatives are stemmed from a commitment to aid the disadvantaged and underprivileged within communities through the encouragement of employee volunteerism and in providing financial and sugar contributions on a regular basis. In order to optimise resources and effectiveness, MSM works to support existing programmes spearheaded by government agencies, welfare institutions, Non-Governmental Organisations (NGOs) and educational institutions.
PURPOSE• Supporting Corporate
Responsibility Programmes organised by relevant government agencies, welfare institutions and NGOs
• Supporting Corporate Responsibility Programmes intended for educational organisations or organised by relevant educational institutions
INITIATIVES• Sugar contributions to uplift the poor and
disadvantaged• Contributions to Food Banks• In support of Pertubuhan Teknikal Insaf Malaysia,
Persatuan Cerebral Palsy, Himpunan Anak Kedah Malaysia, among others
• Sugar contributions to the Orang Asli community• Working with Universiti Malaysia Perlis, Universiti
Teknologi Malaysia, Kolej Poly-Tech MARA, among others
qUANTITY OF SUGAR CONTRIBUTED
6,576 kgAMOUNT
RM18,989.44
MSM PerlisTownhall @ MSM Perlis
MSM Perlis, MSM Holdings, MSM Prai & MSM JohorSambutan Hari Raya Aidilfitri 2019
MSM JohorMSM Audit Committee Visit to MSM Johor
Desaru @ JohorValue Inculcation Training
MSM JohorFGV Board of Directors Visit to MSM Johor
G-Tower @ KLSenior Management Performance Planning Session
Setapak @ KLPertandingan Futsal Piala Dato’ Haris Antara Syarikat: FIGHT FOR THE ULTIMATE PRIDE
Mutiara Damansara @ KLBank Islam’s Corporate Banking Bowling Tournament
Shah Alam @ SelangorBowling Sakan 2019
MSM JohorBCM Simulation Test
14 – 15 FEBRUARY 2019
28 JUNE – 3 JULY 2019
1 AUGUST 2019
15 MARCH 2019
8 OCTOBER 2019
29 MARCH 2019
13 JULY 2019
19 OCTOBER 2019
7 APRIL 2019
28 NOVEMBER 2019
MSM MalaySia HoldingS BerHad | annual report 201958
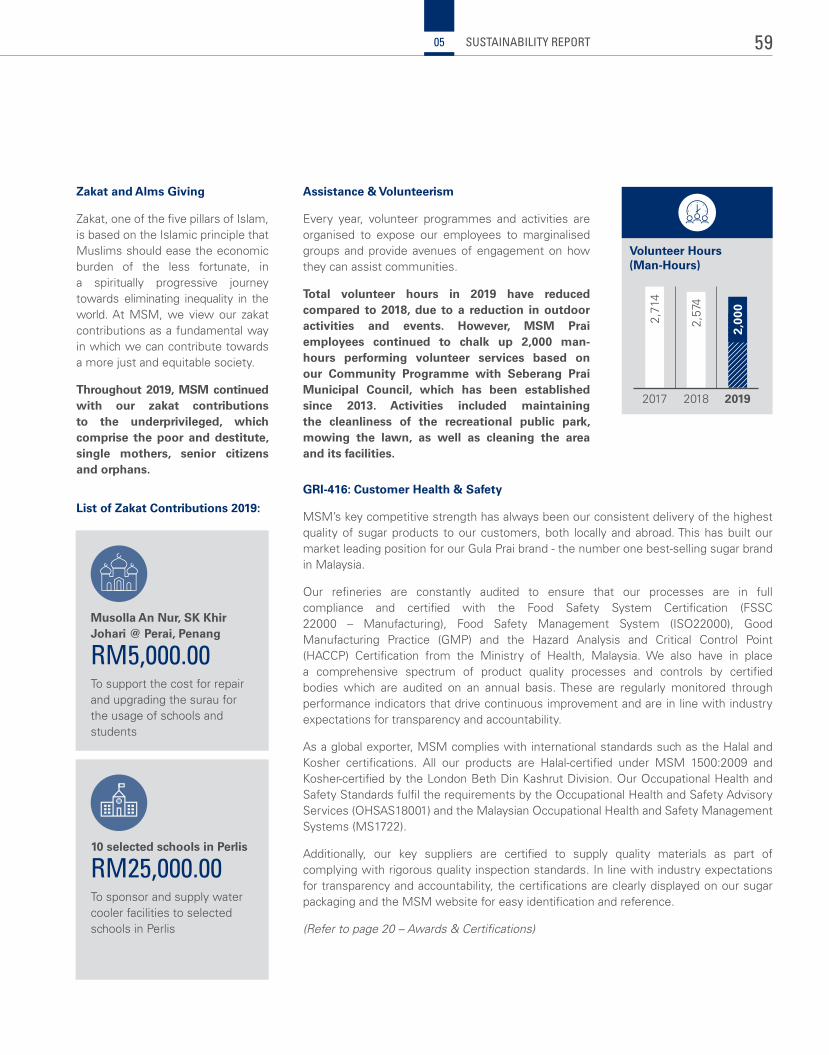
Zakat and Alms Giving
Zakat, one of the five pillars of Islam, is based on the Islamic principle that Muslims should ease the economic burden of the less fortunate, in a spiritually progressive journey towards eliminating inequality in the world. At MSM, we view our zakat contributions as a fundamental way in which we can contribute towards a more just and equitable society.
Throughout 2019, MSM continued with our zakat contributions to the underprivileged, which comprise the poor and destitute, single mothers, senior citizens and orphans.
Musolla An Nur, SK Khir Johari @ Perai, Penang
RM5,000.00To support the cost for repair and upgrading the surau for the usage of schools and students
10 selected schools in Perlis
RM25,000.00To sponsor and supply water cooler facilities to selected schools in Perlis
Assistance & Volunteerism
Every year, volunteer programmes and activities are organised to expose our employees to marginalised groups and provide avenues of engagement on how they can assist communities.
Total volunteer hours in 2019 have reduced compared to 2018, due to a reduction in outdoor activities and events. However, MSM Prai employees continued to chalk up 2,000 man-hours performing volunteer services based on our Community Programme with Seberang Prai Municipal Council, which has been established since 2013. Activities included maintaining the cleanliness of the recreational public park, mowing the lawn, as well as cleaning the area and its facilities.
GRI-416: Customer Health & Safety
MSM’s key competitive strength has always been our consistent delivery of the highest quality of sugar products to our customers, both locally and abroad. This has built our market leading position for our Gula Prai brand - the number one best-selling sugar brand in Malaysia.
Our refineries are constantly audited to ensure that our processes are in full compliance and certified with the Food Safety System Certification (FSSC 22000 – Manufacturing), Food Safety Management System (ISO22000), Good Manufacturing Practice (GMP) and the Hazard Analysis and Critical Control Point (HACCP) Certification from the Ministry of Health, Malaysia. We also have in place a comprehensive spectrum of product quality processes and controls by certified bodies which are audited on an annual basis. These are regularly monitored through performance indicators that drive continuous improvement and are in line with industry expectations for transparency and accountability.
As a global exporter, MSM complies with international standards such as the Halal and Kosher certifications. All our products are Halal-certified under MSM 1500:2009 and Kosher-certified by the London Beth Din Kashrut Division. Our Occupational Health and Safety Standards fulfil the requirements by the Occupational Health and Safety Advisory Services (OHSAS18001) and the Malaysian Occupational Health and Safety Management Systems (MS1722).
Additionally, our key suppliers are certified to supply quality materials as part of complying with rigorous quality inspection standards. In line with industry expectations for transparency and accountability, the certifications are clearly displayed on our sugar packaging and the MSM website for easy identification and reference.
(Refer to page 20 – Awards & Certifications)
Volunteer Hours (Man-Hours)
2017 2018 2019
2,71
4
2,57
4
2,00
0
List of Zakat Contributions 2019:
59SUSTAINABILITY REPORT05
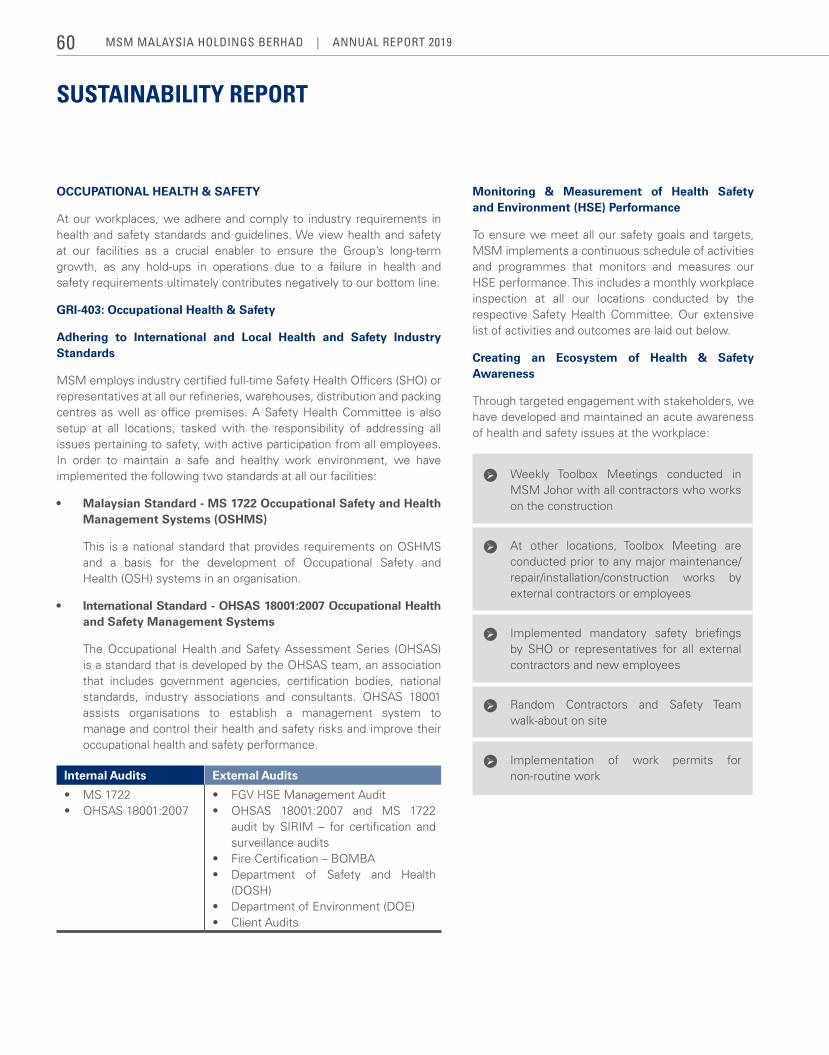
SUSTAINABILITY REPORT
OCCUPATIONAL HEALTH & SAFETY
At our workplaces, we adhere and comply to industry requirements in health and safety standards and guidelines. We view health and safety at our facilities as a crucial enabler to ensure the Group’s long-term growth, as any hold-ups in operations due to a failure in health and safety requirements ultimately contributes negatively to our bottom line.
GRI-403: Occupational Health & Safety
Adhering to International and Local Health and Safety Industry Standards
MSM employs industry certified full-time Safety Health Officers (SHO) or representatives at all our refineries, warehouses, distribution and packing centres as well as office premises. A Safety Health Committee is also setup at all locations, tasked with the responsibility of addressing all issues pertaining to safety, with active participation from all employees. In order to maintain a safe and healthy work environment, we have implemented the following two standards at all our facilities:
• MalaysianStandard-MS1722OccupationalSafetyandHealthManagement Systems (OSHMS)
This is a national standard that provides requirements on OSHMS and a basis for the development of Occupational Safety and Health (OSH) systems in an organisation.
• InternationalStandard-OHSAS18001:2007OccupationalHealth and Safety Management Systems
The Occupational Health and Safety Assessment Series (OHSAS) is a standard that is developed by the OHSAS team, an association that includes government agencies, certification bodies, national standards, industry associations and consultants. OHSAS 18001 assists organisations to establish a management system to manage and control their health and safety risks and improve their occupational health and safety performance.
Internal Audits External Audits
• MS 1722• OHSAS 18001:2007
• FGV HSE Management Audit• OHSAS 18001:2007 and MS 1722
audit by SIRIM – for certification and surveillance audits
• Fire Certification – BOMBA• Department of Safety and Health
(DOSH) • Department of Environment (DOE)• Client Audits
Monitoring & Measurement of Health Safety and Environment (HSE) Performance
To ensure we meet all our safety goals and targets, MSM implements a continuous schedule of activities and programmes that monitors and measures our HSE performance. This includes a monthly workplace inspection at all our locations conducted by the respective Safety Health Committee. Our extensive list of activities and outcomes are laid out below.
Creating an Ecosystem of Health & Safety Awareness
Through targeted engagement with stakeholders, we have developed and maintained an acute awareness of health and safety issues at the workplace:
Weekly Toolbox Meetings conducted in MSM Johor with all contractors who works on the construction
At other locations, Toolbox Meeting are conducted prior to any major maintenance/ repair/installation/construction works by external contractors or employees
Implemented mandatory safety briefings by SHO or representatives for all external contractors and new employees
Random Contractors and Safety Team walk-about on site
Implementation of work permits for non-routine work
MSM MalaySia HoldingS BerHad | annual report 201960
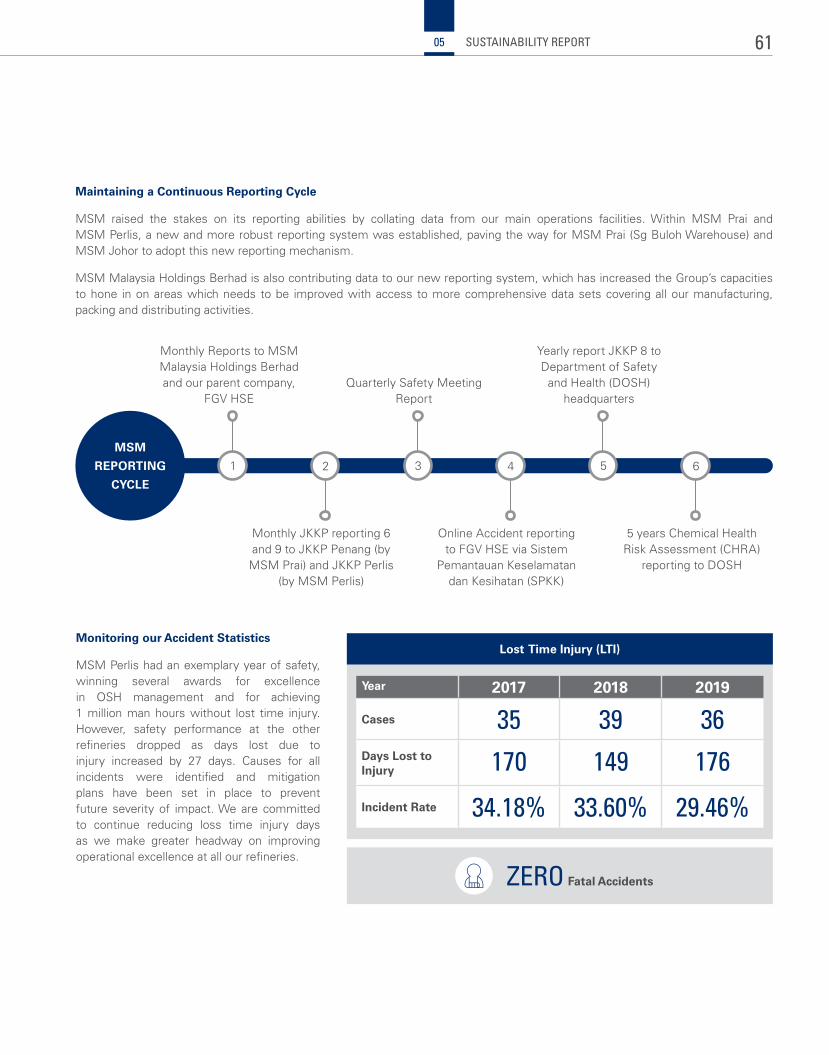
Monitoring our Accident Statistics
MSM Perlis had an exemplary year of safety, winning several awards for excellence in OSH management and for achieving 1 million man hours without lost time injury. However, safety performance at the other refineries dropped as days lost due to injury increased by 27 days. Causes for all incidents were identified and mitigation plans have been set in place to prevent future severity of impact. We are committed to continue reducing loss time injury days as we make greater headway on improving operational excellence at all our refineries.
MSM
REPORTING
CYCLE
Monthly Reports to MSM Malaysia Holdings Berhad and our parent company,
FGV HSEQuarterly Safety Meeting
Report
Yearly report JKKP 8 to Department of Safety
and Health (DOSH) headquarters
Monthly JKKP reporting 6 and 9 to JKKP Penang (by MSM Prai) and JKKP Perlis
(by MSM Perlis)
Online Accident reporting to FGV HSE via Sistem
Pemantauan Keselamatan dan Kesihatan (SPKK)
5 years Chemical Health Risk Assessment (CHRA)
reporting to DOSH
1 3 52 4 6
Lost Time Injury (LTI)
Year 2017 2018 2019
Cases 35 39 36Days Lost to Injury 170 149 176Incident Rate 34.18% 33.60% 29.46%
Maintaining a Continuous Reporting Cycle
MSM raised the stakes on its reporting abilities by collating data from our main operations facilities. Within MSM Prai and MSM Perlis, a new and more robust reporting system was established, paving the way for MSM Prai (Sg Buloh Warehouse) and MSM Johor to adopt this new reporting mechanism.
MSM Malaysia Holdings Berhad is also contributing data to our new reporting system, which has increased the Group’s capacities to hone in on areas which needs to be improved with access to more comprehensive data sets covering all our manufacturing, packing and distributing activities.
ZERO Fatal Accidents
61SUSTAINABILITY REPORT05
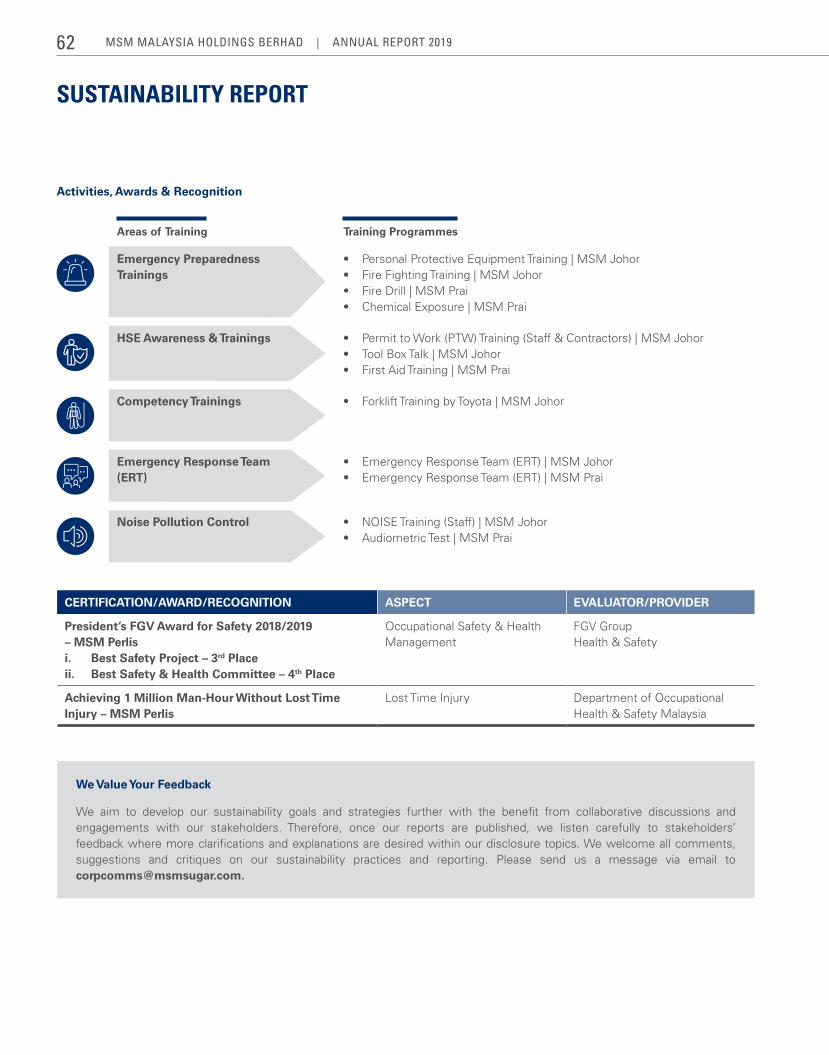
SUSTAINABILITY REPORT
CERTIFICATION/AWARD/RECOGNITION ASPECT EVALUATOR/PROVIDER
President’s FGV Award for Safety 2018/2019 – MSM Perlisi. Best Safety Project – 3rd Placeii. Best Safety & Health Committee – 4th Place
Occupational Safety & Health Management
FGV Group Health & Safety
Achieving 1 Million Man-Hour Without Lost Time Injury – MSM Perlis
Lost Time Injury Department of Occupational Health & Safety Malaysia
We Value Your Feedback
We aim to develop our sustainability goals and strategies further with the benefit from collaborative discussions and engagements with our stakeholders. Therefore, once our reports are published, we listen carefully to stakeholders’ feedback where more clarifications and explanations are desired within our disclosure topics. We welcome all comments, suggestions and critiques on our sustainability practices and reporting. Please send us a message via email to [email protected].
Activities, Awards & Recognition
Areas of Training Training Programmes
Emergency Preparedness Trainings
• Personal Protective Equipment Training | MSM Johor• Fire Fighting Training | MSM Johor• Fire Drill | MSM Prai• Chemical Exposure | MSM Prai
HSE Awareness & Trainings • Permit to Work (PTW) Training (Staff & Contractors) | MSM Johor• Tool Box Talk | MSM Johor• First Aid Training | MSM Prai
Competency Trainings • Forklift Training by Toyota | MSM Johor
Emergency Response Team (ERT)
• Emergency Response Team (ERT) | MSM Johor• Emergency Response Team (ERT) | MSM Prai
Noise Pollution Control • NOISE Training (Staff) | MSM Johor• Audiometric Test | MSM Prai
MSM MalaySia HoldingS BerHad | annual report 201962
PROFILE OF DIRECTORS
Age: 58Gender: Male Nationality: Malaysian
Appointment to the Board:26 September 2017
Length of Tenure as Director:< 3 years
Date of Last Re-election:26 June 2018
Board Meeting Attendance:9/9
Directorship of Public Companies (if any):• Chairman, FGV Holdings
Berhad• Icon Offshore Berhad• Hume Industries Berhad
qualification(s):• A Chartered Accountant by training• Member of the Malaysian Institute of Accountants
Working Experience and Occupation:• Chairman, FGV Holdings Berhad (2017 - present)• Group Managing Director, Malakoff Corporation Berhad
(2016 - 2017)• Chairman, Tradewinds Corporation Berhad (2016 - 2017)• President/Group Managing Director, Tradewinds Corporation
Berhad (2015 - 2016)• Chief Executive Officer, Mass Rapid Transit Corporation
Sdn Bhd (2011 - 2014)• Chairman, Malaysian Palm Oil Association (2007 - 2010)• Sime Darby Group as Business Development Director in Sime
Plantations Sdn Bhd, Managing Director of Tractors Malaysia Holdings Berhad, Sime Darby Group’s Divisional Director for the Heavy Equipment Division for Asia Pacific, covering China, Hong Kong, Malaysia, Singapore and the Philippines, Managing Director, Sime Plantations Sdn Bhd, Sime Darby Group’s Divisional Director for Plantations & Food Division, Sime Darby Bhd, Managing Director, Sime Darby Plantation Sdn Bhd, EVP/Head of Sime Darby’s Plantation & Agri-business Division (2003 - 2010)
• Group Chief Executive, Pernas International Holdings Berhad (2001 - 2002)
• Sime Darby Group serving Sime Tyres International Sdn Bhd as Financial Controller, Sime Conoco Sdn Bhd as Business Development Director and the Group’s Engineering, Oil & Gas Division as Group General Manager (1994 - 2001)
• Head of Internal Audit and Head of Finance, Malaysian Cooperative Insurance Society Ltd (1992 - 1994)
• Internal Audit Manager, British Telecom Plc, United Kingdom (1989 - 1991)
DATUK WIRA AZHAR ABDUL HAMIDChairman, Non-Independent Non-Executive Director
Age: 65Gender: Female Nationality: Malaysian
Appointment to the Board:7 January 2015
Length of Tenure as Director:4 - 6 years
Date of Last Re-election:26 June 2018
Board Meeting Attendance:9/9
Board Committee Attendance:AC: 6/6 BGRMC: 5/5
Directorship of Public Companies (if any): Nil
qualification(s):• Postgraduate Diploma in Accounting, University of Malaya• Bachelor of Economics, Accounting (Hons.), University of
Malaya• Master in Business Administration, University of Cardiff, UK• Member of the Malaysian Institute of Accountants• Honorary Fellow CPA Australia
Working Experience and Occupation:• Independent Non-Executive Director on the Board of IIUM
Holdings Sdn Bhd (2015 - present)• Audit Committee Chairman, IIUM Holdings Sdn Bhd
(2016 - present)• Member of Nomination and Remuneration Committee, IIUM
Holdings Sdn Bhd (2016 - present)• Remedial Grievances and Disciplinary Committee, IIUM
Holdings Sdn Bhd (2016 - present)• Accountant General’s Nominee, Council of Malaysia Institute
of Accountant (MIA) (2011 - 2014)• Deputy Accountant General (Corporate), Accountant General’s
Department Malaysia (2010 - 2014)• Member of the Tender Committee, Percetakan Nasional
Malaysia Berhad (2010 - 2014)• Member of the Nomination and Remuneration Committee,
Percetakan Nasional Malaysia Berhad (2008 - 2014)• Chairman of the Audit Committee, Percetakan Nasional
Malaysia Berhad (2008 - 2014)• Member of the Disciplinary Committee, Percetakan Nasional
Malaysia Berhad (2008 - 2014)• Board Member, Percetakan Nasional Malaysia Berhad
(2007 - 2014)
Membership of Board Committees:• Chairman of the Audit Committee• Member of the Board Governance & Risk Management
Committee
DATO’ ROSINI ABD SAMADIndependent Non-Executive Director
63EFFECTIVE LEADERSHIP06
PROFILE OF DIRECTORS
Age: 48Gender: Male Nationality: Malaysian
Appointment to the Board:23 August 2013
Length of Tenure as Director:4 - 6 years
Date of Last Re-election:15 May 2017
Board Meeting Attendance:9/9
Board Committee Attendance:AC: 6/6 BGRMC: 5/5
Directorship of Public Companies (if any): • Daya Materials Berhad
Age: 57Gender: MaleNationality: Malaysian
Appointment to the Board:13 August 2019
Length of Tenure as Director:< 3 year
Date of Last Re-election:-
Board Meeting Attendance:2/3
Board Committee Attendance:BGRMC: 1/1
Directorship of Public Companies (if any): Nil
qualification(s):• Bachelor of Business Administration, University Utara Malaysia• Bachelor of Law, University of London
Working Experience and Occupation:• Executive Chairman, Daya Materials Berhad (2019 - present)• Director, Tropicana Kajang Hills Sdn Bhd (2018 - present)• Chairman, Tropicana SJII Education Management Sdn Bhd
(2018 - present)• Independent Non-Executive Director, Tropicana Corporation
Berhad (2017 - 2018)• Executive Vice Chairman/Group Chief Executive Officer, Daya
Materials Berhad (2015 - present)• Executive Chairman, Port Klang Free Zone (2008 - 2009)• Director, WWE Holdings Berhad (2004 - 2006)• General Manager, Port Klang Authority (2008 - 2009)• Director, El Medical Systems Sdn Bhd (2001 - 2008)• Director, Latimax Engineering Sdn Bhd (2001 - 2008)• Director, Focus Indera Sdn Bhd (2001 - 2008)• Director, Tripro Engineering Sdn Bhd (2001 - 2008)• Director, Glotel Sdn Bhd (2001 - 2008)
Membership of Board Committee:• Chairman of the Board Governance & Risk Management
Committee• Member of the Audit Committee
qualification(s):• Bachelor in Corporate Communication (Hons.), Universiti
Putra Malaysia (UPM)
Working Experience and Occupation:• Chairman, Koperasi Permodalan FELDA Malaysia Berhad
(2019 - present)• Chairman, KPF Plantation Sdn Bhd (2019 - present)• Chairman, KPF Hotel Management Sdn Bhd (2019 - present)• Director, Felkur Survey Sdn Bhd (2019 - present)• Director, Felda Technoplant Sdn Bhd (2019 - present)• Director, FGV Prodata Systems Sdn Bhd (2019 - present)• Director, FGV Palm Industries Sdn Bhd (2019 - present)• Director, Nextgreen Global Berhad (2019 - present)• President, Kelab Bola Sepak Felda United (FUFC) (2019 -
present)• Chairman, KPF Trading Sdn Bhd (formerly known as Felda
Trading Sdn Bhd) (2018 - present)• Director, Felda D’Saji Sdn Bhd (2018 - present)• Director, FGV Refineries Sdn Bhd (2017 - present)
Membership of Board Committee:• Member of the Board Governance & Risk Management
Committee
DATUK LIM THEAN SHIANGIndependent Non-Executive Director
ANUAR MALEKNon-Independent Non-Executive Director
MSM MalaySia HoldingS BerHad | annual report 201964
Age: 52Gender: Male Nationality: Malaysian
Appointment to the Board:11 February 2019
Length of Tenure as Director:< 3 years
Date of Last Re-election:19 June 2019
Board Meeting Attendance:9/9
Board Committee Attendance:NRC: 5/5 IC: 1/1
Directorship of Public Companies (if any): Nil
qualification(s):• Advanced Management Program (AMP) 2016, Columbia
Business School, Columbia University, New York• Senior Management Development Program (SMDP) 2008,
Harvard Business School Alumni of Malaysia• Master of Business Administration (MBA), 1991, University of
Miami, Coral Gables, Miami, Florida, U.S.A• Bachelor of Business Administration (BBA), 1989, University
of Miami, Coral Gables, Florida, Miami, U.S.A
Working Experience and Occupation:• Group Chief Executive Officer of FGV Holdings Berhad
(January 2019 - present)• Director, Commercial & Land Management of Mass Rapid
Transit Corporation Sdn Bhd (January 2016 - January 2019)• Acting Chief Executive Officer of Mass Rapid Transit
Corporation Sdn Bhd (December 2013 - February 2014)• Director, Stakeholder Relations & Land Management of Mass
Rapid Transit Corporation Sdn Bhd (April 2012 - January 2016) • Senior Vice President 1, Downstream Operations of Sime
Darby Plantation Sdn Bhd (August 2008 - April 2012)
DATO’ HARIS FADZILAH HASSANNon-Independent Non-Executive Director
Additional Information1. None of the Directors has family relationship with and is not related to any Director and/or major shareholder of MSM Malaysia Holdings Berhad.2. None of the Directors has any conflict of interest with MSM Malaysia Holdings Berhad.3. None of the Directors has (i) been convicted of any offence (other than traffic offences) (ii) been imposed with any public sanction or penalty by the relevant regulatory bodies during the financial year4. The details of Directors’ attendance at Board Meetings held in the financial year ended 31 December 2019 are set out in the Corporate Governance statement on
page 70 of this Annual Report.5. The full profiles of every Director is available online at http://www.msmsugar.com/our-company/msm-group/board-directors.
• Senior Vice President 2, Strategy & Business Development of Sime Darby Plantation Sdn Bhd (November 2007 - August 2008)
• Head, Project Management Office (PMO) Plantation of Synergy Drive (November 2006 - November 2007)
• General Manager, Corporate Strategy & Business Development of Golden Hope Plantations Berhad (May 2006 - November 2007)
• Head, Strategy Development & Corporate Planning of Proton Holdings Berhad (May 2005 - May 2006)
• Head of Iran Project, International Business Division of Proton Marketing Sdn Bhd (November 2003 - May 2005)
• Concurrently acting as Head, Domestic Operation and Head, Public Relations Department of Perusahaan Otomobil Nasional Berhad (PROTON) (December 2000 - May 2002)
• Head, Corporate Planning Division of PROTON (December 2000 - November 2003)
• Head, Strategic Investment Unit, International Business Division of PROTON (November 1999 - May 2002)
• Market Strategist, International Business Division of PROTON (August 1998 - November 1999)
• Senior Consultant, Finance of Waterfield-Portola (May 1997 - August 1998)
• Senior Executive, Corporate Planning & Business Development of Petroliam Nasional Berhad (PETRONAS) (March 1994 - May 1997)
• Executive, Systems Development, Information Resources Division of PETRONAS (September 1992 - March 1994)
• Systems Engineer, Information Technology of Matsushita Television Co. (M) Sdn Bhd (1990 - 1992)
Membership of Board Committee:• Member of the Nomination and Remuneration Committee• Member of the Investment Committee
65EFFECTIVE LEADERSHIP06
PROFILE OF COMPANY SECRETARY
KOO SHUANG YEN Company Secretary
Age: 57Gender: Female Nationality: MalaysianAppointed: 20 May 2011Directorship in other public companies: NilConflict of interest with the Company: NilFamily relationship with any director and/or major Shareholder: NilList of convictions for offences within the past five years and particulars of any public sanction or penalty imposed by the relevant regulatory bodies during the financial year, if any: Nil
qualification(s):• Associate of the Chartered Institute of Management Accountants, UK• Chartered Accountant with Malaysian Institute of Accountants
Skill and Eperiences:• Company Secretary, FGV Holdings Berhad (FGV) and its Group of Companies (2014 - present)• Company Secretary, MSM Malaysia Holdings Berhad and its Group of Companies (2011 - present) • Senior Vice President, Group President/Chief Executive Officer’s Office, FGV (July 2016 - December 2017)• Head of Budgeting Unit, FGV (2015 - August 2016)• Head of Cluster Finance & Accounting Unit, FGV (2013 - August 2016)• Company Secretary, Felda Holdings Berhad and its Group of Companies (1995 - 2012)• Senior General Manager, Group Finance, Felda Holdings Berhad (2011 - 2012)• Group Accountant, Downstream Division, Felda Holdings Berhad (2009 - 2010)• Head of Finance, Felda Enterprises Sdn Bhd (2007 - 2008)• Head of Finance, Felda Engineering Services Sdn Bhd (1991 - 2006)
MSM MalaySia HoldingS BerHad | annual report 201966
PROFILE OF SENIOR MANAGEMENT
Age: 53Gender: Male Nationality: MalaysianAppointment of Position: 23 April 2019Details of any interest in the securities of the listed issuer or its subsidiaries: NoneDirectorship in MSM Group of Companies: All subsidiaries of MSMDirectorship of Public Companies/Listed Issuers: Pelaburan Mara Berhad
Age: 56Gender: Male Nationality: MalaysianAppointment of Position: 23 April 2019Details of any interest in the securities of the listed issuer or its subsidiaries: NoneDirectorship in MSM Group of Companies: NoneDirectorship of Public Companies/Listed Issuers: None
qualification(s):• BA (Hons.) in Business Administration majoring in Marketing
Management, Coventry University, UK
Working Experience and Occupation:• Malaysia-Qatar Business Council Committee Member
(MQBC) (2020 - present)• Non-Executive Director, Cadbury Confectionery (M) Sdn Bhd
(2018 - present)• Chief Operating Officer, Sugar Sector, FGV Holdings Berhad
(2018 - present)• Executive Director, MSM Malaysia Holdings Berhad (2017 -
2019)• Chief Operating Officer of Logistics & Other Sector, Felda
Global Ventures Holdings Berhad (2017)• Executive Vice President, Felda Global Ventures Holdings
Berhad (2014 - 2017)• Chief Operating Officer of Domestic Business Operation,
Felda Global Ventures Holdings Berhad (2012 - 2014)• Member of the Programme Advisory Committee (PAC)
“Technical Promotion & Market Development Sub-Committee” by Malaysian Palm Oil Board (MPOB) (2017 - 2019)
• Non-Executive Director, Pelaburan MARA Berhad (PMB) (2014 - present)
• Non-Executive Director of Sinergi Perdana Sdn Bhd (a consortium formed by FELDA, the Rubber Industry Smallholders Development Authority (RISDA), Federal Land Consolidation and Rehabilitation Authority (FELCRA), under the auspices of the Ministry of Rural & Regional Development and Prime Minister’s Department) (2010 - present)
• Executive Chairman, GSSB Consulting Sdn Bhd (2010 - 2014)• Director, International Business and Chief Marketing Officer,
SCAN Associates Berhad (2006 - 2009)• Chief Executive Officer of MLABS Systems Berhad (an
associate company of Universiti Sains Malaysia) (2004 - 2006)• Head of Marketing and Sales Division, JARING Communications
Sdn Bhd (a subsidiary of MIMOS Berhad) (2001 - 2004)• Time Engineering Bhd (TEB) (1999 - 2000)• Cement Industries of Malaysia Berhad (1996 - 1998)• United Engineers Malaysia Berhad (UEM) (1994 - 1995)• Renong Management Trainee, Renong Group Berhad
(1993 - 1994)• Systems Analyst, Resource Management Division, National
Health Service (NHS) in Wakefield, UK (1992 - 1993)
qualification(s):• Bachelor of Science in Engineering (Electrical), University of
Aberdeen, Scotland• Diploma in Electrical Engineering (Power), UiTM Shah Alam
Working Experience and Occupation:• Acting Chief Executive Officer, MSM Malaysia Holdings
Berhad (January 2018 - April 2019)• Chief Technical Officer, MSM Malaysia Holdings Berhad
(2016 - present)• Project Director, MSM Johor Refinery Sdn Bhd
(2017 - present)• Assistant General Manager, MSM Malaysia Holdings Berhad
(2016)• Corporate Engineering Manager, Gandour Saudi Arabia
(2012 - 2016)• Director Plant Operation, Gandour Malaysia, Negeri Sembilan
(1998 - 2012)• Manufacturing Manager, Mutiara Chocolates Sdn Bhd, Perak
(1995 - 1998)• Maintenance Engineer, MEMC Sdn Bhd, Silicon Wafer Mfg,
Selangor (1994 - 1995)• Engineer, Pacific World Sdn Bhd, Pasir Gudang (1991 - 1994)• Electrical Engineer, Pasir Gudang Edible Oils Sdn Bhd, Pasir
Gudang (1989 - 1991)
DATO’ KHAIRIL ANUAR AZIZGroup Chief Executive Officer MSM Malaysia Holdings Berhad
MOHD SHAFFIE SAIDGroup Chief Operating OfficerMSM Malaysia Holdings Berhad
67EFFECTIVE LEADERSHIP06
PROFILE OF SENIOR MANAGEMENT
Age: 52Gender: Male Nationality: MalaysianAppointment of Position: 1 June 2019Details of any interest in the securities of the listed issuer or its subsidiaries: NoneDirectorship in MSM Group of Companies: • MSM Prai Berhad• MSM Perlis Sdn Bhd• MSM Sugar Refinery (Johor) Sdn Bhd• MSM Trading & Distribution Sdn Bhd• MSM Logistics Sdn BhdDirectorship of Public Companies/Listed Issuers: None
Age: 51Gender: Male Nationality: MalaysianAppointment of Position: 1 December 2018Details of any interest in the securities of the listed issuer or its subsidiaries: NoneDirectorship in MSM Group of Companies: NoneDirectorship of Public Companies/Listed Issuers: None
qualification(s):• Fellow Member of the Association of Chartered Certified
Accountants (ACCA), United Kingdom• Chartered Accountant, Malaysian Institute of Accountants
Working Experience and Occupation:• Chief Financial Officer, MSM Malaysia Holdings Berhad
(2019 - present)• Deputy Chief Financial Officer, MSM Malaysia Holdings
Berhad (Apr 2019 - May 2019)• Group Financial Controller (Plantation Sector), Group Finance
Division, FGV Holdings Berhad (Jan 2018 - Mar 2019)• Senior General Manager (Support Services), FGV Trading Sdn
Bhd (2015 - 2017)• Chief Financial Officer, Felda Iffco Sdn Bhd (2007 - 2015)• General Manager, Felda Trading Sdn Bhd (2004 - 2007)• Senior Audit Manager, Group Internal Audit, Felda Holdings
Berhad (1994 - 2004)• Auditor in a Chartered Accountant Firm, London, United
Kingdom (1991 - 1994)
qualification(s):• Bachelor’s Degree in Engineering (Mechanical) 1992 from
Universiti Teknologi Malaysia• Registered Electrical Energy Manager with Energy
Commission 2017
Working Experience and Occupation:• Senior General Manager Operations (Jan 2019 - present)• Acting Head of Operations (Dec 2018)• Assistant General Manager/General Manager, Engineering
(Dec 2009 - Nov 2018)• Manager Mechanical (Sep 2004 - Nov 2009)• Assistant Manager Mechanical (Feb 2000 - Aug 2004)• Mechanical Engineer, MSM Prai (Jul 1993 - Jun 2000)• Mechanical Production Engineer, Sony Electronic Malaysia
(Jul 1992 - Jun 1993)
AB AZIZ ISMAILChief Financial OfficerMSM Malaysia Holdings Berhad
CHEAH POH LYEHead of OperationsMSM Prai Berhad
MSM MalaySia HoldingS BerHad | annual report 201968
Age: 46Gender: Male Nationality: MalaysianAppointment of Position: 21 October 2019Details of any interest in the securities of the listed issuer or its subsidiaries: NoneDirectorship in MSM Group of Companies: NoneDirectorship of Public Companies/Listed Issuers: None
Age: 41Gender: Male Nationality: MalaysianAppointment of Position: 1 December 2018Details of any interest in the securities of the listed issuer or its subsidiaries: NoneDirectorship in MSM Group of Companies: NoneDirectorship of Public Companies/Listed Issuers: None
qualification(s):• Master in Business Administration (MBA), Management
Science University• Degree in Chemical Engineering (Hons.), University Technology
Malaysia
Working Experience and Occupation:• Vice President Operations, MSM Sugars Refinery (Johor)
Sdn Bhd (Present)• Senior General Manager, GCTO Office, MSM Malaysia
Holdings Berhad (2018 - 2019)• General Manager Operations, Central Sugars Refinery Sdn
Bhd (2018)• Assistant General Manager (Factory), Central Sugars Refinery
Sdn Bhd (2014 - 2018)• Production Manager, Central Sugars Refinery Sdn Bhd
(2007 - 2013)• Assistant Production Manager, Central Sugars Refinery Sdn
Bhd (2001 - 2006)• Production Superintendent, Central Sugars Refinery Sdn Bhd
(2000)• Chemical Engineer, Central Sugars Refinery Sdn Bhd
(1996 - 1999)
qualification(s):• Bachelor of Science (Chemistry), University Sains Malaysia
Working Experience and Occupation:• General Manager, Operations (2019 - present)• Manager/Senior Manager, Production, MSM Perlis (2016 -
2019)• Assistant Manager, Production, KGFP/MSM Perlis (2011 - 2016)• Production Shift Chief, KGFP/MSM Perlis (2004 - 2011)• Management Trainee, MSM Prai (2003 - 2004)
HASMANAN ZAQUIER SALLEHHead of OperationsMSM Sugar Refinery (Johor) Sdn Bhd
ASMAWY ARIFFINHead of OperationsMSM Perlis Sdn Bhd
Additional Information1. None of the Senior Management has any family relationship with and is not related to any Director and/or major shareholder of MSM Malaysia Holdings Berhad.2. None of the Senior Management has any directorship in public companies and listed issuers.3. None of the Senior Management has any conflict of interest with MSM Malaysia Holdings Berhad.4. None of the Senior Management has (i) been convicted of any offence (other than traffic offences) within the pass five (5) years; and (ii) been imposed with any public sanction or penalty by the relevant regulatory bodies during the financial year.
69EFFECTIVE LEADERSHIP06
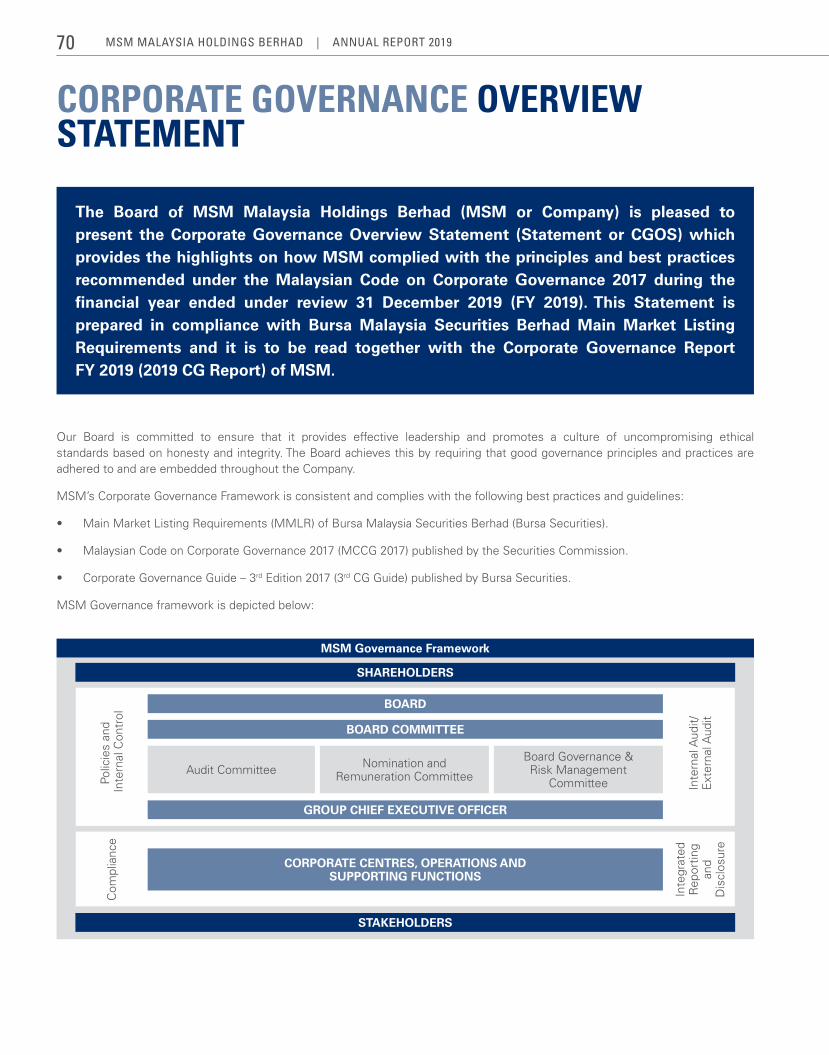
CORPORATE GOVERNANCE OVERVIEW STATEMENT
Our Board is committed to ensure that it provides effective leadership and promotes a culture of uncompromising ethical standards based on honesty and integrity. The Board achieves this by requiring that good governance principles and practices are adhered to and are embedded throughout the Company.
MSM’s Corporate Governance Framework is consistent and complies with the following best practices and guidelines:
• Main Market Listing Requirements (MMLR) of Bursa Malaysia Securities Berhad (Bursa Securities).
• Malaysian Code on Corporate Governance 2017 (MCCG 2017) published by the Securities Commission.
• Corporate Governance Guide – 3rd Edition 2017 (3rd CG Guide) published by Bursa Securities.
MSM Governance framework is depicted below:
The Board of MSM Malaysia Holdings Berhad (MSM or Company) is pleased to present the Corporate Governance Overview Statement (Statement or CGOS) which provides the highlights on how MSM complied with the principles and best practices recommended under the Malaysian Code on Corporate Governance 2017 during the financial year ended under review 31 December 2019 (FY 2019). This Statement is prepared in compliance with Bursa Malaysia Securities Berhad Main Market Listing Requirements and it is to be read together with the Corporate Governance Report FY 2019 (2019 CG Report) of MSM.
Com
plia
nce
Audit Committee Nomination and Remuneration Committee
Board Governance & Risk Management
Committee
Inte
grat
ed
Rep
ortin
g
and
Dis
clos
ure
Polic
ies
and
Inte
rnal
Con
trol
Inte
rnal
Aud
it/
Ext
erna
l Aud
itBOARD
SHAREHOLDERS
MSM Governance Framework
STAKEHOLDERS
BOARD COMMITTEE
GROUP CHIEF ExECUTIVE OFFICER
CORPORATE CENTRES, OPERATIONS AND SUPPORTING FUNCTIONS
MSM MalaySia HoldingS BerHad | annual report 201970
The Board presents this statement to provide an insight into the Corporate Governance practices of MSM Group under the leadership of the Board with reference to the following principles:
(a) Board leadership and effectiveness
(b) Effective audit and risk management
(c) Integrity in corporate reporting and meaningful relationship with stakeholders
Detailed explanation on how MSM has applied the practices are provided and described in the 2019 CG Report found on the corporate website at http://www.msmsugar.com/our-company/corporate-governance.
PrinciPle A: BoArd leAdershiP And effectiveness
Board of directors
Under the Company’s Constitution, the number of Directors shall not be less than two and not more than 12. The composition of the Board fairly reflects the interest of the significant shareholders, without compromising, is also in compliance with Paragraph 15.02 of the MMLR. As at the date of this statement, there are five members on the Board, comprising:
• TwoIndependentNon-ExecutiveDirectors;and
• ThreeNon-IndependentNon-ExecutiveDirectors.
The composition of the Board is reviewed annually by the NominationandRemunerationCommitteetoensureeffectivebalance diversification of gender, skill-sets, experience and knowledge. The profiles of the Directors are presented on pages 63 to 65 of this Annual Report.
Appointments to the Board are made via formal, rigorous and transparent process, premised on meritocracy and taking into account objective criteria such as competencies, experience, character, integrity, diversity and the ability to devote time as needed on the Board in the context of the Group’s strategic direction.
The Board members ensure that high ethical standards are applied in the discharge of their responsibilities, through compliance with relevant rules and regulations, directives and guidelines in addition to adopting the best practices in the MCCG 2017 and the 3rd CG Guide, and act in the best interest of MSM Group and its shareholders. Board members observe the Code of Ethics and Conduct (CoEC) and Code of Business Practice (CoBP) applicable to all Board of Directors. The CoEC and CoBP outline the ethical standards of behaviour and conduct expected from all Directors of MSM Group.
The Board is chaired by Datuk Wira Azhar Abdul Hamid, a Non-Independent Non-Executive Director, who providesleadership for the Board so that the Board can perform its responsibilities effectively.
Details of information on the Board’s roles and responsibilities together with the Board’s reserve matters can be found in the Board Charter which is made available on the Company’s corporate website at http://www.msmsugar.com/our-company/corporate-governance.
The Board is supported by:
• AuditCommittee;
• NominationandRemunerationCommittee;
• BoardGovernance&RiskManagementCommittee;
• InvestmentCommittee(Disbandedon20November2019).
These Committees play a significant role in reviewing matters within their respective Terms of Reference (TOR), and facilitate the Board’s discharge of its duties and responsibilities. Each of the Board Committee has specific TOR, scope and authorities to review matters before tabling it to the Board Meeting for decision making as a whole.
Even though there is delegation of responsibilities from the Board to the Board Committees, Group CEO, Chief Financial Officer (CFO) and Group Chief Operating Officer (Group COO), there are still a number of matters reserved solely for the Board’s undertaking.
71CORPORATE GOVERNANCE07
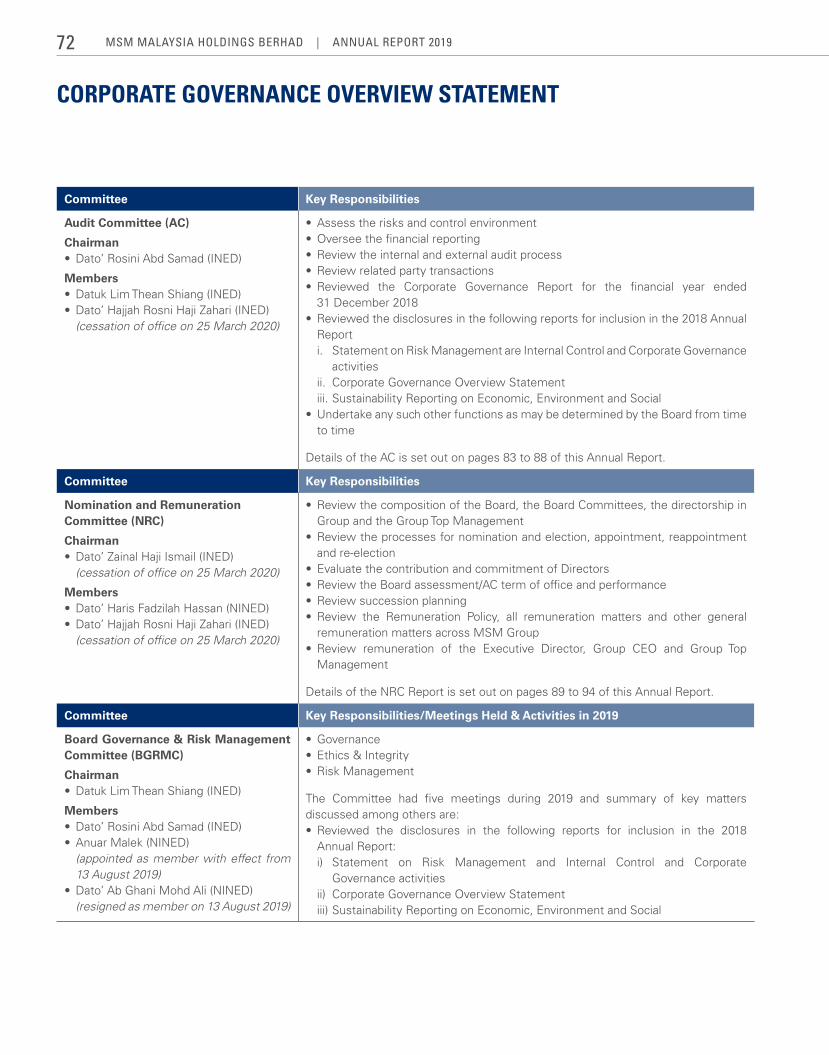
CORPORATE GOVERNANCE OVERVIEW STATEMENT
Committee Key Responsibilities
Audit Committee (AC)
Chairman• Dato’ Rosini Abd Samad (INED)
Members• Datuk Lim Thean Shiang (INED)• Dato’ Hajjah Rosni Haji Zahari (INED)
(cessation of office on 25 March 2020)
• Assess the risks and control environment• Oversee the financial reporting • Review the internal and external audit process• Review related party transactions • Reviewed the Corporate Governance Report for the financial year ended
31 December 2018• Reviewed the disclosures in the following reports for inclusion in the 2018 Annual
Reporti. Statement on Risk Management are Internal Control and Corporate Governance
activitiesii. Corporate Governance Overview Statementiii. Sustainability Reporting on Economic, Environment and Social
• Undertake any such other functions as may be determined by the Board from time to time
Details of the AC is set out on pages 83 to 88 of this Annual Report.
Committee Key Responsibilities
Nomination and Remuneration Committee (NRC)
Chairman• Dato’ Zainal Haji Ismail (INED)
(cessation of office on 25 March 2020)
Members• Dato’ Haris Fadzilah Hassan (NINED)• Dato’ Hajjah Rosni Haji Zahari (INED)
(cessation of office on 25 March 2020)
• Review the composition of the Board, the Board Committees, the directorship in Group and the Group Top Management
• Review the processes for nomination and election, appointment, reappointment and re-election
• Evaluate the contribution and commitment of Directors• Review the Board assessment/AC term of office and performance • Review succession planning• Review the Remuneration Policy, all remuneration matters and other general
remuneration matters across MSM Group• Review remuneration of the Executive Director, Group CEO and Group Top
Management
Details of the NRC Report is set out on pages 89 to 94 of this Annual Report.
Committee Key Responsibilities/Meetings Held & Activities in 2019
Board Governance & Risk Management Committee (BGRMC)
Chairman• Datuk Lim Thean Shiang (INED)
Members• Dato’ Rosini Abd Samad (INED)• Anuar Malek (NINED) (appointed as member with effect from
13 August 2019)• Dato’ Ab Ghani Mohd Ali (NINED) (resigned as member on 13 August 2019)
• Governance• Ethics & Integrity• Risk Management
The Committee had five meetings during 2019 and summary of key matters discussed among others are:• Reviewed the disclosures in the following reports for inclusion in the 2018
Annual Report: i) Statement on Risk Management and Internal Control and Corporate
Governance activities ii) Corporate Governance Overview Statement iii) Sustainability Reporting on Economic, Environment and Social
MSM MalaySia HoldingS BerHad | annual report 201972
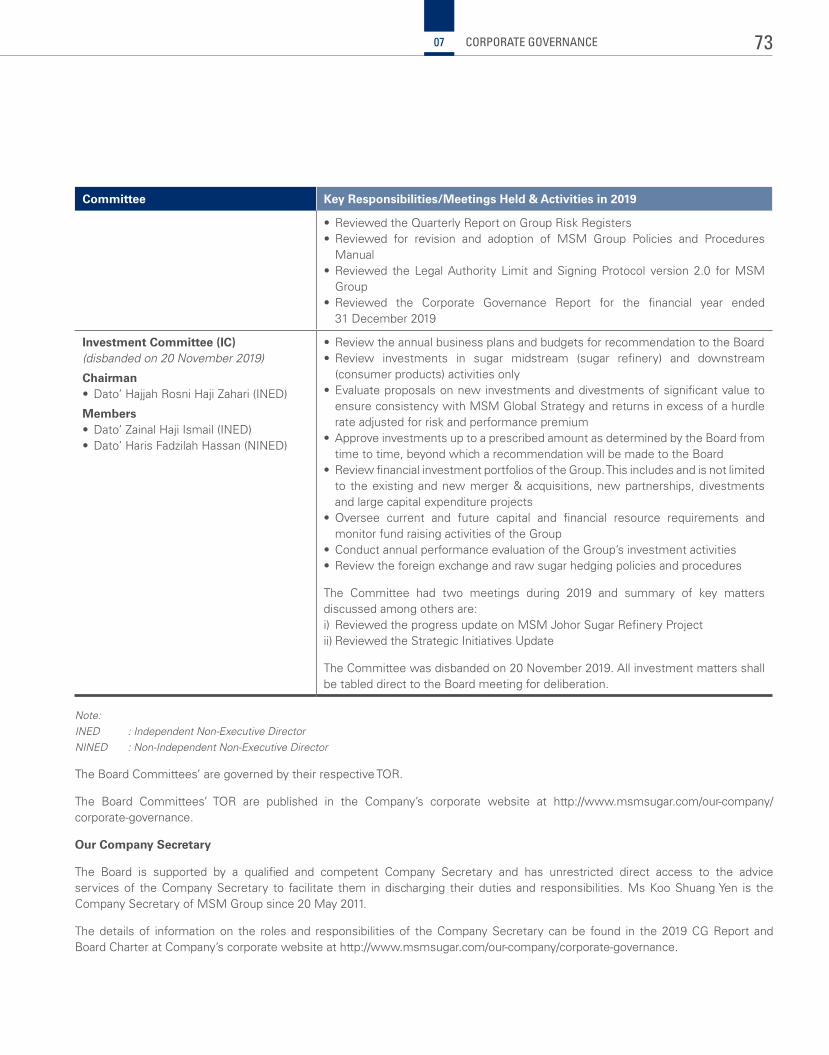
Committee Key Responsibilities/Meetings Held & Activities in 2019
• ReviewedtheQuarterlyReportonGroupRiskRegisters• Reviewed for revision and adoption of MSM Group Policies and ProceduresManual
• Reviewed the LegalAuthority Limit andSigningProtocol version 2.0 forMSMGroup
• Reviewed the Corporate Governance Report for the financial year ended31December2019
Investment Committee (IC)(disbanded on 20 November 2019)
Chairman• Dato’HajjahRosniHajiZahari(ineD)
Members• Dato’ZainalHajiismail(ineD)• Dato’HarisFadzilahHassan(nineD)
• ReviewtheannualbusinessplansandbudgetsforrecommendationtotheBoard• Review investments in sugar midstream (sugar refinery) and downstream(consumerproducts)activitiesonly
• evaluateproposalsonnewinvestmentsanddivestmentsofsignificantvaluetoensureconsistencywithMSMGlobalStrategyandreturnsinexcessofahurdlerateadjustedforriskandperformancepremium
• ApproveinvestmentsuptoaprescribedamountasdeterminedbytheBoardfromtimetotime,beyondwhicharecommendationwillbemadetotheBoard
• ReviewfinancialinvestmentportfoliosoftheGroup.Thisincludesandisnotlimitedto theexistingandnewmerger&acquisitions,newpartnerships,divestmentsandlargecapitalexpenditureprojects
•Oversee current and future capital and financial resource requirements andmonitorfundraisingactivitiesoftheGroup
• ConductannualperformanceevaluationoftheGroup’sinvestmentactivities• Reviewtheforeignexchangeandrawsugarhedgingpoliciesandprocedures
The Committee had two meetings during 2019 and summary of key mattersdiscussedamongothersare:i) ReviewedtheprogressupdateonMSMJohorSugarRefineryProjectii)ReviewedtheStrategicinitiativesUpdate
TheCommitteewasdisbandedon20november2019.AllinvestmentmattersshallbetableddirecttotheBoardmeetingfordeliberation.
Note:iNed : independent Non-executive directorNiNed : Non-independent Non-executive director
TheBoardCommittees’aregovernedbytheirrespectiveTOR.
The Board Committees’ TOR are published in the Company’s corporate website at http://www.msmsugar.com/our-company/corporate-governance.
Our Company Secretary
The Board is supported by a qualified and competent Company Secretary and has unrestricted direct access to the adviceservicesof theCompanySecretary to facilitate them indischarging theirdutiesand responsibilities.MsKooShuangYen is theCompanySecretaryofMSMGroupsince20May2011.
Thedetailsof informationon the rolesand responsibilitiesof theCompanySecretary canbe found in the2019CGReport andBoardCharteratCompany’scorporatewebsiteathttp://www.msmsugar.com/our-company/corporate-governance.
73CORPORATE GOVERNANCE07
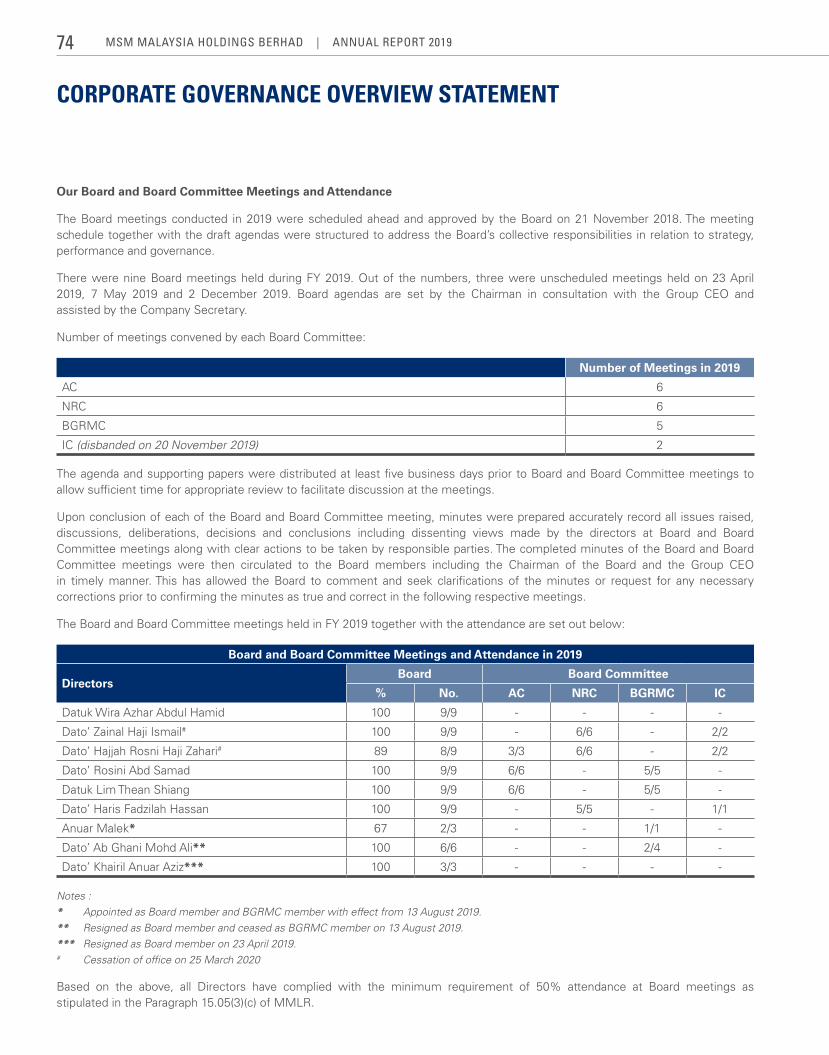
CORPORATE GOVERNANCE OVERVIEW STATEMENT
Our Board and Board Committee Meetings and Attendance
The Board meetings conducted in 2019 were scheduled ahead and approved by the Board on 21 November 2018. The meeting schedule together with the draft agendas were structured to address the Board’s collective responsibilities in relation to strategy, performance and governance.
There were nine Board meetings held during FY 2019. Out of the numbers, three were unscheduled meetings held on 23 April 2019, 7 May 2019 and 2 December 2019. Board agendas are set by the Chairman in consultation with the Group CEO and assisted by the Company Secretary.
Number of meetings convened by each Board Committee:
Number of Meetings in 2019
AC 6
NRC 6
BGRMC 5
IC (disbanded on 20 November 2019) 2
The agenda and supporting papers were distributed at least five business days prior to Board and Board Committee meetings to allow sufficient time for appropriate review to facilitate discussion at the meetings.
Upon conclusion of each of the Board and Board Committee meeting, minutes were prepared accurately record all issues raised, discussions, deliberations, decisions and conclusions including dissenting views made by the directors at Board and Board Committee meetings along with clear actions to be taken by responsible parties. The completed minutes of the Board and Board Committee meetings were then circulated to the Board members including the Chairman of the Board and the Group CEO in timely manner. This has allowed the Board to comment and seek clarifications of the minutes or request for any necessary corrections prior to confirming the minutes as true and correct in the following respective meetings.
The Board and Board Committee meetings held in FY 2019 together with the attendance are set out below:
Board and Board Committee Meetings and Attendance in 2019
DirectorsBoard Board Committee
% No. AC NRC BGRMC IC
Datuk Wira Azhar Abdul Hamid 100 9/9 - - - -
Dato’ Zainal Haji Ismail# 100 9/9 - 6/6 - 2/2
Dato’ Hajjah Rosni Haji Zahari# 89 8/9 3/3 6/6 - 2/2
Dato’ Rosini Abd Samad 100 9/9 6/6 - 5/5 -
Datuk Lim Thean Shiang 100 9/9 6/6 - 5/5 -
Dato’ Haris Fadzilah Hassan 100 9/9 - 5/5 - 1/1
Anuar Malek* 67 2/3 - - 1/1 -
Dato’ Ab Ghani Mohd Ali** 100 6/6 - - 2/4 -
Dato’ Khairil Anuar Aziz*** 100 3/3 - - - -
Notes :* Appointed as Board member and BGRMC member with effect from 13 August 2019.** Resigned as Board member and ceased as BGRMC member on 13 August 2019.*** Resigned as Board member on 23 April 2019.# Cessation of office on 25 March 2020
Based on the above, all Directors have complied with the minimum requirement of 50% attendance at Board meetings as stipulated in the Paragraph 15.05(3)(c) of MMLR.
MSM MalaySia HoldingS BerHad | annual report 201974
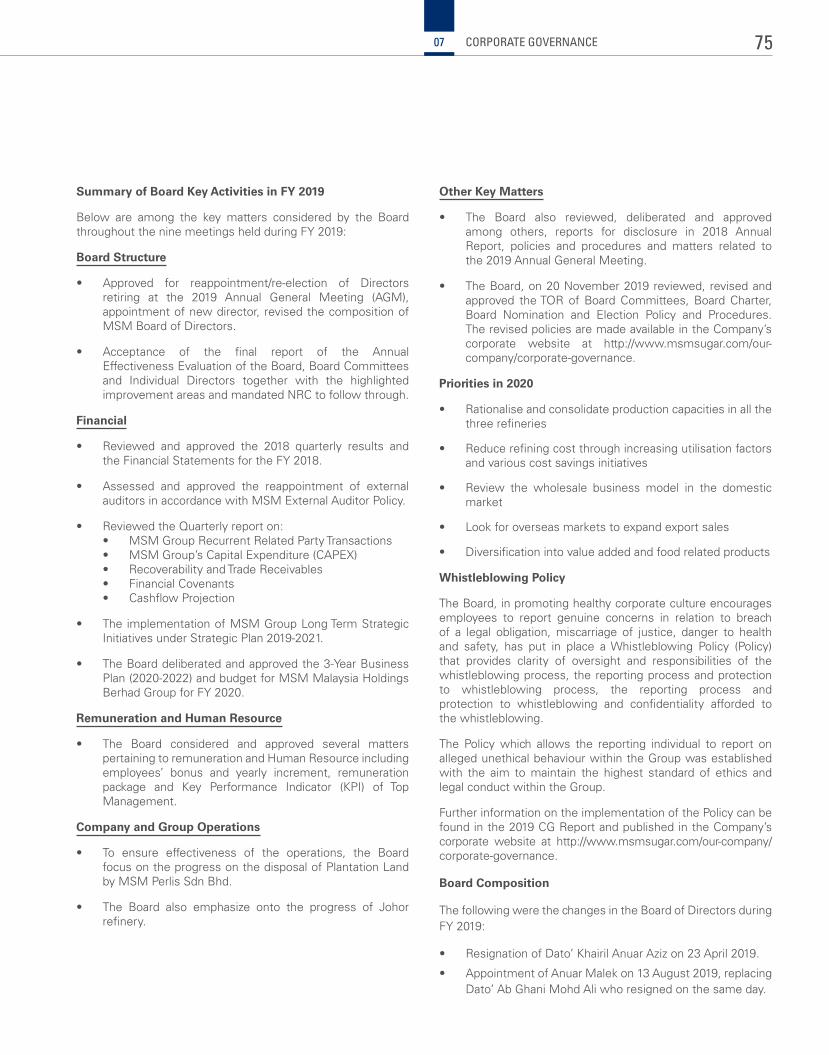
Summary of Board Key Activities in FY 2019
Below are among the key matters considered by the Board throughout the nine meetings held during FY 2019:
Board Structure
• Approved for reappointment/re-election of Directorsretiring at the 2019 Annual General Meeting (AGM),appointmentofnewdirector,revisedthecompositionofMSMBoardofDirectors.
• Acceptance of the final report of the Annual EffectivenessEvaluationoftheBoard,BoardCommitteesand Individual Directors together with the highlightedimprovementareasandmandatedNRCtofollowthrough.
Financial
• Reviewed and approved the 2018 quarterly results and theFinancialStatementsfortheFY2018.
• Assessed and approved the reappointment of externalauditorsinaccordancewithMSMExternalAuditorPolicy.
• ReviewedtheQuarterlyreporton: • MSMGroupRecurrentRelatedPartyTransactions • MSMGroup’sCapitalExpenditure(CAPEX) • RecoverabilityandTradeReceivables • FinancialCovenants • CashflowProjection
• The implementationofMSMGroupLongTermStrategicInitiativesunderStrategicPlan2019-2021.
• TheBoarddeliberatedandapprovedthe3-YearBusinessPlan(2020-2022)andbudgetforMSMMalaysiaHoldingsBerhadGroupforFY2020.
Remuneration and Human Resource
• The Board considered and approved several matterspertainingtoremunerationandHumanResourceincludingemployees’ bonus and yearly increment, remunerationpackage and Key Performance Indicator (KPI) of TopManagement.
Company and Group Operations
• To ensure effectiveness of the operations, the Board focusontheprogressonthedisposalofPlantationLandbyMSMPerlisSdnBhd.
• The Board also emphasize onto the progress of Johorrefinery.
Other Key Matters
• The Board also reviewed, deliberated and approved among others, reports for disclosure in 2018 AnnualReport, policies and procedures and matters related to the2019AnnualGeneralMeeting.
• TheBoard,on20November2019reviewed,revisedandapproved theTORofBoardCommittees,BoardCharter,Board Nomination and Election Policy and Procedures.TherevisedpoliciesaremadeavailableintheCompany’scorporate website at http://www.msmsugar.com/our-company/corporate-governance.
Priorities in 2020
• Rationaliseandconsolidateproductioncapacitiesinallthethreerefineries
• Reducerefiningcostthroughincreasingutilisationfactorsandvariouscostsavingsinitiatives
• Review the wholesale business model in the domesticmarket
• Lookforoverseasmarketstoexpandexportsales
• Diversificationintovalueaddedandfoodrelatedproducts
Whistleblowing Policy
TheBoard,inpromotinghealthycorporatecultureencouragesemployees to report genuine concerns in relation to breachof a legal obligation,miscarriage of justice, danger to healthand safety, has put in place aWhistleblowing Policy (Policy)that provides clarity of oversight and responsibilities of thewhistleblowingprocess,thereportingprocessandprotectionto whistleblowing process, the reporting process andprotection to whistleblowing and confidentiality afforded to thewhistleblowing.
The Policywhich allows the reporting individual to report onallegedunethicalbehaviourwithintheGroupwasestablishedwith the aim tomaintain the highest standard of ethics andlegalconductwithintheGroup.
FurtherinformationontheimplementationofthePolicycanbefoundinthe2019CGReportandpublishedintheCompany’scorporate website at http://www.msmsugar.com/our-company/corporate-governance.
Board Composition
ThefollowingwerethechangesintheBoardofDirectorsduringFY 2019:
• ResignationofDato’KhairilAnuarAzizon23April2019.
• AppointmentofAnuarMalekon13August2019,replacingDato’AbGhaniMohdAliwhoresignedonthesameday.
75CORPORATE GOVERNANCE07
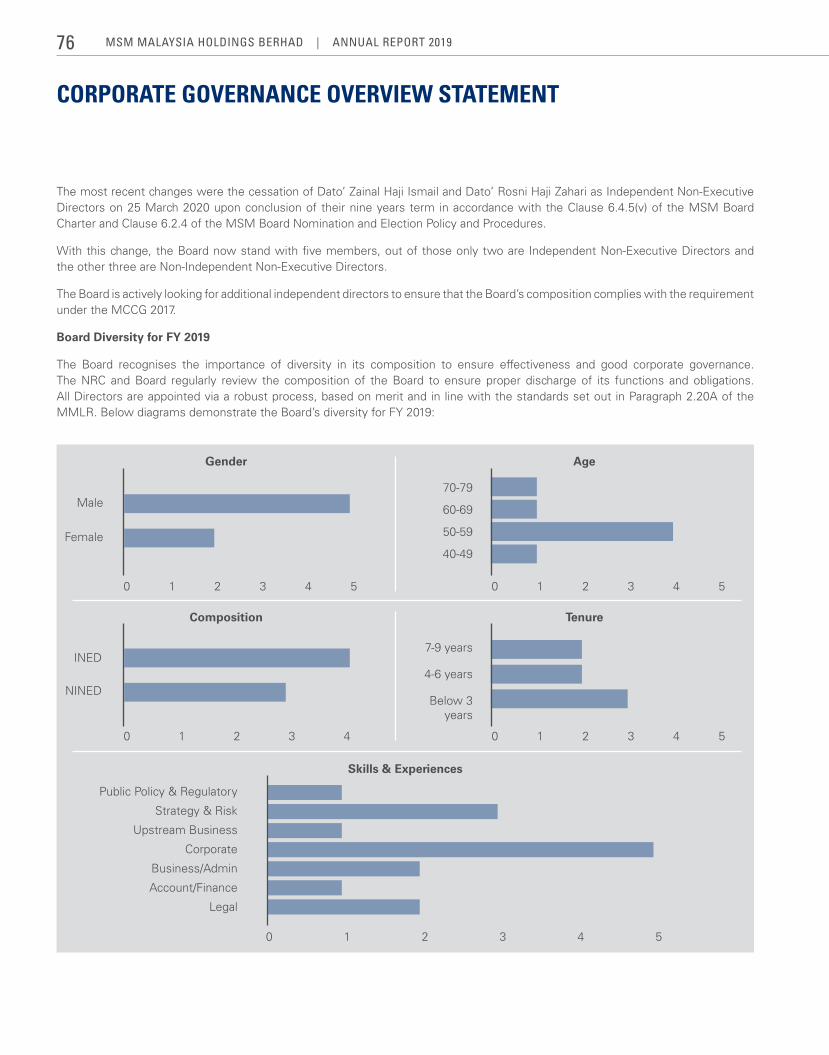
CORPORATE GOVERNANCE OVERVIEW STATEMENT
Male70-79
60-69
50-59
40-49
Gender
Composition
Skills & Experiences
Age
Tenure
0 1 2 3 4 5 0 1 2 3 4 5
0 1 2 3 4 5
0 1 2 3 4 5
0 1 2 3 4
Female
INED7-9 years
NINED4-6 years
Public Policy & Regulatory
Strategy & Risk
Upstream Business
Corporate
Business/Admin
Account/Finance
Legal
Below 3 years
The most recent changes were the cessation of Dato’ Zainal Haji Ismail and Dato’ Rosni Haji Zahari as Independent Non-Executive Directors on 25 March 2020 upon conclusion of their nine years term in accordance with the Clause 6.4.5(v) of the MSM Board Charter and Clause 6.2.4 of the MSM Board Nomination and Election Policy and Procedures.
With this change, the Board now stand with five members, out of those only two are Independent Non-Executive Directors and the other three are Non-Independent Non-Executive Directors.
The Board is actively looking for additional independent directors to ensure that the Board’s composition complies with the requirement under the MCCG 2017.
Board Diversity for FY 2019
The Board recognises the importance of diversity in its composition to ensure effectiveness and good corporate governance. The NRC and Board regularly review the composition of the Board to ensure proper discharge of its functions and obligations. All Directors are appointed via a robust process, based on merit and in line with the standards set out in Paragraph 2.20A of the MMLR. Below diagrams demonstrate the Board’s diversity for FY 2019:
MSM MalaySia HoldingS BerHad | annual report 201976
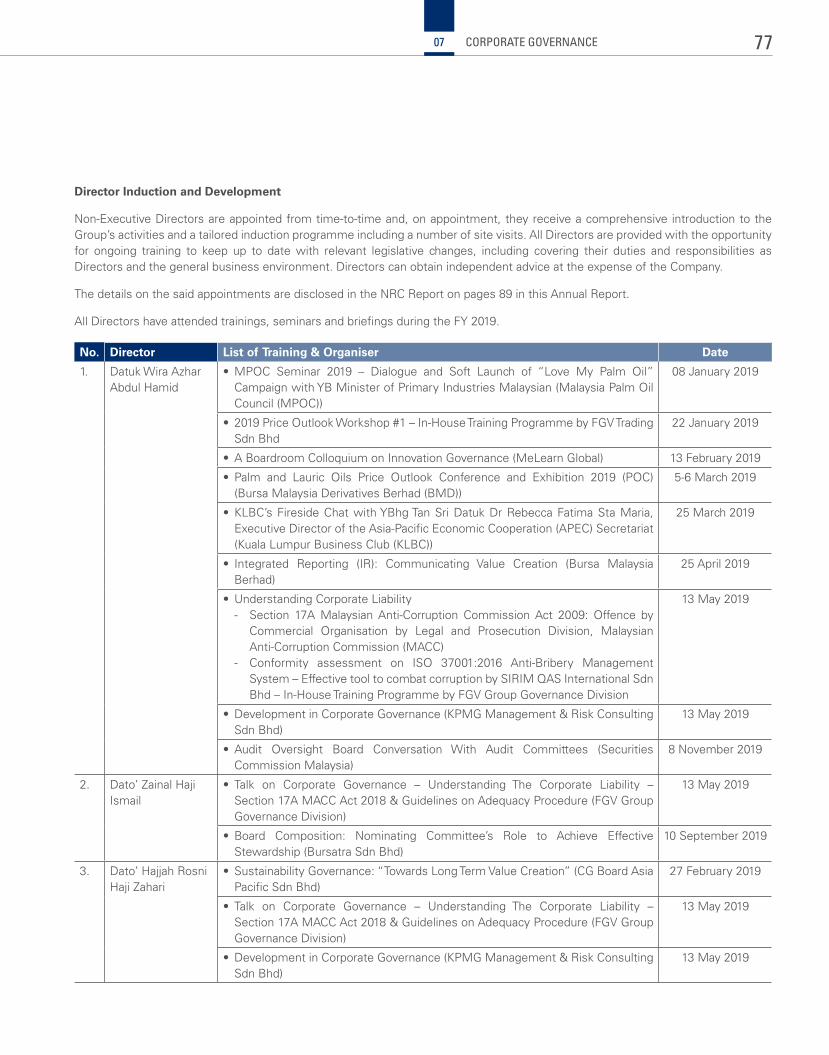
Director Induction and Development
Non-Executive Directors are appointed from time-to-time and, on appointment, they receive a comprehensive introduction to the Group’s activities and a tailored induction programme including a number of site visits. All Directors are provided with the opportunity for ongoing training to keep up to date with relevant legislative changes, including covering their duties and responsibilities as Directors and the general business environment. Directors can obtain independent advice at the expense of the Company.
The details on the said appointments are disclosed in the NRC Report on pages 89 in this Annual Report.
All Directors have attended trainings, seminars and briefings during the FY 2019.
No. Director List of Training & Organiser Date
1. Datuk Wira Azhar Abdul Hamid
• MPOC Seminar 2019 – Dialogue and Soft Launch of “Love My Palm Oil” Campaign with YB Minister of Primary Industries Malaysian (Malaysia Palm Oil Council (MPOC))
08 January 2019
• 2019 Price Outlook Workshop #1 – In-House Training Programme by FGV Trading Sdn Bhd
22 January 2019
• A Boardroom Colloquium on Innovation Governance (MeLearn Global) 13 February 2019
• Palm and Lauric Oils Price Outlook Conference and Exhibition 2019 (POC) (Bursa Malaysia Derivatives Berhad (BMD))
5-6 March 2019
• KLBC’s Fireside Chat with YBhg Tan Sri Datuk Dr Rebecca Fatima Sta Maria, Executive Director of the Asia-Pacific Economic Cooperation (APEC) Secretariat (Kuala Lumpur Business Club (KLBC))
25 March 2019
• Integrated Reporting (IR): Communicating Value Creation (Bursa Malaysia Berhad)
25 April 2019
• Understanding Corporate Liability - Section 17A Malaysian Anti-Corruption Commission Act 2009: Offence by
Commercial Organisation by Legal and Prosecution Division, Malaysian Anti-Corruption Commission (MACC)
- Conformity assessment on ISO 37001:2016 Anti-Bribery Management System – Effective tool to combat corruption by SIRIM QAS International Sdn Bhd – In-House Training Programme by FGV Group Governance Division
13 May 2019
• Development in Corporate Governance (KPMG Management & Risk Consulting Sdn Bhd)
13 May 2019
• Audit Oversight Board Conversation With Audit Committees (Securities Commission Malaysia)
8 November 2019
2. Dato’ Zainal Haji Ismail
• Talk on Corporate Governance – Understanding The Corporate Liability – Section 17A MACC Act 2018 & Guidelines on Adequacy Procedure (FGV Group Governance Division)
13 May 2019
• Board Composition: Nominating Committee’s Role to Achieve Effective Stewardship (Bursatra Sdn Bhd)
10 September 2019
3. Dato’ Hajjah Rosni Haji Zahari
• Sustainability Governance: “Towards Long Term Value Creation” (CG Board Asia Pacific Sdn Bhd)
27 February 2019
• Talk on Corporate Governance – Understanding The Corporate Liability – Section 17A MACC Act 2018 & Guidelines on Adequacy Procedure (FGV Group Governance Division)
13 May 2019
• Development in Corporate Governance (KPMG Management & Risk Consulting Sdn Bhd)
13 May 2019
77CORPORATE GOVERNANCE07
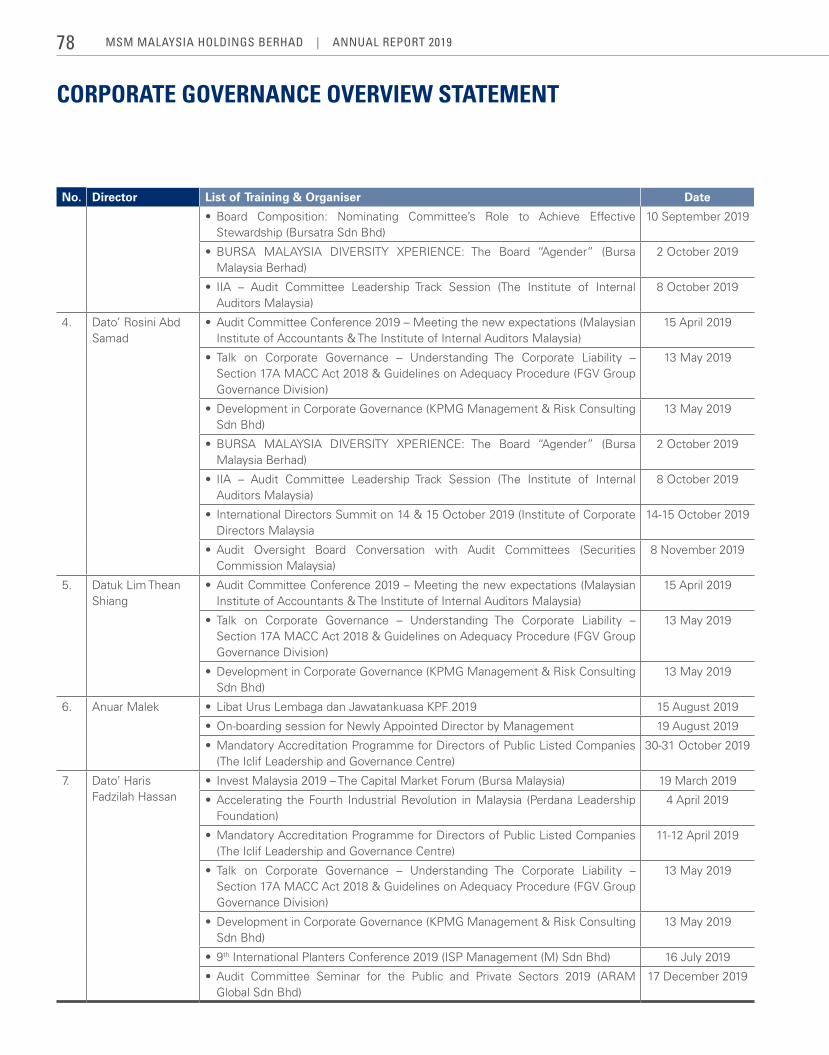
CORPORATE GOVERNANCE OVERVIEW STATEMENT
No. Director List of Training & Organiser Date
• Board Composition: Nominating Committee’s Role to Achieve Effective Stewardship (Bursatra Sdn Bhd)
10 September 2019
• BURSA MALAYSIA DIVERSITY XPERIENCE: The Board “Agender” (Bursa Malaysia Berhad)
2 October 2019
• IIA – Audit Committee Leadership Track Session (The Institute of Internal Auditors Malaysia)
8 October 2019
4. Dato’ Rosini Abd Samad
• Audit Committee Conference 2019 – Meeting the new expectations (Malaysian Institute of Accountants & The Institute of Internal Auditors Malaysia)
15 April 2019
• Talk on Corporate Governance – Understanding The Corporate Liability – Section 17A MACC Act 2018 & Guidelines on Adequacy Procedure (FGV Group Governance Division)
13 May 2019
• Development in Corporate Governance (KPMG Management & Risk Consulting Sdn Bhd)
13 May 2019
• BURSA MALAYSIA DIVERSITY XPERIENCE: The Board “Agender” (Bursa Malaysia Berhad)
2 October 2019
• IIA – Audit Committee Leadership Track Session (The Institute of Internal Auditors Malaysia)
8 October 2019
• International Directors Summit on 14 & 15 October 2019 (Institute of Corporate Directors Malaysia
14-15 October 2019
• Audit Oversight Board Conversation with Audit Committees (Securities Commission Malaysia)
8 November 2019
5. Datuk Lim Thean Shiang
• Audit Committee Conference 2019 – Meeting the new expectations (Malaysian Institute of Accountants & The Institute of Internal Auditors Malaysia)
15 April 2019
• Talk on Corporate Governance – Understanding The Corporate Liability – Section 17A MACC Act 2018 & Guidelines on Adequacy Procedure (FGV Group Governance Division)
13 May 2019
• Development in Corporate Governance (KPMG Management & Risk Consulting Sdn Bhd)
13 May 2019
6. Anuar Malek • Libat Urus Lembaga dan Jawatankuasa KPF 2019 15 August 2019
• On-boarding session for Newly Appointed Director by Management 19 August 2019
• Mandatory Accreditation Programme for Directors of Public Listed Companies (The Iclif Leadership and Governance Centre)
30-31 October 2019
7. Dato’ Haris Fadzilah Hassan
• Invest Malaysia 2019 – The Capital Market Forum (Bursa Malaysia) 19 March 2019
• Accelerating the Fourth Industrial Revolution in Malaysia (Perdana Leadership Foundation)
4 April 2019
• Mandatory Accreditation Programme for Directors of Public Listed Companies (The Iclif Leadership and Governance Centre)
11-12 April 2019
• Talk on Corporate Governance – Understanding The Corporate Liability – Section 17A MACC Act 2018 & Guidelines on Adequacy Procedure (FGV Group Governance Division)
13 May 2019
• Development in Corporate Governance (KPMG Management & Risk Consulting Sdn Bhd)
13 May 2019
• 9th International Planters Conference 2019 (ISP Management (M) Sdn Bhd) 16 July 2019
• Audit Committee Seminar for the Public and Private Sectors 2019 (ARAM Global Sdn Bhd)
17 December 2019
MSM MalaySia HoldingS BerHad | annual report 201978
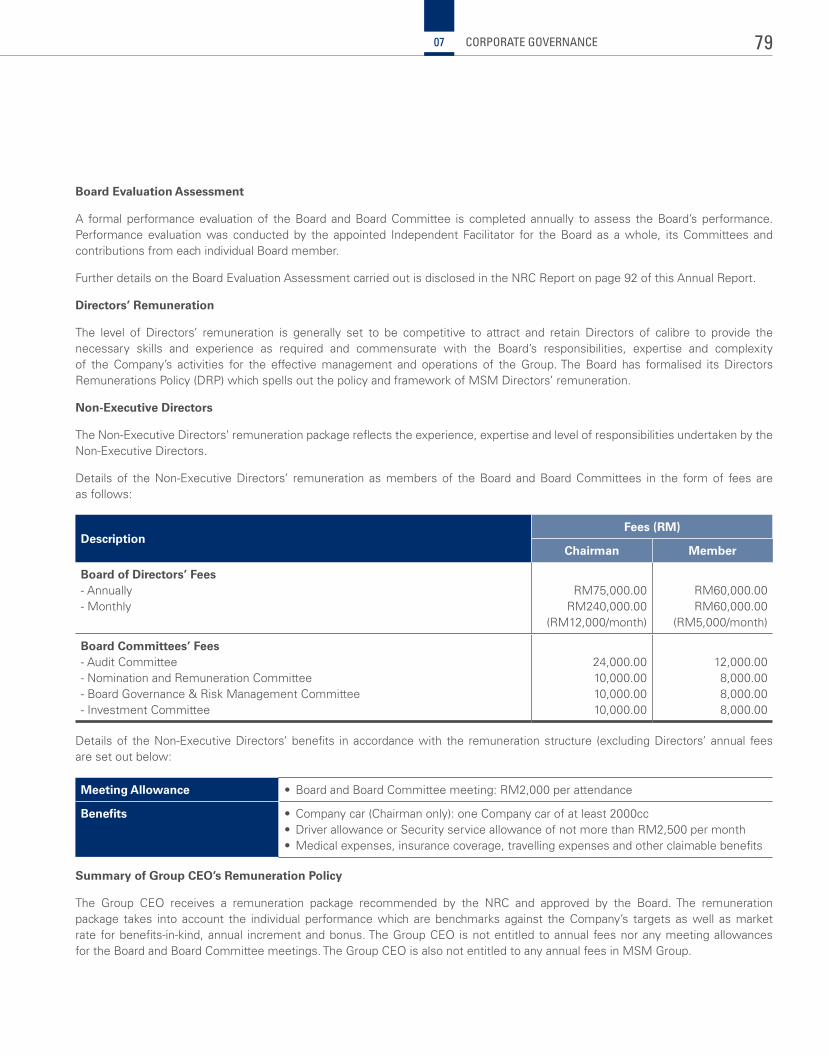
Board Evaluation Assessment
A formal performance evaluation of the Board and Board Committee is completed annually to assess the Board’s performance. Performance evaluation was conducted by the appointed Independent Facilitator for the Board as a whole, its Committees and contributions from each individual Board member.
Further details on the Board Evaluation Assessment carried out is disclosed in the NRC Report on page 92 of this Annual Report.
Directors’ Remuneration
The level of Directors’ remuneration is generally set to be competitive to attract and retain Directors of calibre to provide the necessary skills and experience as required and commensurate with the Board’s responsibilities, expertise and complexity of the Company’s activities for the effective management and operations of the Group. The Board has formalised its Directors Remunerations Policy (DRP) which spells out the policy and framework of MSM Directors’ remuneration.
Non-Executive Directors
The Non-Executive Directors’ remuneration package reflects the experience, expertise and level of responsibilities undertaken by the Non-Executive Directors.
Details of the Non-Executive Directors’ remuneration as members of the Board and Board Committees in the form of fees are as follows:
DescriptionFees (RM)
Chairman Member
Board of Directors’ Fees- Annually- Monthly
RM75,000.00RM240,000.00
(RM12,000/month)
RM60,000.00RM60,000.00
(RM5,000/month)
Board Committees’ Fees- Audit Committee- Nomination and Remuneration Committee- Board Governance & Risk Management Committee- Investment Committee
24,000.0010,000.0010,000.0010,000.00
12,000.00 8,000.00 8,000.00 8,000.00
Details of the Non-Executive Directors’ benefits in accordance with the remuneration structure (excluding Directors’ annual fees are set out below:
Meeting Allowance • Board and Board Committee meeting: RM2,000 per attendance
Benefits • Company car (Chairman only): one Company car of at least 2000cc• Driver allowance or Security service allowance of not more than RM2,500 per month• Medical expenses, insurance coverage, travelling expenses and other claimable benefits
Summary of Group CEO’s Remuneration Policy
The Group CEO receives a remuneration package recommended by the NRC and approved by the Board. The remuneration package takes into account the individual performance which are benchmarks against the Company’s targets as well as market rate for benefits-in-kind, annual increment and bonus. The Group CEO is not entitled to annual fees nor any meeting allowances for the Board and Board Committee meetings. The Group CEO is also not entitled to any annual fees in MSM Group.
79CORPORATE GOVERNANCE07
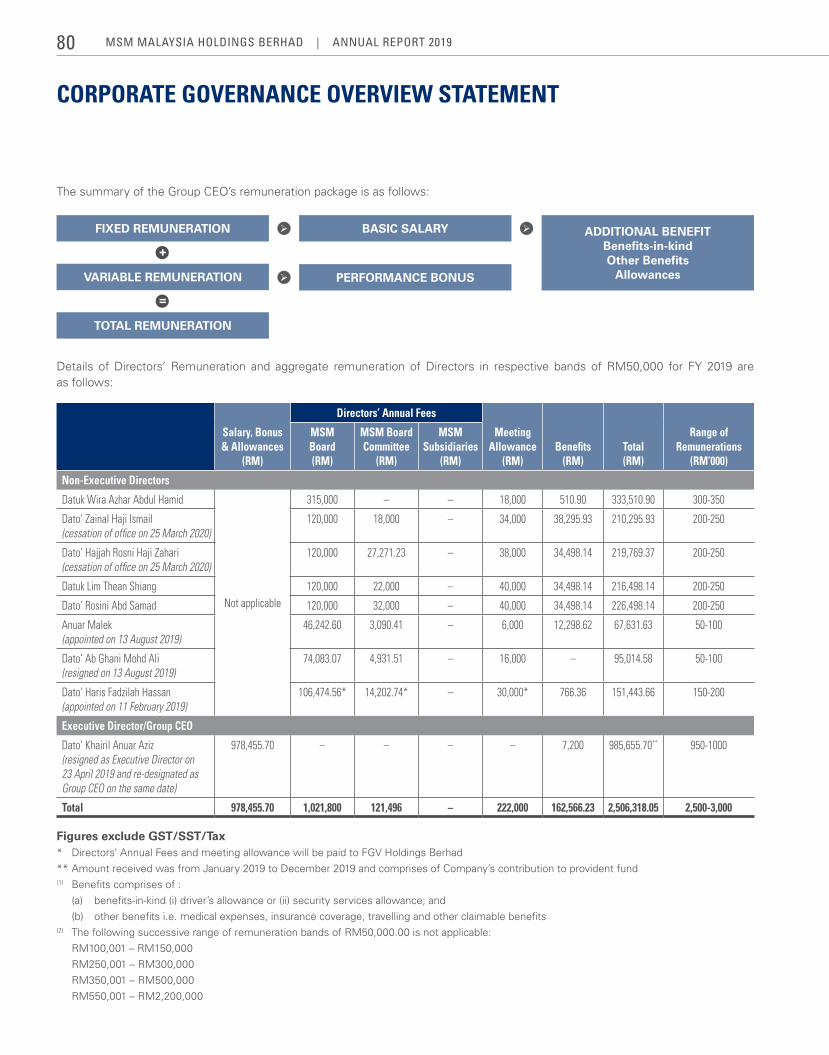
CORPORATE GOVERNANCE OVERVIEW STATEMENT
Details of Directors’ Remuneration and aggregate remuneration of Directors in respective bands of RM50,000 for FY 2019 are as follows:
Salary, Bonus & Allowances
(RM)
Directors’ Annual Fees
Meeting Allowance
(RM)Benefits
(RM)Total (RM)
Range of Remunerations
(RM’000)
MSM Board (RM)
MSM Board Committee
(RM)
MSM Subsidiaries
(RM)
Non-Executive Directors
Datuk Wira Azhar Abdul Hamid
Not applicable
315,000 – – 18,000 510.90 333,510.90 300-350
Dato’ Zainal Haji Ismail(cessation of office on 25 March 2020)
120,000 18,000 – 34,000 38,295.93 210,295.93 200-250
Dato’ Hajjah Rosni Haji Zahari(cessation of office on 25 March 2020)
120,000 27,271.23 – 38,000 34,498.14 219,769.37 200-250
Datuk Lim Thean Shiang 120,000 22,000 – 40,000 34,498.14 216,498.14 200-250
Dato’ Rosini Abd Samad 120,000 32,000 – 40,000 34,498.14 226,498.14 200-250
Anuar Malek (appointed on 13 August 2019)
46,242.60 3,090.41 – 6,000 12,298.62 67,631.63 50-100
Dato’ Ab Ghani Mohd Ali (resigned on 13 August 2019)
74,083.07 4,931.51 – 16,000 – 95,014.58 50-100
Dato’ Haris Fadzilah Hassan(appointed on 11 February 2019)
106,474.56* 14,202.74* – 30,000* 766.36 151,443.66 150-200
Executive Director/Group CEO
Dato’ Khairil Anuar Aziz (resigned as Executive Director on 23 April 2019 and re-designated as Group CEO on the same date)
978,455.70 – – – – 7,200 985,655.70** 950-1000
Total 978,455.70 1,021,800 121,496 – 222,000 162,566.23 2,506,318.05 2,500-3,000
Figures exclude GST/SST/Tax* Directors’ Annual Fees and meeting allowance will be paid to FGV Holdings Berhad** Amount received was from January 2019 to December 2019 and comprises of Company’s contribution to provident fund(1) Benefits comprises of :
(a) benefits-in-kind (i) driver’s allowance or (ii) security services allowance; and (b) other benefits i.e. medical expenses, insurance coverage, travelling and other claimable benefits
(2) The following successive range of remuneration bands of RM50,000.00 is not applicable: RM100,001 – RM150,000 RM250,001 – RM300,000 RM350,001 – RM500,000 RM550,001 – RM2,200,000
The summary of the Group CEO’s remuneration package is as follows:
FIXED REMUNERATION BASIC SALARY ADDITIONAL BENEFITBenefits-in-kindOther Benefits
AllowancesVARIABLE REMUNERATION PERFORMANCE BONUS
TOTAL REMUNERATION
+
=
MSM MalaySia HoldingS BerHad | annual report 201980
PRINCIPLE B: EFFECTIVE AUDIT AND RISK MANAGEMENT
Audit Committee
The Board has established an Audit Committee (AC) to provide robust oversight on financial reporting, external and internal audit processes and related party transactions. The AC members possess the requisite financial literacy and business knowledge that support the sound understanding of matters under their purview.
The AC has unrestricted access to both the internal and external auditors, who report functionally and directly to the AC. The AC has established transparent arrangements to maintain an appropriate relationship with the Company’s external auditors. The external auditor has provided assurance that its personnel are and have been independent throughout the conduct of the audit in accordance to the terms of relevant professional and regulatory requirements.
Oversight of Financial Reporting
The Board ensures that shareholders are presented with a clear, balanced and comprehensive view of the Group’s financial performance and prospects through the audited financial statements, quarterly announcement of financial results, the Chairman’s Statement and the Management Discussion and Analysis (MD&A) on page 105, page 43, page 4 and page 33 in the Annual Report as well as corporate announcements on significant developments affecting the Company in accordance with the MMLR. The Directors considered the compliance with all applicable financial reporting standards, provision of the Companies Act 2016 and relevant provision of laws and regulations in Malaysia.
The AC updates the Board on the matters deliberated in the AC Meetings. Details on the summary of work carried out during the year is set out in page 84 in the AC Report.
Risk Management and Internal Controls
The Board affirms its overall responsibility for the Group’s Statement of Risk Management and Internal Control (SORMIC). The AC provides an independent assessment of the effectiveness of the MSM’s Enterprise Risk Management (ERM) framework and reports to the Board yearly. Key elements of the Group’s control environment include Organisation Structure, Audit Committee, Group Internal Audit, Code of Business Practice, Business Continuity Management, Legal, Company Secretary, Limits of Authority, Polices and Procedures, Financial and Operational Information and Systems and Information Security.
The Group operates within a clearly defined organisational structure with established responsibilities, authorities and reporting lines to the Board. The organisational structure has been designed in order to develop, plan, execute, monitor and control the Group’s objectives effectively and to ensure that internal controls are embedded within the operations.
Further information on the Group’s risk management and internal control framework is made available on the SORMIC of the page 98 of Annual Report.
PRINCIPLE C: INTEGRITY IN CORPORATE REPORTING AND MEANINGFUL RELATIONSHIP WITH STAKEHOLDERS
Relations and Communications with Stakeholders
The Company has a Corporate Disclosure Policy stipulating the proper framework and guidelines to govern the release of information to ensure that comprehensive, accurate and timely disclosures are provided to shareholders and stakeholders. The Corporate Disclosure Policy also regulates the review and release of information to Bursa Malaysia as well as through the Company’s website, facilitating timely and accurate disclosure of the Company’s affairs.
The Company communicates with its shareholders and stakeholders through the following channels of communication:
• AnnualReport
This is MSM’s 9th Annual Report produced since its listing on Bursa Malaysia on 28 June 2011. The report provides a comprehensive view on the Group’s operational and financial performance.
An online version of the complete Annual Report is made available on MSM’s corporate website for download. Our share registrar will ensure that the printed copy reaches shareholders within four days after receiving the request form.
• CorporateWebsite
The Company’s corporate website has become a key communication channel to reach its shareholders and the general public. Financial results, Annual Reports, Bursa Malaysia announcements, corporate presentations and other information on the Company are published on the Company’s corporate website. The presentation slides for research analyst briefings and press releases are also made available to the public via Company’s corporate website, http://www.msmsugar.com
81CORPORATE GOVERNANCE07
CORPORATE GOVERNANCE OVERVIEW STATEMENT
Conduct of General Meeting
The Company’s Annual General Meeting (AGM), is the primary platform for communication with the widest range of shareholders.
The Chairman, at the commencement of a general meeting, informs shareholders of their right to vote. The Board considers the use of electronic voting for polling to facilitate greater shareholders’ participation, taking into consideration its availability, reliability, applicability, cost and efficiency. MSM shall appoint a poll Administrator to handle the polling process and Independent Scrutineers to verify the results of the poll.
The Chairman of the Board chaired the 8th AGM of the Company held on 19 June 2019 in an orderly manner and allowed the shareholders or proxies to speak at the meeting. All Directors were present to the 8th AGM to respond to the questions raised by the shareholders or proxies.
The Group CEO presented the Company’s operational and financial performance for the financial year under review. The presentation covered salient points on financial, operational performance and return on shareholders’ fund. Questions raised by the Minority Shareholder Watch Group (MSWG) prior to the AGM together with feedback from Management were also shared with shareholders during the AGM. The Chairman provided fair opportunity and time to all shareholders in exercising their rights to raise questions.
A media conference was held immediately after the 8th AGM whereby one of the Board of Director, Group CEO, Group COO, CFO and relevant Senior Management were present to update the media representatives on the resolutions passed and answered questions on matters related to the Group. Results of all resolutions passed at the 8th AGM were announced on the same day via Bursa LINK.
Statement by the Board
This Corporate Governance Overview Statement is made in accordance with the resolution of the Board of Directors dated 17 April 2020.
On behalf of the Board
DATUK WIRA AZHAR ABDUL HAMID Chairman
MSM MalaySia HoldingS BerHad | annual report 201982
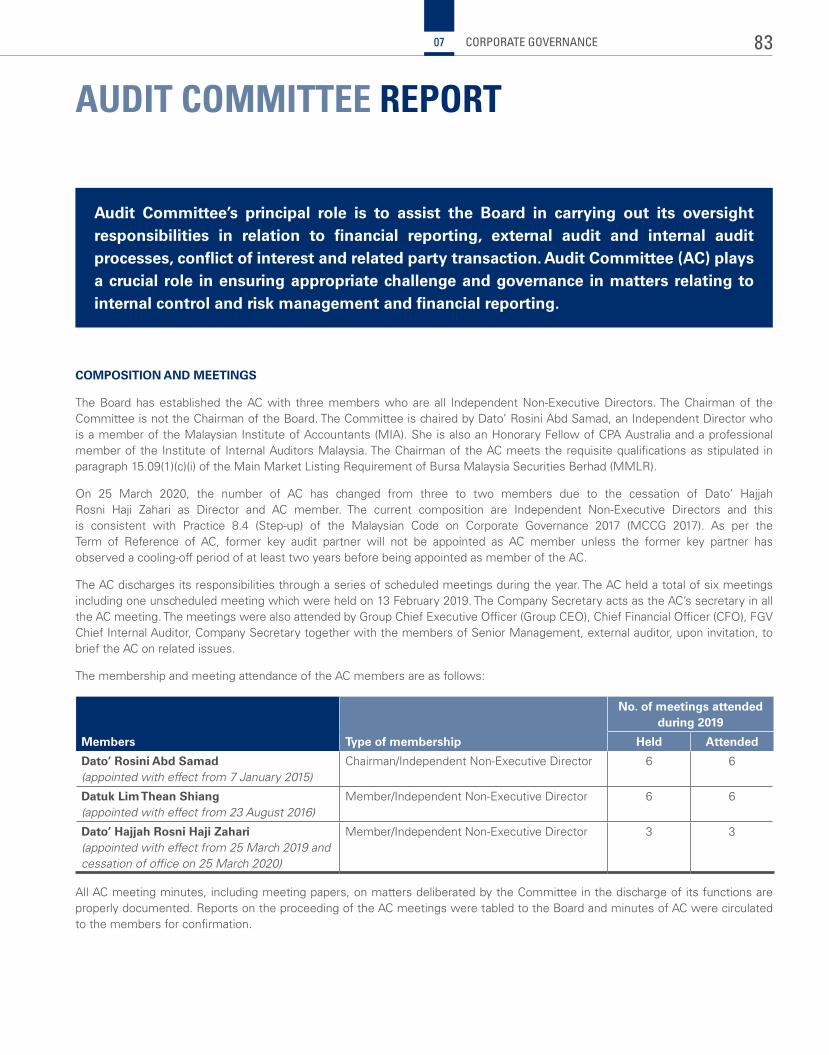
AUDIT COMMITTEE REPORT
COMPOSITION AND MEETINGS
The Board has established the AC with three members who are all Independent Non-Executive Directors. The Chairman of the Committee is not the Chairman of the Board. The Committee is chaired by Dato’ Rosini Abd Samad, an Independent Director who is a member of the Malaysian Institute of Accountants (MIA). She is also an Honorary Fellow of CPA Australia and a professional member of the Institute of Internal Auditors Malaysia. The Chairman of the AC meets the requisite qualifications as stipulated in paragraph 15.09(1)(c)(i) of the Main Market Listing Requirement of Bursa Malaysia Securities Berhad (MMLR).
On 25 March 2020, the number of AC has changed from three to two members due to the cessation of Dato’ Hajjah Rosni Haji Zahari as Director and AC member. The current composition are Independent Non-Executive Directors and this is consistent with Practice 8.4 (Step-up) of the Malaysian Code on Corporate Governance 2017 (MCCG 2017). As per the Term of Reference of AC, former key audit partner will not be appointed as AC member unless the former key partner has observed a cooling-off period of at least two years before being appointed as member of the AC.
The AC discharges its responsibilities through a series of scheduled meetings during the year. The AC held a total of six meetings including one unscheduled meeting which were held on 13 February 2019. The Company Secretary acts as the AC’s secretary in all the AC meeting. The meetings were also attended by Group Chief Executive Officer (Group CEO), Chief Financial Officer (CFO), FGV Chief Internal Auditor, Company Secretary together with the members of Senior Management, external auditor, upon invitation, to brief the AC on related issues.
The membership and meeting attendance of the AC members are as follows:
Members Type of membership
No. of meetings attended during 2019
Held Attended
Dato’ Rosini Abd Samad (appointed with effect from 7 January 2015)
Chairman/Independent Non-Executive Director 6 6
Datuk Lim Thean Shiang (appointed with effect from 23 August 2016)
Member/Independent Non-Executive Director 6 6
Dato’ Hajjah Rosni Haji Zahari(appointed with effect from 25 March 2019 and cessation of office on 25 March 2020)
Member/Independent Non-Executive Director 3 3
All AC meeting minutes, including meeting papers, on matters deliberated by the Committee in the discharge of its functions are properly documented. Reports on the proceeding of the AC meetings were tabled to the Board and minutes of AC were circulated to the members for confirmation.
Audit Committee’s principal role is to assist the Board in carrying out its oversight responsibilities in relation to financial reporting, external audit and internal audit processes, conflict of interest and related party transaction. Audit Committee (AC) plays a crucial role in ensuring appropriate challenge and governance in matters relating to internal control and risk management and financial reporting.
83CORPORATE GOVERNANCE07
AUDIT COMMITTEE REPORT
TERMS OF REFERENCE
The AC’s Terms of Reference (TOR) has been established pursuant to the MMLR and was approved by the Board to guide the AC in the discharge of its functions and duties. In addition, the TOR also recognises and adopts related better practices and guidance from the MCCG 2017 and the Corporate Governance Guide 3rd Edition.
The AC continuously reviews and updates its TOR with the last review and approved by the Board on 20 November 2019.
The full details of the AC’s TOR is published in the Company’s corporate website at http://www.msmsugar.com/our-company/corporate-governance.
The existence of the AC does not diminish the Board’s ultimate statutory and fiduciary responsibility for decision-making relating to the functions and duties of the AC.
SUMMARY OF WORK OF THE AUDIT COMMITTEE IN 2019
Throughout the six meetings held and various private sessions with the external auditors, and internal auditors, the AC undertook the following principal activities in the discharge of its responsibilities:
Financial Reporting
• Reviewed unaudited quarterly financial results, any change in accounting policies, the going concerns assumption, and compliance with accounting standards and regulatory requirements for recommendation to the Board for approval.
• Considered and reviewed the draft of the audited financial statements for the year ended 31 December 2018 in March 2019 together with the Directors’ and Auditor’s and concluded that the financial report presented a true and a fair view of the Company’s financial performance for the year and was in compliance with regulatory requirements.
• Reviewed the significant matters highlighted by the auditors in the financial statements and significant judgment made by management.
• Reviewed matters related to loan facilities of MSM before recommending to the Board for approval.
• Reviewed the Group’s consolidated cashflow projection for the financial year.
• Reviewed the status of construction of Johor Refinery.
• Reviewed the compliance of the financial covenants.
• Reviewed the closure of MSM Perlis Sdn Bhd (MSM Perlis)
• Reviewed the process for the closure of MSM Trading International DMCC (MTID).
Assessing the Risks and Control Environment
• Evaluated the reports on the assessment of the risks and control environment based on the external auditor’s quarterly financial statement review and statutory financial audits at each AC meeting.
• Reviewed all internal audit reports issued by the Group Internal Audit, which detailed the observations from all the internal audits undertaken.
• Received assurances from the Group CEO and CFO that the risk management and internal control system of the Group for the financial year 2019 have been operating adequately and effectively, in all material aspects.
• Monitored the implementation of corrective actions under taken by management. Management provided justification and improvement for the key matters highlighted by internal and external auditors.
• Provided relevant guidance for the improvement of the risks and internal control of the Group, particularly in the areas of raw and refined sugar trading which was the key focus area of the Group during the financial year. This includes improvements in the monitoring and systems.
Internal Audit Process
• Reviewed and approved MSM Group Annual Internal Audit Plan for the year 2020 by assessing the priority ranking of the audit universe to provide sufficient audit coverage.
• Assessed the adequacy of resources of the internal audit function to execute the MSM Group Annual Internal Audit Plan after taking into consideration the number of planned assignments and competencies required.
MSM MalaySia HoldingS BerHad | annual report 201984
• Presented and reviewed quarterly reports summarising the following at every quarterly meeting during the FY 2019:
• The observations from the internal audit reports issued during the quarter. The AC gave direction to management on key matters requiring management’s special and immediate attention. The AC has reported to the Board on these key significant matters.
• The progress of implementation of the recommendations from internal audit reports issued.
• The progress of implementation of the MSM Group Annual Internal Audit Plan.
• Considered major findings, key significant internal audit matters, outcome of any special reviews and investigations, including those arising from management and recommendation raised by AC Chairman and AC members and management’s response and follow-up actions thereto, and reported to the Board.
• Reviewed the performance of the Chief Internal Auditor and competency of the internal audit functions to ensure that the internal audit team has the required expertise and professionalism to discharge its duties.
Reviewing the External Audit Process
• Held two private discussion sessions with external auditor, Messrs Pricewaterhousecoopers PLT (PwC) without management on 11 February 2019 and 13 August 2019.
In these sessions, the matters discussed include the following:
(i) Finance function in improvement of consolidating the account
(ii) Transfer of MSM Perlis Sdn Bhd operation to Johor
(iii) The implications of closing down MSM Perlis Sdn Bhd
(iv) Sales of plantation land in Perlis
(v) MSM Sugar Refinery (Johor) Sdn Bhd’s Plan
• Reviewed the financial results prior to the approval by the Board and discussed the key matters highlighted by PwC. During the year, amongst matters discussed include the following:
(i) Assessment of onerous contracts provision in respect of forward sales export contracts.
(ii) Impairment assessment on Goodwill from Sugar Cluster
(iii) Status of construction of the Johor Refinery
(iv) Assessment of the Group Plantation operations in accordance with MFRS 5
(v) Recoverability of Trade Receivables above credit terms and credit limit assessment
• Reviewed and approved the External Auditor’s Audit Plan and scope of work in August 2019.
• PwC presented the MSM 2020 Group Audit Plan at the AC meeting held on 13 August 2019. During their presentation, PwC confirmed their independence as auditor. As included in the 2020 Group Audit Plan, PwC also highlighted to the AC
(a) MSM’s 2020 focus areas:
i) Risk of Management override of controls (in line with International Standard of Auditing requirement)
ii) Recoverability of non-current assets (including Goodwill)
iii) Recoverability of inventories and adequacy provision of onerous contracts
iv) Risk on non-compliance of financial covenants attached to the construction of new sugar refinery
v) Ensuring restructuring of CIMB long term loan is accounted for in accordance with MFRS 9
vi) Risk of inconsistency of practice and account treatment in MSM Sugar Refinery (Johor) Sdn Bhd
85CORPORATE GOVERNANCE07
AUDIT COMMITTEE REPORT
(b) Recent developments in laws and regulations which cover the following:
i) Development in Accounting Standards
ii) Recent Tax Developments
iii) MIA Competency Framework for Finance function in Public Interest Entities
• The AC also noted the declaration of independence by PwC.
• Analysed the external audit fees proposed in respect of the scope of work required for the financial year and recommended the same for approval by the Board.
• Held four meetings with PwC in February, May, August and November 2019 to review the financial results and areas of concerns identified.
• Reviewed the assessment of the external auditor for FY 2018 for reappointment based on input from management and recommended the same for approval by the Board.
Related Party Transactions
• Analysed the quarterly report on Recurrent Related Party Transactions for monitoring the transactions against the shareholders’ mandate.
• Reviewed the Circular to the shareholders to seek mandate on the existing Recurrent Related Party Transactions of the Group and recommended the same for approval of the Board.
• Periodically reviewed the Recurrent Related Party Transactions that were mandated at the 8th AGM held on 19 June 2019 and tracked the transaction against the mandated amount.
• Reviewed the internal audit report on Recurrent Related Party Transactions.
Governance
• The AC Chairman updated the Board on significant matters deliberated at AC meeting. The report by the Chairman of AC to the Board was made standing agenda item at the quarterly meetings of the Board.
• Reviewed the following reports and recommended them for the Board’s approval for inclusion in the Annual Report for the FY 2018:
i) Corporate Governance Overview Statement and Corporate Governance Report
ii) AC Report
iii) Statement of Risk Management and Internal Control
iv) Sustainability Reporting on Economic, Environmental and Social
The AC reviewed the reports with focus on meeting the MMLR and reporting best practises based on the guidance from the MCCG 2017, Guidance to Directors of Public Listed Companies on the Statement of Risk Management and Internal Control and other best practise references.
• Reviewed and approved the schedule of AC Meetings for year 2020.
ExTERNAL AUDITOR POLICY
The External Auditor Policy (Policy) was developed to provide guidance on matters related to dealing with the External Auditor for the statutory audit of MSM Group. This Policy was approved by the Board on 23 February 2016.
The Policy covers appointment and reappointment of external auditors, assessment of external auditors’ performance and independence, audit partner rotation, audit delivery and reporting, engagement of external auditor for non-audit services and removal of external auditor.
During the FY 2019, there was no non-audit fees services rendered by the external auditor.
CONTINUOUS LEARNING AND DEVELOPMENT
The AC members are updated regularly on changes of accounting standards and issues related to financial reporting through quarterly meetings.
The members of the AC had attended various seminars, training programme and conferences to keep abreast with changes in the industry and business environment.
MSM MalaySia HoldingS BerHad | annual report 201986
A training on the Malaysian Financial Reporting Standards (MFRS) Training was conducted by Messrs. PricewaterhouseCoopers PLT on 29 November 2019. The AC Chairman was updated on the MFRS that impact MSM.
Further details on the training attended by AC members during FY 2019 are detailed out in the Corporate Governance Overview Statement under Directors’ Training on page 77 of this Annual Report.
AUDIT COMMITTEE EVALUATION
For year of assessment of 2018, Board Evaluation Assessment was carried out in 2019 which encompassed the performance of the AC and the AC Chairman as well as the independence of the Independent Directors. The assessment focused on how effective the AC has conducted its activities. Based on the evaluation performed, the AC had effectively and professionally discharged its duties and responsibilities to the benefit of the Company.
For year of assessment of 2019, the AC’s Evaluation is in progress and will be disclosed in the 2020 Annual Report.
INTERNAL AUDIT
The internal audit role for the MSM Group is undertaken by the Group Internal Audit (GIA) of the holding company, FGV Holdings Berhad (FGV). The FGV Chief Internal Auditor reports functionally directly to the AC of MSM. The conduct of GIA is based on a Group Internal Audit Charter, which was established consistent with the requirements of Institute of Internal Auditor’s International Professional Practise of Framework and affirmed through a Quality Assurance Review conducted by Messrs. Ernst & Young Advisory Services Sdn Bhd in 2019.
The FGV Chief Internal Auditor, Puan Zalily Mohd. Zaman Khan, is a fellow member of CPA Australia, a Chartered Accountant with the Malaysian Institute of Accountants, a professional member of the Institute of Internal Auditors Malaysia, a Certified Internal Auditor of the Institute of Internal Auditors (IIA), USA and holds an accounting degree from University of South Australia. She holds a Certification in Control Self-Assessment and a Certification in Risk Management Assurance awarded by the IIA in USA and had served as a member of the IIA Malaysia’s Research and Technical Advisory Committee for several years. She has accumulated almost 30 years of experience in various industries.
The FGV Chief Internal Auditor leads the internal audits across MSM Group. Four internal auditors comprising of a Senior General Manager, a Manager and one team of two persons from the FGV GIA have been specifically assigned for audits of MSM Group throughout the financial year. The team may be supplemented with personnel from other segments of GIA’s organisation structure where it is deemed required. MSM also has the benefit of the FGV IT audit team that perform internal audit work related to information technology.
The total number of internal auditors allocated is appropriate and sufficient in terms of the mix of knowledge, skills and other competencies in line with the scope of the audit and size of MSM Group. Composition of the internal auditors and the corresponding professional status are as follows:
Professional Status No. of Auditors
Professional accounting (ICAEW, CPA, ACCA, CA) or Certified Internal Auditor (CIA) or post graduate (MBA or Masters)
2
Graduate 2
Total 4
The above includes two internal auditors who are members of the Institute of Internal Auditors Malaysia. The total cost incurred for FGV GIA for the FY 2019 was RM1,175,579 (2018: RM 1,119,599).
OBJECTIVITY AND INDEPENDENCE OF GIA
FGV GIA has undertaken a survey of the relationship of its internal auditors in October 2019 and noted that the internal auditors are free from any relationship or conflicts of interests which could impair their objectivity and independence. GIA undertakes a survey of the relationship of its auditors once every two years and ensures that the rotation of internal auditors does not result in any compromise of objectivity and independence.
87CORPORATE GOVERNANCE07
AUDIT COMMITTEE REPORT
SUMMARY OF WORK OF THE INTERNAL AUDIT FUNCTION
GIA provides independent and objective assurance of the adequacy and effectiveness of risk management, controls and governance processes covering all operations of the Group. In conducting their independent audits, GIA adopted a risk based internal audit approach by focusing on the assessment of significant risk areas. During the financial year under review, GIA has undertaken the following main activities:
a) Reviewed GIA’s three year audit plan and forms the basis to derive the Annual Group Internal Audit Plan. The three year audit plan was developed based on the exposure prioritisation. Once the key audit areas are developed, the staff and resource allocation plan, budget estimates and staff development progress are established to support the Audit Plan. The Annual Group Internal Audit Plan is presented to the AC for approval.
b) Carried out internal audits according to the Annual Group Internal Audit Plan approved by the AC and reported the findings, recommendations and management’s corrective action directly to the AC with copies to the relevant management for their action. The scope of work was focused on the following key areas:-
• Governance Framework and Structure
• Finance Processes
• Inventory Management
• Trading Processes
• Project Management
• Procurement
• Fixed Asset Management
In 2019, GIA undertook seven internal audit assignments (i.e. three assurance audits, two special reviews and two investigations) which consumed 592 mandays in comparison to 526 budgeted mandays during the year.
c) Presented to the AC at its quarterly meetings, key findings from the internal audit reports issued.
d) Reported to the AC, the progress of the findings, recommendation and management’s corrective action implementation from internal audit reports issued.
e) Undertook Recurrent Related Party Transactions review for the purpose of supporting the AC’s statement in the Circular to the shareholders to seek mandate on new and existing Recurrent Related Party Transactions of the Group.
f) In addition to the assurance role, GIA also undertook consulting role and investigation role. Key activities carried out were amongst others, as follows:
i) Undertook investigation and reported the outcome of such investigations to the AC and management.
ii) Provided feedback on the Statement on Risk Management and Internal Control 2018, the Report on the AC 2018 and the Corporate Governance Overview Statement 2018 before submission to the AC.
STATEMENT BY THE BOARD
This AC Report is made in accordance with a resolution of the Board of Directors duly passed on 17 April 2020.
MSM MalaySia HoldingS BerHad | annual report 201988
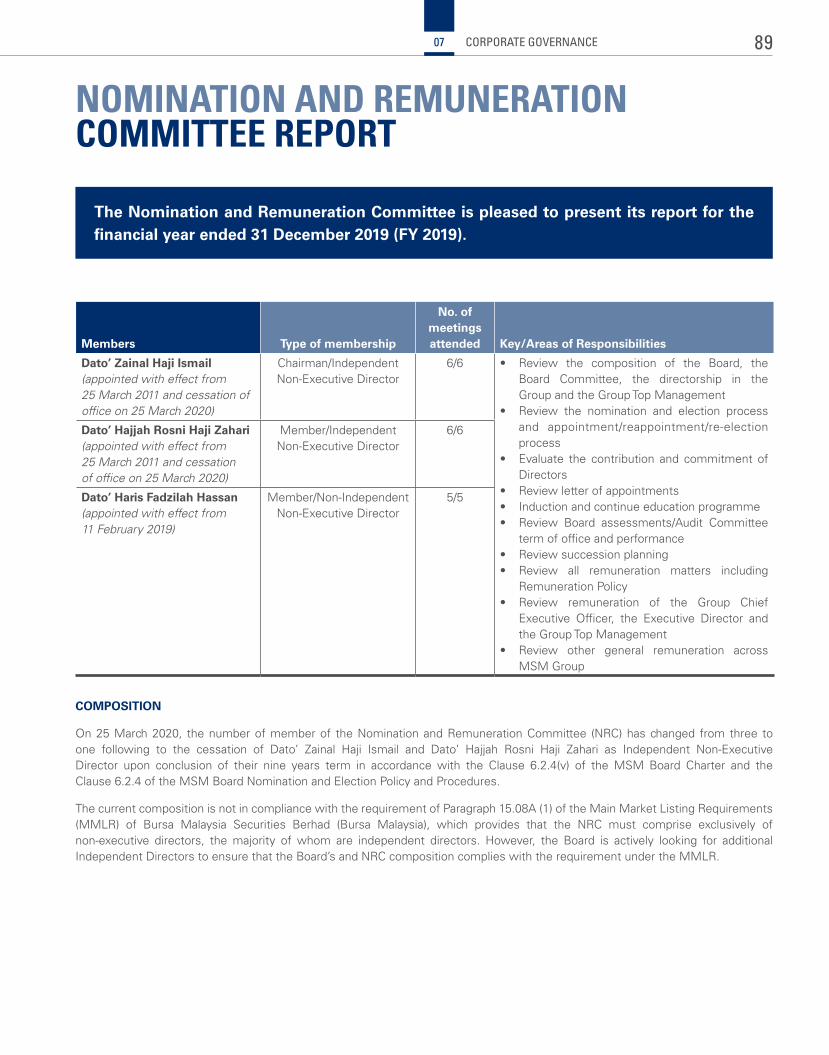
NOMINATION AND REMUNERATION COMMITTEE REPORT
Members Type of membership
No. of meetings attended Key/Areas of Responsibilities
Dato’ Zainal Haji Ismail (appointed with effect from 25 March 2011 and cessation of office on 25 March 2020)
Chairman/Independent Non-Executive Director
6/6 • Review the composition of the Board, the Board Committee, the directorship in the Group and the Group Top Management
• Review the nomination and election process and appointment/reappointment/re-election process
• Evaluate the contribution and commitment of Directors
• Review letter of appointments• Induction and continue education programme• Review Board assessments/Audit Committee
term of office and performance• Review succession planning• Review all remuneration matters including
Remuneration Policy• Review remuneration of the Group Chief
Executive Officer, the Executive Director and the Group Top Management
• Review other general remuneration across MSM Group
Dato’ Hajjah Rosni Haji Zahari (appointed with effect from 25 March 2011 and cessationof office on 25 March 2020)
Member/Independent Non-Executive Director
6/6
Dato’ Haris Fadzilah Hassan (appointed with effect from 11 February 2019)
Member/Non-Independent Non-Executive Director
5/5
COMPOSITION
On 25 March 2020, the number of member of the Nomination and Remuneration Committee (NRC) has changed from three to one following to the cessation of Dato’ Zainal Haji Ismail and Dato’ Hajjah Rosni Haji Zahari as Independent Non-Executive Director upon conclusion of their nine years term in accordance with the Clause 6.2.4(v) of the MSM Board Charter and the Clause 6.2.4 of the MSM Board Nomination and Election Policy and Procedures.
The current composition is not in compliance with the requirement of Paragraph 15.08A (1) of the Main Market Listing Requirements (MMLR) of Bursa Malaysia Securities Berhad (Bursa Malaysia), which provides that the NRC must comprise exclusively of non-executive directors, the majority of whom are independent directors. However, the Board is actively looking for additional Independent Directors to ensure that the Board’s and NRC composition complies with the requirement under the MMLR.
The Nomination and Remuneration Committee is pleased to present its report for the financial year ended 31 December 2019 (FY 2019).
89CORPORATE GOVERNANCE07
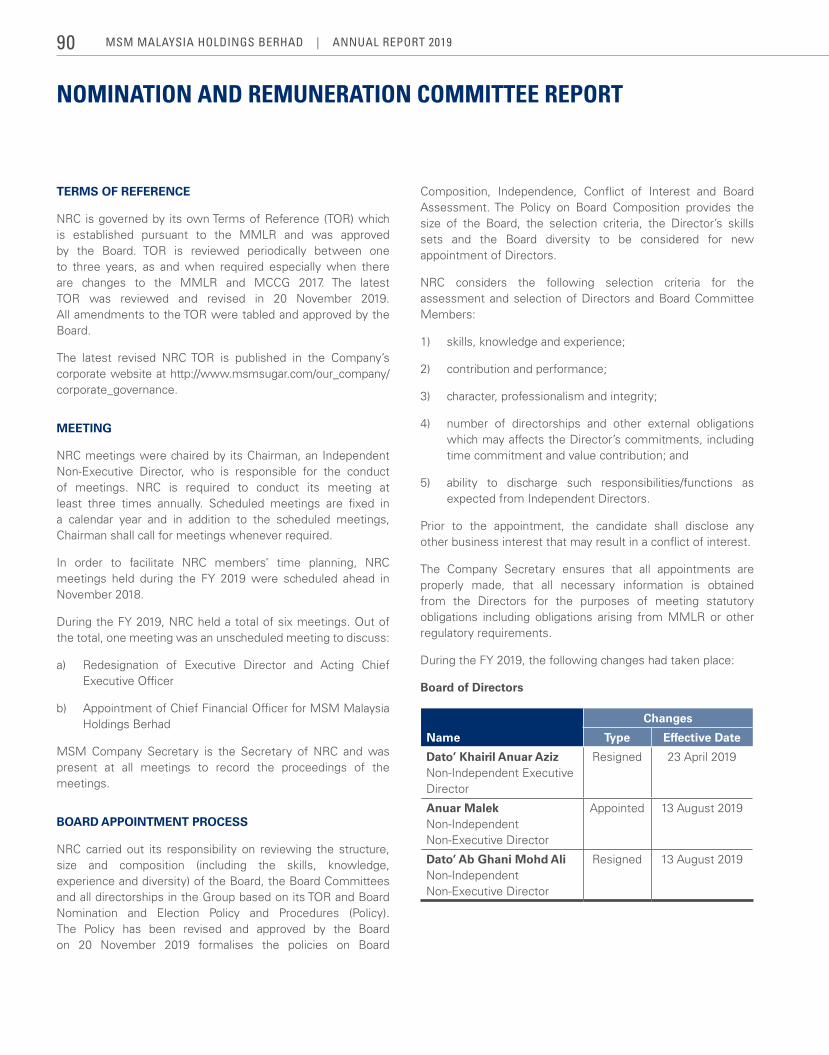
NOMINATION AND REMUNERATION COMMITTEE REPORT
TERMS OF REFERENCE
NRC is governed by its own Terms of Reference (TOR) which is established pursuant to the MMLR and was approved by the Board. TOR is reviewed periodically between one to three years, as and when required especially when there are changes to the MMLR and MCCG 2017. The latest TOR was reviewed and revised in 20 November 2019. All amendments to the TOR were tabled and approved by the Board.
The latest revised NRC TOR is published in the Company’s corporate website at http://www.msmsugar.com/our_company/corporate_governance.
MEETING
NRC meetings were chaired by its Chairman, an Independent Non-Executive Director, who is responsible for the conduct of meetings. NRC is required to conduct its meeting at least three times annually. Scheduled meetings are fixed in a calendar year and in addition to the scheduled meetings, Chairman shall call for meetings whenever required.
In order to facilitate NRC members’ time planning, NRC meetings held during the FY 2019 were scheduled ahead in November 2018.
During the FY 2019, NRC held a total of six meetings. Out of the total, one meeting was an unscheduled meeting to discuss:
a) Redesignation of Executive Director and Acting Chief Executive Officer
b) Appointment of Chief Financial Officer for MSM Malaysia Holdings Berhad
MSM Company Secretary is the Secretary of NRC and was present at all meetings to record the proceedings of the meetings.
BOARD APPOINTMENT PROCESS
NRC carried out its responsibility on reviewing the structure, size and composition (including the skills, knowledge, experience and diversity) of the Board, the Board Committees and all directorships in the Group based on its TOR and Board Nomination and Election Policy and Procedures (Policy). The Policy has been revised and approved by the Board on 20 November 2019 formalises the policies on Board
Composition, Independence, Conflict of Interest and Board Assessment. The Policy on Board Composition provides the size of the Board, the selection criteria, the Director’s skills sets and the Board diversity to be considered for new appointment of Directors.
NRC considers the following selection criteria for the assessment and selection of Directors and Board Committee Members:
1) skills, knowledge and experience;
2) contribution and performance;
3) character, professionalism and integrity;
4) number of directorships and other external obligations which may affects the Director’s commitments, including time commitment and value contribution; and
5) ability to discharge such responsibilities/functions as expected from Independent Directors.
Prior to the appointment, the candidate shall disclose any other business interest that may result in a conflict of interest.
The Company Secretary ensures that all appointments are properly made, that all necessary information is obtained from the Directors for the purposes of meeting statutory obligations including obligations arising from MMLR or other regulatory requirements.
During the FY 2019, the following changes had taken place:
Board of Directors
Name
Changes
Type Effective Date
Dato’ Khairil Anuar AzizNon-Independent Executive Director
Resigned 23 April 2019
Anuar MalekNon-Independent Non-Executive Director
Appointed 13 August 2019
Dato’ Ab Ghani Mohd AliNon-Independent Non-Executive Director
Resigned 13 August 2019
MSM MalaySia HoldingS BerHad | annual report 201990
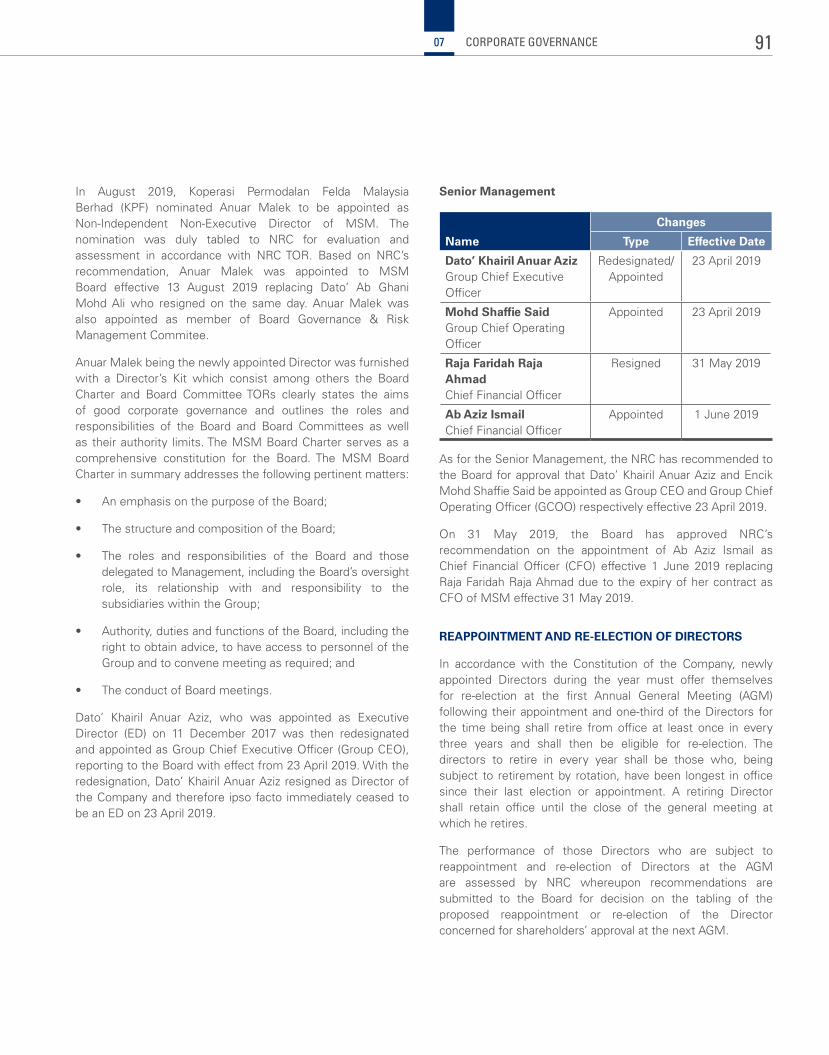
In August 2019, Koperasi Permodalan Felda Malaysia Berhad (KPF) nominated Anuar Malek to be appointed as Non-Independent Non-Executive Director of MSM. The nomination was duly tabled to NRC for evaluation and assessment in accordance with NRC TOR. Based on NRC’s recommendation, Anuar Malek was appointed to MSM Board effective 13 August 2019 replacing Dato’ Ab Ghani Mohd Ali who resigned on the same day. Anuar Malek was also appointed as member of Board Governance & Risk Management Commitee.
Anuar Malek being the newly appointed Director was furnished with a Director’s Kit which consist among others the Board Charter and Board Committee TORs clearly states the aims of good corporate governance and outlines the roles and responsibilities of the Board and Board Committees as well as their authority limits. The MSM Board Charter serves as a comprehensive constitution for the Board. The MSM Board Charter in summary addresses the following pertinent matters:
• An emphasis on the purpose of the Board;
• The structure and composition of the Board;
• The roles and responsibilities of the Board and those delegated to Management, including the Board’s oversight role, its relationship with and responsibility to the subsidiaries within the Group;
• Authority, duties and functions of the Board, including the right to obtain advice, to have access to personnel of the Group and to convene meeting as required; and
• The conduct of Board meetings.
Dato’ Khairil Anuar Aziz, who was appointed as Executive Director (ED) on 11 December 2017 was then redesignated and appointed as Group Chief Executive Officer (Group CEO), reporting to the Board with effect from 23 April 2019. With the redesignation, Dato’ Khairil Anuar Aziz resigned as Director of the Company and therefore ipso facto immediately ceased to be an ED on 23 April 2019.
Senior Management
Name
Changes
Type Effective Date
Dato’ Khairil Anuar AzizGroup Chief Executive Officer
Redesignated/Appointed
23 April 2019
Mohd Shaffie SaidGroup Chief Operating Officer
Appointed 23 April 2019
Raja Faridah Raja AhmadChief Financial Officer
Resigned 31 May 2019
Ab Aziz IsmailChief Financial Officer
Appointed 1 June 2019
As for the Senior Management, the NRC has recommended to the Board for approval that Dato’ Khairil Anuar Aziz and Encik Mohd Shaffie Said be appointed as Group CEO and Group Chief Operating Officer (GCOO) respectively effective 23 April 2019.
On 31 May 2019, the Board has approved NRC’s recommendation on the appointment of Ab Aziz Ismail as Chief Financial Officer (CFO) effective 1 June 2019 replacing Raja Faridah Raja Ahmad due to the expiry of her contract as CFO of MSM effective 31 May 2019.
REAPPOINTMENT AND RE-ELECTION OF DIRECTORS
In accordance with the Constitution of the Company, newly appointed Directors during the year must offer themselves for re-election at the first Annual General Meeting (AGM) following their appointment and one-third of the Directors for the time being shall retire from office at least once in every three years and shall then be eligible for re-election. The directors to retire in every year shall be those who, being subject to retirement by rotation, have been longest in office since their last election or appointment. A retiring Director shall retain office until the close of the general meeting at which he retires.
The performance of those Directors who are subject to reappointment and re-election of Directors at the AGM are assessed by NRC whereupon recommendations are submitted to the Board for decision on the tabling of the proposed reappointment or re-election of the Director concerned for shareholders’ approval at the next AGM.
91CORPORATE GOVERNANCE07
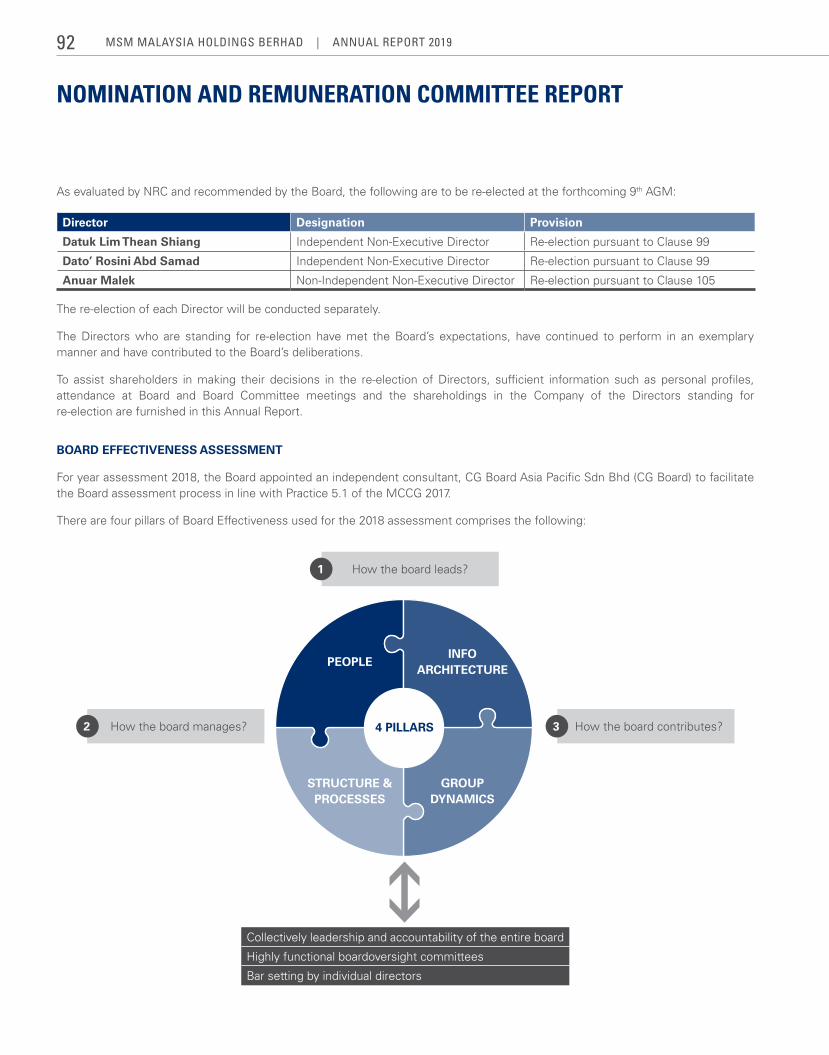
NOMINATION AND REMUNERATION COMMITTEE REPORT
As evaluated by NRC and recommended by the Board, the following are to be re-elected at the forthcoming 9th AGM:
Director Designation Provision
Datuk Lim Thean Shiang Independent Non-Executive Director Re-election pursuant to Clause 99
Dato’ Rosini Abd Samad Independent Non-Executive Director Re-election pursuant to Clause 99
Anuar Malek Non-Independent Non-Executive Director Re-election pursuant to Clause 105
The re-election of each Director will be conducted separately.
The Directors who are standing for re-election have met the Board’s expectations, have continued to perform in an exemplary manner and have contributed to the Board’s deliberations.
To assist shareholders in making their decisions in the re-election of Directors, sufficient information such as personal profiles, attendance at Board and Board Committee meetings and the shareholdings in the Company of the Directors standing for re-election are furnished in this Annual Report.
BOARD EFFECTIVENESS ASSESSMENT
For year assessment 2018, the Board appointed an independent consultant, CG Board Asia Pacific Sdn Bhd (CG Board) to facilitate the Board assessment process in line with Practice 5.1 of the MCCG 2017.
There are four pillars of Board Effectiveness used for the 2018 assessment comprises the following:
4 PILLARS
PEOPLE
STRUCTURE & PROCESSES
INFO ARCHITECTURE
GROUP DYNAMICS
How the board leads?1
How the board contributes?3 How the board manages?2
Collectively leadership and accountability of the entire board
Highly functional boardoversight committees
Bar setting by individual directors
MSM MalaySia HoldingS BerHad | annual report 201992
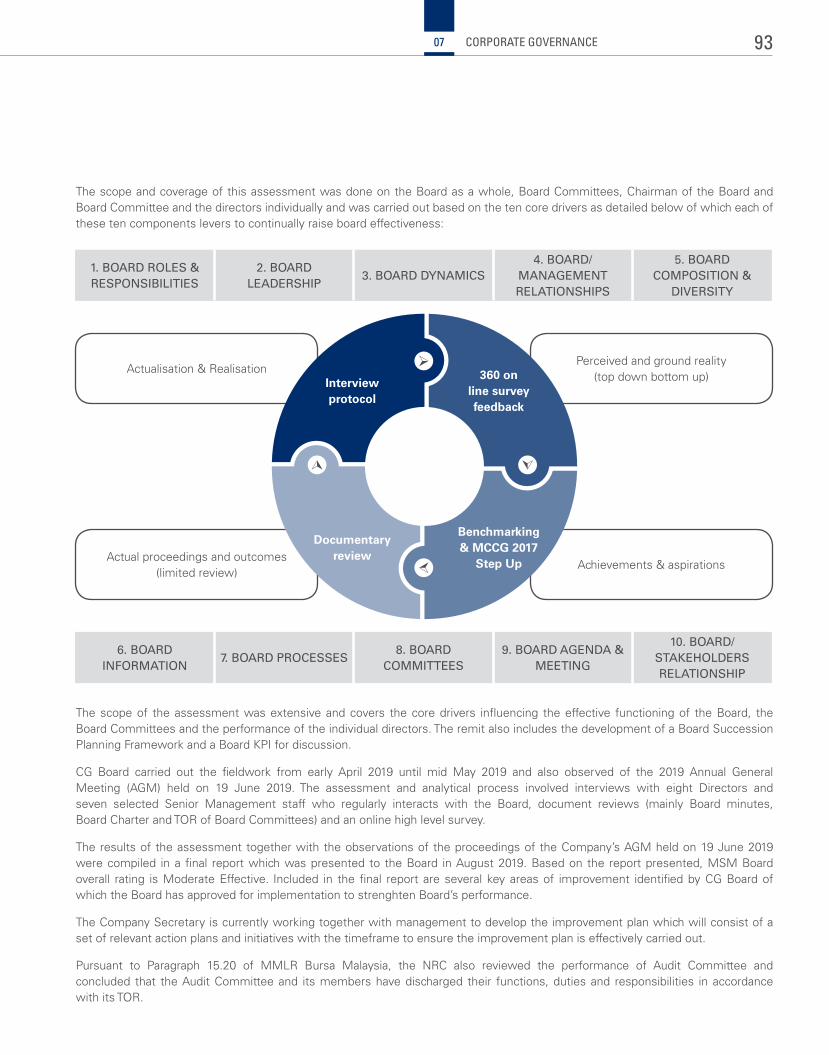
Actualisation & Realisation
Actual proceedings and outcomes (limited review)
Perceived and ground reality (top down bottom up)
Achievements & aspirations
The scope of the assessment was extensive and covers the core drivers influencing the effective functioning of the Board, the Board Committees and the performance of the individual directors. The remit also includes the development of a Board Succession Planning Framework and a Board KPI for discussion.
CG Board carried out the fieldwork from early April 2019 until mid May 2019 and also observed of the 2019 Annual General Meeting (AGM) held on 19 June 2019. The assessment and analytical process involved interviews with eight Directors and seven selected Senior Management staff who regularly interacts with the Board, document reviews (mainly Board minutes, Board Charter and TOR of Board Committees) and an online high level survey.
The results of the assessment together with the observations of the proceedings of the Company’s AGM held on 19 June 2019 were compiled in a final report which was presented to the Board in August 2019. Based on the report presented, MSM Board overall rating is Moderate Effective. Included in the final report are several key areas of improvement identified by CG Board of which the Board has approved for implementation to strenghten Board’s performance.
The Company Secretary is currently working together with management to develop the improvement plan which will consist of a set of relevant action plans and initiatives with the timeframe to ensure the improvement plan is effectively carried out.
Pursuant to Paragraph 15.20 of MMLR Bursa Malaysia, the NRC also reviewed the performance of Audit Committee and concluded that the Audit Committee and its members have discharged their functions, duties and responsibilities in accordance with its TOR.
The scope and coverage of this assessment was done on the Board as a whole, Board Committees, Chairman of the Board and Board Committee and the directors individually and was carried out based on the ten core drivers as detailed below of which each of these ten components levers to continually raise board effectiveness:
Interview protocol
Documentary review
360 on line survey feedback
Benchmarking & MCCG 2017
Step Up
1. BOARD ROLES & RESPONSIBILITIES
2. BOARD LEADERSHIP
3. BOARD DYNAMICS4. BOARD/
MANAGEMENT RELATIONSHIPS
5. BOARD COMPOSITION &
DIVERSITY
6. BOARD INFORMATION
7. BOARD PROCESSES8. BOARD
COMMITTEES9. BOARD AGENDA &
MEETING
10. BOARD/STAKEHOLDERS RELATIONSHIP
93CORPORATE GOVERNANCE07
NOMINATION AND REMUNERATION COMMITTEE REPORT
STATEMENT OF SUMMARY OF NRC’S ACTIVITIES DURING 2019
During the FY 2019, NRC performed a number of key activities summarised among others as below which were reviewed and recommended by NRC to the Board for approval:
Nomination and Election Process
1) Appointment of Nominee Director of FGV Holdings Berhad (FGV) in MSM Malaysia Holdings Berhad (MSM) as Non-Independent Non-Executive Director
2) Appointment and Resignation of Nominee Director of Koperasi Permodalan Felda Malaysia Berhad (KPF) in MSM Malaysia Holdings Berhad as Non-Independent Non-Executive Director
3) Appointment of an Independent Facilitator for the 2018 Board Effectiveness Evaluation exercise
4) Re-election of Retiring Directors at the 2019 Annual General Meeting
5) Assessment on the Audit Committee pursuant to Paragraph 15.20 of MMLR of Bursa Malaysia
6) Redesignation of Executive Director and Acting Chief Executive Officer
7) Changes on the Board Committees’ Membership Composition
8) Annual Assessment of the Effectiveness of the Board, Board Committees and Individual Directors Including Assessment of the Independent Directors for year 2018
9) Resignation and Appointment of Chief Financial Officer
10) Appointment and Resignation of Directors of MSM Subsidiaries
11) Contract Renewal for the Group CEO of MSM Group of Companies
Remuneration Matters
1) 2019 Increment for Top Management of MSM Group of Companies
2) Directors’ Remuneration for the FYE 31 December 2018
3) Bonus Payout for Employees of MSM Malaysia Holdings Berhad and its Subsidiaries
4) Separation Package for the Current Chief Financial Officer upon Expiry of Contract
5) Revised Remuneration Package for Top Management
6) Performance-based Payout for Staff of MSM Group of Companies for year 2019
7) Revised Remuneration package for the Chief Financial Officer
Other matters
1) Report on NRC for Inclusion in MSM Malaysia Holdings Berhad 2018 Annual Report
2) Terms of Employment for Senior Management
3) Revision of MSM Board Nomination and Election Policy and Procedures
4) Schedule of Nomination and Remuneration Committee Meetings for year 2020
The Committee’s Performance
On an annual basis, the Board shall evaluate the Committee’s performance and the extent to which the Committee has met the requirements of its TOR, including the term of office and performance of the Committee and each of its members. This performance assessment may constitute a part of the annual Board Effectiveness Assessment pertaining to the assessment of Board Committees.
STATEMENT BY THE BOARD
This Report on Nomination and Remuneration Committee is made in accordance with a resolution of the Board of Directors duly passed on 17 April 2020.
MSM MalaySia HoldingS BerHad | annual report 201994
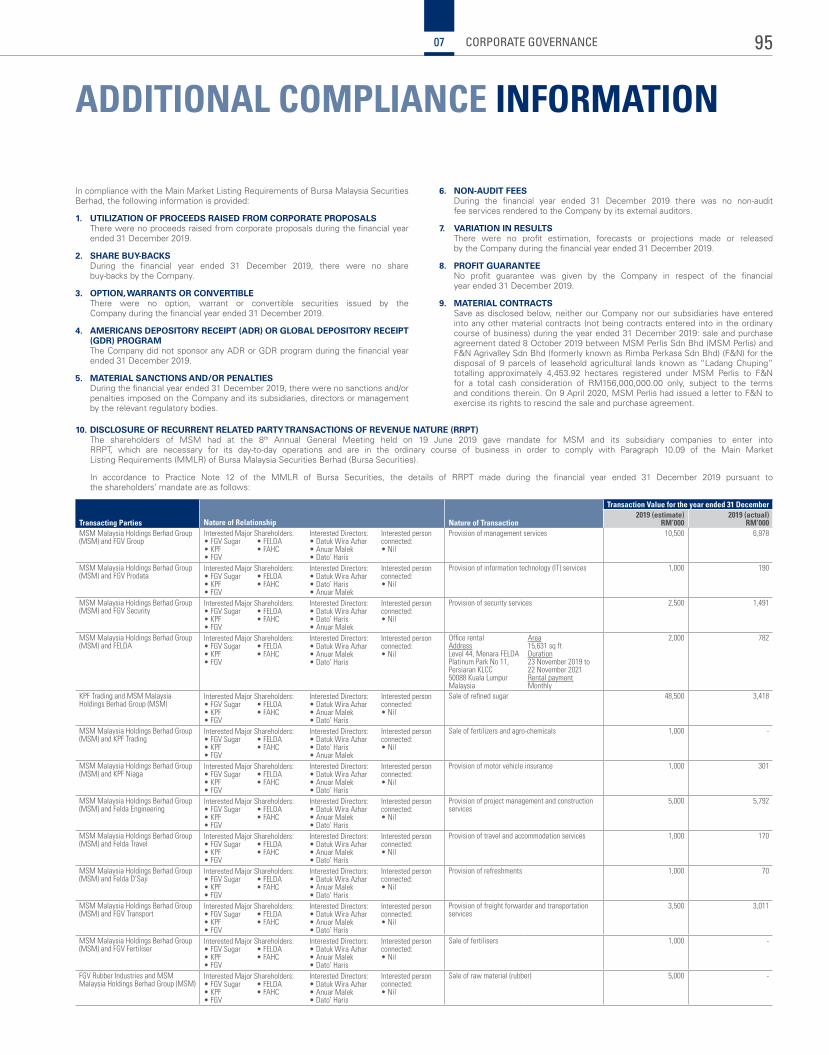
ADDITIONAL COMPLIANCE INFORMATION
In compliance with the Main Market Listing Requirements of Bursa Malaysia Securities Berhad, the following information is provided:
1. UTILIZATION OF PROCEEDS RAISED FROM CORPORATE PROPOSALS There were no proceeds raised from corporate proposals during the financial year
ended 31 December 2019.
2. SHARE BUY-BACKS During the financial year ended 31 December 2019, there were no share
buy-backs by the Company.
3. OPTION, WARRANTS OR CONVERTIBLE There were no option, warrant or convertible securities issued by the
Company during the financial year ended 31 December 2019.
4. AMERICANS DEPOSITORY RECEIPT (ADR) OR GLOBAL DEPOSITORY RECEIPT (GDR) PROGRAM
The Company did not sponsor any ADR or GDR program during the financial year ended 31 December 2019.
5. MATERIAL SANCTIONS AND/OR PENALTIES During the financial year ended 31 December 2019, there were no sanctions and/or
penalties imposed on the Company and its subsidiaries, directors or management by the relevant regulatory bodies.
6. NON-AUDIT FEES During the financial year ended 31 December 2019 there was no non-audit
fee services rendered to the Company by its external auditors.
7. VARIATION IN RESULTS There were no profit estimation, forecasts or projections made or released
by the Company during the financial year ended 31 December 2019.
8. PROFIT GUARANTEE No profit guarantee was given by the Company in respect of the financial
year ended 31 December 2019.
9. MATERIAL CONTRACTS Save as disclosed below, neither our Company nor our subsidiaries have entered
into any other material contracts (not being contracts entered into in the ordinary course of business) during the year ended 31 December 2019: sale and purchase agreement dated 8 October 2019 between MSM Perlis Sdn Bhd (MSM Perlis) and F&N Agrivalley Sdn Bhd (formerly known as Rimba Perkasa Sdn Bhd) (F&N) for the disposal of 9 parcels of leasehold agricultural lands known as “Ladang Chuping” totalling approximately 4,453.92 hectares registered under MSM Perlis to F&N for a total cash consideration of RM156,000,000.00 only, subject to the terms and conditions therein. On 9 April 2020, MSM Perlis had issued a letter to F&N to exercise its rights to rescind the sale and purchase agreement.
10. DISCLOSURE OF RECURRENT RELATED PARTY TRANSACTIONS OF REVENUE NATURE (RRPT) The shareholders of MSM had at the 8th Annual General Meeting held on 19 June 2019 gave mandate for MSM and its subsidiary companies to enter into
RRPT, which are necessary for its day-to-day operations and are in the ordinary course of business in order to comply with Paragraph 10.09 of the Main Market Listing Requirements (MMLR) of Bursa Malaysia Securities Berhad (Bursa Securities).
In accordance to Practice Note 12 of the MMLR of Bursa Securities, the details of RRPT made during the financial year ended 31 December 2019 pursuant to the shareholders’ mandate are as follows:
Transacting Parties Nature of Relationship Nature of Transaction
Transaction Value for the year ended 31 December2019 (estimate)
RM’0002019 (actual)
RM’000MSM Malaysia Holdings Berhad Group (MSM) and FGV Group
Interested Major Shareholders: Interested Directors: Interested person connected:• Nil
• FGV Sugar• KPF• FGV
• FELDA• FAHC
• Datuk Wira Azhar• Anuar Malek• Dato’ Haris
Provision of management services 10,500 6,978
MSM Malaysia Holdings Berhad Group (MSM) and FGV Prodata
Interested Major Shareholders: Interested Directors: Interested person connected:• Nil
• FGV Sugar• KPF• FGV
• FELDA• FAHC
• Datuk Wira Azhar• Dato’ Haris• Anuar Malek
Provision of information technology (IT) services 1,000 190
MSM Malaysia Holdings Berhad Group (MSM) and FGV Security
Interested Major Shareholders: Interested Directors: Interested person connected:• Nil
• FGV Sugar• KPF• FGV
• FELDA• FAHC
• Datuk Wira Azhar• Dato’ Haris• Anuar Malek
Provision of security services 2,500 1,491
MSM Malaysia Holdings Berhad Group (MSM) and FELDA
Interested Major Shareholders: Interested Directors: Interested person connected:• Nil
• FGV Sugar• KPF• FGV
• FELDA• FAHC
• Datuk Wira Azhar• Anuar Malek• Dato’ Haris
Office rentalAddressLevel 44, Menara FELDAPlatinum Park No 11, Persiaran KLCC50088 Kuala LumpurMalaysia
Area15,631 sq ftDuration23 November 2019 to 22 November 2021Rental payment Monthly
2,000 782
KPF Trading and MSM Malaysia Holdings Berhad Group (MSM)
Interested Major Shareholders: Interested Directors: Interested person connected:• Nil
• FGV Sugar• KPF• FGV
• FELDA• FAHC
• Datuk Wira Azhar• Anuar Malek• Dato’ Haris
Sale of refined sugar 48,500 3,418
MSM Malaysia Holdings Berhad Group (MSM) and KPF Trading
Interested Major Shareholders: Interested Directors: Interested person connected:• Nil
• FGV Sugar• KPF• FGV
• FELDA• FAHC
• Datuk Wira Azhar• Dato’ Haris• Anuar Malek
Sale of fertilizers and agro-chemicals 1,000 -
MSM Malaysia Holdings Berhad Group (MSM) and KPF Niaga
Interested Major Shareholders: Interested Directors: Interested person connected:• Nil
• FGV Sugar• KPF• FGV
• FELDA• FAHC
• Datuk Wira Azhar• Anuar Malek• Dato’ Haris
Provision of motor vehicle insurance 1,000 301
MSM Malaysia Holdings Berhad Group (MSM) and Felda Engineering
Interested Major Shareholders: Interested Directors: Interested person connected:• Nil
• FGV Sugar• KPF• FGV
• FELDA• FAHC
• Datuk Wira Azhar• Anuar Malek• Dato’ Haris
Provision of project management and construction services
5,000 5,792
MSM Malaysia Holdings Berhad Group (MSM) and Felda Travel
Interested Major Shareholders: Interested Directors: Interested person connected:• Nil
• FGV Sugar• KPF• FGV
• FELDA• FAHC
• Datuk Wira Azhar• Anuar Malek• Dato’ Haris
Provision of travel and accommodation services 1,000 170
MSM Malaysia Holdings Berhad Group (MSM) and Felda D’Saji
Interested Major Shareholders: Interested Directors: Interested person connected:• Nil
• FGV Sugar• KPF• FGV
• FELDA• FAHC
• Datuk Wira Azhar• Anuar Malek• Dato’ Haris
Provision of refreshments 1,000 70
MSM Malaysia Holdings Berhad Group (MSM) and FGV Transport
Interested Major Shareholders: Interested Directors: Interested person connected:• Nil
• FGV Sugar• KPF• FGV
• FELDA• FAHC
• Datuk Wira Azhar• Anuar Malek• Dato’ Haris
Provision of freight forwarder and transportation services
3,500 3,011
MSM Malaysia Holdings Berhad Group (MSM) and FGV Fertiliser
Interested Major Shareholders: Interested Directors: Interested person connected:• Nil
• FGV Sugar• KPF• FGV
• FELDA• FAHC
• Datuk Wira Azhar• Anuar Malek• Dato’ Haris
Sale of fertilisers 1,000 -
FGV Rubber Industries and MSM Malaysia Holdings Berhad Group (MSM)
Interested Major Shareholders: Interested Directors: Interested person connected:• Nil
• FGV Sugar• KPF• FGV
• FELDA• FAHC
• Datuk Wira Azhar• Anuar Malek• Dato’ Haris
Sale of raw material (rubber) 5,000 -
95CORPORATE GOVERNANCE07
CORPORATE INTEGRITY
Recognising that it required constant effort to maintain the highest level of integrity, in 2019 we further enhanced our ethical work environment via the following initiatives:
ETHICS AND INTEGRITY
MSM is committed to conducting business in an open, honest and ethical manner. The Group’s commitment to upholding integrity in carrying out its duties is evidenced by:
Integrity Initiatives
• Our Corporate Integrity Pledge which was signed with the Malaysian Anti-Corruption Commission (MACC) with the aim to build a culture of integrity within the workforce and to the best effort, ensure that MSM is free from corruption.
• Continuous briefing sessions were held for MSM Employees on the new corporate liability provision of the Malaysian Anti-Corruption Commission Act (Amendment 2018) which was passed in April 2018, to ensure that MSM Employees has an in depth knowledge and understanding of the new law and its impact on MSM Group.
Code of Business Conduct and Ethics for Employees (COBCE)
• The MSM Group Code of Ethics and Conduct for Employees (the Code) supports the Company’s vision and core values by internalising and upholding the value of uncompromising integrity in the behaviour and conduct of all Board Members, Management, employees and stakeholders. The Code was revised and approved on 22 February 2018. The purpose of this Code is to enhance compliance and integrity in business conduct at the workplace.
Whistle-Blowing Policy
• MSM Group also adopted the Whistleblowing Policy (WBP) - guided by FGV Whistleblowing Policy to further strengthen and uphold the high standards of ethics, integrity and professionalism expected from all employees. The WBP allows all employees and third parties to disclose any potential or actual unethical, illegal, irregular and questionable practices in confidence and without risk of reprisal.
• The objectives of the policy are:
• Provide an avenue and designated channels of escalation for employees and third parties (e.g. interns, contractors, consultants, vendors, suppliers and/or customers) to direct their disclosures on any irregularities or suspected irregularities for the timely attention of Management.
• Set out the protection accorded to whistle blowers to enable them to disclose such irregularities in confidence without any risk of reprisal.
MSM Group has over the years built a strong corporate reputation based not only on the products and services that we provide, but also on sound principles of ethics and integrity.
MSM MalaySia HoldingS BerHad | annual report 201996
Social Media Policy
• Today, social media is more accessible than ever and these new ways of communication may expose MSM Group to possible ethical risks committed by staff in the course of engaging in social media activities. MSM Group implemented the Social Media Policy with the following objectives:
• To set out the guidelines on the responsible and ethical usage of social media by all staff of the Group.
• To set out the possible consequences of policy violation by staff.
AUTHORITY & RESPONSIBILITY
Organisation Structure
We organise our business operations into four business entities namely MSM Prai Berhad, MSM Refinery Sugar (Johor) Sdn Bhd, MSM Perlis Sdn Bhd and MSM Logistics Sdn Bhd which are supported by corporate services/ all Departments at the Headquarters level. In achieving our strategic and business objectives, the Group has undergone several key changes and an effective organisational architecture has been designed which combines employees in functions and product structures, across the MSM Group.
Group Discretionary Authority Limits (DAL)
Group Discretionary Authority Limits (DAL) is a manual which sets out the authorisation limits for various levels of MSM’s Group Management and staff. This guide ensures accountability, segregation of duties and control over the Group’s financial commitments. The DAL manual is reviewed and updated periodically to align with business, operational and structural changes. The Board approved the revised DAL version 5.0 on 24 August 2018.
Legal Authority Limit (LAL)
This Legal Authority Limit and Signing Protocol (LAL) authorises MSM Group’s personnel with defined official responsibilities to approve the Legal Services within MSM Group. This is to ensure that all risks are effectively managed to protect MSM Group’s interest.
The LAL is aligned with FGVH Group Legal’s practice of having its own policies and procedures, and MSM Legal Division being the custodian of all legal matters relating to agreements, litigation matters, appointment of legal firms and signing of legal documents.
The Board has approved the revised Legal Authority Limit (LAL) version 2.0 on 21 August 2019.
Job Description
Each role in the organisation structure is supported by clear description of job responsibilities which are linked to the vision and goals of the Group. A well developed and effective job description is key for clarity of responsibilities and relationship between functions which will enhance collaboration across the Group moving towards operational efficiency besides supporting the succession planning. It helps retain and motivate the best talents by ensuring employees’ engagement and drive towards high performance culture.
COMPETENCY
MSM Group has established a structured competency baseline to assess existing human capital development needs across various engagement levels. This is to ensure the Group’s key assets, namely its people, and their skills and abilities are competitive and remain so in the future. With the clarity of responsibilities and relationship between functions, collaboration across the Group is enhanced to move the Group towards operational efficiency.
97CORPORATE GOVERNANCE07
STATEMENT ON RISK MANAGEMENT AND INTERNAL CONTROL
This Statement is made pursuant to Rule 15.26(b) of Bursa Malaysia Securities Berhad Main Market Listing Requirements, Malaysian Code on Corporate Governance 2017 and in accordance with the Statement on Risk Management and Internal Control: Guidelines for Directors of Listed Issuers.
RESPONSIBILITY AND ACCOUNTABILITY
The Board is committed to maintain and continuously improve the Group’s system of risk management and internal control. The Board acknowledges the importance of a sound risk management system and internal control practices for good corporate governance with the objective of safeguarding the shareholders’ interest and the Group’s assets.
In view of the limitations that are inherent in any system of internal control, this system is designed to manage, rather than eliminate the risks that hinder the Group from achieving its objectives. Hence, it can only provide reasonable, but not absolute assurance against material misstatements or losses or the occurrence of unforeseeable circumstances.
There are two committees at Board level that support the Board in its risk management and internal control responsibilities:
i. Board Governance and Risk Management Committee (BGRMC) which is tasked with overseeing risk management and governance aspects of the Group; and
ii. Audit Committee (AC) which is tasked with assessing the risks and control environment and overseeing financial reporting, including the external and internal audit.
The Board of Directors (the Board) of MSM Malaysia Holdings Berhad (MSM Group or the Company) is pleased to present its Statement on Risk Management and Internal Control (Statement) which outlines the nature and scope of risk management and internal control of the Group for the financial year ended 31 December 2019.
RISK MANAGEMENT
The Risk Management function is responsible for implementing the enterprise risk management process, while the management team is required to assume responsibility for risk management within their functional areas and ensure that risk management is embedded in their day-to-day business processes.
The Management’s key role is to identify significant risks, evaluate the risk profile and drive risk mitigation strategies on a regular basis.
MSM Group has a dedicated Corporate Governance and Risk Management Department (CGRM) which undertakes the following responsibilities:
• Reviewing, assessing, enhancing and monitoring the Group’s Risk Management Framework including risk management policies and procedures; and in alignment with FGV Group Risk Management framework;
• Providing guidance to all MSM Group’s operations in identifying and assessing risks, developing relevant and effective mitigation strategies to manage risks;
• Maintaining the Risk Register for the MSM Group;
• Preparing risk reports to the Board Governance and Risk Management Committee (BGRMC) and Board; and
• Overseeing MSM Group’s Business Continuity Management.
MSM MalaySia HoldingS BerHad | annual report 201998
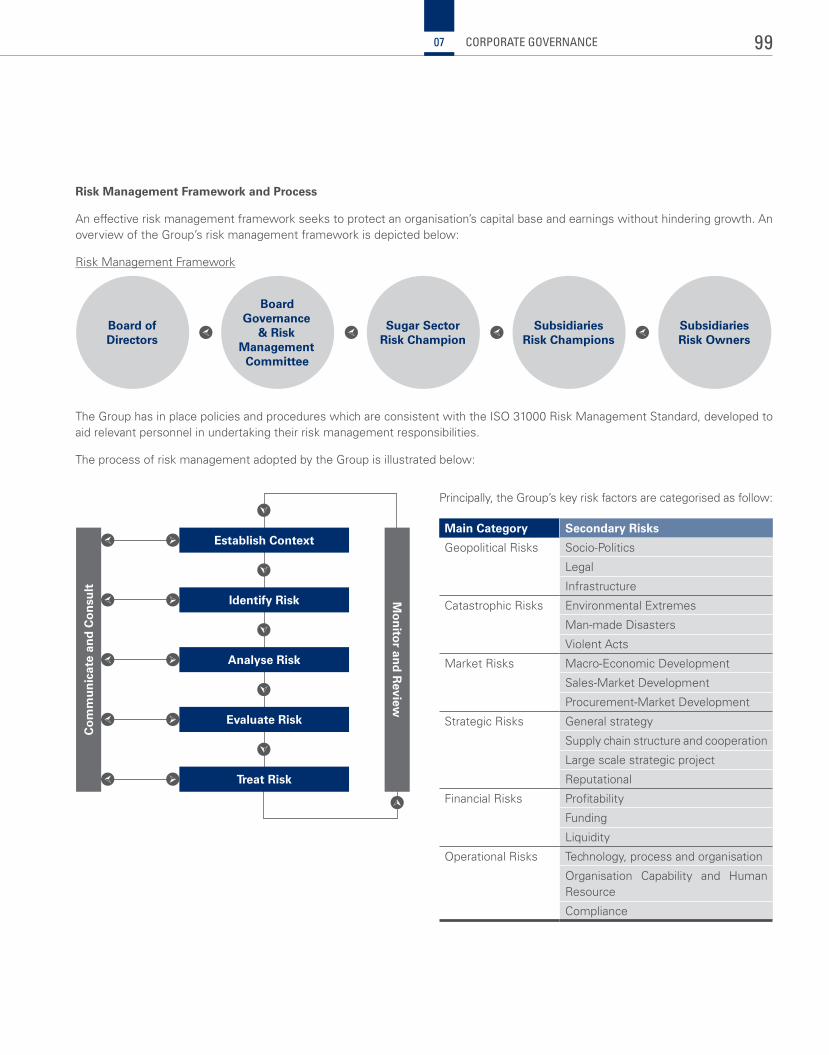
Risk Management Framework and Process
An effective risk management framework seeks to protect an organisation’s capital base and earnings without hindering growth. An overview of the Group’s risk management framework is depicted below:
Risk Management Framework
Board of Directors
Board Governance
& Risk Management
Committee
Sugar Sector Risk Champion
Subsidiaries Risk Champions
Subsidiaries Risk Owners
Establish Context
Identify Risk
Analyse Risk
Evaluate Risk
Treat Risk
Mo
nito
r and
Review
Co
mm
un
icat
e an
d C
on
sult
Principally, the Group’s key risk factors are categorised as follow:
Main Category Secondary Risks
Geopolitical Risks Socio-Politics
Legal
Infrastructure
Catastrophic Risks Environmental Extremes
Man-made Disasters
Violent Acts
Market Risks Macro-Economic Development
Sales-Market Development
Procurement-Market Development
Strategic Risks General strategy
Supply chain structure and cooperation
Large scale strategic project
Reputational
Financial Risks Profitability
Funding
Liquidity
Operational Risks Technology, process and organisation
Organisation Capability and Human Resource
Compliance
The Group has in place policies and procedures which are consistent with the ISO 31000 Risk Management Standard, developed to aid relevant personnel in undertaking their risk management responsibilities.
The process of risk management adopted by the Group is illustrated below:
99CORPORATE GOVERNANCE07
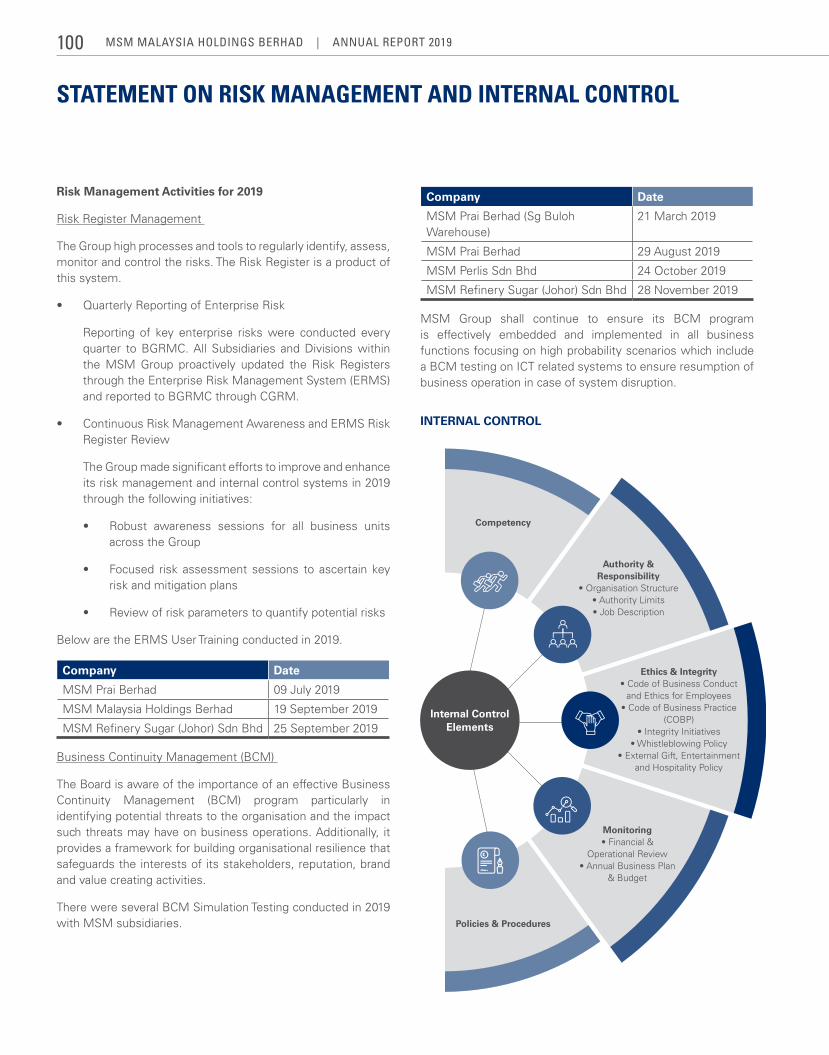
STATEMENT ON RISK MANAGEMENT AND INTERNAL CONTROL
Risk Management Activities for 2019
Risk Register Management
The Group high processes and tools to regularly identify, assess, monitor and control the risks. The Risk Register is a product of this system.
• Quarterly Reporting of Enterprise Risk
Reporting of key enterprise risks were conducted every quarter to BGRMC. All Subsidiaries and Divisions within the MSM Group proactively updated the Risk Registers through the Enterprise Risk Management System (ERMS) and reported to BGRMC through CGRM.
• Continuous Risk Management Awareness and ERMS Risk Register Review
The Group made significant efforts to improve and enhance its risk management and internal control systems in 2019 through the following initiatives:
• Robust awareness sessions for all business units across the Group
• Focused risk assessment sessions to ascertain key risk and mitigation plans
• Review of risk parameters to quantify potential risks
Below are the ERMS User Training conducted in 2019.
Company Date
MSM Prai Berhad 09 July 2019
MSM Malaysia Holdings Berhad 19 September 2019
MSM Refinery Sugar (Johor) Sdn Bhd 25 September 2019
Business Continuity Management (BCM)
The Board is aware of the importance of an effective Business Continuity Management (BCM) program particularly in identifying potential threats to the organisation and the impact such threats may have on business operations. Additionally, it provides a framework for building organisational resilience that safeguards the interests of its stakeholders, reputation, brand and value creating activities.
There were several BCM Simulation Testing conducted in 2019 with MSM subsidiaries.
Company Date
MSM Prai Berhad (Sg Buloh Warehouse)
21 March 2019
MSM Prai Berhad 29 August 2019
MSM Perlis Sdn Bhd 24 October 2019
MSM Refinery Sugar (Johor) Sdn Bhd 28 November 2019
MSM Group shall continue to ensure its BCM program is effectively embedded and implemented in all business functions focusing on high probability scenarios which include a BCM testing on ICT related systems to ensure resumption of business operation in case of system disruption.
INTERNAL CONTROL
Internal Control Elements
Competency
Policies & Procedures
Authority & Responsibility
• Organisation Structure • Authority Limits • Job Description
Ethics & Integrity• Code of Business Conduct
and Ethics for Employees • Code of Business Practice
(COBP)• Integrity Initiatives
• Whistleblowing Policy• External Gift, Entertainment
and Hospitality Policy
Monitoring• Financial &
Operational Review• Annual Business Plan
& Budget
MSM MalaySia HoldingS BerHad | annual report 2019100
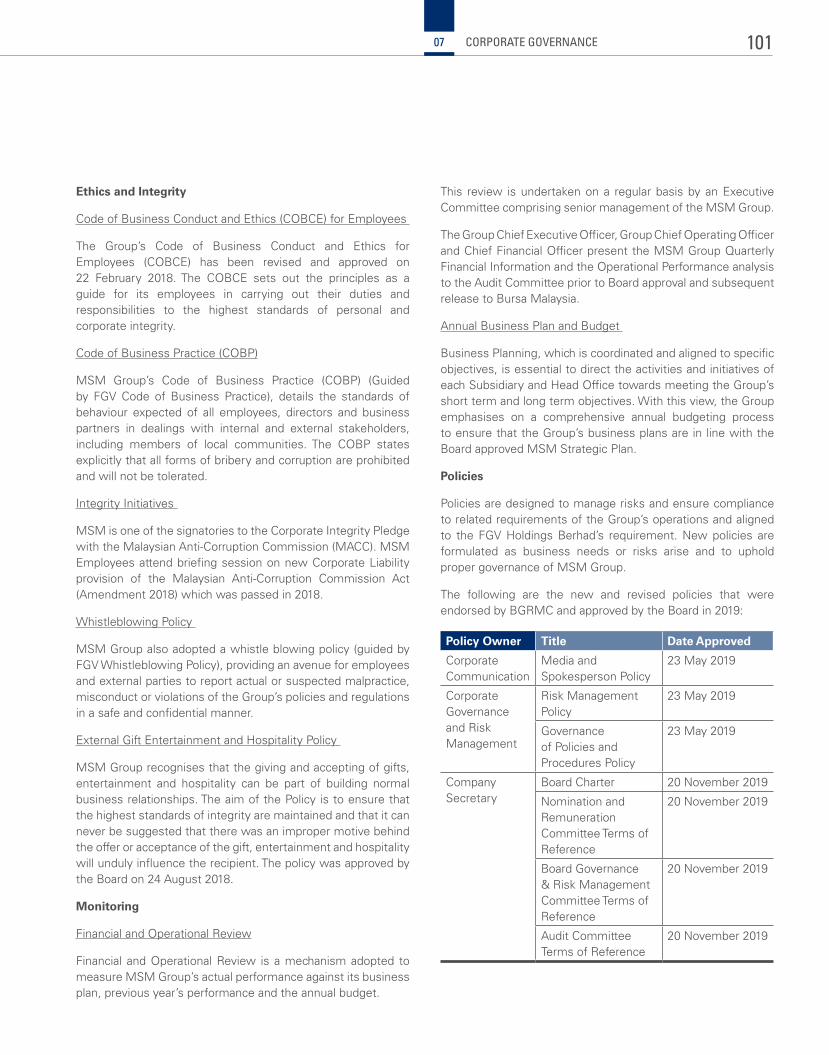
Ethics and Integrity
Code of Business Conduct and Ethics (COBCE) for Employees
The Group’s Code of Business Conduct and Ethics for Employees (COBCE) has been revised and approved on 22 February 2018. The COBCE sets out the principles as a guide for its employees in carrying out their duties and responsibilities to the highest standards of personal and corporate integrity.
Code of Business Practice (COBP)
MSM Group’s Code of Business Practice (COBP) (Guided by FGV Code of Business Practice), details the standards of behaviour expected of all employees, directors and business partners in dealings with internal and external stakeholders, including members of local communities. The COBP states explicitly that all forms of bribery and corruption are prohibited and will not be tolerated.
Integrity Initiatives
MSM is one of the signatories to the Corporate Integrity Pledge with the Malaysian Anti-Corruption Commission (MACC). MSM Employees attend briefing session on new Corporate Liability provision of the Malaysian Anti-Corruption Commission Act (Amendment 2018) which was passed in 2018.
Whistleblowing Policy
MSM Group also adopted a whistle blowing policy (guided by FGV Whistleblowing Policy), providing an avenue for employees and external parties to report actual or suspected malpractice, misconduct or violations of the Group’s policies and regulations in a safe and confidential manner.
External Gift Entertainment and Hospitality Policy
MSM Group recognises that the giving and accepting of gifts, entertainment and hospitality can be part of building normal business relationships. The aim of the Policy is to ensure that the highest standards of integrity are maintained and that it can never be suggested that there was an improper motive behind the offer or acceptance of the gift, entertainment and hospitality will unduly influence the recipient. The policy was approved by the Board on 24 August 2018.
Monitoring
Financial and Operational Review
Financial and Operational Review is a mechanism adopted to measure MSM Group’s actual performance against its business plan, previous year’s performance and the annual budget.
This review is undertaken on a regular basis by an Executive Committee comprising senior management of the MSM Group.
The Group Chief Executive Officer, Group Chief Operating Officer and Chief Financial Officer present the MSM Group Quarterly Financial Information and the Operational Performance analysis to the Audit Committee prior to Board approval and subsequent release to Bursa Malaysia.
Annual Business Plan and Budget
Business Planning, which is coordinated and aligned to specific objectives, is essential to direct the activities and initiatives of each Subsidiary and Head Office towards meeting the Group’s short term and long term objectives. With this view, the Group emphasises on a comprehensive annual budgeting process to ensure that the Group’s business plans are in line with the Board approved MSM Strategic Plan.
Policies
Policies are designed to manage risks and ensure compliance to related requirements of the Group’s operations and aligned to the FGV Holdings Berhad’s requirement. New policies are formulated as business needs or risks arise and to uphold proper governance of MSM Group.
The following are the new and revised policies that were endorsed by BGRMC and approved by the Board in 2019:
Policy Owner Title Date Approved
Corporate Communication
Media and Spokesperson Policy
23 May 2019
Corporate Governance and Risk Management
Risk Management Policy
23 May 2019
Governance of Policies and Procedures Policy
23 May 2019
Company Secretary
Board Charter 20 November 2019
Nomination and Remuneration Committee Terms of Reference
20 November 2019
Board Governance & Risk Management Committee Terms of Reference
20 November 2019
Audit Committee Terms of Reference
20 November 2019
101CORPORATE GOVERNANCE07
STATEMENT ON RISK MANAGEMENT AND INTERNAL CONTROL
Competency
MSM views its employees as invaluable assets. The Group is committed to its employees and professional development at all levels.
In achieving the next level of productivity, excellent service, and performance, MSM has developed SWIIT Values (S for Sense of belonging, W for winning attitude, I for Integrity, I for Innovation and T for Teamwork) which bring meaningful purpose, practical strategies and goals together to make the organisation aspirations more credible and achievable.
The Group has also developed several programmes, in sync with its continual improvement culture, to ensure adequate supply of skilled and knowledgeable workforce who are then groomed to take on leadership positions. This is a key focus towards strong, sustainable and balanced growth. The programmes are holistic in nature, aiming to enhance both professional and behavioural competencies by incorporating elements such as integrity, governance as well as the Group’s core values.
Authority and Responsibility
Organisation Structure
The Group has a comprehensive organisational structure which organises its business operations. The organisational structure provides clear lines of reporting, authority and segregation of duties, which promotes ownership, accountability, and delegated authority.
Authority Limit
• Group Discretionary Authority Limit (DAL) Consistent with the spirit to continually enhance its internal
control, MSM Group’s DAL was regularly reviewed and updated to promote organisational efficiency. The Board approved the revised DAL version 5.0 on 24 August 2018.
• Legal Authority Limit (LAL) The LAL is aligned with FGVH Group Legal’s practice
of having its own policies and procedures, being the custodian of all legal matters relating to agreements, litigation matters, appointment of legal firms and signing of legal documents.
The Board has approved the revised Legal Authority Limit (LAL) version 2.0 on 21 August 2019.
Job Description
Each role in the organisation structure is supported by clear description of job responsibilities which are linked to the vision and goals of the Group. A well developed and effective job description has been designed for clarity of responsibilities and relationship between functions which will enhance collaboration across the Group moving towards operational efficiency besides supporting the succession planning. It can retain and motivate the best talents by ensuring that employee’s engagement and helps drive high performance culture.
REVIEW OF STATEMENT BY ExTERNAL AUDITORS
The External Auditors have reviewed this Statement of Risk Management and Internal Control as per Paragraph 15.23 of the Bursa Malaysia Securities Berhad Main Market Listing Requirements. Their limited assurance review was performed in accordance with Audit and Assurance Practice Guideline (APPG) 3 issues issued by Malaysian Institute of Accountants. AAPG3 does not require external auditors to form an opinion on the adequacy and effectiveness of the risk management and internal control systems of the Group.
STATEMENT BY THE BOARD
Based on the processes and measures undertaken by the Board and its Committees during the financial year and assurance provided by the Group Chief Executive Officer and Chief Financial Officer, the Board is of the view that the risk management framework and internal control system as described in this statement is sound and effective to safeguard the shareholders’ investment and MSM Group’s assets.
This Statement is made in accordance to the resolution of the Board dated 17 April 2020.
MSM MalaySia HoldingS BerHad | annual report 2019102
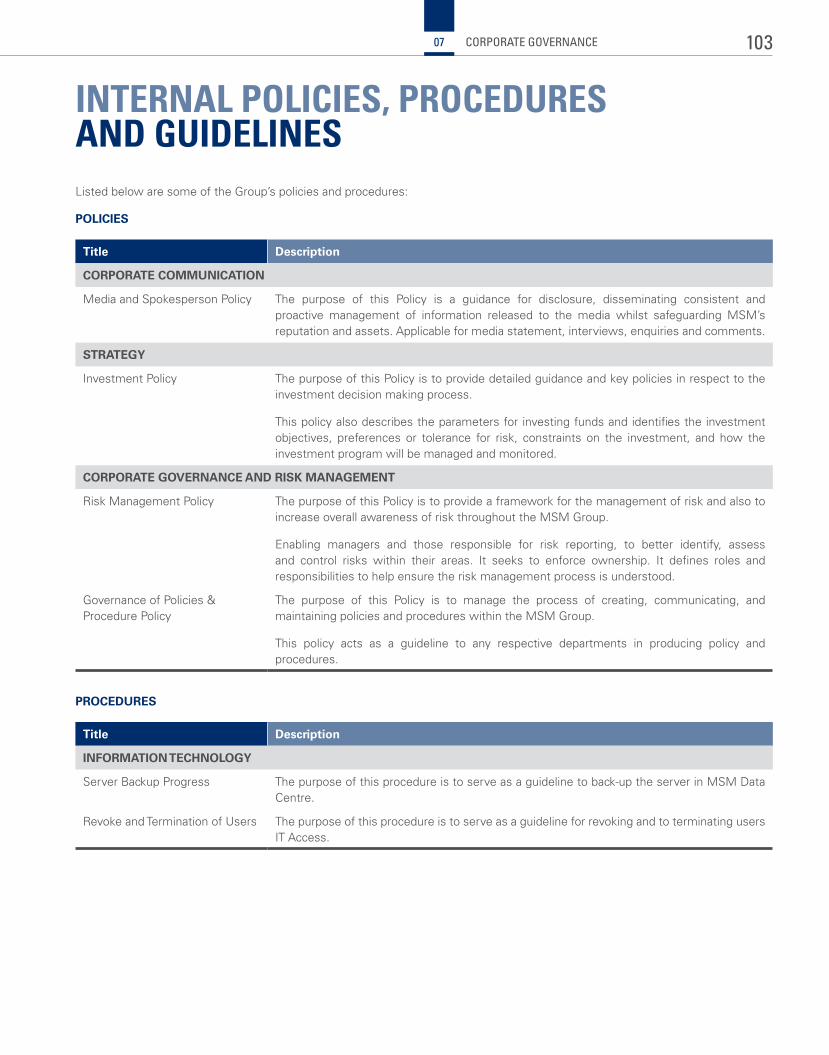
INTERNAL POLICIES, PROCEDURES AND GUIDELINESListed below are some of the Group’s policies and procedures:
POLICIES
Title Description
CORPORATE COMMUNICATION
Media and Spokesperson Policy The purpose of this Policy is a guidance for disclosure, disseminating consistent and proactive management of information released to the media whilst safeguarding MSM’s reputation and assets. Applicable for media statement, interviews, enquiries and comments.
STRATEGY
Investment Policy The purpose of this Policy is to provide detailed guidance and key policies in respect to the investment decision making process.
This policy also describes the parameters for investing funds and identifies the investment objectives, preferences or tolerance for risk, constraints on the investment, and how the investment program will be managed and monitored.
CORPORATE GOVERNANCE AND RISK MANAGEMENT
Risk Management Policy The purpose of this Policy is to provide a framework for the management of risk and also to increase overall awareness of risk throughout the MSM Group.
Enabling managers and those responsible for risk reporting, to better identify, assess and control risks within their areas. It seeks to enforce ownership. It defines roles and responsibilities to help ensure the risk management process is understood.
Governance of Policies & Procedure Policy
The purpose of this Policy is to manage the process of creating, communicating, and maintaining policies and procedures within the MSM Group.
This policy acts as a guideline to any respective departments in producing policy and procedures.
PROCEDURES
Title Description
INFORMATION TECHNOLOGY
Server Backup Progress The purpose of this procedure is to serve as a guideline to back-up the server in MSM Data Centre.
Revoke and Termination of Users The purpose of this procedure is to serve as a guideline for revoking and to terminating users IT Access.
103CORPORATE GOVERNANCE07
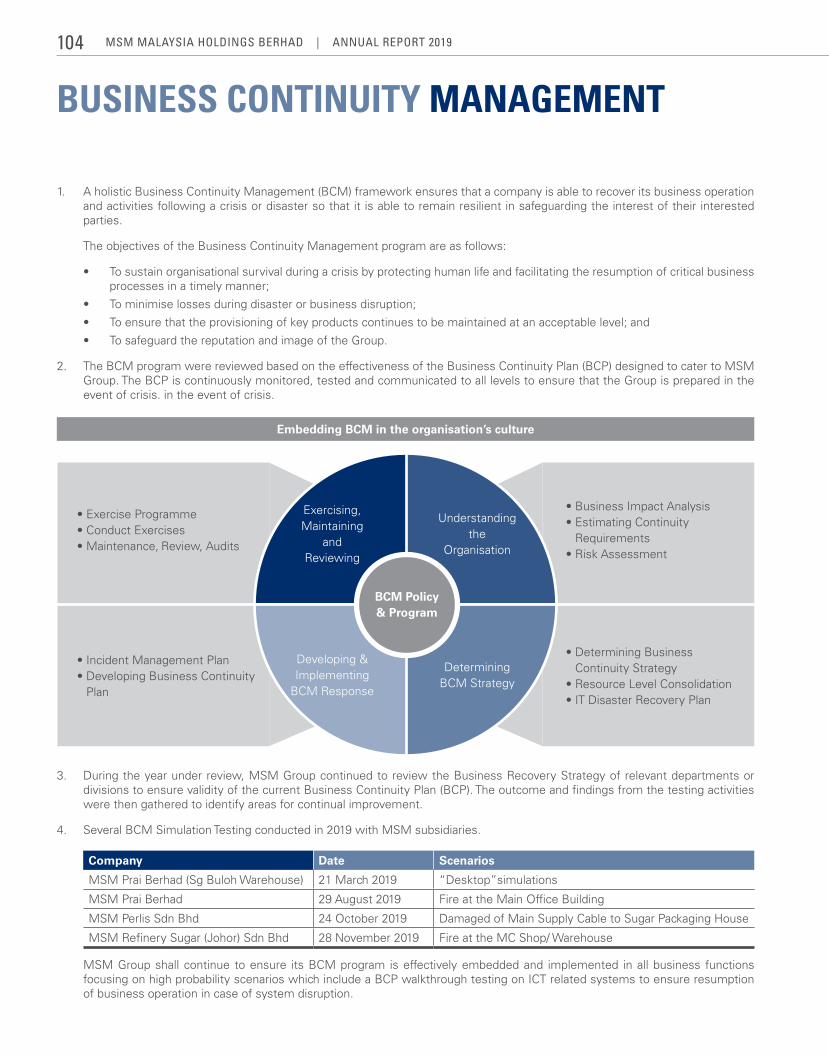
BUSINESS CONTINUITY MANAGEMENT
1. A holistic Business Continuity Management (BCM) framework ensures that a company is able to recover its business operation and activities following a crisis or disaster so that it is able to remain resilient in safeguarding the interest of their interested parties.
The objectives of the Business Continuity Management program are as follows:
• To sustain organisational survival during a crisis by protecting human life and facilitating the resumption of critical business processes in a timely manner;
• To minimise losses during disaster or business disruption;
• To ensure that the provisioning of key products continues to be maintained at an acceptable level; and
• To safeguard the reputation and image of the Group.
2. The BCM program were reviewed based on the effectiveness of the Business Continuity Plan (BCP) designed to cater to MSM Group. The BCP is continuously monitored, tested and communicated to all levels to ensure that the Group is prepared in the event of crisis. in the event of crisis.
Embedding BCM in the organisation’s culture
BCM Policy & Program
Exercising, Maintaining
and Reviewing
Developing & Implementing
BCM Response
Understanding the
Organisation
Determining BCM Strategy
• Exercise Programme• Conduct Exercises• Maintenance, Review, Audits
• Business Impact Analysis• Estimating Continuity
Requirements• Risk Assessment
• Incident Management Plan• Developing Business Continuity
Plan
• Determining Business Continuity Strategy
• Resource Level Consolidation• IT Disaster Recovery Plan
3. During the year under review, MSM Group continued to review the Business Recovery Strategy of relevant departments or divisions to ensure validity of the current Business Continuity Plan (BCP). The outcome and findings from the testing activities were then gathered to identify areas for continual improvement.
4. Several BCM Simulation Testing conducted in 2019 with MSM subsidiaries.
Company Date Scenarios
MSM Prai Berhad (Sg Buloh Warehouse) 21 March 2019 “Desktop”simulations
MSM Prai Berhad 29 August 2019 Fire at the Main Office Building
MSM Perlis Sdn Bhd 24 October 2019 Damaged of Main Supply Cable to Sugar Packaging House
MSM Refinery Sugar (Johor) Sdn Bhd 28 November 2019 Fire at the MC Shop/ Warehouse
MSM Group shall continue to ensure its BCM program is effectively embedded and implemented in all business functions focusing on high probability scenarios which include a BCP walkthrough testing on ICT related systems to ensure resumption of business operation in case of system disruption.
MSM MalaySia HoldingS BerHad | annual report 2019104
STATEMENT ON DIRECTORS’ RESPONSIBILITIESThe Companies Act 2016 requires the Directors to prepare financial statements (which include the consolidated statements of financial position and the consolidated statements of comprehensive income of the Group) for each financial year in accordance with Malaysian Accounting Standards Board (MASB) approved accounting standards in Malaysia for entities other than private entities and the provisions of the Companies Act 2016 and the Main Market Listing Requirements of Bursa Malaysia Securities Berhad (Bursa Malaysia), and to lay these before the Company at its Annual General Meeting.
Incorporated on pages 116 to 224 of this Annual Report, are the financial statements of the Company and the Group for the financial year ended 31 December 2019. The Companies Act 2016 placed responsibility on the Directors to ensure that the consolidated statements of financial position provide a true and fair view of the state of affairs of the Group as at 31 December 2019 and the consolidated statement of comprehensive income provides a true and fair view of the results of the Group for the financial year ended 31 December 2019.
In undertaking the responsibility placed upon them by law, the Directors have relied upon the Group’s system of internal control to provide them with reasonable grounds to believe that the Group’s accounting records, as well as other relevant records, have been maintained by the Group in a manner that enables them to sufficiently explain the transactions and financial position of the Group. This also enables the Directors to ensure that a true and fair consolidated statement of financial position and statement of comprehensive income and documents required by the Companies Act 2016 to be attached are prepared for the financial year to which these financial statements relate.
The Companies Act 2016 also requires the Directors to cause the Company to keep such accounting and other records in such manner that enables the Directors to sufficiently explain the transactions and financial position of the Company and the Group, and to prepare a true and fair statement of comprehensive income and statement of financial position and any documents required to be attached, as well as to enable such accounting records to be audited conveniently and properly.
The Directors also have general responsibilities for taking such steps that are reasonably available to them to safeguard the assets of the Group and of the Company and to prevent and detect fraud and other irregularities.
105FINANCIAL STATEMENTS08
DIRECTORS’ REPORT
DIRECTORS’ REPORT
The Directors hereby submit the annual report to the members together with the audited financial statements of the Group and of the Company for the financial year ended 31 December 2019.
PRINCIPAL ACTIVITIES
The principal activity of the Company is investment holding. The principal activities of the subsidiaries are set out in Note 20 to the financial statements.
There has been no significant change in the nature of these activities of the Group and of the Company during the financial year.
FINANCIAL RESULTS
Group Company RM’000 RM’000
Loss for the financial year (299,769) (358,656)
DIVIDENDS
No dividend has been paid or declared by the Company since the end of the previous financial year.
The Board of Directors do not recommend the payment of any dividend in respect of the financial year ended 31 December 2019.
RESERVES AND PROVISIONS
All material transfers to and from reserves or provisions during the financial year are disclosed in the financial statements.
DIRECTORS
The Directors in office during the financial year and during the previous period from the end of the financial year to the date of the report are as follows:
Datuk Wira Azhar Abdul Hamid
Datuk Lim Thean Shiang
Dato’ Rosini Abd Samad
Dato’ Haris Fadzilah Hassan (Appointed on 11.02.2019)
Anuar Malek (Appointed on 13.08.2019)
Dato’ Zainal Haji Ismail (Cessation of Office on 25.03.2020)
Dato’ Hajjah Rosni Haji Zahari (Cessation of Office on 25.03.2020)
Dato’ Ab Ghani Mohd Ali (Resigned on 13.08.2019)
Dato’ Khairil Anuar Aziz (Resigned on 23.04.2019)
The names of Directors of subsidiaries are set out in the respective subsidiary’s statutory accounts and the said information is deemed incorporated herein by such reference and made part thereof.
MSM MalaySia HoldingS BerHad | annual report 2019106
DIRECTORS’ BENEFITS
Since the end of the previous financial year, no Director has received or become entitled to receive a benefit (other than the benefits shown under Directors’ Remuneration as disclosed in Note 12 to the financial statements) by reason of a contract made by the Company or a related corporation with the Directors or with a firm of which the Director is a member, or with a company in which the Director has a substantial financial interest.
Neither during nor at the end of the financial year, no arrangements subsisted to which the Company is a party, being arrangements with the object or objects of enabling Directors of the Company to acquire benefits by means of the acquisition of shares in, or debentures of, the Company or any other body corporate, other than those arising from holding company’s long term incentive plan (“LTIP”) as disclosed in Directors’ Interest in Shares and Debentures.
DIRECTORS’ INTEREST IN SHARES AND DEBENTURES
According to the Register of Directors’ Shareholdings required to be kept under Section 59 of the Companies Act 2016, none of the Directors who held office at the end of the financial year held any shares or debentures in the Company or its subsidiaries or its holding company or subsidiaries of the holding company during the financial year except as follows:
Shareholdings in MSM Malaysia Holdings Berhad Number of ordinary shares At At 1.1.2019 Acquired (Disposed) 31.12.2019
Dato’ Zainal Haji Ismail 20,000 - - 20,000
Dato’ Hajjah Rosni Haji Zahari 20,000 - - 20,000
Shareholdings in FGV Holdings Berhad, the ultimate holding company Number of ordinary shares At date of appointment/ At 1.1.2019 Acquired Granted (Disposed) 31.12.2019
Datuk Wira Azhar Abdul Hamid 694,500 305,500 - - 1,000,000
Dato’ Zainal Haji Ismail 40,000 - - - 40,000
Dato’ Haris Fadzilah Hassan # 50,000 - - - 50,000
# Deemed interest by virtue of Section 59(11) of the Companies Act 2016, 50,000 shares are held through the spouse of Dato’ Haris Fadzilah Hassan.
DIRECTORS’ REPORT
107FINANCIAL STATEMENTS08
DIRECTORS’ REPORT
AUDITORS’ REMUNERATION
Details of auditors’ remuneration are set out in Note 11 to the financial statements.
DIRECTORS’ REMUNERATION
Details of Directors’ remuneration are set out in Note 12 to the financial statements.
INDEMNITY AND INSURANCE FOR DIRECTORS AND OFFICERS
The Company maintains a corporate liability insurance for the Directors and Officers of the Group throughout the financial year, which provides appropriate insurance cover for the Directors and officers of the Group. The total amount of insurance premium paid by the Group during the financial year amounted to RM48,500 (2018: RM49,000).
STATUTORY INFORMATION ON THE FINANCIAL STATEMENTS
Before the financial statements of the Group and of the Company were prepared, the Directors took reasonable steps:
(a) to ascertain that proper action had been taken in relation to the writing off of bad debts and the making of provision for doubtful debts and satisfied themselves that all known bad debts had been written off and that adequate provision had been made for doubtful debts; and
(b) to ensure that any current assets, other than debts, which were unlikely to be realised in the ordinary course of business including the values of current assets as shown in the accounting records of the Group and the Company had been written down to an amount which the current assets might be expected so to realise.
At the date of this report, the Directors are not aware of any circumstances:
(a) which would render the amounts written off for bad debts or the amount of the provision for doubtful debts inadequate to any substantial extent; or
(b) which would render the values attributed to current assets in the financial statements of the Group and the Company misleading; or
(c) which have arisen which render adherence to the existing method of valuation of assets or liabilities of the Group and the Company misleading or inappropriate.
No contingent or other liability has become enforceable or is likely to become enforceable within the period of twelve (12) months after the end of the financial year which, in the opinion of the Directors, will or may affect the ability of the Group or the Company to meet their obligations when they fall due.
At the date of this report, there does not exist:
(a) any charge on the assets of the Group and of the Company which has arisen since the end of the financial year which secures the liability of any other person; or
(b) any contingent liability of the Group and of the Company which has arisen since the end of the financial year.
MSM MalaySia HoldingS BerHad | annual report 2019108
DIRECTORS’ REPORT
STATUTORY INFORMATION ON THE FINANCIAL STATEMENTS (CONTINUED)
At the date of this report, the Directors are not aware of any circumstances not otherwise dealt with in this report or the financial statements which would render any amount stated in the financial statements misleading.
In the opinion of the Directors:
(a) the results of the Group’s and of the Company’s operations during the financial year were not substantially affected by any item, transaction or event of a material and unusual nature except as disclosed in Notes 17, 20 and 34 to the financial statements; and
(b) there has not arisen in the interval between the end of the financial year and the date of this report any item, transaction or event of a material and unusual nature likely to affect substantially the results of the operations of the Group or the Company for the financial year in which this report is made, except as disclosed in Note 42 to the financial statements.
ULTIMATE HOLDING COMPANY
The Directors regard FGV Holdings Berhad, a company incorporated in Malaysia and listed on the Main Market of Bursa Malaysia Securities Berhad, as the ultimate holding company.
AUDITORS
The auditors, PricewaterhouseCoopers PLT (LLP0014401 - LCA & AF 1146), have expressed their willingness to continue in office.
This report was approved by the Board of Directors on 17 April 2020. Signed on behalf of the Board of Directors:
DATO’ HARIS FADZILAH HASSAN DATO’ ROSINI ABD SAMAD DIRECTOR DIRECTOR
Kuala Lumpur
109FINANCIAL STATEMENTS08
STATUTORY DECLARATION PURSUANT TO SECTION 251(1) OF THE COMPANIES ACT 2016
STATEMENT BY DIRECTORS PURSUANT TO SECTION 251(2) OF THE COMPANIES ACT 2016
We, Dato’ Haris Fadzilah Hassan and Dato’ Rosini Abd Samad, two of the Directors of MSM Malaysia Holdings Berhad, do hereby state that, in the opinion of the Directors, the financial statements set out on pages 116 to 224 are drawn up so as to give a true and fair view of the financial position of the Group and of the Company as at 31 December 2019 and of the financial performance and cash flows of the Group and of the Company for the financial year ended in accordance with Malaysian Financial Reporting Standards, International Financial Reporting Standards and the requirements of the Companies Act 2016 in Malaysia.
Signed on behalf of the Board of Directors in accordance with a resolution dated 17 April 2020.
DATO’ HARIS FADZILAH HASSAN DATO’ ROSINI ABD SAMAD DIRECTOR DIRECTOR
Kuala Lumpur
I, Ab Aziz Ismail, the Officer primarily responsible for the financial management of MSM Malaysia Holdings Berhad, do solemnly and sincerely declare that the financial statements set out on pages 116 to 224 are, to the best of my knowledge and belief, correct, and I make this solemn declaration conscientiously believing the same to be true, and by virtue of the provisions of the Statutory Declarations Act, 1960.
AB AZIZ ISMAIL(MIA No.: 15850)
Subscribed and solemnly declared by the above named Ab Aziz Ismail in Putrajaya on 17 April 2020, before me.
COMMISSIONER FOR OATHS
MSM MalaySia HoldingS BerHad | annual report 2019110
INDEPENDENT AUDITORS’ REPORT TO THE MEMBERS OF MSM MALAYSIA HOLDINGS BERHAD(Incorporated in Malaysia)(Registration No. 201101007583 (935722-K))
REPORT ON THE AUDIT OF THE FINANCIAL STATEMENTS
Our opinion
In our opinion, the financial statements of MSM Malaysia Holdings Berhad (“the Company”) and its subsidiaries (“the Group”) give a true and fair view of the financial position of the Group and of the Company as at 31 December 2019, and of their financial performance and their cash flows for the financial year then ended in accordance with Malaysian Financial Reporting Standards, International Financial Reporting Standards and the requirements of the Companies Act 2016 in Malaysia.
What we have audited
We have audited the financial statements of the Group and of the Company, which comprise the statements of financial position as at 31 December 2019 of the Group and of the Company, and the statements of comprehensive income, statements of changes in equity and statements of cash flows of the Group and of the Company for the financial year then ended, and notes to the financial statements, including a summary of significant accounting policies, as set out on pages 116 to 224.
Basis for opinion
We conducted our audit in accordance with approved standards on auditing in Malaysia and International Standards on Auditing. Our responsibilities under those standards are further described in the “Auditors’ responsibilities for the audit of the financial statements” section of our report.
We believe that the audit evidence we have obtained is sufficient and appropriate to provide a basis for our opinion.
Independence and other ethical responsibilities
We are independent of the Group and of the Company in accordance with the By-Laws (on Professional Ethics, Conduct and Practice) of the Malaysian Institute of Accountants (“By-Laws”) and the International Ethics Standards Board for Accountants’ Code of Ethics for Professional Accountants (“IESBA Code”), and we have fulfilled our other ethical responsibilities in accordance with the By-Laws and the IESBA Code.
Our audit approach
As part of designing our audit, we determined materiality and assessed the risks of material misstatement in the financial statements of the Group and of the Company. In particular, we considered where the Directors made subjective judgements; for example, in respect of significant accounting estimates that involved making assumptions and considering future events that are inherently uncertain. As in all of our audits, we also addressed the risk of management override of internal controls, including among other matters, consideration of whether there was evidence of bias that represented a risk of material misstatement due to fraud.
We tailored the scope of our audit in order to perform sufficient work to enable us to provide an opinion on the financial statements as a whole, taking into account the structure of the Group and of the Company, the accounting processes and controls, and the industry in which the Group and the Company operate.
111FINANCIAL STATEMENTS08
INDEPENDENT AUDITORS’ REPORT TO THE MEMBERS OF MSM MALAYSIA HOLDINGS BERHAD(Incorporated in Malaysia)(Registration No. 201101007583 (935722-K))
REPORT ON THE AUDIT OF THE FINANCIAL STATEMENTS (CONTINUED)
Key audit matters
Key audit matters are those matters that, in our professional judgement, were of most significance in our audit of the financial statements of the Group and of the Company for the current financial year. These matters were addressed in the context of our audit of the financial statements of the Group and of the Company as a whole, and in forming our opinion thereon, and we do not provide a separate opinion on these matters.
Key audit matters How our audit addressed the key audit matters
Impairment assessment of goodwill
As at 31 December 2019, the Group has goodwill of RM576.2 million.
We focused on this area as the recoverable amount of the cash generating unit (“CGU”) is based on value-in-use (“VIU”) calculations, which requires management’s judgement on the assumptions used in the calculations, in particular selling price, raw sugar price, sales volume, terminal value growth rate, discount rate and exchange rate.
Refer to Notes 3(d) and 3(k) in the significant accounting policies, Note 5 in the critical accounting estimates and judgement and Note 19 to the financial statements.
We performed the following procedures on the cash flow projections prepared by the management:
• We assessed the reasonableness of the key assumptionsused by management in the VIU calculations, in particular selling price, raw sugar price, sales volume, terminal value growth rate, discount rate and exchange rate by comparing with business plans, historical results and market trends;
• We assessed the reliability of management’s forecastthrough the review of past trends of actual financial performance against previous forecasted results;
• We examined the sensitivity analysis prepared by themanagement on selling price, raw sugar price, sales volume, terminal value growth rate, discount rate and exchange rate to evaluate the impact on the impairment assessment; and
• Weassessedtheadequacyofthedisclosuresinrelationtogoodwill in the financial statements.
Based on our procedures, we noted no significant exceptions.
Impairment assessment of property, plant and equipment, right-of-use assets and intangible assets
The carrying values of property, plant and equipment, right-of-use assets and intangible assets of the Group as at 31 December 2019 are RM1,295.4 million, RM96.2 million and RM630.8 million respectively (“non-monetary assets”).
The Group has embarked on a plan to rationalise the capacity of its three refinery plants to address the sugar production capacity during the year.
Consequently, management performed an impairment assessment on the Group’s non-monetary assets. An impairment of RM138.8 million was recorded for the financial year ended 31 December 2019.
We performed the following procedures on the cash flow projections prepared by the management:
• We assessed the reasonableness of the key assumptionsused by management in the VIU calculations, in particular selling price, raw sugar price, sales volume, realisability of assets at terminal year and discount rate by comparing with business plans, historical results and market trends;
• We assessed the reliability of management’s forecastthrough the review of past trends of actual financial performance against previous forecasted results; and
• Weassessedtheadequacyofthedisclosuresinthefinancialstatements.
MSM MalaySia HoldingS BerHad | annual report 2019112
INDEPENDENT AUDITORS’ REPORT TO THE MEMBERS OF MSM MALAYSIA HOLDINGS BERHAD(Incorporated in Malaysia)(Registration No. 201101007583 (935722-K))
REPORT ON THE AUDIT OF THE FINANCIAL STATEMENTS (CONTINUED)
Key audit matters (continued)
Key audit matters How our audit addressed the key audit matters
Impairment assessment of property, plant and equipment, right-of-use assets and intangible assets (continued)
We focused on this area as the recoverable amount of the assets based on VIU calculations require management’s judgement on the assumptions used in the calculations, in particular selling price, raw sugar price, sales volume, realisability of the assets at terminal year, and discount rate.
Refer to Notes 3(e), 3(i), 3(k) and 3(r) in the significant accounting policies, Note 5 in the critical accounting estimates and judgement and Notes 17, 18 and 19 to the financial statements.
Based on our procedures, we noted no significant exceptions.
There are no key audit matters to report for the Company.
Information other than the financial statements and auditors’ report thereon
The Directors of the Company are responsible for the other information. The other information comprises the Directors' Report, Chairman’s Statement, Management Discussion and Analysis, Group Financial Report, Sustainability Report, Corporate Governance (including Audit Committee Report, Nomination and Remuneration Committee Report, and Statement on Risk Management and Internal Control), and other sections of the Annual Report 2019, but does not include the financial statements of the Group and of the Company and our auditors’ report thereon.
Our opinion on the financial statements of the Group and of the Company does not cover the other information and we do not express any form of assurance conclusion thereon.
In connection with our audit of the financial statements of the Group and of the Company, our responsibility is to read the other information and, in doing so, consider whether the other information is materially inconsistent with the financial statements of the Group and of the Company or our knowledge obtained in the audit or otherwise appears to be materially misstated.
If, based on the work we have performed, we conclude that there is a material misstatement of this other information, we are required to report that fact. We have nothing to report in this regard.
Responsibilities of the Directors for the financial statements
The Directors of the Company are responsible for the preparation of the financial statements of the Group and of the Company that give a true and fair view in accordance with Malaysian Financial Reporting Standards, International Financial Reporting Standards and the requirements of the Companies Act 2016 in Malaysia. The Directors are also responsible for such internal control as the Directors determine is necessary to enable the preparation of financial statements of the Group and of the Company that are free from material misstatement, whether due to fraud or error.
In preparing the financial statements of the Group and of the Company, the Directors are responsible for assessing the Group’s and the Company’s ability to continue as a going concern, disclosing, as applicable, matters related to going concern and using the going concern basis of accounting unless the Directors either intend to liquidate the Group or the Company or to cease operations, or have no realistic alternative but to do so.
113FINANCIAL STATEMENTS08
INDEPENDENT AUDITORS’ REPORT TO THE MEMBERS OF MSM MALAYSIA HOLDINGS BERHAD(Incorporated in Malaysia)(Registration No. 201101007583 (935722-K))
Auditors’ responsibilities for the audit of the financial statements
Our objectives are to obtain reasonable assurance about whether the financial statements of the Group and of the Company as a whole are free from material misstatement, whether due to fraud or error, and to issue an auditors’ report that includes our opinion. Reasonable assurance is a high level of assurance, but is not a guarantee that an audit conducted in accordance with approved standards on auditing in Malaysia and International Standards on Auditing will always detect a material misstatement when it exists. Misstatements can arise from fraud or error and are considered material if, individually or in the aggregate, they could reasonably be expected to influence the economic decisions of users taken on the basis of these financial statements.
As part of an audit in accordance with approved standards on auditing in Malaysia and International Standards on Auditing, we exercise professional judgement and maintain professional scepticism throughout the audit. We also:
(a) Identify and assess the risks of material misstatement of the financial statements of the Group and of the Company, whether due to fraud or error, design and perform audit procedures responsive to those risks, and obtain audit evidence that is sufficient and appropriate to provide a basis for our opinion. The risk of not detecting a material misstatement resulting from fraud is higher than for one resulting from error, as fraud may involve collusion, forgery, intentional omissions, misrepresentations, or the override of internal control.
(b) Obtain an understanding of internal control relevant to the audit in order to design audit procedures that are appropriate in the circumstances, but not for the purpose of expressing an opinion on the effectiveness of the Group’s and of the Company’s internal control.
(c) Evaluate the appropriateness of accounting policies used and the reasonableness of accounting estimates and related disclosures made by the Directors.
(d) Conclude on the appropriateness of the Directors’ use of the going concern basis of accounting and, based on the audit evidence obtained, whether a material uncertainty exists related to events or conditions that may cast significant doubt on the Group’s or on the Company’s ability to continue as a going concern. If we conclude that a material uncertainty exists, we are required to draw attention in our auditors’ report to the related disclosures in the financial statements of the Group and of the Company or, if such disclosures are inadequate, to modify our opinion. Our conclusions are based on the audit evidence obtained up to the date of our auditors’ report.
However, future events or conditions may cause the Group or the Company to cease to continue as a going concern.
(e) Evaluate the overall presentation, structure and content of the financial statements of the Group and of the Company, including the disclosures, and whether the financial statements of the Group and of the Company represent the underlying transactions and events in a manner that achieves fair presentation.
(f) Obtain sufficient appropriate audit evidence regarding the financial information of the entities or business activities within the Group to express an opinion on the financial statements of the Group. We are responsible for the direction, supervision and performance of the group audit. We remain solely responsible for our audit opinion.
We communicate with the Directors regarding, among other matters, the planned scope and timing of the audit and significant audit findings, including any significant deficiencies in internal control that we identify during our audit.
MSM MalaySia HoldingS BerHad | annual report 2019114
INDEPENDENT AUDITORS’ REPORT TO THE MEMBERS OF MSM MALAYSIA HOLDINGS BERHAD(Incorporated in Malaysia)(Registration No. 201101007583 (935722-K))
Auditors’ responsibilities for the audit of the financial statements (continued)
We also provide the Directors with a statement that we have complied with relevant ethical requirements regarding independence, and to communicate with them all relationships and other matters that may reasonably be thought to bear on our independence, and where applicable, related safeguards.
From the matters communicated with the Directors, we determine those matters that were of most significance in the audit of the financial statements of the Group and of the Company for the current financial year and are therefore the key audit matters. We describe these matters in our auditors’ report unless law or regulation precludes public disclosure about the matter or when, in extremely rare circumstances, we determine that a matter should not be communicated in our report because the adverse consequences of doing so would reasonably be expected to outweigh the public interest benefits of such communication.
REPORT ON OTHER LEGAL AND REGULATORY REQUIREMENTS
In accordance with the requirements of the Companies Act 2016 in Malaysia, we report that the subsidiary of which we have not acted as auditor, is disclosed in Note 20 to the financial statements.
OTHER MATTERS
This report is made solely to the members of the Company, as a body, in accordance with Section 266 of the Companies Act 2016 in Malaysia and for no other purpose. We do not assume responsibility to any other person for the content of this report.
PRICEWATERHOUSECOOPERS PLT MAHESH A/L RAMESHLLP0014401-LCA & AF 1146 03428/04/2021 JChartered Accountants Chartered Accountant
Kuala Lumpur17 April 2020
115FINANCIAL STATEMENTS08
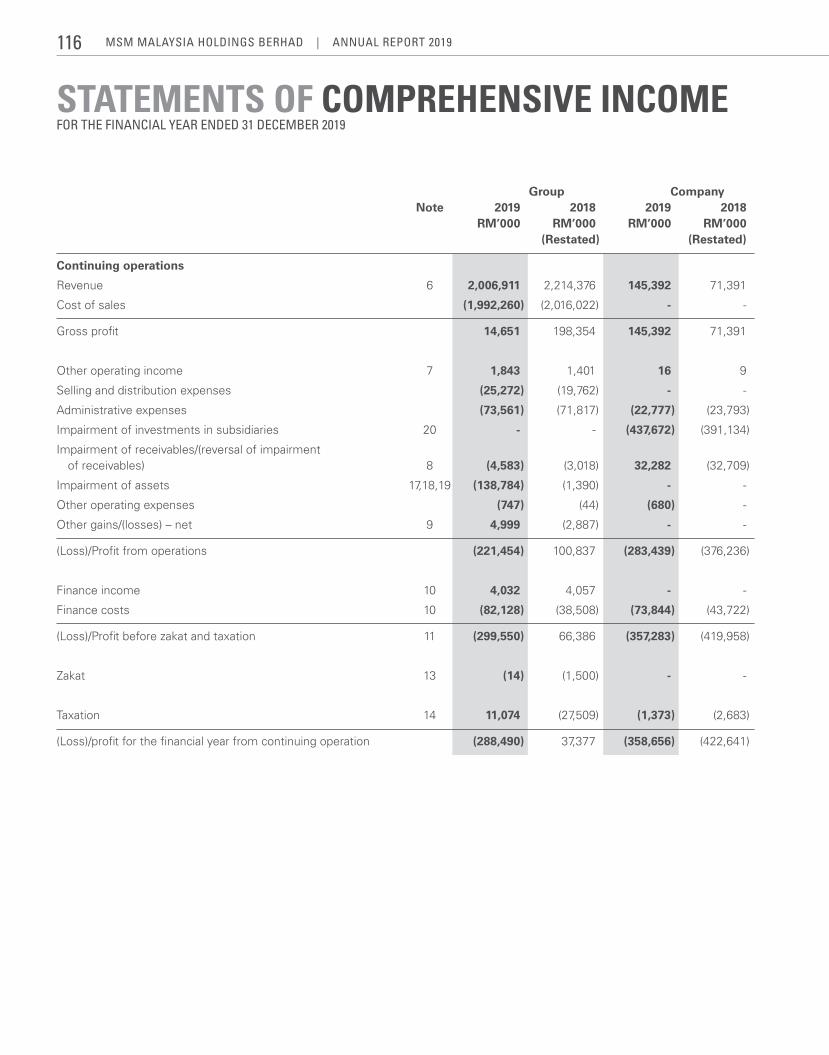
STATEMENTS OF COMPREHENSIVE INCOMEFOR THE FINANCIAL YEAR ENDED 31 DECEMBER 2019
Group Company Note 2019 2018 2019 2018 RM’000 RM’000 RM’000 RM’000 (Restated) (Restated)
Continuing operations
Revenue 6 2,006,911 2,214,376 145,392 71,391
Cost of sales (1,992,260) (2,016,022) - -
Gross profit 14,651 198,354 145,392 71,391
Other operating income 7 1,843 1,401 16 9
Selling and distribution expenses (25,272) (19,762) - -
Administrative expenses (73,561) (71,817) (22,777) (23,793)
Impairment of investments in subsidiaries 20 - - (437,672) (391,134)
Impairment of receivables/(reversal of impairment of receivables) 8 (4,583) (3,018) 32,282 (32,709)
Impairment of assets 17,18,19 (138,784) (1,390) - -
Other operating expenses (747) (44) (680) -
Other gains/(losses) – net 9 4,999 (2,887) - -
(Loss)/Profit from operations (221,454) 100,837 (283,439) (376,236)
Finance income 10 4,032 4,057 - -
Finance costs 10 (82,128) (38,508) (73,844) (43,722)
(Loss)/Profit before zakat and taxation 11 (299,550) 66,386 (357,283) (419,958)
Zakat 13 (14) (1,500) - -
Taxation 14 11,074 (27,509) (1,373) (2,683)
(Loss)/profit for the financial year from continuing operation (288,490) 37,377 (358,656) (422,641)
MSM MalaySia HoldingS BerHad | annual report 2019116
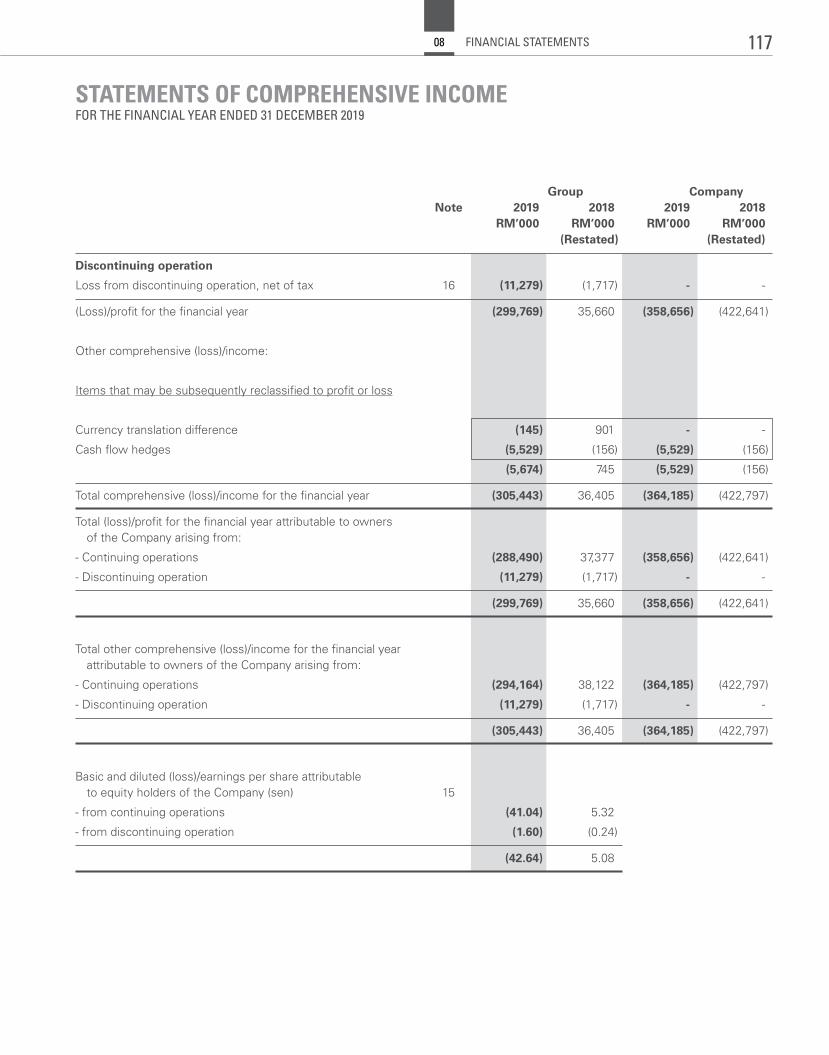
STATEMENTS OF COMPREHENSIVE INCOMEFOR THE FINANCIAL YEAR ENDED 31 DECEMBER 2019
Group Company Note 2019 2018 2019 2018 RM’000 RM’000 RM’000 RM’000 (Restated) (Restated)
Discontinuing operation
Loss from discontinuing operation, net of tax 16 (11,279) (1,717) - -
(Loss)/profit for the financial year (299,769) 35,660 (358,656) (422,641)
Other comprehensive (loss)/income:
Items that may be subsequently reclassified to profit or loss
Currency translation difference (145) 901 - -
Cash flow hedges (5,529) (156) (5,529) (156)
(5,674) 745 (5,529) (156)
Total comprehensive (loss)/income for the financial year (305,443) 36,405 (364,185) (422,797)
Total (loss)/profit for the financial year attributable to owners of the Company arising from:
- Continuing operations (288,490) 37,377 (358,656) (422,641)
- Discontinuing operation (11,279) (1,717) - -
(299,769) 35,660 (358,656) (422,641)
Total other comprehensive (loss)/income for the financial year attributable to owners of the Company arising from:
- Continuing operations (294,164) 38,122 (364,185) (422,797)
- Discontinuing operation (11,279) (1,717) - -
(305,443) 36,405 (364,185) (422,797)
Basic and diluted (loss)/earnings per share attributable to equity holders of the Company (sen) 15
- from continuing operations (41.04) 5.32
- from discontinuing operation (1.60) (0.24)
(42.64) 5.08
117FINANCIAL STATEMENTS08
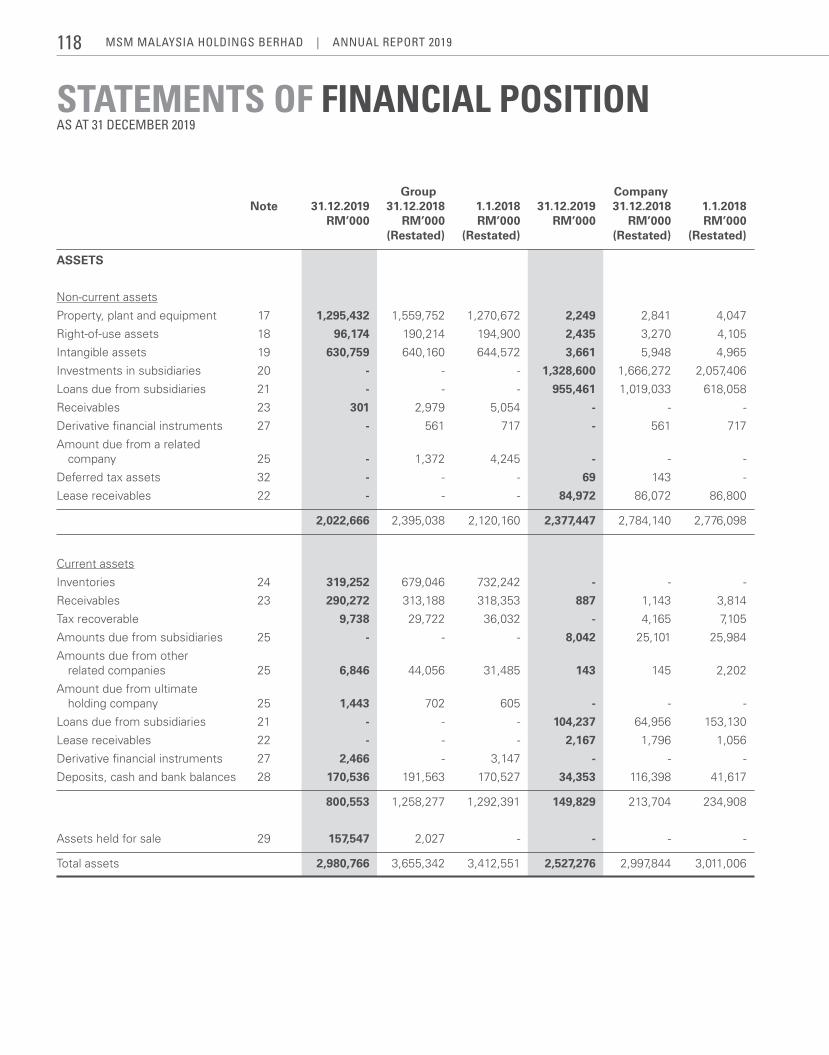
STATEMENTS OF FINANCIAL POSITIONAS AT 31 DECEMBER 2019
Group Company Note 31.12.2019 31.12.2018 1.1.2018 31.12.2019 31.12.2018 1.1.2018 RM’000 RM’000 RM’000 RM’000 RM’000 RM’000 (Restated) (Restated) (Restated) (Restated)
ASSETS
Non-current assets
Property, plant and equipment 17 1,295,432 1,559,752 1,270,672 2,249 2,841 4,047
Right-of-use assets 18 96,174 190,214 194,900 2,435 3,270 4,105
Intangible assets 19 630,759 640,160 644,572 3,661 5,948 4,965
Investments in subsidiaries 20 - - - 1,328,600 1,666,272 2,057,406
Loans due from subsidiaries 21 - - - 955,461 1,019,033 618,058
Receivables 23 301 2,979 5,054 - - -
Derivative financial instruments 27 - 561 717 - 561 717
Amount due from a related company 25 - 1,372 4,245 - - -
Deferred tax assets 32 - - - 69 143 -
Lease receivables 22 - - - 84,972 86,072 86,800
2,022,666 2,395,038 2,120,160 2,377,447 2,784,140 2,776,098
Current assets
Inventories 24 319,252 679,046 732,242 - - -
Receivables 23 290,272 313,188 318,353 887 1,143 3,814
Tax recoverable 9,738 29,722 36,032 - 4,165 7,105
Amounts due from subsidiaries 25 - - - 8,042 25,101 25,984
Amounts due from other related companies 25 6,846 44,056 31,485 143 145 2,202
Amount due from ultimate holding company 25 1,443 702 605 - - -
Loans due from subsidiaries 21 - - - 104,237 64,956 153,130
Lease receivables 22 - - - 2,167 1,796 1,056
Derivative financial instruments 27 2,466 - 3,147 - - -
Deposits, cash and bank balances 28 170,536 191,563 170,527 34,353 116,398 41,617
800,553 1,258,277 1,292,391 149,829 213,704 234,908
Assets held for sale 29 157,547 2,027 - - - -
Total assets 2,980,766 3,655,342 3,412,551 2,527,276 2,997,844 3,011,006
MSM MalaySia HoldingS BerHad | annual report 2019118
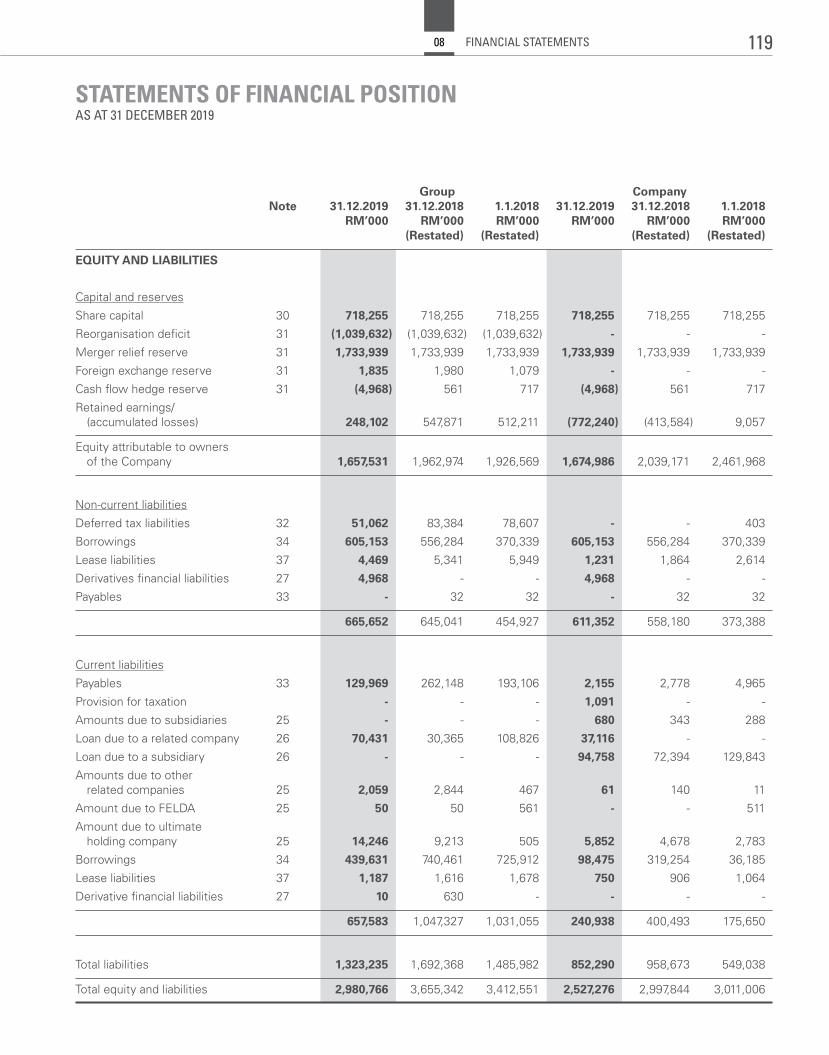
STATEMENTS OF FINANCIAL POSITIONAS AT 31 DECEMBER 2019
Group Company Note 31.12.2019 31.12.2018 1.1.2018 31.12.2019 31.12.2018 1.1.2018 RM’000 RM’000 RM’000 RM’000 RM’000 RM’000 (Restated) (Restated) (Restated) (Restated)
EQUITY AND LIABILITIES
Capital and reserves
Share capital 30 718,255 718,255 718,255 718,255 718,255 718,255
Reorganisation deficit 31 (1,039,632) (1,039,632) (1,039,632) - - -
Merger relief reserve 31 1,733,939 1,733,939 1,733,939 1,733,939 1,733,939 1,733,939
Foreign exchange reserve 31 1,835 1,980 1,079 - - -
Cash flow hedge reserve 31 (4,968) 561 717 (4,968) 561 717
Retained earnings/ (accumulated losses) 248,102 547,871 512,211 (772,240) (413,584) 9,057
Equity attributable to owners of the Company 1,657,531 1,962,974 1,926,569 1,674,986 2,039,171 2,461,968
Non-current liabilities
Deferred tax liabilities 32 51,062 83,384 78,607 - - 403
Borrowings 34 605,153 556,284 370,339 605,153 556,284 370,339
Lease liabilities 37 4,469 5,341 5,949 1,231 1,864 2,614
Derivatives financial liabilities 27 4,968 - - 4,968 - -
Payables 33 - 32 32 - 32 32
665,652 645,041 454,927 611,352 558,180 373,388
Current liabilities
Payables 33 129,969 262,148 193,106 2,155 2,778 4,965
Provision for taxation - - - 1,091 - -
Amounts due to subsidiaries 25 - - - 680 343 288
Loan due to a related company 26 70,431 30,365 108,826 37,116 - -
Loan due to a subsidiary 26 - - - 94,758 72,394 129,843
Amounts due to other related companies 25 2,059 2,844 467 61 140 11
Amount due to FELDA 25 50 50 561 - - 511
Amount due to ultimate holding company 25 14,246 9,213 505 5,852 4,678 2,783
Borrowings 34 439,631 740,461 725,912 98,475 319,254 36,185
Lease liabilities 37 1,187 1,616 1,678 750 906 1,064
Derivative financial liabilities 27 10 630 - - - -
657,583 1,047,327 1,031,055 240,938 400,493 175,650
Total liabilities 1,323,235 1,692,368 1,485,982 852,290 958,673 549,038
Total equity and liabilities 2,980,766 3,655,342 3,412,551 2,527,276 2,997,844 3,011,006
119FINANCIAL STATEMENTS08
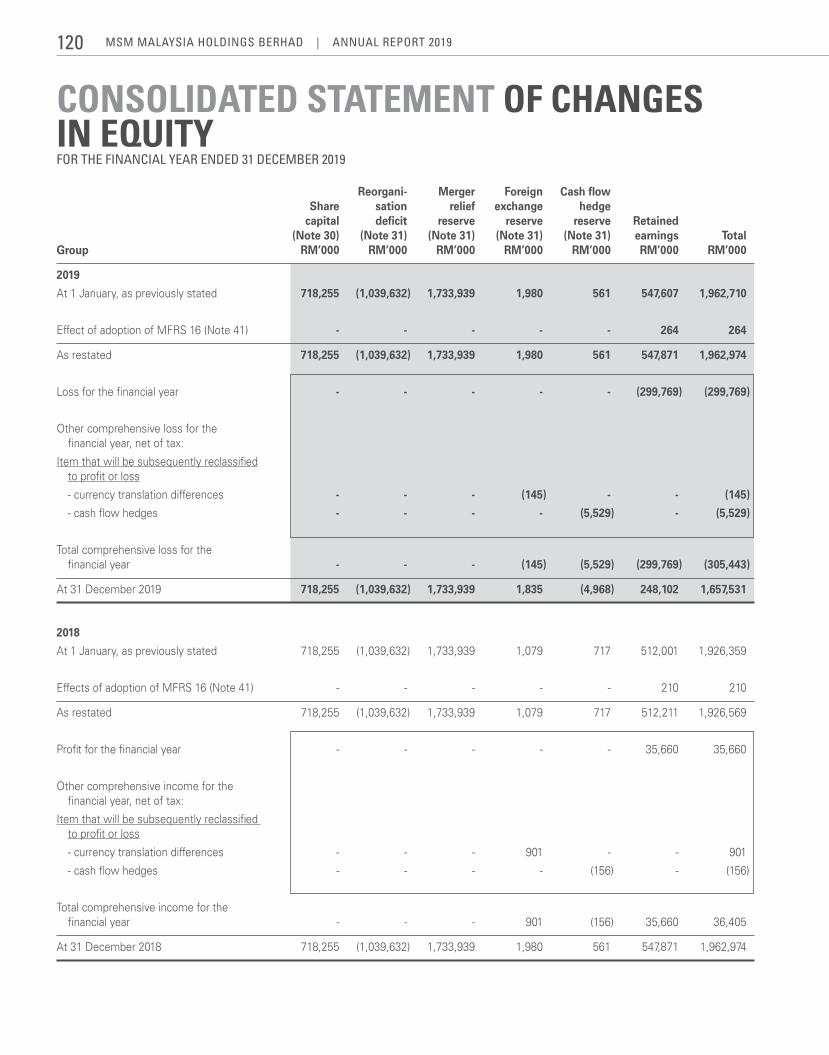
CONSOLIDATED STATEMENT OF CHANGES IN EQUITYFOR THE FINANCIAL YEAR ENDED 31 DECEMBER 2019
Reorgani- Merger Foreign Cash flow Share sation relief exchange hedge capital deficit reserve reserve reserve Retained (Note 30) (Note 31) (Note 31) (Note 31) (Note 31) earnings Total Group RM’000 RM’000 RM’000 RM’000 RM’000 RM’000 RM’000
2019
At 1 January, as previously stated 718,255 (1,039,632) 1,733,939 1,980 561 547,607 1,962,710
Effect of adoption of MFRS 16 (Note 41) - - - - - 264 264
As restated 718,255 (1,039,632) 1,733,939 1,980 561 547,871 1,962,974
Loss for the financial year - - - - - (299,769) (299,769)
Other comprehensive loss for the financial year, net of tax:
Item that will be subsequently reclassified to profit or loss
- currency translation differences - - - (145) - - (145)
- cash flow hedges - - - - (5,529) - (5,529)
Total comprehensive loss for the financial year - - - (145) (5,529) (299,769) (305,443)
At 31 December 2019 718,255 (1,039,632) 1,733,939 1,835 (4,968) 248,102 1,657,531
2018
At 1 January, as previously stated 718,255 (1,039,632) 1,733,939 1,079 717 512,001 1,926,359
Effects of adoption of MFRS 16 (Note 41) - - - - - 210 210
As restated 718,255 (1,039,632) 1,733,939 1,079 717 512,211 1,926,569
Profit for the financial year - - - - - 35,660 35,660
Other comprehensive income for the financial year, net of tax:
Item that will be subsequently reclassified to profit or loss
- currency translation differences - - - 901 - - 901
- cash flow hedges - - - - (156) - (156)
Total comprehensive income for the financial year - - - 901 (156) 35,660 36,405
At 31 December 2018 718,255 (1,039,632) 1,733,939 1,980 561 547,871 1,962,974
MSM MalaySia HoldingS BerHad | annual report 2019120
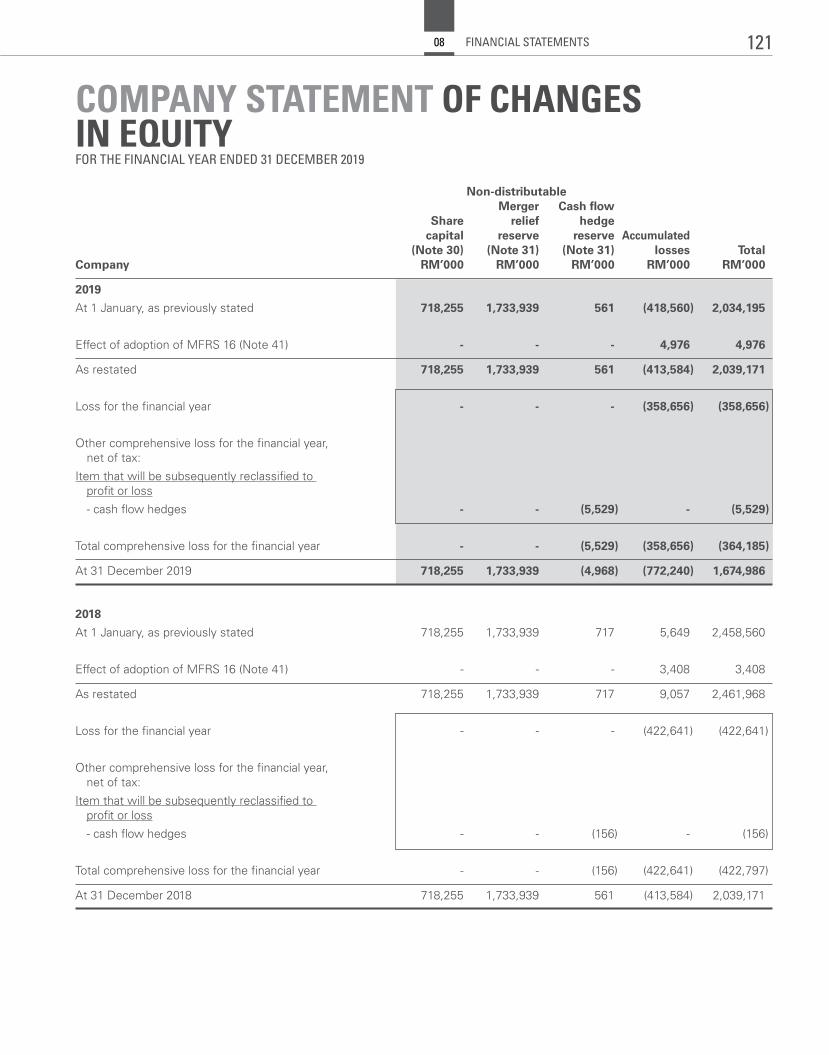
COMPANY STATEMENT OF CHANGES IN EQUITYFOR THE FINANCIAL YEAR ENDED 31 DECEMBER 2019
Non-distributable Merger Cash flow Share relief hedge capital reserve reserve Accumulated (Note 30) (Note 31) (Note 31) losses Total Company RM’000 RM’000 RM’000 RM’000 RM’000
2019
At 1 January, as previously stated 718,255 1,733,939 561 (418,560) 2,034,195
Effect of adoption of MFRS 16 (Note 41) - - - 4,976 4,976
As restated 718,255 1,733,939 561 (413,584) 2,039,171
Loss for the financial year - - - (358,656) (358,656)
Other comprehensive loss for the financial year, net of tax:
Item that will be subsequently reclassified to profit or loss
- cash flow hedges - - (5,529) - (5,529)
Total comprehensive loss for the financial year - - (5,529) (358,656) (364,185)
At 31 December 2019 718,255 1,733,939 (4,968) (772,240) 1,674,986
2018
At 1 January, as previously stated 718,255 1,733,939 717 5,649 2,458,560
Effect of adoption of MFRS 16 (Note 41) - - - 3,408 3,408
As restated 718,255 1,733,939 717 9,057 2,461,968
Loss for the financial year - - - (422,641) (422,641)
Other comprehensive loss for the financial year, net of tax:
Item that will be subsequently reclassified to profit or loss
- cash flow hedges - - (156) - (156)
Total comprehensive loss for the financial year - - (156) (422,641) (422,797)
At 31 December 2018 718,255 1,733,939 561 (413,584) 2,039,171
121FINANCIAL STATEMENTS08
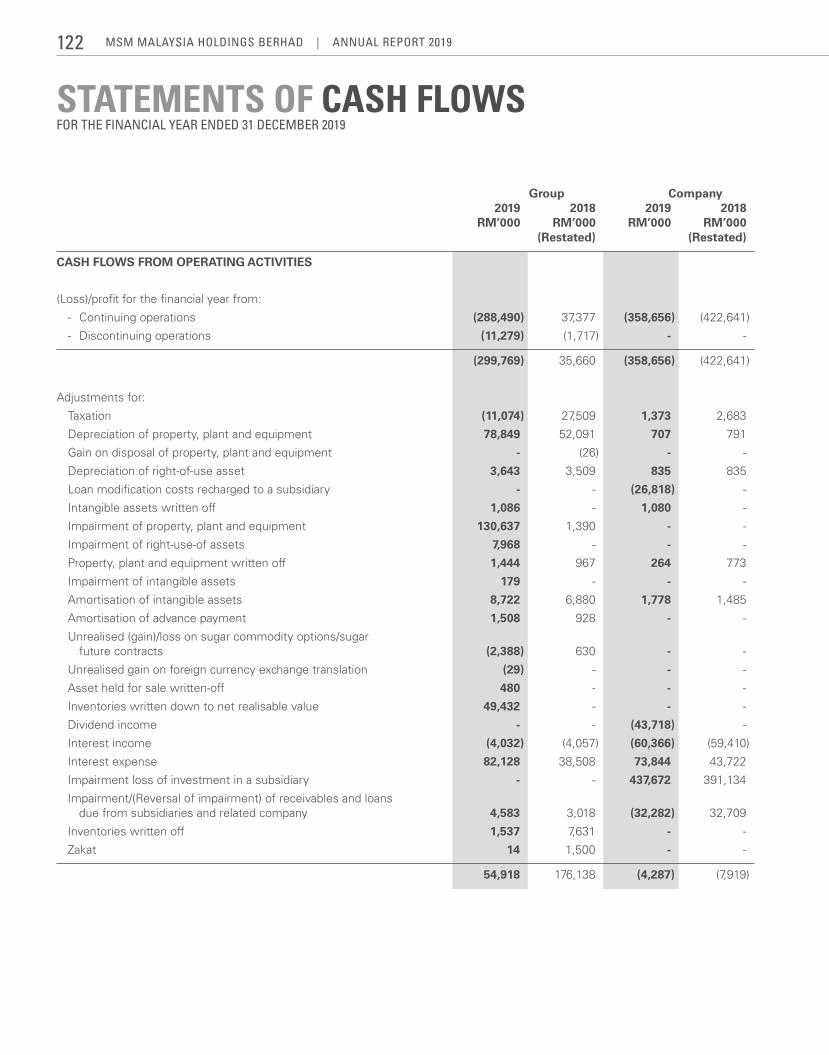
STATEMENTS OF CASH FLOWSFOR THE FINANCIAL YEAR ENDED 31 DECEMBER 2019
Group Company 2019 2018 2019 2018 RM’000 RM’000 RM’000 RM’000 (Restated) (Restated)
CASH FLOWS FROM OPERATING ACTIVITIES
(Loss)/profit for the financial year from:
- Continuing operations (288,490) 37,377 (358,656) (422,641)
- Discontinuing operations (11,279) (1,717) - -
(299,769) 35,660 (358,656) (422,641)
Adjustments for:
Taxation (11,074) 27,509 1,373 2,683
Depreciation of property, plant and equipment 78,849 52,091 707 791
Gain on disposal of property, plant and equipment - (26) - -
Depreciation of right-of-use asset 3,643 3,509 835 835
Loan modification costs recharged to a subsidiary - - (26,818) -
Intangible assets written off 1,086 - 1,080 -
Impairment of property, plant and equipment 130,637 1,390 - -
Impairment of right-use-of assets 7,968 - - -
Property, plant and equipment written off 1,444 967 264 773
Impairment of intangible assets 179 - - -
Amortisation of intangible assets 8,722 6,880 1,778 1,485
Amortisation of advance payment 1,508 928 - -
Unrealised (gain)/loss on sugar commodity options/sugar future contracts (2,388) 630 - -
Unrealised gain on foreign currency exchange translation (29) - - -
Asset held for sale written-off 480 - - -
Inventories written down to net realisable value 49,432 - - -
Dividend income - - (43,718) -
Interest income (4,032) (4,057) (60,366) (59,410)
Interest expense 82,128 38,508 73,844 43,722
Impairment loss of investment in a subsidiary - - 437,672 391,134
Impairment/(Reversal of impairment) of receivables and loans due from subsidiaries and related company 4,583 3,018 (32,282) 32,709
Inventories written off 1,537 7,631 - -
Zakat 14 1,500 - -
54,918 176,138 (4,287) (7,919)
MSM MalaySia HoldingS BerHad | annual report 2019122
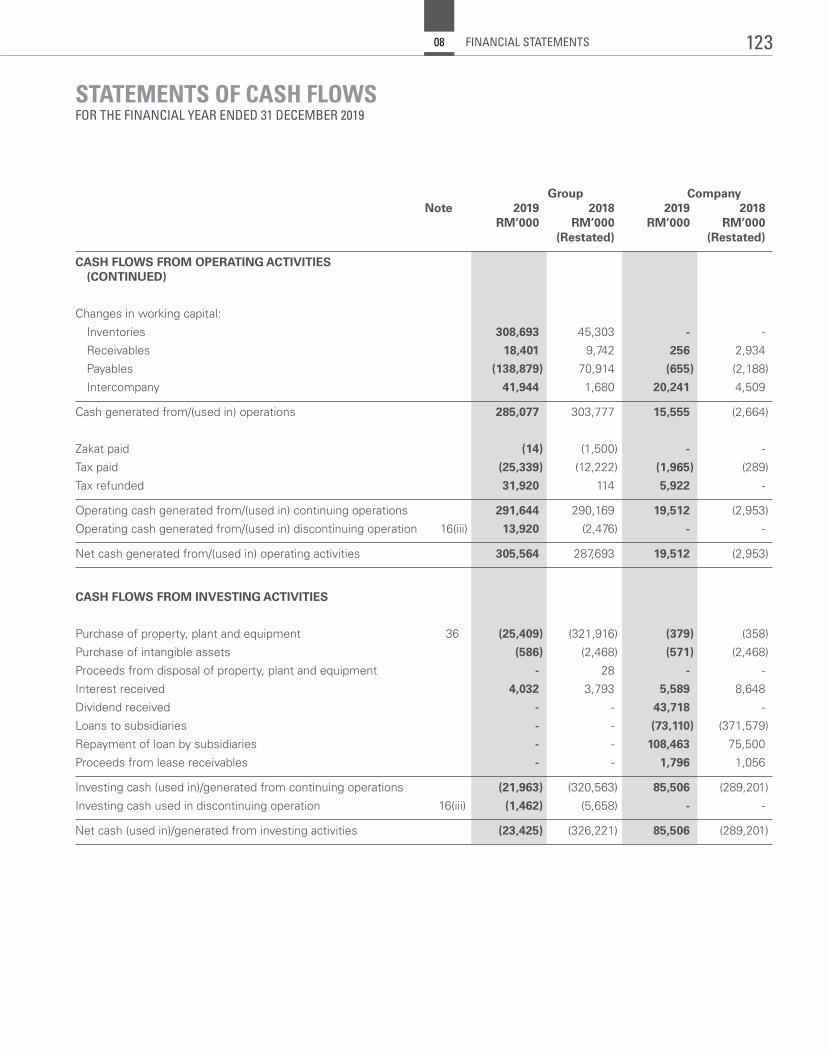
STATEMENTS OF CASH FLOWSFOR THE FINANCIAL YEAR ENDED 31 DECEMBER 2019
Group Company Note 2019 2018 2019 2018 RM’000 RM’000 RM’000 RM’000 (Restated) (Restated)
CASH FLOWS FROM OPERATING ACTIVITIES (CONTINUED)
Changes in working capital:
Inventories 308,693 45,303 - -
Receivables 18,401 9,742 256 2,934
Payables (138,879) 70,914 (655) (2,188)
Intercompany 41,944 1,680 20,241 4,509
Cash generated from/(used in) operations 285,077 303,777 15,555 (2,664)
Zakat paid (14) (1,500) - -
Tax paid (25,339) (12,222) (1,965) (289)
Tax refunded 31,920 114 5,922 -
Operating cash generated from/(used in) continuing operations 291,644 290,169 19,512 (2,953)
Operating cash generated from/(used in) discontinuing operation 16(iii) 13,920 (2,476) - -
Net cash generated from/(used in) operating activities 305,564 287,693 19,512 (2,953)
CASH FLOWS FROM INVESTING ACTIVITIES
Purchase of property, plant and equipment 36 (25,409) (321,916) (379) (358)
Purchase of intangible assets (586) (2,468) (571) (2,468)
Proceeds from disposal of property, plant and equipment - 28 - -
Interest received 4,032 3,793 5,589 8,648
Dividend received - - 43,718 -
Loans to subsidiaries - - (73,110) (371,579)
Repayment of loan by subsidiaries - - 108,463 75,500
Proceeds from lease receivables - - 1,796 1,056
Investing cash (used in)/generated from continuing operations (21,963) (320,563) 85,506 (289,201)
Investing cash used in discontinuing operation 16(iii) (1,462) (5,658) - -
Net cash (used in)/generated from investing activities (23,425) (326,221) 85,506 (289,201)
123FINANCIAL STATEMENTS08
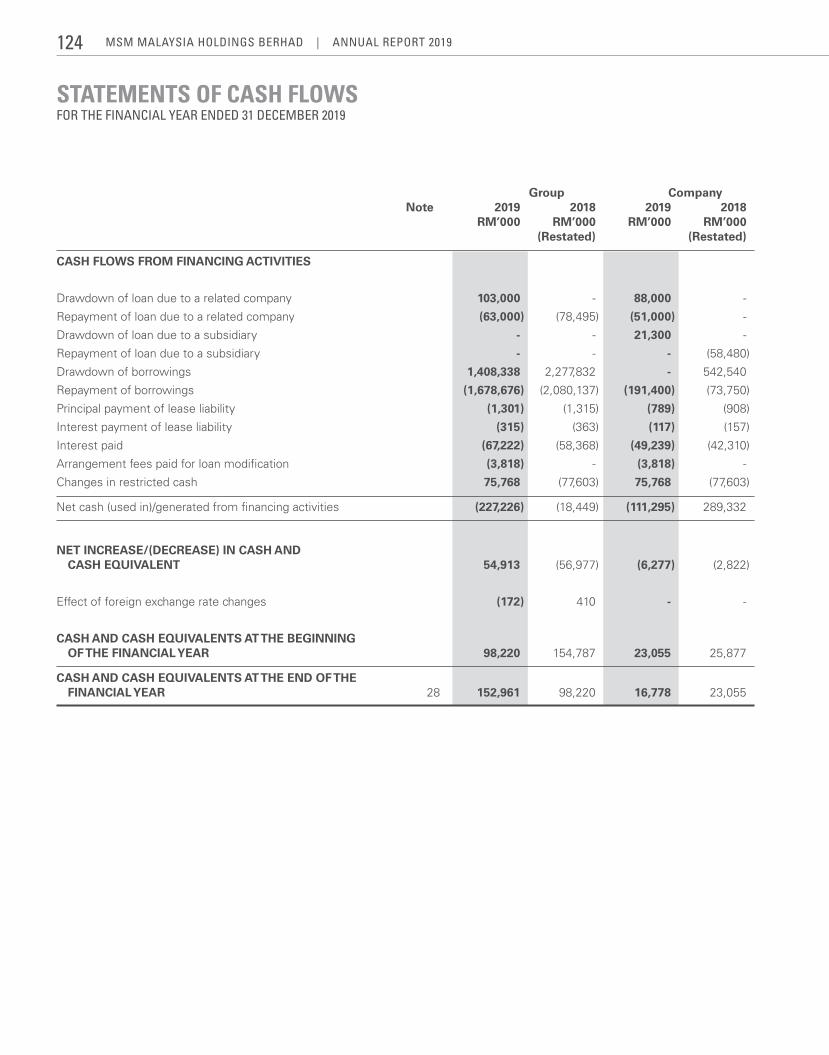
STATEMENTS OF CASH FLOWSFOR THE FINANCIAL YEAR ENDED 31 DECEMBER 2019
Group Company Note 2019 2018 2019 2018 RM’000 RM’000 RM’000 RM’000 (Restated) (Restated)
CASH FLOWS FROM FINANCING ACTIVITIES
Drawdown of loan due to a related company 103,000 - 88,000 -
Repayment of loan due to a related company (63,000) (78,495) (51,000) -
Drawdown of loan due to a subsidiary - - 21,300 -
Repayment of loan due to a subsidiary - - - (58,480)
Drawdown of borrowings 1,408,338 2,277,832 - 542,540
Repayment of borrowings (1,678,676) (2,080,137) (191,400) (73,750)
Principal payment of lease liability (1,301) (1,315) (789) (908)
Interest payment of lease liability (315) (363) (117) (157)
Interest paid (67,222) (58,368) (49,239) (42,310)
Arrangement fees paid for loan modification (3,818) - (3,818) -
Changes in restricted cash 75,768 (77,603) 75,768 (77,603)
Net cash (used in)/generated from financing activities (227,226) (18,449) (111,295) 289,332
NET INCREASE/(DECREASE) IN CASH AND CASH EQUIVALENT 54,913 (56,977) (6,277) (2,822)
Effect of foreign exchange rate changes (172) 410 - -
CASH AND CASH EQUIVALENTS AT THE BEGINNING OF THE FINANCIAL YEAR 98,220 154,787 23,055 25,877
CASH AND CASH EQUIVALENTS AT THE END OF THE FINANCIAL YEAR 28 152,961 98,220 16,778 23,055
MSM MalaySia HoldingS BerHad | annual report 2019124
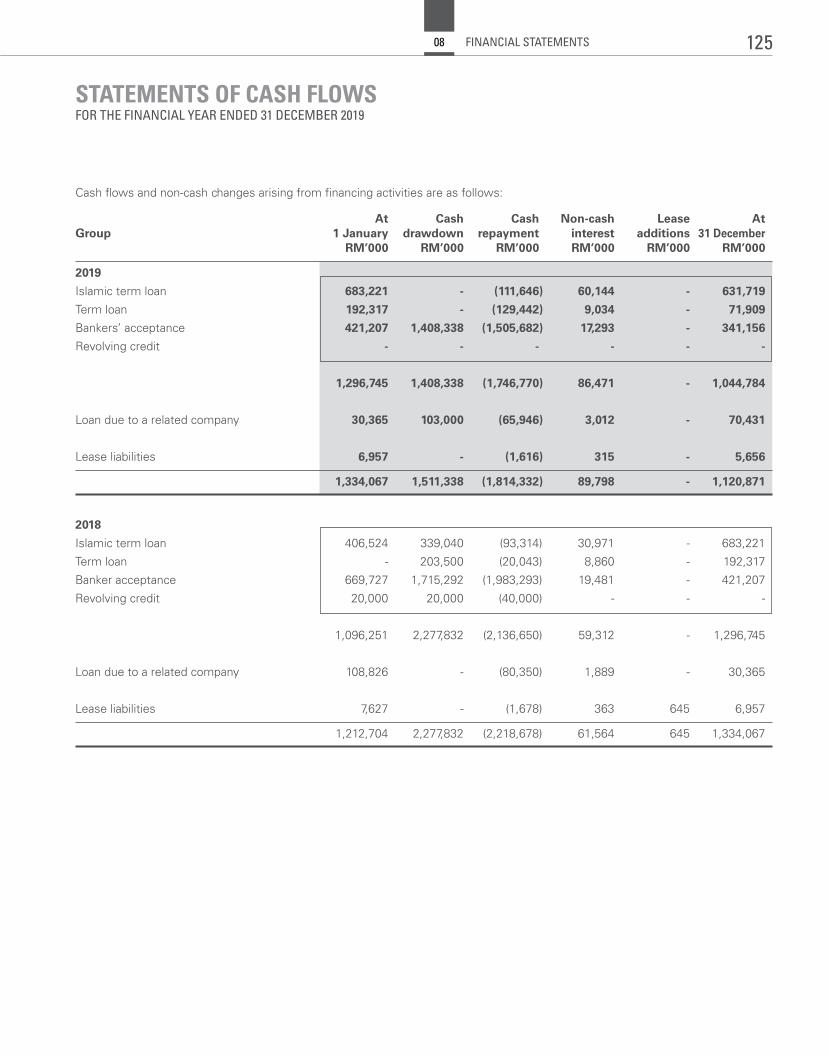
STATEMENTS OF CASH FLOWSFOR THE FINANCIAL YEAR ENDED 31 DECEMBER 2019
Cash flows and non-cash changes arising from financing activities are as follows:
At Cash Cash Non-cash Lease At Group 1 January drawdown repayment interest additions 31 December RM’000 RM’000 RM’000 RM’000 RM’000 RM’000
2019
Islamic term loan 683,221 - (111,646) 60,144 - 631,719
Term loan 192,317 - (129,442) 9,034 - 71,909
Bankers’ acceptance 421,207 1,408,338 (1,505,682) 17,293 - 341,156
Revolving credit - - - - - -
1,296,745 1,408,338 (1,746,770) 86,471 - 1,044,784
Loan due to a related company 30,365 103,000 (65,946) 3,012 - 70,431
Lease liabilities 6,957 - (1,616) 315 - 5,656
1,334,067 1,511,338 (1,814,332) 89,798 - 1,120,871
2018
Islamic term loan 406,524 339,040 (93,314) 30,971 - 683,221
Term loan - 203,500 (20,043) 8,860 - 192,317
Banker acceptance 669,727 1,715,292 (1,983,293) 19,481 - 421,207
Revolving credit 20,000 20,000 (40,000) - - -
1,096,251 2,277,832 (2,136,650) 59,312 - 1,296,745
Loan due to a related company 108,826 - (80,350) 1,889 - 30,365
Lease liabilities 7,627 - (1,678) 363 645 6,957
1,212,704 2,277,832 (2,218,678) 61,564 645 1,334,067
125FINANCIAL STATEMENTS08
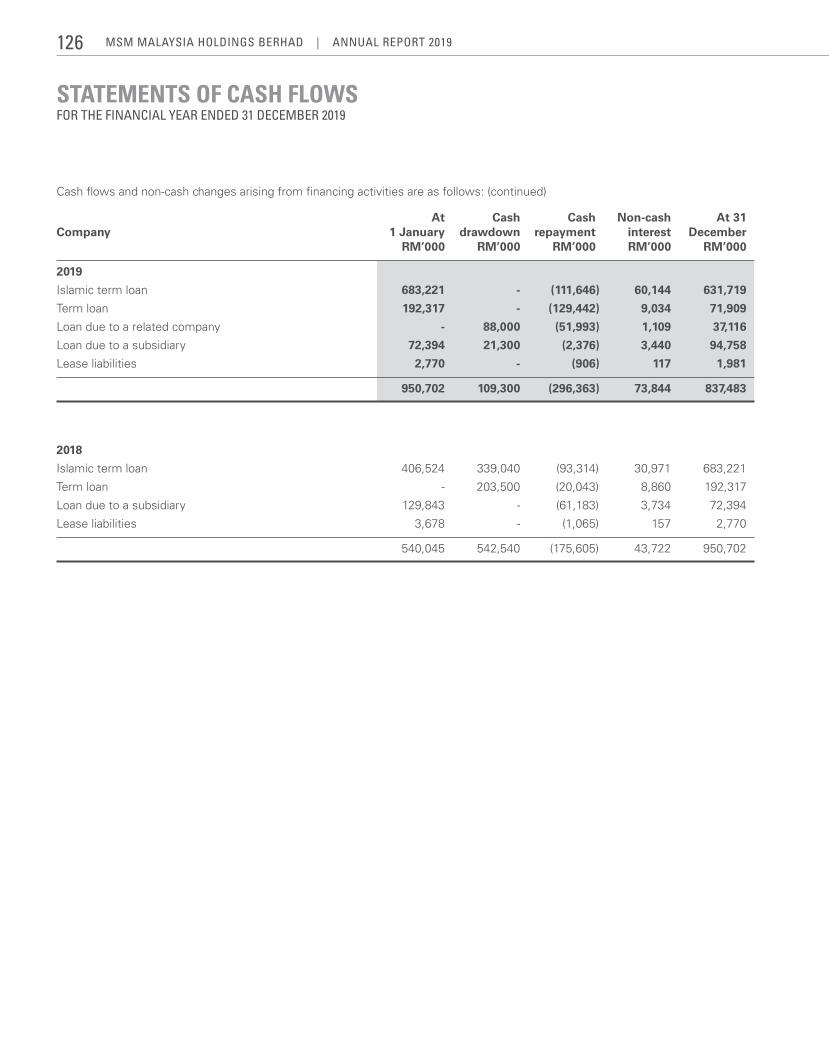
STATEMENTS OF CASH FLOWSFOR THE FINANCIAL YEAR ENDED 31 DECEMBER 2019
Cash flows and non-cash changes arising from financing activities are as follows: (continued)
At Cash Cash Non-cash At 31 Company 1 January drawdown repayment interest December RM’000 RM’000 RM’000 RM’000 RM’000
2019
Islamic term loan 683,221 - (111,646) 60,144 631,719
Term loan 192,317 - (129,442) 9,034 71,909
Loan due to a related company - 88,000 (51,993) 1,109 37,116
Loan due to a subsidiary 72,394 21,300 (2,376) 3,440 94,758
Lease liabilities 2,770 - (906) 117 1,981
950,702 109,300 (296,363) 73,844 837,483
2018
Islamic term loan 406,524 339,040 (93,314) 30,971 683,221
Term loan - 203,500 (20,043) 8,860 192,317
Loan due to a subsidiary 129,843 - (61,183) 3,734 72,394
Lease liabilities 3,678 - (1,065) 157 2,770
540,045 542,540 (175,605) 43,722 950,702
MSM MalaySia HoldingS BerHad | annual report 2019126
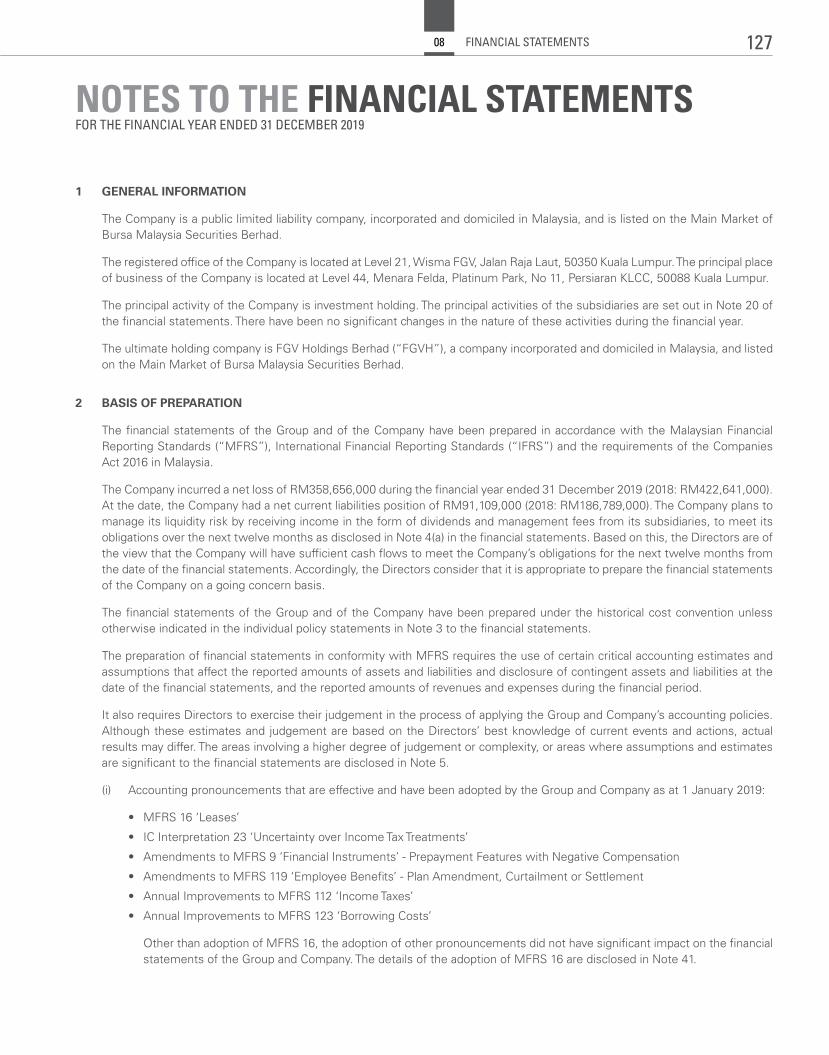
NOTES TO THE FINANCIAL STATEMENTSFOR THE FINANCIAL YEAR ENDED 31 DECEMBER 2019
1 GENERAL INFORMATION
The Company is a public limited liability company, incorporated and domiciled in Malaysia, and is listed on the Main Market of Bursa Malaysia Securities Berhad.
The registered office of the Company is located at Level 21, Wisma FGV, Jalan Raja Laut, 50350 Kuala Lumpur. The principal place of business of the Company is located at Level 44, Menara Felda, Platinum Park, No 11, Persiaran KLCC, 50088 Kuala Lumpur.
The principal activity of the Company is investment holding. The principal activities of the subsidiaries are set out in Note 20 of the financial statements. There have been no significant changes in the nature of these activities during the financial year.
The ultimate holding company is FGV Holdings Berhad (“FGVH”), a company incorporated and domiciled in Malaysia, and listed on the Main Market of Bursa Malaysia Securities Berhad.
2 BASIS OF PREPARATION
The financial statements of the Group and of the Company have been prepared in accordance with the Malaysian Financial Reporting Standards (“MFRS”), International Financial Reporting Standards (“IFRS”) and the requirements of the Companies Act 2016 in Malaysia.
The Company incurred a net loss of RM358,656,000 during the financial year ended 31 December 2019 (2018: RM422,641,000). At the date, the Company had a net current liabilities position of RM91,109,000 (2018: RM186,789,000). The Company plans to manage its liquidity risk by receiving income in the form of dividends and management fees from its subsidiaries, to meet its obligations over the next twelve months as disclosed in Note 4(a) in the financial statements. Based on this, the Directors are of the view that the Company will have sufficient cash flows to meet the Company’s obligations for the next twelve months from the date of the financial statements. Accordingly, the Directors consider that it is appropriate to prepare the financial statements of the Company on a going concern basis.
The financial statements of the Group and of the Company have been prepared under the historical cost convention unless otherwise indicated in the individual policy statements in Note 3 to the financial statements.
The preparation of financial statements in conformity with MFRS requires the use of certain critical accounting estimates and assumptions that affect the reported amounts of assets and liabilities and disclosure of contingent assets and liabilities at the date of the financial statements, and the reported amounts of revenues and expenses during the financial period.
It also requires Directors to exercise their judgement in the process of applying the Group and Company’s accounting policies. Although these estimates and judgement are based on the Directors’ best knowledge of current events and actions, actual results may differ. The areas involving a higher degree of judgement or complexity, or areas where assumptions and estimates are significant to the financial statements are disclosed in Note 5.
(i) Accounting pronouncements that are effective and have been adopted by the Group and Company as at 1 January 2019:
• MFRS16‘Leases’
• ICInterpretation23‘UncertaintyoverIncomeTaxTreatments’
• AmendmentstoMFRS9‘FinancialInstruments’-PrepaymentFeatureswithNegativeCompensation
• AmendmentstoMFRS119‘EmployeeBenefits’-PlanAmendment,CurtailmentorSettlement
• AnnualImprovementstoMFRS112‘IncomeTaxes’
• AnnualImprovementstoMFRS123‘BorrowingCosts’
Other than adoption of MFRS 16, the adoption of other pronouncements did not have significant impact on the financial statements of the Group and Company. The details of the adoption of MFRS 16 are disclosed in Note 41.
127FINANCIAL STATEMENTS08
NOTES TO THE FINANCIAL STATEMENTSFOR THE FINANCIAL YEAR ENDED 31 DECEMBER 2019
2 BASIS OF PREPARATION (CONTINUED)
(ii) Accounting pronouncements that are not yet effective and have not been early adopted by the Group and Company:
Effective for annual periods beginning on or after 1 January 2020 with earlier application permitted
Amendments to existing standards and other accounting pronouncements that are not expected to have any significant impact on the financial statements of the Group and Company:
• TheConceptualFrameworkforFinancialReporting
• Amendments toMFRS101 ‘Presentation of Financial Statements’ andMFRS108 ‘Accounting Policies, Changes inAccounting Estimates and Errors’ - Definition of Material
• AmendmentstoMFRS3‘DefinitionofaBusiness’
3 SIGNIFICANT ACCOUNTING POLICIES
The principal accounting policies applied in the preparation of financial statements are set out below. These policies have been consistently applied to all the financial years presented, unless otherwise stated:
(a) Basis of consolidation and investment in subsidiaries
The consolidated financial statements include the financial statements of the Company and all its subsidiaries made up to the end of financial year. Subsidiaries are all entities (including structured entities) over which the Group has control. The Group controls an entity when the Group is exposed to, or has rights to, variable returns from its involvement with the entity and has the ability to affect those returns through its power over the entity. Subsidiaries are fully consolidated from the date on which control is transferred to the Group. They are deconsolidated from the date that control ceases.
Acquisition accounting
The acquisition method of accounting is used to account for the acquisition of subsidiaries by the Group. The consideration transferred for the acquisition of a subsidiary is the fair values of the assets transferred, the liabilities incurred to the former owners of the acquiree and the equity interests issued by the Group. The consideration transferred includes the fair value of any asset or liability resulting from a contingent consideration arrangement. Acquisition-related costs are expensed as incurred. Identifiable assets acquired and liabilities and contingent liabilities assumed in a business combination are measured initially at their fair values at the acquisition date, irrespective of the extent of the non-controlling interests. The Group recognises any non-current controlling interest in the acquiree on an acquisition-by-acquisition basis, either at fair value or at the non-controlling interest’s proportionate share of the recognised amounts of acquiree’s identifiable net assets. At the end of reporting period, non-controlling interests consists of amount calculated on the date of combinations and its share of changes in the subsidiary’s equity since the date of combination.
If the business combination is achieved in stages, the acquisition date carrying value of the acquirer’s previously held equity interest in the acquiree is re-measured to fair value at the acquisition date through profit or loss.
Any contingent consideration to be transferred by the Group is recognised at fair value at the acquisition date. Subsequent changes to the fair value of the contingent consideration that is deemed to be an asset or liability is recognised in accordance with MFRS 9 in profit or loss. Contingent consideration that is classified as equity is not re-measured, and its subsequent settlement is accounted for within equity.
The excess of the consideration transferred, the amount of any non-controlling interest in the acquiree and the acquisition-date fair value of any previous equity interest in the acquiree over the fair value of the identifiable net assets acquired is recognised as goodwill. If the total of consideration transferred, non-controlling interest recognised and previously held interest measured is less than the fair value of the net assets of the subsidiary acquired in the case of a bargain purchase, the difference is recognised directly in profit or loss (Note 3(d)).
MSM MalaySia HoldingS BerHad | annual report 2019128
NOTES TO THE FINANCIAL STATEMENTSFOR THE FINANCIAL YEAR ENDED 31 DECEMBER 2019
3 SIGNIFICANT ACCOUNTING POLICIES (CONTINUED)
(a) Basis of consolidation and investment in subsidiaries (continued)
Predecessor accounting
Acquisitions of subsidiaries and businesses under common control that meet the conditions of a merger are accounted for using the predecessor basis of accounting.
Under the predecessor basis of accounting, the results of subsidiaries and businesses under common control are presented as if the business combination had been effected throughout the current and previous years. The assets and liabilities combined are accounted for based on the carrying amounts from the perspective of the common control shareholder at the date of transfer. On consolidation, the cost of the business combination is cancelled with the values of the shares received. Any resulting credit or debit difference is classified as reorganisation reserve. Any share premium, capital redemption reserve and any other reserves which are attributable to share capital of the combined entities, to the extent that they have not been capitalised by a debit difference, are reclassified and presented as movement in other capital reserves.
Intercompany transactions, balances and unrealised gains on transactions between group companies are eliminated, unrealised losses are also eliminated unless cost cannot be recovered. Where necessary, adjustments are made to the financial statements of subsidiaries to ensure consistency with the policies adopted by the Group.
Non-controlling interests is the equity in a subsidiary not attributable, directly or indirectly, to a parent. On an acquisition-by-acquisition basis, the Group measures any non-controlling interests in the acquiree at the non-controlling interests’ proportionate share of the acquiree’s identifiable net assets. At the end of reporting period, non-controlling interests consists of amount calculated on the date of combinations and its share of changes in the subsidiary’s equity since the date of combination.
The gain or loss on disposal of a subsidiary is the difference between net disposal proceeds and the Group’s share of its net assets as of the date of disposal including the cumulative amount of any exchange differences or other reserves that relate to the subsidiary and is recognised in profit or loss.
All earnings and losses of the subsidiary are attributed to the parent and the non-controlling interests, even if the attribution of losses to the non-controlling interests results in a debit balance in the non-controlling interests.
In the Company’s financial statements, investments in subsidiaries are shown at cost less accumulated impairment losses.
Where an indication of impairment exists, the carrying amount of the investment is assessed and written down immediately to its recoverable amount (Note 3(f)).
(b) Changes in ownership interests in subsidiaries without change of control
Transactions with non-controlling interests that do not result in loss of control are accounted for as transactions with equity owners of the Group. A change in ownership interest results in an adjustment between the carrying amounts of the controlling and non-controlling interests to reflect their relative interests in the subsidiary. Any difference between the amount of the adjustment to non-controlling interests and any consideration paid or received is recognised in equity attributable to owners of the Group.
129FINANCIAL STATEMENTS08
NOTES TO THE FINANCIAL STATEMENTSFOR THE FINANCIAL YEAR ENDED 31 DECEMBER 2019
3 SIGNIFICANT ACCOUNTING POLICIES (CONTINUED)
(c) Disposal of subsidiaries
When the Group ceases to consolidate because of a loss of control, any retained interest in the entity is remeasured to its fair value with the change in carrying amount recognised in profit or loss. This fair value becomes the initial carrying amount for the purposes of subsequently accounting for the retained interest as an associate, joint venture or financial asset. In addition, any amounts previously recognised in other comprehensive income in respect of that entity are accounted for as if the Group had directly disposed of the related assets or liabilities. This may mean that amounts previously recognised in other comprehensive income are reclassified to profit or loss.
Gains or losses on the disposal of subsidiaries include the carrying amount of goodwill relating to the subsidiaries sold.
(d) Goodwill
Goodwill represents the excess of the cost of acquisition of subsidiaries over the Group’s share of the fair value of their identifiable net assets including contingent liabilities at the date of acquisition. Goodwill on acquisition in respect of a subsidiary is included in the consolidated statement of financial position as intangible assets. Negative goodwill represents the total of consideration transferred, non-controlling interest recognised and previously held interest measured being less than where the fair value of the net assets of the subsidiary acquired in the case of a bargain purchase, the difference is recognised directly in profit or loss.
For the purpose of impairment testing, goodwill acquired in a business combination is allocated to each of the cash generating units (“CGUs”), or groups of CGUs, that is expected to benefit from the synergies of the combination. Each unit or group of units to which the goodwill is allocated represents the lowest level within the entity at which the goodwill is monitored for internal management purposes.
Goodwill impairment reviews are undertaken annually or more frequently if events or changes in circumstances indicate a potential impairment. The carrying value of goodwill is compared to the recoverable amount, which is the higher of value in use and the fair value less costs to sell. Any impairment is recognised immediately as an expense and is not subsequently reversed. See significant accounting policies Note 3(k) on impairment of non-financial assets.
(e) Intangible assets
Intangible assets acquired separately are measured on initial recognition at cost. The cost of intangible assets acquired in a business combination is their fair values as at the date of acquisition. Following initial recognition, intangible assets are carried at cost less any accumulated amortisation and any accumulated impairment losses.
The useful lives of intangible assets are assessed to be either finite or indefinite. Intangible assets with finite lives are amortised on a straight-line basis over the estimated economic useful lives and assessed for impairment whenever there is an indication that the intangible asset may be impaired. If such an indication exists, an asset’s carrying amount is written down immediately to its recoverable amount if the asset’s carrying amount is greater than its estimated recoverable amount. See significant accounting policies Note 3(k) on impairment of non-financial assets.
The amortisation period and the amortisation method for an intangible asset with a finite useful life are reviewed at least at each statement of financial position date.
Intangible assets with indefinite useful lives and intangible assets under development are not amortised but tested for impairment annually or more frequently if the events or changes in circumstances indicate that the carrying value may be impaired either individually or at the cash-generating unit level. The useful life of an intangible asset with an indefinite life is also reviewed annually to determine whether the useful life assessment continues to be supportable.
MSM MalaySia HoldingS BerHad | annual report 2019130
NOTES TO THE FINANCIAL STATEMENTSFOR THE FINANCIAL YEAR ENDED 31 DECEMBER 2019
3 SIGNIFICANT ACCOUNTING POLICIES (CONTINUED)
(e) Intangible assets (continued)
Intangible assets are amortised using the straight line basis over their estimated useful lives as follows:
Intangible assets Estimated useful lives
Brand 25 years
Software 3 - 5 years
Amortisation on intangible assets under development commences when the assets are ready for their intended use.
The nature of the intangible assets are as follows:
(i) Brandisrelatedtoasugarbrand‘Prai’acquiredaspartoftheacquisitionofthesugarbusiness.
(ii) Software relates to information technology (“IT”) used within the Group.
(f) Financial assets
Classification
The Group classifies its financial assets in the following categories:
(i) those to be measured subsequently at fair value (either through profit or loss or other comprehensive income); and
(ii) those to be measured at amortised cost.
The classification depends on the entity’s business model for managing the financial assets and the contractual terms of the cash flows.
For assets measured at fair value, gains and losses will either be recorded in profit or loss or other comprehensive income. For investments in equity instruments that are not held for trading, the Group has made an irrevocable election at the time of initial recognition to account for the equity investment at fair value through other comprehensive income (“FVOCI”).
The Group reclassifies debt investments when and only when its business model for managing those assets changes.
Recognition and derecognition
Regular way purchases and sales of financial assets are recognised on trade-date, the date on which the Group commits to purchase or sell the asset. Financial assets are derecognised when the rights to receive cash flows from the financial assets have expired or have been transferred and the Group has transferred substantially all the risks and rewards of ownership.
131FINANCIAL STATEMENTS08
NOTES TO THE FINANCIAL STATEMENTSFOR THE FINANCIAL YEAR ENDED 31 DECEMBER 2019
3 SIGNIFICANT ACCOUNTING POLICIES (CONTINUED)
(f) Financial assets (continued)
Measurement
At initial recognition, the Group measures a financial asset at its fair value plus, in the case of a financial asset not at fair value through profit or loss (“FVPL”), transaction costs that are directly attributable to the acquisition of the financial asset. Transaction costs of financial assets carried at FVPL are expensed in profit or loss.
Financial assets with embedded derivatives are considered in their entirety when determining whether their cash flows are solely payment of principal and interest.
(a) Debt instruments
Subsequent measurement of debt instruments depends on the Group’s business model for managing the asset and the cash flow characteristics of the asset. There are three measurement categories into which the group classifies its debt instruments:
(i) Amortised cost
Assets that are held for collection of contractual cash flows where those cash flows represent solely payments of principal and interest are measured at amortised cost. Interest income from these financial assets is included in finance income using the effective interest rate method. Any gain or loss arising on derecognition is recognised directly in profit or loss, together with foreign exchange gains and losses. Impairment losses are presented as separate line item in profit or loss.
(ii) FVOCI
Assets that are held for collection of contractual cash flows and for selling the financial assets, where the assets’ cash flows represent solely payments of principal and interest, are measured at FVOCI. Movements in the carrying amount are taken through other comprehensive income, except for the recognition of impairment gains or losses, interest revenue and foreign exchange gains and losses which are recognised in profit or loss. When the financial asset is derecognised, the cumulative gain or loss previously recognised in other comprehensive income is reclassified from equity to profit or loss. Interest income from these financial assets is included in finance income using the effective interest rate method. Foreign exchange gains and losses are recognised in profit or loss and impairment expenses are presented as separate line item in profit or loss.
(iii) FVPL
Assets that do not meet the criteria for amortised cost or FVOCI are measured at FVPL. A gain or loss on a debt investment that is subsequently measured at FVPL is recognised in profit or loss and presented net within other gains/(losses) in the period in which it arises.
(b) Equity instruments
The Group subsequently measures all equity investments at fair value. Where the Group’s management has elected to present fair value gains and losses on equity investments in other comprehensive income, there is no subsequent reclassification of fair value gains and losses to profit or loss following the derecognition of the investment. Dividends from such investments continue to be recognised in profit or loss as other income when the Group’s right to receive payments is established.
Changes in the fair value of financial assets at FVPL are recognised in other gains/(losses) in profit or loss as applicable. Impairment losses (and reversal of impairment losses) on equity investments measured at FVOCI are not reported separately from other changes in fair value.
MSM MalaySia HoldingS BerHad | annual report 2019132
NOTES TO THE FINANCIAL STATEMENTSFOR THE FINANCIAL YEAR ENDED 31 DECEMBER 2019
3 SIGNIFICANT ACCOUNTING POLICIES (CONTINUED)
(f) Financial assets (continued)
Impairment
(a) Impairment for debt instruments
The Group and Company assess on a forward-looking basis the expected credit loss (“ECL”) associated with its debt instruments carried at amortised cost and at FVOCI. The impairment methodology applied depends on whether there has been a significant increase in credit risk.
The Group and Company’s financial instruments that are subject to the ECL model are as follows:
• Receivables(excludingadvancepayments,prepaymentsandGSTreceivables)
• Leasereceivable
• Loansandamountsduefromsubsidiaries/otherrelatedcompanies/ultimateholdingcompany
• Financialassetsatfairvaluethroughothercomprehensiveincome
While cash and cash equivalents are also subject to the impairment requirements of MFRS 9, the identified impairment loss was immaterial.
ECL represent a probability-weighted estimate of the difference between present value of cash flows according to contract and present value of cash flows the Group and the Company expect to receive, over the remaining life of the financial instrument.
The measurement of ECL reflects:
• anunbiasedandprobability-weightedamountthatisdeterminedbyevaluatingarangeofpossibleoutcomes;
• thetimevalueofmoney;and
• reasonableandsupportableinformationthatisavailablewithoutunduecostoreffortatthereportingdateaboutpast events, current conditions and forecasts of future economic conditions.
(i) General 3-stage approach for other receivables, loans and amount due from subsidiaries and related companies that are non-trade related
At each reporting date, the Group and Company measure ECL through loss allowance at an amount equal to 12 months ECL if credit risk on a financial instrument or a group of financial instruments has not increased significantly since initial recognition. For all other financial instruments, a loss allowance at an amount equal to lifetime ECL is required.
The Company applies MFRS 9 general 3 stage approach to measure ECL which uses a lifetime expected loss allowance for lease receivables carried at amortised cost. The ECL rates is based on the probability of recovery of the receivable within one year or more than a year. Based on management assessment, there is no additional loss allowance identified for lease receivables.
The measurement details of ECL are disclosed in the relevant notes to the financial assets.
(ii) Simplified approach for trade receivables and amounts due from subsidiaries and related companies that are trade related
The Group and Company apply the MFRS 9 simplified approach to measure ECL which uses a lifetime ECL for all trade receivables and amounts due from subsidiaries and related companies that are trade related.
The measurement details of ECL are disclosed in the relevant notes to the financial assets.
133FINANCIAL STATEMENTS08
NOTES TO THE FINANCIAL STATEMENTSFOR THE FINANCIAL YEAR ENDED 31 DECEMBER 2019
3 SIGNIFICANT ACCOUNTING POLICIES (CONTINUED)
(f) Financial assets (continued)
Impairment (continued)
(b) Significant increase in credit risk
The Group considers the probability of default upon initial recognition of asset and whether there has been a significant increase in credit risk on an ongoing basis throughout each reporting period. To assess whether there is a significant increase in credit risk, the Group compares the risk of a default occurring on the asset as at the reporting date with the risk of default as at the date of initial recognition. It considers available reasonable and supportable forward-looking information.
The following indicators are incorporated:
• Externalcreditrating(asfarasavailable).
• Actualorexpectedsignificantadversechangesinbusiness,financialoreconomicconditionsthatareexpectedtocause a significant change to the debtor’s ability to meet its obligations.
• Actualorexpectedsignificantchangesintheoperatingresultsofthedebtor.
• Significantincreasesincreditriskonotherfinancialinstrumentsofthesamedebtor.
• Significantchangesinthevalueofthecollateralsupportingtheobligationorinthequalityofthird-partyguaranteesor credit enhancements.
• Significantchangesintheexpectedperformanceandbehaviourofthedebtor,includingchangesinthepaymentstatus of debtor in the group and changes in the operating results of the debtor.
Macroeconomic information (such as market interest rates or growth rates) is incorporated as part of the internal rating model as applicable.
Regardless of the analysis above, a significant increase in credit risk is presumed if a debtor is more than 30 days past due in making a contractual payment.
(c) Definition of default and credit-impaired financial assets
The Group defines a financial instrument as default, which is fully aligned with the definition of credit-impaired, when it meets one or more of the following criteria:
Quantitative criteria:
The Group defines a financial instrument as default, when the counterparty fails to make contractual payment within 180 days of when they fall due.
Qualitative criteria:
The debtor meets unlikeliness to pay criteria, which indicates the debtor is in significant financial difficulty. The Group considers the following instances:
• thedebtorisinbreachoffinancialcovenants.
• concessionshavebeenmadebythelenderrelatingtothedebtor’sfinancialdifficulty.
• itisbecomingprobablethatthedebtorwillenterbankruptcyorotherfinancialreorganisation.
• thedebtorisinsolvent.
Financial instruments that are credit-impaired are assessed on individual basis.
MSM MalaySia HoldingS BerHad | annual report 2019134
NOTES TO THE FINANCIAL STATEMENTSFOR THE FINANCIAL YEAR ENDED 31 DECEMBER 2019
3 SIGNIFICANT ACCOUNTING POLICIES (CONTINUED)
(f) Financial assets (continued)
Impairment (continued)
(d) Groupings of instruments for ECL measurement
(i) Collective assessment
To measure ECL, trade receivables and contract assets arising from the Group have been grouped based on the days past due and shared credit risk characteristics as follows:
(i) Geographical region of customers
(ii) Customer division
(iii) Related company and external customers
(iv) Other shared credit risks
The contract assets relate to amounts due from customers on contracts and unbilled work in progress and have substantially the same risk characteristics as the trade receivables for the same types of contracts. The Group has therefore concluded that the expected loss rates for trade receivables are a reasonable approximation of the loss rates for the contract assets.
(ii) Individual assessment
Trade receivables which are in default or credit-impaired are assessed individually.
Other receivables, loans and amount due from intercompany, are assessed on individual basis for ECL measurement, as credit risk information is obtained and monitored separately.
(e) Write-off
(i) Trade receivables
Trade receivables are written off when there is no reasonable expectation of recovery. Indicators that there is no reasonable expectation of recovery include, amongst others, the failure of a debtor to engage in a repayment plan with the Group.
Impairment losses on trade receivables are presented as net impairment losses on the face of profit or loss. Subsequent recoveries of amounts previously written off are credited against the same line item.
(ii) Other debt instruments
The Group writes off financial assets, in whole or in part, when it has exhausted all practical recovery efforts and has concluded there is no reasonable expectation of recovery. The assessment of no reasonable expectation of recovery is based on unavailability of debtor’s sources of income or assets to generate sufficient future cash flows to repay the amount. The Group may write-off financial assets that are still subject to enforcement activity. Subsequent recoveries of amounts previously written off will result in impairment gains.
(f) Subsidiaries
An impairment loss is recognised for the amount by which the carrying amount of the subsidiary, joint venture or associate exceeds its recoverable amount. The recoverable amount is higher of an asset’s fair value less costs of disposal and value-in-use. Any subsequent increase in recoverable amount is recognised in profit or loss.
135FINANCIAL STATEMENTS08
NOTES TO THE FINANCIAL STATEMENTSFOR THE FINANCIAL YEAR ENDED 31 DECEMBER 2019
3 SIGNIFICANT ACCOUNTING POLICIES (CONTINUED)
(g) Financial liabilities
Financial liabilities are recognised on the statement of financial position when, and only when, the Group becomes a party to the contractual provisions of the financial instrument.
Financial liabilities are recognised initially at fair value, plus, in the case of financial liabilities other than derivatives, directly attributable transactions costs.
Subsequent to initial recognition, all financial liabilities are measured at amortised cost using the effective interest method except for derivatives in a loss position, if any, which are measured through profit or loss.
For financial liabilities other than derivatives, gains and losses are recognised in profit or loss when the liabilities are derecognised, and through the amortisation process.
Gains or losses arising from changes in fair value of derivatives are recognised in profit or loss within other gain/losses, net. Net gains or losses on derivatives include exchange differences.
Borrowings are classified as current liabilities unless the Group has an unconditional right to defer settlement of the liability for at least 12 months after the statement of financial position date.
Borrowing costs directly attributable to the acquisition, construction or production of qualifying assets, which are assets that necessarily take a substantial period of time to get ready for their intended use or sale, are added to the cost of those assets, until such time as the assets are substantially ready for their intended use or sale.
Foreign exchange differences are capitalised to the extent of the capitalisation of the related borrowing costs.
All other borrowing costs are recognised in profit or loss in the period in which they are incurred.
Fees paid on the establishment of loan facilities are recognised as transaction costs of the loan to the extent that it is probable that some or all of the facility will be drawn down. In this case, the fee is deferred until the draw-down occurs. To the extent there is no evidence that it is probable that some or all of the facility will be drawn down, the fee is capitalised as a pre-payment for liquidity services and amortised over the period of the facility to which it relates.
A financial liability is derecognised when the obligation under the liability is extinguished. When an existing financial liability is replaced by another from the same lender on substantially difference terms, or the terms of an existing liability are substantially modified, such an exchange or modification is treated as derecognition of the original liability and the recognition of a new liability, and the difference in the respective carrying amounts is recognised in profit or loss.
(h) Offsetting financial instruments
Financial assets and liabilities are offset and the net amount presented in the statement of financial position when there is a legally enforceable right to offset the recognised amounts and there is an intention to settle on a net basis, or realise the asset and settle the liability simultaneously. The legally enforceable right must not be contingent on future events and must be enforceable in the normal course of business and in the event of default, insolvency or bankruptcy.
(i) Property, plant and equipment
Property, plant and equipment are initially stated at cost. All property, plant and equipment are stated at cost less accumulated depreciation and impairment losses. The cost of an item of property, plant and equipment initially recognised includes its purchase price and any cost that is directly attributable to bringing the asset to the location and condition necessary for it to be capable of operating in the manner intended by management. Cost also includes borrowing costs that are directly attributable to the acquisition, construction or production of a qualifying asset.
See significant accounting policies Note 3(h) on borrowing costs. To the extent a legal or constructive obligation to a third party exists, the acquisition cost includes estimated cost of dismantling and removing the assets are restoring the site.
MSM MalaySia HoldingS BerHad | annual report 2019136
NOTES TO THE FINANCIAL STATEMENTSFOR THE FINANCIAL YEAR ENDED 31 DECEMBER 2019
3 SIGNIFICANT ACCOUNTING POLICIES (CONTINUED)
(i) Property, plant and equipment (continued)
Subsequent costs are included in the asset’s carrying amount or recognised as a separate asset, as appropriate, only when it is probable that future economic benefits associated with the item will flow to the Group and the cost of the item can be measured reliably. The carrying amount of the replaced part is derecognised. All other repairs and maintenance are charged to profit or loss during the financial period in which they are incurred.
Major spare parts, stand-by equipment and servicing equipment are classified as property, plant and equipment rather than inventory when they are expected to be used during more than one period.
A bearer plant is a living plant that is used in the production or supply of agricultural produce, is expected to bear produce for more than one period and has a remote likelihood of being sold as agricultural produce, except for incidental scrap sales. The bearer plants of the Group are oil palms, rubber trees and mango trees. Immature bearer plants are measured at accumulated costs of planting of bearer plants, similar to accounting for a self-constructed item of property, plant and equipment. Bearer plants are classified as immature until the trees are available for harvest.
At that point, bearer plants are measured at amortised cost and depreciated over their useful life which is estimated to be 20 to 25 years.
Freehold land is not depreciated as it has an infinite useful life and assets under construction are not depreciated until when the assets are ready for their intended use.
All property, plant and equipment are depreciated on a straight line basis to write off the cost of each asset to their residual values over their estimated useful lives as follows:
Principal annual rates used are summarised as follows:
Property, plant and equipment Estimated useful lives
Buildings 20 - 25 years
Plant and machinery 3 - 20 years
Furniture, fittings, equipment and motor vehicles 3 - 11 years
Bearer plants
- Oil palms 22 years, or the lease term if shorter
- Rubber trees 20 years, or the lease term if shorter
- Mango trees 25 years, or the lease term if shorter
The assets’ residual values and useful lives are reviewed, and adjusted if appropriate, at each statement of financial position date. The effects of any revision of the residual values and useful lives are included in profit or loss for the financial year in which the changes arise.
Depreciation on property, plant and equipment ceases at the earlier of derecognition and classification as held for sale. Depreciation on assets under construction commences when the assets are ready for their intended use.
Gains and losses on disposals are determined by comparing proceeds with carrying amount and are included in “other operating income” in profit or loss.
At each statement of financial position date, the Group assess whether there is any indication of impairment. If such an indication exists, an analysis is performed to assess whether the carrying amount of the asset is fully recoverable. An asset’s carrying amount is written down immediately to its recoverable amount if the asset’s carrying amount is greater than its estimated recoverable amount. See significant accounting policies Note 3(k) on impairment of non-financial assets.
137FINANCIAL STATEMENTS08
NOTES TO THE FINANCIAL STATEMENTSFOR THE FINANCIAL YEAR ENDED 31 DECEMBER 2019
3 SIGNIFICANT ACCOUNTING POLICIES (CONTINUED)
(j) Inventories
Inventories which consist of raw materials, work-in-progress, finished goods, molasses and consumables are stated at lower of cost and net realisable value.
Cost is determined on the weighted average cost basis. Raw material cost comprises the landed cost of goods purchased and in the case of work-in-progress and finished goods, includes materials, direct labour, other direct charges and an appropriate proportion of factory overheads. Consumables comprise the actual purchase costs.
Net realisable value is the estimated selling price in the ordinary course of business, less selling and distribution costs and all other estimated cost to completion.
(k) Impairment of non-financial assets
Assets that have an indefinite useful life for example goodwill or intangible asset not ready to use, are not subject to amortisation and are tested annually for impairment, or when events or circumstances occur indicating that impairment may exist. Property, plant and equipment and other non-current non-financial assets, including intangible assets with definite useful lives, are reviewed for impairment whenever events or changes in circumstances indicate that the carrying amount may not be recoverable. An impairment loss is recognised for the amount by which the asset’s carrying amount exceeds its recoverable amount.
The impairment loss is charged to profit or loss. The recoverable amount is the higher of an asset’s fair value less costs to sell and value in use. For the purposes of assessing impairment, assets are grouped at the lowest levels for which there are separately identifiable cash flows (cash generating units). Impaired assets, except goodwill, are reviewed for possible reversal of impairment at each reporting date and is recognised in profit or loss.
The reversal is recognised to the extent of the carrying amount of the asset that would have been determined (net of amortisation and depreciation) had no impairment loss been recognised.
(l) Current and deferred income taxes
Tax expenses for the year comprises current and deferred tax. Tax is recognised in profit or loss, except to the extent that it relates to items recognised in other comprehensive income or directly in equity. In this case, the tax is also recognised in other comprehensive income or directly in equity, respectively.
Current and deferred tax is measured using the tax rates that have been enacted or substantively enacted at the statement of financial position date in the countries where the Group’s subsidiaries operate generate taxable income.
Deferred tax is provided for on temporary differences arising between the tax bases of assets and liabilities and their carrying amounts in the financial statements. Deferred tax assets are recognised to the extent that it is probable that future taxable profit will be available against which the deductible temporary differences and unused tax losses can be utilised.
Deferred tax is not accounted for if it arises from initial recognition of an asset or liability in a transaction other than a business combination that at the time of the transaction affects neither accounting nor taxable profit or loss.
Deferred income tax is provided on temporary differences arising on investments in subsidiaries, except for deferred income tax liability where the timing of the reversal of the temporary difference is controlled by the Group and it is probable that the temporary difference will not reverse in the foreseeable future.
Deferred and income tax assets and liabilities are offset when there is a legally enforceable right to offset current tax assets against current tax liabilities and when the deferred income tax assets and liabilities relate to taxes levied by the same taxation authority on either the taxable entity or different taxable entities where there is an intention to settle the balances on a net basis.
MSM MalaySia HoldingS BerHad | annual report 2019138
NOTES TO THE FINANCIAL STATEMENTSFOR THE FINANCIAL YEAR ENDED 31 DECEMBER 2019
3 SIGNIFICANT ACCOUNTING POLICIES (CONTINUED)
(m) Zakat
The Group recognises its obligations towards the payment of zakat on business. Zakat for the current period is recognised as and when the Group has a current zakat obligation as a result of zakat assessment. The amount of zakat expense shall be assessed when a company within the Group has been in operation for at least 12 months, i.e. for the period known as “haul (eligible period)”.
Zakat expense is determined based on the Group’s financial results for the year. The amount of zakat paid is recognised as an expense in the financial year in which it is incurred.
(n) Foreign currencies
Functional and presentation currency
Items included in the financial statements of the each of the Group’s entities are measured using the currency of the primary economic environment in which the entity operates (“the functional currency”). The financial statements are presented in Ringgit Malaysia (“RM”), which is the Group and Company’s functional and presentation currency.
Transactions and balances
Foreign currency transactions are translated into the functional currency using the exchange rates prevailing at the dates of the transactions or valuation where items are remeasured. Foreign exchange gains and losses resulting from the settlement of such transactions and from the translation at year-end exchange rates of monetary assets and liabilities denominated in foreign currencies are recognised in profit or loss, except when deferred in equity as qualifying cash flow hedges and qualifying net investment hedges.
Foreign exchange gains and losses that relate to borrowings and cash and cash equivalents are presented in profit or loss. Foreign exchange gains and losses related to foreign currency forward contracts are presented in profit or loss within “other (losses)/gains – net”.
Group companies
The results and financial position of all Group entities (none of which has the currency of a hyperinflationary economy) that have a functional currency different from the presentation currency are translated into the presentation currency as follows:
(i) assets and liabilities for each statement of financial position presented are translated at the closing rate at the date of that statement of financial position;
(ii) income and expenses for each statement of comprehensive income are translated at average rate (unless this average is not reasonable approximation of the cumulative effect of the rates prevailing on the transaction dates, in which case income and expenses are translated at the dates of the transactions); and
(iii) all resulting exchange differences are recognised in the foreign exchange reserve as a separate component of equity.
Goodwill and fair value adjustments arising on the acquisition of a foreign entity are treated as assets and liabilities of the foreign entities and translated at closing rate. Exchange differences arising are recognised in other comprehensive income.
On consolidation, exchange differences arising from the translation of the net investment in foreign entities and long-term advances are taken to the foreign exchange reserve within equity. When a foreign operation is sold, such exchange differences are recognised in profit or loss as part of the gain or loss on disposal.
139FINANCIAL STATEMENTS08
NOTES TO THE FINANCIAL STATEMENTSFOR THE FINANCIAL YEAR ENDED 31 DECEMBER 2019
3 SIGNIFICANT ACCOUNTING POLICIES (CONTINUED)
(o) Revenue recognition
(i) Revenue from contracts with customers
• Sales of goods
The Group’s revenue which represents income arising in the course of the Group’s and the Company’s ordinary activities is recognised by reference to each distinct performance obligation promised in the contract with customer when or as the Group and the Company transfer the control of the goods and services promised in a contract and the customer obtains control of the goods or services. Depending on the substance of the respective contract with customer, the control of the promised goods or services may transfer over time or at point in time.
A contract with customer exists when the contract has commercial substance, the Group, the Company and their customers have approved the contract and intend to perform their respective obligations, the Group’s, the Company’s and the customer’s rights regarding the goods or services to be transferred and the payment terms can be identified, and it is probable that the Group and the Company will collect the consideration to which it will be entitled to in exchange of those goods or services.
Revenue from contracts with customers is measured at its transaction price, being the amount of consideration which the Group expects to be entitled in exchange for transferring promised goods or services to a customer, excluding amounts collected on behalf of third parties such as sales and service taxes or goods and service tax. If the amount of consideration varies due to discounts, rebates, penalties or other similar items, the Group and the Company estimate the amount of consideration that it expects to be entitled based on the expected value method or the most likely outcome but the estimation is constrained up to the amount that is highly probable of no significant reversal in the future. Transaction price is allocated to each performance obligation on the basis of the relative standalone selling prices of each distinct good or service promised in the contract.
The Group sells refined sugar, liquid sugar, sugar premix, raw sugar and molasses in connection to the sugar operation. In addition, the Group also sells rubber, palm oil and mango through its plantation segment.
Revenue from sales of goods from the sugar operation and plantation are recognised net of discount and taxes at the point in time when control of the goods has transferred to the customer. Depending on the terms of the contract with the customer, control transfers either upon delivery or shipment of goods to the specific location agreed with the customer, the risks of obsolescence and loss have been transferred to the customer, and either the customer has accepted the goods in accordance with the sales contract, the acceptance provisions have lapsed, or the Group has objective evidence that all criteria for acceptance have been satisfied.
• Sales with a right of return
When the customer has a right to return the goods within a given period, the Group is obliged to refund the purchase price. Revenue is adjusted for the expected value of the returns and cost of sales are adjusted for the value of the corresponding goods expected to be returned.
A refund liability for the expected refunds to customers is recognised as adjustment to revenue and correspondingly in trade and other payables. At the same time, the Group has a right to recover the goods from the customer where the customer exercises his right of return and recognises a refund asset and a corresponding adjustment to cost of sales the refund asset is measured by reference to the former carrying amount of the product.
Accumulated experience is used to estimate such returns at the time of sale at a portfolio level using the expected value method. Because the number of goods returned has been steady for years, management assessed that it is highly probable that a significant reversal in the cumulative revenue recognised will not occur. The validity of this assumption and the estimated amount of returns are reassessed at each reporting date.
MSM MalaySia HoldingS BerHad | annual report 2019140

NOTES TO THE FINANCIAL STATEMENTSFOR THE FINANCIAL YEAR ENDED 31 DECEMBER 2019
3 SIGNIFICANT ACCOUNTING POLICIES (CONTINUED)
(o) Revenue recognition (continued)
(i) Revenue from contracts with customers (continued)
• Revenue from rendering services
Revenue from rendering services including management fees are recognised when the services are performed by reference to completion of the specific services.
Transportation services performed after the transfer of control of sales of goods from the sugar operation to customers are regarded as a separate performance obligation and recognised over time depending on the terms of the contract.
• Receivables, contract asset and contract liabilities
A receivable is recognised when the goods are delivered or services are rendered as this is the point in time that the consideration is unconditional because only the passage of time is required before the payment is due.
• Contract cost
During the previous financial year, the Group has elected the practical expedient to recognise incremental contract cost of obtaining contract with period of less than one year as an expense when incurred.
(ii) Revenue from other sources
Specific revenue recognition criteria for other revenue and income earned by the Company are as follows:
(a) Rental income - recognised on a straight-line basis over the lease terms.
(b) Finance income - recognised using effective interest method.
Finance income is calculated by applying the effective interest rate to the gross carrying amount of a financial asset except for financial assets that subsequently become credit-impaired. For credit-impaired financial assets the effective interest rate is applied to the net carrying amount of the financial asset (after deduction of the loss allowance).
(c) Dividend income
Dividend income from investments are recognised in profit or loss when the right to receive payment is established. This applies even if they are paid out of pre-acquisition profits.
Dividends that clearly represents a recovery of part of the cost of an investment is recognised in other comprehensive income if it relates to an investment in equity instruments measured at FVOCI.
(p) Dividend distribution
Dividends on ordinary shares are recognised as liabilities when proposed or declared before the statement of financial position date. A dividend proposed or declared after the statement of financial position date, but before the financial statements are authorised for issue, is not recognised as a liability at the reporting date.
141FINANCIAL STATEMENTS08
NOTES TO THE FINANCIAL STATEMENTSFOR THE FINANCIAL YEAR ENDED 31 DECEMBER 2019
3 SIGNIFICANT ACCOUNTING POLICIES (CONTINUED)
(q) Cash and cash equivalents
For the purpose of the statement of cash flows, cash equivalents are held for the purpose of meeting short-term cash commitments rather than for investment or other purposes. Cash and cash equivalents comprise cash on hand, deposits held at call with financial institutions, other short term, highly liquid investments with original maturities of 3 months or less that are readily convertible to known amounts of cash and which are subject to an insignificant risk of changes in value.
(r) Leases
The Group and Company as a lessee
Leases are recognised as a right-of-use (“ROU”) asset and a corresponding liability at the date at which the leased asset is available for use by the Group and Company.
(a) ROU assets
ROU assets are measured at cost comprising the following:
• theamountoftheinitialmeasurementofleaseliability;
• anyleasepaymentsmadeatorbeforethecommencementdatelessanyleaseincentivesreceived;
• anyinitialdirectcosts;and
• decommissioningorrestorationcosts.
The ROU asset is depreciated over the shorter of the right-of-use asset’s useful life and the lease term on a straight-line basis, as follows:
ROU assets Estimated useful lives
Leasehold land 66 to 99 years
Buildings 3 to 60 years
The ROU assets are adjusted for certain remeasurement of the lease liability.
At each statement of financial position date, the Group assess whether there is any indication of impairment. If such an indication exists, an analysis is performed to assess whether the carrying amount of the asset is fully recoverable. An asset’s carrying amount is written down immediately to its recoverable amount if the asset’s carrying amount is greater than its estimated recoverable amount. See significant accounting policies Note 3(k) on impairment of non-financial assets.
(b) Lease liabilities
Lease liabilities are initially measured at the present value of the lease payments that are not paid at that date. The lease payments include the following:
• Fixedpayments(includingin-substancefixedpayments),lessanyleaseincentivereceivable;
• Variableleasepaymentsthatarebasedonanindexorarate,initiallymeasuredusingtheindexorrateasatthecommencement date, if any;
• AmountsexpectedtobepayablebytheGroupunderresidualvalueguarantees;
• Theexercisepriceofapurchaseandextensionoptionsifthegroupisreasonablycertaintoexercisethatoption,ifany; and
• Paymentsofpenaltiesforterminatingthelease,iftheleasetermreflectstheGroupexercisingthatoption,ifany.
MSM MalaySia HoldingS BerHad | annual report 2019142
NOTES TO THE FINANCIAL STATEMENTSFOR THE FINANCIAL YEAR ENDED 31 DECEMBER 2019
3 SIGNIFICANT ACCOUNTING POLICIES (CONTINUED)
(r) Leases (continued)
The Group and Company as a lessee (continued)
(b) Lease liabilities (continued)
Lease payments are discounted using the interest rate implicit in the lease. If that rate cannot be readily determined, which is generally the case for leases in the Group, the lessee’s incremental borrowing is used. This is the rate that the individual lessee would have to pay to borrow the funds necessary to obtain an asset of similar value to the ROU in a similar economic environment with similar term, security and conditions.
Lease payments are allocated between the liability and finance cost. The finance cost is charged to profit or loss over the lease period so as to produce a constant periodic rate of interest on the remaining balance of the liability for each period.
Variable lease payments that depend on sales are recognised in profit or loss in the period in which the condition that triggers those payments occurs.
The Group presents the lease liabilities as a separate line item in the statement of financial position. Interest expense on the lease liability is presented within the finance cost in the statement of profit or loss.
(c) Lease term
In determining the lease term, the Group considers all facts and circumstances that create an economic incentive to exercise an extension option, or not exercise a termination option. Extension options (or periods after termination options) are only included in the lease term if the lease is reasonably certain to be extended (or not terminated).
The Group reassesses the lease term upon the occurrence of a significant event or change in circumstances that is within the control of the Group and affects whether the Group is reasonably certain to exercise an option not previously included in the determination of lease term, or not to exercise an option previously included in the determination of lease term. A revision in lease term results in remeasurement of the lease liabilities (refer to (d) below).
(d) Reassessment of lease liabilities
The Group initially estimates and recognises amounts expected to be payable under residual value guarantees as part of the lease liability. The amounts are reviewed, and adjusted if appropriate, at the end of each reporting period.
(e) Short-term leases and leases of low value assets
Short-term leases are leases with a lease term of 12 months or less, which cost less than RM20,000 each if purchased new. Payments associated with short-term leases and leases of low-value assets are recognised on a straight-line basis as an expense in profit or loss.
The Group and Company do not separate any non-lease components from lease components, and instead account for each lease component and any associated non-lease components as a single lease component.
143FINANCIAL STATEMENTS08
NOTES TO THE FINANCIAL STATEMENTSFOR THE FINANCIAL YEAR ENDED 31 DECEMBER 2019
3 SIGNIFICANT ACCOUNTING POLICIES (CONTINUED)
(r) Leases (continued)
The Group and Company as a lessor
As a lessor, the Company determines at lease inception whether each lease is a finance lease or an operating lease. To classify each lease, the Company makes an overall assessment of whether the lease transfers substantially all of the risks and rewards incidental to ownership of the underlying asset to the lessee. As part of this assessment, the Company considers certain indicators such as whether the lease is for the major part of the economic life of the asset.
(a) Finance leases
The Company classifies a lease as a finance lease if the lease transfers substantially all the risks and rewards incidental to ownership of an underlying asset to the lessee.
The Company derecognises the underlying asset and recognises a receivable at an amount equal to the net investment in a finance lease. Net investment in a finance lease is measured at an amount equal to the sum of the present value of lease payments from lessee and the unguaranteed residual value of the underlying asset. Initial direct costs are also included in the initial measurement of the net investment. The net investments is subject to MFRS 9 impairment. In addition, the Company reviews regularly the estimated unguaranteed residual value.
Lease income is recognised over the term of the lease using the net investment method so as to reflect a constant periodic rate of return. The Company revises the lease income allocation if there is a reduction in the estimated unguaranteed residual value.
(b) Sublease classification
When the Company is an intermediate lessor, it assesses the lease classification of a sublease with reference to the ROU asset arising from the head lease, not with reference to the underlying asset. If a head lease is short-term lease, then it classifies the sublease as an operating lease.
(s) Employee benefits
(i) Short-term employee benefits
Wages, salaries, bonuses and social security contributions are recognised as expenses in the year in which the associated services are rendered by employees. Short term accumulating compensated absences such as paid annual leave are recognised when services are rendered by employees that increase their entitlement to future compensated absences. Short term non-accumulating compensated absences such as sick leave are recognised when the absences occur.
(ii) Defined contribution plan
Defined contribution plans are post-employment benefit plans under which the Group pays fixed contributions into separate entities or funds and will have no legal or constructive obligation to pay further contributions if any of the funds do not hold sufficient assets to pay all employee benefits relating to employee services in the current and preceding financial years. Such contributions are recognised as an expense in profit or loss as incurred.
(iii) Termination benefits
The Group pays termination benefits in cases of termination of employment within the framework of the restructuring. Termination benefits are recognised as a liability and an expense when the Group has a detailed formal plan for the termination and is without realistic possibility of withdrawal.
MSM MalaySia HoldingS BerHad | annual report 2019144
NOTES TO THE FINANCIAL STATEMENTSFOR THE FINANCIAL YEAR ENDED 31 DECEMBER 2019
3 SIGNIFICANT ACCOUNTING POLICIES (CONTINUED)
(t) Equity instruments
Ordinary shares are classified as equity.
The transaction costs of an equity transaction are accounted for as a deduction from equity, net of tax. Equity transaction costs comprise only those incremental external costs directly attributable to the equity transaction which would otherwise have been avoided.
(u) Contingent liabilities
The Group does not recognise a contingent liability but discloses its existence in the financial statements. A contingent liability is a possible obligation that arises from past events whose existence will be confirmed by the occurrence and non-occurrence of one or more uncertain future events beyond the control of the Group or a present obligation that is not recognised because it is not probable that an outflow of resources will be required to settle the obligation. A contingent liability also arises in the extremely rare case where there is a liability that cannot be recognised because it cannot be measured reliably. However contingent liabilities do not include financial guarantee contracts.
(v) Segment reporting
Segment information is presented in a manner that is consistent with the internal reporting provided to the chief operating decision-maker. The chief operating decision-maker, who is responsible for allocating resources and assessing performance of the operating segments, has been identified as the Group Chief Executive Officer.
(w) Provisions
Provisions are recognised when:
• theGrouphasapresentlegalorconstructiveobligationasaresultofpastevents;
• itisprobablethatanoutflowofresourceswillberequiredtosettletheobligation;and
• areliableestimateoftheamountcanbemade.
Where the Group expects a provision to be reimbursed (for example, under an insurance contract), the reimbursement is recognised as a separate asset but only when the reimbursement is virtually certain. Provisions are not recognised for future operating losses.
Where there are a number of similar obligations, the likelihood that an outflow will be required in settlement is determined by considering the class of obligations as a whole. A provision is recognised even if the likelihood of an outflow with respect to any one item included in the same class of obligations may be small.
Provisions are measured at the present value of the expenditures expected to be required to settle the obligation using pre-tax rate that reflects current market assessments of the time value of money and the risks specific to the obligation. The increase in the provision due to passage of time recognised as finance cost.
(x) Onerous contracts
The Group recognises a provision for onerous contracts when the expected benefits to be derived from a contract are less than the unavoidable costs of meeting the obligations under the contract.
145FINANCIAL STATEMENTS08
NOTES TO THE FINANCIAL STATEMENTSFOR THE FINANCIAL YEAR ENDED 31 DECEMBER 2019
3 SIGNIFICANT ACCOUNTING POLICIES (CONTINUED)
(y) Non-current assets held for sale
Non-current assets are classified as assets held for sale if their carrying amount will be recovered through a sale transaction rather than through continuing use. This condition is regarded as met only when the sale is highly probable and the asset (or disposal group) is available for sale in its immediate condition. Management must be committed to the sale, which should be expected within one year from the date of classification as held for sale. Immediately before classification as held for sale, the assets (or components of a disposal group) are remeasured in accordance with the Group’s accounting policies. Thereafter, the assets (or disposal group) are recognised at the lower of their carrying amount and fair value less cost to sell. Assets classified as held for sale, or included within a disposal group that is classified as held for sale, are not depreciated. Impairment losses on initial classification as held for sale and subsequent gains or losses on remeasurement are included in profit or loss. Gains are not recognised in excess of any cumulative impairment loss.
A discontinued operation is a component of the Group’s business that represents a separate major line of business or geographical area of operations or is a subsidiary acquired exclusively with a view to resale. Classification as a discontinued operation occurs upon disposal or when the operation meets the criteria to be classified as held for sale, if earlier. A disposal group that is to be abandoned may also qualify.
Results from operations qualifying as discontinued operations are presented separately as a single amount on profit or loss. Results from operations qualifying as discontinued operations as of the balance sheet date for the latest period presented, that have previously been presented as results from continuing operations, are represented as results from discontinued operations for all periods presented.
In case conditions for classification of non-current assets and disposal groups as held for sale are no longer met, classification as held for sale ceases. Accordingly, results of operations, previously presented in discontinued operations, are reclassified and included in result from continuing operations for all periods presented. Non-current assets that ceases to be classified as held for sale are remeasured at the lower of their carrying amount before classification as held for sale, adjusted for any depreciation, amortisation or revaluations that would have been recognised had the asset or disposal group not been classified as held for sale, and its recoverable amount at the date of the subsequent decision to sell.
(z) Earnings per share
The Group presents basic and diluted earnings per share (“EPS”) data for its ordinary shares. Basic EPS is calculated based on the consolidated profit after taxation attributable to equity shareholders of the Company and divided by the weighted number of ordinary shares in issue.
(aa) Fair value measurement
The fair value measurement prescribes that fair value of an asset or a liability, except for share-based payment and lease transactions, is determined as the price that would be received to sell an asset or paid to transfer a liability in an orderly transaction between market participants at the measurement date. The measurement assumes that the transaction to sell the asset or transfer the liability takes place either in the principal market or in the absence of a principal market, in the most advantageous market.
(ab) Derivative financial instruments and hedging activities
Derivatives are initially recognised at fair value on the date a derivative contract is entered into and are subsequently re-measured at their fair value.
The method of recognising the resulting gain or loss depends on whether the derivative is designated as a hedging instrument, and the nature of the item being hedged. The Group designates certain derivatives as hedges of a particular risk associated with a recognised asset or liability or a highly probable forecast transaction (cash flow hedge).
MSM MalaySia HoldingS BerHad | annual report 2019146
NOTES TO THE FINANCIAL STATEMENTSFOR THE FINANCIAL YEAR ENDED 31 DECEMBER 2019
3 SIGNIFICANT ACCOUNTING POLICIES (CONTINUED)
(ab) Derivative financial instruments and hedging activities (continued)
The Group documents at the inception of the transaction the relationship between hedging instruments and hedged items, as well as its risk management objectives and strategy for undertaking various hedging transactions. The Group also documents its assessment, both at hedge inception and on an ongoing basis, of whether the derivatives that are used in hedging transactions are highly effective in offsetting changes in cash flows of hedged items.
The fair values of various derivative instruments used for hedging purposes are disclosed in Note 27 to the financial statements. The full fair value of a hedging derivative is classified as a non-current asset or liability when the remaining hedged item is more than 12 months, and as a current asset or liability when the remaining maturity of the hedged item is less than 12 months.
Cash flow hedge
The effective portion of changes in the fair value of derivatives that are designated and qualify as cash flow hedges is recognised in other comprehensive income. The gain or loss relating to the ineffective portion is recognised immediately in profitorlosswithin‘financeincome/(costs)’and‘foreignexchangelosses’.
Amounts accumulated in equity are reclassified to profit or loss in the periods when the hedged item affects profit or loss (for example, when the forecast sale that is hedged takes place). The gain or loss relating to the effective portion of interest rate swaps hedging variable rate borrowings is recognised in profit or loss and presented separately after net operating profit.
When a hedging instrument expires or is sold, or when a hedge no longer meets the criteria for hedge accounting, any cumulative gain or loss existing in equity at that time remains in equity and is recognised when the forecast transaction is ultimately recognised in profit or loss. When a forecast transaction is no longer expected to occur, the cumulative gain or lossthatwasreportedinequityisimmediatelytransferredtoprofitorlosswithin‘financeincome/(costs)’(Note10).
4 FINANCIAL RISK MANAGEMENT
(a) Financial risk management policies
The Group is exposed to market risk (including foreign currency exchange risk, commodity price risk and finance rate risk), credit risk and liquidity risk arising from its business activities. The Group’s overall risk management strategy seeks to minimise adverse effects from the unpredictability of financial markets on the Group’s financial performance. The Group uses relevant derivative financial instruments to hedge the risk of such commercial exposure and ensure the implementation risk action plans to effectively mitigate the risks.
The Board of Directors has overall responsibility for the oversight of financial risk management which includes risk identification, operational or strategic, and the subsequent action plans to manage these risks. Management is responsible for identifying, monitoring and managing the Group’s risk exposures.
Market risk
(i) Foreign currency exchange risk
The Group operates internationally and is exposed to foreign currency exchange risk arising from various currency exposures, primarily with respect to the United States Dollar (“USD”).
The Group manages its currency exposure through foreign currency forward contracts.
As at 31.12.2019, a 10% weakening of the USD against Malaysia Ringgit (“RM”) at the date of statement of financial position would decrease the Group’s loss after tax of approximately RM2,992,000.
147FINANCIAL STATEMENTS08
NOTES TO THE FINANCIAL STATEMENTSFOR THE FINANCIAL YEAR ENDED 31 DECEMBER 2019
4 FINANCIAL RISK MANAGEMENT (CONTINUED)
(a) Financial risk management policies (continued)
Market risk (continued)
(i) Foreign currency exchange risk (continued)
As at 31.12.2018, a 5% weakening of the USD against Malaysia Ringgit (“RM”) at the date of statement of financial position would increase the Group’s profit after tax of approximately RM2,598,000.
The above exposure mainly as a result of foreign exchange gains/losses on translation of payables. The analysis assumes that all other variables remain constant.
(ii) Commodity price risk
The Group is exposed to raw sugar prices which are subject to fluctuations due to unpredictable factors such as weather, change of global demand and global production.
Management is responsible for managing the Group’s exposure to raw sugar input cost against selling prices of refined sugar set by the Government. Management meets regularly to review their raw sugar requirements and price trends and then decides when to buy and price raw sugar consignments so that a refining margin is locked to ensure budgeted profits are met. In addition, the Group enters into New York 11 raw sugar future contracts to manage its raw sugar purchase cost.
A sensitivity analysis has been performed based on the Group’s exposure to sugar futures as at year end. If price of raw sugar increases or decreases by 10% with all other variables held constant, the Group’s loss after tax and equity would increase or decrease by RM4,803,000 (2018: profit after tax and equity would decrease or increase by RM5,301,000).
(iii) Finance rate risk
The Group’s finance rate risk mainly arises from term loans. Term loans issued at variable rates expose the Group to cash flow finance rate risk.
The finance rate profile of the Group’s finance bearing financial assets, based on carrying amounts as at the end of the financial year was:
Group Company 2019 2018 2019 2018 RM’000 RM’000 RM’000 RM’000
Financial assets
At fixed rate:
Fixed deposits 143,652 148,786 29,282 115,071
At floating rate (exposed to cash flow finance rate risk):
Loans to subsidiaries - - 1,059,698 1,083,989
143,652 148,786 1,088,980 1,199,060
MSM MalaySia HoldingS BerHad | annual report 2019148
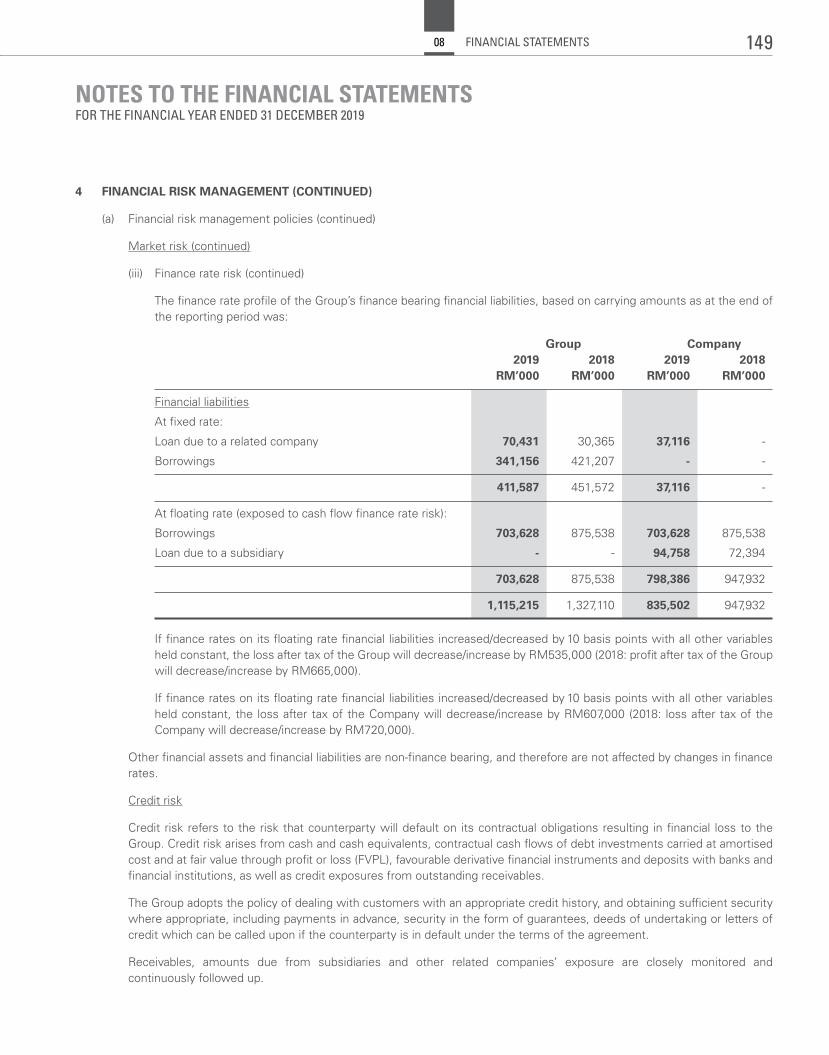
NOTES TO THE FINANCIAL STATEMENTSFOR THE FINANCIAL YEAR ENDED 31 DECEMBER 2019
4 FINANCIAL RISK MANAGEMENT (CONTINUED)
(a) Financial risk management policies (continued)
Market risk (continued)
(iii) Finance rate risk (continued)
The finance rate profile of the Group’s finance bearing financial liabilities, based on carrying amounts as at the end of the reporting period was:
Group Company 2019 2018 2019 2018 RM’000 RM’000 RM’000 RM’000
Financial liabilities
At fixed rate:
Loan due to a related company 70,431 30,365 37,116 -
Borrowings 341,156 421,207 - -
411,587 451,572 37,116 -
At floating rate (exposed to cash flow finance rate risk):
Borrowings 703,628 875,538 703,628 875,538
Loan due to a subsidiary - - 94,758 72,394
703,628 875,538 798,386 947,932
1,115,215 1,327,110 835,502 947,932
If finance rates on its floating rate financial liabilities increased/decreased by 10 basis points with all other variables held constant, the loss after tax of the Group will decrease/increase by RM535,000 (2018: profit after tax of the Group will decrease/increase by RM665,000).
If finance rates on its floating rate financial liabilities increased/decreased by 10 basis points with all other variables held constant, the loss after tax of the Company will decrease/increase by RM607,000 (2018: loss after tax of the Company will decrease/increase by RM720,000).
Other financial assets and financial liabilities are non-finance bearing, and therefore are not affected by changes in finance rates.
Credit risk
Credit risk refers to the risk that counterparty will default on its contractual obligations resulting in financial loss to the Group. Credit risk arises from cash and cash equivalents, contractual cash flows of debt investments carried at amortised cost and at fair value through profit or loss (FVPL), favourable derivative financial instruments and deposits with banks and financial institutions, as well as credit exposures from outstanding receivables.
The Group adopts the policy of dealing with customers with an appropriate credit history, and obtaining sufficient security where appropriate, including payments in advance, security in the form of guarantees, deeds of undertaking or letters of credit which can be called upon if the counterparty is in default under the terms of the agreement.
Receivables, amounts due from subsidiaries and other related companies’ exposure are closely monitored and continuously followed up.
149FINANCIAL STATEMENTS08
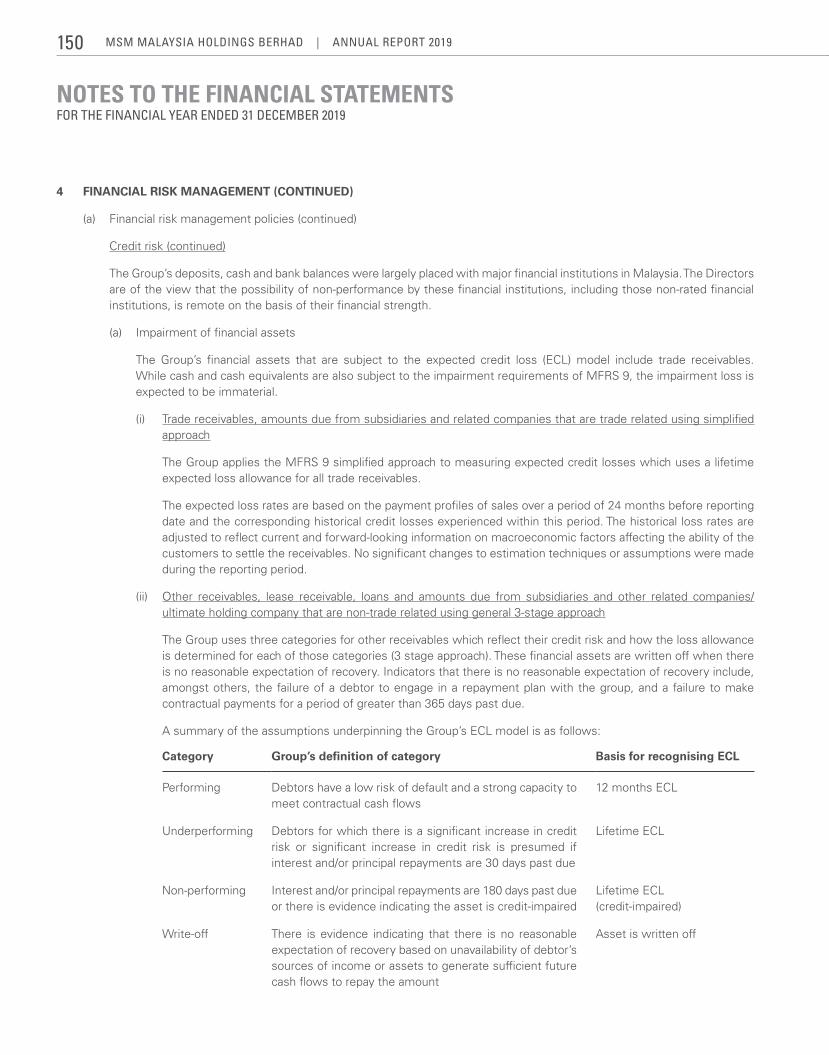
NOTES TO THE FINANCIAL STATEMENTSFOR THE FINANCIAL YEAR ENDED 31 DECEMBER 2019
4 FINANCIAL RISK MANAGEMENT (CONTINUED)
(a) Financial risk management policies (continued)
Credit risk (continued)
The Group’s deposits, cash and bank balances were largely placed with major financial institutions in Malaysia. The Directors are of the view that the possibility of non-performance by these financial institutions, including those non-rated financial institutions, is remote on the basis of their financial strength.
(a) Impairment of financial assets
The Group’s financial assets that are subject to the expected credit loss (ECL) model include trade receivables. While cash and cash equivalents are also subject to the impairment requirements of MFRS 9, the impairment loss is expected to be immaterial.
(i) Trade receivables, amounts due from subsidiaries and related companies that are trade related using simplified approach
The Group applies the MFRS 9 simplified approach to measuring expected credit losses which uses a lifetime expected loss allowance for all trade receivables.
The expected loss rates are based on the payment profiles of sales over a period of 24 months before reporting date and the corresponding historical credit losses experienced within this period. The historical loss rates are adjusted to reflect current and forward-looking information on macroeconomic factors affecting the ability of the customers to settle the receivables. No significant changes to estimation techniques or assumptions were made during the reporting period.
(ii) Other receivables, lease receivable, loans and amounts due from subsidiaries and other related companies/ultimate holding company that are non-trade related using general 3-stage approach
The Group uses three categories for other receivables which reflect their credit risk and how the loss allowance is determined for each of those categories (3 stage approach). These financial assets are written off when there is no reasonable expectation of recovery. Indicators that there is no reasonable expectation of recovery include, amongst others, the failure of a debtor to engage in a repayment plan with the group, and a failure to make contractual payments for a period of greater than 365 days past due.
A summary of the assumptions underpinning the Group’s ECL model is as follows:
Category Group’s definition of category Basis for recognising ECL
Performing Debtors have a low risk of default and a strong capacity to meet contractual cash flows
12 months ECL
Underperforming Debtors for which there is a significant increase in credit risk or significant increase in credit risk is presumed if interest and/or principal repayments are 30 days past due
Lifetime ECL
Non-performing Interest and/or principal repayments are 180 days past due or there is evidence indicating the asset is credit-impaired
Lifetime ECL(credit-impaired)
Write-off There is evidence indicating that there is no reasonable expectation of recovery based on unavailability of debtor’s sources of income or assets to generate sufficient future cash flows to repay the amount
Asset is written off
MSM MalaySia HoldingS BerHad | annual report 2019150
NOTES TO THE FINANCIAL STATEMENTSFOR THE FINANCIAL YEAR ENDED 31 DECEMBER 2019
4 FINANCIAL RISK MANAGEMENT (CONTINUED)
(a) Financial risk management policies (continued)
Credit risk (continued)
Fixed deposits and bank balances
The Group seeks to invest in its cash assets safely by depositing them with licensed financial institutions.
The Group’s bank and cash balances were largely placed with major financial institutions in Malaysia. The Directors are of the view that the possibility of non-performance by these financial institutions, including those non-rated financial institutions, is remote on the basis of their financial strength.
Inter-company balances
The Company provided unsecured loans to subsidiaries. The Company monitors the results of the subsidiaries regularly.
As at the end of the reporting period, the maximum exposure to credit risk is represented by their carrying amounts in the statement of financial position and there was no indication that the loans to the subsidiaries are not recoverable.
Liquidity risk
Liquidity risk is the risk that the Group will encounter difficulties in meeting obligations due to shortage of funds. The Group maintains a sufficient level of cash and cash equivalents to meet the Group’s working capital requirements by closely monitoring its cash flows. Due to the nature of its business, the Group has adopted prudent liquidity risk management in maintaining and obtaining sufficient credit facilities from financial institutions.
Cash flow forecasting is performed in the operating entities of the Group and then aggregated by management. Management monitors rolling forecasts of the Group’s liquidity requirements to ensure it has sufficient cash to meet operational needs while maintaining sufficient headroom on its undrawn committed borrowing facilities at all times so that the Group does not breach borrowing limits or covenants (where applicable) on any of its borrowing facilities. Such forecasting takes into consideration the Group's debt financing plans, covenant compliance, compliance with internal statements of financial position ratio targets and, if applicable, external regulatory or legal requirements – for example, currency restrictions. As at 31 December 2019, the Group has no undrawn committed borrowing facilities (2018: RM Nil).
As disclosed in Note 34 to the financial statements, the Company had revised its payment terms and financial covenants in respect of its Islamic term loan during the financial year ended 31 December 2019. Based on the revised term sheet, the revised financial covenants shall be computed based on the Group’s consolidated annual audited financial statements for the financial year ending 31 December 2020 onwards.
The Company is also assessing various possibilities to negotiate the terms of the Islamic term loan with its lenders following the announcement by the Government of Malaysia on the moratorium repayment period in view of the Covid-19 pandemic, if necessary.
In addition to amending the payment period of the Islamic term loan, the Company also plans to manage its liquidity risk by receiving income in the form of dividends and management fees from its subsidiaries, to meet its obligations over the next twelve months.
151FINANCIAL STATEMENTS08
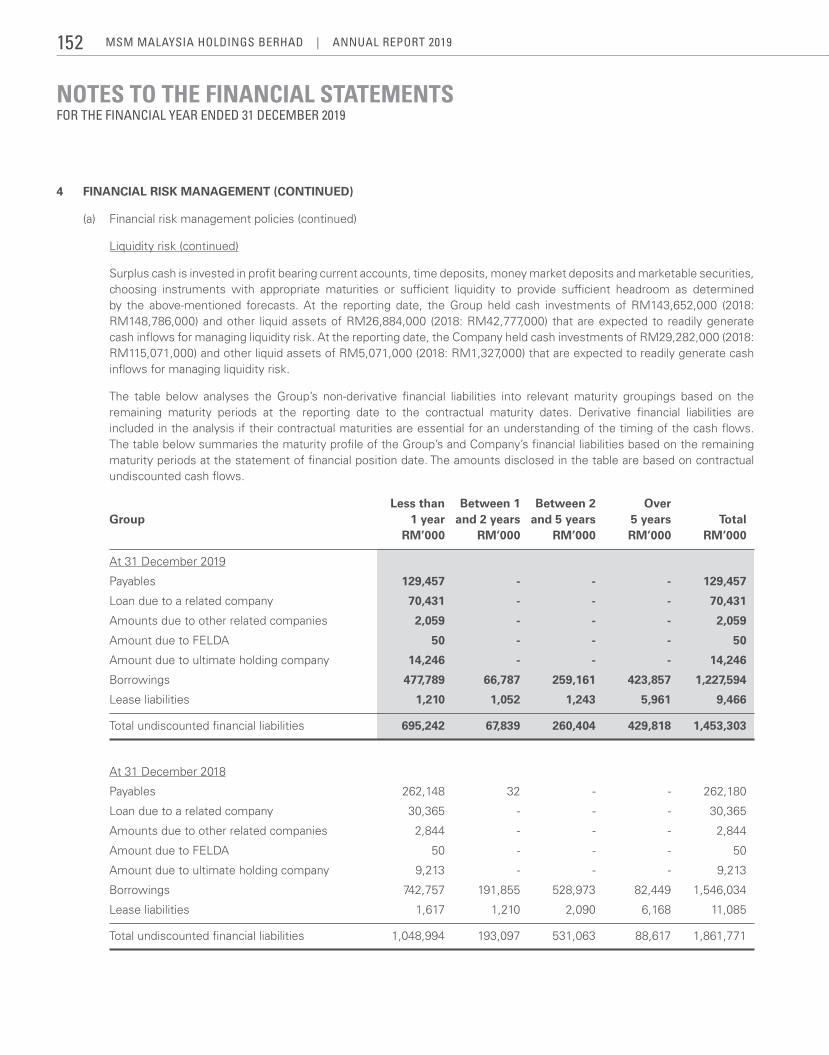
NOTES TO THE FINANCIAL STATEMENTSFOR THE FINANCIAL YEAR ENDED 31 DECEMBER 2019
4 FINANCIAL RISK MANAGEMENT (CONTINUED)
(a) Financial risk management policies (continued)
Liquidity risk (continued)
Surplus cash is invested in profit bearing current accounts, time deposits, money market deposits and marketable securities, choosing instruments with appropriate maturities or sufficient liquidity to provide sufficient headroom as determined by the above-mentioned forecasts. At the reporting date, the Group held cash investments of RM143,652,000 (2018: RM148,786,000) and other liquid assets of RM26,884,000 (2018: RM42,777,000) that are expected to readily generate cash inflows for managing liquidity risk. At the reporting date, the Company held cash investments of RM29,282,000 (2018: RM115,071,000) and other liquid assets of RM5,071,000 (2018: RM1,327,000) that are expected to readily generate cash inflows for managing liquidity risk.
The table below analyses the Group’s non-derivative financial liabilities into relevant maturity groupings based on the remaining maturity periods at the reporting date to the contractual maturity dates. Derivative financial liabilities are included in the analysis if their contractual maturities are essential for an understanding of the timing of the cash flows. The table below summaries the maturity profile of the Group’s and Company’s financial liabilities based on the remaining maturity periods at the statement of financial position date. The amounts disclosed in the table are based on contractual undiscounted cash flows.
Less than Between 1 Between 2 Over Group 1 year and 2 years and 5 years 5 years Total RM’000 RM’000 RM’000 RM’000 RM’000
At 31 December 2019
Payables 129,457 - - - 129,457
Loan due to a related company 70,431 - - - 70,431
Amounts due to other related companies 2,059 - - - 2,059
Amount due to FELDA 50 - - - 50
Amount due to ultimate holding company 14,246 - - - 14,246
Borrowings 477,789 66,787 259,161 423,857 1,227,594
Lease liabilities 1,210 1,052 1,243 5,961 9,466
Total undiscounted financial liabilities 695,242 67,839 260,404 429,818 1,453,303
At 31 December 2018
Payables 262,148 32 - - 262,180
Loan due to a related company 30,365 - - - 30,365
Amounts due to other related companies 2,844 - - - 2,844
Amount due to FELDA 50 - - - 50
Amount due to ultimate holding company 9,213 - - - 9,213
Borrowings 742,757 191,855 528,973 82,449 1,546,034
Lease liabilities 1,617 1,210 2,090 6,168 11,085
Total undiscounted financial liabilities 1,048,994 193,097 531,063 88,617 1,861,771
MSM MalaySia HoldingS BerHad | annual report 2019152
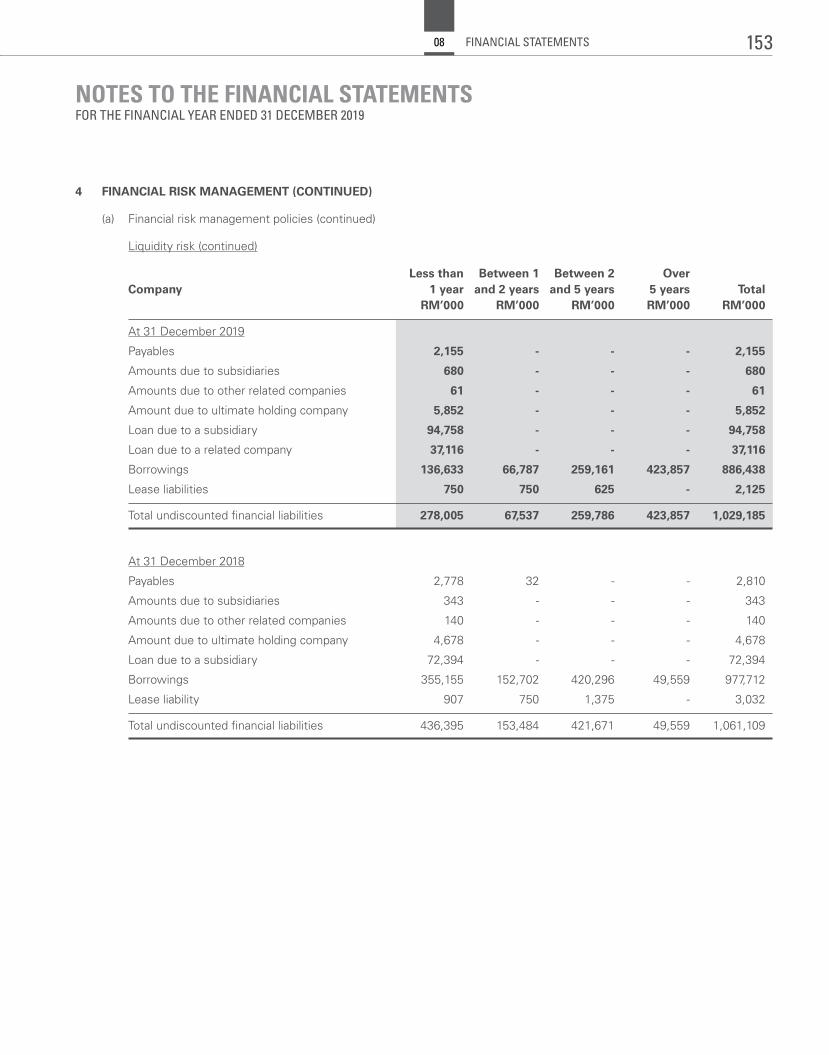
NOTES TO THE FINANCIAL STATEMENTSFOR THE FINANCIAL YEAR ENDED 31 DECEMBER 2019
4 FINANCIAL RISK MANAGEMENT (CONTINUED)
(a) Financial risk management policies (continued)
Liquidity risk (continued)
Less than Between 1 Between 2 Over Company 1 year and 2 years and 5 years 5 years Total RM’000 RM’000 RM’000 RM’000 RM’000
At 31 December 2019
Payables 2,155 - - - 2,155
Amounts due to subsidiaries 680 - - - 680
Amounts due to other related companies 61 - - - 61
Amount due to ultimate holding company 5,852 - - - 5,852
Loan due to a subsidiary 94,758 - - - 94,758
Loan due to a related company 37,116 - - - 37,116
Borrowings 136,633 66,787 259,161 423,857 886,438
Lease liabilities 750 750 625 - 2,125
Total undiscounted financial liabilities 278,005 67,537 259,786 423,857 1,029,185
At 31 December 2018
Payables 2,778 32 - - 2,810
Amounts due to subsidiaries 343 - - - 343
Amounts due to other related companies 140 - - - 140
Amount due to ultimate holding company 4,678 - - - 4,678
Loan due to a subsidiary 72,394 - - - 72,394
Borrowings 355,155 152,702 420,296 49,559 977,712
Lease liability 907 750 1,375 - 3,032
Total undiscounted financial liabilities 436,395 153,484 421,671 49,559 1,061,109
153FINANCIAL STATEMENTS08
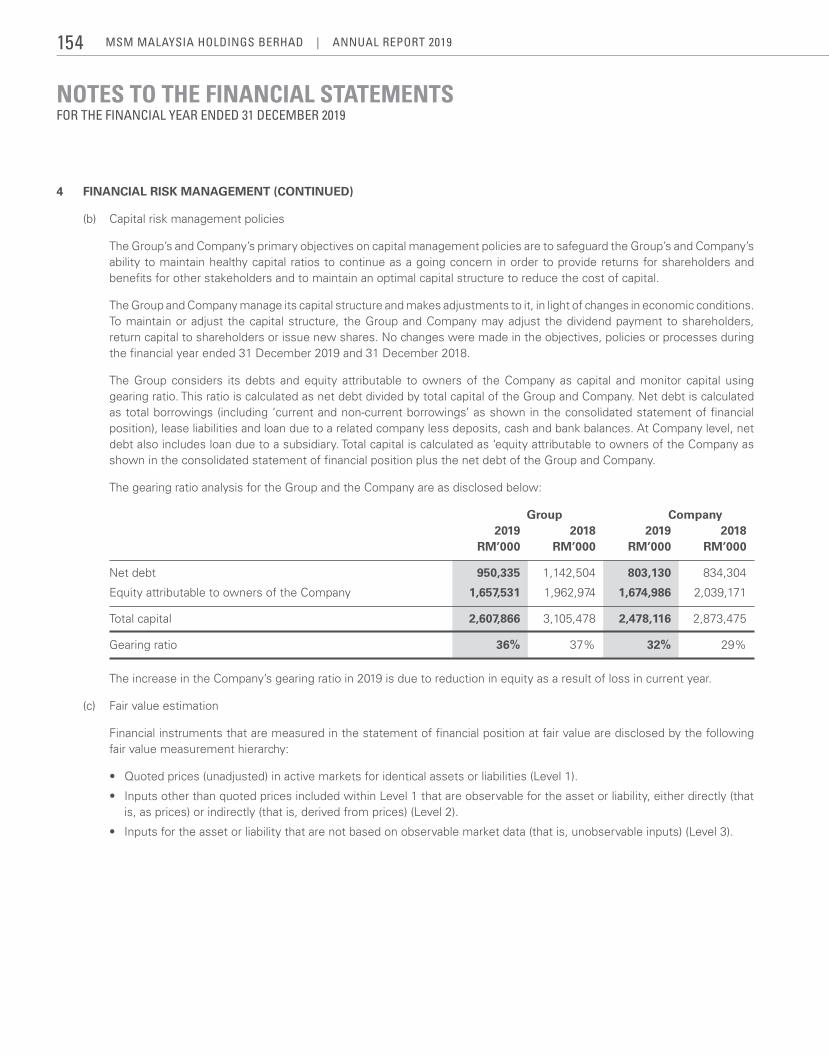
NOTES TO THE FINANCIAL STATEMENTSFOR THE FINANCIAL YEAR ENDED 31 DECEMBER 2019
4 FINANCIAL RISK MANAGEMENT (CONTINUED)
(b) Capital risk management policies
The Group’s and Company’s primary objectives on capital management policies are to safeguard the Group’s and Company’s ability to maintain healthy capital ratios to continue as a going concern in order to provide returns for shareholders and benefits for other stakeholders and to maintain an optimal capital structure to reduce the cost of capital.
The Group and Company manage its capital structure and makes adjustments to it, in light of changes in economic conditions. To maintain or adjust the capital structure, the Group and Company may adjust the dividend payment to shareholders, return capital to shareholders or issue new shares. No changes were made in the objectives, policies or processes during the financial year ended 31 December 2019 and 31 December 2018.
The Group considers its debts and equity attributable to owners of the Company as capital and monitor capital using gearing ratio. This ratio is calculated as net debt divided by total capital of the Group and Company. Net debt is calculated astotalborrowings(including‘currentandnon-currentborrowings’asshownintheconsolidatedstatementoffinancialposition), lease liabilities and loan due to a related company less deposits, cash and bank balances. At Company level, net debtalsoincludesloanduetoasubsidiary.Totalcapitaliscalculatedas‘equityattributabletoownersoftheCompanyasshown in the consolidated statement of financial position plus the net debt of the Group and Company.
The gearing ratio analysis for the Group and the Company are as disclosed below:
Group Company 2019 2018 2019 2018 RM’000 RM’000 RM’000 RM’000
Net debt 950,335 1,142,504 803,130 834,304
Equity attributable to owners of the Company 1,657,531 1,962,974 1,674,986 2,039,171
Total capital 2,607,866 3,105,478 2,478,116 2,873,475
Gearing ratio 36% 37% 32% 29%
The increase in the Company’s gearing ratio in 2019 is due to reduction in equity as a result of loss in current year.
(c) Fair value estimation
Financial instruments that are measured in the statement of financial position at fair value are disclosed by the following fair value measurement hierarchy:
• Quotedprices(unadjusted)inactivemarketsforidenticalassetsorliabilities(Level1).
• InputsotherthanquotedpricesincludedwithinLevel1thatareobservablefortheassetorliability,eitherdirectly(thatis, as prices) or indirectly (that is, derived from prices) (Level 2).
• Inputsfortheassetorliabilitythatarenotbasedonobservablemarketdata(thatis,unobservableinputs)(Level3).
MSM MalaySia HoldingS BerHad | annual report 2019154

NOTES TO THE FINANCIAL STATEMENTSFOR THE FINANCIAL YEAR ENDED 31 DECEMBER 2019
4 FINANCIAL RISK MANAGEMENT (CONTINUED)
(c) Fair value estimation (continued)
The following table presents the Group’s financial assets and liabilities that are measured at fair value at 31 December 2019 and 31 December 2018:
Carrying amount Level 1 Level 2 Level 3 RM’000 RM’000 RM’000 RM’000
Group - Assets
As at 31 December 2019
Financial assets at fair value through profit or loss
Derivatives
- Sugar futures contracts 2,388 2,388 - -
- Foreign exchange forward contract 78 - 78 -
As at 31 December 2018
Derivatives used for hedging:
- Islamic profit rate swap 561 - 561 -
Group - Liabilities
As at 31 December 2019
Financial assets at fair value through profit or loss:
Derivatives
- Foreign exchange forward contract (10) - (10) -
Derivatives used for hedging:
- Islamic profit rate swap (4,968) - (4,968) -
As at 31 December 2018
Financial assets at fair value through profit or loss:
Derivatives
- Sugar commodity options (630) - (630) -
155FINANCIAL STATEMENTS08
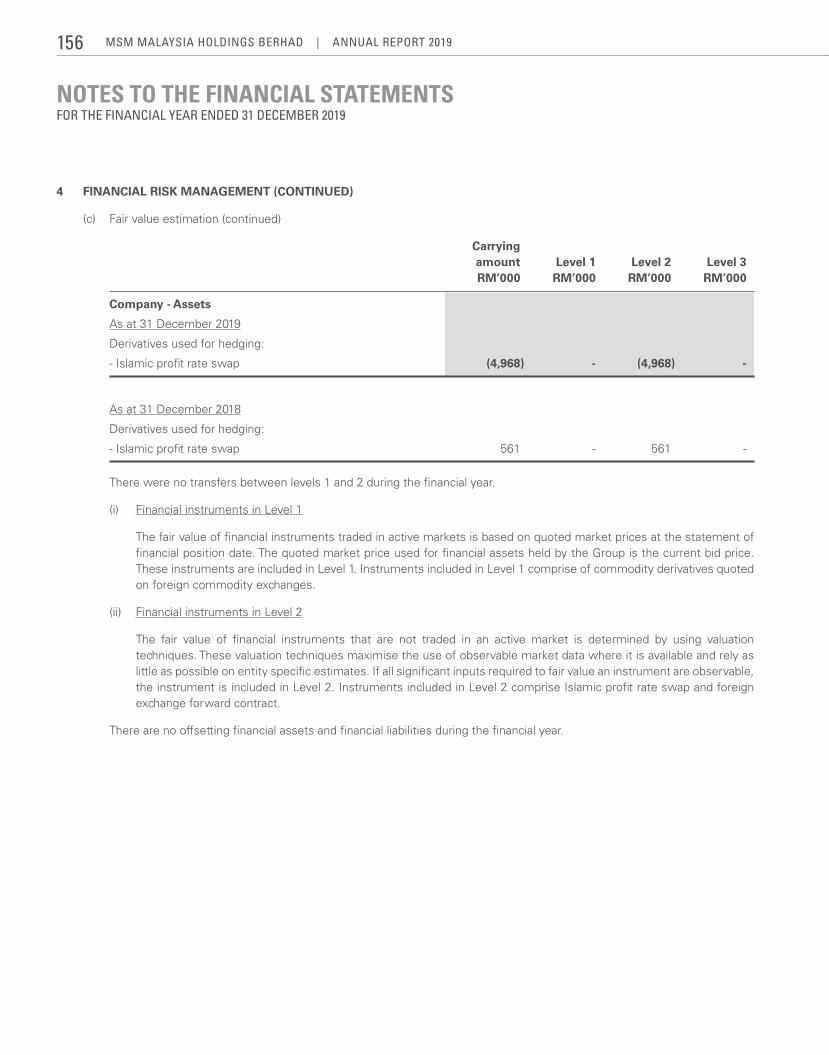
NOTES TO THE FINANCIAL STATEMENTSFOR THE FINANCIAL YEAR ENDED 31 DECEMBER 2019
4 FINANCIAL RISK MANAGEMENT (CONTINUED)
(c) Fair value estimation (continued)
Carrying amount Level 1 Level 2 Level 3 RM’000 RM’000 RM’000 RM’000
Company - Assets
As at 31 December 2019
Derivatives used for hedging:
- Islamic profit rate swap (4,968) - (4,968) -
As at 31 December 2018
Derivatives used for hedging:
- Islamic profit rate swap 561 - 561 -
There were no transfers between levels 1 and 2 during the financial year.
(i) Financial instruments in Level 1
The fair value of financial instruments traded in active markets is based on quoted market prices at the statement of financial position date. The quoted market price used for financial assets held by the Group is the current bid price. These instruments are included in Level 1. Instruments included in Level 1 comprise of commodity derivatives quoted on foreign commodity exchanges.
(ii) Financial instruments in Level 2
The fair value of financial instruments that are not traded in an active market is determined by using valuation techniques. These valuation techniques maximise the use of observable market data where it is available and rely as little as possible on entity specific estimates. If all significant inputs required to fair value an instrument are observable, the instrument is included in Level 2. Instruments included in Level 2 comprise Islamic profit rate swap and foreign exchange forward contract.
There are no offsetting financial assets and financial liabilities during the financial year.
MSM MalaySia HoldingS BerHad | annual report 2019156
NOTES TO THE FINANCIAL STATEMENTSFOR THE FINANCIAL YEAR ENDED 31 DECEMBER 2019
5 CRITICAL ACCOUNTING ESTIMATES AND JUDGMENTS
Estimates and judgements are continually evaluated by Directors and management and are based on historical experience and other factors, including expectations of future events that are believed to be reasonable under the circumstances. The estimates and assumption that have a significant risk of causing a material adjustment to the carrying amounts of assets and liabilities within the next financial year are discussed below:
Goodwill
The Group determines whether goodwill is impaired at least on an annual basis. This requires an estimation of the recoverable amountofthecashgeneratingunits(‘CGU’)towhichthegoodwill isallocated.Estimatingtherecoverableamountrequiresmanagement to make an estimate of the expected future cash flows from the CGU and also to choose a suitable discount rate in order to calculate the present value of those cash flows.
The recoverable amounts of CGUs were determined based on the higher of fair value less cost to sell and value-in-use (“VIU”) calculations. The VIU is the net present value of the projected future cash flows derived from the CGU discounted at an appropriate discount rate. Projected future cash flows are estimates made based on historical, industry trends, general market and economic condition and other available information. Projected future cash flows are based on Group’s judgement in terms of assessing future uncertain parameters such as selling price, raw sugar price, sales volume and terminal value growth rate. These judgements are based on the historical track record and expectations of future events that are believed to be reasonable under current circumstances.
As a result of these impairments assessments, the Group did not recognise any impairment. A forecast period of 3 years together with a terminal value growth rate was used to derive the recoverable amount.
The key assumptions and sensitivity analysis are as disclosed in Note 19 to the financial statements.
Impairment of non-financial assets
The Group and Company assesses whether there is any indication that non-financial assets are impaired at the end of each reporting period and tests non-financial assets for impairment if such indication exists.
Impairment is measured by comparing the carrying amount of a cash generating unit with its recoverable amount. The recoverable amount is measured at the higher of the fair value less costs to sell for that asset and its value in use. The value in use is the net present value of the projected future cash flows derived from that asset discounted at an appropriate discount rate. Projected future cash flows are calculated based on historical and industry trends, general market and economic conditions and other available information. Changes to any of these assumptions would affect the determination of value in use.
Refer to Note 17 to the financial statements for the details of the impairment assessment carried out by management on the Group’s property, plant and equipment, ROU assets and intangible assets.
157FINANCIAL STATEMENTS08
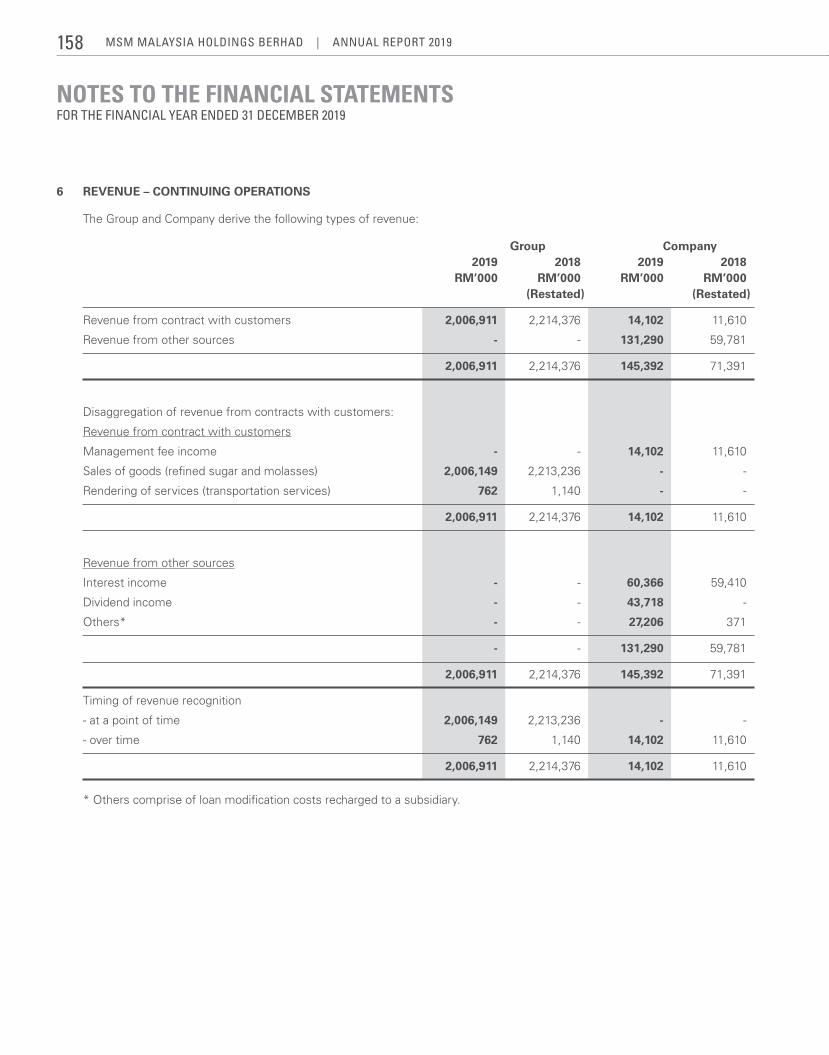
NOTES TO THE FINANCIAL STATEMENTSFOR THE FINANCIAL YEAR ENDED 31 DECEMBER 2019
6 REVENUE – CONTINUING OPERATIONS
The Group and Company derive the following types of revenue:
Group Company 2019 2018 2019 2018 RM’000 RM’000 RM’000 RM’000 (Restated) (Restated)
Revenue from contract with customers 2,006,911 2,214,376 14,102 11,610
Revenue from other sources - - 131,290 59,781
2,006,911 2,214,376 145,392 71,391
Disaggregation of revenue from contracts with customers:
Revenue from contract with customers
Management fee income - - 14,102 11,610
Sales of goods (refined sugar and molasses) 2,006,149 2,213,236 - -
Rendering of services (transportation services) 762 1,140 - -
2,006,911 2,214,376 14,102 11,610
Revenue from other sources
Interest income - - 60,366 59,410
Dividend income - - 43,718 -
Others* - - 27,206 371
- - 131,290 59,781
2,006,911 2,214,376 145,392 71,391
Timing of revenue recognition
- at a point of time 2,006,149 2,213,236 - -
- over time 762 1,140 14,102 11,610
2,006,911 2,214,376 14,102 11,610
* Others comprise of loan modification costs recharged to a subsidiary.
MSM MalaySia HoldingS BerHad | annual report 2019158
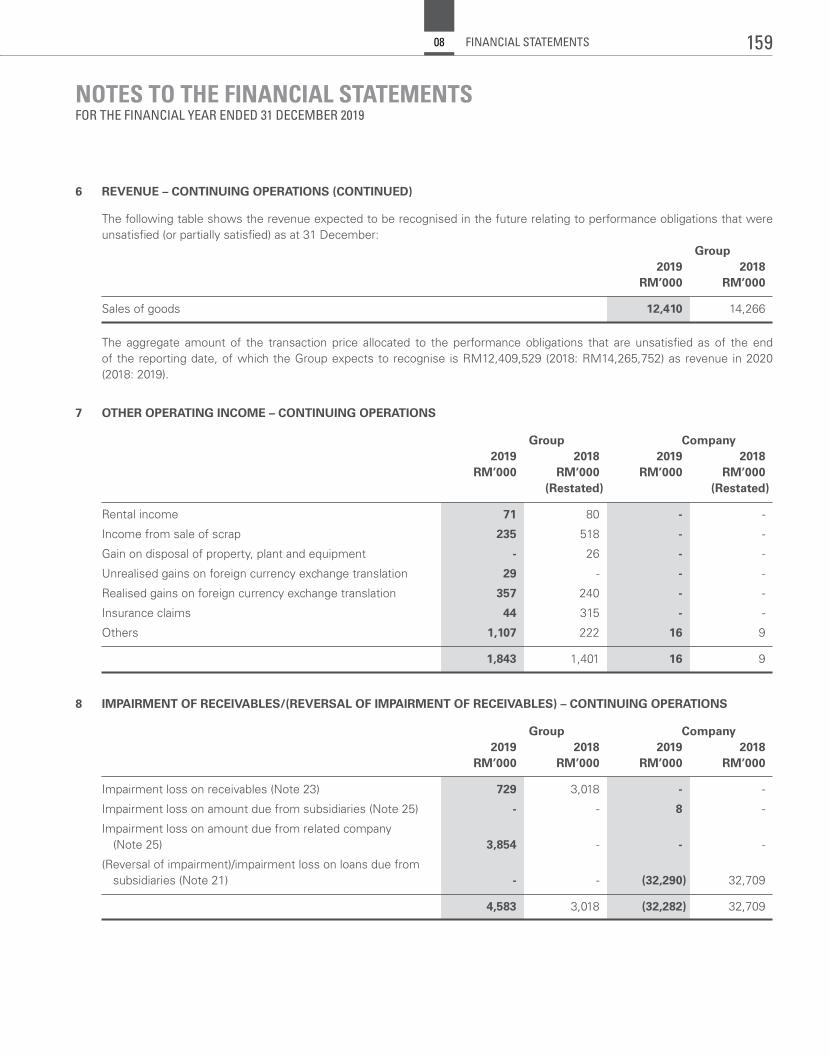
NOTES TO THE FINANCIAL STATEMENTSFOR THE FINANCIAL YEAR ENDED 31 DECEMBER 2019
6 REVENUE – CONTINUING OPERATIONS (CONTINUED)
The following table shows the revenue expected to be recognised in the future relating to performance obligations that were unsatisfied (or partially satisfied) as at 31 December: Group 2019 2018 RM’000 RM’000
Sales of goods 12,410 14,266
The aggregate amount of the transaction price allocated to the performance obligations that are unsatisfied as of the end of the reporting date, of which the Group expects to recognise is RM12,409,529 (2018: RM14,265,752) as revenue in 2020 (2018: 2019).
7 OTHER OPERATING INCOME – CONTINUING OPERATIONS
Group Company 2019 2018 2019 2018 RM’000 RM’000 RM’000 RM’000 (Restated) (Restated)
Rental income 71 80 - -
Income from sale of scrap 235 518 - -
Gain on disposal of property, plant and equipment - 26 - -
Unrealised gains on foreign currency exchange translation 29 - - -
Realised gains on foreign currency exchange translation 357 240 - -
Insurance claims 44 315 - -
Others 1,107 222 16 9
1,843 1,401 16 9
8 IMPAIRMENT OF RECEIVABLES/(REVERSAL OF IMPAIRMENT OF RECEIVABLES) – CONTINUING OPERATIONS
Group Company 2019 2018 2019 2018 RM’000 RM’000 RM’000 RM’000
Impairment loss on receivables (Note 23) 729 3,018 - -
Impairment loss on amount due from subsidiaries (Note 25) - - 8 -
Impairment loss on amount due from related company (Note 25) 3,854 - - -
(Reversal of impairment)/impairment loss on loans due from subsidiaries (Note 21) - - (32,290) 32,709
4,583 3,018 (32,282) 32,709
159FINANCIAL STATEMENTS08
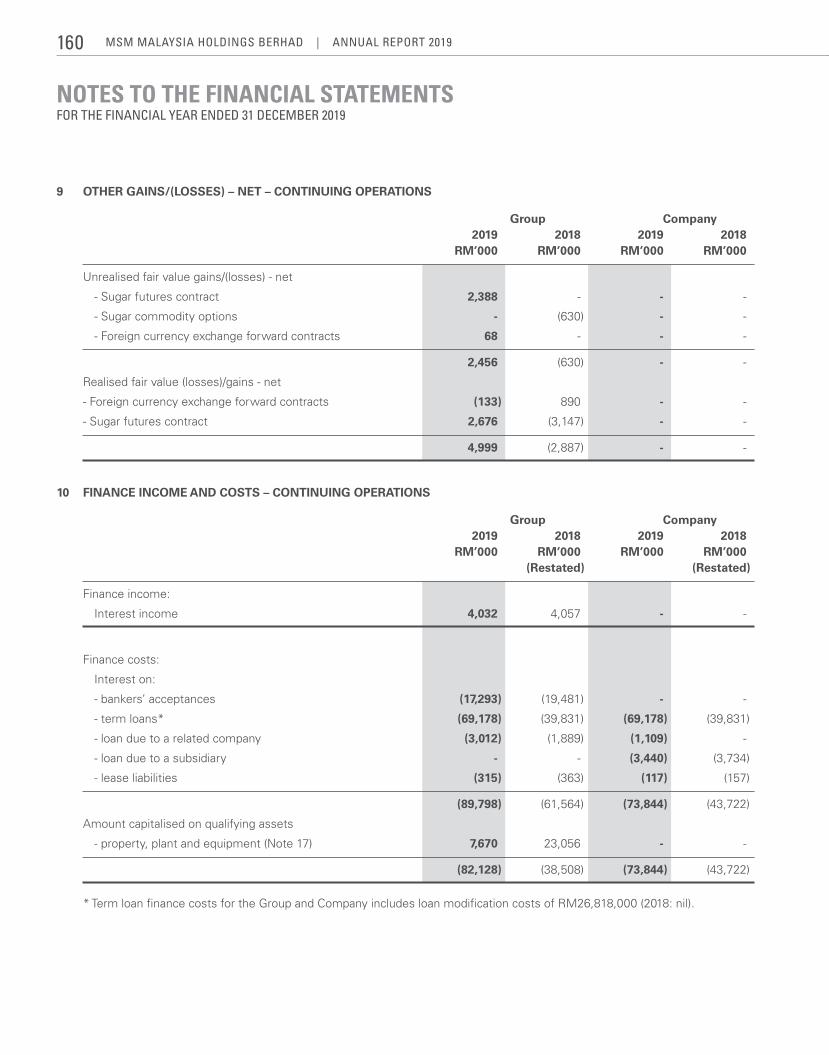
NOTES TO THE FINANCIAL STATEMENTSFOR THE FINANCIAL YEAR ENDED 31 DECEMBER 2019
9 OTHER GAINS/(LOSSES) – NET – CONTINUING OPERATIONS
Group Company 2019 2018 2019 2018 RM’000 RM’000 RM’000 RM’000
Unrealised fair value gains/(losses) - net
- Sugar futures contract 2,388 - - -
- Sugar commodity options - (630) - -
- Foreign currency exchange forward contracts 68 - - -
2,456 (630) - -
Realised fair value (losses)/gains - net
- Foreign currency exchange forward contracts (133) 890 - -
- Sugar futures contract 2,676 (3,147) - -
4,999 (2,887) - -
10 FINANCE INCOME AND COSTS – CONTINUING OPERATIONS
Group Company 2019 2018 2019 2018 RM’000 RM’000 RM’000 RM’000 (Restated) (Restated)
Finance income:
Interest income 4,032 4,057 - -
Finance costs:
Interest on:
- bankers’ acceptances (17,293) (19,481) - -
- term loans* (69,178) (39,831) (69,178) (39,831)
- loan due to a related company (3,012) (1,889) (1,109) -
- loan due to a subsidiary - - (3,440) (3,734)
- lease liabilities (315) (363) (117) (157)
(89,798) (61,564) (73,844) (43,722)
Amount capitalised on qualifying assets
- property, plant and equipment (Note 17) 7,670 23,056 - -
(82,128) (38,508) (73,844) (43,722)
* Term loan finance costs for the Group and Company includes loan modification costs of RM26,818,000 (2018: nil).
MSM MalaySia HoldingS BerHad | annual report 2019160
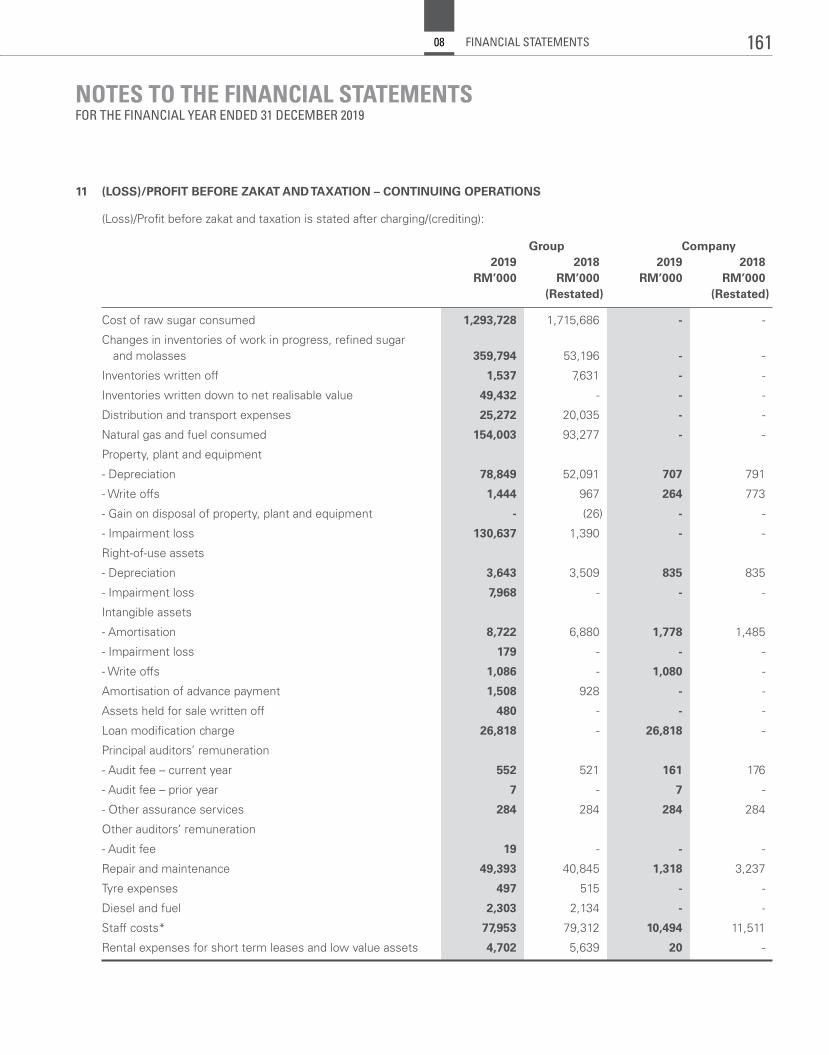
NOTES TO THE FINANCIAL STATEMENTSFOR THE FINANCIAL YEAR ENDED 31 DECEMBER 2019
11 (LOSS)/PROFIT BEFORE ZAKAT AND TAXATION – CONTINUING OPERATIONS
(Loss)/Profit before zakat and taxation is stated after charging/(crediting):
Group Company 2019 2018 2019 2018 RM’000 RM’000 RM’000 RM’000 (Restated) (Restated)
Cost of raw sugar consumed 1,293,728 1,715,686 - -
Changes in inventories of work in progress, refined sugar and molasses 359,794 53,196 - -
Inventories written off 1,537 7,631 - -
Inventories written down to net realisable value 49,432 - - -
Distribution and transport expenses 25,272 20,035 - -
Natural gas and fuel consumed 154,003 93,277 - -
Property, plant and equipment
- Depreciation 78,849 52,091 707 791
- Write offs 1,444 967 264 773
- Gain on disposal of property, plant and equipment - (26) - -
- Impairment loss 130,637 1,390 - -
Right-of-use assets
- Depreciation 3,643 3,509 835 835
- Impairment loss 7,968 - - -
Intangible assets
- Amortisation 8,722 6,880 1,778 1,485
- Impairment loss 179 - - -
- Write offs 1,086 - 1,080 -
Amortisation of advance payment 1,508 928 - -
Assets held for sale written off 480 - - -
Loan modification charge 26,818 - 26,818 -
Principal auditors’ remuneration
- Audit fee – current year 552 521 161 176
- Audit fee – prior year 7 - 7 -
- Other assurance services 284 284 284 284
Other auditors’ remuneration
- Audit fee 19 - - -
Repair and maintenance 49,393 40,845 1,318 3,237
Tyre expenses 497 515 - -
Diesel and fuel 2,303 2,134 - -
Staff costs* 77,953 79,312 10,494 11,511
Rental expenses for short term leases and low value assets 4,702 5,639 20 -
161FINANCIAL STATEMENTS08
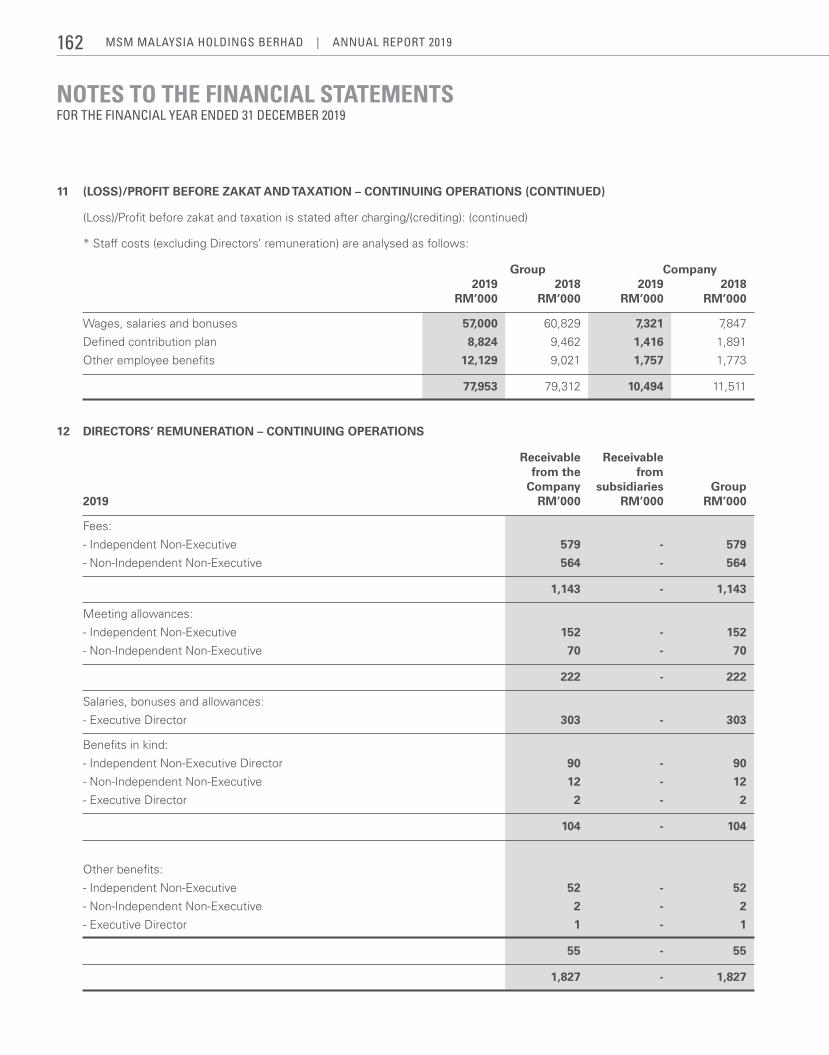
NOTES TO THE FINANCIAL STATEMENTSFOR THE FINANCIAL YEAR ENDED 31 DECEMBER 2019
11 (LOSS)/PROFIT BEFORE ZAKAT AND TAXATION – CONTINUING OPERATIONS (CONTINUED)
(Loss)/Profit before zakat and taxation is stated after charging/(crediting): (continued)
* Staff costs (excluding Directors’ remuneration) are analysed as follows:
Group Company 2019 2018 2019 2018 RM’000 RM’000 RM’000 RM’000
Wages, salaries and bonuses 57,000 60,829 7,321 7,847
Defined contribution plan 8,824 9,462 1,416 1,891
Other employee benefits 12,129 9,021 1,757 1,773
77,953 79,312 10,494 11,511
12 DIRECTORS’ REMUNERATION – CONTINUING OPERATIONS
Receivable Receivable from the from Company subsidiaries Group 2019 RM’000 RM’000 RM’000
Fees:
- Independent Non-Executive 579 - 579
- Non-Independent Non-Executive 564 - 564
1,143 - 1,143
Meeting allowances:
- Independent Non-Executive 152 - 152
- Non-Independent Non-Executive 70 - 70
222 - 222
Salaries, bonuses and allowances:
- Executive Director 303 - 303
Benefits in kind:
- Independent Non-Executive Director 90 - 90
- Non-Independent Non-Executive 12 - 12
- Executive Director 2 - 2
104 - 104
Other benefits:
- Independent Non-Executive 52 - 52
- Non-Independent Non-Executive 2 - 2
- Executive Director 1 - 1
55 - 55
1,827 - 1,827
MSM MalaySia HoldingS BerHad | annual report 2019162
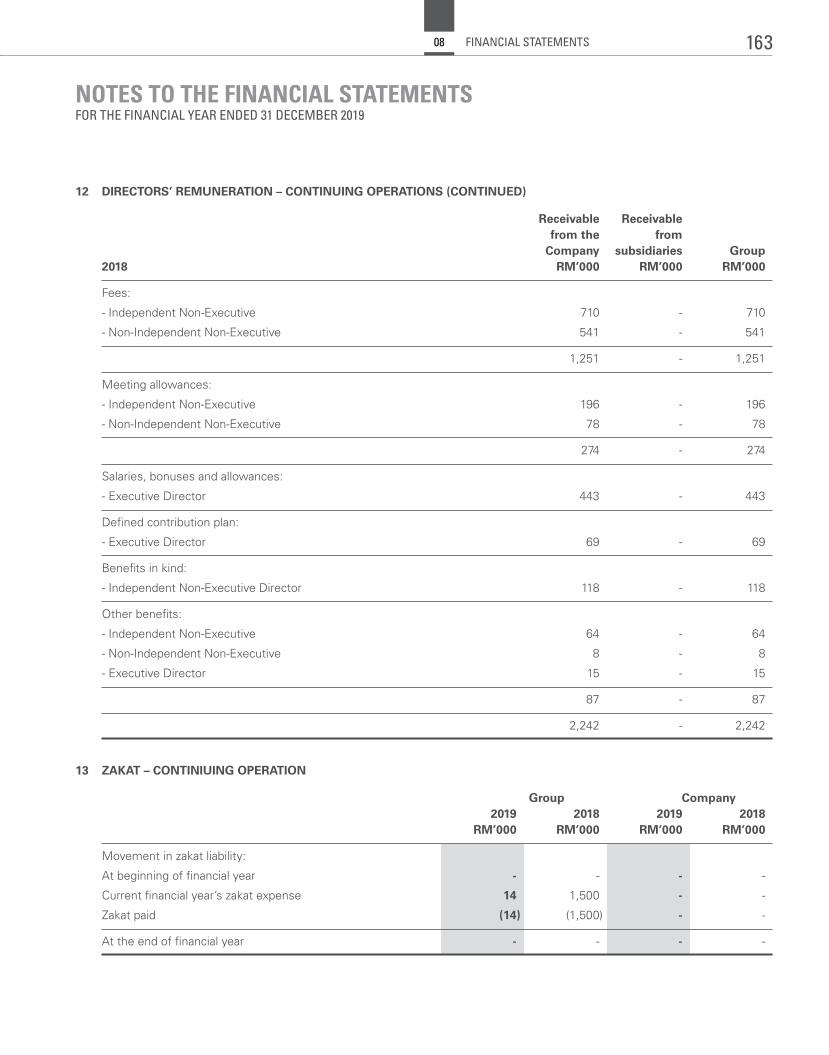
NOTES TO THE FINANCIAL STATEMENTSFOR THE FINANCIAL YEAR ENDED 31 DECEMBER 2019
12 DIRECTORS’ REMUNERATION – CONTINUING OPERATIONS (CONTINUED)
Receivable Receivable from the from Company subsidiaries Group 2018 RM’000 RM’000 RM’000
Fees:
- Independent Non-Executive 710 - 710
- Non-Independent Non-Executive 541 - 541
1,251 - 1,251
Meeting allowances:
- Independent Non-Executive 196 - 196
- Non-Independent Non-Executive 78 - 78
274 - 274
Salaries, bonuses and allowances:
- Executive Director 443 - 443
Defined contribution plan:
- Executive Director 69 - 69
Benefits in kind:
- Independent Non-Executive Director 118 - 118
Other benefits:
- Independent Non-Executive 64 - 64
- Non-Independent Non-Executive 8 - 8
- Executive Director 15 - 15
87 - 87
2,242 - 2,242
13 ZAKAT – CONTINIUING OPERATION
Group Company 2019 2018 2019 2018 RM’000 RM’000 RM’000 RM’000
Movement in zakat liability:
At beginning of financial year - - - -
Current financial year’s zakat expense 14 1,500 - -
Zakat paid (14) (1,500) - -
At the end of financial year - - - -
163FINANCIAL STATEMENTS08
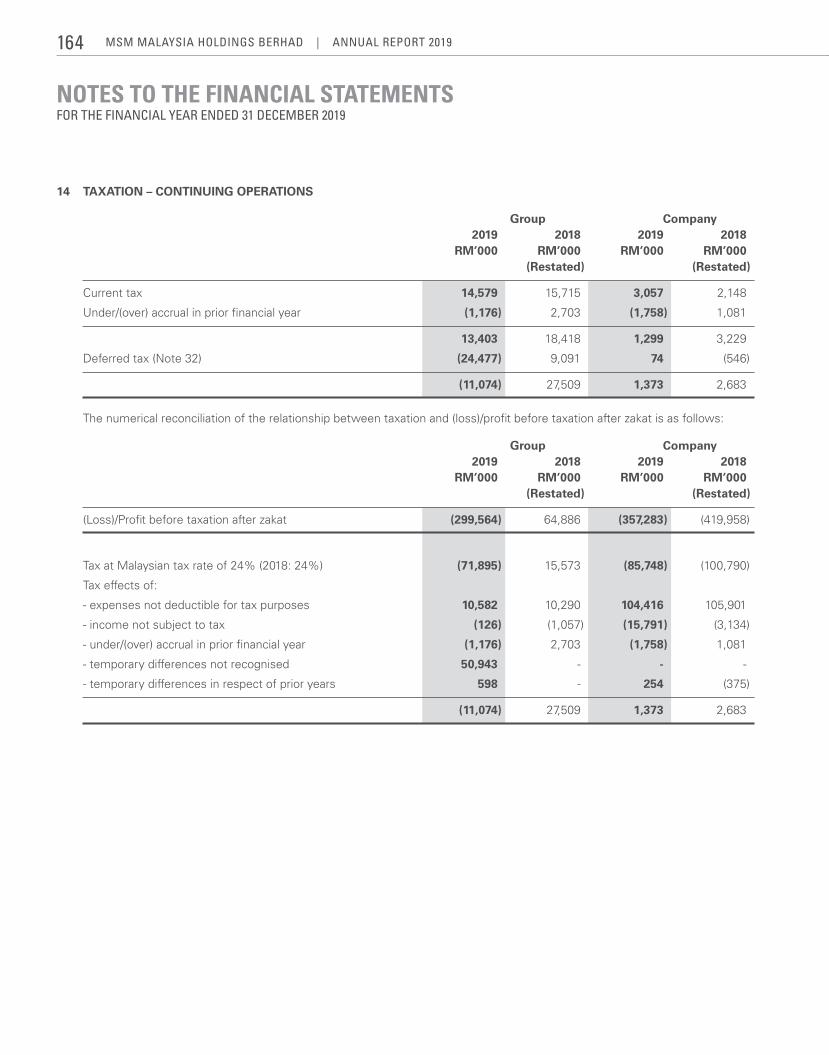
NOTES TO THE FINANCIAL STATEMENTSFOR THE FINANCIAL YEAR ENDED 31 DECEMBER 2019
14 TAXATION – CONTINUING OPERATIONS
Group Company 2019 2018 2019 2018 RM’000 RM’000 RM’000 RM’000 (Restated) (Restated)
Current tax 14,579 15,715 3,057 2,148
Under/(over) accrual in prior financial year (1,176) 2,703 (1,758) 1,081
13,403 18,418 1,299 3,229
Deferred tax (Note 32) (24,477) 9,091 74 (546)
(11,074) 27,509 1,373 2,683
The numerical reconciliation of the relationship between taxation and (loss)/profit before taxation after zakat is as follows:
Group Company 2019 2018 2019 2018 RM’000 RM’000 RM’000 RM’000 (Restated) (Restated)
(Loss)/Profit before taxation after zakat (299,564) 64,886 (357,283) (419,958)
Tax at Malaysian tax rate of 24% (2018: 24%) (71,895) 15,573 (85,748) (100,790)
Tax effects of:
- expenses not deductible for tax purposes 10,582 10,290 104,416 105,901
- income not subject to tax (126) (1,057) (15,791) (3,134)
- under/(over) accrual in prior financial year (1,176) 2,703 (1,758) 1,081
- temporary differences not recognised 50,943 - - -
- temporary differences in respect of prior years 598 - 254 (375)
(11,074) 27,509 1,373 2,683
MSM MalaySia HoldingS BerHad | annual report 2019164
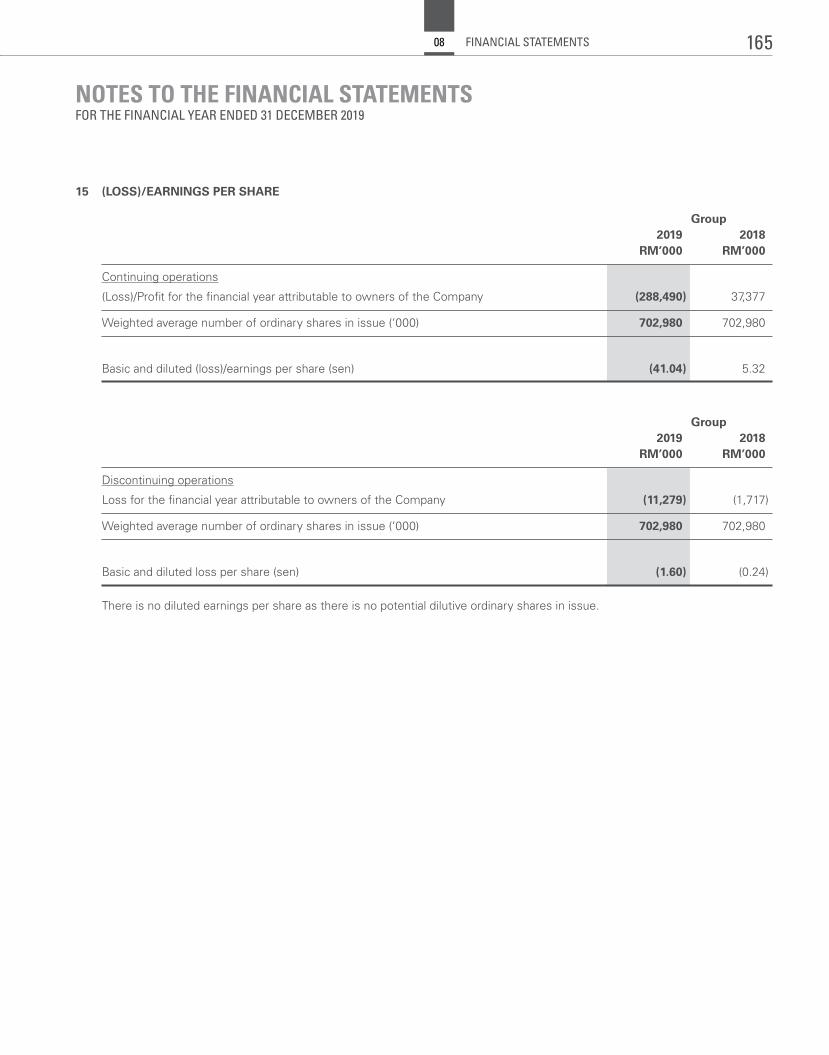
NOTES TO THE FINANCIAL STATEMENTSFOR THE FINANCIAL YEAR ENDED 31 DECEMBER 2019
15 (LOSS)/EARNINGS PER SHARE
Group 2019 2018 RM’000 RM’000
Continuing operations
(Loss)/Profit for the financial year attributable to owners of the Company (288,490) 37,377
Weightedaveragenumberofordinarysharesinissue(‘000) 702,980 702,980
Basic and diluted (loss)/earnings per share (sen) (41.04) 5.32
Group 2019 2018 RM’000 RM’000
Discontinuing operations
Loss for the financial year attributable to owners of the Company (11,279) (1,717)
Weightedaveragenumberofordinarysharesinissue(‘000) 702,980 702,980
Basic and diluted loss per share (sen) (1.60) (0.24)
There is no diluted earnings per share as there is no potential dilutive ordinary shares in issue.
165FINANCIAL STATEMENTS08
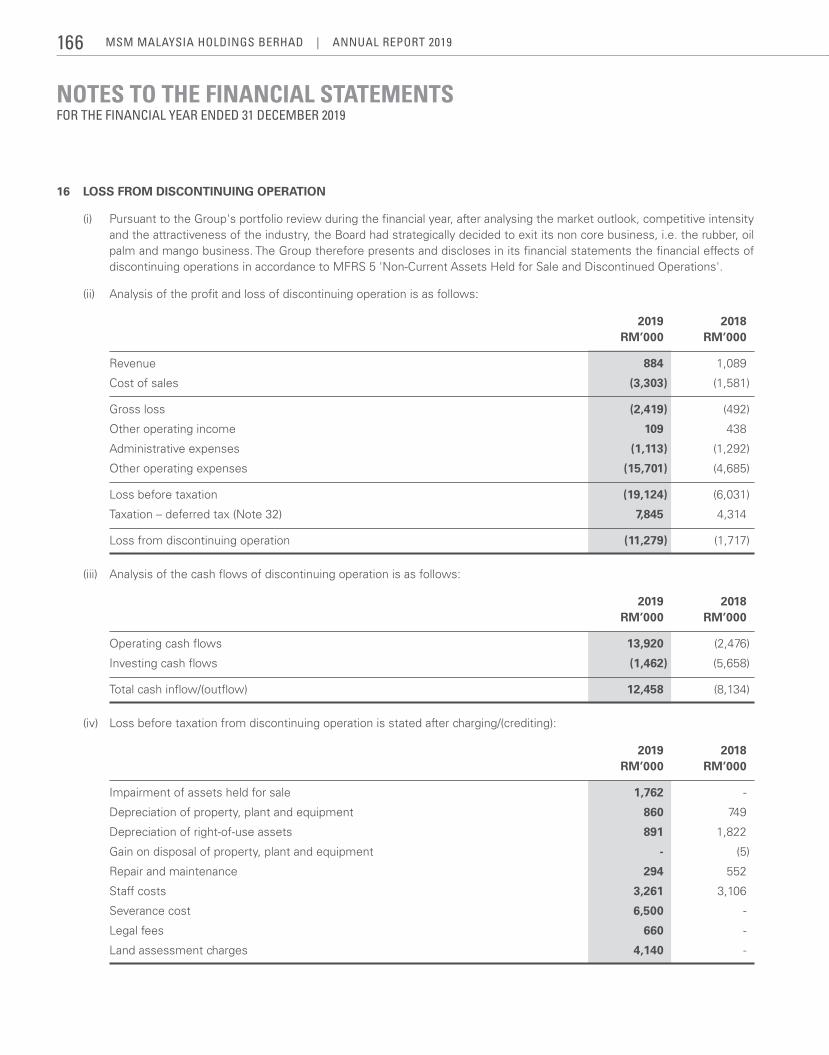
NOTES TO THE FINANCIAL STATEMENTSFOR THE FINANCIAL YEAR ENDED 31 DECEMBER 2019
16 LOSS FROM DISCONTINUING OPERATION
(i) Pursuant to the Group's portfolio review during the financial year, after analysing the market outlook, competitive intensity and the attractiveness of the industry, the Board had strategically decided to exit its non core business, i.e. the rubber, oil palm and mango business. The Group therefore presents and discloses in its financial statements the financial effects of discontinuing operations in accordance to MFRS 5 'Non-Current Assets Held for Sale and Discontinued Operations'.
(ii) Analysis of the profit and loss of discontinuing operation is as follows:
2019 2018 RM’000 RM’000
Revenue 884 1,089
Cost of sales (3,303) (1,581)
Gross loss (2,419) (492)
Other operating income 109 438
Administrative expenses (1,113) (1,292)
Other operating expenses (15,701) (4,685)
Loss before taxation (19,124) (6,031)
Taxation – deferred tax (Note 32) 7,845 4,314
Loss from discontinuing operation (11,279) (1,717)
(iii) Analysis of the cash flows of discontinuing operation is as follows:
2019 2018 RM’000 RM’000
Operating cash flows 13,920 (2,476)
Investing cash flows (1,462) (5,658)
Total cash inflow/(outflow) 12,458 (8,134)
(iv) Loss before taxation from discontinuing operation is stated after charging/(crediting):
2019 2018 RM’000 RM’000
Impairment of assets held for sale 1,762 -
Depreciation of property, plant and equipment 860 749
Depreciation of right-of-use assets 891 1,822
Gain on disposal of property, plant and equipment - (5)
Repair and maintenance 294 552
Staff costs 3,261 3,106
Severance cost 6,500 -
Legal fees 660 -
Land assessment charges 4,140 -
MSM MalaySia HoldingS BerHad | annual report 2019166
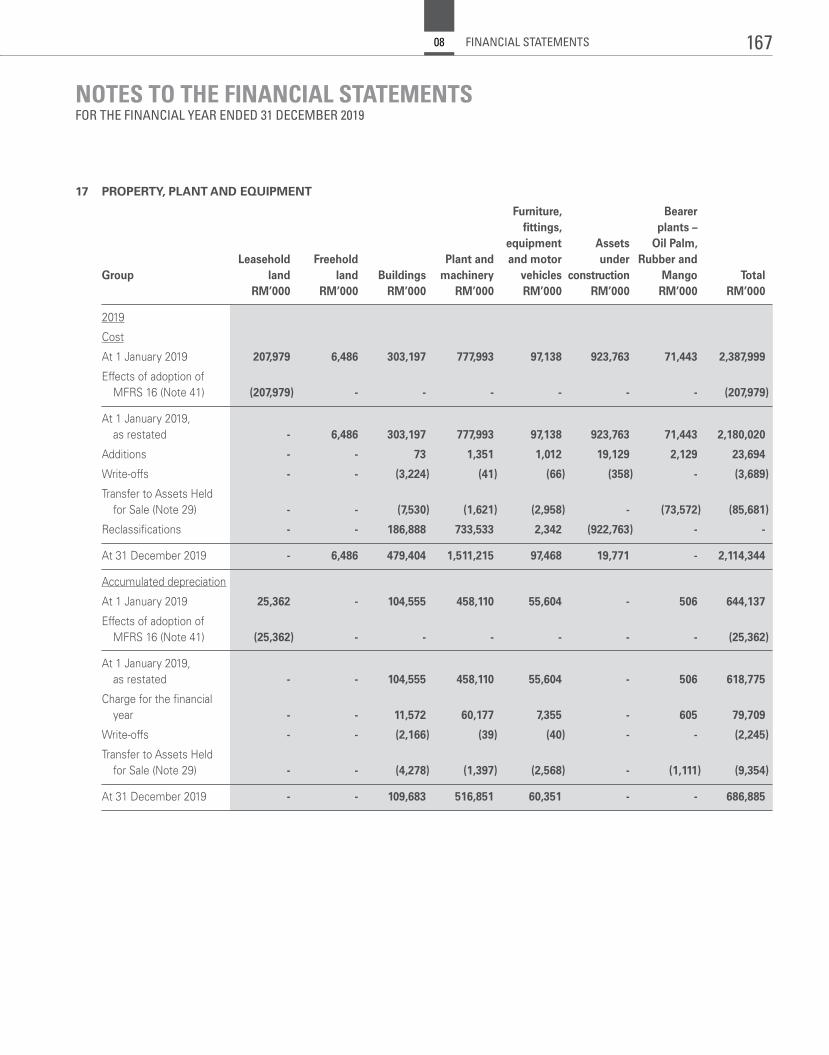
NOTES TO THE FINANCIAL STATEMENTSFOR THE FINANCIAL YEAR ENDED 31 DECEMBER 2019
17 PROPERTY, PLANT AND EQUIPMENT
Furniture, Bearer fittings, plants – equipment Assets Oil Palm, Leasehold Freehold Plant and and motor under Rubber and Group land land Buildings machinery vehicles construction Mango Total RM’000 RM’000 RM’000 RM’000 RM’000 RM’000 RM’000 RM’000
2019
Cost
At 1 January 2019 207,979 6,486 303,197 777,993 97,138 923,763 71,443 2,387,999
Effects of adoption of MFRS 16 (Note 41) (207,979) - - - - - - (207,979)
At 1 January 2019, as restated - 6,486 303,197 777,993 97,138 923,763 71,443 2,180,020
Additions - - 73 1,351 1,012 19,129 2,129 23,694
Write-offs - - (3,224) (41) (66) (358) - (3,689)
Transfer to Assets Held for Sale (Note 29) - - (7,530) (1,621) (2,958) - (73,572) (85,681)
Reclassifications - - 186,888 733,533 2,342 (922,763) - -
At 31 December 2019 - 6,486 479,404 1,511,215 97,468 19,771 - 2,114,344
Accumulated depreciation
At 1 January 2019 25,362 - 104,555 458,110 55,604 - 506 644,137
Effects of adoption of MFRS 16 (Note 41) (25,362) - - - - - - (25,362)
At 1 January 2019, as restated - - 104,555 458,110 55,604 - 506 618,775
Charge for the financial year - - 11,572 60,177 7,355 - 605 79,709
Write-offs - - (2,166) (39) (40) - - (2,245)
Transfer to Assets Held for Sale (Note 29) - - (4,278) (1,397) (2,568) - (1,111) (9,354)
At 31 December 2019 - - 109,683 516,851 60,351 - - 686,885
167FINANCIAL STATEMENTS08
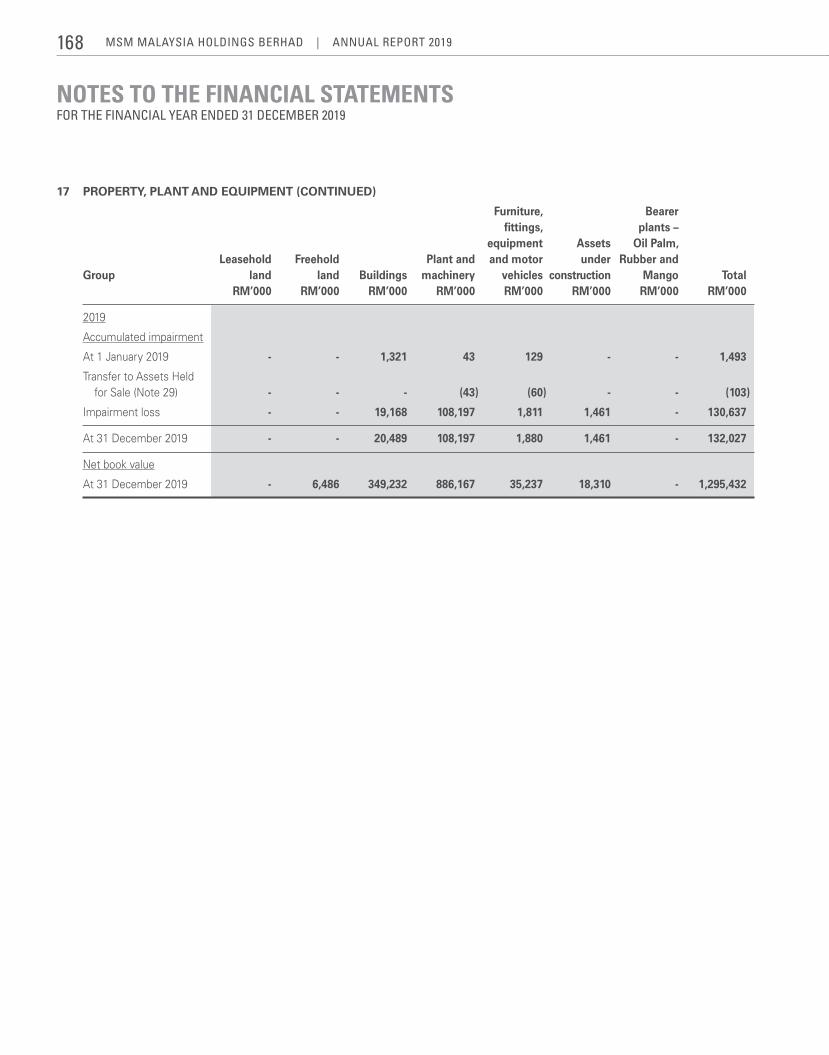
NOTES TO THE FINANCIAL STATEMENTSFOR THE FINANCIAL YEAR ENDED 31 DECEMBER 2019
17 PROPERTY, PLANT AND EQUIPMENT (CONTINUED)
Furniture, Bearer fittings, plants – equipment Assets Oil Palm, Leasehold Freehold Plant and and motor under Rubber and Group land land Buildings machinery vehicles construction Mango Total RM’000 RM’000 RM’000 RM’000 RM’000 RM’000 RM’000 RM’000
2019
Accumulated impairment
At 1 January 2019 - - 1,321 43 129 - - 1,493
Transfer to Assets Held for Sale (Note 29) - - - (43) (60) - - (103)
Impairment loss - - 19,168 108,197 1,811 1,461 - 130,637
At 31 December 2019 - - 20,489 108,197 1,880 1,461 - 132,027
Net book value
At 31 December 2019 - 6,486 349,232 886,167 35,237 18,310 - 1,295,432
MSM MalaySia HoldingS BerHad | annual report 2019168
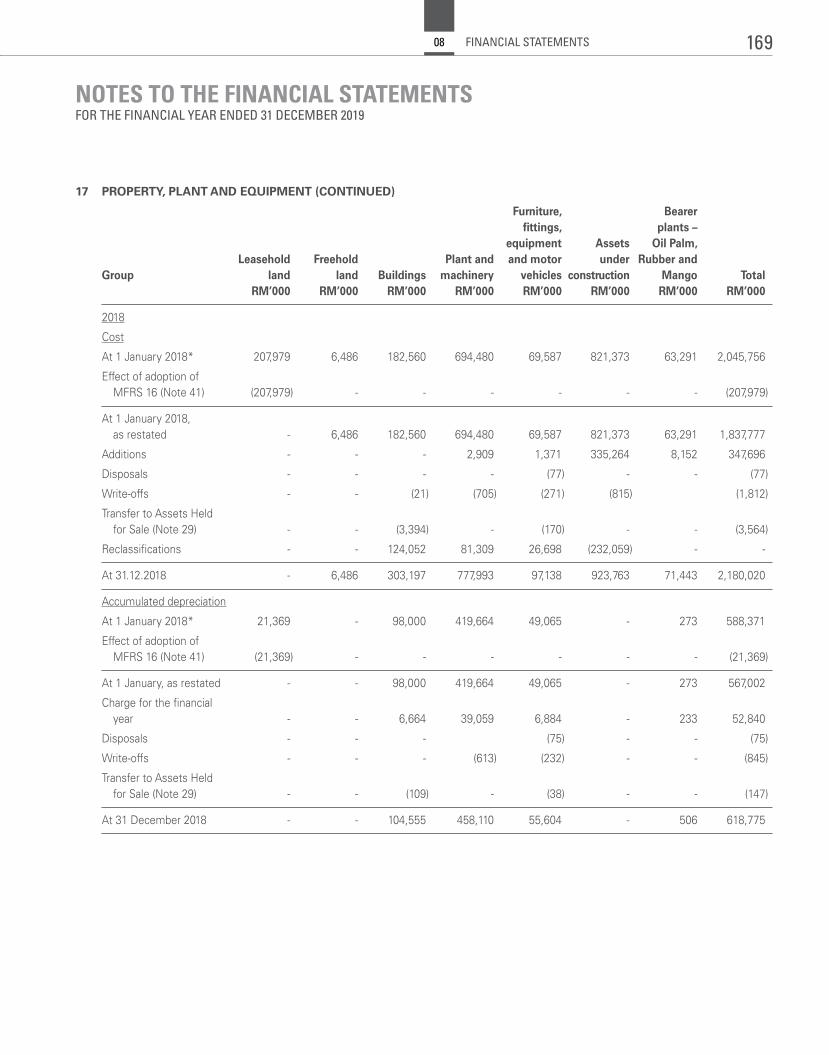
NOTES TO THE FINANCIAL STATEMENTSFOR THE FINANCIAL YEAR ENDED 31 DECEMBER 2019
17 PROPERTY, PLANT AND EQUIPMENT (CONTINUED)
Furniture, Bearer fittings, plants – equipment Assets Oil Palm, Leasehold Freehold Plant and and motor under Rubber and Group land land Buildings machinery vehicles construction Mango Total RM’000 RM’000 RM’000 RM’000 RM’000 RM’000 RM’000 RM’000
2018
Cost
At 1 January 2018* 207,979 6,486 182,560 694,480 69,587 821,373 63,291 2,045,756
Effect of adoption of MFRS 16 (Note 41) (207,979) - - - - - - (207,979)
At 1 January 2018, as restated - 6,486 182,560 694,480 69,587 821,373 63,291 1,837,777
Additions - - - 2,909 1,371 335,264 8,152 347,696
Disposals - - - - (77) - - (77)
Write-offs - - (21) (705) (271) (815) (1,812)
Transfer to Assets Held for Sale (Note 29) - - (3,394) - (170) - - (3,564)
Reclassifications - - 124,052 81,309 26,698 (232,059) - -
At 31.12.2018 - 6,486 303,197 777,993 97,138 923,763 71,443 2,180,020
Accumulated depreciation
At 1 January 2018* 21,369 - 98,000 419,664 49,065 - 273 588,371
Effect of adoption of MFRS 16 (Note 41) (21,369) - - - - - - (21,369)
At 1 January, as restated - - 98,000 419,664 49,065 - 273 567,002
Charge for the financial year - - 6,664 39,059 6,884 - 233 52,840
Disposals - - - (75) - - (75)
Write-offs - - - (613) (232) - - (845)
Transfer to Assets Held for Sale (Note 29) - - (109) - (38) - - (147)
At 31 December 2018 - - 104,555 458,110 55,604 - 506 618,775
169FINANCIAL STATEMENTS08
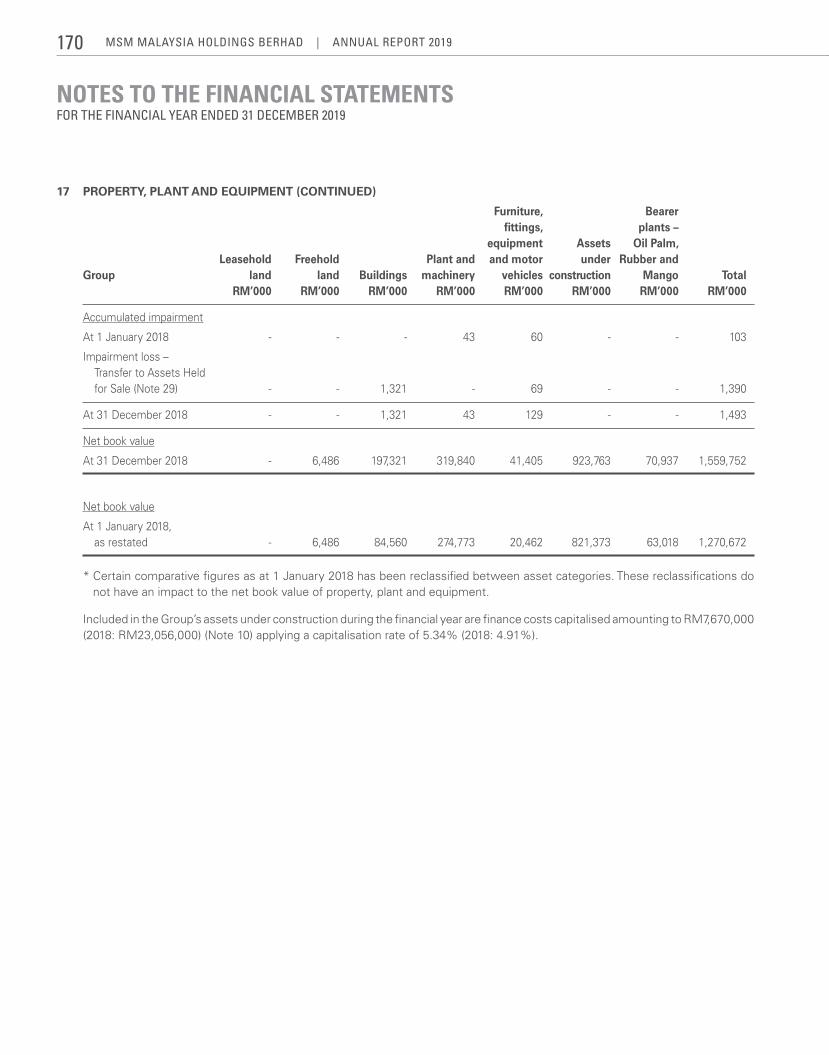
NOTES TO THE FINANCIAL STATEMENTSFOR THE FINANCIAL YEAR ENDED 31 DECEMBER 2019
17 PROPERTY, PLANT AND EQUIPMENT (CONTINUED)
Furniture, Bearer fittings, plants – equipment Assets Oil Palm, Leasehold Freehold Plant and and motor under Rubber and Group land land Buildings machinery vehicles construction Mango Total RM’000 RM’000 RM’000 RM’000 RM’000 RM’000 RM’000 RM’000
Accumulated impairment
At 1 January 2018 - - - 43 60 - - 103
Impairment loss – Transfer to Assets Held for Sale (Note 29) - - 1,321 - 69 - - 1,390
At 31 December 2018 - - 1,321 43 129 - - 1,493
Net book value
At 31 December 2018 - 6,486 197,321 319,840 41,405 923,763 70,937 1,559,752
Net book value
At 1 January 2018, as restated - 6,486 84,560 274,773 20,462 821,373 63,018 1,270,672
* Certain comparative figures as at 1 January 2018 has been reclassified between asset categories. These reclassifications do not have an impact to the net book value of property, plant and equipment.
Included in the Group’s assets under construction during the financial year are finance costs capitalised amounting to RM7,670,000 (2018: RM23,056,000) (Note 10) applying a capitalisation rate of 5.34% (2018: 4.91%).
MSM MalaySia HoldingS BerHad | annual report 2019170
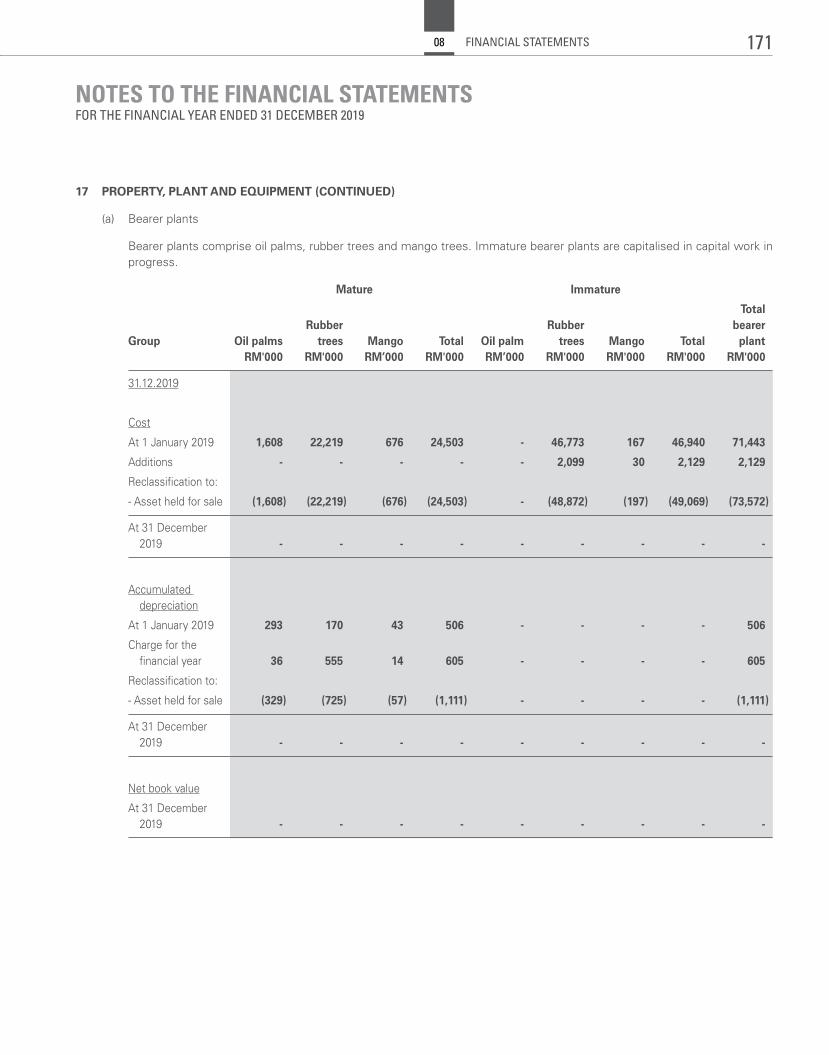
NOTES TO THE FINANCIAL STATEMENTSFOR THE FINANCIAL YEAR ENDED 31 DECEMBER 2019
17 PROPERTY, PLANT AND EQUIPMENT (CONTINUED)
(a) Bearer plants
Bearer plants comprise oil palms, rubber trees and mango trees. Immature bearer plants are capitalised in capital work in progress.
Mature Immature
Total Rubber Rubber bearer Group Oil palms trees Mango Total Oil palm trees Mango Total plant RM'000 RM'000 RM’000 RM'000 RM’000 RM'000 RM'000 RM'000 RM'000
31.12.2019
Cost
At 1 January 2019 1,608 22,219 676 24,503 - 46,773 167 46,940 71,443
Additions - - - - - 2,099 30 2,129 2,129
Reclassification to:
- Asset held for sale (1,608) (22,219) (676) (24,503) - (48,872) (197) (49,069) (73,572)
At 31 December 2019 - - - - - - - - -
Accumulated depreciation
At 1 January 2019 293 170 43 506 - - - - 506
Charge for the financial year 36 555 14 605 - - - - 605
Reclassification to:
- Asset held for sale (329) (725) (57) (1,111) - - - - (1,111)
At 31 December 2019 - - - - - - - - -
Net book value
At 31 December 2019 - - - - - - - - -
171FINANCIAL STATEMENTS08
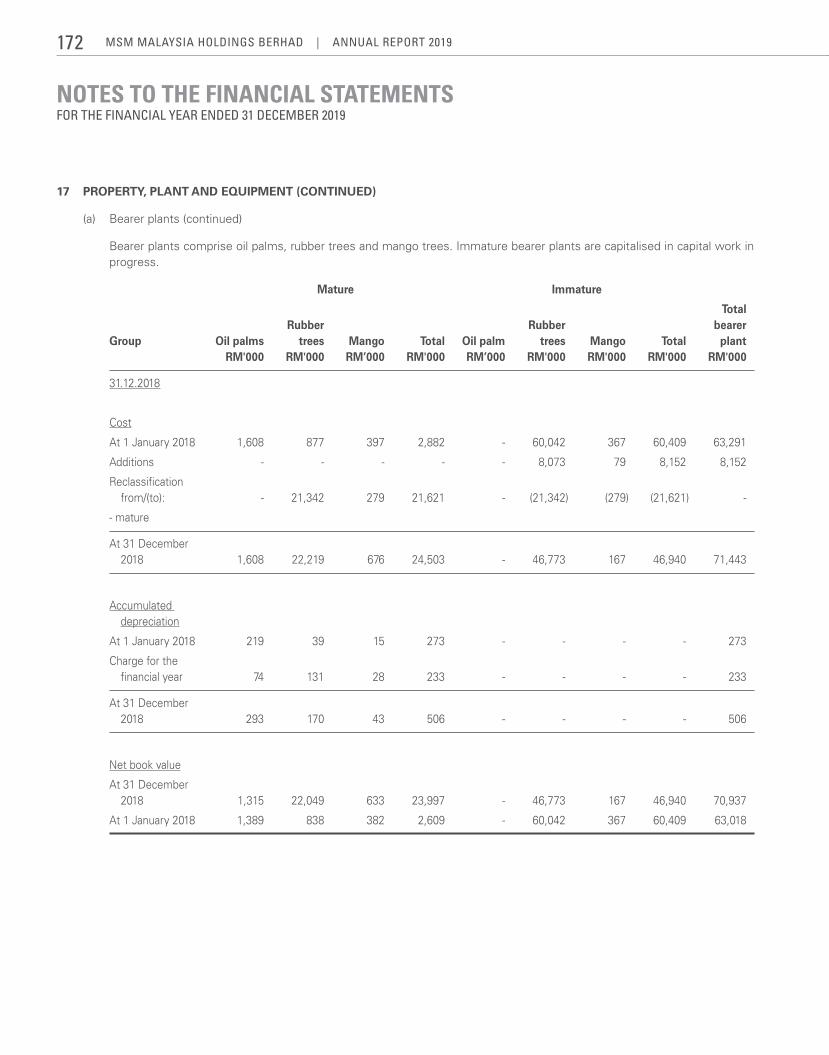
NOTES TO THE FINANCIAL STATEMENTSFOR THE FINANCIAL YEAR ENDED 31 DECEMBER 2019
17 PROPERTY, PLANT AND EQUIPMENT (CONTINUED)
(a) Bearer plants (continued)
Bearer plants comprise oil palms, rubber trees and mango trees. Immature bearer plants are capitalised in capital work in progress.
Mature Immature
Total Rubber Rubber bearer Group Oil palms trees Mango Total Oil palm trees Mango Total plant RM'000 RM'000 RM’000 RM'000 RM’000 RM'000 RM'000 RM'000 RM'000
31.12.2018
Cost
At 1 January 2018 1,608 877 397 2,882 - 60,042 367 60,409 63,291
Additions - - - - - 8,073 79 8,152 8,152
Reclassification from/(to): - 21,342 279 21,621 - (21,342) (279) (21,621) -
- mature
At 31 December 2018 1,608 22,219 676 24,503 - 46,773 167 46,940 71,443
Accumulated depreciation
At 1 January 2018 219 39 15 273 - - - - 273
Charge for the financial year 74 131 28 233 - - - - 233
At 31 December 2018 293 170 43 506 - - - - 506
Net book value
At 31 December 2018 1,315 22,049 633 23,997 - 46,773 167 46,940 70,937
At 1 January 2018 1,389 838 382 2,609 - 60,042 367 60,409 63,018
MSM MalaySia HoldingS BerHad | annual report 2019172
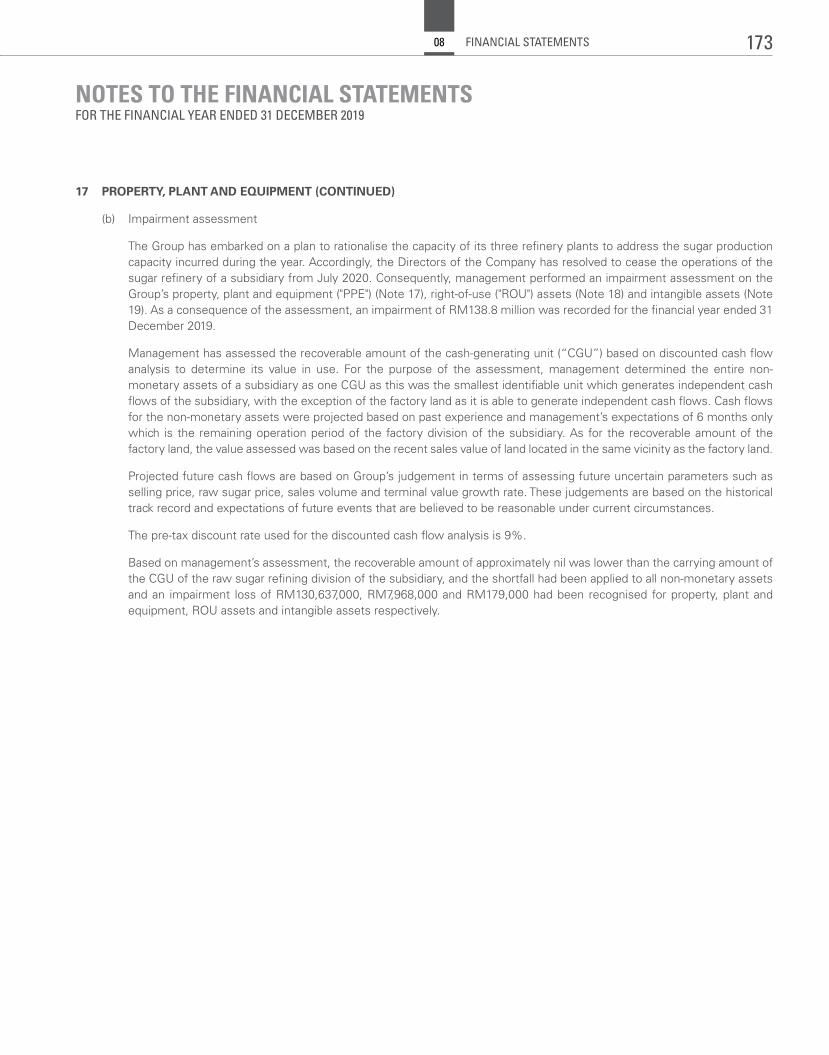
NOTES TO THE FINANCIAL STATEMENTSFOR THE FINANCIAL YEAR ENDED 31 DECEMBER 2019
17 PROPERTY, PLANT AND EQUIPMENT (CONTINUED)
(b) Impairment assessment
The Group has embarked on a plan to rationalise the capacity of its three refinery plants to address the sugar production capacity incurred during the year. Accordingly, the Directors of the Company has resolved to cease the operations of the sugar refinery of a subsidiary from July 2020. Consequently, management performed an impairment assessment on the Group’s property, plant and equipment ("PPE") (Note 17), right-of-use ("ROU") assets (Note 18) and intangible assets (Note 19). As a consequence of the assessment, an impairment of RM138.8 million was recorded for the financial year ended 31 December 2019.
Management has assessed the recoverable amount of the cash-generating unit (“CGU”) based on discounted cash flow analysis to determine its value in use. For the purpose of the assessment, management determined the entire non-monetary assets of a subsidiary as one CGU as this was the smallest identifiable unit which generates independent cash flows of the subsidiary, with the exception of the factory land as it is able to generate independent cash flows. Cash flows for the non-monetary assets were projected based on past experience and management’s expectations of 6 months only which is the remaining operation period of the factory division of the subsidiary. As for the recoverable amount of the factory land, the value assessed was based on the recent sales value of land located in the same vicinity as the factory land.
Projected future cash flows are based on Group’s judgement in terms of assessing future uncertain parameters such as selling price, raw sugar price, sales volume and terminal value growth rate. These judgements are based on the historical track record and expectations of future events that are believed to be reasonable under current circumstances.
The pre-tax discount rate used for the discounted cash flow analysis is 9%.
Based on management’s assessment, the recoverable amount of approximately nil was lower than the carrying amount of the CGU of the raw sugar refining division of the subsidiary, and the shortfall had been applied to all non-monetary assets and an impairment loss of RM130,637,000, RM7,968,000 and RM179,000 had been recognised for property, plant and equipment, ROU assets and intangible assets respectively.
173FINANCIAL STATEMENTS08
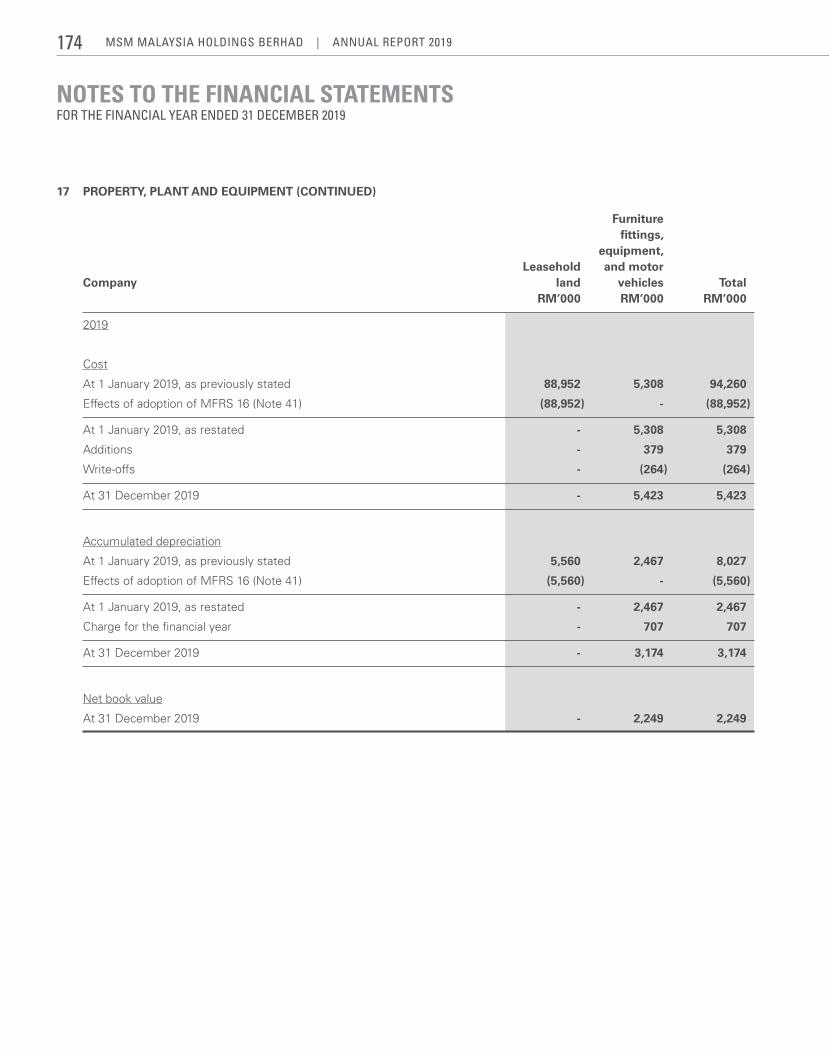
NOTES TO THE FINANCIAL STATEMENTSFOR THE FINANCIAL YEAR ENDED 31 DECEMBER 2019
17 PROPERTY, PLANT AND EQUIPMENT (CONTINUED)
Furniture fittings, equipment, Leasehold and motor Company land vehicles Total RM’000 RM’000 RM’000
2019
Cost
At 1 January 2019, as previously stated 88,952 5,308 94,260
Effects of adoption of MFRS 16 (Note 41) (88,952) - (88,952)
At 1 January 2019, as restated - 5,308 5,308
Additions - 379 379
Write-offs - (264) (264)
At 31 December 2019 - 5,423 5,423
Accumulated depreciation
At 1 January 2019, as previously stated 5,560 2,467 8,027
Effects of adoption of MFRS 16 (Note 41) (5,560) - (5,560)
At 1 January 2019, as restated - 2,467 2,467
Charge for the financial year - 707 707
At 31 December 2019 - 3,174 3,174
Net book value
At 31 December 2019 - 2,249 2,249
MSM MalaySia HoldingS BerHad | annual report 2019174
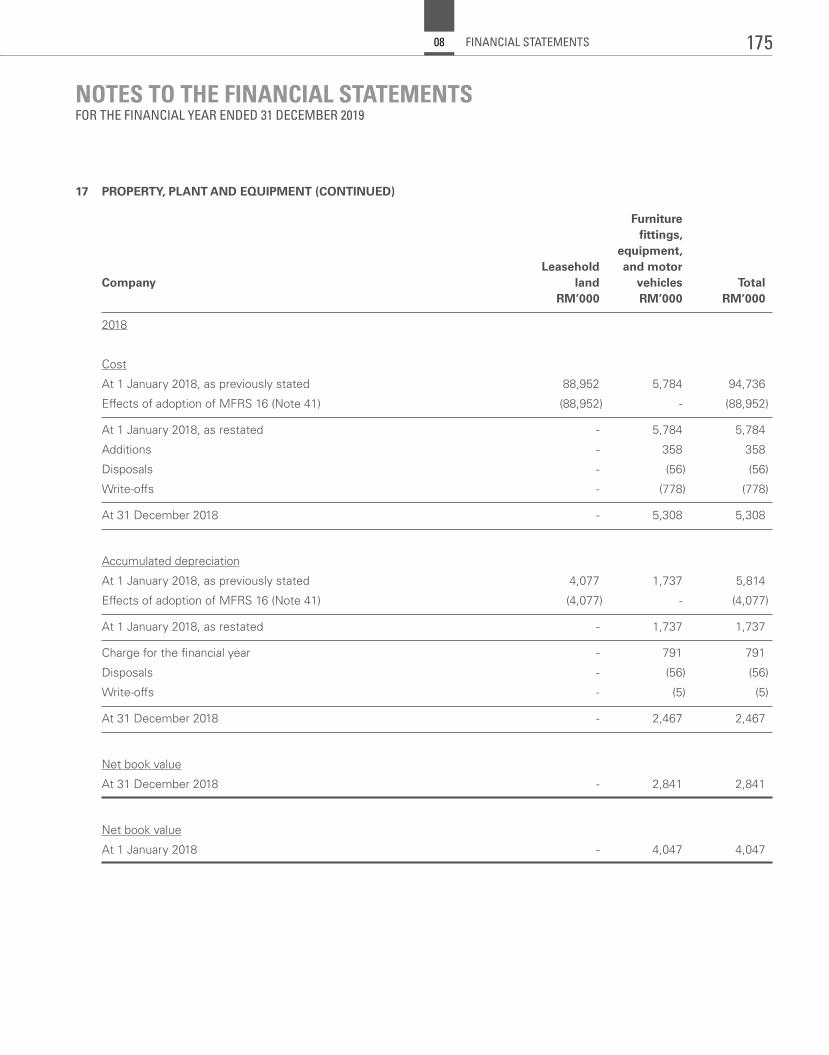
NOTES TO THE FINANCIAL STATEMENTSFOR THE FINANCIAL YEAR ENDED 31 DECEMBER 2019
17 PROPERTY, PLANT AND EQUIPMENT (CONTINUED)
Furniture fittings, equipment, Leasehold and motor Company land vehicles Total RM’000 RM’000 RM’000
2018
Cost
At 1 January 2018, as previously stated 88,952 5,784 94,736
Effects of adoption of MFRS 16 (Note 41) (88,952) - (88,952)
At 1 January 2018, as restated - 5,784 5,784
Additions - 358 358
Disposals - (56) (56)
Write-offs - (778) (778)
At 31 December 2018 - 5,308 5,308
Accumulated depreciation
At 1 January 2018, as previously stated 4,077 1,737 5,814
Effects of adoption of MFRS 16 (Note 41) (4,077) - (4,077)
At 1 January 2018, as restated - 1,737 1,737
Charge for the financial year - 791 791
Disposals - (56) (56)
Write-offs - (5) (5)
At 31 December 2018 - 2,467 2,467
Net book value
At 31 December 2018 - 2,841 2,841
Net book value
At 1 January 2018 - 4,047 4,047
175FINANCIAL STATEMENTS08
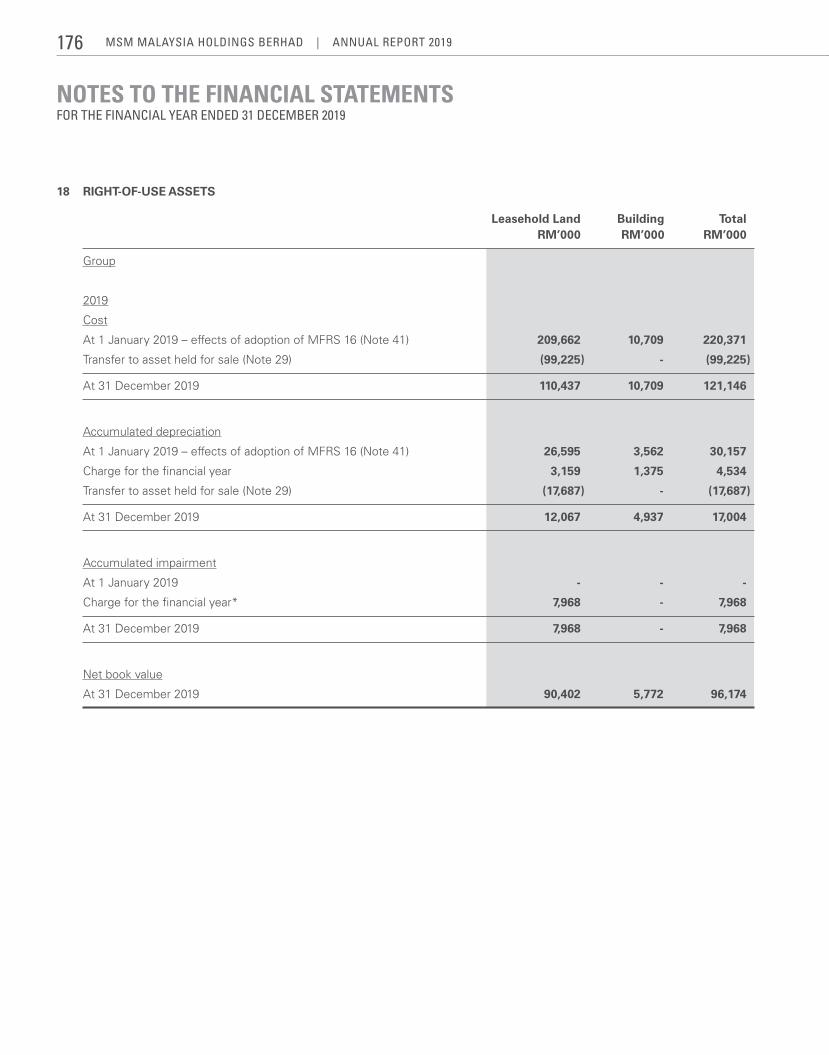
NOTES TO THE FINANCIAL STATEMENTSFOR THE FINANCIAL YEAR ENDED 31 DECEMBER 2019
18 RIGHT-OF-USE ASSETS
Leasehold Land Building Total RM’000 RM’000 RM’000
Group
2019
Cost
At 1 January 2019 – effects of adoption of MFRS 16 (Note 41) 209,662 10,709 220,371
Transfer to asset held for sale (Note 29) (99,225) - (99,225)
At 31 December 2019 110,437 10,709 121,146
Accumulated depreciation
At 1 January 2019 – effects of adoption of MFRS 16 (Note 41) 26,595 3,562 30,157
Charge for the financial year 3,159 1,375 4,534
Transfer to asset held for sale (Note 29) (17,687) - (17,687)
At 31 December 2019 12,067 4,937 17,004
Accumulated impairment
At 1 January 2019 - - -
Charge for the financial year* 7,968 - 7,968
At 31 December 2019 7,968 - 7,968
Net book value
At 31 December 2019 90,402 5,772 96,174
MSM MalaySia HoldingS BerHad | annual report 2019176
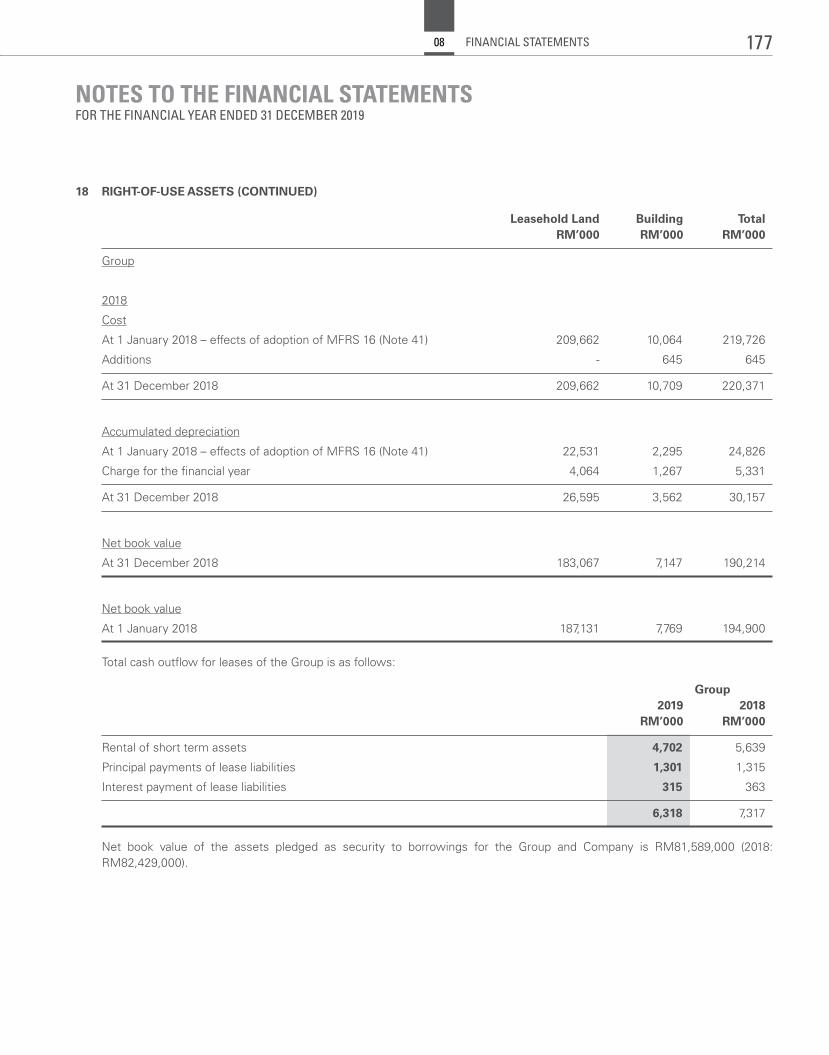
NOTES TO THE FINANCIAL STATEMENTSFOR THE FINANCIAL YEAR ENDED 31 DECEMBER 2019
18 RIGHT-OF-USE ASSETS (CONTINUED)
Leasehold Land Building Total RM’000 RM’000 RM’000
Group
2018
Cost
At 1 January 2018 – effects of adoption of MFRS 16 (Note 41) 209,662 10,064 219,726
Additions - 645 645
At 31 December 2018 209,662 10,709 220,371
Accumulated depreciation
At 1 January 2018 – effects of adoption of MFRS 16 (Note 41) 22,531 2,295 24,826
Charge for the financial year 4,064 1,267 5,331
At 31 December 2018 26,595 3,562 30,157
Net book value
At 31 December 2018 183,067 7,147 190,214
Net book value
At 1 January 2018 187,131 7,769 194,900
Total cash outflow for leases of the Group is as follows:
Group 2019 2018 RM’000 RM’000
Rental of short term assets 4,702 5,639
Principal payments of lease liabilities 1,301 1,315
Interest payment of lease liabilities 315 363
6,318 7,317
Net book value of the assets pledged as security to borrowings for the Group and Company is RM81,589,000 (2018: RM82,429,000).
177FINANCIAL STATEMENTS08
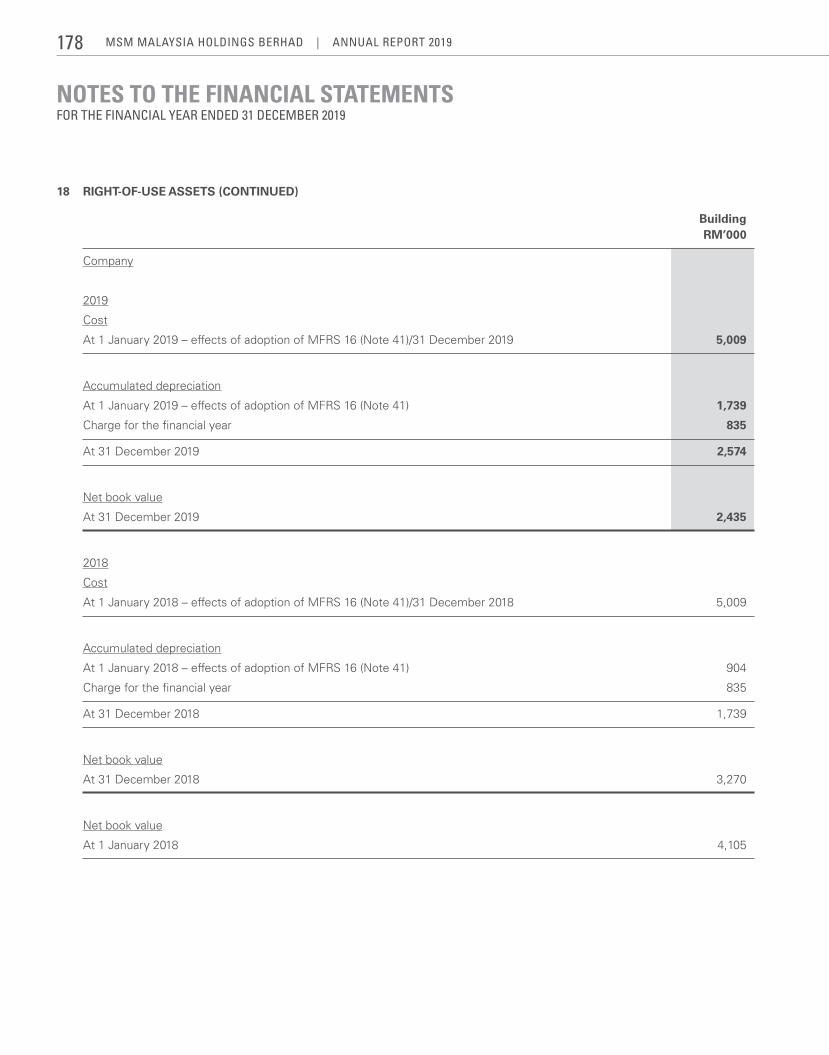
NOTES TO THE FINANCIAL STATEMENTSFOR THE FINANCIAL YEAR ENDED 31 DECEMBER 2019
18 RIGHT-OF-USE ASSETS (CONTINUED)
Building RM’000
Company
2019
Cost
At 1 January 2019 – effects of adoption of MFRS 16 (Note 41)/31 December 2019 5,009
Accumulated depreciation
At 1 January 2019 – effects of adoption of MFRS 16 (Note 41) 1,739
Charge for the financial year 835
At 31 December 2019 2,574
Net book value
At 31 December 2019 2,435
2018
Cost
At 1 January 2018 – effects of adoption of MFRS 16 (Note 41)/31 December 2018 5,009
Accumulated depreciation
At 1 January 2018 – effects of adoption of MFRS 16 (Note 41) 904
Charge for the financial year 835
At 31 December 2018 1,739
Net book value
At 31 December 2018 3,270
Net book value
At 1 January 2018 4,105
MSM MalaySia HoldingS BerHad | annual report 2019178
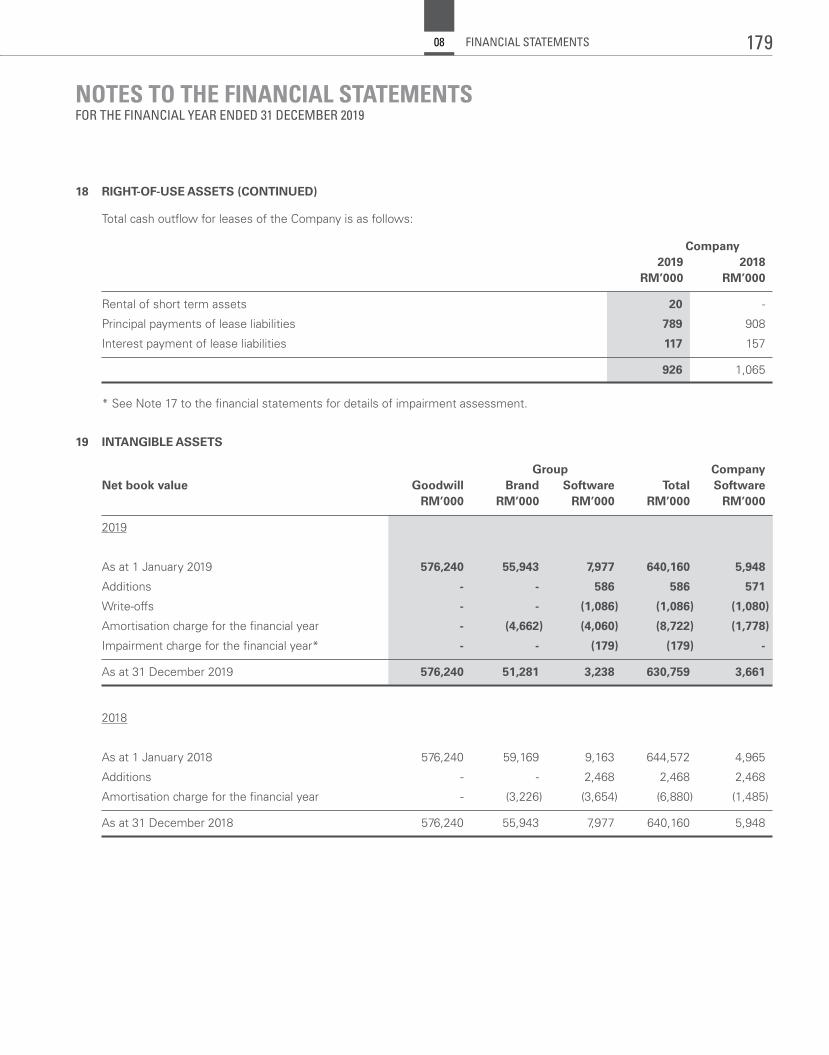
NOTES TO THE FINANCIAL STATEMENTSFOR THE FINANCIAL YEAR ENDED 31 DECEMBER 2019
18 RIGHT-OF-USE ASSETS (CONTINUED)
Total cash outflow for leases of the Company is as follows:
Company 2019 2018 RM’000 RM’000
Rental of short term assets 20 -
Principal payments of lease liabilities 789 908
Interest payment of lease liabilities 117 157
926 1,065
* See Note 17 to the financial statements for details of impairment assessment.
19 INTANGIBLE ASSETS
Group CompanyNet book value Goodwill Brand Software Total Software RM’000 RM’000 RM’000 RM’000 RM’000
2019
As at 1 January 2019 576,240 55,943 7,977 640,160 5,948
Additions - - 586 586 571
Write-offs - - (1,086) (1,086) (1,080)
Amortisation charge for the financial year - (4,662) (4,060) (8,722) (1,778)
Impairment charge for the financial year* - - (179) (179) -
As at 31 December 2019 576,240 51,281 3,238 630,759 3,661
2018
As at 1 January 2018 576,240 59,169 9,163 644,572 4,965
Additions - - 2,468 2,468 2,468
Amortisation charge for the financial year - (3,226) (3,654) (6,880) (1,485)
As at 31 December 2018 576,240 55,943 7,977 640,160 5,948
179FINANCIAL STATEMENTS08
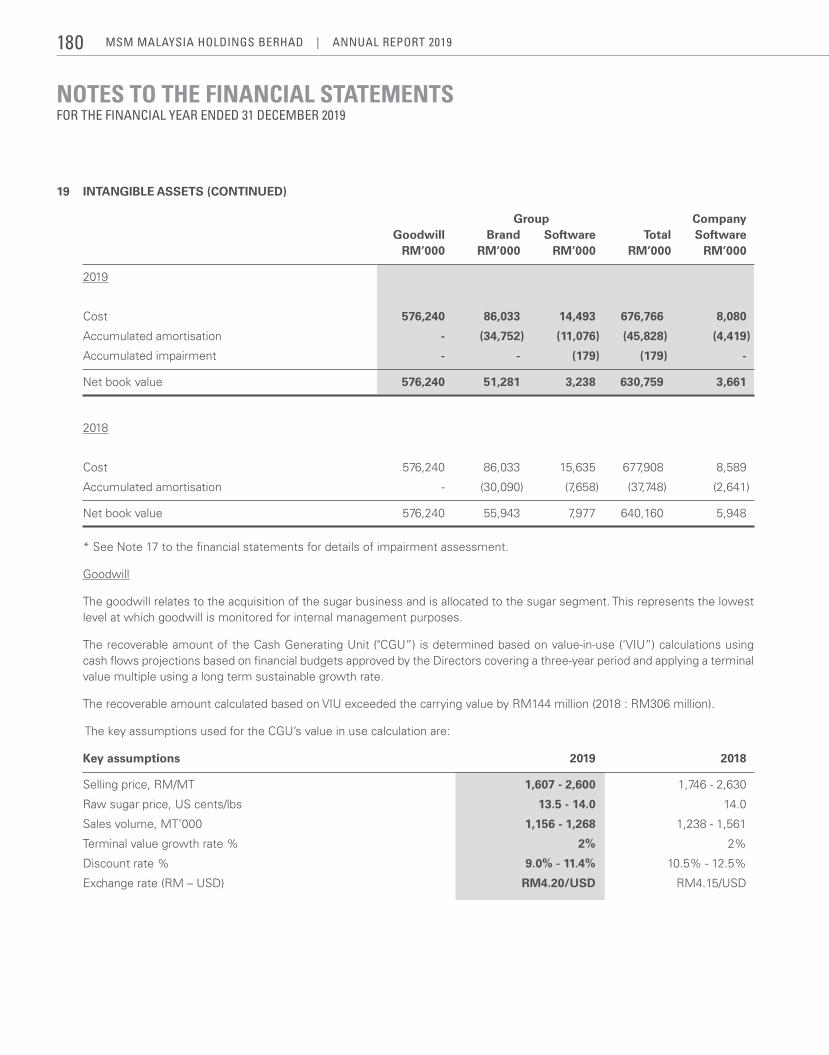
NOTES TO THE FINANCIAL STATEMENTSFOR THE FINANCIAL YEAR ENDED 31 DECEMBER 2019
19 INTANGIBLE ASSETS (CONTINUED)
Group Company Goodwill Brand Software Total Software RM’000 RM’000 RM’000 RM’000 RM’000
2019
Cost 576,240 86,033 14,493 676,766 8,080
Accumulated amortisation - (34,752) (11,076) (45,828) (4,419)
Accumulated impairment - - (179) (179) -
Net book value 576,240 51,281 3,238 630,759 3,661
2018
Cost 576,240 86,033 15,635 677,908 8,589
Accumulated amortisation - (30,090) (7,658) (37,748) (2,641)
Net book value 576,240 55,943 7,977 640,160 5,948
* See Note 17 to the financial statements for details of impairment assessment.
Goodwill
The goodwill relates to the acquisition of the sugar business and is allocated to the sugar segment. This represents the lowest level at which goodwill is monitored for internal management purposes.
TherecoverableamountoftheCashGeneratingUnit("CGU”)isdeterminedbasedonvalue-in-use(‘VIU”)calculationsusingcash flows projections based on financial budgets approved by the Directors covering a three-year period and applying a terminal value multiple using a long term sustainable growth rate.
The recoverable amount calculated based on VIU exceeded the carrying value by RM144 million (2018 : RM306 million).
The key assumptions used for the CGU’s value in use calculation are:
Key assumptions 2019 2018
Selling price, RM/MT 1,607 - 2,600 1,746 - 2,630
Raw sugar price, US cents/lbs 13.5 - 14.0 14.0
Sales volume, MT’000 1,156 - 1,268 1,238 - 1,561
Terminal value growth rate % 2% 2%
Discount rate % 9.0% - 11.4% 10.5% - 12.5%
Exchange rate (RM – USD) RM4.20/USD RM4.15/USD
MSM MalaySia HoldingS BerHad | annual report 2019180
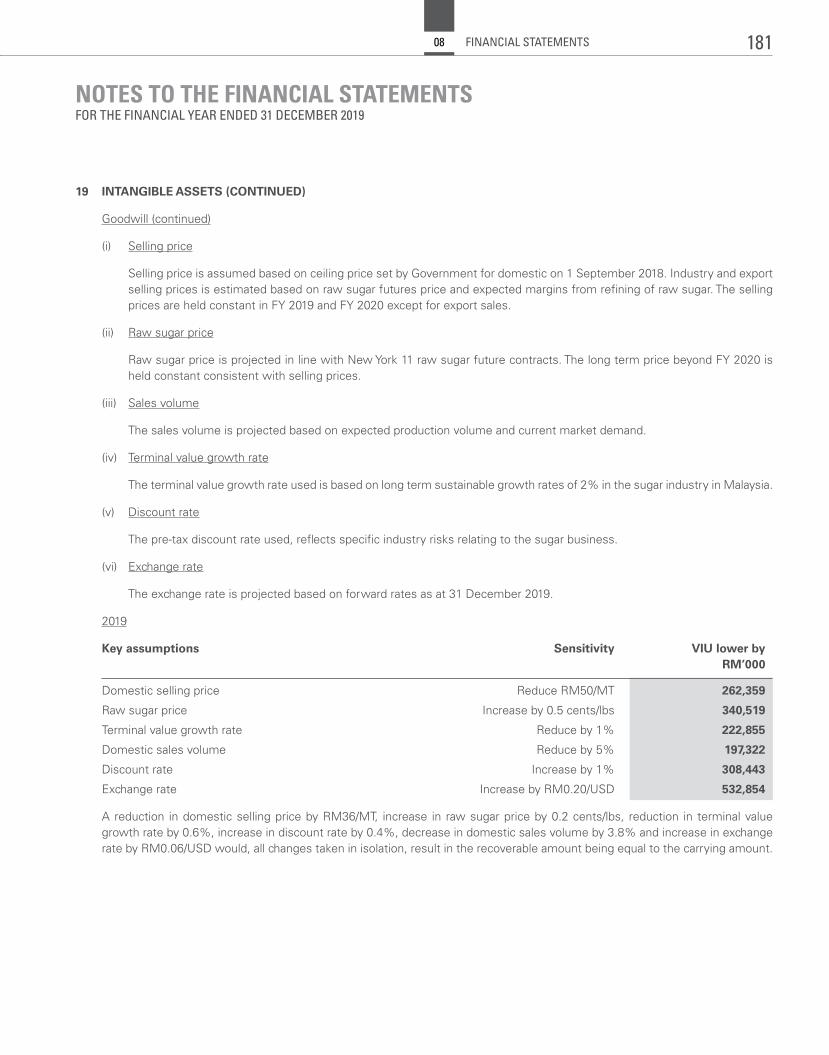
NOTES TO THE FINANCIAL STATEMENTSFOR THE FINANCIAL YEAR ENDED 31 DECEMBER 2019
19 INTANGIBLE ASSETS (CONTINUED)
Goodwill (continued)
(i) Selling price
Selling price is assumed based on ceiling price set by Government for domestic on 1 September 2018. Industry and export selling prices is estimated based on raw sugar futures price and expected margins from refining of raw sugar. The selling prices are held constant in FY 2019 and FY 2020 except for export sales.
(ii) Raw sugar price
Raw sugar price is projected in line with New York 11 raw sugar future contracts. The long term price beyond FY 2020 is held constant consistent with selling prices.
(iii) Sales volume
The sales volume is projected based on expected production volume and current market demand.
(iv) Terminal value growth rate
The terminal value growth rate used is based on long term sustainable growth rates of 2% in the sugar industry in Malaysia.
(v) Discount rate
The pre-tax discount rate used, reflects specific industry risks relating to the sugar business.
(vi) Exchange rate
The exchange rate is projected based on forward rates as at 31 December 2019.
2019
Key assumptions Sensitivity VIU lower by RM’000
Domestic selling price Reduce RM50/MT 262,359
Raw sugar price Increase by 0.5 cents/lbs 340,519
Terminal value growth rate Reduce by 1% 222,855
Domestic sales volume Reduce by 5% 197,322
Discount rate Increase by 1% 308,443
Exchange rate Increase by RM0.20/USD 532,854
A reduction in domestic selling price by RM36/MT, increase in raw sugar price by 0.2 cents/lbs, reduction in terminal value growth rate by 0.6%, increase in discount rate by 0.4%, decrease in domestic sales volume by 3.8% and increase in exchange rate by RM0.06/USD would, all changes taken in isolation, result in the recoverable amount being equal to the carrying amount.
181FINANCIAL STATEMENTS08
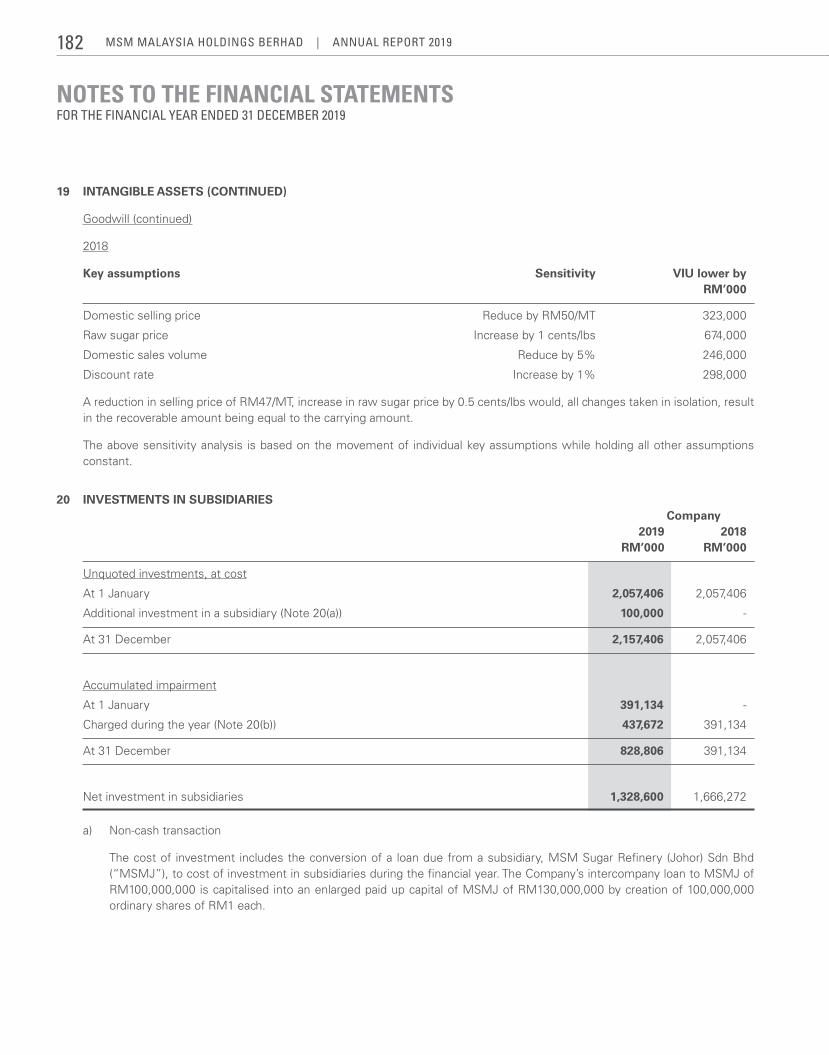
NOTES TO THE FINANCIAL STATEMENTSFOR THE FINANCIAL YEAR ENDED 31 DECEMBER 2019
19 INTANGIBLE ASSETS (CONTINUED)
Goodwill (continued)
2018
Key assumptions Sensitivity VIU lower by RM’000
Domestic selling price Reduce by RM50/MT 323,000
Raw sugar price Increase by 1 cents/lbs 674,000
Domestic sales volume Reduce by 5% 246,000
Discount rate Increase by 1% 298,000
A reduction in selling price of RM47/MT, increase in raw sugar price by 0.5 cents/lbs would, all changes taken in isolation, result in the recoverable amount being equal to the carrying amount.
The above sensitivity analysis is based on the movement of individual key assumptions while holding all other assumptions constant.
20 INVESTMENTS IN SUBSIDIARIES Company 2019 2018 RM’000 RM’000
Unquoted investments, at cost
At 1 January 2,057,406 2,057,406
Additional investment in a subsidiary (Note 20(a)) 100,000 -
At 31 December 2,157,406 2,057,406
Accumulated impairment
At 1 January 391,134 -
Charged during the year (Note 20(b)) 437,672 391,134
At 31 December 828,806 391,134
Net investment in subsidiaries 1,328,600 1,666,272
a) Non-cash transaction
The cost of investment includes the conversion of a loan due from a subsidiary, MSM Sugar Refinery (Johor) Sdn Bhd (“MSMJ”), to cost of investment in subsidiaries during the financial year. The Company’s intercompany loan to MSMJ of RM100,000,000 is capitalised into an enlarged paid up capital of MSMJ of RM130,000,000 by creation of 100,000,000 ordinary shares of RM1 each.
MSM MalaySia HoldingS BerHad | annual report 2019182
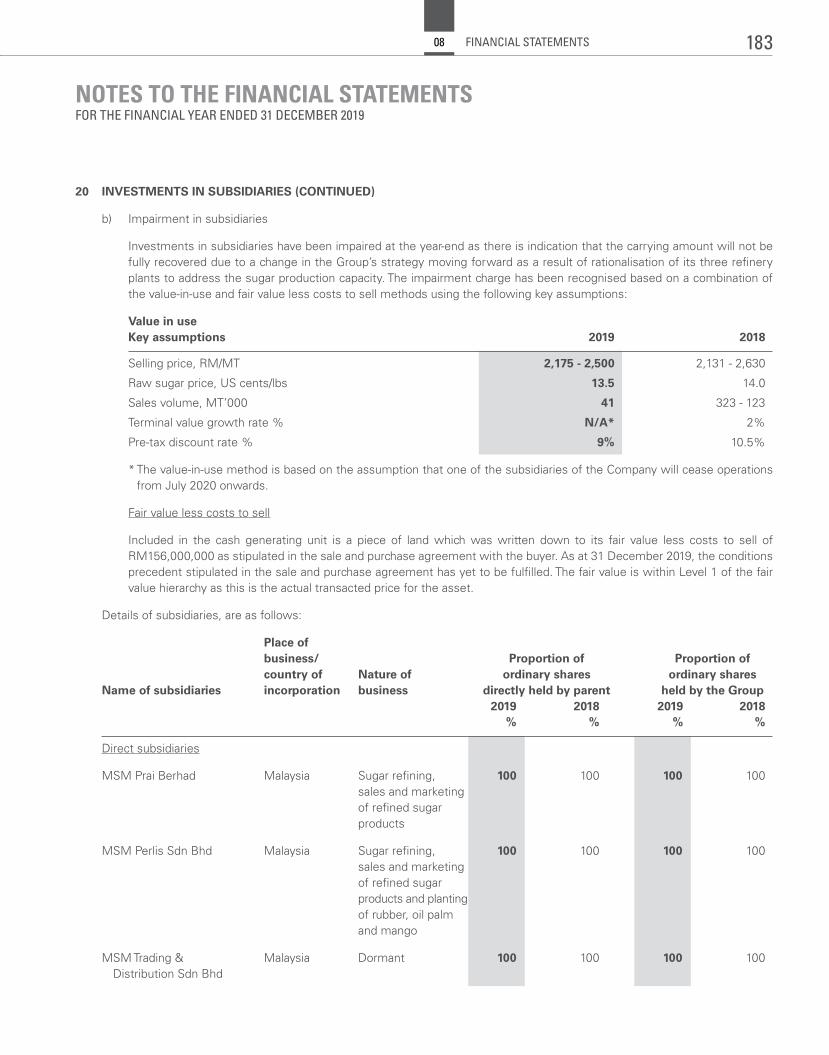
NOTES TO THE FINANCIAL STATEMENTSFOR THE FINANCIAL YEAR ENDED 31 DECEMBER 2019
20 INVESTMENTS IN SUBSIDIARIES (CONTINUED)
b) Impairment in subsidiaries
Investments in subsidiaries have been impaired at the year-end as there is indication that the carrying amount will not be fully recovered due to a change in the Group’s strategy moving forward as a result of rationalisation of its three refinery plants to address the sugar production capacity. The impairment charge has been recognised based on a combination of the value-in-use and fair value less costs to sell methods using the following key assumptions:
Value in use Key assumptions 2019 2018
Selling price, RM/MT 2,175 - 2,500 2,131 - 2,630
Raw sugar price, US cents/lbs 13.5 14.0
Sales volume, MT’000 41 323 - 123
Terminal value growth rate % N/A* 2%
Pre-tax discount rate % 9% 10.5%
* The value-in-use method is based on the assumption that one of the subsidiaries of the Company will cease operations from July 2020 onwards.
Fair value less costs to sell
Included in the cash generating unit is a piece of land which was written down to its fair value less costs to sell of RM156,000,000 as stipulated in the sale and purchase agreement with the buyer. As at 31 December 2019, the conditions precedent stipulated in the sale and purchase agreement has yet to be fulfilled. The fair value is within Level 1 of the fair value hierarchy as this is the actual transacted price for the asset.
Details of subsidiaries, are as follows:
Place of business/ Proportion of Proportion of country of Nature of ordinary shares ordinary shares Name of subsidiaries incorporation business directly held by parent held by the Group 2019 2018 2019 2018 % % % %
Direct subsidiaries
MSM Prai Berhad Malaysia Sugar refining, 100 100 100 100 sales and marketing of refined sugar products
MSM Perlis Sdn Bhd Malaysia Sugar refining, 100 100 100 100 sales and marketing of refined sugar products and planting of rubber, oil palm and mango
MSM Trading & Malaysia Dormant 100 100 100 100 Distribution Sdn Bhd
183FINANCIAL STATEMENTS08
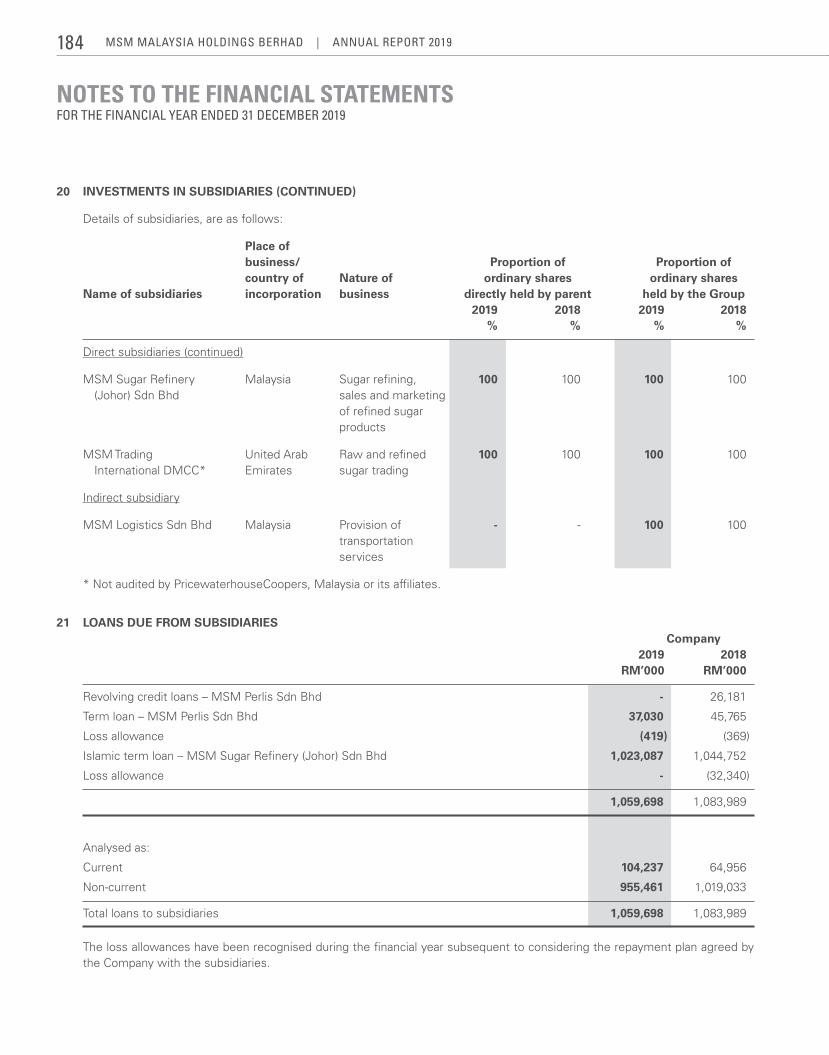
NOTES TO THE FINANCIAL STATEMENTSFOR THE FINANCIAL YEAR ENDED 31 DECEMBER 2019
20 INVESTMENTS IN SUBSIDIARIES (CONTINUED)
Details of subsidiaries, are as follows:
Place of business/ Proportion of Proportion of country of Nature of ordinary shares ordinary shares Name of subsidiaries incorporation business directly held by parent held by the Group 2019 2018 2019 2018 % % % %
Direct subsidiaries (continued)
MSM Sugar Refinery Malaysia Sugar refining, 100 100 100 100 (Johor) Sdn Bhd sales and marketing of refined sugar products
MSM Trading United Arab Raw and refined 100 100 100 100 International DMCC* Emirates sugar trading
Indirect subsidiary
MSM Logistics Sdn Bhd Malaysia Provision of - - 100 100 transportation services
* Not audited by PricewaterhouseCoopers, Malaysia or its affiliates.
21 LOANS DUE FROM SUBSIDIARIES Company 2019 2018 RM’000 RM’000
Revolving credit loans – MSM Perlis Sdn Bhd - 26,181
Term loan – MSM Perlis Sdn Bhd 37,030 45,765
Loss allowance (419) (369)
Islamic term loan – MSM Sugar Refinery (Johor) Sdn Bhd 1,023,087 1,044,752
Loss allowance - (32,340)
1,059,698 1,083,989
Analysed as:
Current 104,237 64,956
Non-current 955,461 1,019,033
Total loans to subsidiaries 1,059,698 1,083,989
The loss allowances have been recognised during the financial year subsequent to considering the repayment plan agreed by the Company with the subsidiaries.
MSM MalaySia HoldingS BerHad | annual report 2019184
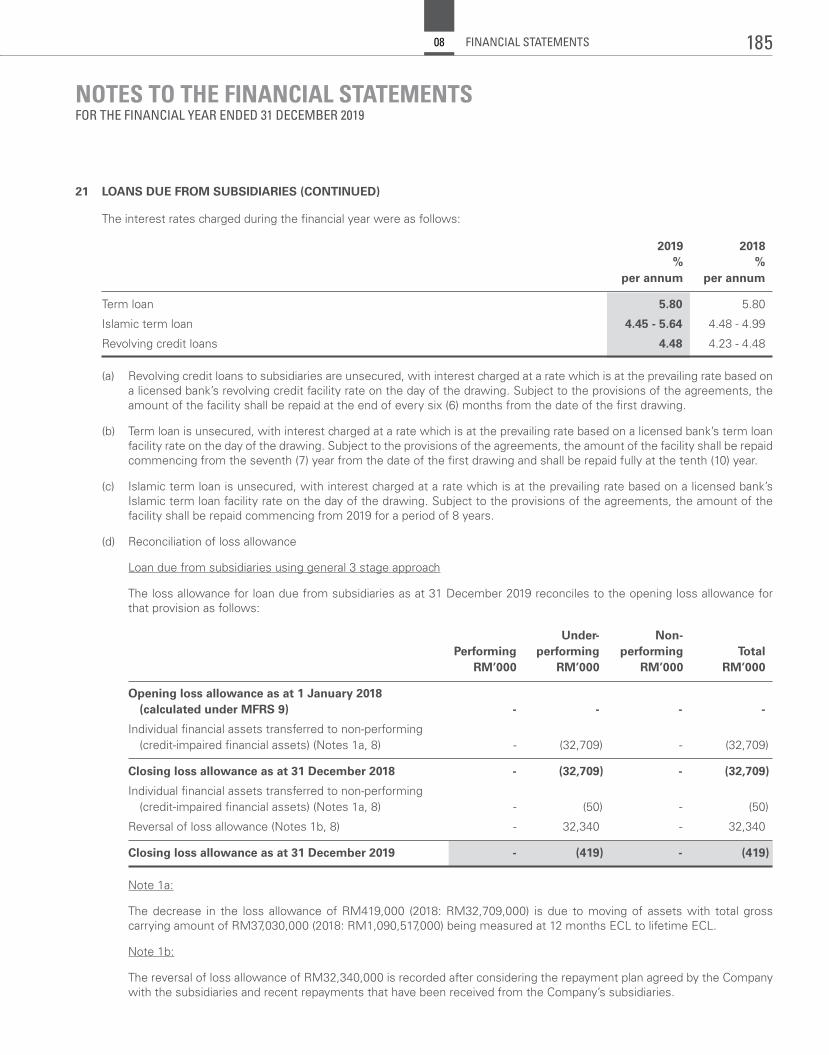
NOTES TO THE FINANCIAL STATEMENTSFOR THE FINANCIAL YEAR ENDED 31 DECEMBER 2019
21 LOANS DUE FROM SUBSIDIARIES (CONTINUED)
The interest rates charged during the financial year were as follows:
2019 2018 % % per annum per annum
Term loan 5.80 5.80
Islamic term loan 4.45 - 5.64 4.48 - 4.99
Revolving credit loans 4.48 4.23 - 4.48
(a) Revolving credit loans to subsidiaries are unsecured, with interest charged at a rate which is at the prevailing rate based on a licensed bank’s revolving credit facility rate on the day of the drawing. Subject to the provisions of the agreements, the amount of the facility shall be repaid at the end of every six (6) months from the date of the first drawing.
(b) Term loan is unsecured, with interest charged at a rate which is at the prevailing rate based on a licensed bank’s term loan facility rate on the day of the drawing. Subject to the provisions of the agreements, the amount of the facility shall be repaid commencing from the seventh (7) year from the date of the first drawing and shall be repaid fully at the tenth (10) year.
(c) Islamic term loan is unsecured, with interest charged at a rate which is at the prevailing rate based on a licensed bank’s Islamic term loan facility rate on the day of the drawing. Subject to the provisions of the agreements, the amount of the facility shall be repaid commencing from 2019 for a period of 8 years.
(d) Reconciliation of loss allowance
Loan due from subsidiaries using general 3 stage approach
The loss allowance for loan due from subsidiaries as at 31 December 2019 reconciles to the opening loss allowance for that provision as follows:
Under- Non- Performing performing performing Total RM’000 RM’000 RM’000 RM’000
Opening loss allowance as at 1 January 2018 (calculated under MFRS 9) - - - -
Individual financial assets transferred to non-performing (credit-impaired financial assets) (Notes 1a, 8) - (32,709) - (32,709)
Closing loss allowance as at 31 December 2018 - (32,709) - (32,709)
Individual financial assets transferred to non-performing (credit-impaired financial assets) (Notes 1a, 8) - (50) - (50)
Reversal of loss allowance (Notes 1b, 8) - 32,340 - 32,340
Closing loss allowance as at 31 December 2019 - (419) - (419)
Note 1a:
The decrease in the loss allowance of RM419,000 (2018: RM32,709,000) is due to moving of assets with total gross carrying amount of RM37,030,000 (2018: RM1,090,517,000) being measured at 12 months ECL to lifetime ECL.
Note 1b:
The reversal of loss allowance of RM32,340,000 is recorded after considering the repayment plan agreed by the Company with the subsidiaries and recent repayments that have been received from the Company’s subsidiaries.
185FINANCIAL STATEMENTS08
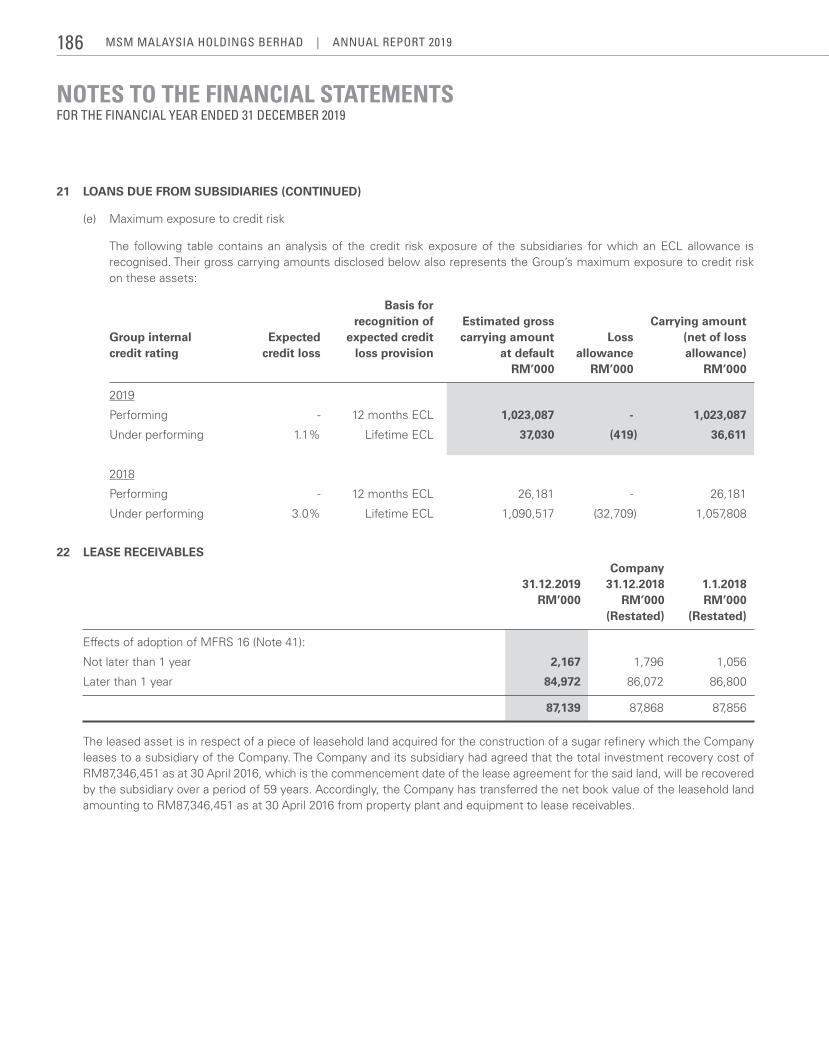
NOTES TO THE FINANCIAL STATEMENTSFOR THE FINANCIAL YEAR ENDED 31 DECEMBER 2019
21 LOANS DUE FROM SUBSIDIARIES (CONTINUED)
(e) Maximum exposure to credit risk
The following table contains an analysis of the credit risk exposure of the subsidiaries for which an ECL allowance is recognised. Their gross carrying amounts disclosed below also represents the Group’s maximum exposure to credit risk on these assets:
Basis for recognition of Estimated gross Carrying amount Group internal Expected expected credit carrying amount Loss (net of loss credit rating credit loss loss provision at default allowance allowance) RM’000 RM’000 RM’000
2019
Performing - 12 months ECL 1,023,087 - 1,023,087
Under performing 1.1% Lifetime ECL 37,030 (419) 36,611
2018
Performing - 12 months ECL 26,181 - 26,181
Under performing 3.0% Lifetime ECL 1,090,517 (32,709) 1,057,808
22 LEASE RECEIVABLES Company 31.12.2019 31.12.2018 1.1.2018 RM’000 RM’000 RM’000 (Restated) (Restated)
Effects of adoption of MFRS 16 (Note 41):
Not later than 1 year 2,167 1,796 1,056
Later than 1 year 84,972 86,072 86,800
87,139 87,868 87,856
The leased asset is in respect of a piece of leasehold land acquired for the construction of a sugar refinery which the Company leases to a subsidiary of the Company. The Company and its subsidiary had agreed that the total investment recovery cost of RM87,346,451 as at 30 April 2016, which is the commencement date of the lease agreement for the said land, will be recovered by the subsidiary over a period of 59 years. Accordingly, the Company has transferred the net book value of the leasehold land amounting to RM87,346,451 as at 30 April 2016 from property plant and equipment to lease receivables.
MSM MalaySia HoldingS BerHad | annual report 2019186
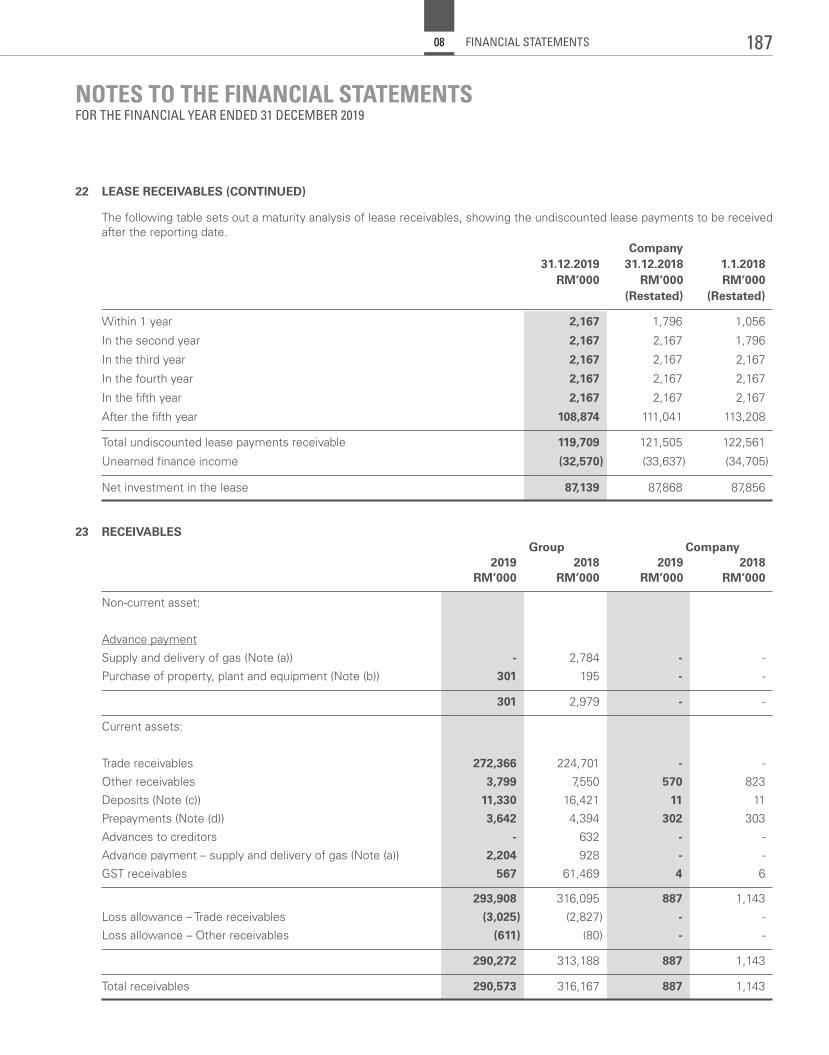
NOTES TO THE FINANCIAL STATEMENTSFOR THE FINANCIAL YEAR ENDED 31 DECEMBER 2019
22 LEASE RECEIVABLES (CONTINUED)
The following table sets out a maturity analysis of lease receivables, showing the undiscounted lease payments to be received after the reporting date. Company 31.12.2019 31.12.2018 1.1.2018 RM’000 RM’000 RM’000 (Restated) (Restated)
Within 1 year 2,167 1,796 1,056
In the second year 2,167 2,167 1,796
In the third year 2,167 2,167 2,167
In the fourth year 2,167 2,167 2,167
In the fifth year 2,167 2,167 2,167
After the fifth year 108,874 111,041 113,208
Total undiscounted lease payments receivable 119,709 121,505 122,561
Unearned finance income (32,570) (33,637) (34,705)
Net investment in the lease 87,139 87,868 87,856
23 RECEIVABLES Group Company 2019 2018 2019 2018 RM’000 RM’000 RM’000 RM’000
Non-current asset:
Advance payment
Supply and delivery of gas (Note (a)) - 2,784 - -
Purchase of property, plant and equipment (Note (b)) 301 195 - -
301 2,979 - -
Current assets:
Trade receivables 272,366 224,701 - -
Other receivables 3,799 7,550 570 823
Deposits (Note (c)) 11,330 16,421 11 11
Prepayments (Note (d)) 3,642 4,394 302 303
Advances to creditors - 632 - -
Advance payment – supply and delivery of gas (Note (a)) 2,204 928 - -
GST receivables 567 61,469 4 6
293,908 316,095 887 1,143
Loss allowance – Trade receivables (3,025) (2,827) - -
Loss allowance – Other receivables (611) (80) - -
290,272 313,188 887 1,143
Total receivables 290,573 316,167 887 1,143
187FINANCIAL STATEMENTS08
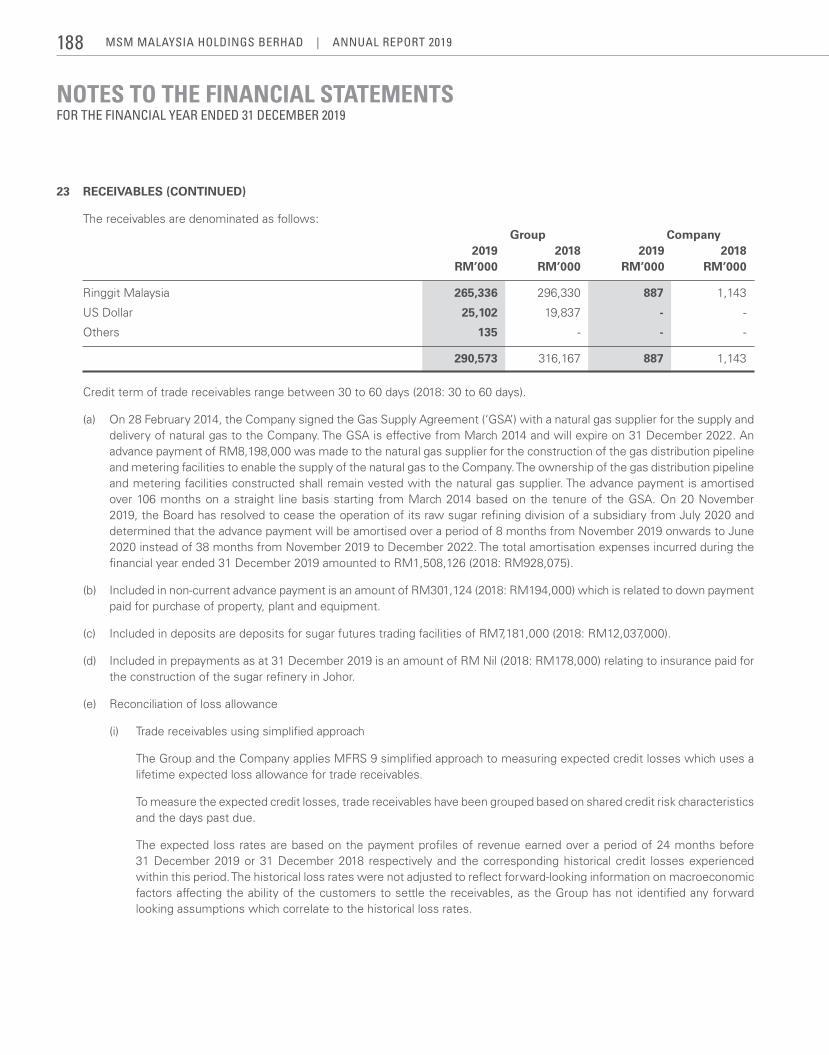
NOTES TO THE FINANCIAL STATEMENTSFOR THE FINANCIAL YEAR ENDED 31 DECEMBER 2019
23 RECEIVABLES (CONTINUED)
The receivables are denominated as follows: Group Company 2019 2018 2019 2018 RM’000 RM’000 RM’000 RM’000
Ringgit Malaysia 265,336 296,330 887 1,143
US Dollar 25,102 19,837 - -
Others 135 - - -
290,573 316,167 887 1,143
Credit term of trade receivables range between 30 to 60 days (2018: 30 to 60 days).
(a) On28February2014,theCompanysignedtheGasSupplyAgreement(‘GSA’)withanaturalgassupplierforthesupplyanddelivery of natural gas to the Company. The GSA is effective from March 2014 and will expire on 31 December 2022. An advance payment of RM8,198,000 was made to the natural gas supplier for the construction of the gas distribution pipeline and metering facilities to enable the supply of the natural gas to the Company. The ownership of the gas distribution pipeline and metering facilities constructed shall remain vested with the natural gas supplier. The advance payment is amortised over 106 months on a straight line basis starting from March 2014 based on the tenure of the GSA. On 20 November 2019, the Board has resolved to cease the operation of its raw sugar refining division of a subsidiary from July 2020 and determined that the advance payment will be amortised over a period of 8 months from November 2019 onwards to June 2020 instead of 38 months from November 2019 to December 2022. The total amortisation expenses incurred during the financial year ended 31 December 2019 amounted to RM1,508,126 (2018: RM928,075).
(b) Included in non-current advance payment is an amount of RM301,124 (2018: RM194,000) which is related to down payment paid for purchase of property, plant and equipment.
(c) Included in deposits are deposits for sugar futures trading facilities of RM7,181,000 (2018: RM12,037,000).
(d) Included in prepayments as at 31 December 2019 is an amount of RM Nil (2018: RM178,000) relating to insurance paid for the construction of the sugar refinery in Johor.
(e) Reconciliation of loss allowance
(i) Trade receivables using simplified approach
The Group and the Company applies MFRS 9 simplified approach to measuring expected credit losses which uses a lifetime expected loss allowance for trade receivables.
To measure the expected credit losses, trade receivables have been grouped based on shared credit risk characteristics and the days past due.
The expected loss rates are based on the payment profiles of revenue earned over a period of 24 months before 31 December 2019 or 31 December 2018 respectively and the corresponding historical credit losses experienced within this period. The historical loss rates were not adjusted to reflect forward-looking information on macroeconomic factors affecting the ability of the customers to settle the receivables, as the Group has not identified any forward looking assumptions which correlate to the historical loss rates.
MSM MalaySia HoldingS BerHad | annual report 2019188
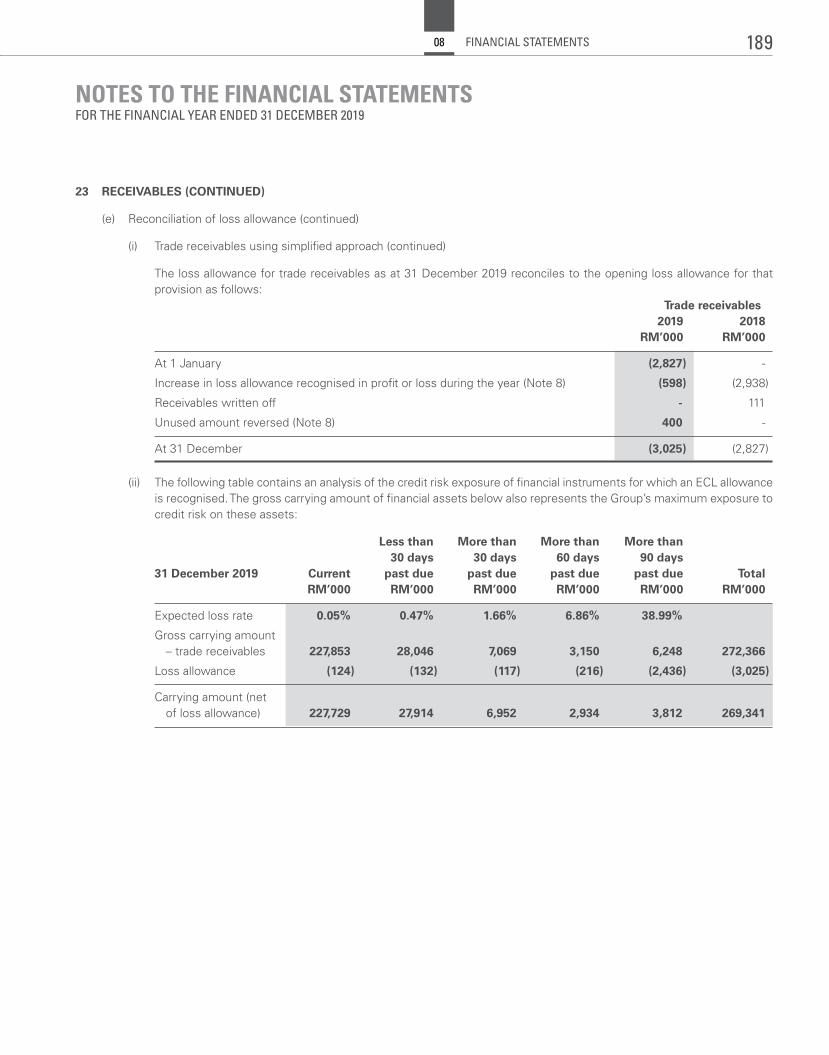
NOTES TO THE FINANCIAL STATEMENTSFOR THE FINANCIAL YEAR ENDED 31 DECEMBER 2019
23 RECEIVABLES (CONTINUED)
(e) Reconciliation of loss allowance (continued)
(i) Trade receivables using simplified approach (continued)
The loss allowance for trade receivables as at 31 December 2019 reconciles to the opening loss allowance for that provision as follows:
Trade receivables 2019 2018 RM’000 RM’000
At 1 January (2,827) -
Increase in loss allowance recognised in profit or loss during the year (Note 8) (598) (2,938)
Receivables written off - 111
Unused amount reversed (Note 8) 400 -
At 31 December (3,025) (2,827)
(ii) The following table contains an analysis of the credit risk exposure of financial instruments for which an ECL allowance is recognised. The gross carrying amount of financial assets below also represents the Group’s maximum exposure to credit risk on these assets:
Less than More than More than More than 30 days 30 days 60 days 90 days 31 December 2019 Current past due past due past due past due Total RM’000 RM’000 RM’000 RM’000 RM’000 RM’000
Expected loss rate 0.05% 0.47% 1.66% 6.86% 38.99%
Gross carrying amount – trade receivables 227,853 28,046 7,069 3,150 6,248 272,366
Loss allowance (124) (132) (117) (216) (2,436) (3,025)
Carrying amount (net of loss allowance) 227,729 27,914 6,952 2,934 3,812 269,341
189FINANCIAL STATEMENTS08
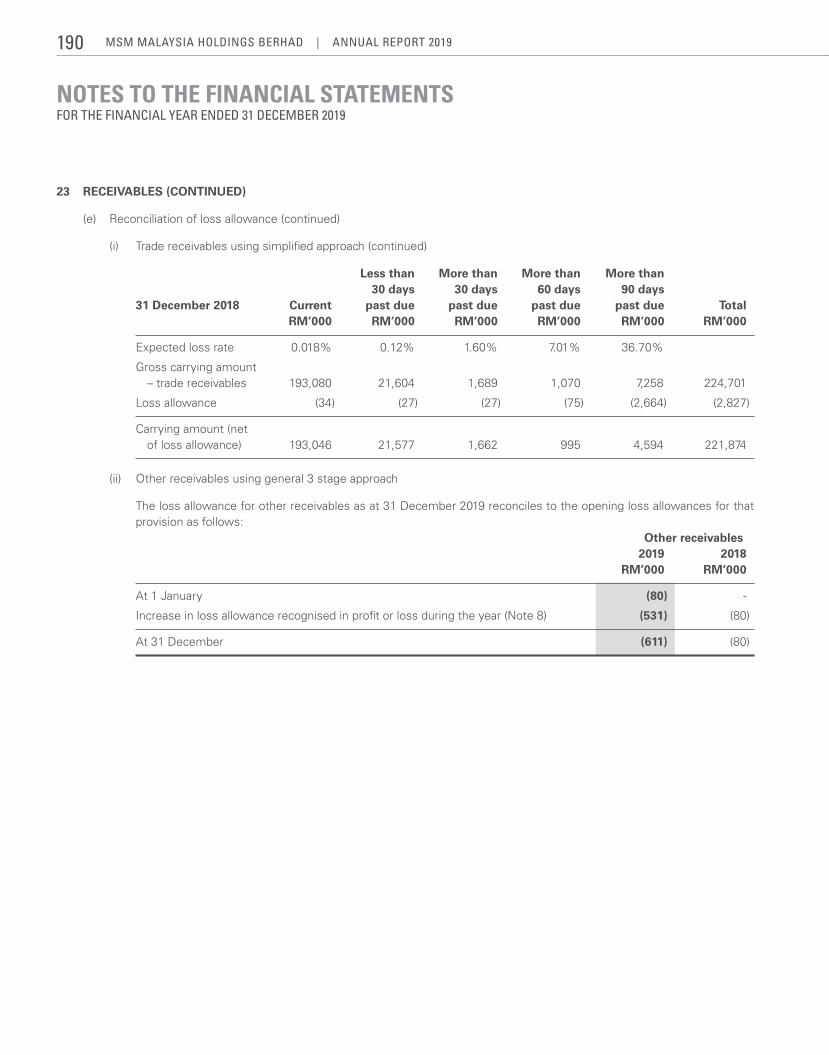
NOTES TO THE FINANCIAL STATEMENTSFOR THE FINANCIAL YEAR ENDED 31 DECEMBER 2019
23 RECEIVABLES (CONTINUED)
(e) Reconciliation of loss allowance (continued)
(i) Trade receivables using simplified approach (continued)
Less than More than More than More than 30 days 30 days 60 days 90 days 31 December 2018 Current past due past due past due past due Total RM’000 RM’000 RM’000 RM’000 RM’000 RM’000
Expected loss rate 0.018% 0.12% 1.60% 7.01% 36.70%
Gross carrying amount – trade receivables 193,080 21,604 1,689 1,070 7,258 224,701
Loss allowance (34) (27) (27) (75) (2,664) (2,827)
Carrying amount (net of loss allowance) 193,046 21,577 1,662 995 4,594 221,874
(ii) Other receivables using general 3 stage approach
The loss allowance for other receivables as at 31 December 2019 reconciles to the opening loss allowances for that provision as follows:
Other receivables 2019 2018 RM’000 RM’000
At 1 January (80) -
Increase in loss allowance recognised in profit or loss during the year (Note 8) (531) (80)
At 31 December (611) (80)
MSM MalaySia HoldingS BerHad | annual report 2019190
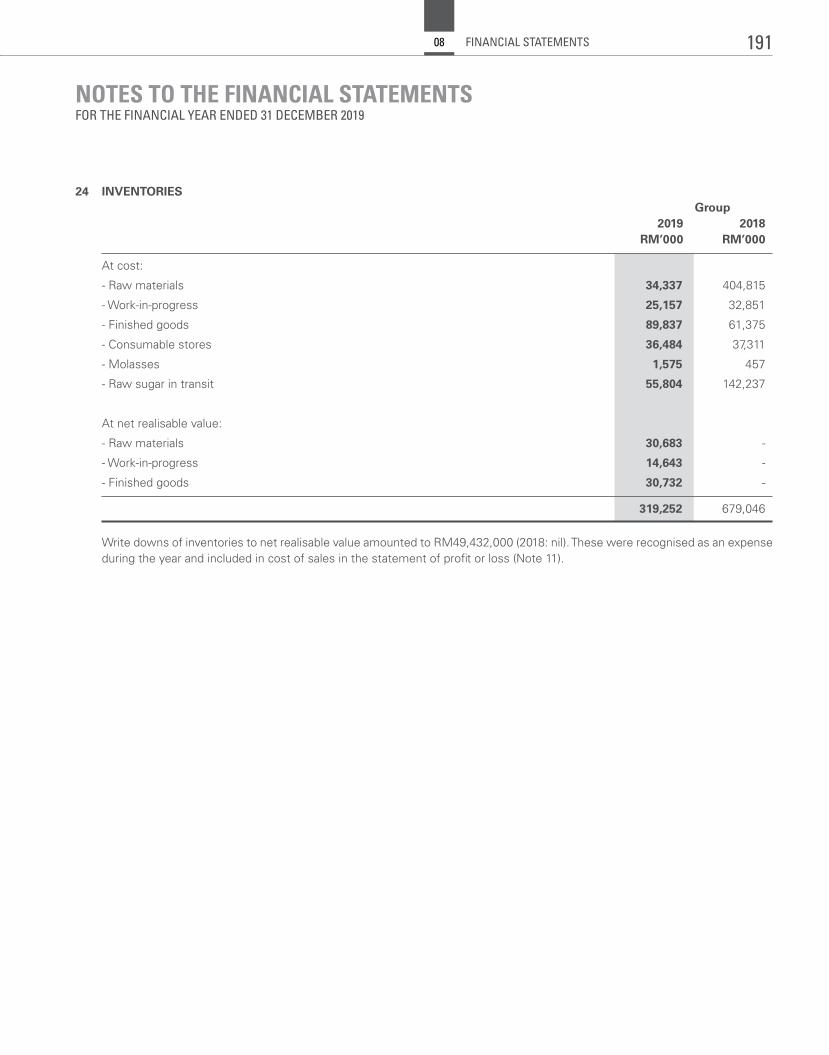
NOTES TO THE FINANCIAL STATEMENTSFOR THE FINANCIAL YEAR ENDED 31 DECEMBER 2019
24 INVENTORIES Group 2019 2018 RM’000 RM’000
At cost:
- Raw materials 34,337 404,815
- Work-in-progress 25,157 32,851
- Finished goods 89,837 61,375
- Consumable stores 36,484 37,311
- Molasses 1,575 457
- Raw sugar in transit 55,804 142,237
At net realisable value:
- Raw materials 30,683 -
- Work-in-progress 14,643 -
- Finished goods 30,732 -
319,252 679,046
Write downs of inventories to net realisable value amounted to RM49,432,000 (2018: nil). These were recognised as an expense during the year and included in cost of sales in the statement of profit or loss (Note 11).
191FINANCIAL STATEMENTS08
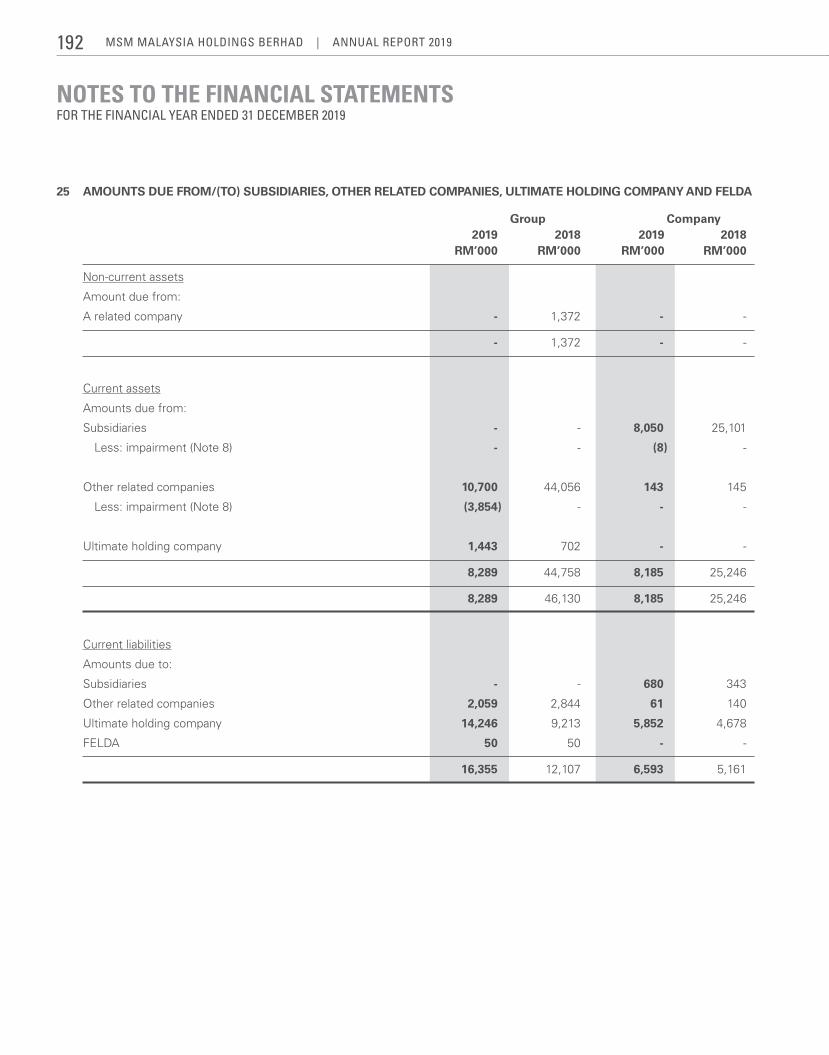
NOTES TO THE FINANCIAL STATEMENTSFOR THE FINANCIAL YEAR ENDED 31 DECEMBER 2019
25 AMOUNTS DUE FROM/(TO) SUBSIDIARIES, OTHER RELATED COMPANIES, ULTIMATE HOLDING COMPANY AND FELDA
Group Company 2019 2018 2019 2018 RM’000 RM’000 RM’000 RM’000
Non-current assets
Amount due from:
A related company - 1,372 - -
- 1,372 - -
Current assets
Amounts due from:
Subsidiaries - - 8,050 25,101
Less: impairment (Note 8) - - (8) -
Other related companies 10,700 44,056 143 145
Less: impairment (Note 8) (3,854) - - -
Ultimate holding company 1,443 702 - -
8,289 44,758 8,185 25,246
8,289 46,130 8,185 25,246
Current liabilities
Amounts due to:
Subsidiaries - - 680 343
Other related companies 2,059 2,844 61 140
Ultimate holding company 14,246 9,213 5,852 4,678
FELDA 50 50 - -
16,355 12,107 6,593 5,161
MSM MalaySia HoldingS BerHad | annual report 2019192
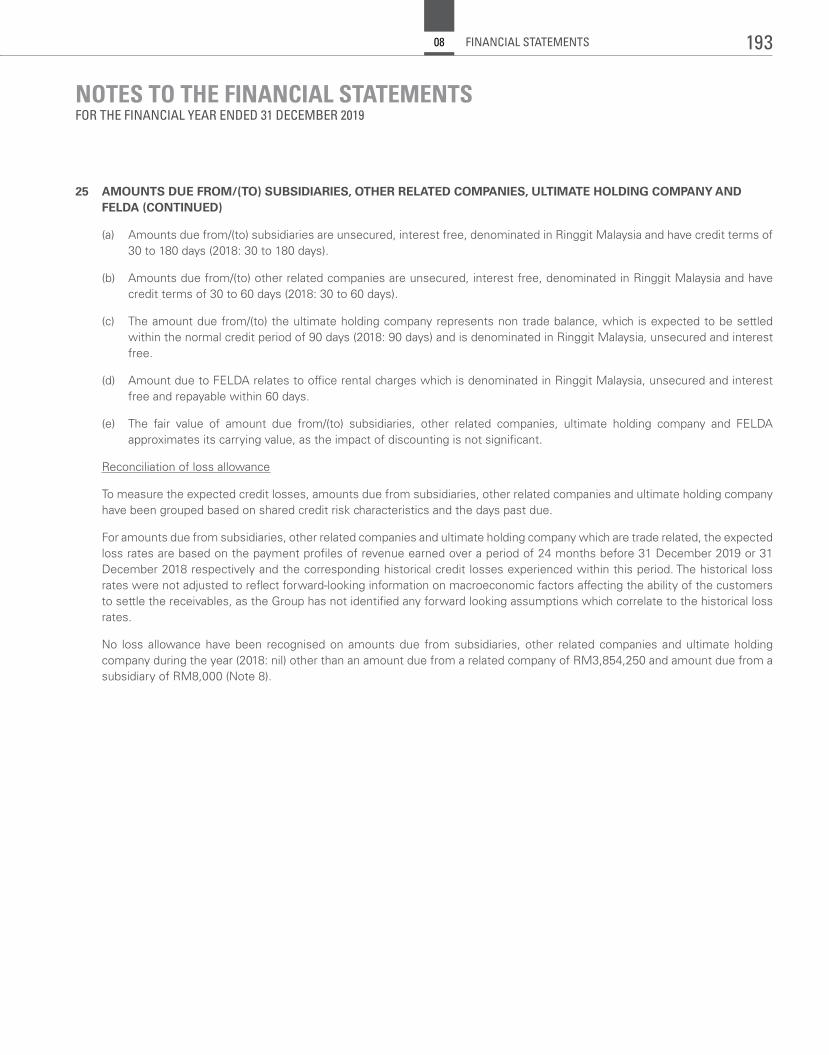
NOTES TO THE FINANCIAL STATEMENTSFOR THE FINANCIAL YEAR ENDED 31 DECEMBER 2019
25 AMOUNTS DUE FROM/(TO) SUBSIDIARIES, OTHER RELATED COMPANIES, ULTIMATE HOLDING COMPANY AND FELDA (CONTINUED)
(a) Amounts due from/(to) subsidiaries are unsecured, interest free, denominated in Ringgit Malaysia and have credit terms of 30 to 180 days (2018: 30 to 180 days).
(b) Amounts due from/(to) other related companies are unsecured, interest free, denominated in Ringgit Malaysia and have credit terms of 30 to 60 days (2018: 30 to 60 days).
(c) The amount due from/(to) the ultimate holding company represents non trade balance, which is expected to be settled within the normal credit period of 90 days (2018: 90 days) and is denominated in Ringgit Malaysia, unsecured and interest free.
(d) Amount due to FELDA relates to office rental charges which is denominated in Ringgit Malaysia, unsecured and interest free and repayable within 60 days.
(e) The fair value of amount due from/(to) subsidiaries, other related companies, ultimate holding company and FELDA approximates its carrying value, as the impact of discounting is not significant.
Reconciliation of loss allowance
To measure the expected credit losses, amounts due from subsidiaries, other related companies and ultimate holding company have been grouped based on shared credit risk characteristics and the days past due.
For amounts due from subsidiaries, other related companies and ultimate holding company which are trade related, the expected loss rates are based on the payment profiles of revenue earned over a period of 24 months before 31 December 2019 or 31 December 2018 respectively and the corresponding historical credit losses experienced within this period. The historical loss rates were not adjusted to reflect forward-looking information on macroeconomic factors affecting the ability of the customers to settle the receivables, as the Group has not identified any forward looking assumptions which correlate to the historical loss rates.
No loss allowance have been recognised on amounts due from subsidiaries, other related companies and ultimate holding company during the year (2018: nil) other than an amount due from a related company of RM3,854,250 and amount due from a subsidiary of RM8,000 (Note 8).
193FINANCIAL STATEMENTS08
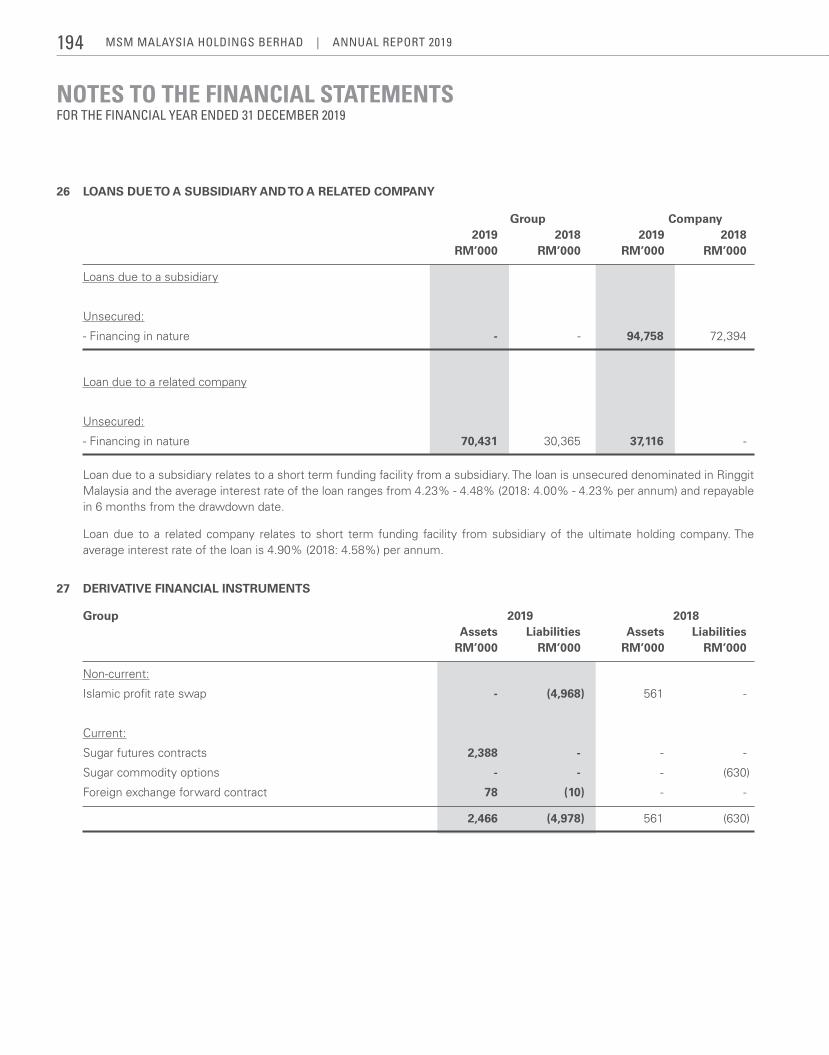
NOTES TO THE FINANCIAL STATEMENTSFOR THE FINANCIAL YEAR ENDED 31 DECEMBER 2019
26 LOANS DUE TO A SUBSIDIARY AND TO A RELATED COMPANY
Group Company 2019 2018 2019 2018 RM’000 RM’000 RM’000 RM’000
Loans due to a subsidiary
Unsecured:
- Financing in nature - - 94,758 72,394
Loan due to a related company
Unsecured:
- Financing in nature 70,431 30,365 37,116 -
Loan due to a subsidiary relates to a short term funding facility from a subsidiary. The loan is unsecured denominated in Ringgit Malaysia and the average interest rate of the loan ranges from 4.23% - 4.48% (2018: 4.00% - 4.23% per annum) and repayable in 6 months from the drawdown date.
Loan due to a related company relates to short term funding facility from subsidiary of the ultimate holding company. The average interest rate of the loan is 4.90% (2018: 4.58%) per annum.
27 DERIVATIVE FINANCIAL INSTRUMENTS
Group 2019 2018 Assets Liabilities Assets Liabilities RM’000 RM’000 RM’000 RM’000
Non-current:
Islamic profit rate swap - (4,968) 561 -
Current:
Sugar futures contracts 2,388 - - -
Sugar commodity options - - - (630)
Foreign exchange forward contract 78 (10) - -
2,466 (4,978) 561 (630)
MSM MalaySia HoldingS BerHad | annual report 2019194
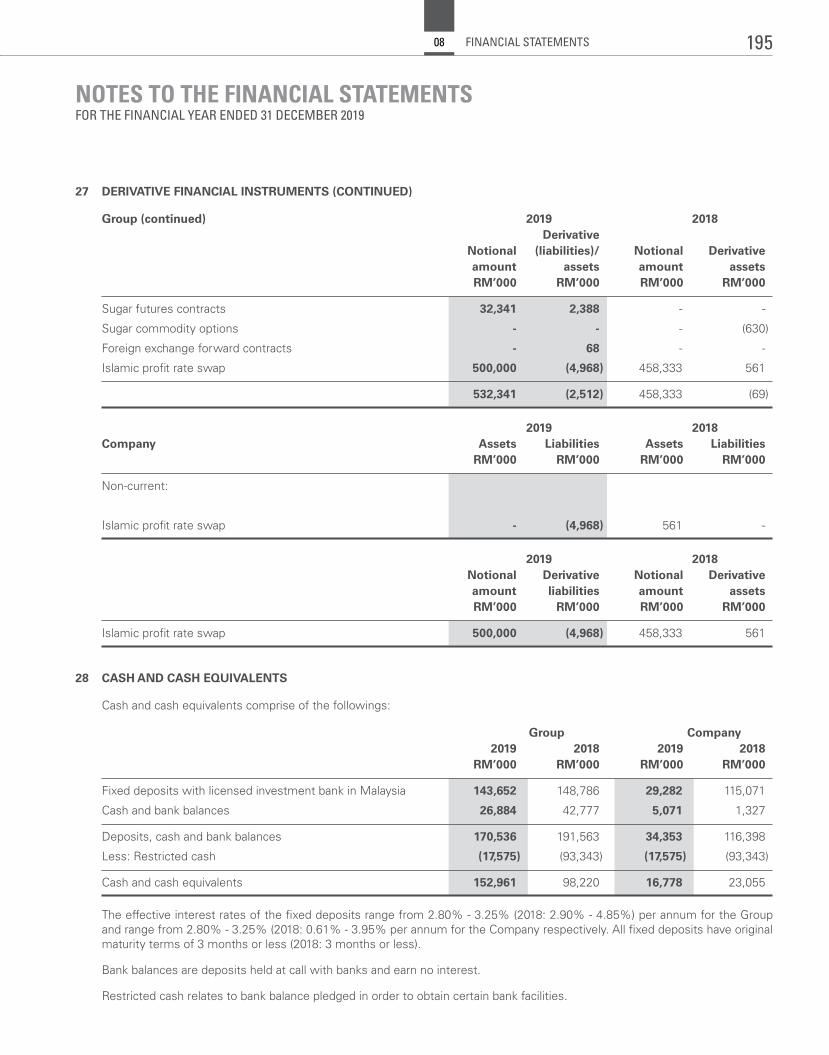
NOTES TO THE FINANCIAL STATEMENTSFOR THE FINANCIAL YEAR ENDED 31 DECEMBER 2019
27 DERIVATIVE FINANCIAL INSTRUMENTS (CONTINUED)
Group (continued) 2019 2018 Derivative Notional (liabilities)/ Notional Derivative amount assets amount assets RM’000 RM’000 RM’000 RM’000
Sugar futures contracts 32,341 2,388 - -
Sugar commodity options - - - (630)
Foreign exchange forward contracts - 68 - -
Islamic profit rate swap 500,000 (4,968) 458,333 561
532,341 (2,512) 458,333 (69)
2019 2018Company Assets Liabilities Assets Liabilities RM’000 RM’000 RM’000 RM’000
Non-current:
Islamic profit rate swap - (4,968) 561 -
2019 2018 Notional Derivative Notional Derivative amount liabilities amount assets RM’000 RM’000 RM’000 RM’000
Islamic profit rate swap 500,000 (4,968) 458,333 561
28 CASH AND CASH EQUIVALENTS
Cash and cash equivalents comprise of the followings:
Group Company 2019 2018 2019 2018 RM’000 RM’000 RM’000 RM’000
Fixed deposits with licensed investment bank in Malaysia 143,652 148,786 29,282 115,071
Cash and bank balances 26,884 42,777 5,071 1,327
Deposits, cash and bank balances 170,536 191,563 34,353 116,398
Less: Restricted cash (17,575) (93,343) (17,575) (93,343)
Cash and cash equivalents 152,961 98,220 16,778 23,055
The effective interest rates of the fixed deposits range from 2.80% - 3.25% (2018: 2.90% - 4.85%) per annum for the Group and range from 2.80% - 3.25% (2018: 0.61% - 3.95% per annum for the Company respectively. All fixed deposits have original maturity terms of 3 months or less (2018: 3 months or less).
Bank balances are deposits held at call with banks and earn no interest.
Restricted cash relates to bank balance pledged in order to obtain certain bank facilities.
195FINANCIAL STATEMENTS08
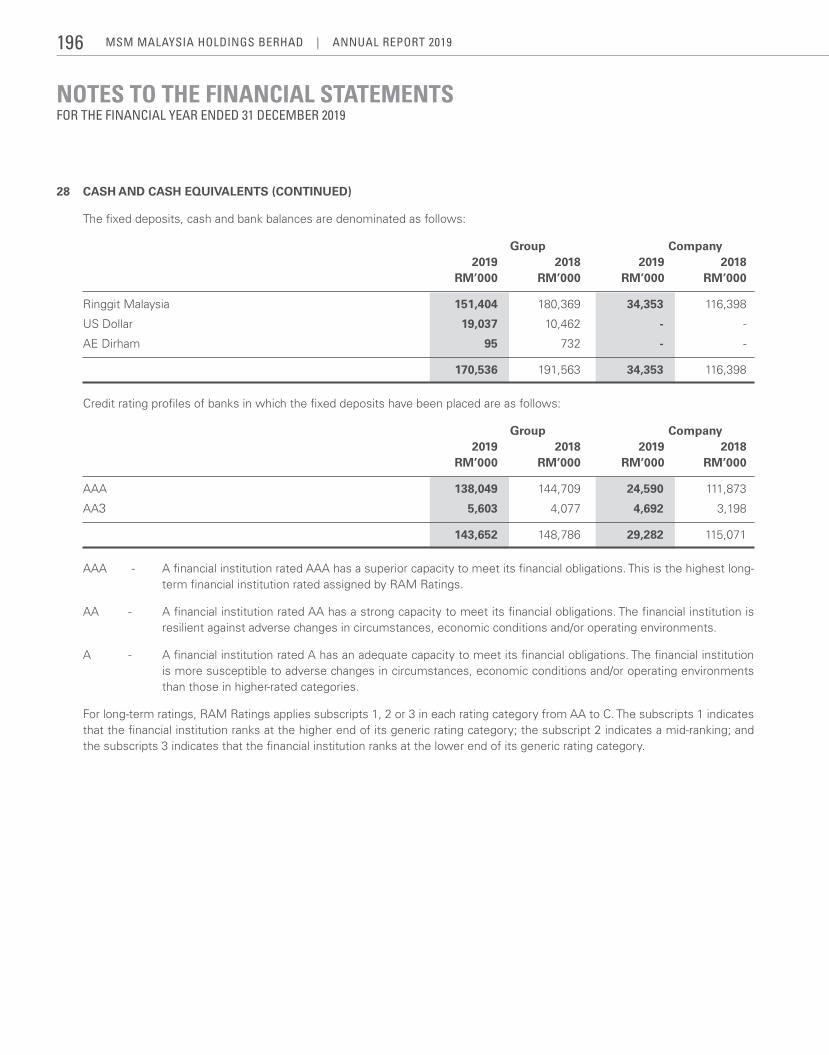
NOTES TO THE FINANCIAL STATEMENTSFOR THE FINANCIAL YEAR ENDED 31 DECEMBER 2019
28 CASH AND CASH EQUIVALENTS (CONTINUED)
The fixed deposits, cash and bank balances are denominated as follows:
Group Company 2019 2018 2019 2018 RM’000 RM’000 RM’000 RM’000
Ringgit Malaysia 151,404 180,369 34,353 116,398
US Dollar 19,037 10,462 - -
AE Dirham 95 732 - -
170,536 191,563 34,353 116,398
Credit rating profiles of banks in which the fixed deposits have been placed are as follows:
Group Company 2019 2018 2019 2018 RM’000 RM’000 RM’000 RM’000
AAA 138,049 144,709 24,590 111,873
AA3 5,603 4,077 4,692 3,198
143,652 148,786 29,282 115,071
AAA - A financial institution rated AAA has a superior capacity to meet its financial obligations. This is the highest long-term financial institution rated assigned by RAM Ratings.
AA - A financial institution rated AA has a strong capacity to meet its financial obligations. The financial institution is resilient against adverse changes in circumstances, economic conditions and/or operating environments.
A - A financial institution rated A has an adequate capacity to meet its financial obligations. The financial institution is more susceptible to adverse changes in circumstances, economic conditions and/or operating environments than those in higher-rated categories.
For long-term ratings, RAM Ratings applies subscripts 1, 2 or 3 in each rating category from AA to C. The subscripts 1 indicates that the financial institution ranks at the higher end of its generic rating category; the subscript 2 indicates a mid-ranking; and the subscripts 3 indicates that the financial institution ranks at the lower end of its generic rating category.
MSM MalaySia HoldingS BerHad | annual report 2019196
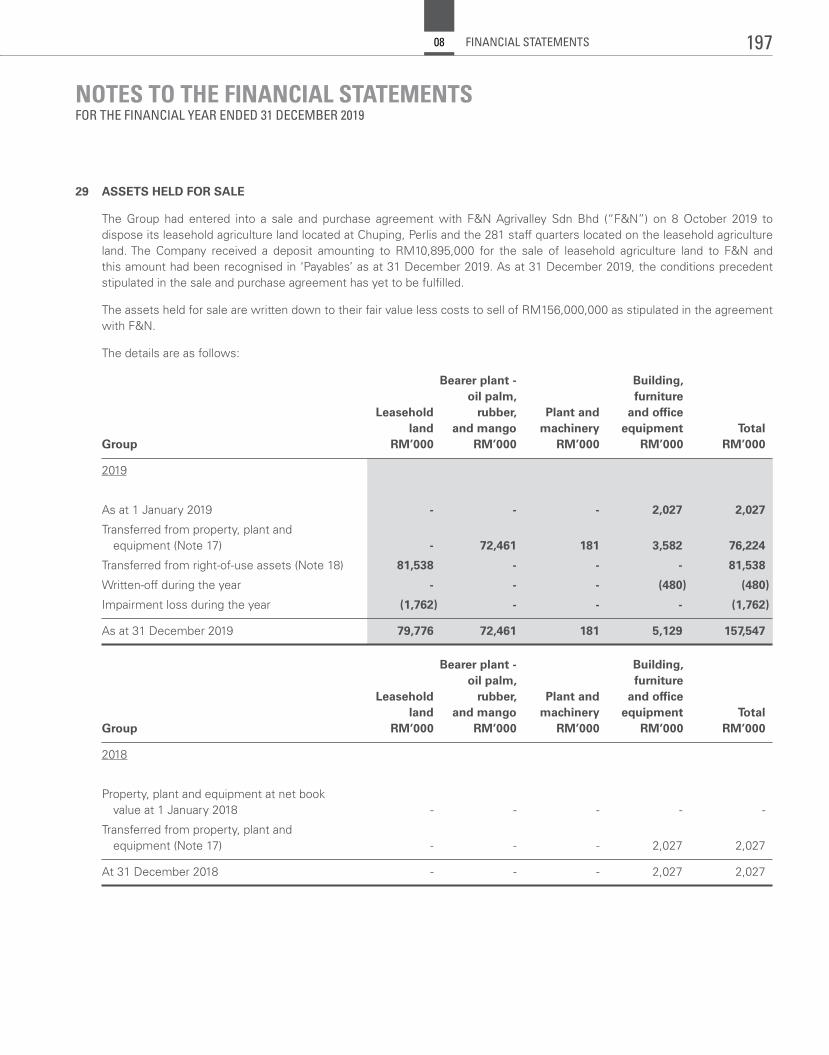
NOTES TO THE FINANCIAL STATEMENTSFOR THE FINANCIAL YEAR ENDED 31 DECEMBER 2019
29 ASSETS HELD FOR SALE
The Group had entered into a sale and purchase agreement with F&N Agrivalley Sdn Bhd (“F&N”) on 8 October 2019 to dispose its leasehold agriculture land located at Chuping, Perlis and the 281 staff quarters located on the leasehold agriculture land. The Company received a deposit amounting to RM10,895,000 for the sale of leasehold agriculture land to F&N and thisamounthadbeenrecognisedin‘Payables’asat31December2019.Asat31December2019,theconditionsprecedent stipulated in the sale and purchase agreement has yet to be fulfilled.
The assets held for sale are written down to their fair value less costs to sell of RM156,000,000 as stipulated in the agreement with F&N.
The details are as follows:
Bearer plant - Building, oil palm, furniture Leasehold rubber, Plant and and office land and mango machinery equipment Total Group RM’000 RM’000 RM’000 RM’000 RM’000
2019
As at 1 January 2019 - - - 2,027 2,027
Transferred from property, plant and equipment (Note 17) - 72,461 181 3,582 76,224
Transferred from right-of-use assets (Note 18) 81,538 - - - 81,538
Written-off during the year - - - (480) (480)
Impairment loss during the year (1,762) - - - (1,762)
As at 31 December 2019 79,776 72,461 181 5,129 157,547
Bearer plant - Building, oil palm, furniture Leasehold rubber, Plant and and office land and mango machinery equipment Total Group RM’000 RM’000 RM’000 RM’000 RM’000
2018
Property, plant and equipment at net book value at 1 January 2018 - - - - -
Transferred from property, plant and equipment (Note 17) - - - 2,027 2,027
At 31 December 2018 - - - 2,027 2,027
197FINANCIAL STATEMENTS08
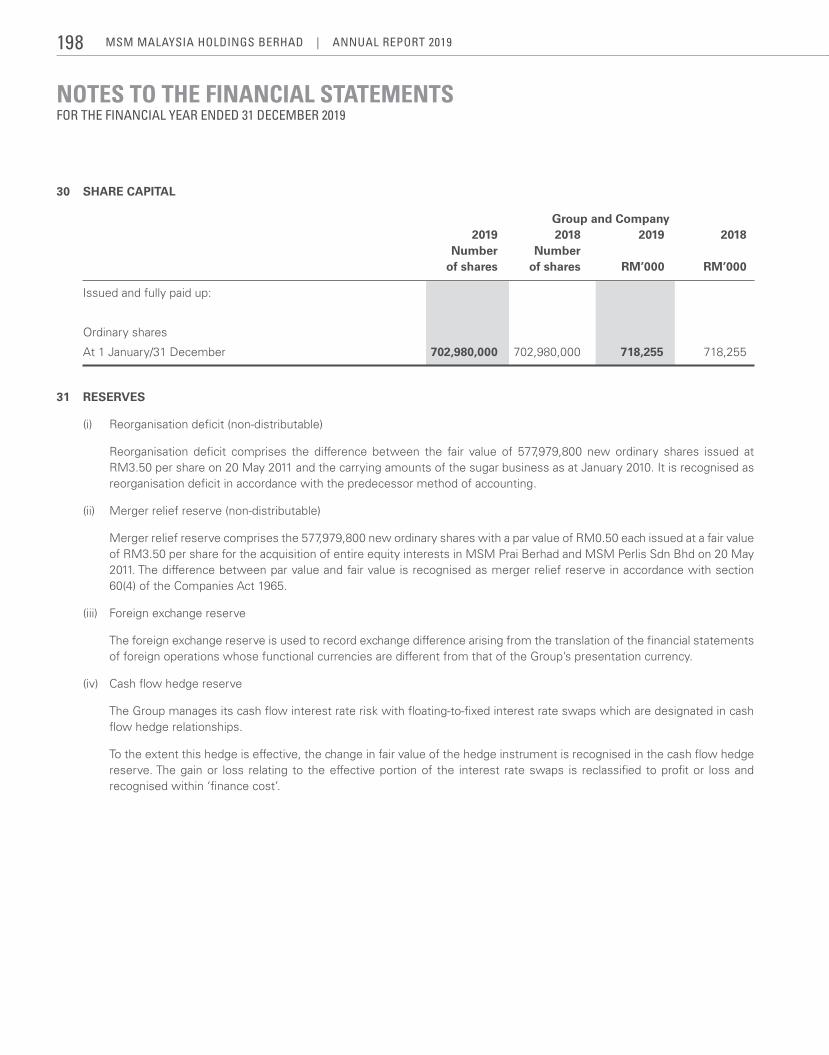
NOTES TO THE FINANCIAL STATEMENTSFOR THE FINANCIAL YEAR ENDED 31 DECEMBER 2019
30 SHARE CAPITAL
Group and Company 2019 2018 2019 2018 Number Number of shares of shares RM’000 RM’000
Issued and fully paid up:
Ordinary shares
At 1 January/31 December 702,980,000 702,980,000 718,255 718,255
31 RESERVES
(i) Reorganisation deficit (non-distributable)
Reorganisation deficit comprises the difference between the fair value of 577,979,800 new ordinary shares issued at RM3.50 per share on 20 May 2011 and the carrying amounts of the sugar business as at January 2010. It is recognised as reorganisation deficit in accordance with the predecessor method of accounting.
(ii) Merger relief reserve (non-distributable)
Merger relief reserve comprises the 577,979,800 new ordinary shares with a par value of RM0.50 each issued at a fair value of RM3.50 per share for the acquisition of entire equity interests in MSM Prai Berhad and MSM Perlis Sdn Bhd on 20 May 2011. The difference between par value and fair value is recognised as merger relief reserve in accordance with section 60(4) of the Companies Act 1965.
(iii) Foreign exchange reserve
The foreign exchange reserve is used to record exchange difference arising from the translation of the financial statements of foreign operations whose functional currencies are different from that of the Group’s presentation currency.
(iv) Cash flow hedge reserve
The Group manages its cash flow interest rate risk with floating-to-fixed interest rate swaps which are designated in cash flow hedge relationships.
To the extent this hedge is effective, the change in fair value of the hedge instrument is recognised in the cash flow hedge reserve. The gain or loss relating to the effective portion of the interest rate swaps is reclassified to profit or loss and recognisedwithin‘financecost’.
MSM MalaySia HoldingS BerHad | annual report 2019198
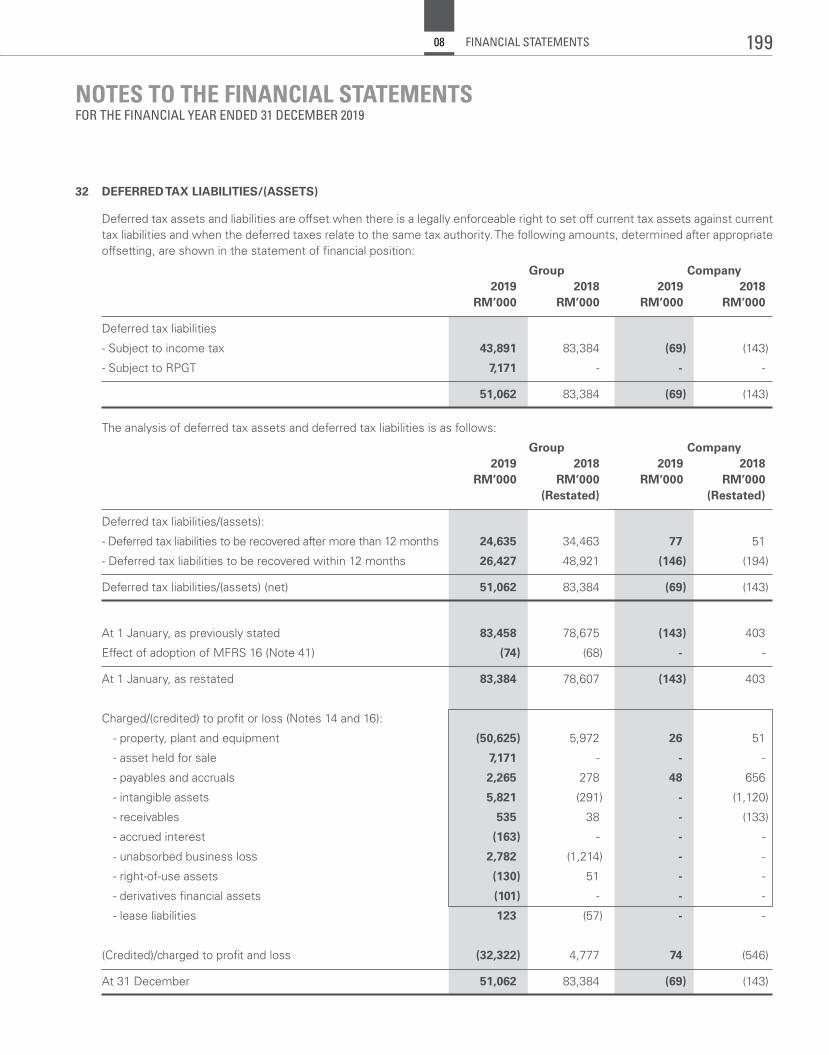
NOTES TO THE FINANCIAL STATEMENTSFOR THE FINANCIAL YEAR ENDED 31 DECEMBER 2019
32 DEFERRED TAX LIABILITIES/(ASSETS)
Deferred tax assets and liabilities are offset when there is a legally enforceable right to set off current tax assets against current tax liabilities and when the deferred taxes relate to the same tax authority. The following amounts, determined after appropriate offsetting, are shown in the statement of financial position:
Group Company 2019 2018 2019 2018 RM’000 RM’000 RM’000 RM’000
Deferred tax liabilities
- Subject to income tax 43,891 83,384 (69) (143)
- Subject to RPGT 7,171 - - -
51,062 83,384 (69) (143)
The analysis of deferred tax assets and deferred tax liabilities is as follows:
Group Company 2019 2018 2019 2018 RM’000 RM’000 RM’000 RM’000 (Restated) (Restated)
Deferred tax liabilities/(assets):
- Deferred tax liabilities to be recovered after more than 12 months 24,635 34,463 77 51
- Deferred tax liabilities to be recovered within 12 months 26,427 48,921 (146) (194)
Deferred tax liabilities/(assets) (net) 51,062 83,384 (69) (143)
At 1 January, as previously stated 83,458 78,675 (143) 403
Effect of adoption of MFRS 16 (Note 41) (74) (68) - -
At 1 January, as restated 83,384 78,607 (143) 403
Charged/(credited) to profit or loss (Notes 14 and 16):
- property, plant and equipment (50,625) 5,972 26 51
- asset held for sale 7,171 - - -
- payables and accruals 2,265 278 48 656
- intangible assets 5,821 (291) - (1,120)
- receivables 535 38 - (133)
- accrued interest (163) - - -
- unabsorbed business loss 2,782 (1,214) - -
- right-of-use assets (130) 51 - -
- derivatives financial assets (101) - - -
- lease liabilities 123 (57) - -
(Credited)/charged to profit and loss (32,322) 4,777 74 (546)
At 31 December 51,062 83,384 (69) (143)
199FINANCIAL STATEMENTS08
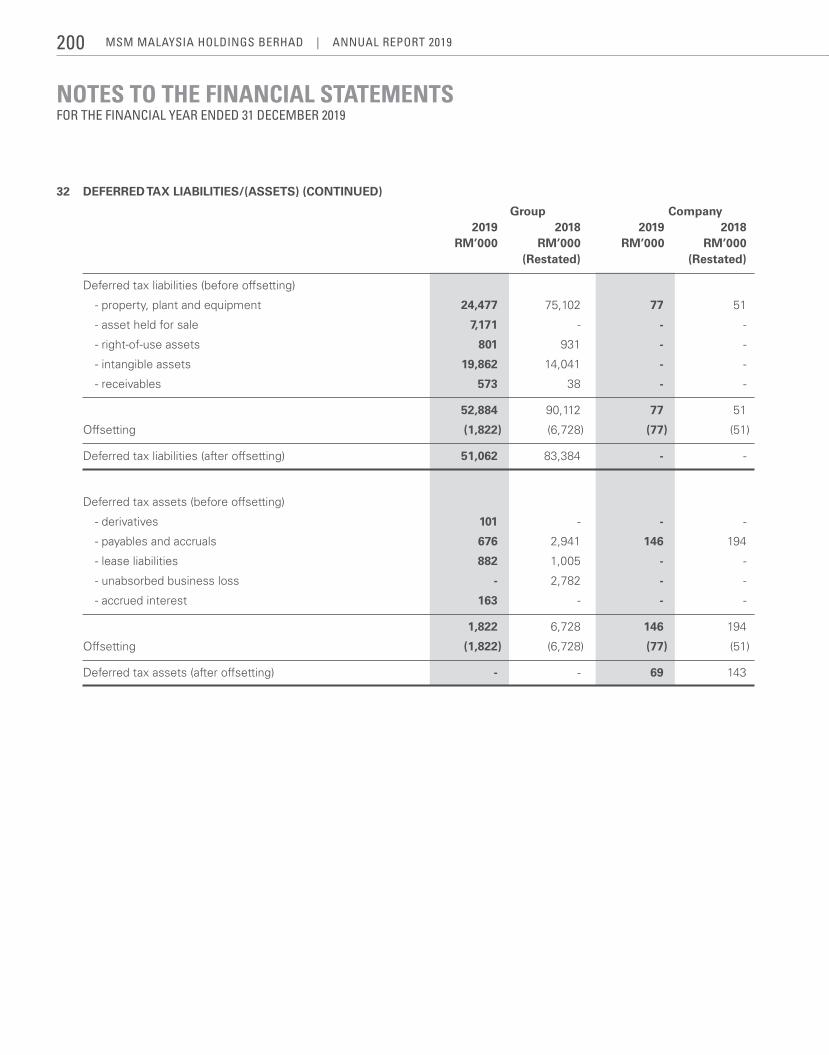
NOTES TO THE FINANCIAL STATEMENTSFOR THE FINANCIAL YEAR ENDED 31 DECEMBER 2019
32 DEFERRED TAX LIABILITIES/(ASSETS) (CONTINUED)
Group Company 2019 2018 2019 2018 RM’000 RM’000 RM’000 RM’000 (Restated) (Restated)
Deferred tax liabilities (before offsetting)
- property, plant and equipment 24,477 75,102 77 51
- asset held for sale 7,171 - - -
- right-of-use assets 801 931 - -
- intangible assets 19,862 14,041 - -
- receivables 573 38 - -
52,884 90,112 77 51
Offsetting (1,822) (6,728) (77) (51)
Deferred tax liabilities (after offsetting) 51,062 83,384 - -
Deferred tax assets (before offsetting)
- derivatives 101 - - -
- payables and accruals 676 2,941 146 194
- lease liabilities 882 1,005 - -
- unabsorbed business loss - 2,782 - -
- accrued interest 163 - - -
1,822 6,728 146 194
Offsetting (1,822) (6,728) (77) (51)
Deferred tax assets (after offsetting) - - 69 143
MSM MalaySia HoldingS BerHad | annual report 2019200
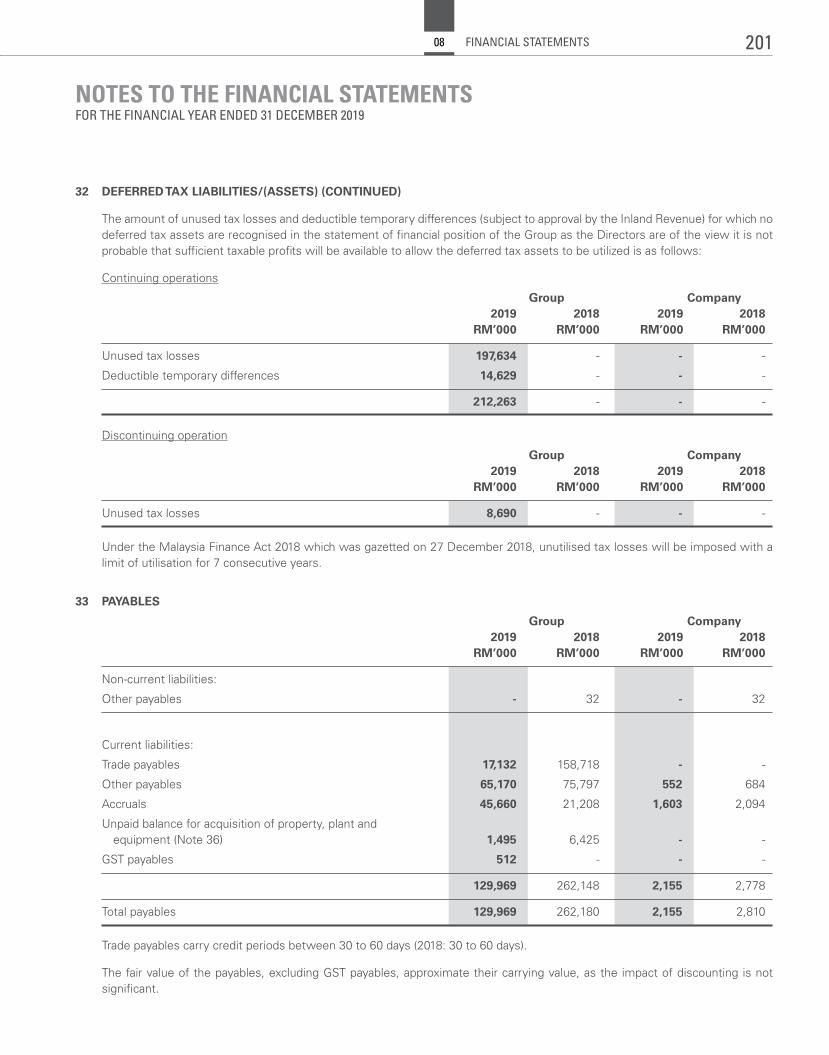
NOTES TO THE FINANCIAL STATEMENTSFOR THE FINANCIAL YEAR ENDED 31 DECEMBER 2019
32 DEFERRED TAX LIABILITIES/(ASSETS) (CONTINUED)
The amount of unused tax losses and deductible temporary differences (subject to approval by the Inland Revenue) for which no deferred tax assets are recognised in the statement of financial position of the Group as the Directors are of the view it is not probable that sufficient taxable profits will be available to allow the deferred tax assets to be utilized is as follows:
Continuing operations
Group Company 2019 2018 2019 2018 RM’000 RM’000 RM’000 RM’000
Unused tax losses 197,634 - - -
Deductible temporary differences 14,629 - - -
212,263 - - -
Discontinuing operation
Group Company 2019 2018 2019 2018 RM’000 RM’000 RM’000 RM’000
Unused tax losses 8,690 - - -
Under the Malaysia Finance Act 2018 which was gazetted on 27 December 2018, unutilised tax losses will be imposed with a limit of utilisation for 7 consecutive years.
33 PAYABLES
Group Company 2019 2018 2019 2018 RM’000 RM’000 RM’000 RM’000
Non-current liabilities:
Other payables - 32 - 32
Current liabilities:
Trade payables 17,132 158,718 - -
Other payables 65,170 75,797 552 684
Accruals 45,660 21,208 1,603 2,094
Unpaid balance for acquisition of property, plant and equipment (Note 36) 1,495 6,425 - -
GST payables 512 - - -
129,969 262,148 2,155 2,778
Total payables 129,969 262,180 2,155 2,810
Trade payables carry credit periods between 30 to 60 days (2018: 30 to 60 days).
The fair value of the payables, excluding GST payables, approximate their carrying value, as the impact of discounting is not significant.
201FINANCIAL STATEMENTS08
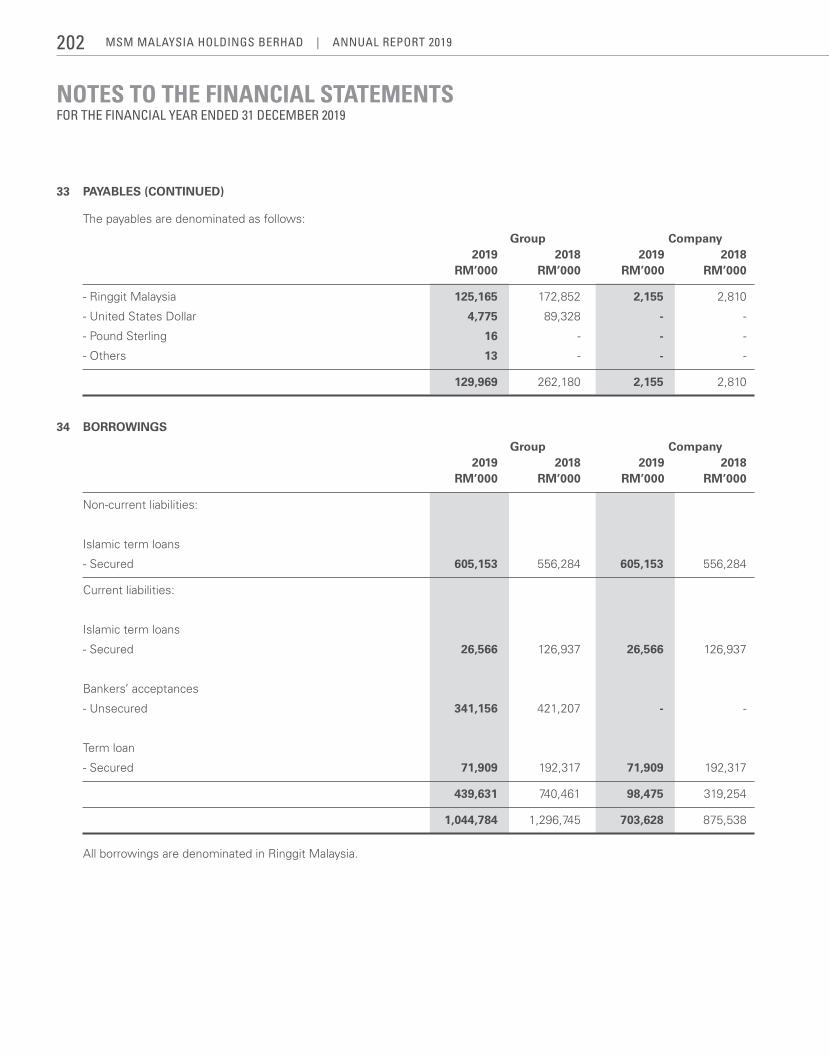
NOTES TO THE FINANCIAL STATEMENTSFOR THE FINANCIAL YEAR ENDED 31 DECEMBER 2019
33 PAYABLES (CONTINUED)
The payables are denominated as follows:
Group Company 2019 2018 2019 2018 RM’000 RM’000 RM’000 RM’000
- Ringgit Malaysia 125,165 172,852 2,155 2,810
- United States Dollar 4,775 89,328 - -
- Pound Sterling 16 - - -
- Others 13 - - -
129,969 262,180 2,155 2,810
34 BORROWINGS
Group Company 2019 2018 2019 2018 RM’000 RM’000 RM’000 RM’000
Non-current liabilities:
Islamic term loans
- Secured 605,153 556,284 605,153 556,284
Current liabilities:
Islamic term loans
- Secured 26,566 126,937 26,566 126,937
Bankers’ acceptances
- Unsecured 341,156 421,207 - -
Term loan
- Secured 71,909 192,317 71,909 192,317
439,631 740,461 98,475 319,254
1,044,784 1,296,745 703,628 875,538
All borrowings are denominated in Ringgit Malaysia.
MSM MalaySia HoldingS BerHad | annual report 2019202
NOTES TO THE FINANCIAL STATEMENTSFOR THE FINANCIAL YEAR ENDED 31 DECEMBER 2019
34 BORROWINGS (CONTINUED)
Bankers’ acceptance
The average interest rates of the borrowings range approximately 3.96% to 4.14% (2018: 3.43% to 4.70%) per annum.
Islamic term loans
The average interest rates of the borrowings range approximately 4.99% to 5.69% (2018: 4.72% to 4.99%) per annum.
The Islamic term loans which have a tenure of 12 years (2018: 8 years) are secured against a leasehold land, debenture and certain bank balances of the Group.
The Group and the Company is required to comply with certain financial covenants i.e. consolidated net debt and financing to equity ratio, consolidated net debt and financing to earnings before interest, tax, depreciation and amortisation (“EBITDA”) ratio andconsolidatedfinancepaymentcoverratio(collectivelyknownas‘’financialcovenants”).Thefinancialcovenantsaretobecomplied with annually (2018: semi-annually).
During the financial year ended 31 December 2017, the Group and the Company was not in compliance with certain financial covenants for its Islamic term loans amounting to RM406.5 million. However, the Company had received a letter of indulgence dated 3 November 2017 from the lender allowing the requirement to comply with the financial covenants to be deferred until 31 December 2018. The financial covenants were required to be met for the 12 month period ended 31 December 2019, with the first compliance date as 30 June 2019 and all times thereafter but subject to the following conditions:
a) No dividend declaration and/or payment by the Company without prior written consent from the financier until the financial covenants are complied with;
b) Letter of undertaking (“LOU”) from FGVH to complete the construction of the new sugar refinery in Johor by second quarter of 2018; and
c) The Company’s ability to perform all obligations under and comply with all terms and conditions governing the facilities.
As at 31 December 2018, the waiver of the financial covenants continued to be effective as the Company met all the conditions as stipulated in the letter of indulgence dated 3 November 2017. Accordingly, the Islamic term loan of RM683.2 million was classified based on its contractual payment dates as at 31 December 2018.
On 19 March 2019, the Company received a letter of indulgence from the lender confirming the lender of the Islamic term loan facility had granted a further indulgence and extension of deferment of the imposition of the financial covenants with effect from 1 January 2019 until 31 December 2019, subject to the following conditions:
a) no dividend declaration and/or payment by the Company without prior written consent from the lender until such financial covenants are complied with; and
b) amendments to payments of the loan and the other relevant terms and conditions in the loan agreement must be in place and effective by next payment due on 27 May 2019.
203FINANCIAL STATEMENTS08
NOTES TO THE FINANCIAL STATEMENTSFOR THE FINANCIAL YEAR ENDED 31 DECEMBER 2019
34 BORROWINGS (CONTINUED)
Islamic term loans (continued)
On 2 May 2019, the Company had successfully negotiated the amendments to the payment terms and financial covenants with the lender and had agreed revisions to the terms of agreement which include:
a) Longer tenure of loan from 8 to 12 years;
b) Increase in effective profit rate from 3 months KLIBOR plus 1.3% per annum to 1 month KLIBOR plus 2.5% per annum; and
c) Revision to the financial covenants.
According to the revised terms, the financial covenants shall be computed based on the Group’s consolidated annual audited financial statement for the financial year ending 31 December 2020 onwards. Accordingly, the Islamic term loan of RM631.7 million was classified based on its contractual payment dates as at 31 December 2019. The Company believes it will be able to meet the required financial covenants based on the projected cash flows as at 31 December 2020.
The revision of the terms resulted in a loan modification charge of RM25,559,000 and loan arrangement fee of RM3,270,000.
The Company is also assessing various possibilities to negotiate the terms of the Islamic term loan with its lenders following the announcement by the Government of Malaysia on the moratorium repayment period in view of the Covid-19 pandemic, if necessary.
Term loan - secured
The average interest rates of the borrowings range approximately 6.30% to 6.40% per annum (2018: 5.90% to 6.15% per annum).
As at 31 December 2019, the term loan which has a tenure of 30 months (2018: 18 months) are secured against an assignment of proceeds from leasehold agriculture land disposal as disclosed in Note 29 to the financial statements and the Assignment and Charge of the Designated Accounts. As indicated in Note 42 to the financial statements, on 9 April 2020, the Group had issued a letter to F&N Agrivalley Sdn. Bhd. to exercise its rights to rescind the sale and purchase agreement in respect of the disposal of its leasehold agricultural land located at Chuping, Perlis entered on 8 October 2019. Despite the cancellation of the sale and purchase agreement, the Group continues to believe that it will be able to settle its term loan based on its contractual due dates.
On 17 October 2019, the Company successfully negotiated the amendments to the payment with the lender incurring arrangement fees of RM547,500. The revision of the terms also resulted in a loan modification charge of RM1,259,000.
MSM MalaySia HoldingS BerHad | annual report 2019204
NOTES TO THE FINANCIAL STATEMENTSFOR THE FINANCIAL YEAR ENDED 31 DECEMBER 2019
35 SIGNIFICANT RELATED PARTY TRANSACTIONS
In addition to related party disclosures mentioned elsewhere in the financial statements, set out below are other significant related party transactions and balances.
Federal Land Development Authority (“FELDA”), a significant shareholder of the Group’s ultimate holding company, FGV Holdings Berhad, owns 33.67% (2018: 33.67%) of the issued share capital of FGVH, which in turn has an effective 51% interest in the Company. The Group considers that, for the purpose of MFRS 124 “Related Party Disclosures”, FELDA and the Malaysian Government is in the position to exercise significant influence over it. As a result, the Malaysian Government and Malaysian Government controlled bodies (collectively referred to as “government-related entities”) are related parties of the Group and the Company.
Apart from the individually significant transactions as disclosed in the financial statements, the Group and the Company have collectively, but not individually, significant transactions with other government-related entities which include but not limited to the following:
• Depositplacingwithanddeposittakingfromgovernment-relatedentities
• Utilitiesservicesprovidedbythegovernment-relatedentities
These transactions are conducted in the ordinary course of the Group’s business on terms consistently applied in accordance with the Group’s internal policies and processes. These terms do not depend on whether the counterparties are government-related entities or not.
Related parties and their relationship with the Group are as follows:
Related parties Relationship
Federal Land Development Authority (“FELDA”) Significant shareholder of FGVH
FGV Holdings Berhad (“FGVH”) Ultimate holding company
Felda D'Saji Sdn Bhd (“D'Saji”) Subsidiary of FELDA
KPF Trading Sdn Bhd (formerly known as Felda Trading Sdn Bhd) (“KPF”) Subsidiary of FELDA
Felda Holdings Berhad (“FHB”) Subsidiary of FGVH
FGV Prodata Systems Sdn Bhd (“FPSB”) Subsidiary of FGVH
FGV Security Services Sdn Bhd (“FSS”) Subsidiary of FGVH
Felda Engineering Services Sdn Bhd (“Felda Engineering”) Subsidiary of FGVH
FGV Capital Sdn Bhd (“FGVC”) Subsidiary of FGVH
FGV Fertiliser Sdn Bhd (“FPM”) Subsidiary of FGVH
MSM Sugar Refinery (Johor) Sdn Bhd (“MSM Johor”) Subsidiary company
MSM Logistics Sdn Bhd (“MSM Logistics”) Subsidiary company
MSM Prai Berhad (“MSM Prai”) Subsidiary company
MSM Perlis Sdn Bhd (“MSM Perlis”) Subsidiary company
MSM Trading & Distribution Sdn Bhd (“MSM Trading”) Subsidiary company
MSM Trading International DMCC (“MSM Trading International”) Subsidiary company
205FINANCIAL STATEMENTS08
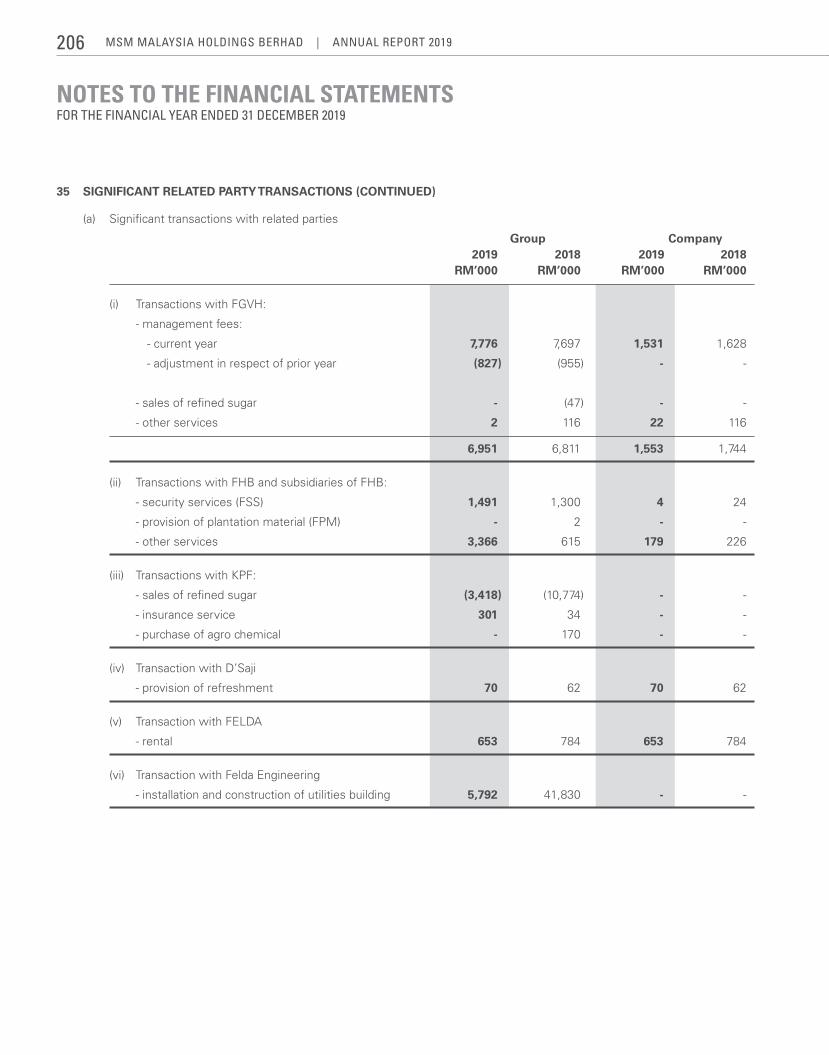
NOTES TO THE FINANCIAL STATEMENTSFOR THE FINANCIAL YEAR ENDED 31 DECEMBER 2019
35 SIGNIFICANT RELATED PARTY TRANSACTIONS (CONTINUED)
(a) Significant transactions with related parties
Group Company 2019 2018 2019 2018 RM’000 RM’000 RM’000 RM’000
(i) Transactions with FGVH:
- management fees:
- current year 7,776 7,697 1,531 1,628
- adjustment in respect of prior year (827) (955) - -
- sales of refined sugar - (47) - -
- other services 2 116 22 116
6,951 6,811 1,553 1,744
(ii) Transactions with FHB and subsidiaries of FHB:
- security services (FSS) 1,491 1,300 4 24
- provision of plantation material (FPM) - 2 - -
- other services 3,366 615 179 226
(iii) Transactions with KPF:
- sales of refined sugar (3,418) (10,774) - -
- insurance service 301 34 - -
- purchase of agro chemical - 170 - -
(iv) Transaction with D’Saji
- provision of refreshment 70 62 70 62
(v) Transaction with FELDA
- rental 653 784 653 784
(vi) Transaction with Felda Engineering
- installation and construction of utilities building 5,792 41,830 - -
MSM MalaySia HoldingS BerHad | annual report 2019206
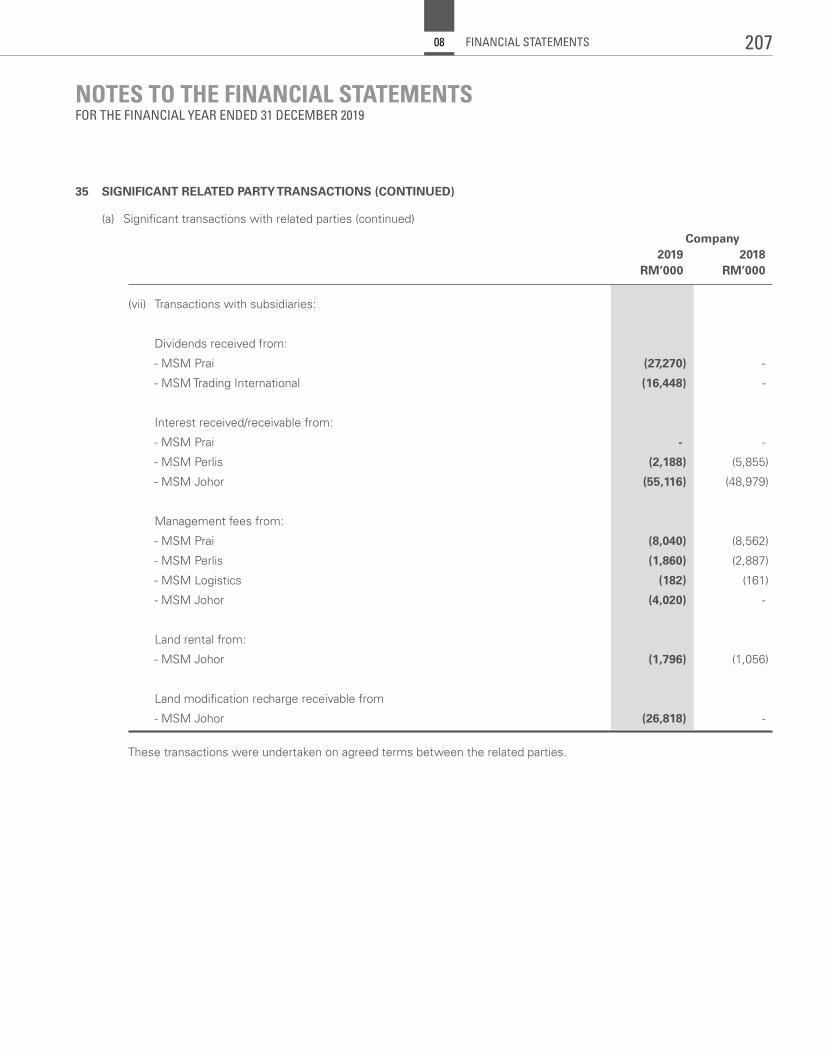
NOTES TO THE FINANCIAL STATEMENTSFOR THE FINANCIAL YEAR ENDED 31 DECEMBER 2019
35 SIGNIFICANT RELATED PARTY TRANSACTIONS (CONTINUED)
(a) Significant transactions with related parties (continued)
Company 2019 2018 RM’000 RM’000
(vii) Transactions with subsidiaries:
Dividends received from:
- MSM Prai (27,270) -
- MSM Trading International (16,448) -
Interest received/receivable from:
- MSM Prai - -
- MSM Perlis (2,188) (5,855)
- MSM Johor (55,116) (48,979)
Management fees from:
- MSM Prai (8,040) (8,562)
- MSM Perlis (1,860) (2,887)
- MSM Logistics (182) (161)
- MSM Johor (4,020) -
Land rental from:
- MSM Johor (1,796) (1,056)
Land modification recharge receivable from
- MSM Johor (26,818) -
These transactions were undertaken on agreed terms between the related parties.
207FINANCIAL STATEMENTS08
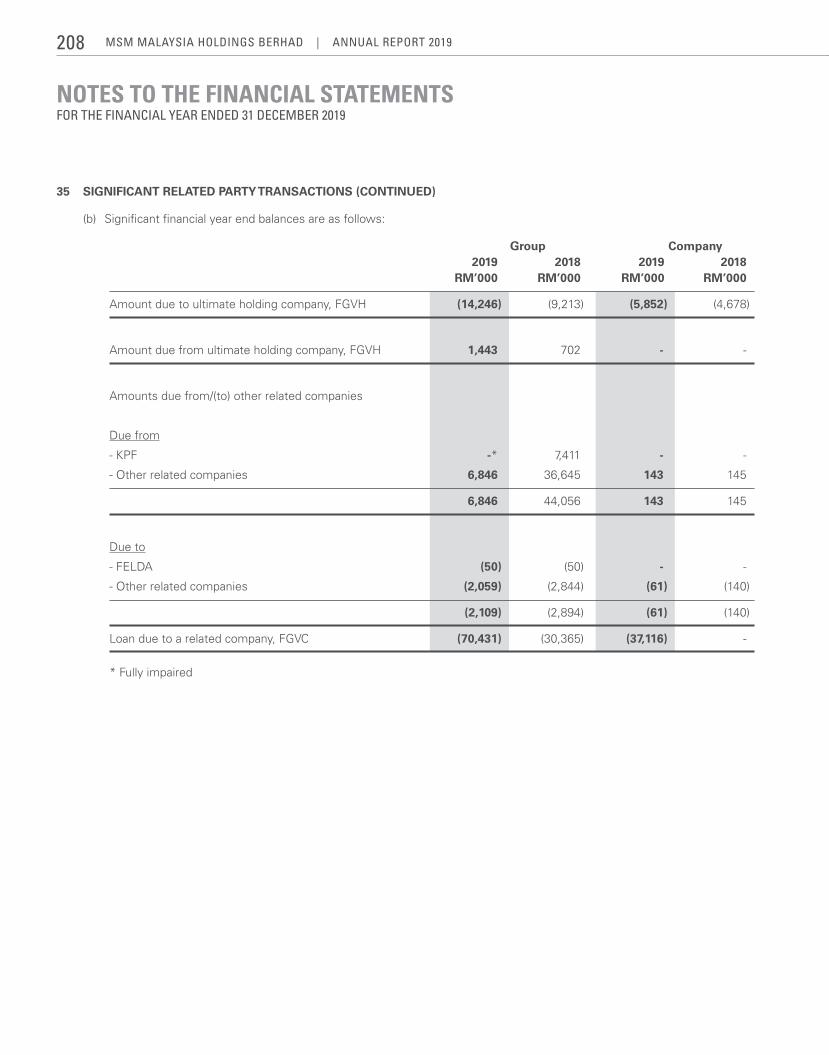
NOTES TO THE FINANCIAL STATEMENTSFOR THE FINANCIAL YEAR ENDED 31 DECEMBER 2019
35 SIGNIFICANT RELATED PARTY TRANSACTIONS (CONTINUED)
(b) Significant financial year end balances are as follows:
Group Company 2019 2018 2019 2018 RM’000 RM’000 RM’000 RM’000
Amount due to ultimate holding company, FGVH (14,246) (9,213) (5,852) (4,678)
Amount due from ultimate holding company, FGVH 1,443 702 - -
Amounts due from/(to) other related companies
Due from
- KPF -* 7,411 - -
- Other related companies 6,846 36,645 143 145
6,846 44,056 143 145
Due to
- FELDA (50) (50) - -
- Other related companies (2,059) (2,844) (61) (140)
(2,109) (2,894) (61) (140)
Loan due to a related company, FGVC (70,431) (30,365) (37,116) -
* Fully impaired
MSM MalaySia HoldingS BerHad | annual report 2019208
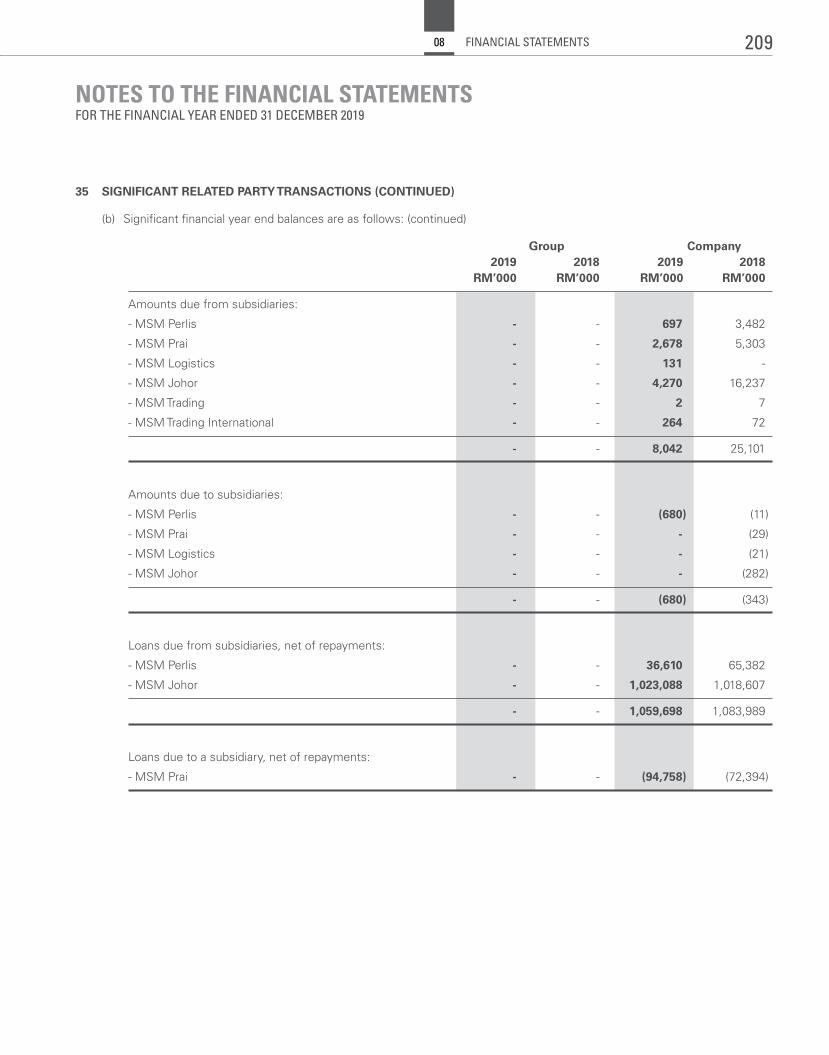
NOTES TO THE FINANCIAL STATEMENTSFOR THE FINANCIAL YEAR ENDED 31 DECEMBER 2019
35 SIGNIFICANT RELATED PARTY TRANSACTIONS (CONTINUED)
(b) Significant financial year end balances are as follows: (continued)
Group Company 2019 2018 2019 2018 RM’000 RM’000 RM’000 RM’000
Amounts due from subsidiaries:
- MSM Perlis - - 697 3,482
- MSM Prai - - 2,678 5,303
- MSM Logistics - - 131 -
- MSM Johor - - 4,270 16,237
- MSM Trading - - 2 7
- MSM Trading International - - 264 72
- - 8,042 25,101
Amounts due to subsidiaries:
- MSM Perlis - - (680) (11)
- MSM Prai - - - (29)
- MSM Logistics - - - (21)
- MSM Johor - - - (282)
- - (680) (343)
Loans due from subsidiaries, net of repayments:
- MSM Perlis - - 36,610 65,382
- MSM Johor - - 1,023,088 1,018,607
- - 1,059,698 1,083,989
Loans due to a subsidiary, net of repayments:
- MSM Prai - - (94,758) (72,394)
209FINANCIAL STATEMENTS08
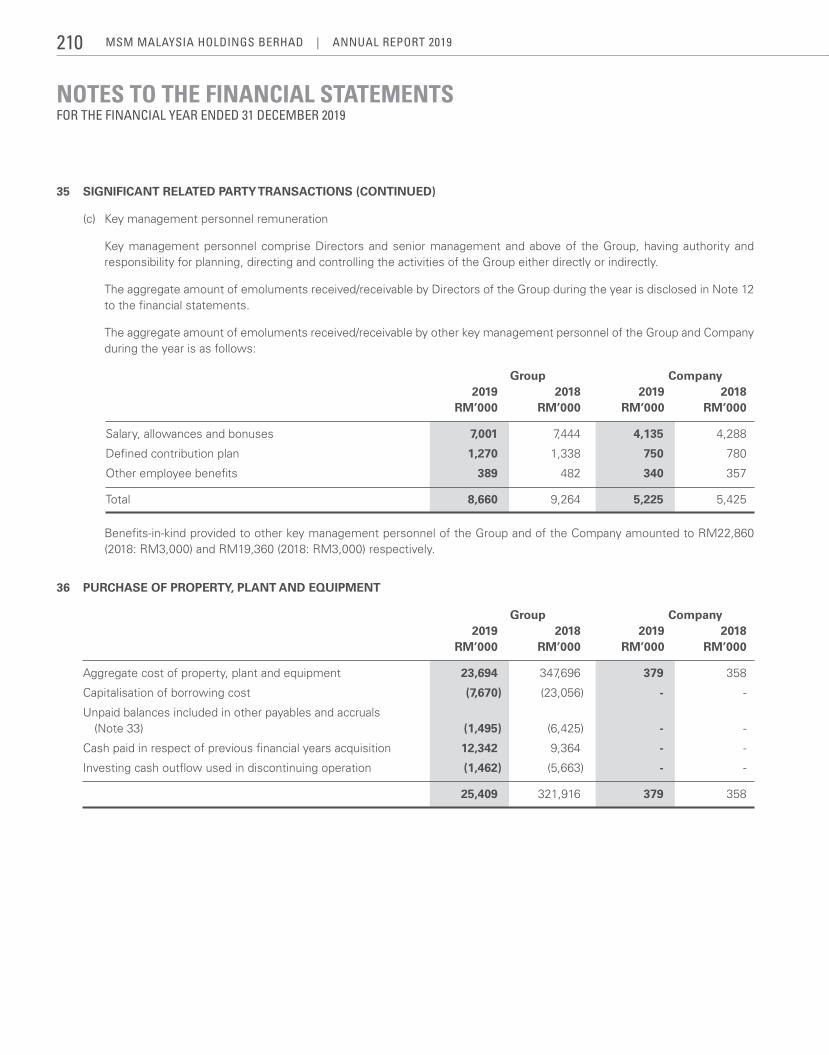
NOTES TO THE FINANCIAL STATEMENTSFOR THE FINANCIAL YEAR ENDED 31 DECEMBER 2019
35 SIGNIFICANT RELATED PARTY TRANSACTIONS (CONTINUED)
(c) Key management personnel remuneration
Key management personnel comprise Directors and senior management and above of the Group, having authority and responsibility for planning, directing and controlling the activities of the Group either directly or indirectly.
The aggregate amount of emoluments received/receivable by Directors of the Group during the year is disclosed in Note 12 to the financial statements.
The aggregate amount of emoluments received/receivable by other key management personnel of the Group and Company during the year is as follows:
Group Company 2019 2018 2019 2018 RM’000 RM’000 RM’000 RM’000
Salary, allowances and bonuses 7,001 7,444 4,135 4,288
Defined contribution plan 1,270 1,338 750 780
Other employee benefits 389 482 340 357
Total 8,660 9,264 5,225 5,425
Benefits-in-kind provided to other key management personnel of the Group and of the Company amounted to RM22,860 (2018: RM3,000) and RM19,360 (2018: RM3,000) respectively.
36 PURCHASE OF PROPERTY, PLANT AND EQUIPMENT
Group Company 2019 2018 2019 2018 RM’000 RM’000 RM’000 RM’000
Aggregate cost of property, plant and equipment 23,694 347,696 379 358
Capitalisation of borrowing cost (7,670) (23,056) - -
Unpaid balances included in other payables and accruals (Note 33) (1,495) (6,425) - -
Cash paid in respect of previous financial years acquisition 12,342 9,364 - -
Investing cash outflow used in discontinuing operation (1,462) (5,663) - -
25,409 321,916 379 358
MSM MalaySia HoldingS BerHad | annual report 2019210
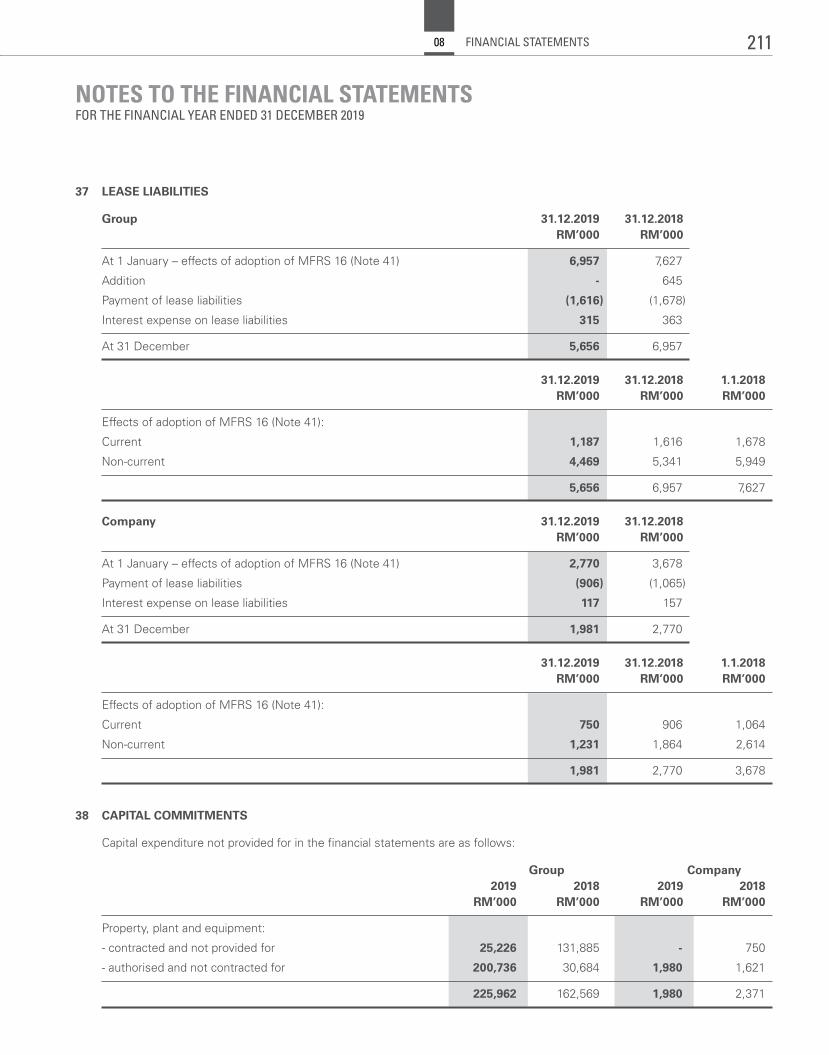
NOTES TO THE FINANCIAL STATEMENTSFOR THE FINANCIAL YEAR ENDED 31 DECEMBER 2019
37 LEASE LIABILITIES
Group 31.12.2019 31.12.2018 RM’000 RM’000
At 1 January – effects of adoption of MFRS 16 (Note 41) 6,957 7,627
Addition - 645
Payment of lease liabilities (1,616) (1,678)
Interest expense on lease liabilities 315 363
At 31 December 5,656 6,957
31.12.2019 31.12.2018 1.1.2018 RM’000 RM’000 RM’000
Effects of adoption of MFRS 16 (Note 41):
Current 1,187 1,616 1,678
Non-current 4,469 5,341 5,949
5,656 6,957 7,627
Company 31.12.2019 31.12.2018 RM’000 RM’000
At 1 January – effects of adoption of MFRS 16 (Note 41) 2,770 3,678
Payment of lease liabilities (906) (1,065)
Interest expense on lease liabilities 117 157
At 31 December 1,981 2,770
31.12.2019 31.12.2018 1.1.2018 RM’000 RM’000 RM’000
Effects of adoption of MFRS 16 (Note 41):
Current 750 906 1,064
Non-current 1,231 1,864 2,614
1,981 2,770 3,678
38 CAPITAL COMMITMENTS
Capital expenditure not provided for in the financial statements are as follows:
Group Company 2019 2018 2019 2018 RM’000 RM’000 RM’000 RM’000
Property, plant and equipment:
- contracted and not provided for 25,226 131,885 - 750
- authorised and not contracted for 200,736 30,684 1,980 1,621
225,962 162,569 1,980 2,371
211FINANCIAL STATEMENTS08
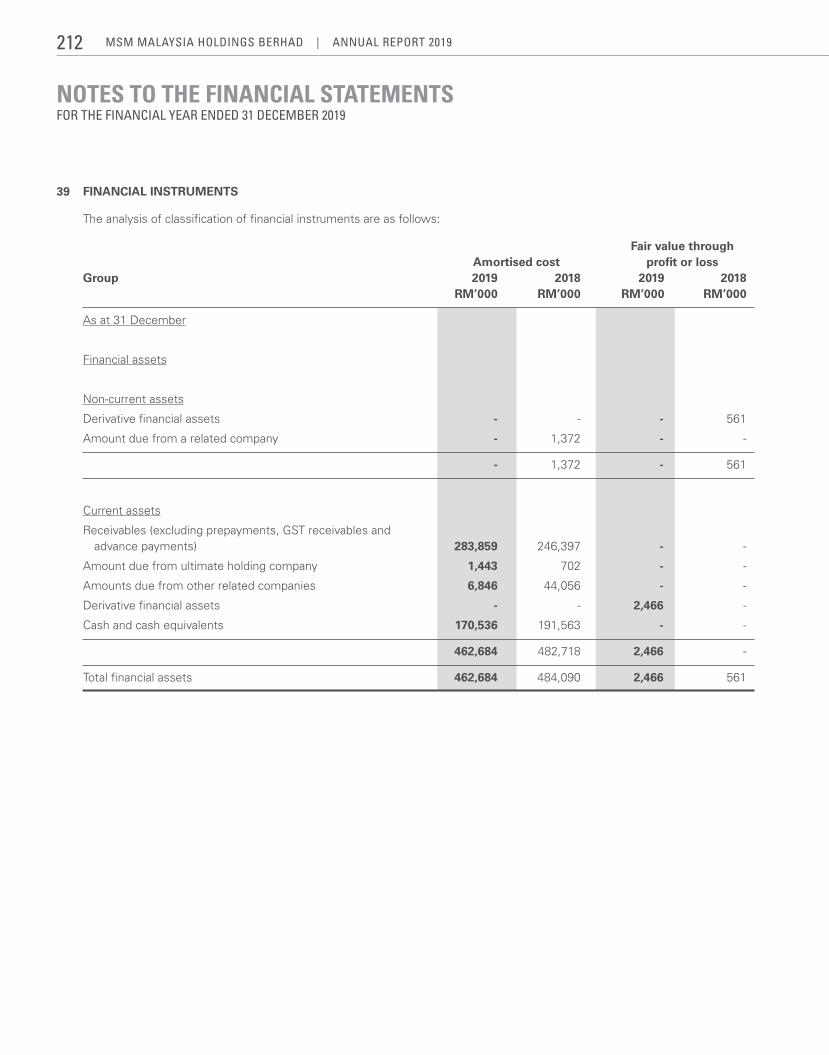
NOTES TO THE FINANCIAL STATEMENTSFOR THE FINANCIAL YEAR ENDED 31 DECEMBER 2019
39 FINANCIAL INSTRUMENTS
The analysis of classification of financial instruments are as follows:
Fair value through Amortised cost profit or lossGroup 2019 2018 2019 2018 RM’000 RM’000 RM’000 RM’000
As at 31 December
Financial assets
Non-current assets
Derivative financial assets - - - 561
Amount due from a related company - 1,372 - -
- 1,372 - 561
Current assets
Receivables (excluding prepayments, GST receivables and advance payments) 283,859 246,397 - -
Amount due from ultimate holding company 1,443 702 - -
Amounts due from other related companies 6,846 44,056 - -
Derivative financial assets - - 2,466 -
Cash and cash equivalents 170,536 191,563 - -
462,684 482,718 2,466 -
Total financial assets 462,684 484,090 2,466 561
MSM MalaySia HoldingS BerHad | annual report 2019212
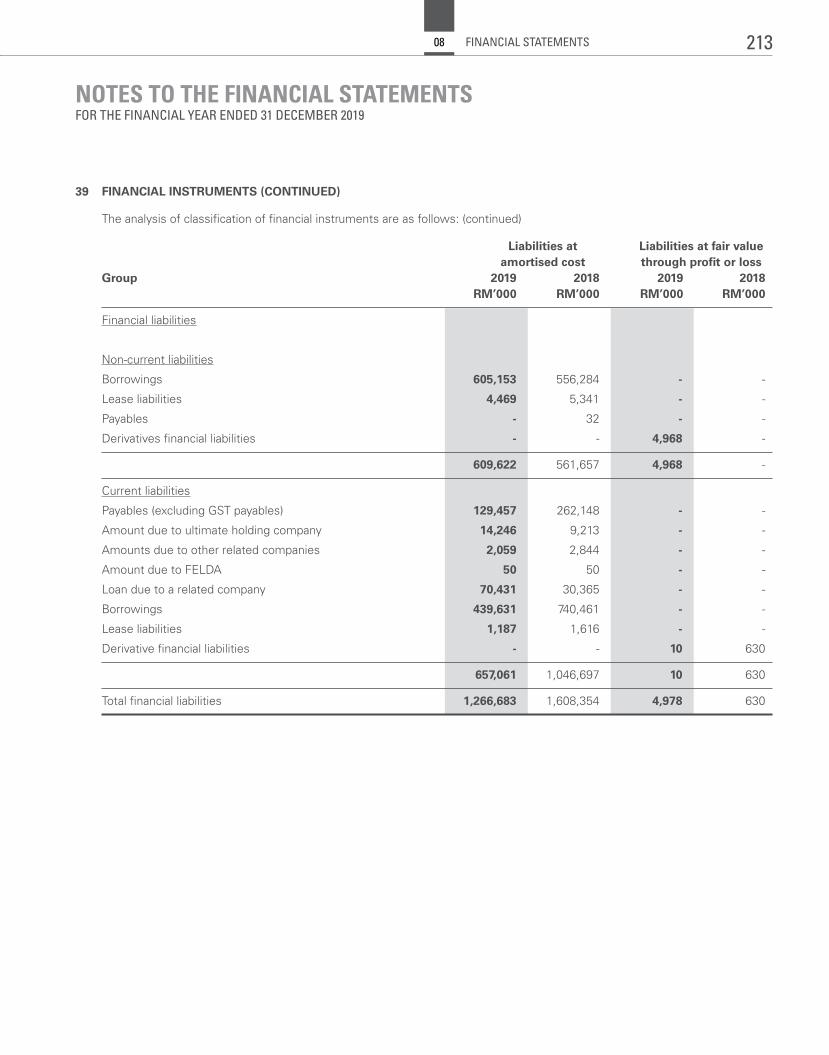
NOTES TO THE FINANCIAL STATEMENTSFOR THE FINANCIAL YEAR ENDED 31 DECEMBER 2019
39 FINANCIAL INSTRUMENTS (CONTINUED)
The analysis of classification of financial instruments are as follows: (continued)
Liabilities at Liabilities at fair value amortised cost through profit or lossGroup 2019 2018 2019 2018 RM’000 RM’000 RM’000 RM’000
Financial liabilities
Non-current liabilities
Borrowings 605,153 556,284 - -
Lease liabilities 4,469 5,341 - -
Payables - 32 - -
Derivatives financial liabilities - - 4,968 -
609,622 561,657 4,968 -
Current liabilities
Payables (excluding GST payables) 129,457 262,148 - -
Amount due to ultimate holding company 14,246 9,213 - -
Amounts due to other related companies 2,059 2,844 - -
Amount due to FELDA 50 50 - -
Loan due to a related company 70,431 30,365 - -
Borrowings 439,631 740,461 - -
Lease liabilities 1,187 1,616 - -
Derivative financial liabilities - - 10 630
657,061 1,046,697 10 630
Total financial liabilities 1,266,683 1,608,354 4,978 630
213FINANCIAL STATEMENTS08
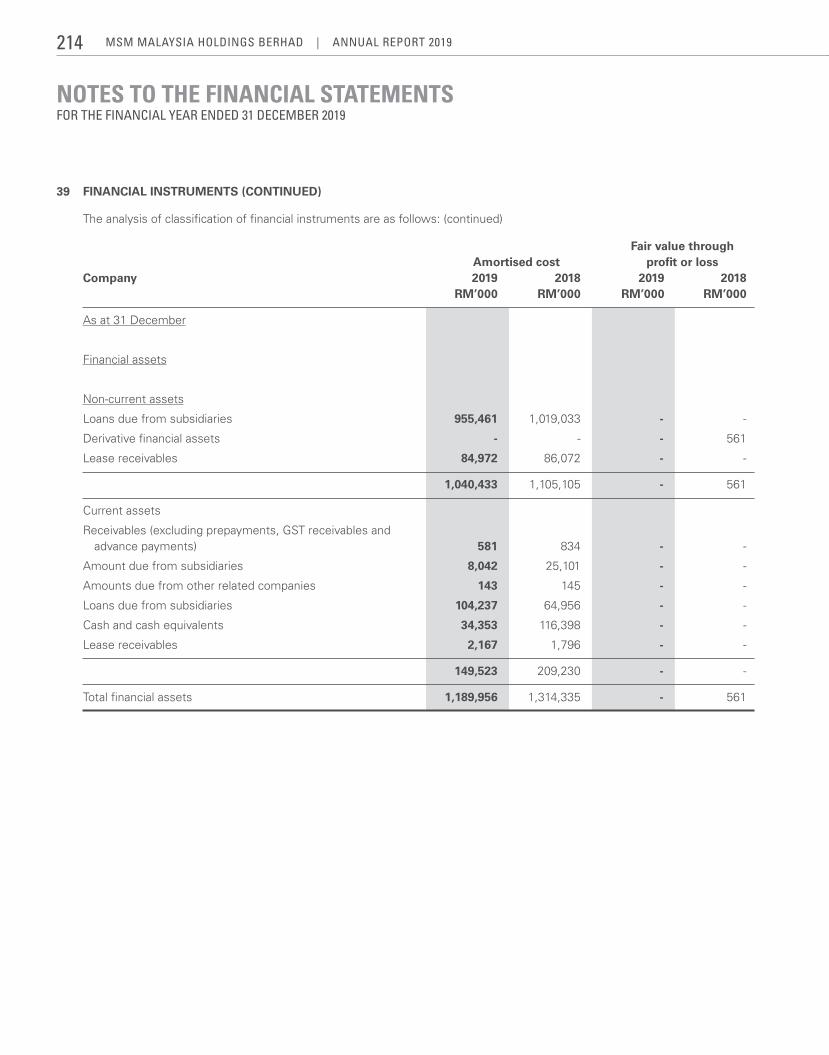
NOTES TO THE FINANCIAL STATEMENTSFOR THE FINANCIAL YEAR ENDED 31 DECEMBER 2019
39 FINANCIAL INSTRUMENTS (CONTINUED)
The analysis of classification of financial instruments are as follows: (continued)
Fair value through Amortised cost profit or lossCompany 2019 2018 2019 2018 RM’000 RM’000 RM’000 RM’000
As at 31 December
Financial assets
Non-current assets
Loans due from subsidiaries 955,461 1,019,033 - -
Derivative financial assets - - - 561
Lease receivables 84,972 86,072 - -
1,040,433 1,105,105 - 561
Current assets
Receivables (excluding prepayments, GST receivables and advance payments) 581 834 - -
Amount due from subsidiaries 8,042 25,101 - -
Amounts due from other related companies 143 145 - -
Loans due from subsidiaries 104,237 64,956 - -
Cash and cash equivalents 34,353 116,398 - -
Lease receivables 2,167 1,796 - -
149,523 209,230 - -
Total financial assets 1,189,956 1,314,335 - 561
MSM MalaySia HoldingS BerHad | annual report 2019214
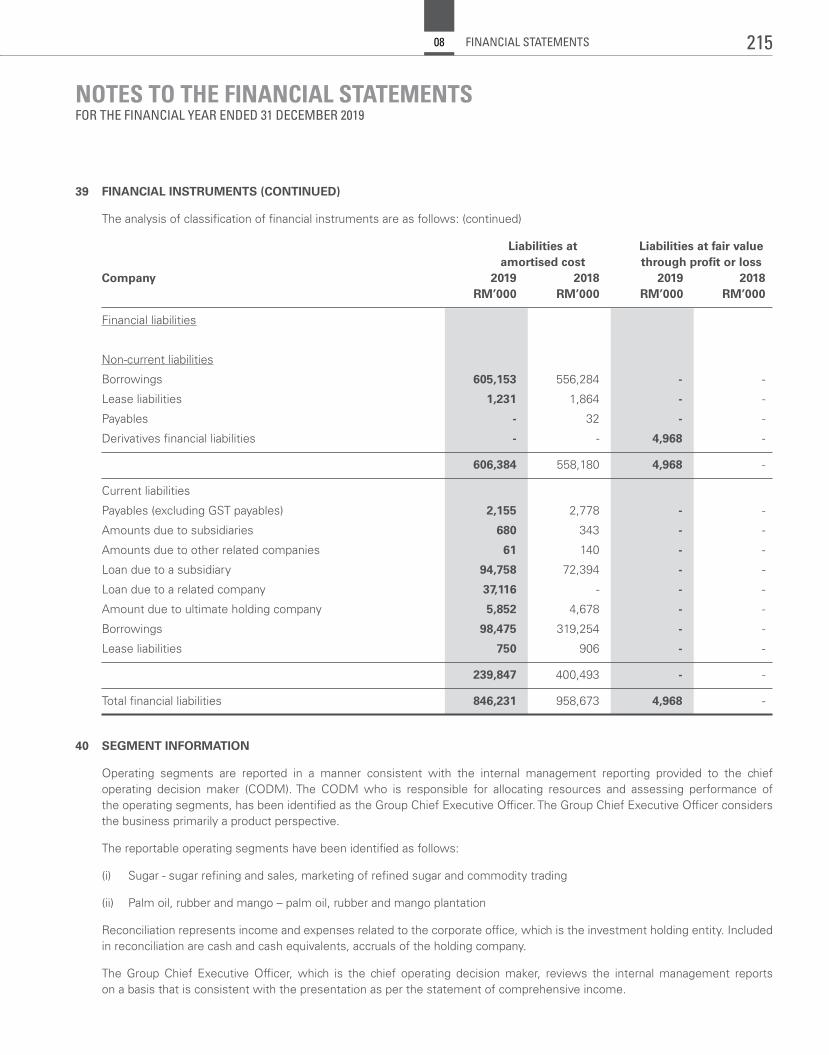
NOTES TO THE FINANCIAL STATEMENTSFOR THE FINANCIAL YEAR ENDED 31 DECEMBER 2019
39 FINANCIAL INSTRUMENTS (CONTINUED)
The analysis of classification of financial instruments are as follows: (continued)
Liabilities at Liabilities at fair value amortised cost through profit or lossCompany 2019 2018 2019 2018 RM’000 RM’000 RM’000 RM’000
Financial liabilities
Non-current liabilities
Borrowings 605,153 556,284 - -
Lease liabilities 1,231 1,864 - -
Payables - 32 - -
Derivatives financial liabilities - - 4,968 -
606,384 558,180 4,968 -
Current liabilities
Payables (excluding GST payables) 2,155 2,778 - -
Amounts due to subsidiaries 680 343 - -
Amounts due to other related companies 61 140 - -
Loan due to a subsidiary 94,758 72,394 - -
Loan due to a related company 37,116 - - -
Amount due to ultimate holding company 5,852 4,678 - -
Borrowings 98,475 319,254 - -
Lease liabilities 750 906 - -
239,847 400,493 - -
Total financial liabilities 846,231 958,673 4,968 -
40 SEGMENT INFORMATION
Operating segments are reported in a manner consistent with the internal management reporting provided to the chief operating decision maker (CODM). The CODM who is responsible for allocating resources and assessing performance of the operating segments, has been identified as the Group Chief Executive Officer. The Group Chief Executive Officer considers the business primarily a product perspective.
The reportable operating segments have been identified as follows:
(i) Sugar - sugar refining and sales, marketing of refined sugar and commodity trading
(ii) Palm oil, rubber and mango – palm oil, rubber and mango plantation
Reconciliation represents income and expenses related to the corporate office, which is the investment holding entity. Included in reconciliation are cash and cash equivalents, accruals of the holding company.
The Group Chief Executive Officer, which is the chief operating decision maker, reviews the internal management reports on a basis that is consistent with the presentation as per the statement of comprehensive income.
215FINANCIAL STATEMENTS08
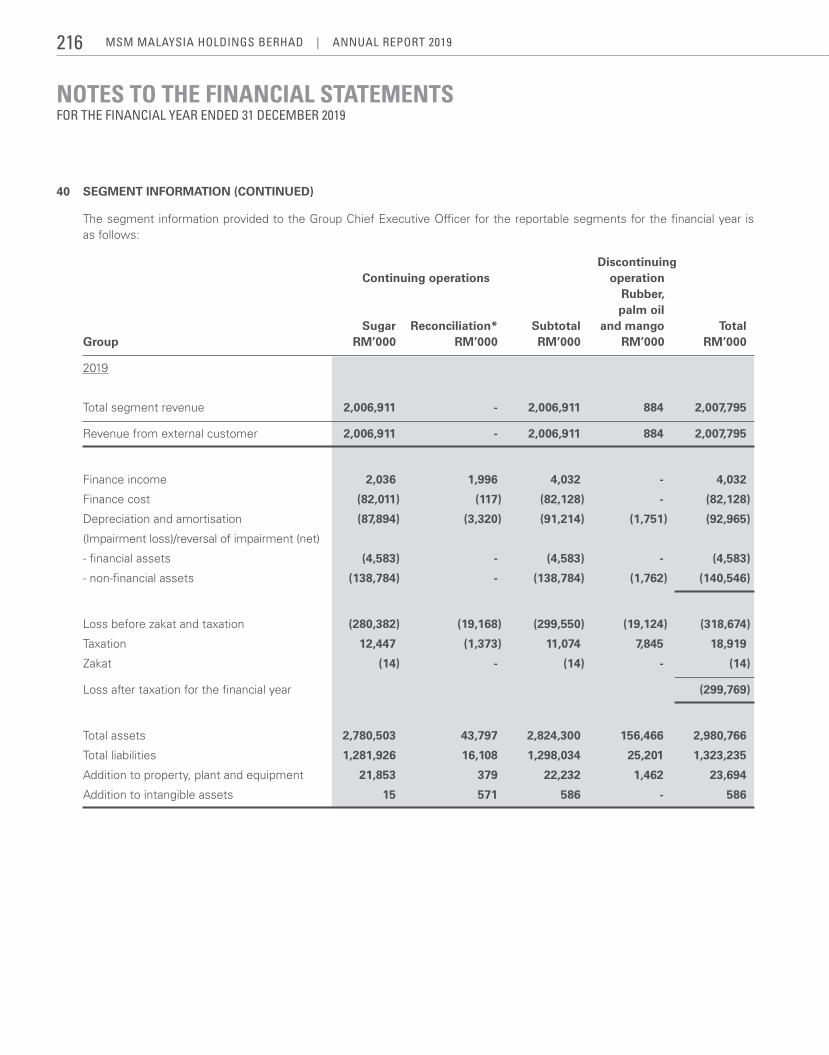
NOTES TO THE FINANCIAL STATEMENTSFOR THE FINANCIAL YEAR ENDED 31 DECEMBER 2019
40 SEGMENT INFORMATION (CONTINUED)
The segment information provided to the Group Chief Executive Officer for the reportable segments for the financial year is as follows:
Discontinuing Continuing operations operation Rubber, palm oil Sugar Reconciliation* Subtotal and mango Total Group RM’000 RM’000 RM’000 RM’000 RM’000
2019
Total segment revenue 2,006,911 - 2,006,911 884 2,007,795
Revenue from external customer 2,006,911 - 2,006,911 884 2,007,795
Finance income 2,036 1,996 4,032 - 4,032
Finance cost (82,011) (117) (82,128) - (82,128)
Depreciation and amortisation (87,894) (3,320) (91,214) (1,751) (92,965)
(Impairment loss)/reversal of impairment (net)
- financial assets (4,583) - (4,583) - (4,583)
- non-financial assets (138,784) - (138,784) (1,762) (140,546)
Loss before zakat and taxation (280,382) (19,168) (299,550) (19,124) (318,674)
Taxation 12,447 (1,373) 11,074 7,845 18,919
Zakat (14) - (14) - (14)
Loss after taxation for the financial year (299,769)
Total assets 2,780,503 43,797 2,824,300 156,466 2,980,766
Total liabilities 1,281,926 16,108 1,298,034 25,201 1,323,235
Addition to property, plant and equipment 21,853 379 22,232 1,462 23,694
Addition to intangible assets 15 571 586 - 586
MSM MalaySia HoldingS BerHad | annual report 2019216
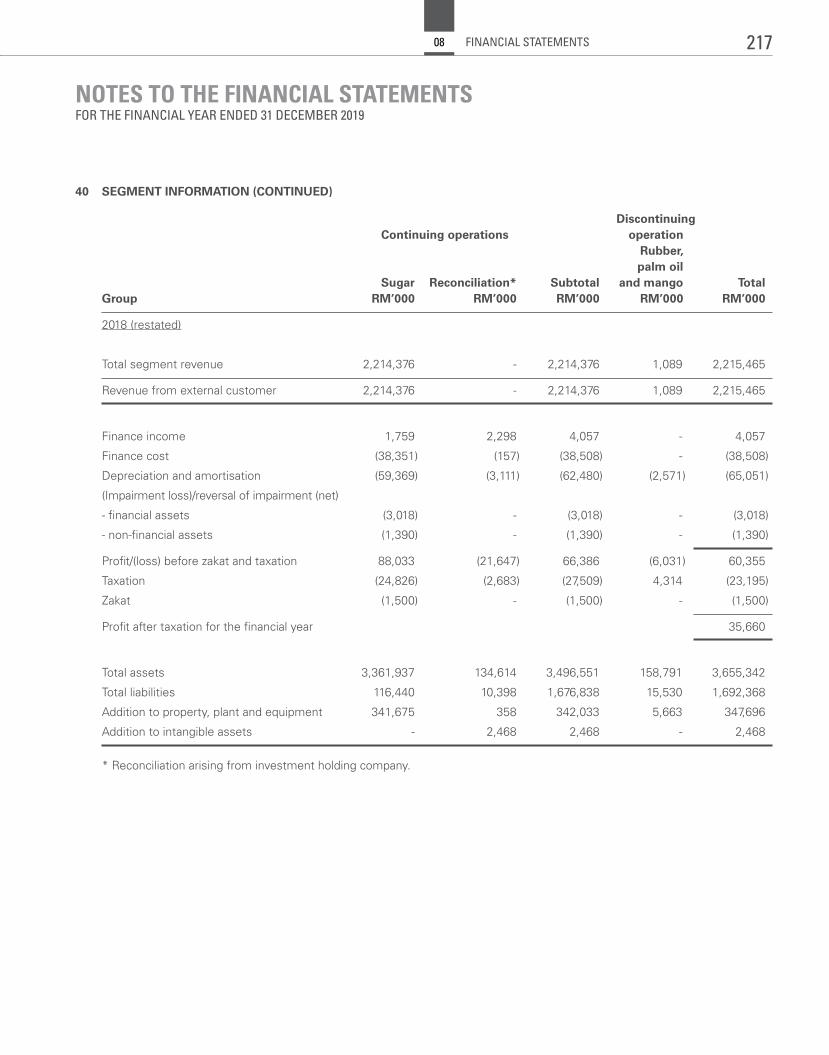
NOTES TO THE FINANCIAL STATEMENTSFOR THE FINANCIAL YEAR ENDED 31 DECEMBER 2019
40 SEGMENT INFORMATION (CONTINUED)
Discontinuing Continuing operations operation Rubber, palm oil Sugar Reconciliation* Subtotal and mango Total Group RM’000 RM’000 RM’000 RM’000 RM’000
2018 (restated)
Total segment revenue 2,214,376 - 2,214,376 1,089 2,215,465
Revenue from external customer 2,214,376 - 2,214,376 1,089 2,215,465
Finance income 1,759 2,298 4,057 - 4,057
Finance cost (38,351) (157) (38,508) - (38,508)
Depreciation and amortisation (59,369) (3,111) (62,480) (2,571) (65,051)
(Impairment loss)/reversal of impairment (net)
- financial assets (3,018) - (3,018) - (3,018)
- non-financial assets (1,390) - (1,390) - (1,390)
Profit/(loss) before zakat and taxation 88,033 (21,647) 66,386 (6,031) 60,355
Taxation (24,826) (2,683) (27,509) 4,314 (23,195)
Zakat (1,500) - (1,500) - (1,500)
Profit after taxation for the financial year 35,660
Total assets 3,361,937 134,614 3,496,551 158,791 3,655,342
Total liabilities 116,440 10,398 1,676,838 15,530 1,692,368
Addition to property, plant and equipment 341,675 358 342,033 5,663 347,696
Addition to intangible assets - 2,468 2,468 - 2,468
* Reconciliation arising from investment holding company.
217FINANCIAL STATEMENTS08
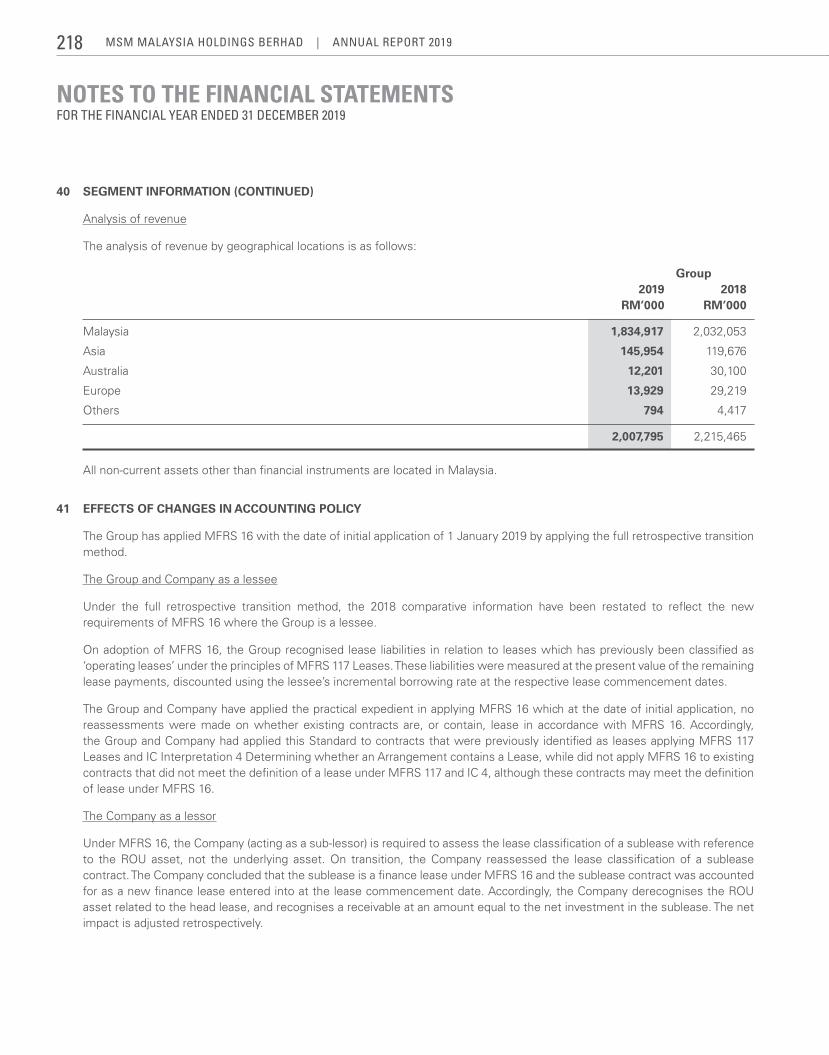
NOTES TO THE FINANCIAL STATEMENTSFOR THE FINANCIAL YEAR ENDED 31 DECEMBER 2019
40 SEGMENT INFORMATION (CONTINUED)
Analysis of revenue
The analysis of revenue by geographical locations is as follows:
Group 2019 2018 RM’000 RM’000
Malaysia 1,834,917 2,032,053
Asia 145,954 119,676
Australia 12,201 30,100
Europe 13,929 29,219
Others 794 4,417
2,007,795 2,215,465
All non-current assets other than financial instruments are located in Malaysia.
41 EFFECTS OF CHANGES IN ACCOUNTING POLICY
The Group has applied MFRS 16 with the date of initial application of 1 January 2019 by applying the full retrospective transition method.
The Group and Company as a lessee
Under the full retrospective transition method, the 2018 comparative information have been restated to reflect the new requirements of MFRS 16 where the Group is a lessee.
On adoption of MFRS 16, the Group recognised lease liabilities in relation to leases which has previously been classified as ‘operatingleases’undertheprinciplesofMFRS117Leases.Theseliabilitiesweremeasuredatthepresentvalueoftheremaininglease payments, discounted using the lessee’s incremental borrowing rate at the respective lease commencement dates.
The Group and Company have applied the practical expedient in applying MFRS 16 which at the date of initial application, no reassessments were made on whether existing contracts are, or contain, lease in accordance with MFRS 16. Accordingly, the Group and Company had applied this Standard to contracts that were previously identified as leases applying MFRS 117 Leases and IC Interpretation 4 Determining whether an Arrangement contains a Lease, while did not apply MFRS 16 to existing contracts that did not meet the definition of a lease under MFRS 117 and IC 4, although these contracts may meet the definition of lease under MFRS 16.
The Company as a lessor
Under MFRS 16, the Company (acting as a sub-lessor) is required to assess the lease classification of a sublease with reference to the ROU asset, not the underlying asset. On transition, the Company reassessed the lease classification of a sublease contract. The Company concluded that the sublease is a finance lease under MFRS 16 and the sublease contract was accounted for as a new finance lease entered into at the lease commencement date. Accordingly, the Company derecognises the ROU asset related to the head lease, and recognises a receivable at an amount equal to the net investment in the sublease. The net impact is adjusted retrospectively.
MSM MalaySia HoldingS BerHad | annual report 2019218
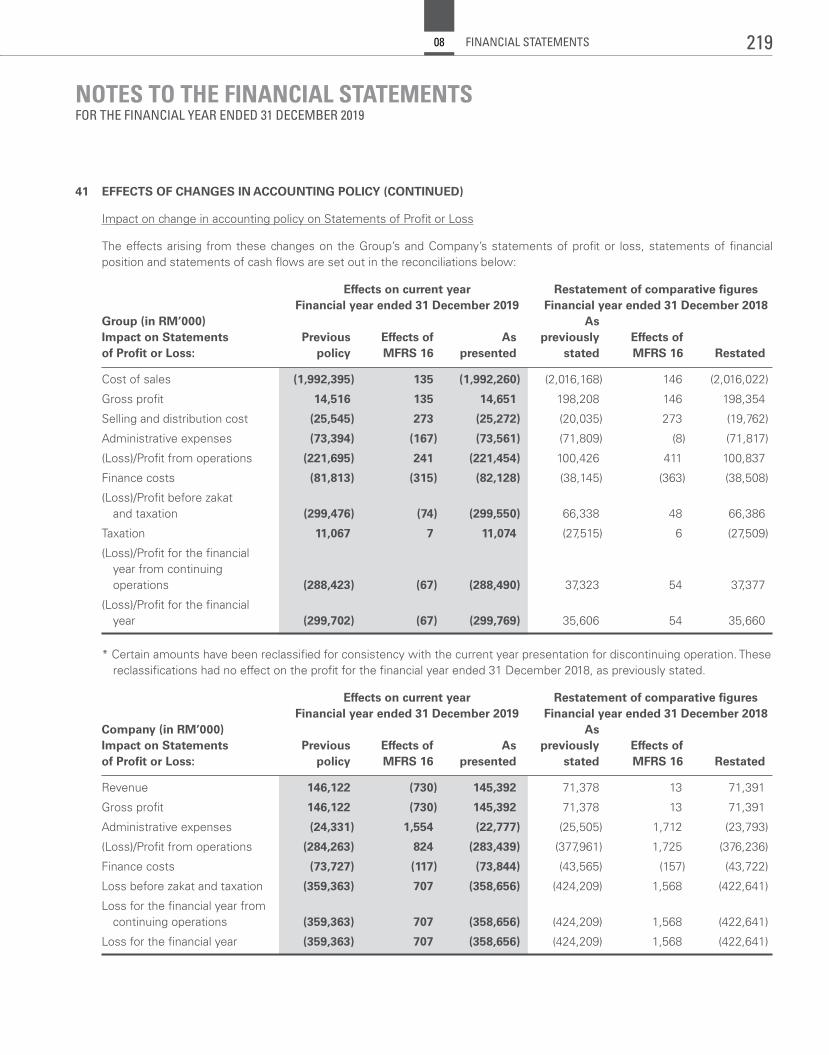
NOTES TO THE FINANCIAL STATEMENTSFOR THE FINANCIAL YEAR ENDED 31 DECEMBER 2019
41 EFFECTS OF CHANGES IN ACCOUNTING POLICY (CONTINUED)
Impact on change in accounting policy on Statements of Profit or Loss
The effects arising from these changes on the Group’s and Company’s statements of profit or loss, statements of financial position and statements of cash flows are set out in the reconciliations below:
Effects on current year Restatement of comparative figures Financial year ended 31 December 2019 Financial year ended 31 December 2018Group (in RM’000) As Impact on Statements Previous Effects of As previously Effects of of Profit or Loss: policy MFRS 16 presented stated MFRS 16 Restated
Cost of sales (1,992,395) 135 (1,992,260) (2,016,168) 146 (2,016,022)
Gross profit 14,516 135 14,651 198,208 146 198,354
Selling and distribution cost (25,545) 273 (25,272) (20,035) 273 (19,762)
Administrative expenses (73,394) (167) (73,561) (71,809) (8) (71,817)
(Loss)/Profit from operations (221,695) 241 (221,454) 100,426 411 100,837
Finance costs (81,813) (315) (82,128) (38,145) (363) (38,508)
(Loss)/Profit before zakat and taxation (299,476) (74) (299,550) 66,338 48 66,386
Taxation 11,067 7 11,074 (27,515) 6 (27,509)
(Loss)/Profit for the financial year from continuing operations (288,423) (67) (288,490) 37,323 54 37,377
(Loss)/Profit for the financial year (299,702) (67) (299,769) 35,606 54 35,660
* Certain amounts have been reclassified for consistency with the current year presentation for discontinuing operation. These reclassifications had no effect on the profit for the financial year ended 31 December 2018, as previously stated.
Effects on current year Restatement of comparative figures Financial year ended 31 December 2019 Financial year ended 31 December 2018Company (in RM’000) As Impact on Statements Previous Effects of As previously Effects of of Profit or Loss: policy MFRS 16 presented stated MFRS 16 Restated
Revenue 146,122 (730) 145,392 71,378 13 71,391
Gross profit 146,122 (730) 145,392 71,378 13 71,391
Administrative expenses (24,331) 1,554 (22,777) (25,505) 1,712 (23,793)
(Loss)/Profit from operations (284,263) 824 (283,439) (377,961) 1,725 (376,236)
Finance costs (73,727) (117) (73,844) (43,565) (157) (43,722)
Loss before zakat and taxation (359,363) 707 (358,656) (424,209) 1,568 (422,641)
Loss for the financial year from continuing operations (359,363) 707 (358,656) (424,209) 1,568 (422,641)
Loss for the financial year (359,363) 707 (358,656) (424,209) 1,568 (422,641)
219FINANCIAL STATEMENTS08
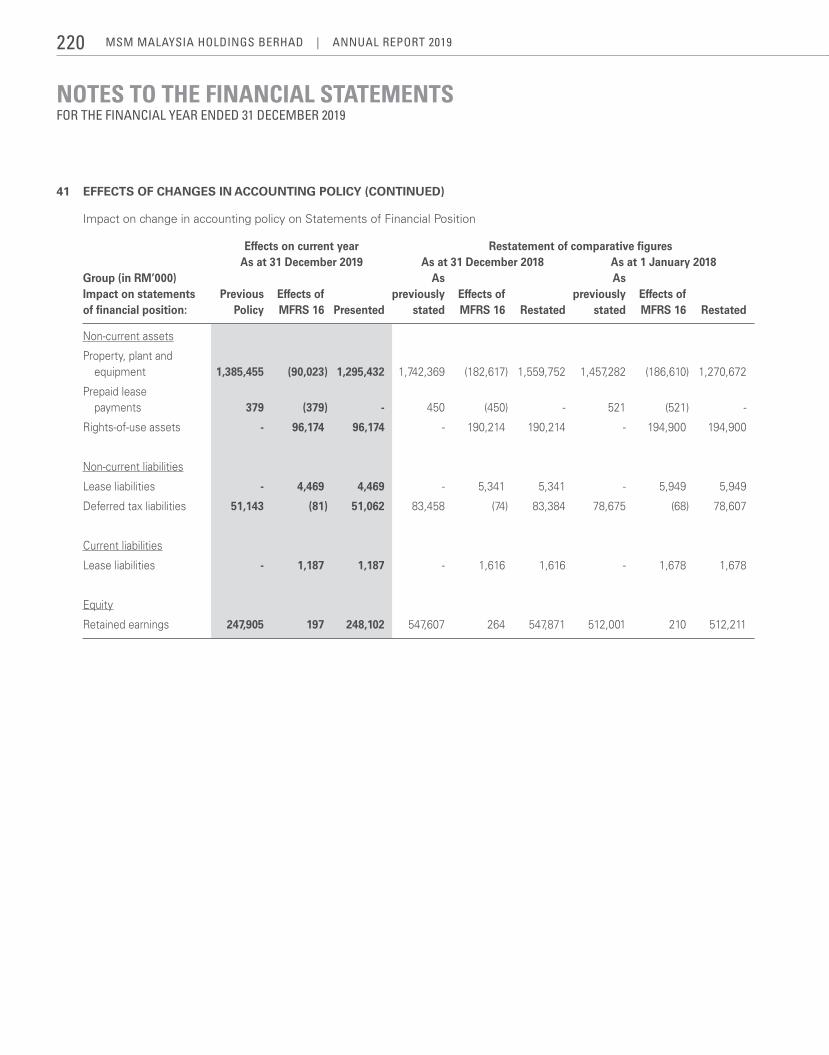
NOTES TO THE FINANCIAL STATEMENTSFOR THE FINANCIAL YEAR ENDED 31 DECEMBER 2019
41 EFFECTS OF CHANGES IN ACCOUNTING POLICY (CONTINUED)
Impact on change in accounting policy on Statements of Financial Position
Effects on current year Restatement of comparative figures As at 31 December 2019 As at 31 December 2018 As at 1 January 2018Group (in RM’000) As As Impact on statements Previous Effects of previously Effects of previously Effects of of financial position: Policy MFRS 16 Presented stated MFRS 16 Restated stated MFRS 16 Restated
Non-current assets
Property, plant and equipment 1,385,455 (90,023) 1,295,432 1,742,369 (182,617) 1,559,752 1,457,282 (186,610) 1,270,672
Prepaid lease payments 379 (379) - 450 (450) - 521 (521) -
Rights-of-use assets - 96,174 96,174 - 190,214 190,214 - 194,900 194,900
Non-current liabilities
Lease liabilities - 4,469 4,469 - 5,341 5,341 - 5,949 5,949
Deferred tax liabilities 51,143 (81) 51,062 83,458 (74) 83,384 78,675 (68) 78,607
Current liabilities
Lease liabilities - 1,187 1,187 - 1,616 1,616 - 1,678 1,678
Equity
Retained earnings 247,905 197 248,102 547,607 264 547,871 512,001 210 512,211
MSM MalaySia HoldingS BerHad | annual report 2019220
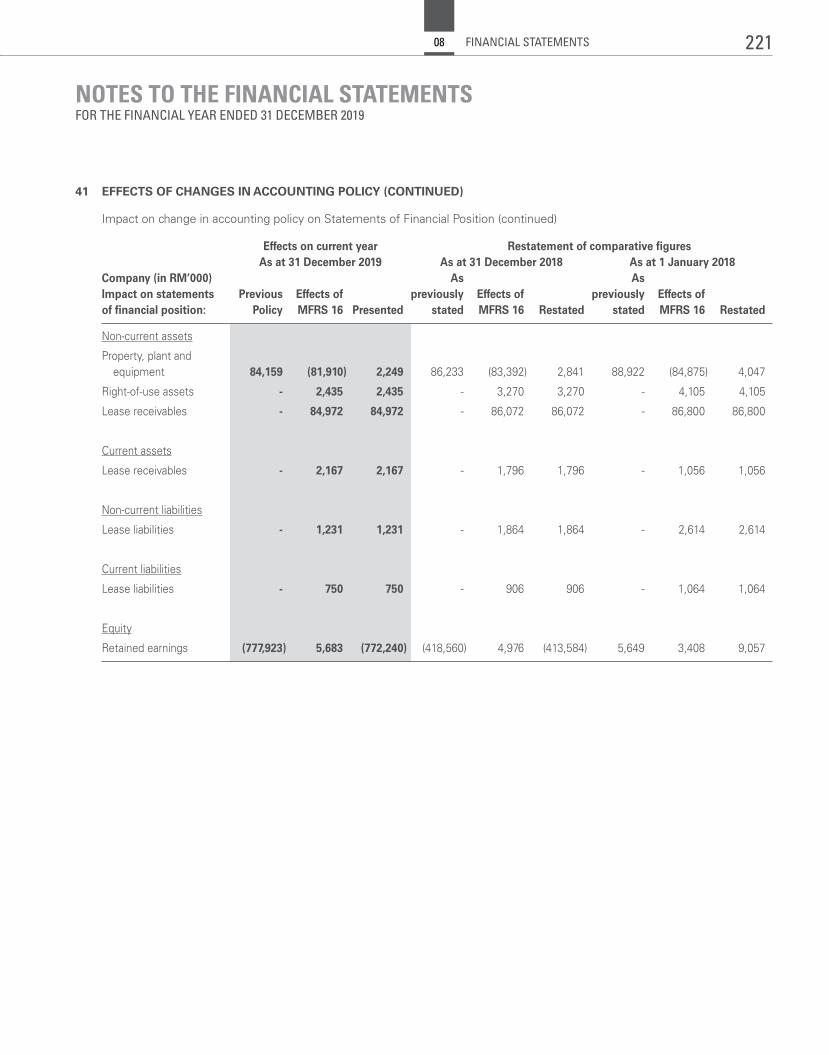
NOTES TO THE FINANCIAL STATEMENTSFOR THE FINANCIAL YEAR ENDED 31 DECEMBER 2019
41 EFFECTS OF CHANGES IN ACCOUNTING POLICY (CONTINUED)
Impact on change in accounting policy on Statements of Financial Position (continued)
Effects on current year Restatement of comparative figures As at 31 December 2019 As at 31 December 2018 As at 1 January 2018Company (in RM’000) As As Impact on statements Previous Effects of previously Effects of previously Effects of of financial position: Policy MFRS 16 Presented stated MFRS 16 Restated stated MFRS 16 Restated
Non-current assets
Property, plant and equipment 84,159 (81,910) 2,249 86,233 (83,392) 2,841 88,922 (84,875) 4,047
Right-of-use assets - 2,435 2,435 - 3,270 3,270 - 4,105 4,105
Lease receivables - 84,972 84,972 - 86,072 86,072 - 86,800 86,800
Current assets
Lease receivables - 2,167 2,167 - 1,796 1,796 - 1,056 1,056
Non-current liabilities
Lease liabilities - 1,231 1,231 - 1,864 1,864 - 2,614 2,614
Current liabilities
Lease liabilities - 750 750 - 906 906 - 1,064 1,064
Equity
Retained earnings (777,923) 5,683 (772,240) (418,560) 4,976 (413,584) 5,649 3,408 9,057
221FINANCIAL STATEMENTS08
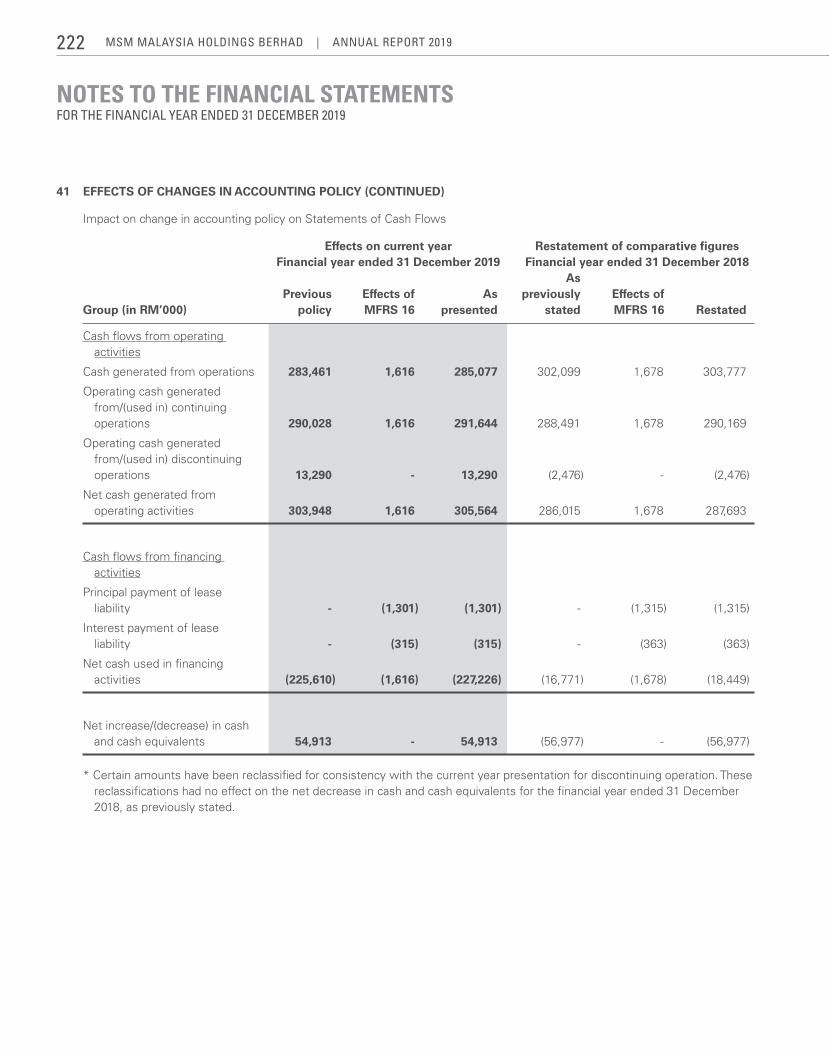
NOTES TO THE FINANCIAL STATEMENTSFOR THE FINANCIAL YEAR ENDED 31 DECEMBER 2019
41 EFFECTS OF CHANGES IN ACCOUNTING POLICY (CONTINUED)
Impact on change in accounting policy on Statements of Cash Flows
Effects on current year Restatement of comparative figures Financial year ended 31 December 2019 Financial year ended 31 December 2018 As Previous Effects of As previously Effects of Group (in RM’000) policy MFRS 16 presented stated MFRS 16 Restated
Cash flows from operating activities
Cash generated from operations 283,461 1,616 285,077 302,099 1,678 303,777
Operating cash generated from/(used in) continuing operations 290,028 1,616 291,644 288,491 1,678 290,169
Operating cash generated from/(used in) discontinuing operations 13,290 - 13,290 (2,476) - (2,476)
Net cash generated from operating activities 303,948 1,616 305,564 286,015 1,678 287,693
Cash flows from financing activities
Principal payment of lease liability - (1,301) (1,301) - (1,315) (1,315)
Interest payment of lease liability - (315) (315) - (363) (363)
Net cash used in financing activities (225,610) (1,616) (227,226) (16,771) (1,678) (18,449)
Net increase/(decrease) in cash and cash equivalents 54,913 - 54,913 (56,977) - (56,977)
* Certain amounts have been reclassified for consistency with the current year presentation for discontinuing operation. These reclassifications had no effect on the net decrease in cash and cash equivalents for the financial year ended 31 December 2018, as previously stated.
MSM MalaySia HoldingS BerHad | annual report 2019222
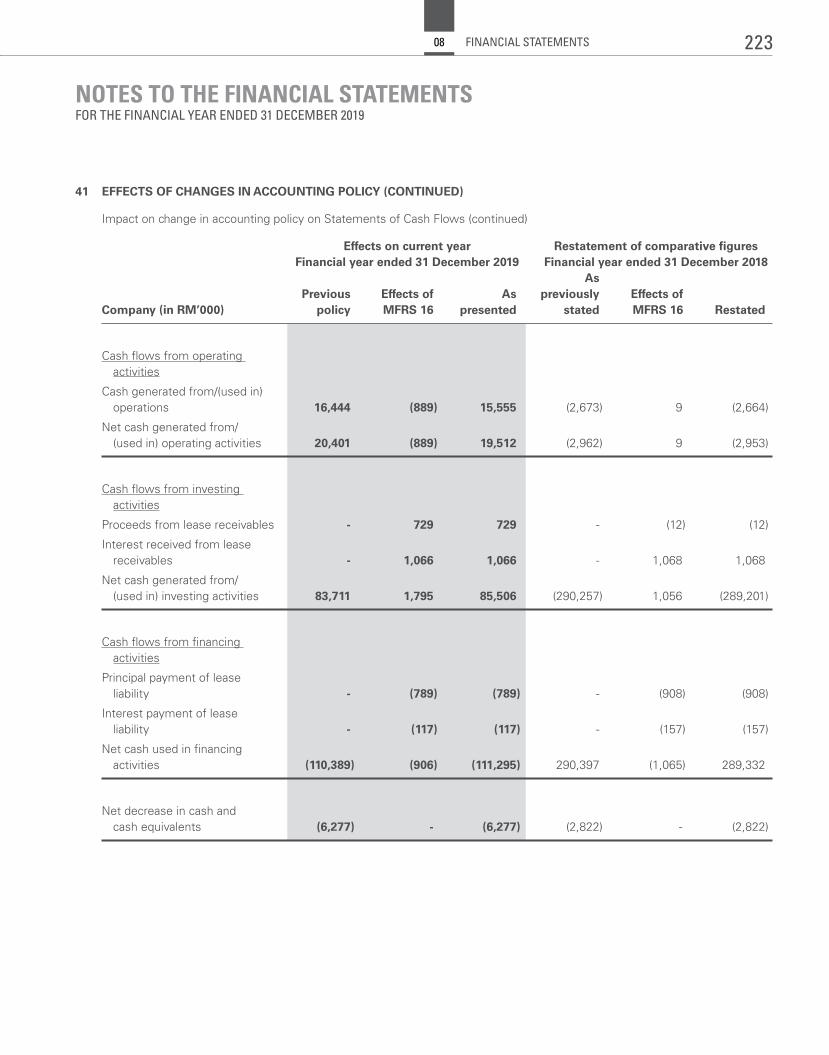
NOTES TO THE FINANCIAL STATEMENTSFOR THE FINANCIAL YEAR ENDED 31 DECEMBER 2019
41 EFFECTS OF CHANGES IN ACCOUNTING POLICY (CONTINUED)
Impact on change in accounting policy on Statements of Cash Flows (continued)
Effects on current year Restatement of comparative figures Financial year ended 31 December 2019 Financial year ended 31 December 2018 As Previous Effects of As previously Effects of Company (in RM’000) policy MFRS 16 presented stated MFRS 16 Restated
Cash flows from operating activities
Cash generated from/(used in) operations 16,444 (889) 15,555 (2,673) 9 (2,664)
Net cash generated from/ (used in) operating activities 20,401 (889) 19,512 (2,962) 9 (2,953)
Cash flows from investing activities
Proceeds from lease receivables - 729 729 - (12) (12)
Interest received from lease receivables - 1,066 1,066 - 1,068 1,068
Net cash generated from/ (used in) investing activities 83,711 1,795 85,506 (290,257) 1,056 (289,201)
Cash flows from financing activities
Principal payment of lease liability - (789) (789) - (908) (908)
Interest payment of lease liability - (117) (117) - (157) (157)
Net cash used in financing activities (110,389) (906) (111,295) 290,397 (1,065) 289,332
Net decrease in cash and cash equivalents (6,277) - (6,277) (2,822) - (2,822)
223FINANCIAL STATEMENTS08
NOTES TO THE FINANCIAL STATEMENTSFOR THE FINANCIAL YEAR ENDED 31 DECEMBER 2019
42 EVENTS AFTER THE REPORTING DATE
a) Impact of Covid-19
In 2020, the global economic impact from the Covid-19 pandemic will be felt by industries and billions of people across the world. Even though a large portion of the Group’s activities are considered as essential operations, it is foreseen that the Covid-19 pandemic may have financial implications to the Group, including the results of the Group and measurement of its assets and liabilities of the Group for the next financial year. The Board of Directors of the Company has also performed a preliminary assessment of its cash flows for the next twelve months. The Board of Directors of the Company are closely monitoring the situation and will make the appropriate decisions and undertake the necessary measures to preserve value.
b) Cessation of operations of a subsidiary
On 29 January 2020, a townhall was held for a subsidiary's employees where they were informed regarding management's plans to cease the operation of the subsidiary. This follows the decision by the Directors of the Company on 20 November 2019 to cease the operation of its raw sugar refining division of the subsidiary in June 2020. The employees were presented with the option of being relocated to the other subsidiaries' operations. As of the date of this report, the decision from the employees regarding the relocation has yet to be made.
c) Rescission of the sale and purchase agreement between a subsidiary and F&N Agrivalley Sdn Bhd
On 9 April 2020, the Group issued a letter to F&N to exercise its rights to rescind the sale and purchase agreement in respect of the disposal of its leasehold agriculture land located at Chuping, Perlis, entered on 8 October 2019 as disclosed in Note 29 to the financial statements. As of the date of this report, the Group continues the plan to sell the leasehold agriculture land located at Chuping, Perlis and is of the view that the transacted value in the F&N sale and purchase agreement of RM156,000,000 remains the most reflective market value to be used as fair value less costs to sell for the purposes of measurement of the assets held for sale. Management expects the sale to be completed within the financial year ending 31 December 2020.
43 APPROVAL OF FINANCIAL STATEMENTS
The financial statement have been approved for issue in accordance with a resolution of the Board of Directors on 17 April 2020.
MSM MalaySia HoldingS BerHad | annual report 2019224
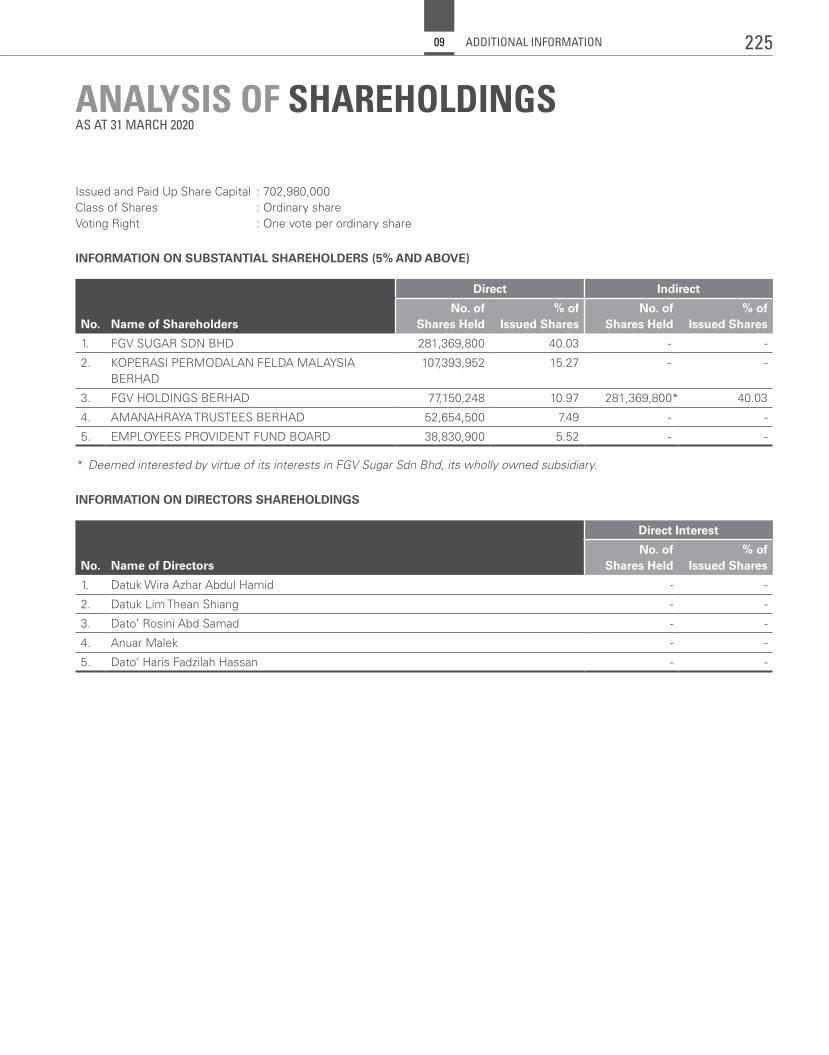
ANALYSIS OF SHAREHOLDINGSAS AT 31 MARCH 2020
Issued and Paid Up Share Capital : 702,980,000Class of Shares : Ordinary shareVoting Right : One vote per ordinary share
INFORMATION ON SUBSTANTIAL SHAREHOLDERS (5% AND ABOVE)
No. Name of Shareholders
Direct Indirect
No. of Shares Held
% of Issued Shares
No. of Shares Held
% of Issued Shares
1. FGV SUGAR SDN BHD 281,369,800 40.03 - -
2. KOPERASI PERMODALAN FELDA MALAYSIA BERHAD
107,393,952 15.27 - -
3. FGV HOLDINGS BERHAD 77,150,248 10.97 281,369,800* 40.03
4. AMANAHRAYA TRUSTEES BERHAD 52,654,500 7.49 - -
5. EMPLOYEES PROVIDENT FUND BOARD 38,830,900 5.52 - -
* Deemed interested by virtue of its interests in FGV Sugar Sdn Bhd, its wholly owned subsidiary.
INFORMATION ON DIRECTORS SHAREHOLDINGS
No. Name of Directors
Direct Interest
No. of Shares Held
% of Issued Shares
1. Datuk Wira Azhar Abdul Hamid - -
2. Datuk Lim Thean Shiang - -
3. Dato’ Rosini Abd Samad - -
4. Anuar Malek - -
5. Dato’ Haris Fadzilah Hassan - -
225ADDITIONAL INFORMATION09
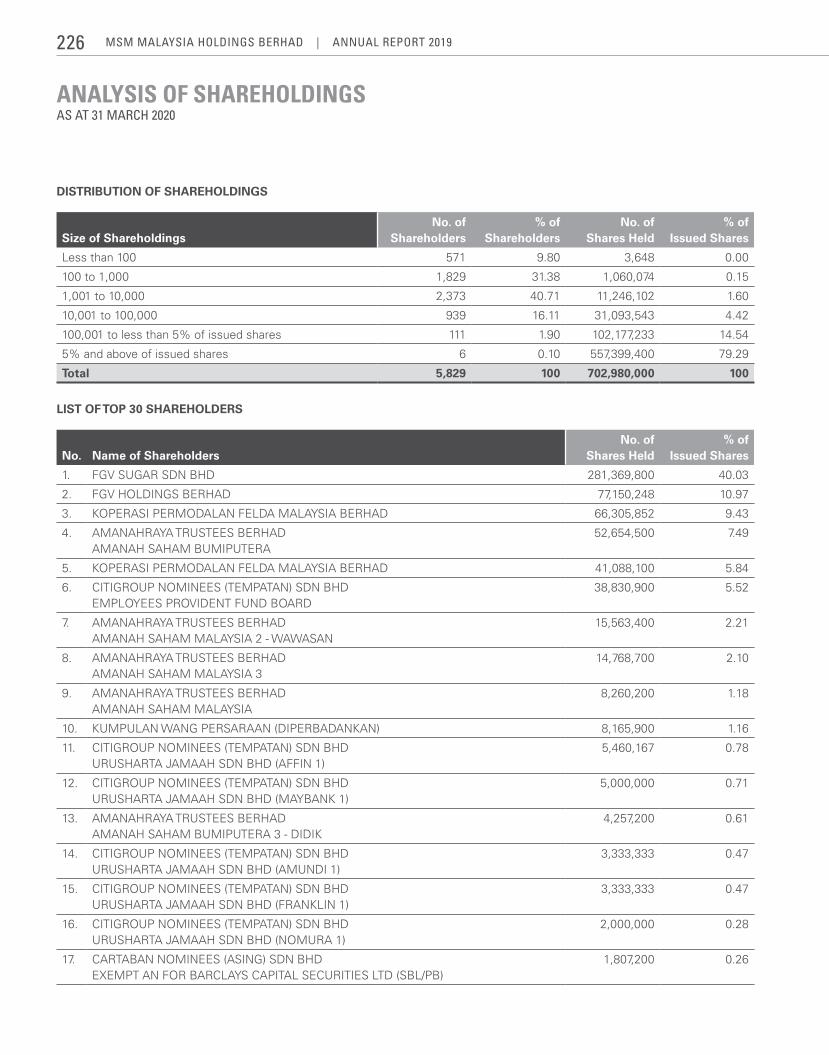
ANALYSIS OF SHAREHOLDINGSAS AT 31 MARCH 2020
DISTRIBUTION OF SHAREHOLDINGS
Size of ShareholdingsNo. of
Shareholders% of
ShareholdersNo. of
Shares Held% of
Issued Shares
Less than 100 571 9.80 3,648 0.00
100 to 1,000 1,829 31.38 1,060,074 0.15
1,001 to 10,000 2,373 40.71 11,246,102 1.60
10,001 to 100,000 939 16.11 31,093,543 4.42
100,001 to less than 5% of issued shares 111 1.90 102,177,233 14.54
5% and above of issued shares 6 0.10 557,399,400 79.29
Total 5,829 100 702,980,000 100
LIST OF TOP 30 SHAREHOLDERS
No. Name of ShareholdersNo. of
Shares Held% of
Issued Shares
1. FGV SUGAR SDN BHD 281,369,800 40.03
2. FGV HOLDINGS BERHAD 77,150,248 10.97
3. KOPERASI PERMODALAN FELDA MALAYSIA BERHAD 66,305,852 9.43
4. AMANAHRAYA TRUSTEES BERHADAMANAH SAHAM BUMIPUTERA
52,654,500 7.49
5. KOPERASI PERMODALAN FELDA MALAYSIA BERHAD 41,088,100 5.84
6. CITIGROUP NOMINEES (TEMPATAN) SDN BHDEMPLOYEES PROVIDENT FUND BOARD
38,830,900 5.52
7. AMANAHRAYA TRUSTEES BERHADAMANAH SAHAM MALAYSIA 2 - WAWASAN
15,563,400 2.21
8. AMANAHRAYA TRUSTEES BERHADAMANAH SAHAM MALAYSIA 3
14,768,700 2.10
9. AMANAHRAYA TRUSTEES BERHADAMANAH SAHAM MALAYSIA
8,260,200 1.18
10. KUMPULAN WANG PERSARAAN (DIPERBADANKAN) 8,165,900 1.16
11. CITIGROUP NOMINEES (TEMPATAN) SDN BHDURUSHARTA JAMAAH SDN BHD (AFFIN 1)
5,460,167 0.78
12. CITIGROUP NOMINEES (TEMPATAN) SDN BHDURUSHARTA JAMAAH SDN BHD (MAYBANK 1)
5,000,000 0.71
13. AMANAHRAYA TRUSTEES BERHADAMANAH SAHAM BUMIPUTERA 3 - DIDIK
4,257,200 0.61
14. CITIGROUP NOMINEES (TEMPATAN) SDN BHDURUSHARTA JAMAAH SDN BHD (AMUNDI 1)
3,333,333 0.47
15. CITIGROUP NOMINEES (TEMPATAN) SDN BHDURUSHARTA JAMAAH SDN BHD (FRANKLIN 1)
3,333,333 0.47
16. CITIGROUP NOMINEES (TEMPATAN) SDN BHDURUSHARTA JAMAAH SDN BHD (NOMURA 1)
2,000,000 0.28
17. CARTABAN NOMINEES (ASING) SDN BHDEXEMPT AN FOR BARCLAYS CAPITAL SECURITIES LTD (SBL/PB)
1,807,200 0.26
MSM MalaySia HoldingS BerHad | annual report 2019226
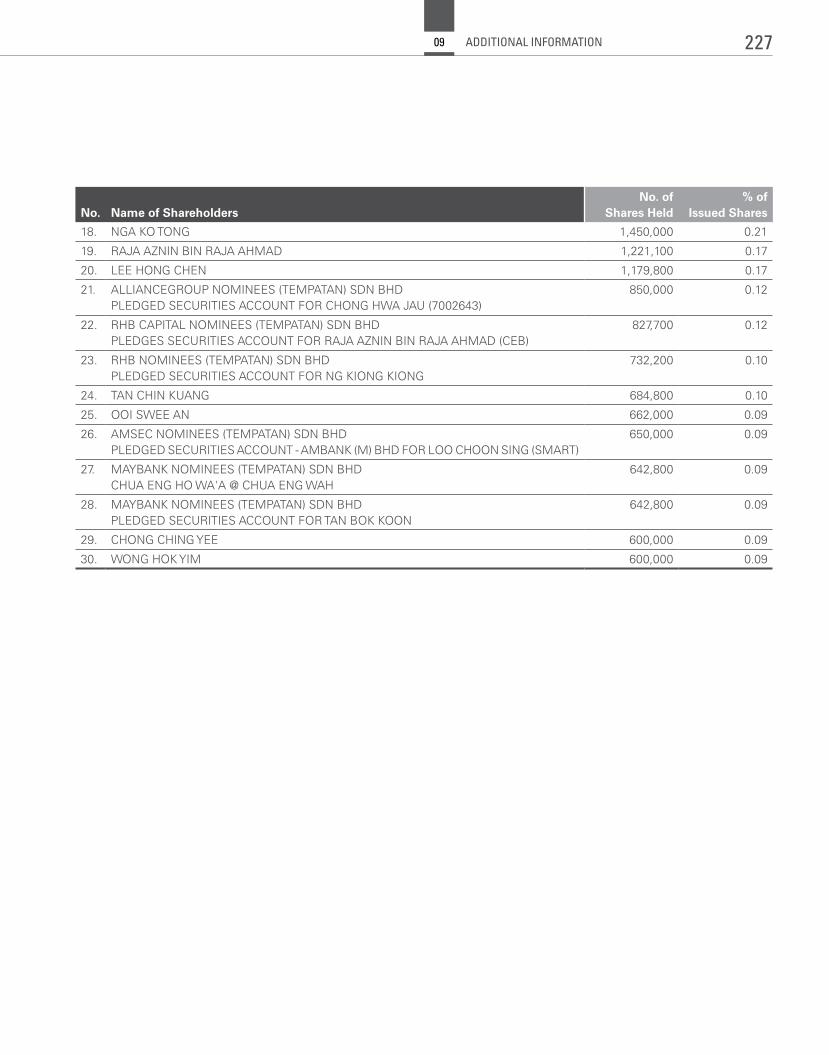
No. Name of ShareholdersNo. of
Shares Held% of
Issued Shares
18. NGA KO TONG 1,450,000 0.21
19. RAJA AZNIN BIN RAJA AHMAD 1,221,100 0.17
20. LEE HONG CHEN 1,179,800 0.17
21. ALLIANCEGROUP NOMINEES (TEMPATAN) SDN BHDPLEDGED SECURITIES ACCOUNT FOR CHONG HWA JAU (7002643)
850,000 0.12
22. RHB CAPITAL NOMINEES (TEMPATAN) SDN BHDPLEDGES SECURITIES ACCOUNT FOR RAJA AZNIN BIN RAJA AHMAD (CEB)
827,700 0.12
23. RHB NOMINEES (TEMPATAN) SDN BHDPLEDGED SECURITIES ACCOUNT FOR NG KIONG KIONG
732,200 0.10
24. TAN CHIN KUANG 684,800 0.10
25. OOI SWEE AN 662,000 0.09
26. AMSEC NOMINEES (TEMPATAN) SDN BHDPLEDGED SECURITIES ACCOUNT - AMBANK (M) BHD FOR LOO CHOON SING (SMART)
650,000 0.09
27. MAYBANK NOMINEES (TEMPATAN) SDN BHDCHUA ENG HO WA'A @ CHUA ENG WAH
642,800 0.09
28. MAYBANK NOMINEES (TEMPATAN) SDN BHDPLEDGED SECURITIES ACCOUNT FOR TAN BOK KOON
642,800 0.09
29. CHONG CHING YEE 600,000 0.09
30. WONG HOK YIM 600,000 0.09
227ADDITIONAL INFORMATION09
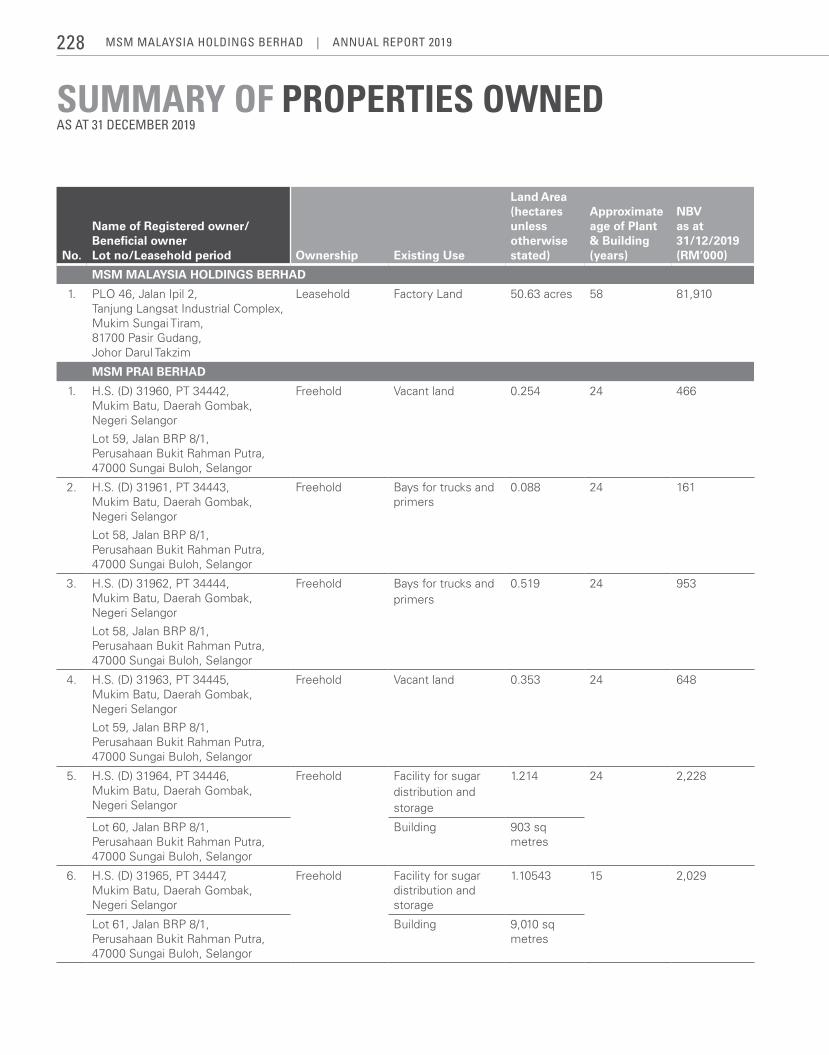
SUMMARY OF PROPERTIES OWNEDAS AT 31 DECEMBER 2019
No.
Name of Registered owner/Beneficial ownerLot no/Leasehold period Ownership Existing Use
Land Area (hectares unless otherwise stated)
Approximate age of Plant & Building (years)
NBVas at 31/12/2019(RM’000)
MSM MALAYSIA HOLDINGS BERHAD
1. PLO 46, Jalan Ipil 2,Tanjung Langsat Industrial Complex,Mukim Sungai Tiram,81700 Pasir Gudang,Johor Darul Takzim
Leasehold Factory Land 50.63 acres 58 81,910
MSM PRAI BERHAD
1. H.S. (D) 31960, PT 34442, Mukim Batu, Daerah Gombak, Negeri Selangor
Lot 59, Jalan BRP 8/1, Perusahaan Bukit Rahman Putra, 47000 Sungai Buloh, Selangor
Freehold Vacant land 0.254 24 466
2. H.S. (D) 31961, PT 34443, Mukim Batu, Daerah Gombak, Negeri Selangor
Lot 58, Jalan BRP 8/1, Perusahaan Bukit Rahman Putra, 47000 Sungai Buloh, Selangor
Freehold Bays for trucks and primers
0.088 24 161
3. H.S. (D) 31962, PT 34444, Mukim Batu, Daerah Gombak, Negeri Selangor
Lot 58, Jalan BRP 8/1, Perusahaan Bukit Rahman Putra, 47000 Sungai Buloh, Selangor
Freehold Bays for trucks and primers
0.519 24 953
4. H.S. (D) 31963, PT 34445, Mukim Batu, Daerah Gombak, Negeri Selangor
Lot 59, Jalan BRP 8/1, Perusahaan Bukit Rahman Putra, 47000 Sungai Buloh, Selangor
Freehold Vacant land 0.353 24 648
5. H.S. (D) 31964, PT 34446, Mukim Batu, Daerah Gombak, Negeri Selangor
Freehold Facility for sugar distribution and storage
1.214 24 2,228
Lot 60, Jalan BRP 8/1, Perusahaan Bukit Rahman Putra, 47000 Sungai Buloh, Selangor
Building 903 sq metres
6. H.S. (D) 31965, PT 34447, Mukim Batu, Daerah Gombak, Negeri Selangor
Freehold Facility for sugar distribution and storage
1.10543 15 2,029
Lot 61, Jalan BRP 8/1, Perusahaan Bukit Rahman Putra, 47000 Sungai Buloh, Selangor
Building 9,010 sq metres
MSM MalaySia HoldingS BerHad | annual report 2019228
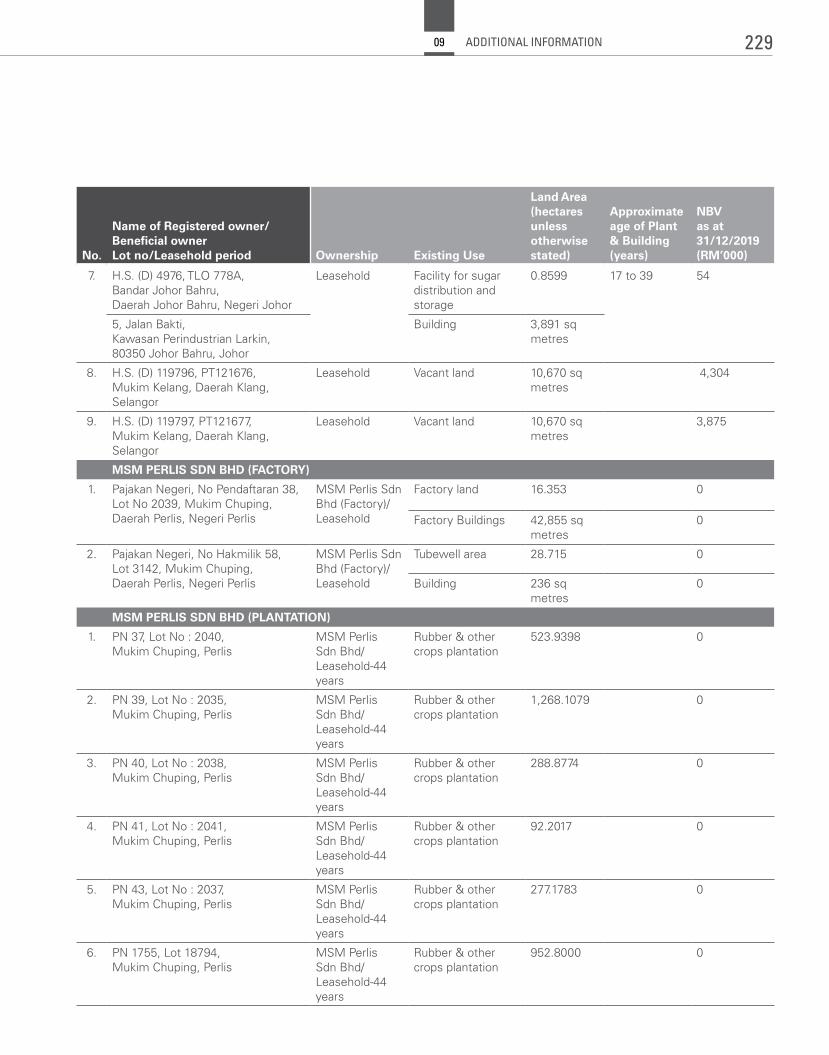
No.
Name of Registered owner/Beneficial ownerLot no/Leasehold period Ownership Existing Use
Land Area (hectares unless otherwise stated)
Approximate age of Plant & Building (years)
NBVas at 31/12/2019(RM’000)
7. H.S. (D) 4976, TLO 778A, Bandar Johor Bahru, Daerah Johor Bahru, Negeri Johor
Leasehold Facility for sugar distribution and storage
0.8599 17 to 39 54
5, Jalan Bakti, Kawasan Perindustrian Larkin, 80350 Johor Bahru, Johor
Building 3,891 sq metres
8. H.S. (D) 119796, PT121676, Mukim Kelang, Daerah Klang, Selangor
Leasehold Vacant land 10,670 sq metres
4,304
9. H.S. (D) 119797, PT121677, Mukim Kelang, Daerah Klang, Selangor
Leasehold Vacant land 10,670 sq metres
3,875
MSM PERLIS SDN BHD (FACTORY)
1. Pajakan Negeri, No Pendaftaran 38, Lot No 2039, Mukim Chuping, Daerah Perlis, Negeri Perlis
MSM Perlis Sdn Bhd (Factory)/Leasehold
Factory land 16.353 0
Factory Buildings 42,855 sq metres
0
2. Pajakan Negeri, No Hakmilik 58, Lot 3142, Mukim Chuping, Daerah Perlis, Negeri Perlis
MSM Perlis Sdn Bhd (Factory)/Leasehold
Tubewell area 28.715 0
Building 236 sq metres
0
MSM PERLIS SDN BHD (PLANTATION)
1. PN 37, Lot No : 2040, Mukim Chuping, Perlis
MSM Perlis Sdn Bhd/Leasehold-44 years
Rubber & other crops plantation
523.9398 0
2. PN 39, Lot No : 2035, Mukim Chuping, Perlis
MSM Perlis Sdn Bhd/Leasehold-44 years
Rubber & other crops plantation
1,268.1079 0
3. PN 40, Lot No : 2038, Mukim Chuping, Perlis
MSM Perlis Sdn Bhd/Leasehold-44 years
Rubber & other crops plantation
288.8774 0
4. PN 41, Lot No : 2041, Mukim Chuping, Perlis
MSM Perlis Sdn Bhd/Leasehold-44 years
Rubber & other crops plantation
92.2017 0
5. PN 43, Lot No : 2037, Mukim Chuping, Perlis
MSM Perlis Sdn Bhd/Leasehold-44 years
Rubber & other crops plantation
277.1783 0
6. PN 1755, Lot 18794, Mukim Chuping, Perlis
MSM Perlis Sdn Bhd/Leasehold-44 years
Rubber & other crops plantation
952.8000 0
229ADDITIONAL INFORMATION09
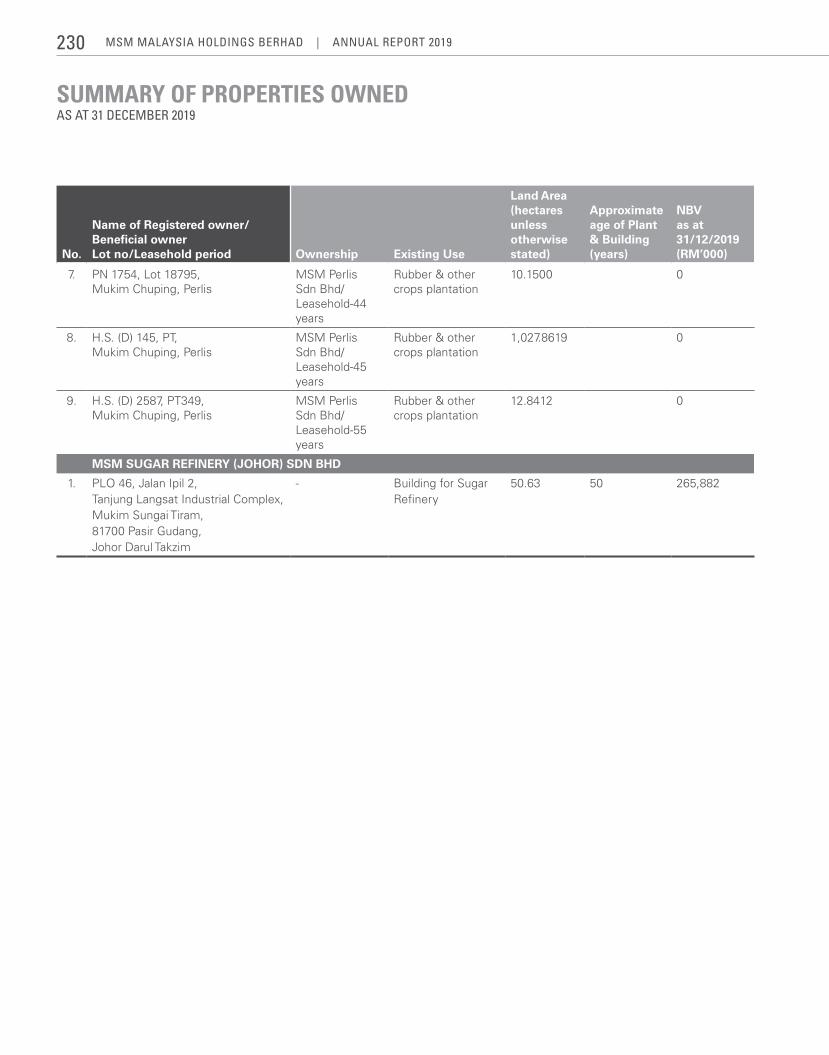
SUMMARY OF PROPERTIES OWNEDAS AT 31 DECEMBER 2019
No.
Name of Registered owner/Beneficial ownerLot no/Leasehold period Ownership Existing Use
Land Area (hectares unless otherwise stated)
Approximate age of Plant & Building (years)
NBVas at 31/12/2019(RM’000)
7. PN 1754, Lot 18795, Mukim Chuping, Perlis
MSM Perlis Sdn Bhd/Leasehold-44 years
Rubber & other crops plantation
10.1500 0
8. H.S. (D) 145, PT, Mukim Chuping, Perlis
MSM Perlis Sdn Bhd/Leasehold-45 years
Rubber & other crops plantation
1,027.8619 0
9. H.S. (D) 2587, PT349, Mukim Chuping, Perlis
MSM Perlis Sdn Bhd/Leasehold-55 years
Rubber & other crops plantation
12.8412 0
MSM SUGAR REFINERY (JOHOR) SDN BHD
1. PLO 46, Jalan Ipil 2, Tanjung Langsat Industrial Complex, Mukim Sungai Tiram, 81700 Pasir Gudang, Johor Darul Takzim
- Building for Sugar Refinery
50.63 50 265,882
MSM MalaySia HoldingS BerHad | annual report 2019230
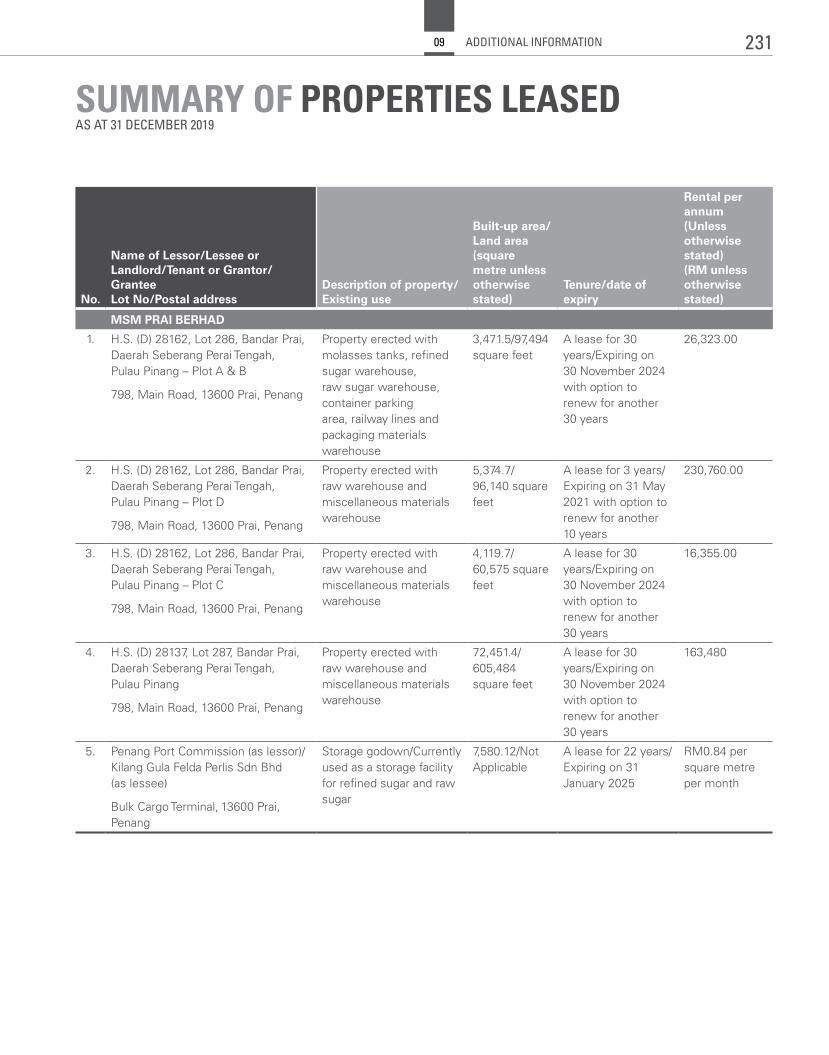
SUMMARY OF PROPERTIES LEASEDAS AT 31 DECEMBER 2019
No.
Name of Lessor/Lessee or Landlord/Tenant or Grantor/GranteeLot No/Postal address
Description of property/ Existing use
Built-up area/Land area(square metre unless otherwise stated)
Tenure/date of expiry
Rental per annum (Unless otherwise stated)(RM unless otherwise stated)
MSM PRAI BERHAD
1. H.S. (D) 28162, Lot 286, Bandar Prai, Daerah Seberang Perai Tengah, Pulau Pinang – Plot A & B
798, Main Road, 13600 Prai, Penang
Property erected with molasses tanks, refined sugar warehouse, raw sugar warehouse, container parking area, railway lines and packaging materials warehouse
3,471.5/97,494square feet
A lease for 30years/Expiring on30 November 2024with option torenew for another30 years
26,323.00
2. H.S. (D) 28162, Lot 286, Bandar Prai, Daerah Seberang Perai Tengah, Pulau Pinang – Plot D
798, Main Road, 13600 Prai, Penang
Property erected with raw warehouse and miscellaneous materials warehouse
5,374.7/96,140 squarefeet
A lease for 3 years/Expiring on 31 May2021 with option torenew for another10 years
230,760.00
3. H.S. (D) 28162, Lot 286, Bandar Prai, Daerah Seberang Perai Tengah, Pulau Pinang – Plot C
798, Main Road, 13600 Prai, Penang
Property erected withraw warehouse andmiscellaneous materialswarehouse
4,119.7/60,575 squarefeet
A lease for 30years/Expiring on30 November 2024with option torenew for another30 years
16,355.00
4. H.S. (D) 28137, Lot 287, Bandar Prai, Daerah Seberang Perai Tengah, Pulau Pinang
798, Main Road, 13600 Prai, Penang
Property erected withraw warehouse andmiscellaneous materialswarehouse
72,451.4/605,484square feet
A lease for 30years/Expiring on30 November 2024with option torenew for another30 years
163,480
5. Penang Port Commission (as lessor)/Kilang Gula Felda Perlis Sdn Bhd (as lessee)
Bulk Cargo Terminal, 13600 Prai, Penang
Storage godown/Currentlyused as a storage facilityfor refined sugar and rawsugar
7,580.12/NotApplicable
A lease for 22 years/Expiring on 31January 2025
RM0.84 persquare metreper month
231ADDITIONAL INFORMATION09
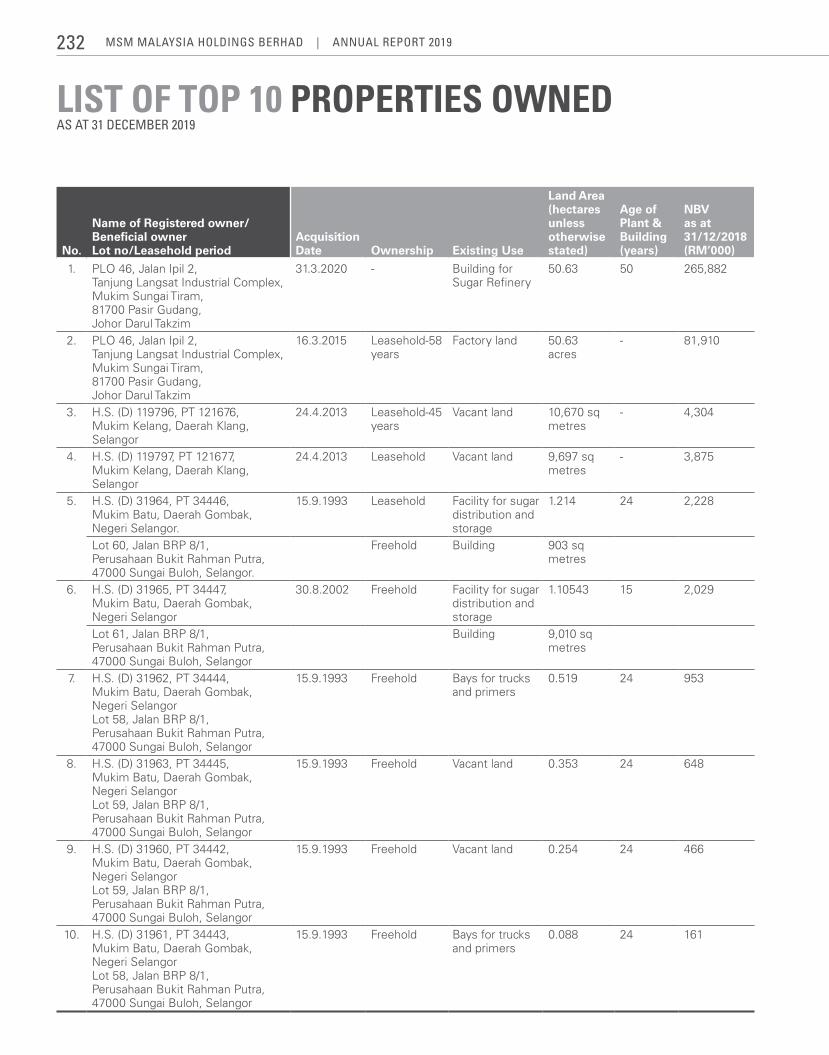
LIST OF TOP 10 PROPERTIES OWNEDAS AT 31 DECEMBER 2019
No.
Name of Registered owner/Beneficial ownerLot no/Leasehold period
Acquisition Date Ownership Existing Use
Land Area(hectares unlessotherwise stated)
Age of Plant &Building (years)
NBVas at 31/12/2018(RM’000)
1. PLO 46, Jalan Ipil 2,Tanjung Langsat Industrial Complex,Mukim Sungai Tiram,81700 Pasir Gudang,Johor Darul Takzim
31.3.2020 - Building for Sugar Refinery
50.63 50 265,882
2. PLO 46, Jalan Ipil 2,Tanjung Langsat Industrial Complex,Mukim Sungai Tiram,81700 Pasir Gudang,Johor Darul Takzim
16.3.2015 Leasehold-58 years
Factory land 50.63 acres
- 81,910
3. H.S. (D) 119796, PT 121676,Mukim Kelang, Daerah Klang,Selangor
24.4.2013 Leasehold-45years
Vacant land 10,670 sqmetres
- 4,304
4. H.S. (D) 119797, PT 121677,Mukim Kelang, Daerah Klang,Selangor
24.4.2013 Leasehold Vacant land 9,697 sqmetres
- 3,875
5. H.S. (D) 31964, PT 34446,Mukim Batu, Daerah Gombak,Negeri Selangor.
15.9.1993 Leasehold Facility for sugar distribution and storage
1.214 24 2,228
Lot 60, Jalan BRP 8/1,Perusahaan Bukit Rahman Putra,47000 Sungai Buloh, Selangor.
Freehold Building 903 sqmetres
6. H.S. (D) 31965, PT 34447,Mukim Batu, Daerah Gombak,Negeri Selangor
30.8.2002 Freehold Facility for sugar distribution and storage
1.10543 15 2,029
Lot 61, Jalan BRP 8/1,Perusahaan Bukit Rahman Putra,47000 Sungai Buloh, Selangor
Building 9,010 sq metres
7. H.S. (D) 31962, PT 34444,Mukim Batu, Daerah Gombak,Negeri SelangorLot 58, Jalan BRP 8/1,Perusahaan Bukit Rahman Putra,47000 Sungai Buloh, Selangor
15.9.1993 Freehold Bays for trucks and primers
0.519 24 953
8. H.S. (D) 31963, PT 34445,Mukim Batu, Daerah Gombak,Negeri SelangorLot 59, Jalan BRP 8/1,Perusahaan Bukit Rahman Putra,47000 Sungai Buloh, Selangor
15.9.1993 Freehold Vacant land 0.353 24 648
9. H.S. (D) 31960, PT 34442,Mukim Batu, Daerah Gombak,Negeri SelangorLot 59, Jalan BRP 8/1,Perusahaan Bukit Rahman Putra,47000 Sungai Buloh, Selangor
15.9.1993 Freehold Vacant land 0.254 24 466
10. H.S. (D) 31961, PT 34443,Mukim Batu, Daerah Gombak,Negeri SelangorLot 58, Jalan BRP 8/1,Perusahaan Bukit Rahman Putra,47000 Sungai Buloh, Selangor
15.9.1993 Freehold Bays for trucks and primers
0.088 24 161
MSM MalaySia HoldingS BerHad | annual report 2019232
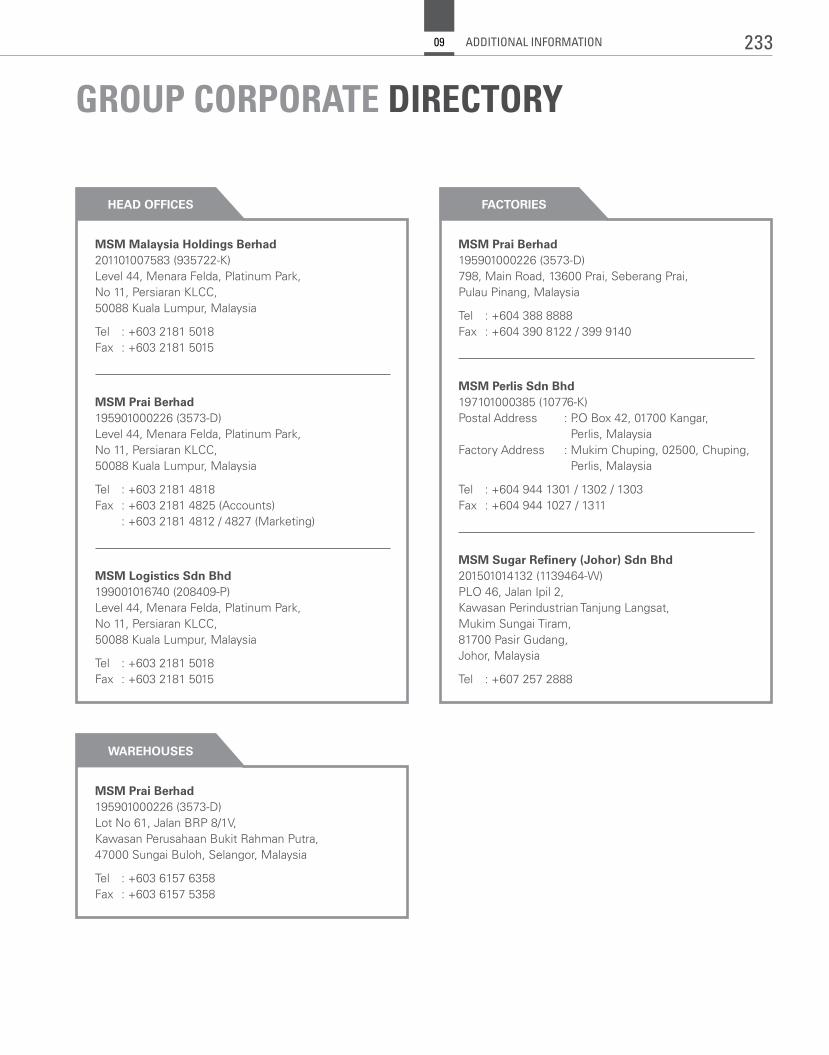
GROUP CORPORATE DIRECTORY
MSM Prai Berhad 195901000226 (3573-D)Lot No 61, Jalan BRP 8/1V,Kawasan Perusahaan Bukit Rahman Putra,47000 Sungai Buloh, Selangor, Malaysia
Tel : +603 6157 6358Fax : +603 6157 5358
MSM Prai Berhad 195901000226 (3573-D)798, Main Road, 13600 Prai, Seberang Prai,Pulau Pinang, Malaysia
Tel : +604 388 8888Fax : +604 390 8122 / 399 9140
MSM Perlis Sdn Bhd 197101000385 (10776-K)Postal Address : P.O Box 42, 01700 Kangar,
Perlis, MalaysiaFactory Address : Mukim Chuping, 02500, Chuping,
Perlis, Malaysia
Tel : +604 944 1301 / 1302 / 1303Fax : +604 944 1027 / 1311
MSM Sugar Refinery (Johor) Sdn Bhd 201501014132 (1139464-W)PLO 46, Jalan Ipil 2, Kawasan Perindustrian Tanjung Langsat, Mukim Sungai Tiram, 81700 Pasir Gudang, Johor, Malaysia
Tel : +607 257 2888
HEAD OFFICES
WAREHOUSES
FACTORIES
MSM Malaysia Holdings Berhad 201101007583 (935722-K)Level 44, Menara Felda, Platinum Park,No 11, Persiaran KLCC,50088 Kuala Lumpur, Malaysia
Tel : +603 2181 5018Fax : +603 2181 5015
MSM Prai Berhad 195901000226 (3573-D)Level 44, Menara Felda, Platinum Park,No 11, Persiaran KLCC,50088 Kuala Lumpur, Malaysia
Tel : +603 2181 4818Fax : +603 2181 4825 (Accounts) : +603 2181 4812 / 4827 (Marketing)
MSM Logistics Sdn Bhd 199001016740 (208409-P)Level 44, Menara Felda, Platinum Park,No 11, Persiaran KLCC,50088 Kuala Lumpur, Malaysia
Tel : +603 2181 5018Fax : +603 2181 5015
233ADDITIONAL INFORMATION09
www.msmsugar.com
AN
NU
AL
RE
PO
RT
20
19
MSM
MA
LAYSIA H
OLD
ING
S BER
HA
D
201101007583 (935722-K)
MSM MALAYSIA HOLDINGS BERHAD Registration No.: 201101007583 (935722-K)
Level 44, Menara FeldaPlatinum ParkNo. 11, Persiaran KLCC50088 Kuala LumpurTel No. : +603 2181 5018Fax No. : +603 2181 5015E-mail : [email protected]
A N N U A L R E P O R T 2 0 1 9
BalanceAttaining