Embed Size (px)
Citation preview

Response of Pinus taeda L. Families to Root-Inhabiting Ophiostomatoid Fungi
by
Pratima Devkota
A dissertation submitted to the Graduate Faculty of Auburn University
in partial fulfillment of the requirements for the Degree of
Doctor of Philosophy
Auburn, Alabama August 5, 2017
Keywords: Pinus taeda, Leptographium terebrantis, Grosmannia huntii, Pine Decline
Copyright 2017 by Pratima Devkota
Approved by
Lori Eckhardt, Professor of Forest Entomology and Pathology Scott Enebak, Professor of Forest Pathology Zhaofei Fan, Associate Professor of Forestry
Joseph Kloepper, Professor of Plant Pathology Kathy Lawrence, Professor of Plant Pathology

Abstract
Pinus taeda (loblolly pine), a most widely cultivated timber species in the
southern U.S., creates 110,000 job opportunities and contributes 30 billion dollars per
year to the economy. However, insect-vectored root-infecting ophiostomatoid fungi,
Leptographium terebrantis, and Grosmannia huntii are potential threats to sustainable P.
taeda forest management in the southern U.S. Understanding the intra-species response
of P. taeda to these fungi is critical to mitigate the potential problem due to these fungi.
Thus, the objectives of my research are: (i) to determine the intraspecific
tolerance/susceptibility of P. taeda to L. terebrantis and G. huntii, (ii) to understand
whether intraspecific tolerance of P. taeda to L. terebrantis and G. huntii remain same
regardless of the tree growth stage (iii) to understand the interaction of the vascular-
inhabiting fungi and P. taeda under drought conditions, (iv) to determine the antibiosis
potential of these fungi by plant growth-promoting rhizobacteria (PGPR), (v) to
understand whether PGPR can induce resistance of P. taeda families to these fungi, (vi)
to determine the intraspecific variation in virulence of L. terebrantis, (vii) to determine
the growth potential of most virulent L. terebrantis at different inoculum densities in P.
taeda wood segments, and (viii) to determine the growth potential of various blue-stain
fungi on P. taeda stem segments.
In study 1, seedlings from 94 P. taeda families were artificially inoculated at the
stem with L. terebrantis and G. huntii and family responses were studied. In study 2, the
roots of the mature P. taeda trees from 4 families were inoculated with these two fungi to
ii

understand the intraspecific response of mature trees. In study 3, P. taeda families were
exposed to drought and simultaneously inoculated with vascular-inhabiting fungi and
impacts were studied. In study 4, PGPR strains and ophiostomatoid fungi were plated
together in a dual agar plate and the antibiosis potential of PGPR strains to fungi was
studied. In addition, induced systemic resistance of P. taeda to L. terebrantis and G.
huntii were studied by inoculating PGPR in soil and fungi in stems of P. taeda seedlings.
In study 5, most virulent L. terebrantis was inoculated to P. taeda stem segments at
different inoculum densities. In study 6, various blue-staining ophiostomatoid fungi were
cultured in P. taeda stem segments to study their growth potential.
The results suggest P. taeda families vary in tolerance to ophiostomatoid fungi
with potential for selection of relatively tolerant families. Moreover, this intra-species
variation in tolerance is an inherent character of P. taeda, regardless of the tree growth
stage. The growth and productivity of P. taeda seedlings decrease and fungal
pathogenicity increase under severe drought. Specific strains of PGPR have the ability to
inhibit the growth of blue-staining fungi in vitro. Specific PGPR strains have the capacity
to induce systemic resistance of P. taeda during fungal infection. Fungal growth and
blue-staining potential are high when fungal inoculation points are closer. Growth and
staining potential of L. terebrantis in P. taeda stem segment is higher compared to G.
huntii and G. alacris. This study provides meaningful insights into P. taeda and
ophiostomatoid fungal interaction.
iii

Acknowledgements
First of all, I would like to express my sincere gratitude to my advisor Dr. Lori G.
Eckhardt for her continuous support, guidance, motivation and unsurpassed knowledge.
Her guidance helped me to accomplish this dissertation. I could not have imagined
having a better advisor and mentor for my Ph.D. study.
I am grateful to my committee members Dr. Scott Enebak, Dr. Joseph Kloepper,
Dr. Kathy Lawrence, and Dr. Zhaofei Fan for their insightful comments, encouragement,
guidance, and continuous support throughout my graduate school and for the completion
of this dissertation. I am much obliged to Dr. Ryan Nadel for his guidance and Dr. Emily
Carter for being an external reader of this dissertation.
I am forever indebted to Dalton Smith, Sarah Paedan, Tessa Bauman, Andrea
Cole, Adam Tratwig, Jeff Chippa, John Mensah, Shrijana Duwadi, Jessica Ahl, Chauntey
Eckhardt, Nina Payne, Charles Essien, Gifty Acquah and dear undergraduate students for
their help in the accomplishment of this project.
I would like to dedicate this dissertation to my first teachers; father (Damodar
Devkota) and mother (Surya K. Devkota) who taught me the value of education. I am
thankful to my husband and siblings for their spiritual support and my life in general,
without whom this journey would not have been possible. Last but not the least, I am
grateful to all formal and informal teachers of my life.
iv

Table of Contents
Abstract ............................................................................................................................... ii
Acknowledgements ............................................................................................................ iv
List of Tables .................................................................................................................... xii
List of Figures ....................................................................................................................xv
I. Introduction and Review of Literature ........................................................20
1.1 Forestry in the southern United States .................................................20
1.2 Pinus taeda...........................................................................................20
1.2.1 History of Pinus taeda .....................................................................2
1.2.2 Indicators of health and vigor of P. taeda........................................3
1.2.3 Biotic and abiotic factors affecting growth of P. taeda ...................4
1.3 Concepts of forest decline ......................................................................8
1.4 Pine Decline (PD) ..................................................................................9
1.5 Ophiostomatoid fungi ..........................................................................12
1.5.1 Leptographium species (Lagerb and Melin.) .................................12
1.5.2 Grosmannia huntii (R.C. Rob. Jeffr.) Zipfel, Z.W. de Beer and M.J. Wingf. .............................................................................15
1.5.3 Grosmannia alacris T. A. Duong, Z. W. de Beer and M. J.
Wingf. .............................................................................................16
1.6 Concept of virulence and pathogenicity ..............................................16
1.7 Methods of fungal inoculation .............................................................17
v

1.7.1 Mature tree root inoculation...........................................................18
1.7.2 Mature tree stem inoculation .........................................................18
1.7.3 Seedling inoculation.......................................................................20
1.7.4 Lesion measurement ......................................................................21
1.8 Host defense .........................................................................................22
1.9 Tree-to-tree variation ...........................................................................23
1.10 Climate change in host-pathogen interactions .....................................24
1.11 Possible solutions to root infecting ophiostomatoid fungi ...................24
1.12 Conclusion ...........................................................................................26
1.13 References ............................................................................................26
II. Intraspecific and Inter-Stocktype Response of Pinus taeda L. to Grosmannia huntii and Leptographium terebrantis .....................................38
2.1 Abstract ................................................................................................38
2.2 Introduction ..........................................................................................39
2.3 Materials and methods .........................................................................42
2.3.1 Experimental design.......................................................................42
2.3.2 Inoculation of fungi........................................................................47
2.3.3 Measurements ................................................................................49
2.3.4 Statistical analyses .........................................................................50
2.4 Results ..................................................................................................51
2.4.1 Year 2013 .......................................................................................51
2.4.2 Year 2014 .......................................................................................59
2.4.3 Year 2016 .......................................................................................67
2.4.4 Response of connector families in all years ...................................73
vi

2.5 Discussion ............................................................................................73
2.6 References ............................................................................................78
III. Intra-species Variation in Response of Mature Pinus taeda Families to Root-infecting Ophiostomatoid Fungi ......................................82
3.1 Abstract ................................................................................................82
3.2 Introduction ..........................................................................................82
3.3 Materials and method ...........................................................................85
3.3.1 Experimental design.......................................................................85
3.3.2 Inoculation experiment ..................................................................86
3.3.3 Laboratory measurements ..............................................................88
3.3.4 Statistical analysis ..........................................................................90
3.4 Results ..................................................................................................90
3.4.2 Summer 2015 inoculation ..............................................................93
3.4.3 Spring 2016 inoculation .................................................................94
3.5 Discussion ..........................................................................................104
3.6 References ..........................................................................................107
IV. The Role of Leptographium terebrantis and Grosmannia huntii Invasion in Driving Drought-Related Decline in Pinus taeda Families .........................................................................................................112
4.1 Abstract ..............................................................................................112
4.2 Introduction ........................................................................................112
4.3 Methodology ......................................................................................115
4.3.1 Experimental set-up .....................................................................115
4.3.2 Seedling planting .........................................................................116
4.3.3 Moisture treatment .......................................................................116
vii

4.3.4 Inoculation treatment ...................................................................117
4.3.5 Pre-harvesting measurements ......................................................119
4.3.5.1 Growth and size measurement ...............................................119
4.3.5.2 Needle greenness and chlorophyll content ............................120
4.3.5.3 Predawn water potential .........................................................121
4.3.5.4 Relative leaf water content.....................................................121
4.3.6 Post-harvest measurement ...........................................................122
4.3.6.1 Inoculation response ..............................................................122
4.3.6.2 Seedling biomass ...................................................................122
4.3.7 Statistical analysis ........................................................................123
4.4 Results ................................................................................................124
4.4.1 Seedling survival ..........................................................................124
4.4.2 Lesion and occlusion....................................................................126
4.4.3 Seedling volume increment..........................................................133
4.4.4 Bud-outbreak number increment .................................................134
4.4.5 Seedling height increment............................................................136
4.4.6 Seedling dry matter yield .............................................................136
4.4.7 Needle greenness and needle chlorophyll content .......................146
4.4.8 Pre-dawn water potential measurement .......................................147
4.4.9 Relative water content..................................................................147
4.5 Discussion ..........................................................................................148
4.6 References ..........................................................................................152
V. Towards Biocontrol of Blue-Stain Fungi by Plant Growth-Promoting Rhizobacteria ............................................................................156
viii

5.1 Abstract ..............................................................................................156
5.2 Introduction ........................................................................................156
5.3 Methodology ......................................................................................159
5.3.1 In vitro screening of antagonistic activity ....................................159
5.3.1.1 Preparation of fungal cultures ................................................161
5.3.1.2 Antibiosis test.........................................................................161
5.3.1.3 Measurements ........................................................................162
5.3.2 Induced systemic resistance study ...............................................163
5.3.2.1 Study design ...........................................................................163
5.3.2.2 PGPR selection ......................................................................164
5.3.2.3 Fungal treatment ....................................................................165
5.3.2.4 Measurements ........................................................................165
5.3.3 Statistical analysis ........................................................................166
5.4 Results ................................................................................................166
5.4.1 In vitro antagonistic activity screening ........................................166
5.4.2 Resistance Study ..........................................................................169
5.4.2.1 Infection reduction .................................................................169
5.4.2.2 Biomass yield .........................................................................170
5.5 Discussion ..........................................................................................173
5.5.1 Antibiosis study ...........................................................................173
5.5.2 Induced systemic resistance study ...............................................174
5.6 References: .........................................................................................177
VI. Intra-specific variation in virulence and effect of inoculum density of Leptographium terebrantis to Pinus taeda L. .........................................182
ix

6.1 Abstract ....................................................................................................182
6.2 Introduction ........................................................................................182
6.3 Material and methods .........................................................................184
6.3.1 Leptographium terebrantis pathogenicity testing ........................184
6.3.2 Leptographium terebrantis inoculations in P. taeda stem sections (blots) .............................................................................186
6.3.2.1 Wood segment preparation ....................................................186
6.3.2.2 Preparation of culture .............................................................187
6.3.2.3 Inoculation of Pinus taeda stem segments.............................188
6.3.2.4 Laboratory Measurement .......................................................189
6.3.3 Analysis........................................................................................190
6.4 Results ................................................................................................191
6.4.1 Leptographium terebrantis pathogenicity....................................191
6.4.2 Growth of L. terebrantis in P. taeda segments ............................193
6.5 Discussion ..........................................................................................196
6.6 References: .........................................................................................198
VII. Growth and Staining Ability of Various Blue-Staining Fungi in Pinus taeda L. Stem Segments ....................................................................201
7.1 Abstract ..............................................................................................201
7.2 Introduction ........................................................................................201
7.3 Materials and methods .......................................................................203
7.3.1 Wood section preparation ............................................................203
7.3.2 Preparation of culture ...................................................................203
7.3.3 Inoculation of P. taeda bolts ........................................................204
x

7.3.4 Laboratory Measurement .............................................................204
7.4 Results ................................................................................................205
7.5 Discussion ..........................................................................................208
7.6 References ..........................................................................................209
VIII. General Conclusions ....................................................................................211
8.1 Ophiostomatoid fungi ........................................................................211
8.2 The decline of pine in the southern U.S. ............................................211
8.3 Current understanding ........................................................................212
8.4 Approaches to improve understanding ..............................................213
8.5 Research results .................................................................................214
8.6 Potential future research ....................................................................215
8.7 References ..........................................................................................216
xi

List of Tables
Table 1.1 Volume of timberland by softwood species in the southern U.S. (Oswalt et al., 2012) .........................................................................................20
Table 1.2 Common fungal diseases of pine forests of the southern U.S. ..........................7
Table 2.1 Pinus taeda families for the year 2013. ...........................................................44
Table 2.2 Pinus taeda families for the year 2014. ...........................................................45
Table 2.3 Pinus taeda families for the year 2016. ...........................................................46
Table 2.4 Covariance parameter estimates form mixed-model (Year 2013). ..................57
Table 2.5 Type three fixed effects from mixed-model. Initial root collar diameter (RCD) was used as covariate (year 2013). .......................................................58
Table 2.6 Pairwise comparisons between all inoculation treatments for lesion length................................................................................................................59
Table 2.7 Pairwise comparisons between all inoculation treatments for occlusion length. ……………………………………………………………………….………60
Table 2.8 Covariance parameter estimates from the mixed model (Year 2014). ............66
Table 2.9 Type three fixed effects from the mixed model (Year 2014). .........................66
Table 2.10 Pairwise comparison of log lesion between the treatments. ............................68
Table 2.11 Treatment and family fixed effects from mixed model. ..................................69
Table 3.1 P-values for fixed effect and possible interactions for summer 2015 and spring 2016 inoculation. ............................................................................95
Table 3.2 Familywise mean and standard deviation of all the response variables for 2015 summer inoculation. ..........................................................................96
Table 3.3 Parameter estimates of the response variables between the families in summer 2015 inoculation. ...............................................................................97
xii

Table 3.4 Means of response variables in four families inoculated with L. terebrantis and G. huntii in spring 2016. .........................................................98
Table 3.5 Estimate of difference in response variables between families inoculated with L. terebrantis and G. huntii in spring 2016. ...........................99
Table 4.1 Initial family height, RCD, dry wet matter of seedling averages and standard deviation (n = 12 per family). ..........................................................120
Table 4.2 An overview of the effect of different treatments on seedlings response variables. ........................................................................................................125
Table 4.3 Effects of inoculation and watering treatments on lesion and occlusion. ......130
Table 4.4 Effects of family and inoculation on the lesion and occlusion length. ..........131
Table 4.5 Effect on family x watering treatment x inoculation on lesion depth. ...........132
Table 4.6 Effect of family and inoculation on seedling volume change. .......................134
Table 4.7 Effect of watering treatment and inoculation on number of bud outbreak..........................................................................................................136
Table 4.8 Inoculation x family interaction on seedling height, stem dry matter and needle dry matter yield. ...........................................................................140
Table 4.9 Inoculation x family interaction on fine and coarse root dry matter yield................................................................................................................141
Table 4.10 The effect of watering treatment x family interaction on seedling growth and biomass yields. ............................................................................142
Table 4.11 The effect of watering treatment x inoculation interaction on fine root dry matter yield (Fry). ....................................................................................143
Table 4.12 The effect of family x watering treatment x inoculation interaction on coarse root dry matter yield. ..........................................................................144
Table 4.13 Shoot-to-root and coarse-to-fine-root dry matter yield ratio (Sy/Ry) of different families. ...........................................................................................145
Table 4.14 Coarse-to-fine-root dry matter yield ratio (Cry/Fry) of different inoculation treatment. ....................................................................................145
Table 4.15 Effect of different watering treatment on shoot-to-root dry matter yield ratio (S/R).......................................................................................................145
Table 4.16 Effect of watering treatment x inoculation on needle-to-fine-root dry matter yield ratio (Ny/Fry). ............................................................................146
xiii

Table 4.17 The effect of inoculation treatment on needle greenness. ..............................147
Table 4.18 The effect of inoculation treatment interaction on water potential (Ψpd). .............................................................................................................147
Table 4.19 The effect of watering treatments on relative water content. .........................148
Table 5.1 Twenty-nine PGPR strains used in the in vitro antagonism screening. .........160
Table 5.2 Isolation site and source of fungal isolates used in the study. .......................161
Table 5.3 Mean inhibition zone (mm) and inhibition index by 30 PGPR strains to 3 fungi. ...........................................................................................................168
Table 5.4 The p-values showing the effect of the independent variables for lesion length. ………………………………………………………………………170
Table 5.5 Mean length of the lesion produced by fungi in seedlings inoculated with different PGPR. ......................................................................................170
Table 5.6 The p-values showing biomass yield for study replicates 1 and 2. ................171
Table 5.7 Mean biomass yield of Pinus taeda seedlings inoculated with different PGPR. ............................................................................................................172
Table 6.1 The effects of different dependent variables for percentage of fungal staining (N = 48). ...........................................................................................194
Table 6.2 Estimation of the difference in staining caused by various inoculum load in Pinus taeda stem segments. ...............................................................195
xiv

List of Figures
Figure 1.1 Pinus taeda stands in Cordele, Georgia, USA. ...............................................2
Figure 1.2 Model of southern pine decline (disease circle). Factors are adapted from many literatures. ............................................................................................11
Figure 1.3 Conidia of Leptographium terebrantis in Pinus taeda root section. ............14
Figure 1.4 Serpentine hyphae of Grosmannia huntii .....................................................15
Figure 2.1 Container-grown Pinus taeda seedlings from a single family before re-planting. ........................................................................................................43
Figure 2.2 Pinus taeda seedlings planted in six blocks (RCBD) in the outdoor planting space. .............................................................................................................47
Figure 2.3 Artificial inoculation of fungi in the stem of Pinus taeda. ...........................48
Figure 2.4 Pinus taeda seedlings dipped in FastGreen stain after clipping. ..................49
Figure 2.5 The dark necrotic lesion observed in Pinus taeda seedlings 8 weeks following inoculation. ...................................................................................52
Figure 2.6 Mean lesion length caused by the both fungal treatments in Pinus taeda
families. Error bars indicate 95% confidence interval. .................................54
Figure 2.7 Mean lesion length caused by Grosmannia huntii in different Pinus taeda families. Error bars indicate 95% confidence interval. .................................55
Figure 2.8 Mean lesion length caused by Leptographium terebrantis in different Pinus taeda families. Error bars indicate 95% confidence interval. .......................56
Figure 2.9 Mean lesion length on bare-root and container-grown families P. taeda families inoculated with Leptographium terebrantis. Error bars indicate 95% confidence interval. Different letters indicate significant differences between same bare-root and container-grown seedlings within same family. ............61
Figure 2.10 Mean lesion length on bare-root and container-grown Pinus taeda families inoculated with Leptographium terebrantis. Error bars indicate 95% confidence interval. Different letters indicate significant differences between bare-root and container-grown seedlings within same family. .....................62
xv

Figure 2.11 Mean lesion length caused by both the fungal treatments on Pinus taeda families. .........................................................................................................63
Figure 2.12 Mean lesion length caused by Grosmannia huntii on different Pinus taeda families. Error bars indicate 95% confidence interval. .................................64
Figure 2.13 Mean lesion length caused by Leptographium terebrantis on different Pinus taeda families. Error bars indicate 95% confidence interval. .......................65
Figure 2.14 The overall mean lesion lengths caused by both the fungal treatments on Pinus taeda families. 95% confidence intervals are indicated by error bars. ...............................................................................................................70
Figure 2.15 Mean lesion length caused by Grosmannia huntii on Pinus taeda families. Error bars indicate 95% confidence interval. ................................................71
Figure 2.16 Mean lesion length caused by Leptographium terebrantis on Pinus taeda families. Error bars indicate the 95% confidence interval of the mean……72
Figure 2.17 Mean lesion length of connector Pinus taeda families on each inoculation year. Error bars represent 95% confidence interval. .....................................73
Figure 3.1 Two primary lateral roots of Pinus taeda excavated for the fungal inoculation…………………………………………………………………87
Figure 3.2 Inoculation of the agar plug with fungi in the lateral root of Pinus taeda. ...88
Figure 3.3 Re-excavation of the fungi inoculated lateral roots of Pinus taeda for further measurements. ...............................................................................................89
Figure 3.4 Pinus taeda root samples ready for measurement in the laboratory. ............89
Figure 3.5 Resinosis and necrosis in the root 8 weeks following inoculation with Leptographium terebrantis in family S2.......................................................91
Figure 3.6 Wound control treated root section with small necrotic area. ......................92
Figure 3.7 Pie-shaped occlusion observed at the cross-section of inoculated root. .......92
Figure 3.8 Lesion length caused by the two different fungi in summer 2015 and spring 2016 inoculations. T1 and T2: Families tolerant to root-infecting ophiostomatoid fungi at seedling stage . S1 and S2: Families susceptible to root-infecting fungi and seedling stage. 95% confidence intervals are indicated by error bars. ...............................................................................100
xvi

Figure 3.9 Lesion area caused by the two different fungi in summer 2015 and spring 2016 inoculations. T1 and T2: Families tolerant to root-infecting ophiostomatoid fungi at seedling stage. S1 and S2: Families susceptible to root-infecting ophiostomatoid fungi at seedling stage. 95% confidence intervals are indicated by error bars. ...........................................................101
Figure 3.10 The length of occluded tissue produced by the two different fungi in summer 2015 and spring 2016 inoculations. T1 and T2: Families tolerant to root-infecting fungi. S1 and S2: Families susceptible to root-infecting ophiostomatoid fungi at seedling stage. 95% confidence intervals are indicated by error bars. ...............................................................................102
Figure 3.11 The width of occluded tissue produced by the two different fungi in summer 2015 and spring 2016 inoculations. T1 and T2: Families tolerant to root-infecting fungi. S1 and S2: Families susceptible to root-infecting ophiostomatoid fungi and seedling stage. 95% confidence intervals are indicated by error bars. ...............................................................................103
Figure 4.1 Pinus taeda seedlings planted in sand filled boxes experiencing different watering treatments. ....................................................................................116
Figure 4.2 Soil moisture being monitored with a soil moisture meter. ........................117
Figure 4.3 Inoculation of agar plug in Pinus taeda stem. ............................................119
Figure 4.4 Samples containing chlorophyll extracted from Pinus taeda needles. .......121
Figure 4.5 Pinus taeda seedling separated into coarse root (CR), fine root (FR), needles (N) and stem (S) for biomass measurement. ...............................................123
Figure 4.6 Necrotic tissue (lesion) on the stem of P. taeda seedling under severe drought inoculated with L. terebrantis........................................................128
Figure 4.7 Dark necrotic tissue in stem cross-section of Pinus taeda following fungal inoculation...................................................................................................128
Figure 4.8 Cross-section of the Pinus taeda vascular tissue occluded as a result of Leptographium terebrantis inoculation. Arrow indicates the growth of new tissue on the opposite site of inoculation. ...................................................129
Figure 4.9 Mean lesion length produced in seedlings under different watering treatments. Different letters denote significant differences between watering treatments within each inoculation treatment at α = 0.05. ..........................133
Figure 4.10 Mean numbers of bud break in seedlings under different fungal and watering treatments. ...................................................................................................135
xvii

Figure 4.11 Roots of Pinus taeda seedling following harvest; left: Severe drought, right: Medium drought..........................................................................................138
Figure 4.12 Seedling parts of two different Pinus taeda seedlings grown under different watering treatment. Left: seedling under severe drought and right: seedling under normal watering. ...............................................................................139
Figure 5.1 Fungal disc inoculated at the center of the agar plate .................................162
Figure 5.2 Fungal growth inhibited at the three sides ..................................................163
Figure 5.3 Loblolly pine seedlings after application of the PGPR and the fungal treatment. ....................................................................................................164
Figure 6.1 Pinus taeda seedlings in randomized controlled design in an outdoor space………………………………………………………………………185
Figure 6.2 Malt Extract Broth soaked and un-soaked sterile toothpicks......................187
Figure 6.3 Wooden toothpicks placed into the MEA plate. .........................................188
Figure 6.4 Pinus taeda stem segments showing different inoculation points for inoculation of Leptographium tererantis. A: 1.27 cm apart sideways and parallel, B: 1.27 cm apart in a single line, C: 2.54 cm in a double line, and D: 2.54 cm in a single line. .........................................................................189
Figure 6.5 Inoculated stem segments kept in a container with sterile sand. ................189
Figure 6.6 Cross-section of the stem segment showing point of inoculation, tangential spread, and depth of the stain. .....................................................................190
Figure 6.7 The mean lesion length produced in Pinus taeda seedlings following inoculation with various Leptographium terebrantis isolates. ...................192
Figure 6.8 A: Cutting of the bolts with the band saw, B: Development of the fungal stain in different treatments, and C: Staining developed in soaked 2.54 cm treatment. ....................................................................................................193
Figure 6.9 Cross-section of wood stained with Leptographium terebrantis at different inoculation treatments. . ..............................................................................194
Figure 6.10 The percentage of the total tissue stained by L. terebrantis at different inoculum loads in P. taeda stem sections. Different letters indicate significant differences at α = 0.05. (OIP: 2.54 cm in double line, OIS: 2.54 in single line, HIP: 1.27 cm apart in double line, and HIS: 1.27 cm apart in single line). ..................................................................................................195
xviii

Figure 7.1 Pinus taeda bolts with inoculation holes for inoculation of fungal cultured toothpicks. ...................................................................................................204
Figure 7.2 Blue-stain caused by various fungi in the stem segments...........................205
Figure 7.3 Percentage of the stain area in the cross-section caused by three fungi. (GA: Grosmannia alacris, LT: Leptographium terebrantis, and GH: Grosmannia huntii). Different letters denote significant differences at α = 0.05. ...........207
xix

CHAPTER I
Introduction and Review of Literature
1.1 Forestry in the southern United States
The southern United States (U.S.) comprises 108.1 million hectares of forestland
of which approximately 13% of the total volume of the timber in the U.S. is produced in
the south. This region incorporates almost 50% of world’s entire industrial forest
plantations used for commercial timber production (Prestemon and Abt, 2002). Pinus
taeda L. (loblolly pine) and P. echinata Mill. (shortleaf pine) are the major timber species
Oswalt et al. (2012) which together account for 71% of softwood volume in the southern
U.S. as shown in Table 1.1.
Table 1.1 Volume of timberland by softwood species in the southern U.S. (Oswalt et al., 2012)
Softwood Species Total volume Pinus taeda and P. echinata 71% Pinus palustris Mill. (longleaf pine) and P. elliottii Englem. (slash pine) 13% Cypress 6% Pinus strobus L. (white pine) and P. resinosa Aiton (red pine) 2% Yellow pines 5% Tsuga canadensis (L.) Carr. (Eastern hemlock) 1% Picea spp. (Spruce) and Abies balsamea (L.) Mill. (Balsam fir) <1% Other softwoods 2%
1.2 Pinus taeda
Pinus taeda (Figure 1.1), the most important commercial timber species in the
southern U.S. is grown on 11.7 million hectares (Baker and Balmer, 1983a; Rauscher,
xx

2004) which is 80% of the commercial forest area in the south (Smith et al., 1990). The
geographical range of this species extends across 15 states in the south and mid-Atlantic
region (Baker and Langdon, 1990). Approximately, one billion P. taeda seedling are
planted each year (McNabb and Enebak, 2008). Pinus taeda grows in a variety of
conditions producing a high wood volume yield per acre. It provides all-purpose
marketable forest products, ecosystem services and place for recreational activities
making it the most economical pine species in the southern U.S (Poudel, 2014; Schultz,
1997).
Figure 1.1 Pinus taeda stands in Cordele, Georgia, USA.
1.2.1 History of Pinus taeda
Pinus taeda was only a minor component (2.2 million hectares) of hardwood
dominated Piedmont forest before European settlement in the U.S. (before the 1800’s).
These forests were converted into agricultural lands (especially cotton farming) after
2

European settlement. However, the introduction of the boll weevil (Anthonomus grandis
grandis Boheman) impacted the growing cotton industry, and piedmont and coastal
plains in the south remained unused. Abandoned land with eroded soil created a favorable
condition for the spread of the light-seeded P. taeda trees resulting in the widespread
growth of pure P. taeda stand (Schultz, 1997). Fire control programs conducted in the
early 1900s further favored those stands. Furthermore, P. taeda stands expanded to cover
the natural range of the species from eastern Texas to central Florida to southern New
Jersey (Schultz, 1997).
1.2.2 Indicators of health and vigor of P. taeda
Crown morphology is one of the indicators of P. taeda tree health. Trees with
larger crowns (high crown density) are stronger and have higher energy available for the
stem growth. The live crown ratio indicates the health and growth potential of individual
trees. Healthy P. taeda trees in the southern U.S have a live crown ratio of 0.40, or
greater (Zhao et al., 2012).
Healthy roots are another indicator of the good health of P. taeda. The root system
of a P. taeda consists of a taproot, lateral roots, and fine roots. The tap root is strong and
extends downward. Lateral roots are smaller than taproot and grow in all directions
covering larger areas. Ten or more lateral roots usually originate from the tap root of a
tree at depths of 15-to-100 cm depending on the soil texture. Whereas, 3-to-10 lateral
roots grow within 15 cm below the ground surface. These roots live for the entire life of a
tree. Lateral and fine roots are the primary supporting roots, and soil water and nutrient
3

absorbing roots respectively (Schultz, 1997). Healthy roots are vital to P. taeda health
and productivity.
1.2.3 Biotic and abiotic factors affecting growth of P. taeda
Various biotic and abiotic factors put P. taeda health at risk. Factors that
influence P. taeda growth are temperature, soil type, fertilization, daylight length,
moisture, genetics, wind and flooding, high and freezing temperature. Also, vegetative
competition may affect the growth (Schultz, 1997). The soil moisture availability is
critical for the growth of P. taeda. Moisture stress causes various physiological changes
in P. taeda tree. Prolonged moisture stress can hinder or interrupt tree growth by
affecting stomatal opening (Schultz, 1997).
Soil moisture conditions influence the stomatal opening of P. taeda. The needles
of P. taeda seedlings growing under warm and moist condition have 70 % of the stomata
open 14 hours after watering. Under similar soil moisture condition, 62 hours after
watering, stomatal opening drops to 30% (Newton et al., 1987). However, individual
trees may respond differently to moisture stress due to genetic differences. Drought
resistant trees can resume the normal functioning of all the tissues after severe
dehydration (Newton et al., 1987).
Various plant growth characteristics are affected by soil moisture. Such as annual
rings, relative amounts of early wood and latewood production, needle growth and
development, and root growth. In drier years, the radial growth of mature P. taeda trees
reduces by 20% to 30% (Hiller and Brown, 1967). Moisture stress may negatively impact
root growth and rate of water absorption by roots. The root-to-shoot ratio is larger in
4

seedlings growing under dry soil conditions than that compared to seedling growing
under the moist soil. Needles grow 1 mm/day until they reach 70% of their maturity if the
soil moisture is near field capacity. However, in drying soil, growth is only 0.4 to 0.6
mm/day until they reach maximum length (Kaufmann, 1968). Pinus taeda is tolerant to
low levels of soil O2 caused by excess moisture associated with flooding (Williston,
1962). Abiotic factors play a role in predisposing the trees to organisms like insects and
fungi (Baker, 1972).
Pinus taeda is a host to many insects among which some cause significant
damage. For example, Dendroctonus frontalis Zimmermann (southern pine beetle)
among others is the most destructive pest in the southern U.S and is distinguished as a
persistent threat of pine trees. Several outbreaks of this insect from 1999 to 2003 have
occurred causing damage to millions of acres of state, federal, industrial and private
forests (Thatcher and Barry, 1982). Pinus taeda stands on poor site, adverse weather,
overstocking or over maturity are likely to be more stressed and are susceptible to
infestation by D. frontalis. Even well-managed stands adjacent to stand with stressed
trees are also at risk when the beetle populations are high (Baker and Balmer, 1983b).
Several other insects negatively impact P. taeda health. For example, pine
engraver beetles (Ips spp.) are another important pest group of the southern pine forests.
They consist of three species I. calligraphus (Germar), I. grandicollis (Eichoff) and I.
avulsus (Eichoff) which have six, five and four spines respectively on their bodies’
surfaces. These insects attack dying, unhealthy and recently felled trees (Connor and
Wilkinson, 1983). Pine tip moths (Rhyacionia spp.) often infest the tips of the young
5

seedlings and saplings which are under 5 years of age (Fettig et al., 2000). Regeneration
weevils such as Hylobius pales (Herbst) and Pachylobius picivorus (Germar) with their
ophiostomatoid fungal associates are associated with Pinus strobus L. (white pine) and
Pinus resinosa Sol. ex Aiton (red pine), and P. taeda decline in the northeastern and the
southern U.S. (Erbilgin and Raffa, 2000; Eckhardt et al., 2007) respectively. Similarly,
Hylastes spp. feed on the roots of pre-stressed conifers (Wood, 1982; Jacobs and
Wingfield, 2001). Hylastes salebrosus Eichoff and H. tenuis Eichoff have been
associated with pine decline (Klepzig et al., 1995; Jacobs and Wingfield, 2001; Eckhardt
et al., 2007). However, accurate economic assessment of the damages caused by these
pests in the southern U.S. forests is limited in recent literature.
Pinus taeda is a suitable host to fusiform rust caused by Cronartium quercuum f.
sp. fusiforme (Fusarium spp. and Macrophomia spp.), root rot (Heterobasidion irregulare
Fr.) and heart rot (Phellinus pini Tho. Ex. Fr.) (Baker and Balmer, 1983b) (Table 1.2).
Leptographium Lagerb. and Melin and Ophiostoma H. and P. Sydow, commonly known
as ophiostomatoid fungi infect lateral roots of pine trees, and, have been associated with
pine decline (Harrington and Cobb, 1988; Eckhardt et al., 2004a; Eckhardt et al., 2007).
6

7
Table 1.2 Common fungal diseases of pine forests of the southern U.S.
Pathogen Diseases Host References Cronartium quercuum fusiforme Fusiform rust P. elliottii
P. taeda Lamb and Sleeth (1940) Burdsall and Snow (1977) Lamb and Sleeth (1940)
Heterobasidion irregulare Annosus root-rot P. elliottii P. taeda P. echinata
Powers and Boyce (1961) Lightle (1960) Berry and Dooling (1962)
Armillaria spp. Armallaria root- rot Conifers Hepting and Downs (1944) Phytopthora cinnamomic Littleleaf disease Shortleaf pine
Radiata pine Hepting and Jemison (1950) Newhook 1959
Hypoderma spp.
Lophodermium pinastri Bifusella linearis
Needle cast disease
Loblolly pine Longleaf pine Shortleaf pine Slash pine Virginia pine Mountain pine Pitch pine All pines Eastern white pine
Boyce (1958); Hepting and Jemison (1950) Boyce (1958) Boyce (1958) Boyce (1958) Boyce (1958) Boyce (1958) Boyce (1958) Boyce (1958)
Fusarium circinatum Pitch canker Loblolly pine Nirenberg and O’Donnell (1988) Mycosphaerella dearnessii Brown spot needle blight Longleaf pine Siggers (1944) Leptographium procerum Procerum root disease Loblolly pine Eckhardt et al.(2004a); Eckhardt et al. (2007) Leptographium procerum Leptographium terebrantis Grosmannia huntii Grosmannia alacris
Southern Pine Decline (SPD) Loblolly pine Longleaf pine
Eckhardt (2004b); Zanzot et al. (2010); Matusick et al. (2010)

1.3 Concepts of forest decline
Forest decline can occur at a stand level or landscape level. Trees of the same
species showing out-of-season leaf discoloration, diameter increment reduction and loss
of crown vigor indicate a decline. Dieback often comes together with the decline which is
the further concatenation of decline. Loss of leaves in the crown of the top limbs of the
tree indicates the dieback. Tree death often follows the decline (Manion, 1981).
Forest decline is multifactorial in origin, and thus, often difficult to determine the
exact factors causing decline (Manion, 1981). However, a common interpretation of the
literature is that forest decline is a disorder involving abiotic stresses that modifies the
physiology and predisposes trees to dieback and damage caused by biotic agents. There
are several hypotheses regarding factors in forest decline.
The host, stress, and pathogen hypothesis describes decline as a disease. This
assumption suggests that some form of environmental stress alters the host tissues,
making it vulnerable to pathogen invasion. Invaded pathogen weakens the plant tissues,
and further leads to tree decline (Ciesla and Donaubauer, 1994). The synchronous cohort
senescence hypothesis considers decline as a part of forest dynamics involving various
interacting factors. This concept suggests that certain sudden eliciting environmental
factors such as drought and flood predispose the trees to pest and pathogen attacks
(Ciesla and Donaubauer, 1994).
The most widely accepted hypothesis of forest decline is the chain reaction theory
given by Sinclair (1965). According to this hypothesis, when predisposing, inciting and
contributing factors come into play together, they cause forest decline (Sinclair, 1965).
Manion (1981) assimilated this theory in his death spiral theory which helps to clarify the
concept of decline and describes different biotic and abiotic agents as factors causing
8

decline. Moreover, this model gives emphasis on pathology which supports the idea that
forest decline is a form of a disease. The predisposing factors are long-term factors such
as the genetic potential of the tree, age, climate, soil factors, and air pollution. The
inciting factors are short term factors such as frost, drought, salt, and mechanical injury.
The contributing factors are bark beetles, canker fungi, and root decay fungi. Thus, the
decline can be a slow process in which pathogens and insects always appear towards the
end (Manion and Lachance, 1992).
1.4 Pine Decline (PD)
Pine Decline (PD) was first reported in 1959 in the Talladega National Forest in
the Okmulgee and Tuscaloosa Ranger districts in Alabama (Brown and McDowell,
1968). This decline was termed as “loblolly pine die-off.” Further incidences of mortality
were reported during the early 1970s, which included the symptoms such as chlorotic
crowns, thinned crowns, deteriorated fine and lateral roots and reduced growth (Roth and
Preacher, 1971).
Phytophthora cinnamomi Rands was initially suggested as the causal agent of
“loblolly pine die-off” (Hess et al., 1999). In the early 2000s, there were more reports of
loblolly pine decline. Hess et al. (2002) further examined the conditions and factors
associated with this early tree mortality and recovered many fungi from the soil root zone
including, P. cinnamomi and Leptographium spp. Furthermore, Eckhardt et al. (2007)
conducted a three-year study to investigate the roles of fungi and root-feeding bark
beetles in pine decline. Root-feeding bark beetles such as H. salebrosus Eichoff, H.
tenuis, P. picivorus and H. pales were recovered from areas with symptomatic trees
showing symptoms of decline (Eckhardt et al., 2007). Eckhardt et al. (2004a) had
9

previously found that Hylastes species could vector the fungi Leptographium spp. Further
studies have provided sufficient supporting evidence to prove the hypothesis that root-
feeding bark beetles and their fungal associates are biotic factors associated with PD.
Recently, premature mortality in P. taeda has been described as a disease decline
disorder which involves a complex interaction of biotic and abiotic factors (Eckhardt et
al., 2007). The predisposing factors are abiotic factors including topography, drought,
increased slope, and southwest facing aspects that predispose the pines to biotic factors
such as bark beetles. The abiotic factors induce stress on the trees, and the stressed trees
will then attract root and lower stem feeding bark beetles (Eckhardt et al., 2007). These
beetles carry the fungus from an infected tree to a stressed tree by feeding activity (Paine
and Hanlon, 1994). There is a mutualistic relationship between the ophiostomatoid fungi
and the root feeding bark beetles that lead to an expansion of the decline disease complex
(Paine et al., 1997). Figure 1.2 shows an advanced hypothesis of PD termed as diseae
circle, in which various biotic and abiotic factors are adapted from the literature. Various
predisposing factors such as tree genetics, age and topographical location of the tree,
climatic and soil factors act as predisposing factors. Stand density, stand species
composition, natural disturbance, anthropogenic factors and soil moisture stress act as
inciting factors which stress the trees. Then the stressed trees attract insects and the
associated fungi that act as contributing factors in the PD.
10

11
Figure 1.2 Model of southern pine decline (disease circle). Factors are adapted from many literatures.

1.5 Ophiostomatoid fungi
Ophiostomatoid fungi contains diverse anamorphs and teleomorphs with different
patterns of conidium ontogeny, ascomatal centrum development, different biochemical
composition and symbiotic association with the insect vector (Upadhyay, 1993). Some
genera in this group are Ophiostoma Syd. and P. Syd., Ceratocystis Ellis and Halst.,
Ceratocystiopsis H.P Upadhyay and W.B. Kendr., Grosmannia Goid. as well as related
asexual genera Leptographium, Pesotum J.L. Crane and Schokn., Sporothrix Hektoen and
C.F. Perkins, Hyalorhinocladiella H.P. Upadhyay and W.B. Kendr., Thielaviopsis Went,
Chalara Rabenh., and Graphium Cord. (Repe and Jurc, 2010).
Many of ophiostomatoid fungi are conifer pathogens and blue-staining fungi
(Repe and Jurc 2010). They have darkly pigmented hyphae which cause blue staining of
the plant tissue (Jacobs and Wingfield, 2001. They pose mucilaginous ascospores and
conidia. The slimy masses of the spores are produced at the top of the long conidiophores
which helps surface attachment to vectors (Wingfield et al.,1993). The fungi lead to
superficial discoloration on the wood surface by sporulation. When they penetrate the
wood, they cause blue coloration which reduces the economic value of the timber
(Uzunovic et al., 1999).
1.5.1 Leptographium species (Lagerb and Melin.)
Leptographium, the anamorph of Ophiostoma, is distinguished by having dark
mononematous conidiophores that give rise to a series of branching metulae. These
conidiophores have conidiogenous cells at the terminal end which produce single-celled
pigmented hyaline conidia. The conidia are produced through enteroblastic ontogeny and
12

holoblastic proliferation (Jacobs and Wingfield, 2001). Conidia are ideally suited for
dispersal by insects as they accumulate in a slimy mass at the top of the conidiophore
(Figure 1.3).
Leptographium spp. have cellulose, rhamnose, and chitin in their cell walls and
are tolerant to high concentrations of cycloheximide (Jacobs and Wingfield, 2001).
Ceratocystis could be associated with Leptographium species. The characteristics of
Ophiostoma and the Ceratocystis are similar which led to doubt regarding the validity of
the genera. However, currently, these two genera are accepted as being phylogenetically
unrelated (Hausner et al., 1993; Spatafora and Blackwell, 1994).
Leptographium spp. have been recovered throughout the world. In the Northern
Hemisphere, the fungus has been recorded from U.S., Canada, Europe, Germany, Italy,
Japan, Vietnam, Taiwan, and China. Whereas, in the Southern Hemisphere, the fungus
has been reported from New Zealand, South Africa, Central Africa and Australia (Jacobs
and Wingfield, 2001). In most cases, Leptographium species have been reported from
conifers (Kendrick, 1962; Harrington, 1988) and, only a few cases have been reported
from deciduous trees (Kendrick,1962). This fungus has been found to be one of the most
pathogenic fungus isolated from declining P. taeda in the southern U.S. (Hess et al.,
1999). Leptographium terebrantis Barras and. Perry is vectored by Dendroctonus
terebrans (Oliver) infecting P. taeda (Barras and Perry, 1971). This fungus also was
isolated from the root samples and insects captured from several P. taeda plantations in
Alabama (Eckhardt et al., 2007). The continuous re-isolation of L. terebrantis from
southern forests indicates that the fungus has the potential to become a devastating
pathogen in the future.
13

Figure 1.3 Conidia of Leptographium terebrantis in Pinus taeda root section.
Leptographium procerum (W.B. Kendr.) M. J. Wingf., previously known as
Verticicladiella procera Kendrick (Kendrick, 1962; Wingfield, 1983) was first identified
from P. banksiana Lamb. (jack pine) (Kendrick, 1962) and has been recovered from
other conifer species including P. palustris (longleaf pine) (Otrosina et al., 1999), P.
taeda (Eckhardt et al., 2004a) and P. elliottii (slash pine) by Barnard et al. (1991). This
fungus has been isolated from declining white pine from the U.S. (Houston, 1969;
Lackner and Alexander, 1982; Wingfield and Marasas, 1983), Yugoslavia (Halambek,
1976) and New Zealand (Shaw and Dick, 1980; Wingfield and Marasas, 1983).
The insect vectors associated with L. procerum are D. frontalis Zimmermann
(Otrosina et al., 1999), Hylastes spp. (Wingfield and Gibbs, 1991; Eckhardt et al., 2007)
and H. pales by (Klepzig et al., 1991). Though L. procerum have repeatedly been isolated
from various pine decline site, pathogenicity tests have shown that it is a weak pathogen
compared to L. terebrantis, Grosmannia huntii (R.C. Rob. Jeffr.) Zipfel, Z.W. de Beer
and M.J. Wingf. and G. alacris T.A. Duong, Z.W. de Beer and M.J. Wingf. sp. nov
(Wingfield, 1986; Matusick et al., 2012).
14

1.5.2 Grosmannia huntii (R.C. Rob. Jeffr.) Zipfel, Z.W. de Beer and M.J. Wingf.
Grosmannia huntii was formerly known as Ophiostoma huntii (Zipfel et al.,
2006). The teleomorphic form Grosmannia huntii and anamorphic form Leptographium
huntii were first described occurring on Pinus contorta Dougl. var. latifolia Engelm.
(lodgepole pine) infested by D. ponderosae Hopkins (mountain pine beetle) in British
Columbia, Canada (Robionson-Jeffrey and Grinchenko, 1964). Grosmannia huntii have
distinct serpentine hyphae as shown in Figure 1.4. The colonies initially grow hyaline,
and the olivaceous pigmentation appears with time. It produces sparse conidiophores in
culture. If present, each conidiophore has two primary branches. The conidiophore form
on the aerial mycelium gives rise to ovoid conidia (Jacobs and Wingfield, 2001).
Figure 1.4 Serpentine hyphae of Grosmannia huntii.
Grosmannia huntii has been isolated from New Zealand from Hylastes ater
(Payk) stumps, and seedlings of pine trees infested with Hylastes ater (Reay et al., 2005).
It also occurs in Australia, associated with H. ater, Tomicus piniperda (Linnaeus) in
Europe and H. macer LeConte and Ips pini (Say) in the U.S. (Harrington, 1988;
Wingfield and Gibbs, 1991; Zhou et al., 2004). In the U.S., it has been isolated from
15

root-feeding bark beetles in California (Kim et al., 2011), Georgia (Zanzot et al., 2010),
Alabama (Matusick et al., 2013). Grosmannia huntii has recently been described as
relatively virulent fungi among other Leptographium spp. and Grosmannia spp. in the
southern U.S. (Zanzot et al., 2010; Matusick et al., 2012).
1.5.3 Grosmannia alacris T. A. Duong, Z. W. de Beer and M. J. Wingf.
Grosmannia alacris T. A. Duong, Z. W. de Beer and M. J. Wingf. renamed from
L. serpens (Goid.) (Duong et al., 2012) was previously described as Verticicladiella
alacris (Wingfield and Marasas, 1981). Grosmannia alacris has been isolated from
diseased roots of P. pinea L. in Italy and P. radiata D. Don and P. pinaster Aiton in
South Africa (Wingfield et al., 1988). In culture medium, the fungus forms black
mycelium and has relatively slow growth rate compared to either L. terebrantis or L.
procerum. Serpentine shaped hyphae are the most important characteristic of this fungus.
Grosmannia alacris has been successfully isolated from H. tenuis and H. salebrosus
(Eckhardt et al., 2007) and has been reported to produce longer lesions on mature loblolly
pine tree roots when compared to lesions produced by either L. terebrantis or L.
procerum (Matusick et al., 2012).
1.6 Concept of virulence and pathogenicity
The terms pathogenicity and virulence are commonly used in the literature
dealing with fungal pathogens. However, the usage of these terms is often confusing.
Pathogenicity is the ability of a disease-causing agent to cause disease which may be
either natural or experimental. It considers only the qualitative factors associated with the
level of pathogenicity. Whereas, virulence is the capability of a disease-causing agent to
cause disease. Virulence considers both qualitative and quantitative factors related to the
16

degree of pathogenicity (Watson and Brandly, 1949). Virulence is used to compare the
disease evoking capacity of an isolate compared to another. Also, it is used to refer to the
process of the disease establishment and to indicate the relative amount of damage to the
host (Shaner et al., 1992). Various inoculation techniques can assess the relative
virulence and the pathogenicity of pathogens.
1.7 Methods of fungal inoculation
Inoculation experiments satisfy the Koch’s Postulates and confirm the causal
relationship between disease and the disease-causing agent. Experiments with artificial
inoculation of fungi is a simplified method to determine the pathogenicity and relative
virulence of ophiostomatoid fungi (Wingfield and Marasas, 1983, Matusick and
Eckhardt, 2010). Various stages of the tree from seedling to sapling to mature trees have
been used for inoculations (Matusick and Eckhardt, 2010).
Wright (1933) described the method for an artificial inoculation study to mimic
natural inoculation of fungi by bark beetles in the tree. In this approach, the bark around
the point of inoculation is surface sterilized with 70% ethyl alcohol and bark disc is
removed with a sterilized 6 mm cork borer to create an artificial wound. A disc of the
fungal mycelium from the culture plate is taken and inserted into the wound in the tree
using a sterile plunger. The inoculation site is then covered with sterile moistened cotton
balls and then finally covered with a wrapper (Wright, 1933).
Artificial inoculation experiments have been conducted to determine the virulence
and the pathogenicity of the ophiostomatoid fungi in conifers (Yamaoka et al., 2000;
Molnar, 1965; Lieutier et al., 2009; Jankowiak, 2006; Lee et al., 2006; Matusick et al.,
2012). Hepting and Roth (1946) artificially inoculated mature Pinus virginiana Mill.
17

(Virginia pine), P. echinata and P. rigida Mill. (Pitch pine) trees with Fusarium species.
The fungal inoculation resulted in an infection and death of those trees (Hepting and
Roth, 1946). Molnar (1965) used a similar method and inoculated, Abies lasiocarpa
(Hook.) Nutt. (Alpine fir) trees (15.24-38.1 cm in diameter) with Ceratocystis dryocetidis
Kendrick and Molnar. Sterile agar was inoculated as a control (Molnar, 1965). Paine and
Stephen (1987) used the similar inoculation technique to inoculate an 18-year-old P.
taeda (19 - 19.5 cm in diameter at 1.5 m height). The choice of inoculation method
depends on the age of the tree.
1.7.1 Mature tree root inoculation
Mature tree root inoculation studies in conifers have been performed to
understand the pathogenicity of root-feeding beetle vectored fungi and their role in pine
decline. Declining longleaf pine roots with evidence of insect attacks, resinosis and
necrosis have been excavated and sampled for the presence of root-infecting fungi
(Otrosina et al., 1999). To determine the effect caused by these fungi, root inoculation
experiments seem a more accurate portrayal of disease etiology. Healthy primary lateral
roots have been inoculated on longleaf pine to determine the extent the root damage
caused by ophiostomatoid fungi (Matusick et al., 2010). This inoculation technique seems
more promising as it mimics the natural inoculation of ophiostomatoid fungi by root-
feeding bark beetles.
1.7.2 Mature tree stem inoculation
Wound inoculations of ophiostomatoid fungi in the cambium of mature trees bark
is the most commonly used technique to assess the fungal pathogenicity (Wright, 1933;
Matusick et al., 2016). Stem inoculations of the root pathogen L. terebrantis has been
18

repeated to give similar results as root inoculation in P. taeda and P. palustris. Also, stem
inoculation techniques can act as the surrogate to understand the relative pathogenicity of
root fungal pathogens; G. huntii, G. alacris, H. irregulare and L. procerum in the same
pine species (Matusick et al., 2016).
Inoculations of fungus at a single point in each tree has been performed with P.
resinosa Sol. ex Aiton (red pine) (Raffa and Smalley, 1988), P. ponderosa Douglas ex C.
Lawson (ponderosa pine) (Parmeter et al., 1989), P. taeda (Eckhardt, 2004b), and P.
palustris (Matusick and Eckhardt, 2010). Multiple inoculations (multiple dosages) like
200, 400 or 800 inoculation sites/m2 of the surface of the bark has been also performed in
Douglas-fir (Ross and Solheim, 1997), 400 inoculation sites/m2 Picea abies (L.) H.
Karst. (Norway spruce) (Krokene and Solheim, 1998). These artificial inoculations have
resulted in lesions occurring in the inoculated hosts.
Measurement of the necrotic lesion area formed around the point of inoculation
has been useful to evaluate fungal virulence (Matusick and Eckhardt, 2010; Raffa and
Smalley, 1988). The fungi in multiple mass inoculation experiments extended well
beyond the necrotic region, colonizing the phloem and sapwood, finally killing the tree
(Christiansen et al., 1987). These mature tree, mass inoculations experiments, mimic the
natural scenario of an introduction of the fungi by bark beetles and are a reliable estimate
of the fungal-virulence (Solheim 1993; Solheim and Krokene, 1998).
The inoculum size and the number of inoculation points are the primary factors to
be considered while performing inoculation experiments. Wound size created for
inoculations varies between 5 - 19 mm between studies which might lead to a difference
in results between studies. Inoculation techniques using multiple inoculation points m-2
19

would be more practical in determining the actual impact of the beetle- vectored fungi.
The studies on the impact of multiple point inoculations on the physiology of southern
pine species are limited.
1.7.3 Seedling inoculation
Numerous seedling inoculation experiments have been conducted to determine
the pathogenicity of ophiostomatoid fungi on pine trees and to assess the relative
virulence of different ophiostomatoid fungi (Harrington, 1993; Krokene and Solheim,
1998; Parmeter et al., 1989; Wingfield, 1986; Yamaoka et al., 1995). Inoculation in a
seedling stem under aseptic conditions is performed by inoculating colonized mycelium
in slanting cut made in the seedling stem (Singh et al., 2014; Matusick and Eckhardt,
2010; Nevill et al., 1995). Various host response characteristics and symptoms can then
be observed to determine successful fungal colonization.
Various host response characteristics such as mortality (Wingfield, 1983), dark
resinous lesion (Matusick and Eckhardt, 2010; Nevill et al., 1995), chlorotic needles,
inner bark necrosis and reduction in water potential (Rane and Tattar, 1987) are observed
following inoculation of ophiostomatid fungi in P. taeda. In addition, other responses like
occlusion of vascular tissues (Singh et al., 2014; Matusick and Eckhardt, 2010) as well as
a change in monoterpene levels and carbohydrate composition have been observed (Cook
and Hain, 1985). The defense system of small seedlings may not be similar to a mature
tree and therefore the use of seedlings to estimate virulence in the mature trees may affect
the accuracy. Thus, careful experimentation and elucidation of the results are necessary.
Krokene and Solheim (1998) studied the relevance of seedling inoculation study
in determining the pathogenicity of Capperia polonica Adamczewski and Ophiostoma
20

spp. by comparing it with inoculation in 40-year-old P. abies trees. They repeated that the
fungal isolate showed similar virulence in seedlings when compared to mass inoculation
study using 40–year–old trees. Some studies have suggested that fungi appear to be more
pathogenic to seedlings than to mature trees (Basham, 1970). However, seedling
inoculation experiments allow to control over the soil temperature and moisture to assess
the pathogenicity of fungi. Lower inoculum load should be used in seedling inoculations
compared to mature trees to get proportionally accurate equivalent lesion.
1.7.4 Lesion measurement
The fungi associated with PD when inoculated in pine trees, cause the necrotic
lesions. The lesion extends radially from the point of inoculation. The relationship
between vertical lesion length and depth have not gained proper attention (Parmeter et al.,
1992). Many authors focused only on vertical lesion length (Cook and Hain 1985; Paine
et al., 1988; Raffa and Berryman, 1982; Wingfield, 1986). Since the sapwood depth is
limiting, it is therefore suggested that the vertical extension of the lesion from the point of
inoculation is the better measure of pathogenicity (Parmeter et al., 1992). Placing the
infected stem in a dye solution and measuring the area through which the dye could not
pass has been used as a measure of the sapwood occlusion (Matusick et al., 2008;
Parmeter et al., 1992; Singh et al., 2014).
The time period between fungal inoculation and lesion measurement is also an
important factor to consider. Cook and Hain (1985), repeated there is a significant
increase in lesion length produced by O. minus (Hedge.) H. et P. Syd. on P. taeda when
measured at 2 weeks and 4 weeks. Similarly, Raffa and Smalley (1988) found a
continuous increase in lesion length produced by Ceratocystis nigrocarpa (Davids.) and
21

C. ips (Rumb) on either P. resinosa or P. banksiana from 1 to 5 weeks after inoculation.
Parmeter et al. (1992), with the purpose of finding a time frame of the radial development
and extension of sapwood occlusion, inoculated 36-37-year-old trees of P. ponderosa and
measured the lesion and occlusion length weekly. In the study, lesion and occlusion sizes
were not different between 9 and 17 weeks post fungal inoculation. They reported that
the lesion and occlusion reached maximum size (near endpoint) 8-10 weeks post
inoculation. The lesion length in loblolly pine seedlings has been measured at 8 (Singh et
al., 2014; Chieppa et al., 2015) and 16 weeks (Eckhardt, 2004b; Matusick et al., 2008)
following inoculation.
The lesion caused by the blue stain fungus can be an evidence of both fungal
growth and the resistance response of the host tree (Solheim, 1992). Lesion length has
been used as a strong indicator of the fungal pathogenicity (Molnar, 1965; Paine et al.,
1997; Matusick et al., 2012; Singh et al., 2014; Chieppa et al., 2015). Smaller lesion
lengths may indicate that the tree can produce the effective defensive mechanism towards
the fungi whereas longer lesion as the response produced by less resistant trees
(Horntvedt, 1988; Solheim, 1988; Singh et al., 2014). Also, the most pathogenic fungus
grows for a longer period under oxygen-deficient condition than the less pathogenic one.
The ability of the fungus to tolerate the oxygen-deficient condition may be related to the
volume of the occluded sapwood (Solheim, 1992).
1.8 Host defense
Active defense mechanisms in conifers helps them to protect from insect and
pathogens. These defense mechanisms involve the production of terpenoids and
phenolics that are toxic to bark beetles. Oleoresin, a major chemical constituent of
22

conifers, is a complex mixture of terpenes. Its secretion plays a significant role in the
defensive mechanism of conifers against beetles, fungi, and microbes (Turtola et al.,
2003) and conifers have unique anatomical structures that store and transport these
chemicals.
Recently, researchers have been focused on inter-species and intra-species
variation in tolerance of pine trees (Matusick et al., 2010; Singh et al., 2014). The
response of the host tree to inoculation of beetle-vectored-fungi is the reliable means of
identifying the relative host resistance (Raffa and Smalley, 1988). Fungal metabolism,
but not the structural components have been found to responsible for eliciting the host
defense mechanism (Raffa and Smalley, 1988). So, the inter-species and intra-species
variance of the pine can be studied regarding their response towards the pathogenic fungi
(Singh et al., 2014). Thus, studying the response of the tree to fungi would be a promising
step in selecting tolerant pine varieties to mitigate the pine decline problem.
1.9 Tree-to-tree variation
Pinus taeda trees within a stand may have significant genetic variation. For
example, as the quality and quantity of chemicals are under strong genetic control
different levels of monoterpenes can be present in individual trees (Rockwood, 1972).
Also, there is significant genetic variation among the trees regarding survival, growth,
development, resistance to insects and disease-causing agents. These genetic variations
allow selection of specific traits and thus help to generate families having desirable
properties (Schultz, 1997).
23

1.10 Climate change in host-pathogen interactions
Abiotic stress factors like adverse climatic condition have an influence on the
susceptibility of host conifers to attacks by pathogens and insects (Lindberg and
Johansson, 1992). Climate change issues like increasing levels of ozone at of rate of 0.3%
to 2% per year (Balsing, 2009), fluctuating mean annual precipitation and increasing
temperature are prevalent (Paoletti et al., 2009). The fungal pathogens may behave in a
different manner under future climate change conditions (Chieppa et al., 2015; Klepzig et
al., 2001). For example, the forests of the southeastern U.S. have experienced severe
droughts in recent years, and these drought events significantly affected tree growth and
mortality (Klos et al., 2009; Wang et al., 2010). Drought-stressed P. palustris seedlings
inoculated with G. huntii have resulted in an increased infection and high mortality in
longleaf pine (Matusick et al., 2008). Seedlings treated with ozone were more susceptible
to ophiostomatoid fungi. Pinus taeda families which were susceptible to pine decline
associated fungi were found to be more sensitive to ozone treatment (Chieppa et al.,
2015). Therefore, it is important to understand the pathogen virulence and host defense
system under other predicted climate change scenarios.
1.11 Possible solutions to root infecting ophiostomatoid fungi
Ophiostomatoid fungi have the potential to become a more virulent pathogen in a
changed environment. Global trade of logs and wood products has enhanced the
introduction of pathogens into new environments. One of the examples is Dutch Elm
disease caused by O. ulmi (Buisman) Melin and Nannf. associated with Scolytus spp.
(Brasier, 2001). This disease is a plant vascular wilting disease that caused massive tree
mortality in Europe and North America in the 20th century. Similarly, ophiostomatoid
24

fungi were found to be problematic in Pinus species and Pieca abies (L.) H. Karst
(Norway spruce) (Friedl, 2004). Various studies have suggested, though the present
damage is at low levels, the predicted environmental changes in the future may bring new
threats at a larger level.
The first strategy to mitigate this problem is to investigate the potential pathogen
that might negatively influence the forest health (Repe and Jurc, 2010). Prognostic and
early diagnostic procedures must be adopted (Jurc et al., 2006). Identification of the
pathogen by microscopy and culture may be time taking. In addition, some of the
microbes cannot be cultured. Use of recent molecular techniques such as loop-mediated
isothermal amplification (LAMP) and clustered regularly interspaced short palindromic
repeats (CRISPER) might be promising approach to detect pathogen.
Various fungicides have been used for treatment where the damage is severe.
However, the use of fungicides has been found to be problematic. Fungicides have a
broad spectrum of the mode of action and may kill other useful microorganisms. Thus,
the application of the fungicide is not recommended (Jmones and Mangels, 2002).
Another good approach to mitigate potential problem due to PD in industrial
plantations may be breeding trees for resistance to ophiostomatoid fungi. This can be
done by phenotypic selection of tree or genetic improvement of the trees. This method
seems suitable, but often it is dubious that resistance may change from young to adult.
Screening studies should be conducted both on mature and the young trees (Repe and
Jurc, 2010).
Fungal virulence may also change over time (Dwinell, 2001). So, the regular
monitoring and diagnosis of the tree are very crucial. Other possible solutions would be
25

to study the biocontrol potential of the beneficial microbes in the rhizosphere and
phyllosphere of the tree. For example, albino strains of Ophiostoma spp. do not
synthesize the melanin-like pigment (Farrell et al., 1993; Schroeder et al., 2002) and have
been found to be effective in stopping the pathogenic fungi. The chemical method of
treatment and kiln drying is done to treat wood vulnerable to attack by blue-stain fungi.
Fungal biology and the disease pathogenesis should be properly studied to fight against
the pathogen and disease.
1.12 Conclusion
The purpose of this review is to view the impact of the insect-vectored vascular-
inhabiting ophiostomatoid fungi to the Pinus species in the southern U.S. There have
been some research conducted to understand the pathogenicity and the virulence of these
fungal species on Pinus species. Also, some studies have been carried out to understand
the inter-species variability in the tolerance of Pinus species. Further research and testing
are required to better understand the intra-species and inter-stock type variability in
tolerance of P. taeda to ophiostomatoid fungi. Furthermore, it is necessary to develop an
efficient artificial fungal inoculation technique to mimic the natural inoculation of the
fungi by bark beetles to understand the impact caused by these fungi.
1.13 References
Baker, J., and Langdon, O. (1990). Silvics of North America. USDA For. Sent. Handb, 654.
Baker, J. B., and Balmer, W. E. (1983a). Loblolly pine. Silvicultural systems for the
major forest types of the United States. Agric. Handb, 445, 148-152. Baker, J. B., and Balmer, W. E. (1983b). Loblolly pine. Agriculture Handbook, Ed by
Burns, RM USDA, Forest Service. Washington, DC, US, 148.
26

Baker, W. L. (1972). Eastern forest insects: United States Departtment of Agdriculture, Forest Service, Miscellaneous Publications 1175, 642 pp.
Blasing, T. J. (2009). Recent greenhouse gas concentrations. Carbon Dioxide Information
Analysis Center. http://cdiac.ornl.gov/pns/ current_ghg.html, DOI: , DOI: 10.3334/CDIAC/atg.032.
Barnard, E., Gilly, S., and Dixon, W. (1991). Incidence of Heterobasidion annosum and
other root-infecting fungi in residual stumps and roots in thinned slash pine plantations in Florida. Plant Dis, 75, 823-828.
Barras, S. J., and Perry, T. (1971). Leptographium terebrantis sp. nov. associated with
Dendroctonus terebrans in loblolly pine. Mycopathologia, 43(1), 1-10. Basham, H. (1970). Wilt of Loblolly Pine inoculated with blue stain fungi of the genus
Ceratocystis. Phytopathology, 60(5), 750-754. Berry, F. H., and Dooling, O. J. (1962). Fomes annosus on shortleaf pine in
Missouri. Plant Dis. Rep, 46, 886-887. Boyce, J. S. (1958). Needle cast of southern pines. Department of Agriculture, Forest
Service., Forest Pest Leaflet 28. Brasier, C. M. (2001). Rapid evolution of introduced plant pathogens via interspecific
hybridization is leading to rapid evolution of Dutch elm disease and other fungal plant pathogens. Bioscience, 51(2), 123-133.
Brown, H., and McDowell, W. (1968). Status of loblolly pine die-off on the Oakmulgee
District, Talladega National Forest, Alabama-1968. US Dep. Agric. For. Serv. Rept(69-2), 28.
Burdsall Jr, H. H., and Snow, G. A. (1977). Taxonomy of Cronartium quercuum and C.
fusiforme. Mycologia, 503-508. Chieppa, J., Chappelka, A., and Eckhardt, L. (2015). Effects of tropospheric ozone on
loblolly pine seedlings inoculated with root infecting ophiostomatoid fungi. Environmental Pollution, 207, 130-137.
Christiansen, E., Waring, R. H., and Berryman, A. A. (1987). Resistance of conifers to
bark beetle attack: searching for general relationships. Forest Ecology and Management, 22(1), 89-106.
Ciesla, W. M., and Donaubauer, E. (1994). Decline and dieback of trees and forests: a
global overview (No. 120). Food and Agriculture Org.p 3-9.
27

Connor, M. D., and Wilkinson, R. C. (1983). Ips bark beetles in the South. US Department of Agriculture, Forest Service.
Cook, S. P., and Hain, F. P. (1985). Qualitative examination of the hypersensitive
response of loblolly pine, Pinus taeda L., inoculated with two fungal associates of the southern pine beetle, Dendroctonus frontalis Zimmermann (Coleoptera: Scolytidae). Environmental entomology, 14(4), 396-400.
Duong, T. A., De Beer, Z. W., Wingfield, B. D., and Wingfield, M. J. (2012). Phylogeny
and taxonomy of species in the Grosmannia serpens complex. Mycologia, 104(3), 715-732.
Dwinell, L. (2001). Potential use of heat pasteurization to manage fungi in hardwood
lumber. Personal communication on unpublished preliminary results. Eckhardt, L. G., Goyer, R. A., Klepzig, K. D., and Jones, J. P. (2004a). Interactions of
Hylastes species (Coleoptera: Scolytidae) with Leptographium species associated with loblolly pine decline. Journal of economic entomology, 97(2), 468-474.
Eckhardt, L., Jones, J., and Klepzig, K. D. (2004b). Pathogenicity of Leptographium
species associated with loblolly pine decline. Plant disease, 88(11), 1174-1178. Eckhardt, L. G., Weber, A. M., Menard, R. D., Jones, J. P., and Hess, N. J. (2007).
Insect-fungal complex associated with loblolly pine decline in central Alabama. Forest science, 53(1), 84-92.
Erbilgin, N., and Raffa, K. F. (2000). Opposing effects of host monoterpenes on
responses by two sympatric species of bark beetles to their aggregation pheromones. Journal of Chemical Ecology, 26(11), 2527-2548.
Farrell, R. L., Blanchette, R. A., Brush, T. S., Hadar, Y., Iverson, S., Krisa, K., and
Wendler P. A., Zimmerman, W. (1993). Cartapip™: a biopulping product for control of pitch and resin acid problems in pulp mills. Journal of Biotechnology, 30(1), 115-122.
Fettig, C. J., Dalusky, M. J., and Berisford, C. W. (2000). Nantucket pine tip moth
phenology and timing of insecticide spray applications in seven southeastern states. Res. Pap. SRS-18. Asheville, NC: US Department of Agriculture, Forest Service, Southern Research Station. 23 p., 18.
Friedl, K. (2004). Blueness of spruce roundwood damage quantification and impact on
shelf life Y FORMEC, Gmunden, Upper Austria 8. Halambek, M. (1976). Dieback of eastern white pine (Pinus strobus L.) in cultures
(Yugoslavia). Poljoprivredna Znanstvena Smotra.
28

Harrington, T. (1988). Leptographium species, their distributions, hosts and insect vectors.
Harrington, T. (1993). Diseases of conifers caused by species of Ophiostoma and
Leptographium, Ceratocystis and Ophiostoma: taxonomy, ecology, and pathogenicity, 161-172.
Harrington, T. C., and Cobb, F. W. (1988). Leptographium root diseases on conifers.
Paper presented at the Symposium series (US). Hausner, G., Reid, J., and Klassen, G. (1993). On the subdivision of Ceratocystis sl,
based on partial ribosomal DNA sequences. Canadian Journal of Botany, 71(1), 52-63.
Hepting, G. H., and Downs, A. A. (1944). Root and butt rot in planted white pine at
Biltmore, North Carolina. Journal of Forestry, 42(2), 119-123. Hepting, G. H., and Jemison, G. M. (1950). A cure for littleleaf disease?. American
Forests, 56(11), 20-30. Hepting, G. H., and Roth, E. R. (1946). Pitch canker, a new disease of some southern
pines. Journal of Forestry, 44(10), 742-744. Hess, N.J., Otrosina, W.J., Carter, E.A., Steinman, J.R., Jones, J.P., Eckhardt, L.G.,
Weber,A.M., and Walkinshaw, C.H. 2002. Assessment of loblolly pine decline in central Alabama. Proceedings of the eleventh biennial southern silvicultural research conference. Gen. Tech. Rep. SRS–48.: U.S. Department of Agriculture, Forest Service, Southern Research Station, Asheville, NC. pp. 622.
Hess, N. J., Otroana, W. J., Jones, J. P., Goddard, A. J., and Walkinshaw, C. H. (1999).
Reassessment of loblolly pine decline on the Oakmulgee Ranger District, Talladega National Forest, Alabama.
Hiller, C. H., and Brown, R. S. (1967). Comparison of dimensions and fibril angles of
loblolly pine tracheids formed in wet or dry growing seasons. American Journal of Botany, 453-460.
Horntvedt, R. (1988). Resistance of Picea abies to Ips typographus: tree response to
monthly inoculations with Ophiostoma polonicum, a beetle transmitted blue‐stain fungus. Scandinavian Journal of Forest Research, 3(1-4), 107-114.
Houston, D. R. (1969). Basal canker of white pine. Forest science, 15(1), 66-83. Jacobs, K., and Wingfield, M. J. (2001). Leptographium species: tree pathogens, insect
associates, and agents of blue-stain: American Phytopathological Society (APS Press).
29

Jankowiak, R. (2006). Fungi associated with Tomicus piniperda in Poland and
assessment of their virulence using Scots pine seedlings. Annals of Forest Science, 63(7), 801-808.
Jmones, R. L., and Mangels, G. (2002). Review of the validation of models used in
federal insecticide, fungicide, and rodenticide act environmental exposure assessments. Environmental toxicology and chemistry, 21(8), 1535-1544.
Jurc, M., Perko, M., Džeroski, S., Demšar, D., and Hrašovec, B. (2006). Spruce bark
beetles (Ips typographus, Pityogenes chalcographus, Col.: Scolytidae) in the Dinaric mountain forests of Slovenia: monitoring and modeling. Ecological modelling, 194(1), 219-226.
Kaufmann, M. R. (1968). Water relations of pine seedlings in relation to root and shoot
growth. Plant Physiology, 43(2), 281-288. Kendrick, W. B. (1962). The Leptographium complex Verticicladiella Hughes. Canadian
Journal of Botany, 40(6), 772-797. Kim, S., Harrington, T. C., Lee, J. C., and Seybold, S. J. (2011). Leptographium
tereforme sp. nov. and other Ophiostomatales isolated from the root-feeding bark beetle Hylurgus ligniperda in California. Mycologia, 103(1), 152-163.
Klepzig, K., Moser, J., Lombardero, M., Ayres, M., Hofstetter, R., and Walkinshaw, C.
(2001). 13 Mutualism and Antagonism: Ecological Interactions Among Bark Beetles, Mites and Fungi. Biotic interactions in plant-pathogen associations, 237.
Klepzig, K. D., Raffa, K., and Smalley, E. (1991). Association of an insect-fungal
complex with red pine decline in Wisconsin. Forest science, 37(4), 1119-1139. Klepzig, K. D., Smalley, E. B., and Raffa, K. F. (1995). Dendroctonus valens and
Hylastes porculus (Coleoptera: Scolytidae): vectors of pathogenic fungi (Ophiostomatales) associated with red pine decline disease. The Great Lakes entomologist (USA).
Klos, R. J., Wang, G. G., Bauerle, W. L., and Rieck, J. R. (2009). Drought impact on
forest growth and mortality in the southeast US: an analysis using Forest Health and Monitoring data. Ecological Applications, 19(3), 699-708.
Krokene, P., and Solheim, H. (1998). Pathogenicity of four blue-stain fungi associated
with aggressive and nonaggressive bark beetles. Phytopathology, 88(1), 39-44. Lackner, A., and Alexander, S. (1982). Occurrence and pathogenicity of Verticicladiella
procera in Christmas tree plantations in Virginia. Plant disease, 66(3), 211-212.
30

Lamb, H., and Sleeth, B. (1940). Distribution and suggested control measures for the Southern Pine fusiform rust. Occasional Papers. Southern Forest Experiment Station, (91).
Lee, S., Kim, J.-J., and Breuil, C. (2006). Pathogenicity of Leptographium longiclavatum
associated with Dendroctonus ponderosae to Pinus contorta. Canadian Journal of Forest Research, 36(11), 2864-2872.
Lieutier, F., Yart, A., and Salle, A. (2009). Stimulation of tree defenses by
Ophiostomatoid fungi can explain attack success of bark beetles on conifers. Annals of Forest Science, 66(8), 801.
Lightle, P. C. (1960). Brown-spot needle blight of Longleaf Pine. Brown-spot needle
blight of Longleaf Pine., (44). Lindberg, M., and Johansson, M. (1992). Resistance of Picea abies seedlings to infection
by Heterobasidion annosum in relation to drought stress. European Journal of Forest Pathology, 22(2), 115-124.
McNabb, K., and Enebak, S. (2008). Forest tree seedling production in the southern
United States: the 2005-2006 planting season. Tree planters' notes. Manion, P. D. (1981). Tree disease concepts. Prentice-Hall, Inc. New Jersy USA. p 10-
56. Manion, P. D., and Lachance, D. (1992). Forest decline concepts: an overview. APS
Press, St. Paul, Minnesota, USA. p 181-190. Matusick, G., and Eckhardt, L. (2010). Variation in virulence among four root-inhabiting
ophiostomatoid fungi on. Pinus taeda, 361-367. Matusick, G., Eckhardt, L., and Enebak, S. (2008). Virulence of Leptographium serpens
on longleaf pine seedlings under varying soil moisture regimes. Plant disease, 92(11), 1574-1576.
Matusick, G., Somers, G., and Eckhardt, L. (2012). Root lesions in large loblolly pine
(Pinus taeda L.) following inoculation with four root‐inhabiting ophiostomatoid fungi. Forest Pathology, 42(1), 37-43.
Matusick, G., Eckhardt, L. G., and Somers, G. L. (2010). Susceptibility of longleaf pine
roots to infection and damage by four root-inhabiting ophiostomatoid fungi. Forest ecology and management, 260(12), 2189-2195.
Matusick, G., Menard, R. D., Zeng, Y., and Eckhardt, L. G. (2013). Root-inhabiting bark
beetles (Coleoptera: Curculionidae) and their fungal associates breeding in dying loblolly pine in Alabama. Florida Entomologist, 96(1), 238-241.
31

Matusick, G., Nadel, R. L., Walker, D. M., Hossain, M. J., and Eckhardt, L. G. (2016).
Comparative behavior of root pathogens in stems and roots of southeastern Pinus species. Fungal biology, 120(4), 471-480.
Molnar, A. (1965). Pathogenic fungi associated with a bark beetle on alpine fir. Canadian
Journal of Botany, 43(5), 563-570. Nevill, R., Kelley, W., Hess, N., and Perry, T. (1995). Pathogenicity to loblolly pines of
fungi recovered from trees attacked by southern pine beetles. Southern Journal of Applied Forestry, 19(2), 78-83.
Newhook, F. J. (1959). The association of Phytophthora spp. with mortality of Pinus
radiata and other conifers: I. Symptoms and epidemiology in shelterbelts. New Zealand journal of agricultural research, 2(4), 808-843.
Newton, R., Sen, S., and Puryear, J. (1987). Free proline in water-stressed pine callus.
Tappi journal, 70(6), 141-144. Nirenberg, H. I., and O'Donnell, K. (1998). New Fusarium species and combinations
within the Gibberella fujikuroi species complex. Mycologia, 434-458. Oswalt, S. N., Smith, W. B., Miles, P. D., and Pugh, S. A. (2014). Forest resources of the
United States, 2012. Washington Office, Forest Service, US Department of Agriculture.
Otrosina, W. J., Bannwart, D., and Roncadori, R. W. (1999). Root-infecting fungi
associated with a decline of longleaf pine in the southeastern United States. Plant and Soil, 217(1-2), 145-150.
Paine, T., and Hanlon, C. (1994). Influence of oleoresin constituents from Pinus
ponderosa and Pinus jeffreyi on growth of mycangial fungi from Dendroctonus ponderosae and Dendroctonus jeffreyi. Journal of chemical ecology, 20(10), 2551-2563.
Paine, T., Raffa, K., and Harrington, T. (1997). Interactions among scolytid bark beetles,
their associated fungi, and live host conifers. Annual review of entomology, 42(1), 179-206.
Paine, T., and Stephen, F. (1987). Fungi associated with the southern pine beetle:
avoidance of induced defense response in loblolly pine. Oecologia, 74(3), 377-379.
Paine, T., Stephen, F., and Cates, R. (1988). Phenology of an induced response in loblolly
pine following inoculation of fungi associated with the southern pine beetle. Canadian Journal of Forest Research, 18(12), 1556-1562.
32

Paoletti, E. (2009). Ozone and urban forests in Italy. Environmental Pollution, 157(5),
1506-1512. Parmeter, J., Slaughter, G., Chen, M., and Wood, D. (1992). Rate and depth of sapwood
occlusion following inoculation of pines with bluestain fungi. Forest science, 38(1), 34-44.
Parmeter Jr, J., Slaughter, G., Chen, M.-M., Wood, D., and Stubbs, H. (1989). Single and
mixed inoculations of ponderosa pine with fungal associates of Dendroctonus spp. Phytopathology, 79(7), 768-772.
Poudel, J. (2014). Economic impacts of fishing, hunting, and wildlife-associated
recreation expenditures across the US South (Doctoral dissertation, Mississippi State University).
Powers Jr, H. R., and Boyce Jr, J. (1961). Fomes annosus on slash pine in the Southeast.
Plant Disease Reporter, 45, 306-307. Prestemon, J. P., and Abt, R. C. (2002). Southern forest resource assessment highlights:
the Southern timber market to 2040. Journal of Forestry, 100(7), 16-22. Raffa, K. F., and Berryman, A. A. (1982). Physiological differences between lodgepole
pines resistant and susceptible to the mountain pine beetle and associated microorganisms. Environmental entomology, 11(2), 486-492.
Raffa, K. F., and Smalley, E. B. (1988). Response of red and Jack pines to inoculation
with microbial associates of the pine engraver, Ips pini (Coleoptera: Scolytidae). Canadian Journal of Forest Research, 18(5), 581-586.
Rane, K. K., and Tattar, T. A. (1987). Pathogenicity of blue-stain fungi associated with
Dendroctonus terebrans. Plant disease, 71(10), 879-882. Rauscher, H. M. (2004). A history of southern forest science, management, and
sustainability issues. p. 3-4. In H. M. Rauscher and K. Johnsen (eds.), Southern forest science: Past, present, and future. U.S.D.A Forest Service, Southern Research Station, Asheville, NC.
Reay, S., Thwaites, J., and Farrell, R. (2005). A survey of Ophiostoma species vectored
by Hylastes ater to pine seedlings in New Zealand. Forest Pathology, 35(2), 105-113.
Repe, A., and Jurc, M. (2010). Ophiostomatoid fungi (Ascomycota: Ophiostomataceae)
associated with bark beetles and their possible economic impact in forests and timber production. Zbornik Gozdarstva in Lesarstva(91), 3-12.
33

Robinson-Jeffrey, R. C., and Grinchenko, A. H. (1964). A new fungus in the genus Ceratocystis occurring on blue-stained lodgepole pine attacked by bark beetles. Canadian Journal of Botany, 42(5), 527-532.
Rockwood, D. L. (1972). Aspects of monoterpene composition in loblolly pine. Ph.D.
Thesis, N.C. State University, School of Forest Resources, 129 pp. Ross, D. W., and Solheim, H. (1997). Pathogenicity to Douglas-fir of Ophiostoma
pseudotsugae and Leptographium abietinum, fungi associated with the Douglas-fir beetle. Canadian Journal of Forest Research, 27(1), 39-43.
Roth, E., and Preacher, P. (1971). Alabama loblolly pine die-off evaluation. US Forest
Service Report, 72-72. Schroeder, S., Kim, S. H., Lee, S., Sterflinger, K., and Breuil, C. (2002). The β-tubulin
gene is a useful target for PCR-based detection of an albino Ophiostoma piliferum used in biological control of sapstain. European journal of plant pathology, 108(8), 793-801.
Schultz, R. P. (1997). Loblolly pine: the ecology and culture of loblolly pine (Pinus taeda
L.). Agriculture Handbook (Washington)(713). Shaw, C., and Dick, M. (1980). Verticicladiella root disease of Pinus strobus in New
Zealand. Plant disease, 64(1). Shaner, G., Stromberg, E.L., Lacy, G.H, Barker, K.R., and Pirone, T. P. (1992).
Nomenclature and concepts of pathogenicity and virulence. Annual review of Phytopathology, 30(1), 47-66.
Siggers, P. V. (1944). The brown spot needle blight of pine seedlings. US Department of
Agriculture. Techincal Bulletin, 870, 1-16. Sinclair, W. A. (1965). Comparisons of recent declines of white ash, oaks, and sugar
maple in northeastern woodlands. Cornell Plant, 20, 62-67. Singh, A., Anderson, D., and Eckhardt, L. (2014). Variation in resistance of loblolly pine
(Pinus taeda L.) families against Leptographium and Grosmannia root fungi. Forest Pathology, 44(4), 293-298.
Smith, W. B., Miles, P. D., Vissage, J. S., and Pugh, S. A. (2004). Forest resources of the
United States, 2002. General Technical Report NC-241. St. Paul: USDA Forest Service, North Central Forest Experiment Station.
Solheim, H. (1992). The early stages of fungal invasion in Norway spruce infested by the
bark beetle Ips typographus. Canadian Journal of Botany, 70(1), 1-5.
34

Solheim, H. (1993). Fungi associated with the spruce bark beetle Ips typographus in an endemic area in Norway. Scandinavian Journal of Forest Research, 8(1-4), 118-122.
Solheim, H. (1988). Pathogenicity of some Ips typographus-associated blue-stain fungi to
Norway spruce: Norsk institutt for skogforskning 40, 1-11. Solheim, H., and Krokene, P. (1998). Growth and virulence of mountain pine beetle
associated blue-stain fungi, Ophiostoma clavigerum and Ophiostoma montium. Canadian Journal of Botany, 76(4), 561-566.
Spatafora, J. W., and Blackwell, M. (1994). The polyphyletic origins of ophiostomatoid
fungi. Mycological Research, 98(1), 1-9. Thatcher, R.C., and Barry, P.J. 1982. Southern Pine Beetle. Forest Insect and Disease
Leaflet 49. USDA, Forest Service. Turtola, S., Manninen, A.-M., Rikala, R., and Kainulainen, P. (2003). Drought stress
alters the concentration of wood terpenoids in Scots pine and Norway spruce seedlings. Journal of chemical ecology, 29(9), 1981-1995.
Upadhyay, H. (1993). Classification of the ophiostomatoid fungi. Ceratocystis and
Ophiostoma: Taxonomy, ecology and pathogenicity. The American Phytopathological Society. St. Paul, MN. US. pp, 7-13.
Uzunovic, A., Yang, D.-Q., Gagne, P., Breuil, C., Bernier, L., Byrne, A., Gignac
M., Kim, S. (1999). Fungi that cause sapstain in Canadian softwoods. Canadian journal of microbiology, 45(11), 914-922.
Wang, H., Fu, R., Kumar, A., and Li, W. (2010). Intensification of summer rainfall
variability in the southeastern United States during recent decades. Journal of Hydrometeorology, 11(4), 1007-1018.
Watson, D., and Brandly, C. (1949). Virulence and pathogenicity. Annual Reviews in
Microbiology, 3(1), 195-220. Wingfield, M. J. (1983). Association of Verticicladiella procera and Leptographium
terrebrantis with insects in the Lake States. Canadian Journal of Forest Research, 13(6), 1238-1245.
Wingfield, M. J. (1985). Reclassification of Verticicladiella based on conidial
development. Transactions of the British Mycological Society, 85(1), 81-93. Wingfield, M. (1986). Pathogenicity of Leptographium procerum and L. terebrantis on
Pinus strobus seedlings and established trees. European Journal of Forest Pathology, 16(5‐6), 299-308.
35

Wingfield, M., and Marasas, W. (1981). Verticicladiella alacris, a synonym of V.
serpens. Transactions of the British Mycological Society, 76(3), 508-510. Wingfield, M., and Marasas, W. (1983). Some Verticicladiella species, including V.
truncata sp. nov., associated with root diseases of pine in New Zealand and South Africa. Transactions of the British Mycological Society, 80(2), 231-236.
Wingfield, M. J., and Gibbs, J. N. (1991). Leptographium and Graphium species
associated with pineinfesting bark beetles in England. Mycological Research, 95(11), 1257-1260.
Wingfield, M., Capretti, P., and Mackenzie, M. (1988). Leptographium spp. as root
pathogens of conifers. An international perspective. Wingfield, M. J., Seifert, K. A., and Webber, J. F. (1993). Ceratocystis and Ophiostoma:
taxonomy, ecology and pathogenicity: American Phytopathological Society (APS).
Williston, H. (1962). Loblolly seedlings survive twelve days submergence: Jour: For.
60,412. Wood, D. L. (1982). The role of pheromones, kairomones, and allomones in the host
selection and colonization behavior of bark beetles. Annual review of entomology, 27(1), 411-446.
Wright, E. (1933). A cork-borer method for inoculating trees. Phytopathology, 23, 487-
488. Yamaoka, Y., Hiratsuka, Y., and Maruyama, P. (1995). The ability of Ophiostoma
clavigerum to kill mature lodgepolepine trees. European Journal of Forest Pathology, 25(6‐7), 401-404.
Yamaoka, Y., Takahashi, I., and Iguchi, K. (2000). Virulence of ophiostomatoid fungi
associated with the spruce bark beetle Ips typographus f. japonicus in Yezo spruce. Journal of Forest Research, 5(2), 87-94.
Zhao, D., Kane, M., and Borders, B. E. (2012). Crown ratio and relative spacing
relationships for Loblolly pine Plantations. Open Journal of Forestry, 2(03), 101. Zanzot, J. W., Matusick, G., and Eckhardt, L. G. (2010). Ecology of root-feeding beetles
and their associated fungi on longleaf pine in Georgia. Environmental entomology, 39(2), 415-423.
36

Zhou, X., De Beer, Z., Ahumada, R., Wingfield, B., and Wingfield, M. (2004). Ophiostoma and Ceratocystiopsis spp. associated with two pine-infesting bark beetles in Chile. Fungal Divers, 15, 261-274.
Zipfel, R. D., de Beer, Z. W., Jacobs, K., Wingfield, B. D., and Wingfield, M. J. (2006).
Multi-gene phylogenies define Ceratocystiopsis and Grosmannia distinct from Ophiostoma. Studies in Mycology, 55, 75-97.
37

CHAPTER II
Intraspecific and Inter-Stocktype Response of Pinus taeda L. to Grosmannia huntii
and Leptographium terebrantis
2.1 Abstract
Vascular-inhabiting ophiostomatoid fungi are among the contributing factors of
premature decline and mortality of Pinus taeda (loblolly pine). The aim of this
experiment was to examine intraspecific variation in tolerance of P. taeda to
ophiostomatoid fungi. Containerized and bare-root seedlings for 94 and 4 families
respectively, were artificially inoculated at the stem with L. terebrantis and G. huntii.
Eight weeks post inoculation, lesion and occlusion were measured on each seedling to
determine variation of host responses. Pinus taeda showed wide intraspecific variation in
tolerance/susceptibility to both L. terebrantis and G. huntii. The two interspecies
stocktypes (bare-root and container) of P. taeda had similar tolerance to fungi. Results
suggest both seedling stocktypes can be used in virulence screening studies. Pinus taeda
families more tolerant to ophiostomatoid fungi can be separated from less tolerant. These
results will help land managers in making decisions to plant most appropriate P. taeda
families to minimize the potential impact of ophiostomatoid fungi.
38

2.2 Introduction
Pinus taeda L. (loblolly pine) is the leading pine species which comprises 50% of
the total softwood volume grown in the south (Schultz, 1997; Oswalt et al., 2014). The
number of P. taeda seedlings planted in the southern U.S. each year reaches a billion
(McNabb and Enebak, 2008). Pinus taeda plantations provide marketable forest products,
provides habitat for wildlife, and place for recreational activities and thus contribute a
considerable portion of the southern U.S. economy (Poudel et al., 2017; Schultz, 1997).
Over the past 40 years, however, there have been reports of Pine Decline.
Pine Decline (PD), a decline disease syndrome, first reported by Brown and Mc
Dowell (1968) at Talladega National Forest, Oakmulgee Ranger District in 1959. The
decline was indicated by short chlorotic needles, sparse crowns, reduced radial growth
and premature mortality. Subsequent reports of decline urged scientists to conduct further
studies that revealed the association of beetle-vectored ophiostomatoid fungi with PD
(Hess et al., 1999; Hess et al., 2002). Consistent isolation of ophiostomatoid fungi:
Leptographium terebrantis S.J. Barras and T. J Perry, Grosmannia huntii R.C. Rob. Jeffr,
L. procerum Kendrick M.J. Wingfield and Grosmannia alacris T.A. Duong, Z.W. de
Beer and M.J Wingfield, from the roots of declining trees (Eckhardt et al., 2007)
emphasizes the role of fungi in decline process, thus warranting further controlled
experimental studies incorporating P. taeda and fungi.
Leptographium terebrantis and G. huntii, are distributed worldwide as pathogens
of conifers (Jacobs and Wingfield, 2001). Whereas, in North America, the former
pathogen is relatively more problematic (Wingfield et al., 1988; Matusick and Eckhardt,
2010). However, mature root inoculations in P. taeda, P. palustris (longleaf pine) and P.
elliottii (slash pine) in the southern U.S. revealed relatively higher virulence of G. huntii
39

than L. terebrantis (Matusick and Eckhardt, 2010). One of the immediate effects of L.
terebrantis and G. huntii in Pinus hosts include resin-soaking, sapwood discoloration and
lesions in the phloem (Wingfield 1986; Matusick and Eckhardt 2010; Chieppa et al.,
2017).
Ophiostomatoid fungi affect pine species differently with P. taeda being
relatively more susceptible than P. palustris and P. elliotti (Matusick et al., 2010). Singh
et al. (2014) studied intra-species variation in tolerance of P. taeda to L. terebrantis and
G. huntii and found P. taeda families widely varied in tolerance/susceptibility to both
Leptographium and Grosmannia species. Various Pinus species have shown intra-species
variation in tolerance to other tree pathogens and prompted the launch of tree breeding
initiatives. For instance, open-pollinated families of Pinus thunbergii Parl., and P.
densiflora Sieb. et Zucc., inoculated with a pine wood nematode, Bursaphelenchus
xylophilus (Steiner et Buhrer) Nickle in Japan (Akiba et al., 2012) exhibited intra-species
variation. Use of tolerant families in the breeding program has resulted in 92 clones of P.
densiflora and 16 clones of P. thunbergi. Similarly, Pinus sylvestris L. (Scots pine) had
intraspecific variation in susceptibility to dothistroma needle blight caused by fungi
Dothistroma septosporum (Dorog.) Morlet. with implications for more tolerant families
in breeding programs (Fraser et al., 2015).
Bare-root and containerized seedlings are the two stock types used in previous
screening studies (Singh et al., 2014; Chieppa et al., 2017). Bare-root seedlings are grown
in soil beds in an open field with the removal of soil during harvest. Containerized
seedlings are grown in containers containing artificial media under a shelter or controlled
greenhouse environment with root and soil media maintained together from harvest to re-
40

planting (Grossnickle et al., 2016). The lifting of bare-root seedlings in nurseries in the
southeastern U.S. involves a number of operational procedures which might affect root
viability (Starkey and Enebak, 2013). In contrast, root damage is minimal in
containerized seedlings. Containerized seedlings usually have higher survival success
rates than bare-root after replanting (Sloan et al., 1987; South et al., 2005). However, the
use of a greenhouse, growth medium, proper irrigation and fertilization may make
containerized seedlings more susceptible to biotic diseases (Grossnickle et al., 2016).
Singh et al. (2014) studied intraspecific variation in tolerance to ophiostomatoid fungi in
either containerized or bare-root seedlings respectively in two separate years. The
containerized seedlings had both higher field survival and longer lesions compared to
bare-root seedlings. However, the results were inconclusive as interfamily-stocktype
differences were not studied. Thus, the study of the response of two stocktypes
(container-grown and bare-root seedlings) of the same families of P. taeda is necessary.
The variation in susceptibility to pathogen observed in few families cannot be
generalized to the whole population. However, despite this knowledge, and the enormous
threat that the ophiostomatoid fungi pose to P. taeda, the question of whether
intraspecific variation in tolerance/susceptibility to ophiostomatoid fungi remains
unexplored in many P. taeda families. The hypotheses of this study are: (i) Pinus taeda
families out-planted in the southern U.S. have intra-specific variation in tolerance to two
major fungi associated with PD, (ii) Pinus taeda stocktypes vary in tolerance to
ophiostomatoid fungi, and (iii) The connector families will show a similar response to the
fungal inoculation in all the three years.
41

2.3 Materials and methods
2.3.1 Experimental design
Container-grown seedlings from 33, 38 and 23 different P. taeda families were
studied in 2013, 2014 and 2016 respectively (Table 2.1, Table 2.2 and Table 2.3). In
2014, bare-root seedlings from 4 families same as container grown families also were
studied. The genetic distinction among groups is based on female parent, so the term
“family” is utilized. Families L05, L09, L16, L38, L49, and L50 were included each year
and served as connector families. The genetic distinction between these families is
unknown but families L49 and L50 represent the wildtype families. Families used belong
to the most commonly out-planted half-sib (open-pollinated), or full-sib (controlled-
pollinated) P. taeda families in the southern U.S. These families were derived from the
tree genetic improvement programs conducted by North Carolina Tree Improvement
Cooperative. Seeds from all families were grown within a single forest company nursery
each year to minimize environmental variability. Nine-month-old, containerized
seedlings and bare-root seedlings were extracted from individual containers and common
nursery beds and used in the experiment. Twelve seedlings per family were randomly
selected and separated into the stem, needles, coarse root and fine root and dried at oven
(75 °C for 72 h) for initial biomass assessment.
The study site is an outdoor research facility of the School of Forestry and
Wildlife Sciences, Auburn University, located in Auburn, Alabama. A randomized
complete block design with six blocks (3 replications) (Figure 2.2) was established with
the random assignment of families and treatments within each block. Seedlings were
planted in one-gallon pots filled with ProMIx BX® (Premier Tech, Quebec, and Canada)
42

peat-based potting media. The seedlings with a mean height of 30 cm and root collar
diameter of 4.5 mm (Figure 2.1) were chosen for planting to reduce individual seedling
variability. The planted seedlings were allowed to acclimatize in the ambient climate
condition at the experimental site for 2 months prior commencement of stem
inoculations. Seedlings were irrigated when required.
Figure 2.1 Container-grown Pinus taeda seedlings from a single family before re-planting.
43

Table 2.1 Pinus taeda families for the year 2013.
Family ID Company L05 Rayonier L09 Rayonier L16 Rayonier L38 Arborgen L49 Arborgen L50 Arborgen L51 Rayonier L52 Arborgen L53 Westervelt L54 Rayonier L55 Rayonier L56 Rayonier L57 Rayonier L58 Weyerhaeuser L59 Weyerhaeuser L60 Weyerhaeuser L61 Weyerhaeuser L62 Plum Creek L63 Plum Creek L64 Plum Creek L65 Plum Creek L66 Arborgen L67 Arborgen L68 Arborgen L69 Hancock L70 Hancock L71 Hancock L72 Hancock L73 Hancock L74 Westervelt L75 Westervelt L76 Westervelt L77 Westervelt
Notes: L05, L09, L16, L38, L49 and L50 replicated each year, L49: FM2 and L50: SEF-Mix are wildtype families
44

Table 2.2 Pinus taeda families for the year 2014.
Family code Company L78 Arborgen L79 Weyehaeuser L80 Rayonier L81* Arborgen L16 Rayonier L82 Arborgen L83 Weyehaeuser L84 Westervelt L85 Arborgen L86 Plum Creek L05 Rayonier L87 Arborgen L88 Plum Creek L38* Arborgen L89 Plum Creek L90 Westervelt L91 Plum Creek L92 Arborgen L93 Arborgen L94 Westervelt L95 Westervelt L09* Rayonier L96 Hancock L97 Hancock L98 Arborgen L99 Rayonier L100 Rayonier L101 Rayonier L102 Weyehaeuser L103 Westervelt L104 Arborgen L105 Arborgen L106 Weyehaeuser L107 Hancock L49 Arborgen L108 Weyehaeuser L109* Plum Creek L50 Arborgen
Notes: L05, L09, L16, L38, L49 and L50 replicated each year, L49: FM2, L50: SEF-Mix are wildtype families, * represents families with both bare-root and container-grown seedlings.
45

Table 2.3 Pinus taeda families for the year 2016.
Family code Company L114 Rayonier L118 Rayonier L05 Rayonier L16 Rayonier L123 Rayonier L117 Rayonier L124 Rayonier L116 Plum Creek L122 Plum Creek L115 Plum Creek L111 Westervelt L33 Westervelt L09 Weyehauser L126 Weyehauser L127 Weyehauser L128 Weyehauser L129 Weyehauser L130 Weyehauser L112 Plum Creek L113 Plum Creek L38 Arborgen L49 Arborgen L50 Arborgen
Notes: L05, L09, L16, L38, L49 and L50 replicated each year, L49: FM2, L50: SEF-Mix are wildtype families.
46

Figure 2.2 Pinus taeda seedlings planted in six blocks (RCBD) in the outdoor planting space.
2.3.2 Inoculation of fungi
Single spore isolates of Leptographium terebrantis (ATCC accession no. MYA-
3316) and Grosmannia huntii (ATCC accession no. MYA-3311) maintained at 4 °C in
Forest Health Dynamics Laboratory at Auburn University, AL, U.S. were used for the
stem inoculations. These isolates were sub-cultured in Malt Extract Agar, 2 weeks before
the start of the stem inoculation. The L. terebrantis isolate was isolated from the lateral
root of P. taeda in the Talladega National Forest, Oakmulgee Ranger District, AL, U.S.
The G. huntii isolate was isolated from the lateral root of P. taeda from Fort Benning
Military Reservation, GA, U.S. Those trees exhibited symptoms of PD such as thin
crowns and lateral roots with a damaged localized root tissue as described by Eckhardt et
al. (2007).
47

Seven seedlings (in 2013 and 2014) and 10 seedlings (in 2016) from each family
received 1 of 4 inoculation treatments. The inoculation treatments were: (i) wound
(control), (ii) wound + sterile media (control), (iii) wound + media with L. terebrantis,
and (iv) wound + media with G. huntii. To perform inoculation, an 11-mm vertical
wound (< 2 mm deep) in root-collar-area 2 cm above the soil line was created with a
sterile razor blade (Figure 2.3). Wound control received a sterile cut only. Wound +
media control received a sterile agar plug in the wound. Media with fungus treatment
received a 3-mm agar plug with actively growing fungal mycelium from the edge of the
agar plate, inoculated (fungus-side-down) in the wound. Inoculation points were covered
with sterile moist cotton balls to prevent desiccation of the fungal media. Furthermore,
the inoculation area was wrapped with Parafilm® to prevent further contamination.
Figure 2.3 Artificial inoculation of fungi in the stem of Pinus taeda.
48

2.3.3 Measurements
Seedling height and Root-Collar-Diameter (RCD) were measured on individual
seedlings prior to stem inoculations and at harvest. During harvest, 7
seedlings/family/block were clipped at the soil level and placed in a tub that contained
solution of Fast-Green stain (FastGreen FCF; Sigma Chemical Co., St. Louis, MO, USA)
and distilled water mixed in a ratio of 0.25 g L-1. Seedlings were exposed to the solution
for 72 h to allow the capillary movement of dye through the stem. Three
seedlings/family/block (in 2016) were gently pulled from the pot with roots and used for
seedling dry matter biomass measurements as described earlier.
Figure 2.4 Pinus taeda seedlings dipped in FastGreen stain after clipping.
After removal from the Fast-Green solution, the lesion-length-width-depth,
occlusion- length-width, and depth were measured on each seedling. The dark brown
dead tissue section around the inoculation site was considered lesion length. Stem tissue
49

lacking capillary action to allow Fast-Green dye to pass through it was recorded as
occlusion.
To verify Koch’s Postulates of disease diagnosis, one centimeter of stem
surrounding the lesion was removed from the stem and plated in MEA amended with 800
mg L-1 of cycloheximide and 200 mg L-1 of streptomycin sulphate. Plates were incubated
at room temperature for 14 days and fungal recovery from each stem piece was identified
and scored.
2.3.4 Statistical analyses
Mixed-models were used to analyze the lesion and occlusion data with family and
treatment as fixed effects and the block as a random effect. PROC MIXED statement was
used in SAS 9.4. The data were checked for normality and homogeneity of variance and
log transformations were performed if there was a violation of these assumptions.
Estimate statements were used to evaluate effects of each treatment. Multiple comparison
tests were performed using Tukey-Kramer test at a 5% significance level. Graphs were
created in STATISTICA 10.
The data were analyzed using mixed model. This model has both fixed and
random effects. The statistical model used was
𝑌𝑌𝑖𝑖𝑖𝑖𝑖𝑖 = µ + 𝐶𝐶𝐶𝐶𝐶𝐶 + 𝑇𝑇𝑖𝑖 + 𝐵𝐵𝑖𝑖 + 𝐹𝐹𝑖𝑖 + 𝐹𝐹𝑇𝑇 + 𝐸𝐸𝑖𝑖𝑖𝑖𝑖𝑖 ……… (1)
Where,
𝑌𝑌𝑖𝑖𝑖𝑖𝑖𝑖 = Response variable (for example ∶ lesion length, occlusion length )
µ = Mean of parameter
𝑇𝑇𝑖𝑖𝑖𝑖 = Fixed effect of treatments in block j (i = 1(GH). . , 2(LT). . , 3(WM). . ,4(W))
𝐶𝐶𝐶𝐶𝐶𝐶 = Initial root collar diameter of seedling as a covariate
50

𝐵𝐵𝑖𝑖 = Random Effect associated with block (j = 1. .6)
𝐹𝐹𝑖𝑖 = Fixed Effects of family (k = 1. . n)
𝐹𝐹𝑇𝑇𝑖𝑖𝑖𝑖 = Interaction effect of loblolly pine family and treatment𝑠𝑠 (𝐺𝐺𝐺𝐺, 𝐿𝐿𝑇𝑇,𝑊𝑊 𝑎𝑎𝑎𝑎𝑎𝑎 𝑊𝑊𝑊𝑊)
𝐸𝐸𝑖𝑖𝑖𝑖𝑖𝑖 = Residual with mean zero and constant variance (Random error)
Working hypotheses:
Family and inoculation treatments are under fixed effects. We want to compare whether
there is significant differences in lesion length among the families.
We were mainly interested in testing family effects:
𝐺𝐺𝐶𝐶: µ1 = µ2 = ⋯µ𝑖𝑖 (Mean lesion length of the families are not significantly
different)
𝐺𝐺𝐻𝐻: µ1 ≠ µ𝑖𝑖 (Mean lesion length is different in at least between two families)
Also, when inoculation treatment effects are considered:
𝐺𝐺𝐶𝐶: 𝑇𝑇1 = 𝑇𝑇2 = ⋯𝑇𝑇𝑖𝑖 = 0 (There is no effect of the treatment on lesion
development)
𝐺𝐺𝑎𝑎:𝑇𝑇𝑖𝑖 ≠ 0 for at least one fungal treatment
2.4 Results
2.4.1 Year 2013
Both the fungi used in the inoculation trials led to dark brown lesions in seedlings
form families tested (Figure 2.5). The fungal re-isolation from seedling stems was 96 to
98%. Seedling survival was significantly different among the families tested (Chi-sq =
68.36, P <0.0001) and among the inoculation treatments (Chi-sq = 1419.86, P <0.0001).
However, the seedling survival was not different between the seedlings receiving
different inoculations within a family.
51

The lesion length produced by the wound and wound + media was significantly
smaller than that caused by the fungal treatments. So, the effect of the controls were
removed from the model. The average lesion length caused by both fungal treatments on
different P. taeda families is shown in Figure 2.6. Leptographium terebrantis caused
longer lesions that those by G. huntii (P <0.0001) as given in Table 2.1. Family L73 had
the shortest lesions and families L68 and L66 had the longest lesions when treated with L.
terebrantis. Whereas families L51 and L73 had the shortest lesions and L55, L66 and
L67 had the longer lesions when treated with G. huntii (Table S1). Occlusion observed
was moving both vertically and radially. The occlusion length produced as a result of L.
terebrantis inoculation was significantly higher than that produced by G. huntii (P
<0.0001).
Figure 2.5 The dark necrotic lesions observed in Pinus taeda seedlings 8 weeks following inoculations.
Covariance parameter estimates showed that lesion length for families tested were
significantly different from zero (Z = 0.02). The average overall lesion length and those
52

caused by G. huntii and L. terebrantis is shown in Figure 2.6, 2.7, and 2.8, respectively.
Lesion width was not significantly different from zero (Z = 0.19). Similarly, occlusion
length (Z = 0.35) and occlusion width (Z = 0.47) was not significantly different from zero
(Table 2.4).
The length, width and depth of lesions were found to be affected by fungal
treatments as shown by type three fixed effects (Table 2.5). A family x treatment
interaction was not found to be significant (P = 0.07) which indicates within each family
two fungi did not cause differing sizes of lesion. Thus, an overall ranking of families (in
terms of lesion length) can be done as shown in Table S2.
53

Figure 2.6 Mean lesion length caused by the both fungal treatments in Pinus taeda families (year: 2013). Error bars indicate 95%
confidence interval.
54

Figure 2.7 Mean lesion length caused by Grosmannia huntii in
different Pinus taeda families (year: 2013). Error bars indicate 95% confidence interval.
55

Figure 2.8 Mean lesion length caused by Leptographium terebrantis in different Pinus taeda families (year: 2013). Error bars indicate 95% confidence interval.
56

Table 2.4 Covariance parameter estimates form mixed-model (Year 2013).
Variable Cov Parm Estimate SE Z Value Pr > Z Lesion length Family 2.88 1.42 2.03 0.0267
Family*Trt 1.74 1.16 1.50 0.0710 Residual 116.24 3.26 35.70 <0.0001
Lesion width Family 0.03 0.03 0.88 0.1901 Family*Trt 0.01 0.04 0.31 0.3248 Residual 6.53 0.18 35.69 <0.0001
Occlusion length Family 5.80 15.94 0.36 0.3546 Family*Trt 28.33 20.41 1.39 0.0832 Residual 915.17 39.02 23.45 <0.0001
Occlusion width Family 0.01 0.16 0.08 0.4761 Family*Trt 0.14 0.21 0.65 0.2652 Residual 10.33 0.46 22.37 <0.0001
Note: Trt: Fungal treatment.
57

Table 2.5 Type three fixed effects from mixed-model. Initial root collar diameter (RCD) was used as covariate (year 2013).
Variable Effect DF F Value Pr>F Lesion length RCD 1 1.68 0.2000
Block 5 44.74 <0.0001 Trt 1 369.20 <0.0001 Block*Trt 5 33.74 <0.0001
Lesion width RCD 1 29.10 <0.0001 Block 5 22.08 <0.0001 Trt 1 323.42 <0.0001 Block*Trt 5 17.57 <0.0001
Lesion depth RCD 1 9.53 <0.0020 Block 5 4.43 <0.0005 Trt 1 17.83 <0.0001 Block*Trt 5 0.31 <0.9000
Occlusion length RCD 1 0.35 <0.5558 Block 5 20.91 <0.0001 Trt 1 16.99 <0.0001 Block*Trt 5 9.40 <0.0001
Occlusion width RCD 1 3.04 0.0800 Block 5 10.71 <0.0001 Trt 1 4.75 0.0300 Block*Trt 5 2.58 0.0200
Occlusion depth RCD 1 67.86 <0.0005 Block 5 4.99 0.0030 Trt 1 62.25 <0.0001 Block*Trt 5 1.85 0.1300
Note: RCD: Root-collar diameter and Trt: Fungal treatment.
58
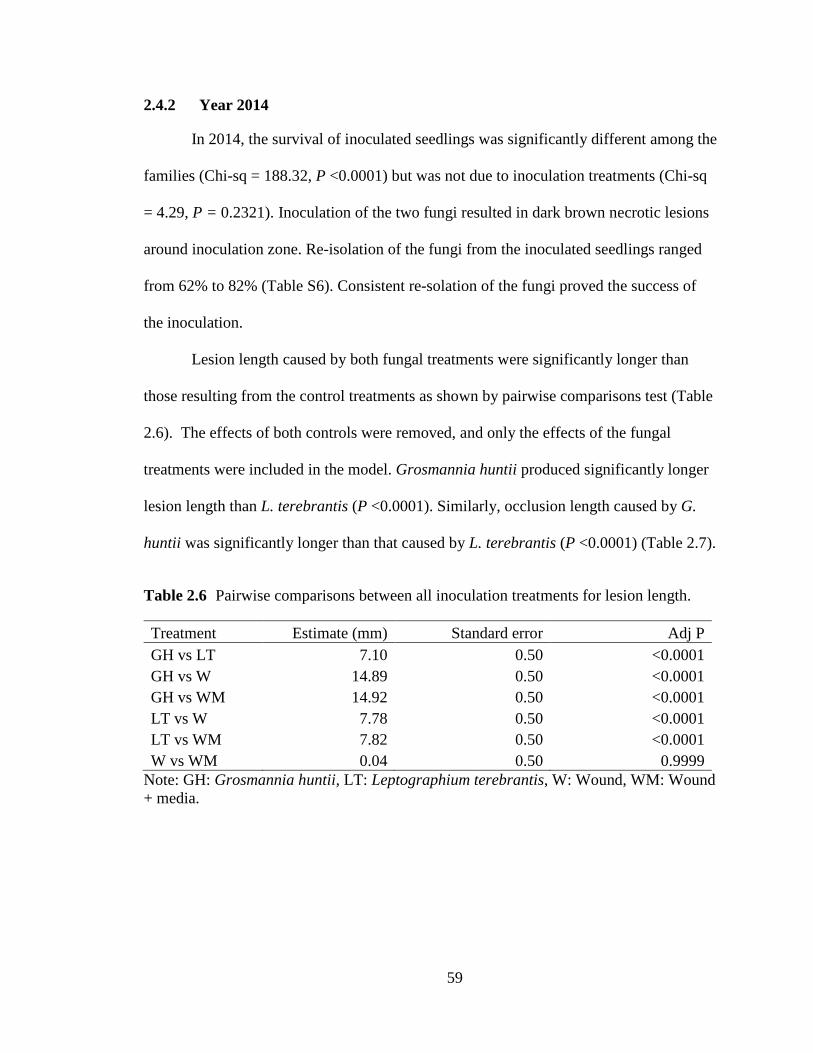
2.4.2 Year 2014
In 2014, the survival of inoculated seedlings was significantly different among the
families (Chi-sq = 188.32, P <0.0001) but was not due to inoculation treatments (Chi-sq
= 4.29, P = 0.2321). Inoculation of the two fungi resulted in dark brown necrotic lesions
around inoculation zone. Re-isolation of the fungi from the inoculated seedlings ranged
from 62% to 82% (Table S6). Consistent re-solation of the fungi proved the success of
the inoculation.
Lesion length caused by both fungal treatments were significantly longer than
those resulting from the control treatments as shown by pairwise comparisons test (Table
2.6). The effects of both controls were removed, and only the effects of the fungal
treatments were included in the model. Grosmannia huntii produced significantly longer
lesion length than L. terebrantis (P <0.0001). Similarly, occlusion length caused by G.
huntii was significantly longer than that caused by L. terebrantis (P <0.0001) (Table 2.7).
Table 2.6 Pairwise comparisons between all inoculation treatments for lesion length.
Treatment Estimate (mm) Standard error Adj P GH vs LT 7.10 0.50 <0.0001 GH vs W 14.89 0.50 <0.0001 GH vs WM 14.92 0.50 <0.0001 LT vs W 7.78 0.50 <0.0001 LT vs WM 7.82 0.50 <0.0001 W vs WM 0.04 0.50 0.9999
Note: GH: Grosmannia huntii, LT: Leptographium terebrantis, W: Wound, WM: Wound + media.
59

Table 2.7 Pairwise comparisons between all inoculation treatments for occlusion length.
Treatment Estimate (mm) Standard error Adj P GH vs LT 13.26 0.67 <0.0001 GH vs W 29.19 0.67 <0.0001 GH vs WM 28.02 0.67 <0.0001 LT vs W 15.94 0.67 <0.0001 LT vs WM 14.76 0.67 <0.0001 W vs WM -1.18 0.67 0.2933
Note: GH: Grosmannia huntii, LT: Leptographium terebrantis, W: Wound, WM: Wound + media.
Lesion and occlusion length was significantly different among the families as
indicated by covariance parameter estimates (Table 2.8). However, family and treatment
interaction was not statistically significant for both lesion length and occlusion length.
Lesion and occlusion length, depth and width were found to be affected by fungal
treatments (P <0.0001) (Table 2.9). Families L108 and L99 had shorter lesions and L81
and L91 had longest lesions when treated with L. terebrantis. Whereas, families L86 and
L108 had the shortest lesions and families L88 and L91 had the longest lesions when
treated by G. huntii.
There was no significant difference in lesion length between the two stocktypes
used in the trial when challenged with L. terebrantis and G. huntii (Figure 2.9 and 2.10).
Although differences were observed among different families, none of the same two
families had significantly different lesion lengths (Figure 2.9 and 2.10).
60
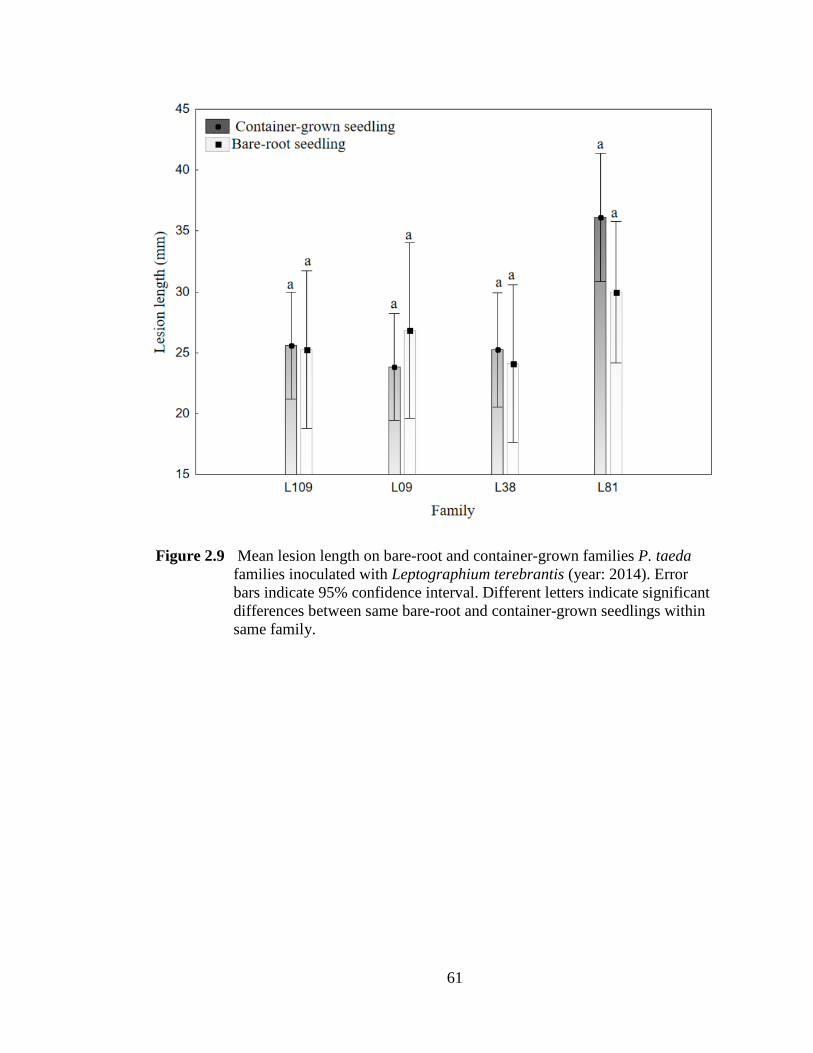
Figure 2.9 Mean lesion length on bare-root and container-grown families P. taeda families inoculated with Leptographium terebrantis (year: 2014). Error bars indicate 95% confidence interval. Different letters indicate significant differences between same bare-root and container-grown seedlings within same family.
61

Figure 2.10 Mean lesion length on bare-root and container-grown Pinus taeda families inoculated with Leptographium terebrantis (year: 2014). Error bars indicate 95% confidence interval. Different letters indicate significant differences between bare-root and container-grown seedlings within same family.
62

Figure 2.11 Mean lesion length caused by both the fungal treatments on Pinus taeda families (year: 2014). Error bars indicate 95% confidence interval.
63
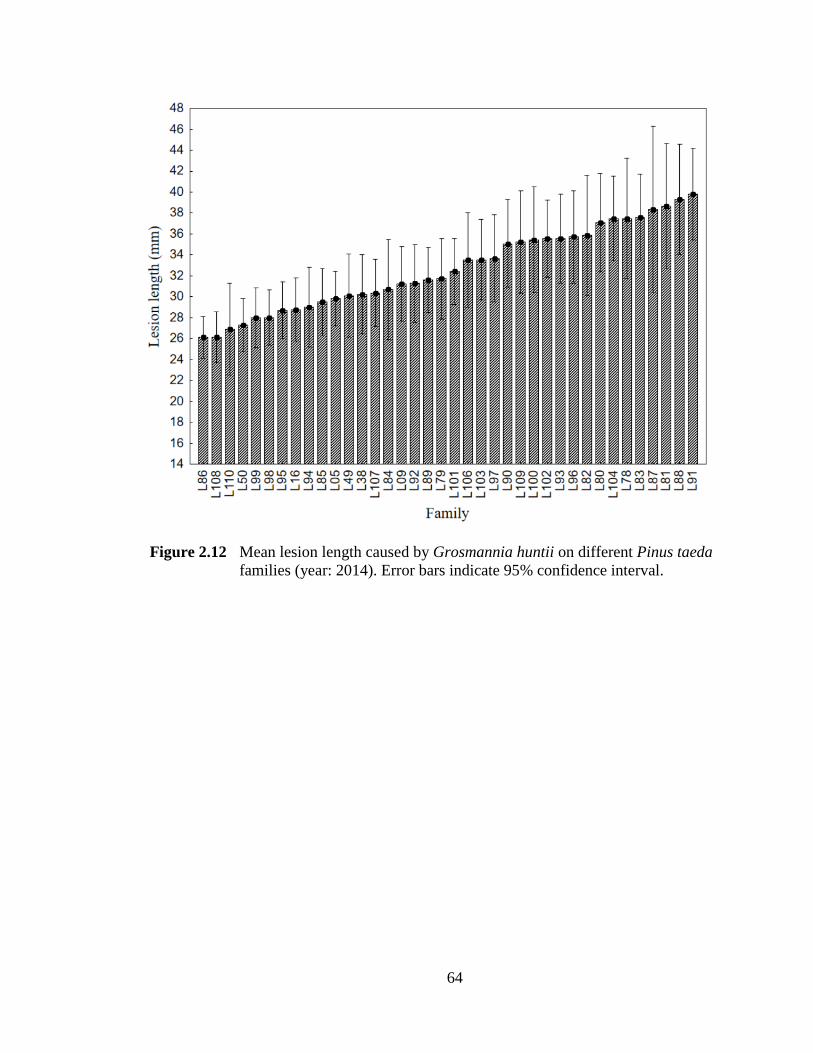
Figure 2.12 Mean lesion length caused by Grosmannia huntii on different Pinus taeda families (year: 2014). Error bars indicate 95% confidence interval.
64

Figure 2.13 Mean lesion length caused by Leptographium terebrantis on different Pinus taeda families (year: 2014). Error bars indicate 95% confidence interval.
65

Table 2.8 Covariance parameter estimates from the mixed model (Year 2014).
Parameter Covariance Parameter Estimate
Standard Error Z values Pr>Z
Lesion length Family 6.16 2.16 2.85 0.0022 Family*treatment 1.46 1.26 1.16 0.1230 Residual 149.07 3.94 37.85 <0.0001
Occlusion length Family 7.34 3.49 2.13 0.0166 Family*treatment 4.60 2.89 1.59 0.0620 Residual 289.50 7.69 37.65 <0.0001
Table 2.9 Type three fixed effects from the mixed model (Year 2014).
Variables Effect Num DF Den DF F value Pr>F Lesion length RCD 1 2864 6.98 0.0083
Block 5 2864 117.11 <0.0001 Trt 1 2864 179.62 <0.0001 Block*Trt 5 2864 115.03 <0.0001
Lesion width RCD 1 2864 137.60 <0.0001 Block 5 2864 74.62 <0.0001 Trt 1 2864 75.75 <0.0001 Block*Trt 5 2864 10.29 <0.0001
Lesion depth RCD 1 2864 68.03 <0.2426 Block 5 2864 16.98 <0.0001 Trt 1 2864 35.98 <0.0001 Block*Trt 5 2864 53.15 <0.0001
Occlusion length
RCD 1 2833 13.02 0.0003 Block 5 2833 187.50 <0.0001 Trt 3 2833 295.73 <0.0001 Block*Trt 15 2833 245.55 <0.0001
Occlusion width
RCD 1 2833 266.42 <0.0001 Block 5 2833 234.15 <0.0001 Trt 3 2833 574.56 <0.0001 Block*Trt 15 2833 174.19 <0.0001
Occlusion depth
RCD 1 2832 177.16 <0.0001 Block 5 2832 147.25 <0.0001 Trt 3 2832 427.68 <0.0001 Block*Trt 15 2832 161.18 <0.0001
Note: Trt: Treatment, RCD: Root-collar diameter.
66

2.4.3 Year 2016
The seedling survival was not significantly different among the family. All
families had 100% seedling survival except families L50, L114 and L127 which had 97%
survival rate. Neither G. huntii (F = 9.94, χ2 = 0.99) nor L. terebrantis (F = 3.21, χ2 =
0.67) affected seedling survival. The re-isolation success of G. huntii and L. terebrantis
was 96% and 93% respectively from the inoculated seedlings.
Inoculation of L. terebrantis and G. huntii in P. taeda seedlings resulted in dark
brown lesions around the inoculation points. The lesions caused by both fungal
treatments were significantly longer than those lesions resulting from the control
treatments (Table 2.10). Lesion length, width and depth and occlusion length, width and
depth differed significantly between two fungal treatments (P = <0.0001) and families (P
= <0.0001). The fungal treatment and family interaction was significant for lesion length
(P = 0.002), occlusion length (P = <0.0001) and occlusion depth (P = 0.0171). However,
the interaction was not significant for lesion width (P = 0.3784), lesion depth (P =
0.3049) and occlusion width (P = 0.0505) (Table 2.11). Families, L126, L130 and L129
had the longest, and L118 and L09 had the shortest lesion length when treated with G.
huntii. Families, L126 and L129 had the longest average lesion length, and L33 and L111
had the shortest lesion length when challenged with L. terebrantis.
Inoculations did not alter seedling biomass, however, biomass varied by family (F
(22, 1420) = 13.40, P = <0.001). Fungal treatment interaction was not significant (F (66, 1420)
= 0.93, P = 0.6369) indicating that biomass did not change in seedlings within families
receiving different inoculation treatments.
67

Table 2.10 Pairwise comparison of log lesion between the treatments.
Treatment Estimate Standard error DF t Value Pr > |t| GH vs LT -0.01 0.01 3943 -10.39 <0.0001 GH vs W 0.40 0.01 3943 40.60 <0.0001 GH vs WM 0.31 0.01 3943 32.56 <0.0001 LT vs W 0.50 0.01 3943 51.74 <0.0001 LT vs WM 0.41 0.01 3943 43.75 <0.0001 W vs WM -0.09 0.01 3943 -8.99 <0.0001
Note: GH: Grosmannia huntii, LT: Leptographium terebrantis, W: Wound, and WM: Wound + media.
68

Table 2.11 Treatment and family fixed effects from mixed model.
Variable Effect Num DF Den DF F Value Pr > F Lesion length Block 5 1971 178.45 <0.0001
IRCD 1 1971 8.88 0.0029 Family 22 1971 4.48 <0.0001
Trt 1 1971 137.51 <0.0001 Trt*Family 22 1971 2.10 0.002
Lesion width Block 5 1963 26.06 <0.0001 IRCD 1 1963 13.23 0.0003
Family 22 1963 2.54 0.0001 Trt 1 1963 206.43 <0.0001
Trt*Family 22 1963 1.07 0.3784 Lesion depth Block 5 1971 69.23 <0.0001
IRCD 1 1971 39.99 <0.0001 Family 22 1971 2.15 0.0015
Trt 1 1971 130.79 <0.0001 Trt*Family 22 1971 1.13 0.3049
Occlusion length Block 5 1952 223.98 <0.0001 IRCD 1 1952 5.49 0.0193
Family 22 1952 5.16 <0.0001 Trt 1 1952 552.47 <0.0001 Trt*Family 22 1952 2.65 <0.0001
Occlusion depth Block 5 1952 36.32 <0.0001 IRCD 1 1952 37.41 <0.0001 Family 22 1952 2.51 0.0001
Trt 1 1952 587.09 <0.0001 Trt*Family 22 1952 1.75 0.0171
Occlusion width Block 5 1952 112.38 <0.0001 IRCD 1 1952 29.71 <0.0001 Family 22 1952 2.93 <0.0001 Trt 1 1952 546.88 <0.0001 Trt*Family 22 1952 1.55 0.0505
Note: RCD: Initial Root-collar-diameter, Trt: Treatment.
69

Figure 2.14 The overall mean lesion lengths caused by both the fungal treatments on Pinus taeda families (year: 2016). 95% confidence intervals are indicated by error bars.
70

Figure 2.15 Mean lesion length caused by Grosmannia huntii on Pinus taeda families (year: 2016). Error bars indicate 95% confidence interval.
71

Figure 2.16 Mean lesion length caused by Leptographium terebrantis on Pinus taeda families (year: 2016). Error bars indicate the 95% confidence interval of the mean.
72

2.4.4 Response of connector families in all years
The 6 connector families which were inoculated every year did not show any family x
year interaction (in terms of lesion length). However, the lesion formation varied by year
of inoculation. The lesion length was smallest in the year 2016 and greatest in 2014.
These families did not respond differently to the fungal inoculation (in terms of lesion
length) within each year. The six families responded similarly to the fungal inoculation
(in terms of lesion length) in within each experimental year (Figure 2.17).
Figure 2.17 Mean lesion length of connector Pinus taeda families on each inoculation year. Error bars represent 95% confidence interval.
2.5 Discussion
There was intra-species variation in tolerance/susceptibility (regarding lesion
length and occlusion length) of P. taeda to L. terebrantis and G. huntii. Similar variation
73

was observed in the study of different Pinus families in response to Fusarium circinatum
Roux et al. (2007), and clones of Ulmus americans L. (American elm) to Ophiostoma
ulmi (Buism). Tchernoff (1965), reported similar response of Quercus robur L.
(pedunculate oak) families to Phytophthora cambivora (Petri) Buisman. Jankowiak et al.
(2013). Current screening trials show that there is significant potential for selecting PD
tolerant P. taeda from current southeastern U.S. planting stock. These families have the
potential for use as parents in breeding programs to maximize the disease tolerance in
Pinus taeda and thus to ensure that losses due to fungi associated with PD can be
minimized in the future.
Intraspecific variation in tolerance of the P. taeda to ophiostomatoid fungi is
independent of the seedling growth conditions. Bare-root and container-grown seedlings
demonstrated no inter-stocktype differences in response to ophiostomatoid fungi (Figure
2.17). Both stocktypes of a single family responded similarly. Containerized seedlings
had higher survival rate than the bare-root, making former stocktype more favorable to
use in the experimental design studies.
Lesions observed in host seedling after fungal inoculation serves as a reliable
estimator of the fungal virulence as well host response (Matusick and Eckhardt, 2010,
Matusick et al., 2010). While other host responses such as lesion depth, lesion width,
occlusion length, and occlusion depth and occlusion width also were measured, these
responses did not provide sufficient evidence to draw any conclusions regarding relative
tolerance as the depth of sapwood in limited. Occlusion length acted as supporting
response variable.
74

Pinus taeda families with shorter lesion were considered relatively tolerant to the
fungi than the families with longer lesions. In an ecological scale, the bark-beetle and the
associated fungi (i) must overcome the tree defense, and (ii) obtain food from the tree.
The utilization of the tree’s resources such as sapwood resources and non-structural
carbohydrates (NSC) by the trees in defense may lead to depletion of the resources. The
relatively tolerant families can defend against the fungi by utilizing fewer resources. In
the susceptible family, the successfully colonized ophiostomatoid fungi use the tree’s
resources, and the resources decline over time impacting the growth and development of
the tree. The trees with relatively larger lesions as a response to fungal inoculation have
greater resource reduction (Lahr and Krokene, 2013).
As indicated by the relatively longer lesion and occlusion length, L. terebrantis
and G. huntii were found to be relatively more pathogenic in 2013 than 2014 or 2016.
Our results are similar to those of Singh et al. 2014 where they reported that the
pathogenicity of the fungi varied among years. Singh et al. (2014) gave two possible
explanations for this variation: (i) use of different seedling stocktypes in different years
or (ii) genotype x environment interaction. The former reason can be excluded as our
results suggest that inter-stocktype response to ophiostomatoid fungi do not exist. Thus,
genotype x environment interaction might have resulted in differences in fungal
pathogenicity among years. In this regard, in January 2013 (when seedlings were potted),
lowest and monthly average temperature were -1 º and 12 ºC respectively (according to
weather underground1). In contrast, in January 2014, the lowest and the average
temperature was -12 ºC and 3 ºC respectively which was lower compared to 2013. In
1 http://www.wunderground.com
75

addition, seedlings were subjected to a winter storm on January 28. Thus, the observed
differences in fungal pathogenicity between years could be due to family x environment
interaction. This can be further supported by Petäistö et al (1993) who suggested that
trees experiencing cold and frost also are more susceptible to infection by Gremmeniella
abietina.
The ophiostomatoid fungi varied in virulence among each year of inoculation. In
2013 and 2016, L. terebrantis was found to be more virulent than G. huntii. Whereas, in
2014 (when the seedling growing condition was cold), G. huntii was relatively more
virulent (in terms of lesion length) than L. terebrantis. Our finding that G. huntii is
relatively virulent than L. terebrantis has been supported by Matusick and Eckhardt, 2010
where they reported G. huntii to be more virulent than L. terebrantis in Pinus species in
the southern U.S. Although we lack experiments with controlled temperature and fungal
virulence, results suggest the disease-causing ability of the pathogen is associated with
either how stressed the hosts are due to adverse environmental condition or how
conducive is the condition for the growth of pathogen (Stenlid and Oliva, 2016). Our
results underline the need to include the role of the environment while predicting the
impact of the invasive pathogens (Dukes et al., 2009). Tolerance to the L. terebrantis and
G. huntii varies between the families, and the findings are consistent with the previous
years.
Fungi had no effect on seedling growth regarding seedling biomass. Some short-
term studies have found that the growth ability of Pinus taeda seedling may vary between
the family independent of the fungal inoculation (Chieppa et al. 2015; Chieppa et al.,
2017). Some other conifer and ophiostomatoid fungal interactions studies have not
76

considered the impact of fungi on seedling growth (Matusick and Eckhardt, 2010; Singh
et al., 2014). Oliva et al., (2014) suggests that vascular-inhabiting fungi obtain sugar from
degraded cells around the lesion and xylem sap in order to thrive. In addition, allocation
of the more carbon in defense of vascular-inhabiting fungi cause resource starvation
which decreases plant productivity (Oliva et al., 2014). In a natural scenario, bark beetles
inoculate the fungi on previously stressed trees. So, it is possible that the fungi negatively
impact the growth and biomass of the trees in the field at a higher level. We, therefore,
suggest that long-term studies should be conducted to understand the impact of these
fungi on seedling biomass.
Families utilized in the present study have the desired attributes (undisclosed)
depending on the objective of the forest companies. These families responded differently
to the L. terebrantis and G. huntii. Whereas, the wild-type families had the intermediate
levels of virulence. This suggests that different families chosen for desired attributes
differ in their tolerance towards the ophiostomatoid fungi, but wildtype families do not
differ. Wild-type families may be relatively less susceptible to fungi than some of the
susceptible families but use of these families may not meet the objective of the timber
companies in the southern U.S. Thus a particular attribute such as growth phenology,
wood density, wood volume, etc. may or may not benefit the plant against the attack by
the studied fungi. Thus, the selection of families tolerant to these fungi provides an
opportunity to make a decision regarding the planting of the suitable P. taeda families.
In conclusion, P. taeda families show wide variation in response to
ophiostomatoid fungi associated with the pine decline thus indicating family genetics
play an important role in the variation in response to the fungi. Containerized and bare-
77

root seedling stocktypes of the same family are equally susceptible or tolerant to L.
terebrantis and G. huntii suggesting both types of the seedlings can be used in further
screening studies. Pathogenicity of the two fungi varies even within a particular family so
relative tolerance of P. taeda families to L. terebrantis and G. huntii should be considered
separately. Since the tolerance of the families is tested at the premature stage future,
studies should be performed on mature P. taeda families. Also, future studies should be
focused on transcriptional changes in the tolerant and susceptible families following
fungal inoculation to improve our understanding of mechanisms of disease tolerance.
2.6 References
Akiba, M., Ishihara, M., Sahashi, N., Nakamura, K., Ohira, M., and Toda, T. (2012). Virulence of Bursaphelenchus xylophilus isolated from naturally infested pine forests to five resistant families of Pinus thunbergii. Plant Disease, 96(2), 249-252.
Brown, H., and McDowell, W. (1968). Status of loblolly pine die-off on the Oakmulgee District, Talladega National Forest, Alabama-1968. US Dep. Agric. For. Serv. Rept(69-2), 28.
Chieppa, J., Chappelka, A., & Eckhardt, L. (2015). Effects of tropospheric ozone on
loblolly pine seedlings inoculated with root infecting ophiostomatoid fungi. Environmental Pollution, 207, 130-137.
Chieppa, J., Eckhardt, L., and Chappelka, A. (2017). Simulated summer rainfall
variability effects on loblolly pine (Pinus taeda) seedling physiology and susceptibility to root-infecting ophiostomatoid fungi. Forests, 8(4), 104.
Dukes, J.S., Pontius, J., Orwig, D., Garnas, J.R., Rodgers, V.L., Brazee, N., Cooke, B.,
Theoharides, K.A., Stange, E.E., Harrington, R. and Ehrenfeld, J. (2009). Responses of insect pests, pathogens, and invasive plant species to climate change in the forests of northeastern North America: What can we predict? This article is one of a selection of papers from NE Forests 2100: A Synthesis of Climate Change Impacts on Forests of the Northeastern US and Eastern Canada. Canadian Journal of Forest Research, 39(2), pp.231-248.
Eckhardt, L. G., Weber, A. M., Menard, R. D., Jones, J. P., and Hess, N. J. (2007).
Insect-fungal complex associated with loblolly pine decline in central Alabama. Forest Science, 53(1), 84-92.
78

Fraser, S., Brown, A. V., and Woodward, S. (2015). Intraspecific variation in
susceptibility to dothistroma needle blight within native Scottish Pinus sylvestris. Plant Pathology, 64(4), 864-870.
Grossnickle, S. C., and El-Kassaby, Y. A. (2016). Bareroot versus container stocktypes: a
performance comparison. New forests, 47(1), 1-51. Hess, N. J., Otroana, W. J., Jones, J. P., Goddard, A. J., and Walkinshaw, C. H. (1999).
Reassessment of loblolly pine decline on the Oakmulgee Ranger District, Talladega National Forest, Alabama.
Hess, N. J., Otrosina, W. J., Carter, E. A., Steinman, J. R., Jones, J. P., Eckhardt, L. G.,
Weber, A.M., Walkinshaw, C. H. (2002). Assessment of loblolly pine decline in central Alabama. Paper presented at the Proceedings of theeleventh biennial southern silvicultural research conference. Gen. Tech. Rep. SRS-48. Asheville, NC: US Department of Agriculture, Forest Service, Southern Research Station.
Jacobs, K., and Wingfield, M. J. (2001). Leptographium species: tree pathogens, insect
associates, and agents of blue-stain. American Phytopathological Society (APS Press).
Jankowiak, R., Banach, J., and Balonek, A. (2013). Susceptibility of Polish provenances
and families of pedunculate oak (Quercus robur L.) to colonisation by Phytophthora cambivora. Forest Research Papers, 74(2), 161-170.
Lahr, E. C., and Krokene, P. (2013). Conifer stored resources and resistance to a fungus
associated with the spruce bark beetle Ips typographus. PloS one, 8(8), e72405. Matusick, G., and Eckhardt, L. G. (2010). The pathogenicity and virulence of four
Ophiostomatoid fungi on young Longleaf pine trees. Canadian Journal of Plant Pathology, 32(2), 170-176.
Matusick, G., Eckhardt, L. G., and Somers, G. L. (2010). Susceptibility of longleaf pine
roots to infection and damage by four root-inhabiting ophiostomatoid fungi. Forest ecology and management, 260(12), 2189-2195.
McNabb, K., and Enebak, S. (2008). Forest tree seedling production in the southern
United States: the 2005-2006 planting season. Tree planters' notes. Oliva, J., Stenlid, J., & Martínez‐Vilalta, J. (2014). The effect of fungal pathogens on the
water and carbon economy of trees: implications for drought‐induced mortality. New Phytologist, 203(4), 1028-1035.
79

Oswalt, S. N., Smith, W. B., Miles, P. D., and Pugh, S. A. (2014). Forest Resources of the United States, 2012. Washington Office, Forest Service, US Department of Agriculture.
Petäistö, R. L., and Kurkela, T. (1993). The susceptibility of Scots pine seedlings to
Gremmeniella abietina: effect of growth phase, cold and drought stress. European journal of forest pathology, 23(6‐7), 385-399.
Poudel, J., Munn, I. A., and Henderson, J. E. (2017). Economic contributions of wildlife
watching recreation expenditures (2006 & 2011) across the US south: An input-output analysis. Journal of Outdoor Recreation and Tourism, 17, 93-99.
Roux, J., Eisenberg, B., Kanzler, A., Nel, A., Coetzee, V., Kietzka, E., and Wingfield, M.
J. (2007). Testing of selected South African Pinus hybrids and families for tolerance to the pitch canker pathogen, Fusarium circinatum. New Forests, 33(2), 109-123.
Schultz, R. P. (1997). Loblolly pine: the ecology and culture of loblolly pine (Pinus taeda
L.). Agriculture Handbook (Washington)(713). Singh, A., Anderson, D., and Eckhardt, L. G. (2014). Variation in resistance of loblolly
pine (Pinus taeda L.) families against Leptographium and Grosmannia root fungi. Forest Pathology, 44(4), 293-298.
Sloan, J. P., Jump, L. H., and Ryker, R. A. (1987). Container-grown ponderosa pine
seedlings outperform bareroot seedlings on harsh sites in southern Utah. USDA Forest Service research paper, Intermountain Research Station (USA). no. 384.
South, D. B., Harris, S. W., Barnett, J. P., Hainds, M. J., and Gjerstad, D. H. (2005).
Effect of container type and seedling size on survival and early height growth of Pinus palustris seedlings in Alabama, USA. Forest Ecology and Management, 204(2), 385-398.
Starkey, T. E., and Enebak, S. A. (2013). Nursery lifter operation affects root growth
potential of pine seedlings. Tree Plant Notes, 56(3), 35-42. Stenlid, J., and Oliva, J. (2016). Phenotypic interactions between tree hosts and invasive
forest pathogens in the light of globalization and climate change. Phil. Trans. R. Soc. B, 371(1709), 20150455.
Tchernoff, V. (1965). Methods for screening and for the rapid selection of elms for
resistance to Dutch elm disease. Plant Biology, 14(4), 409-452. Wingfield, M. J. (1986). Pathogenicity of Leptographium procerum and L. terebrantis on
Pinus strobus seedlings and established trees. Forest Pathology, 16, 299-308.
80

Wingfield, M. j., Capretti, P. and McKenzie, M. 1988. Leptographium spp. as root pathogens of conifers: An international perspective. In Leptographium Root Diseases on Conifers. Edited by: Harrington TC, Cobb FW. 113-128. St. Paul, MN: American Phytopathological Society Press.
81

CHAPTER III
Intra-species Variation in Response of Mature Pinus taeda Families to Root-
infecting Ophiostomatoid Fungi
3.1 Abstract
Seedling screening studies have shown intra-species variation in susceptibility of
Pinus taeda (loblolly pine) to Leptographium terebrantis and Grosmannia huntii, the
causal agents of Pinus species root-infection. Roots of mature P. taeda families
determined as susceptible and tolerant to L. terebrantis and G. huntii by previous
seedling screening trials were artificially inoculated with the same fungal isolates. Dark
necrotic lesion and the vascular occlusion were recorded 8 weeks later. Families
previously considered as susceptible had longer lesions and occlusions when compared to
the tolerant families. The variation in susceptibility/tolerance pattern remained similar as
exhibited by families at seedling trial. The studies indicate that intra-species variation in
relative susceptibility of P. taeda to L. terebrantis and G. huntii remain the same
regardless of the tree age.
3.2 Introduction
Pinus taeda L., an important timber species, is commercially planted on
approximately 11.7 million hectares of land in the southern U.S. (Baker and Langdon,
1990; Rauscher, 2004). This species, when fertilized, can produce high per hectare wood
volume yields (Fox et al., 2004) providing an all-purpose forest product such as furniture,
82

pulpwood, composite boards, crates, boxes and pallets (Schultz, 1997). In addition, P.
taeda stands provide habitat for wildlife including endangered species such as red-
cockaded woodpecker (Jones and Hunt, 1996), and also place for wildlife watching and
hunting (Poudel et al., 2016). This pine species directly or indirectly contributes $30
billion to the economy of the southern U.S. (Schultz, 1999).
A factor impacting the growth and optimal productivity of this important pine
species is root-infecting pathogenic fungi, among which some are associated with Pine
Decline (PD) (Otrosina et al., 1999; Eckhardt et al., 2004a). Pine Decline, a decline
disease syndrome, was first observed by Brown and Mc Dowell (1968) on the Talladega
National Forest in Oakmulgee Ranger District located in central Alabama, U.S. Brown
and Mc Dowell (1968) reported 40-to-50-year-old P. taeda stands with symptoms of
decline that included thinning crowns, reduced radial growth, and root deteriorations.
This decline syndrome has subsequently been reported across the southeastern U.S. (Hess
et al., 2002; Eckhardt et al., 2007).
The decline-disease spiral, the widely accepted model of forest decline, given by
Manion (1981) involves interactions of 3 factors as follows: (i) factors bringing trees
under constant stress (predisposing factors), (ii) short-term factors increasing the severity
of stress (inciting factors), and (iii) factors a playing role at the end (contributing factors).
In the context of PD, tree genetics and increased slopes are the predisposing, drought and
ozone are the inciting, and root-feeding bark beetles and their associated ophiostomatoid
fungi are the contributing factors (Eckhardt et al., 2004a; Eckhardt et al., 2004b; Eckhardt
et al., 2007; Eckhardt and Menard, 2008). Root-feeding bark beetles such as Hylobius
pales Herbst., Hylastes spp. and Pachylobius picivorus (Germar) act as vectors in
83

introducing their ophiostomatoid fungal associates, namely Leptographium terebrantis
S.J. Barras and T.J. Perry, Grosmannia huntii R.C. Rob. Jeffr, and Leptographium
procerum (W.B. Kendr.) M.J. Wingf., into roots of P. taeda trees (Eckhardt et al., 2004 a;
Eckhardt et al., 2004b). Leptographium terebrantis and G. huntii were found to be more
virulent to southern Pinus species (Matusick et al., 2010; Singh et al., 2014) thus
warranting further need to study these fungi. Also, the inter-species and intra-species
susceptibility of the host (a major predisposing factor) to fungi contributing to PD are still
poorly known.
Ophiostomatoid fungi cause lesions in the phloem and occlusion in the xylem of
artificially inoculated seedling stems (Eckhardt et al., 2004a), stems (Matusick et al.,
2016), and roots (Matusick et al., 2010) of mature P. taeda trees. Furthermore, these
fungi use sugars, defense compounds and sugars leaking from degraded cell walls to
surive and proliferate inside xylem conduits (Hammerbacher et al., 2013).
Concomitantly, trees synthesize defensive carbon compounds and form tyloses and
structures that can compartmentalize fungal spread and infection (Yadeta and Thoma,
2013). Fungal spread and tyloses formation both disturb plant water transport (Joseph et
al., 1988) resulting in tree decline and death. Moreover, investment by the tree in defense
reaction occurs at the expense of radial growth (Krokene et al., 2008).
Artificial inoculation of Grosmannia and Leptographium species into roots of P.
taeda, P. palustris Mill. (longleaf pine) and P. elliotti Englem. (slash pine) by Matusick
et al. (2010) showed inter-species variation in susceptibility/tolerance. Pinus taeda was
the most susceptible among 3 Pinus species. Furthermore, Singh et al. (2014) conducted a
seedling screening study to examine intra-species variability of P. taeda tolerance to G.
84

huntii and L. terebrantis. Results indicate that P. taeda families have varying levels of
susceptibility/tolerance to those fungi. However, given that these fungi affect mature
trees in the ecological scenario, the reliability of results obtained from families at a
seedling stage is yet to be answered. To address this important question, we further
sought to determine the intra-species variation in tolerance/susceptibility of mature P.
taeda trees to L. terebrantis and G. huntii based on the seedling studies performed by
Singh et al. (2014). We hypothesize that intra-species variation in tolerance/susceptibility
of P. taeda to ophiostomatoid fungi is an inherent character of a family regardless of the
tree’s age.
3.3 Materials and method
3.3.1 Experimental design
Pinus taeda stands from 4 families in Alabama and Georgia (~ 31°53'N and
85°8'W, 81.16 m above the sea level) were chosen. Among 4 families, T1 and T2
represent the families relatively tolerant to ophiostomatoid fungi based on seedling
screening trials conducted by Singh et al. (2014). Conversely, S1 and S2, represent
susceptible families. The study was conducted twice; once in summer 2015 (June 15 -
August 15) and again in spring 2016 (March 15 - May 15). A total of 25 healthy mature
P. taeda trees, 17-year-old (for 2015) and 18-year-old (for 2016) with no visible signs or
symptoms of aboveground disease were selected per family. Selected trees had a mean
diameter at breast height and height of 19.5 cm (± 2.8 cm), and 13 m (± 2 m)
respectively.
85
3.3.2 Inoculation experiment
Roots were artificially inoculated with fungal cultures consisting of single spore
isolates of L. terebrantis (ATCC accession no. MYA-3316) and G. huntii (ATCC
accession no. MYA-3311) maintained at 4 ºC in Malt Extract Agar (MEA) in the Forest
Health Dynamics Laboratory at Auburn University. These fungal isolates were cultured
on 2% MEA, two weeks prior to root inoculations. The L. terebrantis and G. huntii
isolates used in the study were respectively isolated from the roots of P. taeda from the
Talladega National Forest, Oakmulgee Ranger District, AL, USA and of P. palustris
from the Fort Benning Military Reservation, GA, USA exhibiting symptoms of decline
such as localized tissue damage and defoliating crowns as described by Eckhardt et al.
(2007). Several previous artificial stem and root inoculation studies have used these
isolates (Matusick et al., 2010; Singh et al., 2014; Chieppa et al., 2017).
In the field, two primary lateral roots were excavated with hand tools that had
been sterilized using 70% ethanol from each P. taeda tree without damaging roots
(Figure 3.1). On each excavated root, two wounds to the cambium layer and 30 cm
horizontally apart from each other, were created by hitting a rubber mallet on a 13-mm
diameter sterile steel arch punch. The root inoculation included removing the bark plug
and placing the 10-mm agar plug (fungus-side-down) with actively growing fungi in the
wound (Figure 3.2). There were 2 fungal treatments: L. terebrantis, G. huntii and 2
control treatments: wound with sterile media and wound without media. One of each
fungal treatment and a control treatment were randomly paired together in each of the
roots per tree. Following inoculation, the bark was replaced, and the wound sealed with
duct tape to minimize further contamination. The inoculation points of the roots were
marked with labeled pin flags and covered with soil.
86
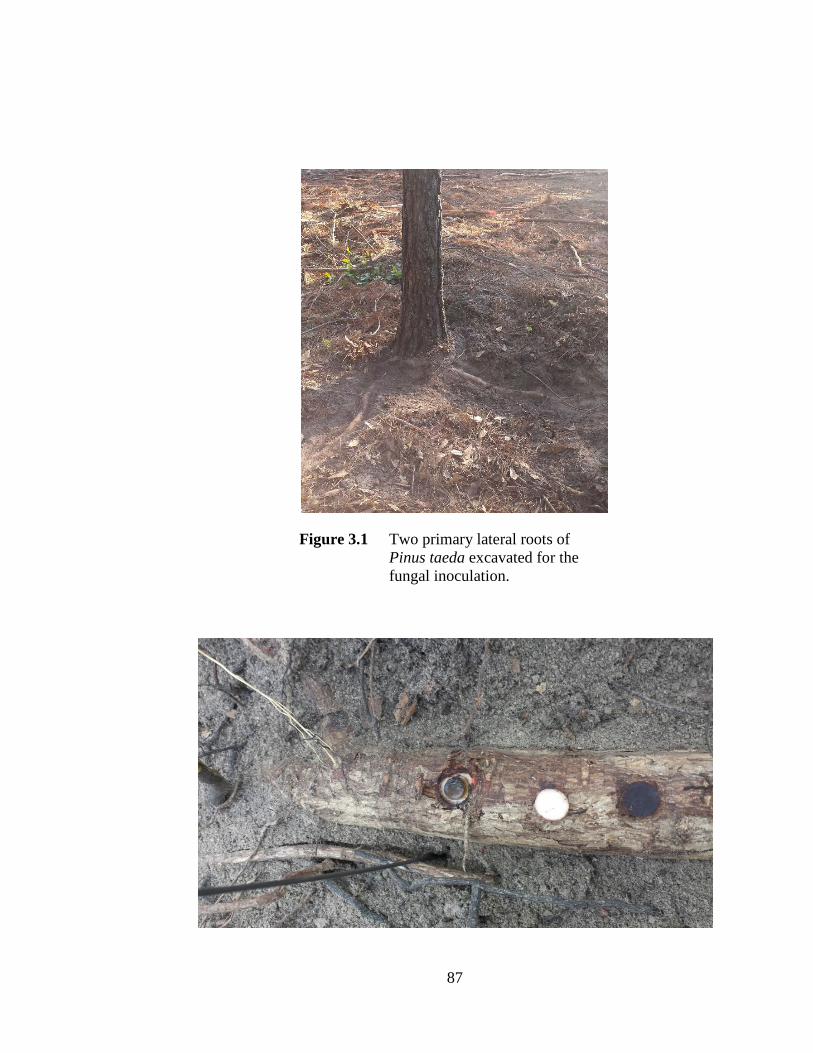
Figure 3.1 Two primary lateral roots of Pinus taeda excavated for the fungal inoculation.
87

Figure 3.2 Inoculation of the agar plug with fungi in the lateral root of Pinus taeda.
3.3.3 Laboratory measurements
Eight weeks post-inoculation, the inoculated roots were re-excavated and
removed from the tree (Figure 3.3). The exposed ends of the roots were painted with
Drylok Latex Masonry Waterproofer (Scranton, PA, USA) and were transported to the
lab at Auburn University for further processing (Figure 3.4). To observe the necrotized
and occluded tissues, bark around the inoculation area was removed and painted with a
solution of FastGreen stain (FastGreen FCF; Sigma Chemical Co.) (0.25 g/L of water).
The necrotic tissue area on each inoculation site was traced on a clear transparent sheet,
and lesion area was determined by using a Lasico Planimeter (Lasico®, Los Angeles, CA)
as described by Matusick et al. (2012). The amount of unstained tissue around the fungal
inoculation point determined the occlusion length. The root samples were cut transversely
at the point of the inoculation and the discolored sapwood was measured as occlusion
depth. Small pieces of stem tissue from the distal and proximal portions of the
inoculation site were plated on MEA amended with cycloheximide and streptomycin to
confirm fungal infection by re-isolation of the inoculated fungi.
88

Figure 3.3 Re-excavation of the fungi inoculated lateral roots of Pinus taeda for further measurements.
Figure 3.4 Pinus taeda root samples ready for measurement in the laboratory.
89
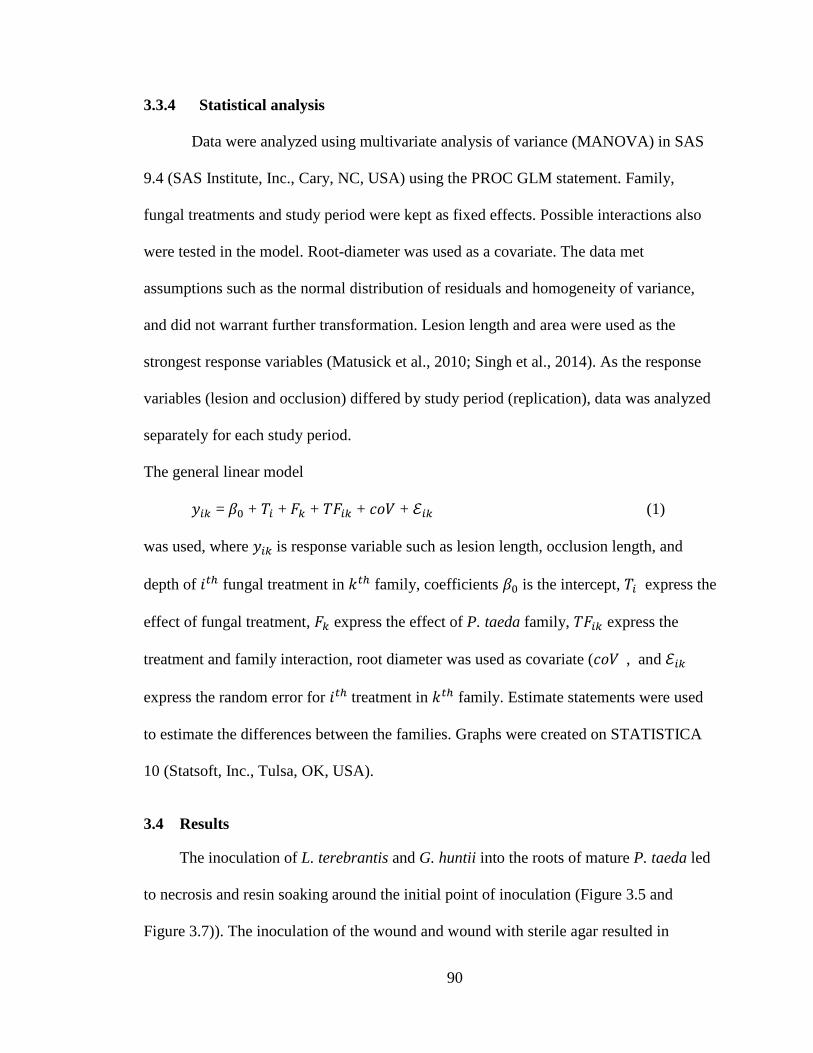
3.3.4 Statistical analysis
Data were analyzed using multivariate analysis of variance (MANOVA) in SAS
9.4 (SAS Institute, Inc., Cary, NC, USA) using the PROC GLM statement. Family,
fungal treatments and study period were kept as fixed effects. Possible interactions also
were tested in the model. Root-diameter was used as a covariate. The data met
assumptions such as the normal distribution of residuals and homogeneity of variance,
and did not warrant further transformation. Lesion length and area were used as the
strongest response variables (Matusick et al., 2010; Singh et al., 2014). As the response
variables (lesion and occlusion) differed by study period (replication), data was analyzed
separately for each study period.
The general linear model
𝑦𝑦𝑖𝑖𝑖𝑖 = 𝛽𝛽0 + 𝑇𝑇𝑖𝑖 + 𝐹𝐹𝑖𝑖 + 𝑇𝑇𝐹𝐹𝑖𝑖𝑖𝑖 + 𝑐𝑐𝐶𝐶𝑐𝑐 + ℰ𝑖𝑖𝑖𝑖 (1)
was used, where 𝑦𝑦𝑖𝑖𝑖𝑖 is response variable such as lesion length, occlusion length, and
depth of 𝑖𝑖𝑡𝑡ℎ fungal treatment in 𝑘𝑘𝑡𝑡ℎ family, coefficients 𝛽𝛽0 is the intercept, 𝑇𝑇𝑖𝑖 express the
effect of fungal treatment, 𝐹𝐹𝑖𝑖 express the effect of P. taeda family, 𝑇𝑇𝐹𝐹𝑖𝑖𝑖𝑖 express the
treatment and family interaction, root diameter was used as covariate (𝑐𝑐𝐶𝐶𝑐𝑐), and ℰ𝑖𝑖𝑖𝑖
express the random error for 𝑖𝑖𝑡𝑡ℎ treatment in 𝑘𝑘𝑡𝑡ℎ family. Estimate statements were used
to estimate the differences between the families. Graphs were created on STATISTICA
10 (Statsoft, Inc., Tulsa, OK, USA).
3.4 Results
The inoculation of L. terebrantis and G. huntii into the roots of mature P. taeda led
to necrosis and resin soaking around the initial point of inoculation (Figure 3.5 and
Figure 3.7)). The inoculation of the wound and wound with sterile agar resulted in
90

significantly smaller lesions than those caused by fungal inoculation (Figure 3.6).
Families responded differently to the fungal inoculation at each study periods in terms of
lesion area (F (3,374) = 10.48, p = <0.0001), lesion length (F (3,374) = 7.69, p = <0.0001) and
occlusion length (F (3,374) = 3.68, p = 0.01) (Figure 3.8). Hence, the data from summer and
spring root inoculation studies were analyzed separately. The inoculation of the fungi into
roots resulted in more tissue necrosis (in terms of lesion area) in the spring 2016
inoculation compared to the summer 2015 inoculation (Figure 3.9).
Figure 3.5 Resinosis and necrosis in the root 8 weeks following inoculation with
Leptographium terebrantis in family S2.
91

Figure 3.6 Wound control treated root section with small necrotic area.
Figure 3.7 Pie-shaped occlusion observed at the cross-section of inoculated root.
92

3.4.2 Summer 2015 inoculation
Families differed in their overall response to the fungal inoculation during
summer 2015 (F (21, 543) = 3.01, p = <0.0001) (Table 3.1). However, within a single
family, the pathogenicity of the two fungi were not different (F (21, 543) = 1.07, p = 0.38).
Leptographium terebrantis and G. huntii did not differ in their virulence (in terms of
occlusion length) (F (7,179) = 1.41, p = 0.21) (Figure 3.10).
Four P. taeda families differed in their response to inoculated fungi in terms of
the area (p = <0.0001) and length of the lesion (p = 0.01), and length (p = 0.03) and depth
(p = <0.0001) of the vascular occlusion (Table 3.1). The lesion area did not differ
significantly between two families (T1 and T2) tolerant to ophiostomatoid fungi (p =
0.07) and between two families (S1 and S2) susceptible to ophiostomatoid fungi (p =
0.30) (Table 3.2 and 3.3). The lesion area observed in tolerant family T2 was
substantially smaller than susceptible families S1 and S2 (Table 3.2 and 3.3). Families
showed a similar trend for lesion length. Susceptible family (S1) had a significantly
longer occlusion length compared to tolerant families (T1 and T2) (Table 3.2 and 3.3).
However, the depth and width of occlusion at the cross section underneath the fungal
inoculation point were significantly shorter in susceptible families S1 and S2 compared to
tolerant family T1 (Table 3.3).
The success of re-isolation of G. huntii from the inoculated root was 92%, 80%,
92%, and 92% for family T1, T2, S1, and S2 respectively. Similarly, for L. terebrantis
the re-isolation success was 100%, 96%, 88%, and 100% for family T1, T2, S1, and S2
respectively. The higher success of re-isolation of the fungi inoculated in root proved the
success of fungal inoculation and root-infection.
93

3.4.3 Spring 2016 inoculation
Pinus taeda families responded differently to the fungal inoculation in spring
2016 (F (21, 552) = 4.63, p = <0.0001). However, family and fungal treatment interaction
were significant (F (21,552) = 2.27, p = <0.0001), suggesting an overall variation in the
pathogenicity of L. terebrantis and G. huntii within each family. The families responded
differently to G. huntii and L. terebrantis in terms of lesion area (p = 0.03) and occlusion
length (p = 0.01) (Table 3.1). Leptographium terebrantis caused significantly longer
occlusion length than G. huntii in all of the families (Figure 3.10).
Area of the lesions caused by both fungi was significantly smaller in roots of
tolerant families (T1 and T2) compared to the susceptible families (S1 and S2) (Table 3.4
and 3.5). The length of occlusion caused by G. huntii was significantly longer in the
susceptible family S2 compared to all other families. However, occlusion length caused
by L. terebrantis did not differ in between the four P. taeda families (Table 3.4 and 3.5).
Both fungi caused lesions with a larger area and longer and wider length in susceptible
family S2 followed by susceptible S1 (Table 3.5).
The success of re-isolation of L. terebrantis from inoculated roots was 100%,
100%, 92%, and 100% from family T1, T2, S1, and S2 respectively. Similarly, the re-
isolation success of G. huntii was 84%, 76%, 64%, and 88%, from family T1, T2, S1, and
S2 respectively. Consistent re-isolation of the fungi previously inoculated in root proved
the success of fungal inoculation and infection.
94

95
Table 3.1 P-values for fixed effect and possible interactions for summer 2015 and spring 2016 inoculation.
Time Variable
DF
Lesion Area
Lesion Length
Lesion Width
Occlusion Length
Lesion Depth
Occlusion Width
Occlusion Depth
2015 RD 1 0.01 0.01 0.01 0.08 0.65 <0.0001 0.02 Fam 3 <0.0001 0.31 0.31 0.03 0.12 0.10 <0.0001 Trt 1 0.08 0.10 0.10 0.10 0.58 0.34 0.02 Fam*trt 3 0.85 0.46 0.46 0.86 0.38 0.94 0.51 2016 RD 1 0.03 0.86 <0.0001 0.99 <0.0001 <0.0001 <0.0001 Fam 3 <0.0001 <0.0001 <0.0001 0.03 0.02 0.43 0.12 Trt 1 0.002 <0.0001 0.62 0.31 0.31 0.10 <0.0001 Fam*Trt 3 0.03 0.32 0.54 0.01 0.37 0.73 0.29
(Note: RD: Root-diameter, Fam: Family, Trt: Fungal treatment). P-values were estimated at α = 0.05.

96
Table 3.2 Familywise mean and standard deviation of all the response variables for 2015 summer inoculation.
Family N
Lesion Area
(mm2)
Lesion Length (mm)
Lesion Width (mm)
Occlusion Length (mm)
Lesion Depth (mm)
Occlusion Width (mm)
Occlusion Depth (mm)
T1
50
1734.44ab (1010.62)
58.50a (18.62)
38.46a (15.51)
85.34a (24.90)
3.64a (1.43)
13.49a (3.00)
6.81a (3.02)
T2
49
1411.59b (635.08)
57.02ab
(12.46) 37.86a
(12.33) 85.54a
(29.08) 3.96a
(1.54) 14.22a
(2.45) 7.11a (3.08)
S1
46
2400.76c (1553.76)
76.41c
(28.38) 43.13a
(12.22) 102.09b (38.42)
3.35a (0.96)
13.37a (3.68)
5.54b (2.67)
S2
49
2125.22ac (1255.88)
67.23ac (22.66)
38.38a (16.04)
86.96a (25.65)
5.84b (10.98)
12.74a
(4.08) 5.42b (2.86)
T1 and T2: Families considered tolerant to root-infecting ophiostomatoid fungi at seedling stage, and S1 and S2: Families considered susceptible root-infecting ophiostomatoid fungi at seedling stage. Means followed by the standard deviation in parenthesis. Numbers followed by same letters within each column are not significantly different at α = 0.05.

97
Table 3.3 Parameter estimates of the response variables between the families in summer 2015 inoculation.
Lesion Area (mm2) Lesion Length (mm) Occlusion Length (mm) Occlusion Depth (mm) Family Estimate p-value Estimate p-value Estimate p-value Estimate p-value T1 vs T2
419.78 (230.30)
0.07
2.67 (4.27)
0.53
1.49 (6.10)
0.80
-0.08 (0.58)
0.89
T1 vs S1
-545.09 (235.31)
0.02
-16.41 (4.37)
0.0002
-14.63 (6.16)
0.01
1.54 (0.59)
0.01
T1 vs S2
-305.25 (229.76)
0.18
-7.67 (4.26)
0.07
-0.13 (6.01)
0.98
1.59 (0.58)
0.007
T2 vs S1
-964.87 (232.88)
<0.0001
-19.09 (4.32)
<0.0001
-16.12 (5.99)
0.008
1.62 (0.57)
0.006
T2 vs S2
-725.02 (229.04)
0.002
-10.34 (4.25)
0.02
-1.62 (6.10)
0.78
1.66 (0.58)
0.004
S1 vs S2
239.84 (233.05)
0.30
8.74 (4.33)
0.04
-14.50 (6.09)
0.01
0.04 (0.58)
0.94
T1 and T2: Families considered tolerant to root-infecting ophiostomatoid fungi at seedling stage, and S1 and S2: Families considered susceptible to root-infecting ophiostomatoid fungi at seedling stage. Estimates followed by the standard error in parenthesis. P-values show significant differences at α = 0.05.

98
Table 3.4 Means of response variables in four families inoculated with L. terebrantis and G. huntii in spring 2016.
Fungi Family N
Lesion Area (mm2)
Lesion Length (mm)
Lesion Width (mm)
Occlusion Length (mm)
Occlusion Depth (mm)
LT T1
25
2330.88a (729.69)
95.44a (31.40)
33.24a (5.02)
256.04a (81.64)
12.23a
(5.22) T2
25
2608.20a (847.55)
103.26ab (26.31)
37.86a (13.53)
206.20a (83.11)
16.35a (8.31)
S1
25
4764.84b (2126.54)
115.31ab (41.78)
50.41a (17.83)
251.84a (104.67)
14.96a (5.93)
S2
25
6435.40c
(4610.77) 164.520c
(96.08) 53.79a (22.2)
255.54a (95.32)
14.11a (5.71)
GH T1
25
2063.64a (791.27)
81.59a (21.57)
34.97a (12.71)
180.95a (90.84)
10.04a (3.89)
T2
25
2429.40a (1443.48)
83.01a (34.94)
38.07b (10.40)
248.07b (106.15)
9.70a (3.47)
S1
22
3529.73b (2151.41)
92.71a (37.39)
45.85b (19.89)
179.96ab (101.89)
13.83b (9.15)
S2
25
3886.36b (2524.02)
115.75c (62.44)
50.52c (13.28)
295.69c (190.79)
10.13ab (3.89)
Note: LT: Leptographium terebrantis, and GH: Grosmannia huntii. T1 and T2: Families considered tolerant to root-infecting ophiostomatoid fungi at seedling stage, and S1 and S2: Families considered susceptible to root-infecting ophiostomatoid fungi at seedling stage. Means followed by the standard deviation in parenthesis. Numbers followed by same letters within each column within each fungus are not significantly different at α = 0.05.

99
Table 3.5 Estimate of difference in response variables between families inoculated with L. terebrantis and G. huntii in spring 2016.
Lesion Area (mm2)
Lesion Length (mm)
Lesion Width (mm)
Occlusion Length (mm)
Occlusion Depth (mm)
Fungi Family Estimate p-value Estimate p-value Estimate p-value Estimate p-value Estimate p-value LT T1 vs T2
-129.41
(758.05) 0.86
-10.27
(16.43) 0.53
-1.30
(4.44) 0.77
39.73
(26.47) 0.14
-0.73
(1.16) 0.53
T1 vs S1
-25359.26
(742.07) 0.002
-21.10
(16.08) 0.19
-15.50 (4.35)
0.0006
-0.91 (25.90)
0.97
-1.03 (1.13)
0.37
T1 vs S2
-4095.43 (736.60)
<0.0001
-69.23 (15.96)
<0.0001
-20.34 (4.32)
<0.0001
-0.11 (25.71)
0.99
-1.69 (1.13)
0.14
T2 vs S1
-2229.84 (741.85)
0.003
-10.82 (16.06)
0.50
-14.20 (4.35)
0.0015
-40.63 (25.90)
0.12
-0.30 (1.13)
0.79
T2 vs S2
-3966.01 (755.51)
<0.0001
-58.95 (16.37)
0.0005
-19.04 (4.43)
<0.0001
-39.84 (26.38)
0.13
-0.96 (1.15)
0.41
S1 vs S2
-1736.17 (740.80)
0.02
-48.12 (16.05)
0.004
-4.85 (4.34)
0.27
0.79 (25.86)
0.98
-0.66 (1.13)
0.56
GH T1 vs T2
-333.94 (501.45)
0.51
-1.07 (11.81)
0.93
-2.70 (3.61)
0.46
-66.07 (36.49)
0.07
0.44 (1.47)
0.76
T1 vs S1
-1344.11 (519.85)
0.01
-9.81 (12.25)
0.43
-9.37 (3.74)
0.01
5.12 (37.83)
0.90
-3.39 (1.53)
0.03
T1 vs S2
-1952.93 (503.35)
0.0002
-35.55 (11.86)
0.004
-17.17 (3.63)
<0.0001
-119.15 (36.63)
0.001
-0.51 (1.48)
0.73
T2 vs S1
-1011.17 (519.50)
0.05
-8.75 (12.23)
0.48
-6.68 (3.74)
0.07
-71.12 (36.77)
0.06
-3.84 (1.53)
0.01
T2 vs S2
-1619.99 (504.50)
0.002
-34.50 (11.88)
0.005
-14.76 (3.64)
0.0001
-53.13 (36.71)
0.15
-0.96 (1.48)
0.52
S1 vs S2
-608.82 (525.46)
0.25
-25.74 (12.40)
0.04
-7.80 (3.79)
0.04
-124.26 (38.23)
0.002
2.88 (1.54)
0.07

Figure 3.8 Lesion length caused by the two different fungi in summer 2015 and spring 2016 inoculations. T1 and T2: Families tolerant to root-infecting ophiostomatoid fungi at seedling stage. S1 and S2: Families susceptible to root-infecting fungi and seedling stage. 95% confidence intervals are indicated by error bars.
100

Figure 3.9 Lesion area caused by the two different fungi in summer 2015 and spring 2016 inoculations. T1 and T2: Families tolerant to root-infecting ophiostomatoid fungi at seedling stage. S1 and S2: Families susceptible to root-infecting ophiostomatoid fungi at seedling stage. 95% confidence intervals are indicated by error bars.
G. huntii
T1 T2 S1 S20
1000
2000
3000
4000
5000
6000
7000
8000
Lesi
on a
rea
(mm
2 )
L. terebrantis
T1 T2 S1 S2
a
a
bb
ab a
aa
b
a
Summer 2015 Spring 2016
ab
ba
b
101
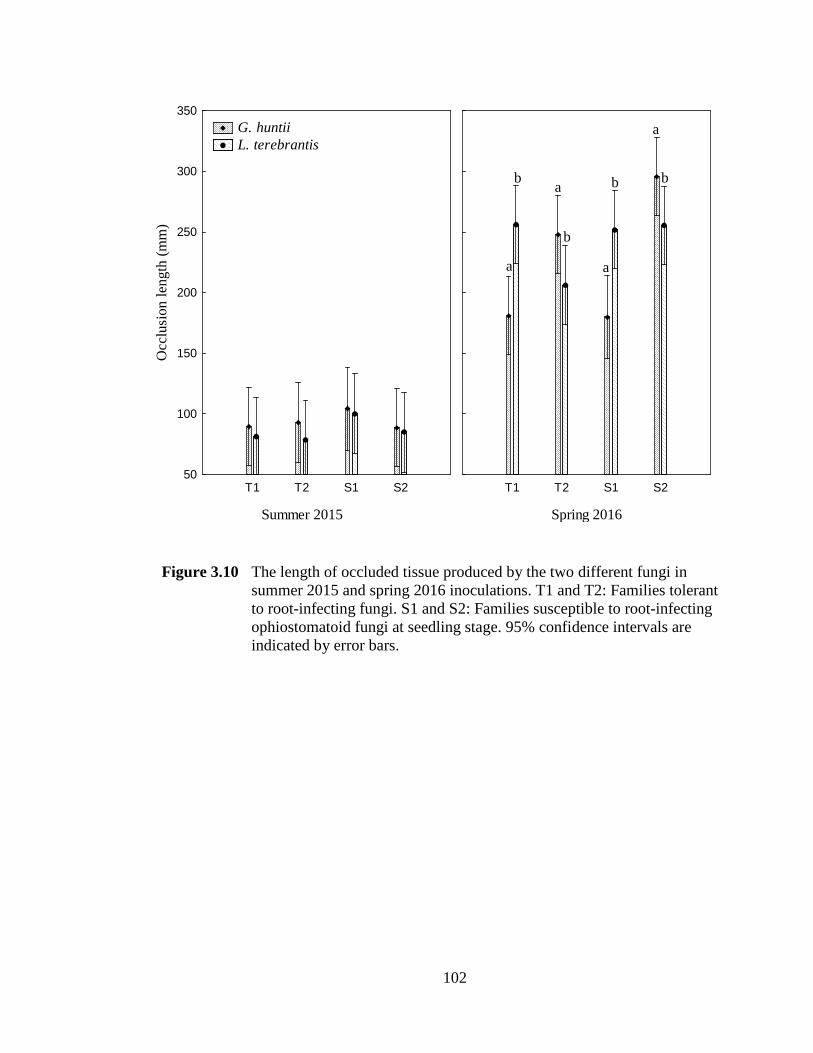
Figure 3.10 The length of occluded tissue produced by the two different fungi in summer 2015 and spring 2016 inoculations. T1 and T2: Families tolerant to root-infecting fungi. S1 and S2: Families susceptible to root-infecting ophiostomatoid fungi at seedling stage. 95% confidence intervals are indicated by error bars.
Summer 2015
T1 T2 S1 S250
100
150
200
250
300
350
Occ
lusi
on le
ngth
(mm
)
Spring 2016
T1 T2 S1 S2
b a
a
b
b
a
b
G. huntii L. terebrantis
a
102

Figure 3.11 The width of occluded tissue produced by the two different fungi in summer 2015 and spring 2016 inoculations. T1 and T2: Families tolerant to root-infecting fungi. S1 and S2: Families susceptible to root-infecting ophiostomatoid fungi and seedling stage. 95% confidence intervals are indicated by error bars.
G. huntii
Summer 2015 Spring 20168
10
12
14
16
18
20
22
24
Occ
lusi
on w
idth
(mm
)
L. terebrantis
Summer 2015 Spring 2016
T1 T2 S1 S2
*
*
103

3.5 Discussion
This is the first study to show within species variation in susceptibility of mature
P. taeda to ophiostomatoid fungi. Families S1 and S2 were more susceptible to root-
infection caused by ophiostomatoid compared to family T1 and T2 (Figure 3.8)
confirming the result of Singh et al. (2014) that found four P. taeda families used in the
present study plus others have different levels of tolerance to root-infecting
ophiostomatoid fungi. Intraspecific variation in susceptibility of mature Pinus species to
ophiostomatoid fungi have been observed in some other conifer hosts (Rice et al., 2007a;
Rice et al., 2007b). Several other researchers have reported considerable variation in
susceptibility to pitch canker within P. taeda (Dwinell et al. 1977; Gordon et al., 1998;
Schultz et al. 1990; Kelley and Williams, 1982) and P. radiata (Correll et al., 1991; Roux
et al., 2007). The present study shows that there is potential for selecting ophiostomatoid
fungi tolerant P. taeda families from the current southern U.S. planting stock reducing
the potential losses due to PD.
The use of seedlings to screen tolerance/susceptibility of P. taeda families to L.
terebrantis and G. huntii was questioned by Coyle et al. (2015). However, these results
confirmed that the use of seedlings in screening studies is consistent and reliable. While,
differences in the actual lesion size to define family susceptibility levels varies between
the present study when compared to that of Singh et al. (2014) families performed
similarly in both studies. Variation in susceptibility exists within and between Pinus spp.,
and this variation must be quantified before host susceptibility/tolerance can be
generalized across the entire range of this host.
In the spring, larger lesions and occlusions caused by L. terebrantis indicated a
higher virulence level of L. terebrantis over G. huntii. Similar results were reported by
104
Singh et al. (2014). Our results are not in agreement with the findings of Matusick et al.
(2010) where they found Grosmannia huntii to be relatively more virulent than L.
terebrantis. These discrepancies about fungal virulence can be attributed to the
consideration of intra-species variability in P. taeda in our study which was not
considered in the previous study. This implies that virulence of pathogens can be
underestimated if the intra-species response is not integrated into the selection of disease
tolerant hosts.
Lesions and occlusions were observed in all of tree roots. Similar hypersensitive
response was observed in P. taeda following fungal inoculation in various previous
studies (Matusick et al., 2008; Matusick et al., 2010; Matusick et al., 2012; Otrosina et
al., 2000). The host response observed in control treated roots were significantly lower
than those produced by the roots that were inoculated with fungal treatments. Similar
observations were made by Singh et al. (2014) in their seedling inoculation experiment.
Lesion size determines the susceptibility of the host (Stephen and Paine, 1985;
Matusick and Eckhardt, 2010; Singh et al., 2014). The introduction of ophiostomatoid
fungi in P. taeda induces ethylene production which further regulates monoterpene
production and guides the lesion formation (Popp et al., 1995). Paine et al. (1997) further
concluded that higher monoterpene accumulation denotes elevated plant defense to
invading insect vectors and pathogens. We, however, suggest that a smaller lesion length
indicates that with a shorter response the host plant can suppress the effect of the fungal
pathogen. The family that can block the fungal movement with less resin response is
more tolerant to root-infecting fungi. The higher carbon investment of the tree in defense
can result in the reduced radial growth (Krokene et al., 2008), alteration in conductive
105

tissue (Joseph et al., 1998), xylem disruption and immediate mortality (Tyree and
Zimmermann, 2002). We, thus suggest that the tolerant families T1 and T2 inhibit the
fungi at the expense of less carbon and are thus less prone to infection and further
reduction in productivity by ophiostomatoid fungi.
A number of the secondary metabolites produced by the host highly influence the
ability of root pathogens to spread in the host (Eckhardt et al., 2009). Trees with fewer
resin ducts are more susceptible to fungal infection and prone to attack by insect vectors
compared to those with more ducts (Ferrenberg et al., 2014). It is, however, unclear
whether variarion in either the resin constituents or the resin duct length and area among
the families results in inhibition of the fungal growth. The amount of production, the rate
of flow and the concentration of chemical content are heritable traits that guide the resin
defense in pine trees (Chhatre et al., 2013; Westbrook et al., 2013). The inherent factors
that direct the susceptibility and tolerance of P. taeda families to ophiostomatoid fungi
are still unknown.
A relatively severe hypersensitive response was observed in spring inoculation
compared to summer inoculation. Several studies suggest the timing of fungal inoculation
influence the response of trees (Paine, 1984; Stephen and Paine, 1985; Matusick et al.,
2010) and the results greatly support our findings. Resin production is highest in the root
cells formed immediately following the meristem differentiation and differ throughout
the year (Berryman, 1972). Tree defense is highest in May and continues to decrease until
December (Blanche et al., 1992). Thus, lesions are larger during the growing season that
the dormant season (Stephen and Paine, 1985; Matusick et al., 2010). The larger lesion
response requires higher carbon at the inoculation site (Guérard et al., 2007.) There is a
106

trade-off between investment of tree in defense and decrease of the radial growth and loss
of conductive tissue (Oliva et al., 2014).
Recent research has made great strides towards understanding intra-species
variation in disease tolerance, but their implication in mature trees in an ecological
scenario remains understudied. This paper presents the first study to show intra-species
variation in disease tolerance exists in mature P. taeda trees. Our results suggest that the
susceptibility and tolerance to L. terebrantis and G. huntii is an inherent property of
families, regardless of the life stage of P. taeda. The family genetics, a significant role
player in susceptibility and tolerance to pathogens, should be considered in future studies.
It is suggested that future studies of the molecular, anatomical and chemical mechanism
of defense strategies will improve our understanding of these findings.
3.6 References
Baker, J. B., and Langdon, O. G., (1990). Pinus taeda L. Silvics of North America. 1, 497-512.
Berryman, A. A. (1972). Resistance of conifers to invasion by bark beetle-fungus
associations. BioScience, 22(10), 598-602. Blanche, C. A., Lorio, P. L., Sommers, R. A., Hodges, J. D., and Nebeker, T. E. (1992).
Seasonal cambial growth and development of loblolly pine: xylem formation, inner bark chemistry, resin ducts, and resin flow. Forest Ecology and Management, 49 (1-2), 151-165.
Brown, H. D., and McDowell, W. E. (1968). Status of loblolly pine die-off on the
Oakmulgee District, Talladega National Forest, Alabama-1968. US Dep. Agric. For. Serv. Rept, (69-2), 28.
Chhatre, V. E., Byram, T. D., Neale, D. B., Wegrzyn, J. L., and Krutovsky, K. V. (2013). Genetic structure and association mapping of adaptive and selective traits in the east Texas loblolly pine (Pinus taeda L.) breeding populations. Tree Genet Genomes, 9 (5), 1161-1178.
107

Chieppa, J., Eckhardt, L., and Chappelka, A. (2017). Simulated Summer Rainfall Variability Effects on Loblolly Pine (Pinus taeda) Seedling Physiology and Susceptibility to Root-Infecting Ophiostomatoid Fungi. Forests, 8(4), 104.
Correll, J. C., Gordon, T. R., McCain, A. H., Fox, J. W., Koehler, C. S., Wood, D. L., and
Schultz, M. E. (1991). Pitch canker disease in California: pathogenicity, distribution, and canker development on Monterey pine (Pinus radiata). Plant Disease, 75(7), 676-682.
Coyle, D. R., Kier, D. K., Frank, H. K., Lawrence, A. M., John, T. N., Steven, W. O.,
William, J. O., William, D. S., and Kamal, J. K. G. (2015). A review of southern pine decline in North America. Forest Ecology and Management, 349, 134-148.
Dwinell, L. D., and Phelps, W. R. (1977). Pitch canker of slash pine in Florida. Journal
of Forestry, 75(8), 488-489. Eckhardt, L. G., and Menard, R. D. (2008). Topographic features associated with loblolly
pine decline in central Alabama. Forest ecology and management, 255(5), 1735-1739.
Eckhardt, L. G., Jones, J. P., and Klepzig, K. D. (2004a). Pathogenicity of
Leptographium species associated with loblolly pine decline. Plant Disease, 88(11), 1174-1178.
Eckhardt, L. G., Menard, R. D., and Gray, E. D. (2009). Effects of oleoresins and
monoterpenes on in vitro growth of fungi associated with pine decline in the Southern United States. Forest Pathology, 39(3), 157-167.
Eckhardt, L.G., Goyer, R. A., Klepzig, K. D., and Jones, J. P. (2004b). Interaction of
Hylastes species (Coleoptera: Scolytidae) with Leptographium species associated with loblolly pine decline. Journal of Economic Entomology, 97(2), 468-474.
Eckhardt, L. G., Weber, A. M., Menard, R. D., Jones, J. P., and Hess, N. J. (2007).
Insect-fungal complex associated with loblolly pine decline in central Alabama. Forest Science, 53(1), 84-92.
Ferrenberg, S., Kane, J. M., and Mitton, J. B. (2014). Resin duct characteristics
associated with tree resistance to bark beetles across lodgepole and limber pines. Oecologia, 174(4), 1283-1292.
Fox, T. R., Jokela, E. J., and Allen, H. L. (2004). The evolution of pine plantation
silviculture in the southern United States. Chapter 8. Gordon, T. R., Okamoto, D., Storer, A. J., and Wood, D. L. (1998). Susceptibility of five
landscape pines to pitch canker disease, caused by Fusarium subglutinans f. sp. pini. HortScience, 33(5), 868-871.
108

Hammerbacher, A., Schmidt, A., Wadke, N., Wright, L. P., Schneider, B., Bohlmann, J.,
Brand, W.A., Fenning, T.M., Gershenzon, J., and Paetz, C. (2013). A common fungal associate of the spruce bark beetle metabolizes the stilbene defenses of Norway spruce. Plant physiology, 162(3), 1324-1336.
Hess, N. J., Otrosina, W. J., Carter, E. A., Steinman, J. R., Jones, J. P., Eckhardt, L. G.,
Weber A. M and Walkinshaw, C. H. (2002). Assessment of loblolly pine decline in central Alabama.
Jones, C. M., and Hunt, H. E. (1996). Foraging Habitat of the Red-Cockaded
Woodpecker on the D'Arbonne National Wildlife Refuge, Louisiana (Habitat de Forrajeo de Picoides borealis en el Refugio Silvestre Nacional D'Arbonne, Louisiana). Journal of Field Ornithology, 511-518.
Joseph, G., Kelsey, R. G., and Thies, W. G. (1998). Hydraulic conductivity in roots of
ponderosa pine infected with black-stain (Leptographium wageneri) or annosus (Heterobasidion annosum) root disease. Tree Physiology, 18(5), 333-339.
Kelley, W. D., and Williams, J. C. (1982). Incidence of pitch canker among clones of
loblolly pine in seed orchards. Plant Disease, 66(12), 1171-1173. Krokene, P., Nagy, N. E., and Solheim, H. (2008). Methyl jasmonate and oxalic acid
treatment of Norway spruce: anatomically based defense responses and increased resistance against fungal infection. Tree Physiology, 28(1), 29-35.
Manion, P.D. (1981) Tree Disease Concept. Prentice-Hall Inc., Englewood Cliffs, NJ. Matusick, G., and Eckhardt, L. G. (2010). Variation in virulence among four root-
inhabiting Ophiostomatoid fungi on Pinus taeda L., P. palustris Mill, and P. elliottii Engelm. seedlings. Canadian Journal of Plant Pathology, 32(3), 361-367.
Matusick, G., Eckhardt, L. G., and Enebak, S. A. (2008). Virulence of Leptographium
serpens on longleaf pine seedlings under varying soil moisture regimes. Plant Disease, 92(11), 1574-1576.
Matusick, G., Somers, G., and Eckhardt, L.G. (2012). Root lesions in large loblolly pine
(Pinus taeda L.) following inoculation with four root-inhabiting ophiostomatoid fungi. Forest Pathology, 42(1), 37-43.
Matusick, G., Eckhardt, L. G., and Somers, G. L. (2010). Susceptibility of longleaf pine
roots to infection and damage by four root-inhabiting ophiostomatoid fungi. Forest Ecology and Management, 260(12), 2189-2195.
109

Matusick, G., Nadel, R. L., Walker D. M., Hossain M. J., and Eckhardt, L. G. (2016). Comparative behavior of root pathogens in stems and roots of southeastern Pinus species. Fungal Biology, 120(4), 471-480.
Oliva, J., Stenlid, J., and Martínez‐Vilalta, J. (2014). The effect of fungal pathogens on
the water and carbon economy of trees: implications for drought‐induced mortality. New Phytologist, 203(4), 1028-1035.
Otrosina, W. J., Bannwart, D., and Roncadori, R. W. (1999). Root-infecting fungi
associated with a decline of longleaf pine in the southeastern United States. Plant and Soil, 217(1), 145-150.
Otrosina, W. J., Walkinshaw, C. H., Zarnoch, S. J., Sung, S., and Sullivan, B. T. (2000).
Root disease, longleaf pine mortality, and prescribed burning. In Proceedings of the eleventh biennial southern silvicultural research conference. U.S. Dep. Agric. For. Serv. Gen. Tech. Rep. SRS-48. Asheville, NC.
Paine, T. D. (1984). Seasonal response of ponderosa pine to inoculation of the mycangial
fungi from the western pine beetle. Canadian Journal of Botany, 62(3), 551-555. Paine, T. D., Raffa, K. F., and Harrington, T. C. (1997). Interactions among scolytid bark
beetles, their associated fungi, and live host conifers. Annual review of entomology, 42(1), 179-206.
Popp, M. P., Johnson, J. D., and Lesney, M. S. (1995). Changes in ethylene production
and monoterpene concentration in slash pine and loblolly pine following inoculation with bark beetle vectored fungi. Tree Physiology, 15, 807-812.
Rauscher, H. M. (2004). A history of southern forest science, management, and
sustainability issues. Gen. Tech. Rep.USDA Forest Service, Southern Research Station. Chapter 1, 3-4.
Rice, A. V., Thormann, M. N., and Langor, D. W. (2007a). Mountain pine beetle
associated blue-stain fungi cause lesions on jack pine, lodgepole pine, and lodgepole× jack pine hybrids in Alberta. Botany, 85(3), 307-315.
Rice, A. V., Thormann, M. N., and Langor, D. W. (2007b). Virulence of, and interactions
among, mountain pine beetle associated blue-stain fungi on two pine species and their hybrids in Alberta. Botany, 85(3), 316-323.
Roux, J., Eisenberg, B., Kanzler, A., Nel, A., Coetzee, V., Kietzka, E., and Wingfield, M.
J. (2007). Testing of selected South African Pinus hybrids and families for tolerance to the pitch canker pathogen, Fusarium circinatum. New Forests, 33(2), 109-123.
110

Schultz, R. P. (1999). Loblolly—the pine for the twenty-first century. In Planted Forests: Contributions to the Quest for Sustainable Societies (pp. 71-88). Springer Netherlands.
Schultz, R. P. (1997). Loblolly pine: the ecology and culture of loblolly pine (Pinus taeda
L.). Agriculture Handbook. USDA Forest Service, Washington D.C. Schultz, M. E., Gordon, T. R., and McCain, A. H. (1990). Resistance of Monterey pine
(Pinus radiata) to pitch canker disease caused by Fusarium subglutinans. Phytopathology, 80, 977.
Singh, A., Anderson, D., and Eckhardt, L. G. (2014). Variation in resistance of loblolly
pine (Pinus taeda L.) families against Leptographium and Grosmannia root fungi. Forest Pathology, 44(4), 293-298.
Stephen, F. M., and Paine, T. D. (1985). Seasonal patterns of host tree resistance to
fungal associates of the southern pine beetle. Zeitschrift für angewandte Entomologie, 99(1-5), 113-122.
Tyree, M. T., and Zimmermann, M. H. (2002). Xylem Structure and the Ascent of Sap,
Springer. Berlin, Germany. Westbrook, J. W., Resende, M. F., Munoz, P., Walker, A. R., Wegrzyn, J. L., Nelson, C.
D., Neale, D. B., Kirst, M., Huber, D. A., Gezan, S. A., Peter, G. F., and Davis, J. M. (2013). Association genetics of oleoresin flow in loblolly pine: discovering genes and predicting phenotype for improved resistance to bark beetles and bioenergy potential. New Phytologist, 199(1), 89-100.
Yadeta, K., Thomma, B. 2013. The xylem as battleground for plant hosts and vascular
wilt pathogens. Frontiers in Plant Science 4: art no. 97.
111

CHAPTER IV
The Role of Leptographium terebrantis and Grosmannia huntii Invasion in Driving
Drought-Related Decline in Pinus taeda Families
4.1 Abstract
The complex interaction of various biotic and abiotic factors may put the overall
stand health of Pinus spp. at risk. A study was designed to determine the combined
impact of drought and vascular-inhabiting fungi (Leptographium terebrantis and
Grosmannia huntii) in Pinus taeda (loblolly pine). Seedlings from two P. taeda families
were planted and watering treatments: i. normal moisture, ii. medium drought, and iii.
severe drought were applied. One month following initiation of watering treatments,
seedling stems were artificially inoculated with L. terebrantis and G. huntii. Drought and
fungal interaction significantly affected lesion and occlusion length, and seedling fine
root dry matter biomass yield and needle-to-fine-root dry biomass ratio. Leptographium
terebrantis was more virulent in severe drought conditions. The tolerant family was also
more tolerant to drought, indicating tolerance to of P. taeda to drought may be improved
through appropriate family selection. Drought and vascular-inhabiting fungi may
negatively impact P. taeda stand health.
4.2 Introduction
Adverse climatic conditions like drought have been shown to be responsible for a
number of forest declines throughout the world (Adams et al., 2013; Cailleret et al.,
112

2014). Recent incidents of tree decline and mortality have been related to increased mean
annual temperatures and decreased mean annual rainfall in European forests (Carnicer et
al., 2011) and increased droughts in the southwestern (van Mantgem et al., 2009) and
southeastern U.S. (Klos et al., 2009; Wang et al., 2010). Drought events are expected to
become more common in future (IPCC, 2013) resulting in drought-induced forest
mortality (Peng et al., 2011). As forests play a key role in the global water and carbon
cycles, a feedback loop exists between climate change and forest function (Bonan, 2008).
Despite the effects of drought on forest function, mechanisms underlying forest decline
and mortality are still weakly understood (Mc Dowell et al., 2011).
According to Turtola et al. (2003), low soil moisture influences the production of
specific chemicals in conifers rendering the trees more susceptible to both pathogen and
insect attack. For example, bark beetle infestation in drought-weakened Pinus forests
may occur many years after the end of the climatological drought (Raffa et al., 2008).
Beetle-vectored, vascular-inhabiting pathogens can have a devastating effect on drought
stressed trees (Oliva et al., 2014). Vascular wilt pathogens such as Ceratocystis Ellis and
Halst., Leptographium, and Grosmannia Goid. species thrive in the xylem of Pinus spp.
(Yadeta and Thomma, 2013; Singh et al., 2014). Pinus spp. defend against these fungi by
producing resins that clog the plant vascular conducting tissues (Matusick and Eckhardt,
2010). Clogging of plant conduits disturb plant water transport, resulting in hydraulic
failure that leads to tree mortality (Oliva et al., 2014). Thus, adverse climatic conditions
easily influence susceptibility of conifer hosts to pathogen and insect attack (Lindberg
and Johansson, 1992).
113

Models of forest decline incorporate predisposing factors, inciting factor and
contributing factors (Sinclair 1966; Manion, 1981). In this context, P. taeda L. decline in
the southern U.S. has been associated with (i) predisposing factors like tree genetics, age,
ozone and adverse soil conditions, (ii) inciting factors such as drought and increased
ozone and (iii) contributing factors like root-feeding bark beetles and beetle-vectored
vascular-inhabiting fungi (Eckhardt et al., 2004; Eckhardt and Menard, 2008; Eckhardt et
al., 2010). The vascular inhabiting fungal pathogens are considered to be the major
driving factors in the final phase of drought-induced tree and stand mortality (Oliva et al.,
2014).
Pathologists many have been suffering from false dichotomy of drought vs biotic
attack (Mc Dowell et al., 2013). Many studies have focused primarily on individual
factors: (i) drought and its subsequent effect on plant physiology (Noormets et al., 2010;
Maggard et al., 2016) or (ii) biotic agents and its subsequent impact on tree health
(Matusick and Eckhardt, 2010; Singh et al., 2014). However, the evidence for the
mechanisms suggested by these individual factors is inconclusive and a more integrated
approach focusing on interrelations between drought and the biotic agents on tree growth
and functioning are needed.
Recently, a limited number of studies have concentrated on the interaction of
drought and vascular-inhabiting fungi (Matusick et al., 2008; Chieppa et al., 2017).
However, these studies were conducted for shorter time periods and deployed both
drought and fungal treatment at the same time (Matusick et al., 2008; Chieppa et al.,
2017), despite the fact that these vascular-inhabiting fungi come into play only after the
predisposition of trees to a drought event. Thus, a closer examination of the impact of L.
114

terebrantis and G. huntii on P. taeda trees predisposed to drought is needed. In this
concern, we address the following questions: (i) Does the virulence of L. terebrantis and
G. huntii in P. taeda increase under increasing drought?, (ii) Does drought stress increase
the susceptibility of P. taeda families to these fungi?, and (iii) Is infection by vascular-
inhabiting fungi under drought likely to enhance tree decline directly through increased
investment in occlusion and indirectly through a reduction of plant growth?
4.3 Methodology
4.3.1 Experimental set-up
The experiment was conducted in the research facility of the Southern Forest
Nursery Management Cooperative Auburn, AL, USA. The facility contained an open
outdoor pavilion with 12 raised wooden boxes (120 cm long and 100 cm wide) filled with
pure sand. Plastic transparent roof covered the pavilion to exclude ambient rainfall. A
system was used for automatic irrigation prior to the commencement of the study.
115

Figure 4.1 Pinus taeda seedlings planted in sand filled boxes experiencing different watering treatments.
4.3.2 Seedling planting
One-year-old, bare-root seedlings from two commercially grown P. taeda
families were used. Seeds were sown in March 2014 and seedlings were lifted from the
nursery in January 2015. Based on previous findings by Singh et al., (2014), one family
was considered “susceptible” (S) and one “tolerant” (T) to root-infecting ophiostomatoid
fungi. In February 2015, 630 seedlings (35 per family in each box) were planted in 9
wooden boxes and watered to field capacity for 4 weeks until watering treatments were
initiated.
4.3.3 Moisture treatment
Three watering treatments: i. normal moisture, ii. moderate drought, and iii.
severe drought were deployed to 3 boxes (3 replicates/treatment) in March 2015. The
watering treatments were determined based on the volumetric water content of the pure
sand and loblolly pine. The well-watered soil sample was taken with soil core of known
volume. The wet weight and dry weight (72 h at 105 ºC) of the soil were determined and
the volumetric water content of the soil sample at field capacity (FC) was determined by
using the following formula:
𝑐𝑐 = 𝑊𝑊𝑊𝑊𝑊𝑊𝑊𝑊𝑊𝑊−𝐷𝐷𝑊𝑊𝑊𝑊𝑊𝑊𝑊𝑊𝑃𝑃𝑃𝑃 𝑉𝑉𝑊𝑊
Where Wmass is the mass before drying and Dmass is the mass after drying, Pw is the
density of
water (1000 kg m-3) and Vs is the total volume of the soil sample (sum of air, water, and
soil). The volumetric water content for the FC was 32 m3 m-3. The watering treatments
116

were as follows: i. 75 % of FC (normal water i.e 28 m3 m-3), ii. 50 % of FC (medium
drought i.e. 18 m3 m-3), and iii. 25 % of FC (severe drought i.e. 11 m3 m-3). Soil water
content was constantly monitored in each box using an external moisture probe (Figure
4.2) and irrigation was programmed to meet volumetric water content of each box.
Figure 4.2 Soil moisture being monitored with a soil moisture meter.
4.3.4 Inoculation treatment
One month into the three watering treatments (April 2015), artificial stem
inoculations were conducted using the method described by Nevill et al. (1995), Singh et
al. (2014), and Chieppa et al. (2017) using wound + inoculum method. Five inoculation
treatments applied were as follows: L. terebrantis (LOB-R-00-805/ATCC accession no.
MYA-3316), G. huntii (LLP-R-02/ATCC accession no. MYA-3311), wound, wound +
media and no wound. Seven seedlings per family within a box received each inoculation
treatment. The L. terebrantis isolate used was isolated from a root of P. taeda exhibiting
local tissue damage and deteriorating crowns from the Talladega National Forest,
117

Oakmulgee Ranger District, AL, USA (Eckhardt et al., 2007). The G. huntii isolate used
was isolated from a root of P. palustris Mill. showing similar characteristics of decline
from the Fort Benning Military Reservation, GA, USA. These isolates have been used in
previous artificial inoculation studies (Matusick and Eckhardt, 2010; Singh et al., 2014;
Chieppa et al., 2017). The fungal isolates were maintained at 4 ºC in Malt Extract Agar
(MEA) before use and were plated on 2 % MEA plate, 14 days prior to the inoculation
experiment.
To perform the inoculation, 13 mm (<2 mm depth) of seedling bark at the stem, ~
3 cm above soil line was cut vertically with a sterile razor blade. The single pre-punched
plug of agar (3 mm) with actively growing fungal mycelium was placed (fungus-side-
towards wound) in the wound in each seedling. Sterile agar was inoculated in the wound
in case of wound + media inoculation. A sterile cut was made for wound control. No
wound was made in seedling receiving no wound treatment. Wounds on the stems were
then wrapped with sterile cotton balls moistened with deionized water to prevent
desiccation of MEA and wrapped with Parafilm® to avoid contamination.
118

Figure 4.3 Inoculation of agar plug in Pinus taeda stem.
4.3.5 Pre-harvesting measurements
4.3.5.1 Growth and size measurement
Height and root-collar diameter (RCD) measurements were collected from each
seedling prior to watering treatment (March 2015), stem inoculation (April 2015) and
seedling harvesting (September 2015). Before seedling planting (February 2015), 12
extra seedlings from each family were randomly selected for height, RCD, and biomass
measurements and the averages are given in Table 4.1. The number of new buds
developed were also counted on individual seedlings before watering (March 2015) and
inoculation treatments (April 2015) and prior to seedling harvesting (September 2015).
119

Table 4.1 Initial family height, RCD, dry wet matter of seedling averages and standard deviation (n = 12 per family).
F H (cm) RCD (mm) FR (g) CR (g) N(g) S (g) S 23.5 (2.2) 4.29 (0.68) 0.45 (0.17) 0.39 (0.21) 1.84 (0.60) 1.10 (0.26) T 27.5 (3.5) 5.34 (1.02) 0.89 (0.64) 0.38 (0.38) 1.48 (0.47) 1.43 (0.52)
F: Family, S and T denote loblolly pine family selected for its susceptibility and tolerance to ophiostomatoid fungi, RCD: Root-collar diameter, FR: Fine Root, CR: Coarse root, N: Needle, and S: Stem. Means followed my standard deviation in parenthesis.
4.3.5.2 Needle greenness and chlorophyll content
Needle greenness was measured non-destructively on 5-7 needles that reached
physiological maturity using Soil-Plant Analysis Development-502 (SPAD) chlorophyll
meter (Spectrum Tech. Inc., Plainfield, IL, USA) prior to inoculation treatment and at
seedling harvest. Three measurements were taken from each seedling and then averaged.
Needle chlorophyll content was measured in two needles for all treatments.
Samples were collected by extracting 0.25 g of the needle material in 6.25 ml 95 %
ethanol. The sample was kept in the dark in a water bath for 24 h and then allowed to
cool to room temperature and vortexed at slow speed for 1 minute. Samples were
centrifuged for 5 minutes at 13500 g, and the extract was collected. The extract
absorbance was measured at 665, 645 and 470 nm using a UV-Vis spectrophotometer
(Thermo ScientificTM, USA). Chlorophyll content Chlorophyll-a (Chla) and
Chlorophyll-b (Chlb) was calculated by using the following formula (Guo et al., 2010):
Chla = 13.95A665 - 6.88A649
and
Chlb = 24.96A649 - 7.32A665
120

Figure 4.4 Samples containing chlorophyll extracted from Pinus taeda needles.
4.3.5.3 Predawn water potential
Two seedlings from each treatment, replicate, were destructively sampled (end of
August 2015) for pre-dawn needle water potential (Ψpd) measurements. Three mature
fascicles from each seedling were harvested between 2:30 AM and 5:00 AM, placed in an
air-tight plastic bag and kept in a dark box until measured. A Scholander pressure bomb
(PMS Instrument Company, Albany, OR, USA) was used to measure Ψpd, within 5 hours
of collection.
4.3.5.4 Relative leaf water content
The relative leaf water content (RWC) was measured on needle fascicles used for
the water potential measurement. The fresh weight of the fascicle was determined then
soaked in sterile deionized water for 24 h. The fascicle was oven dried at 75 ºC for 48 h,
re-weighed and RCW was calculated by the following formula:
𝑅𝑅𝐶𝐶𝑊𝑊 = 𝑊𝑊−𝐷𝐷𝑊𝑊𝑇𝑇𝑊𝑊−𝐷𝐷𝑊𝑊
𝑋𝑋 100 %
121

Where W = Sample fresh weight, TW = Turgid weight of needle, DW = Dry weight of the
sample.
4.3.6 Post-harvest measurement
4.3.6.1 Inoculation response
In September 2015, four seedlings from each treatment within each box were cut
at the stem above the soil level (September 2015). Seedling stems were placed in mixture
of stain (FastGreen FCF; Sigma Chemical Co., St. Louis, MO, USA) and water in a ratio
of 0.25 g L-1 for 72 h. The bark near the inoculation point was carefully scraped away to
the xylem and the lesion and occlusion length and width were measured. The phloem
colonized by the fungi was measured as the lesion. The portion of the xylem that did not
allow the stain to pass through it was considered an occlusion. Two pieces (~ 3 mm) of
stem tissue surrounding the lesion were cut and plated on MEA with cycloheximide at
800 mg L-1 and streptomycin sulfate at 200 mg L-1 to confirm fungal re-isolation. Stem
sections of control seedlings also were also plated to confirm no contamination.
4.3.6.2 Seedling biomass
Three remaining seedlings from each treatment combination per box were used
for dry biomass measurements. Each seedling was separated into needles (N), stem (S),
coarse root (CR) and fine root (FR) and allowed to dry at 75 ºC for 72 h then weighed.
122

Figure 4.5 Pinus taeda seedling separated into coarse root (CR), fine root (FR), needles (N) and stem (S) for biomass measurement.
4.3.7 Statistical analysis
The experimental design was a randomized complete block (RCBD) design with
replicates at all levels. The data for the seedling survival were analyzed by logistic
regression using R 3.3.1.
Similarly, the general linear model was used to analyze the other response
variables. The general linear model used was:
𝑦𝑦 = 𝛽𝛽𝐶𝐶 + 𝛽𝛽1 + 𝛽𝛽2 + 𝛽𝛽3 + 𝛽𝛽4 + 𝛽𝛽5 + 𝛽𝛽6 + β7 +ℰ
Where, y is the response variable (lesion and occlusion length, depth and width,
and needle, stem, coarse root, fine root). β0 is the intercept, β1 is the family effect, β2 is
the fungal effect, β3 is the moisture effect, β4 is the family x fungal interaction, β5 is the
interaction of fungal treatment x moisture treatment and β6 is the interaction of family x
moisture treatment and β7 is the random effect of the box and ℰ is the residual error.
Multiple comparisons tests were performed by using post hoc Tukey (Honest Significant
Difference) procedures. All the assumptions of normality and homogeneity of the
123

variance were inspected. All the statistical analysis were conducted using SAS (Version
9.4, SAS Institute, Inc., Cary, NC, USA), R Core 3.3.1 and STATISTICA (Statsoft, Inc.,
Tulsa, OK, USA).
4.4 Results
4.4.1 Seedling survival
No specific pattern regarding the seedling mortality was observed during the
study period. Seedling survival was not affected by family of P. taeda, watering
treatment, and fungal inoculation. An overall result of the effects of different treatments
in the response variables is presented in Table 4.2.
124

125
Table 4.2 An overview of the effect of different treatments on seedlings response variables.
Treatments/Combinations Measurement Transformation n Mos Fam Ino Mos x Fam Fam x Ino Mos x Ino Fam x Mos x Ino LL Log10 429 *** *** *** NS ** *** NS LL/Ht Log10 420 *** *** *** NS NS ** NS LD Log10 425 ** NS *** NS NS NS * LW Log10 419 * NS *** NS NS * NS OL Log10 419 NS * *** NS * ** NS OL/Ht Log10 410 ** *** *** NS NS * NS OD Log10 417 ** * *** NS NS NS NS OW Log10 417 ** NS *** NS NS NS NS Ny Log10 450 ** *** * NS NS NS NS Sy Log10 430 *** *** ** NS NS NS NS Cry Log10 428 *** *** NS NS NS NS * Fry Raw 428 *** *** ** NS NS ** NS S/R Log10 399 *** *** NS NS NS NS NS Fry/Cry Log10 385 NS * * NS NS NS NS Ny/Fry Log10 375 ** NS NS NS NS ** NS Hti Raw 609 *** *** ** NS NS NS NS NG Log10 315 NS NS *** NS NS NS NS SVC Square root 597 *** *** ** NS * NS NS Ψpd Log10 149 NS NS ** NS NS NS NS RCW Log10 150 ** NS NS NS NS NS NS BP Log10 463 * NS ** NS NS * NS *: P <0.05, **: P <0.01, ***: P <0.0001, Mos: watering treatment, Ino: Inoculation treatment, Fam: Family, LL: Lesion length, LL/Ht: Lesion length Height-1, OL/Ht: Occlusion length Height-1, LD: Lesion depth, OL: Occlusion length, Ny: Needle dry matter yield (DMY), Sy: Stem DMY, Cry: Crude root DMY, Fry: Fine root DMY, Hti: Height increase, NG: Needle greenness, SVC: Seedling volume change, Ψpd: Predawn water potential, RCW: Relative water content, BP: Bud production.

4.4.2 Lesion and occlusion
Dark brown necrotic tissues were observed at the inoculation point in all the inoculated
seedlings. The re-isolation of G. huntii and L. terebrantis was 89% and 92%, respectively
indicating successful fungal inoculation. Seedling lesions with the control inoculations were
significantly smaller than fungal inoculations, indicating fungi, but not the wound caused lesion.
The lesions in the wound and wound + media did not extend beyond the inoculation zone.
Lesion length/seedling height (LL/Ht) was significantly affected by family and the
interaction between inoculation and watering conditions (Table 4.2). Family S (susceptible
family) had the greatest lesion and lesion length/height ratio. L. terebrantis resulted in the
highest lesion length/height ratio in severe drought condition (Figure 4.6).
Lesion length was significantly affected by watering treatment, family, inoculation,
family x inoculation and watering treatment x inoculation. Leptographium terebrantis resulted in
significantly longer lesion than G. huntii within both tolerant (T) and susceptible (S) family. The
seedlings under severe drought challenged with L. terebrantis had the longest lesions (Table 4.3).
Under the medium drought condition, there was greater variation in lesion length caused by both
fungi. The lesion caused by L. terebrantis was significantly longer in the susceptible family than
the tolerant family.
Lesion depth was significantly affected by the watering condition, inoculation and
family x watering x inoculation (Table 4.2). Leptographium terebrantis caused deeper lesions
than G. huntii in all treatment and treatment combinations (Table 4.5). Occlusion length was
significantly affected by family, inoculation, family x inoculation, watering treatment x
inoculation interaction (Table 4.2). The occlusion length caused by the wound and wound +
media inoculation was not different among the various watering treatments and smaller than the
126

caused by fungal inoculation. Leptographium terebrantis caused the longest length of occlusion
in seedlings under severe drought (Table 4.3).
Occlusion length/seedling height was affected by watering treatment, family, inoculation
and watering treatment x inoculation interaction (Table 4.2). Within each watering treatment, L.
terebrantis caused significantly higher occlusion length/seedling height than G. huntii (Table
4.3). Occlusion length was also affected by family, inoculation, family x inoculation, and
watering treatment x inoculation (Table 4.2). Leptographium terebrantis caused longer occlusion
lengths than G. huntii in both families (Table 4.4). Seedlings under moderate drought had
greatest occlusion length as a response to L. terebrantis inoculation. However, the occlusion
length/seedling height ratio was not significantly different between the seedlings receiving
different watering treatments. This ratio was significantly higher in seedlings inoculated with L.
terebrantis than G. huntii (Table 4.3), indicating the higher virulence of L. terebrantis.
Occlusion depth produced in the seedlings was significantly affected by watering
treatment, family type, and inoculation. Grosmannia huntii and L. terebrantis caused
significantly deeper occlusions than wound and wound + media inoculated seedlings, suggesting
successful fungal inoculation. Leptographium terebrantis caused deeper occlusion than G. huntii
under all watering conditions.
127

Figure 4.6 Necrotic tissue (lesion) on the stem of P. taeda seedling under severe drought inoculated with L. terebrantis.
Figure 4.7 Dark necrotic tissue in stem cross-section of Pinus taeda following fungal inoculation.
128

Figure 4.8 Cross-section of the Pinus taeda vascular tissue occluded as a result of Leptographium terebrantis inoculation. Arrow indicates the growth of new tissue on the opposite site of inoculation.
129

130
Table 4.3 Effects of inoculation and watering treatments on lesion and occlusion.
Inoculation Moisture LL (mm) LL/Ht LD (mm) OL (mm) OL/Ht OD (mm) GH N 21.73 (2.48) d 0.50 (0.12) b 1.51 (0.57) b 27.27 (4.98) c 0.63 (0.19) c 0.46 (0.75) b
MD 24.06 (6.59) d 0.56 (0.19) b 2.31 (0.55) b 28.71 (12.31) c 0.67 (0.22) bc 0.61 (0.79) b SD 22.47 (6.50) d 0.73 (0.78) b 0.40 (0.51) b 27.64 (12.16) c 0.63 (0.94) bc 0.59 (0.93) b
LT N 27.97 (5.65) c 0.65 (0.21) b 2.44 (0.56) a 39.37 (9.22) b 0.93 (0.37) ab 0.82 (1.85) a MD 24.06 (10.64) a 0.56 (0.44) a 1.58 (0.60) a 54.52 (7.32) a 1.32 (0.47) a 0.67 (1.85) a SD 38.27 (11.60) b 1.04 (0.46) a 2.14 (0.47) a 44.39 (12.65) b 1.20 (0.48) a 2.57 (0.54) d
WM N 12.73 (1.52) e 0.28 (0.09) c 0.64 (0.34) c 12.75 (3.43) d 0.28 (0.13) d 0.40 (0.01) c MD 12.67 (3.57) e 0.26 (0.09) c 0.72 (0.33) cd 12.34 (4.83) d 0.25 (0.12) d 0.54 (0.01) c SD 12.73 (3.30) e 0.43 (0.67) c 0.78 (0.46) cd 13.04 (4.23) d 0.44 (0.70) d 0.56 (0.01) c
W N 12.73 (3.54) e 0.28 (0.10) c 0.64 (0.31) cd 12.75 (4.31) d 0.28 (0.12) d 0.54 (0.01) c MD 12.52 (3.73) e 0.27 (0.10) c 0.62 (0.35) d 11.82 (4.70) d 0.25 (0.11) d 0.43 (0.01) c SD 12.42 (3.52) e 0.46 (0.70) c 0.60 (0.26) d 11.12 (5.00) d 0.42 (0.69) d 0.42 (0.01) c
GH: Grosmannia huntii, LT: Leptographium terebrantis, WM: Wound + media, W: Wound, N: Normal watering, MD: Medium drought, SD: Severe drought, LL: Lesion length, LL/Ht: Lesion length Seedling height-1, LD: Lesion depth, OL: Occlusion length, OL/Ht: Occlusion length Seedling height-1, OD: Occlusion depth. Means followed by the standard deviation in parenthesis. Numbers followed by different letters within a column indicate significant differences at α = 0.05

Table 4.4 Effects of family and inoculation on the lesion and occlusion length.
Lesion length (mm) Occlusion length (mm) Family Inoculation n n Tolerant G. huntii 58 21.45 (3.65) c 58 25.78 (5.94) b L. terebrantis 50 35.22(10.24) b 50 43.62 (12.91) a
Wound 58 12.74 (3.51) d 58 11.93(4.79) c Wound + media 55 12.76 (2.99) d 55 12.65 (4.17) c
Susceptible G. huntii 58 24.03 (6.84) c 58 29.95 (10.61) b L. terebrantis 55 40.41 (12.99) a 55 49.45 (12.87) a Wound 54 12.34 (3.65) d 54 11.78 (4.64) c Wound + media 51 13.0 (2.92)d 51 4.16 (4.21)c
Means followed by the standard deviation in parenthesis. Numbers followed by different letters within a column indicate significant differences at α = 0.05.
131

Table 4.5 Effect on family x watering treatment x inoculation on lesion depth.
Family Watering treatment Inoculation n Lesion depth (mm) Tolerant Normal G. huntii 18 1.41 (0.70) bcd
L. terebrantis 14 2.55 (0.59) a Wound 20 0.62 (0.38) ef Wound + media 19 0.89 (0.38) cde Moderate drought G. huntii 19 1.65 (0.44) ab L. terebrantis 19 2.29 (0.70) a Wound 19 0.50 (0.23) f Wound + media 16 0.80 (0.29) ef Severe drought G. huntii 21 1.34 (0.51) bcd L. terebrantis 17 2.16 (0.49) a Wound 19 0.66 (0.27) ef Wound + media 20 0.69 (0.36) ef
Susceptible Normal G. huntii 19 1.60 (0.42) ab L. terebrantis 15 2.35 (0.54) a Wound 15 0.66 (0.19) ef Wound + media 14 0.85 (0.30) def Moderate drought G. huntii 18 1.51 (0.65) bc L. terebrantis 19 2.33 (0.50) a Wound 18 0.75 (0.42) ef Wound + media 16 0.65 (0.35) ef Severe drought G. huntii 21 1.45 (0.51) bc L. terebrantis 21 2.13 (0.46) a Wound 21 0.55 (0.24) ef Wound + media 21 0.87 (0.53) def
Means followed by the standard deviation in parenthesis. Numbers followed by different letters within a column indicate significant differences at α = 0.05.
132

Figure 4.9 Mean lesion length produced in seedlings under different watering
treatments. Different letters denote significant differences between watering treatments within each inoculation treatment at α = 0.05.
4.4.3 Seedling volume increment
Watering treatment, family, inoculation, and family x inoculation interaction
significantly affected seedling growth during the experiment (Table 4.2). The susceptible
family (S) grew less than tolerant family (T). This reduction in growth rate cannot be
attributed to the response of different family to fungal inoculation as the growth was not
significantly different between the fungi inoculated and control seedlings. Thus, the
tolerant family has more capability to grow compared to susceptible family. Volume
increment of seedlings under drought stress was low.
WM W GH LT
Treatment
5
10
15
20
25
30
35
40
45
50
Lesio
n le
ngth
(mm
)
Drought Medium drought Normal moisture
a a a a a a
aa
a
a
b
c
133

Table 4.6 Effect of family and inoculation on seedling volume change (SVC).
Family Inoculation n SVC (mm3) Tolerant family G. huntii 62 11.86 (8.51) ab L. terebrantis 56 10.93 (6.28) abc No wound 57 16.97 (10.59) a Wound 61 16.88 (10.76) a Wound + media 63 14.47 (8.66) a Susceptible family G. huntii 61 7.67 (5.52) dc L. terebrantis 59 8.25 (5.84) bcd No wound 59 8.32 (7.45) d Wound 60 8.18 (6.13) dc Wound + media 59 8.50 (5.34) bcd
Means followed by the standard deviation in parenthesis. Numbers followed by different letters within a column indicate significant differences at α = 0.05.
4.4.4 Bud-outbreak number increment
Bud-outbreak was significantly affected by inoculation x watering treatment. The
bud production was not affected by family. The control (NW) had the greatest number of
the buds with no differences among medium drought and normal watering. Seedlings
challenged with G. huntii had significantly fewer buds in the seedling under the severe
drought than that under the high and medium drought. However, the increment in the
number of bud-outbreak was not different in the seedlings inoculated with L. terebrantis
under different watering treatments.
134

Figure 4.10 Mean numbers of bud break in seedlings under different fungal and watering treatments.
NW WM W GH LT
Treatment
0.0
0.5
1.0
1.5
2.0
2.5
3.0
3.5
4.0
Num
ber o
f new
bud
sa
b b
aa
aa a
a
a
b
c
a aa
Drought Medium Drought Normal Moisture
135
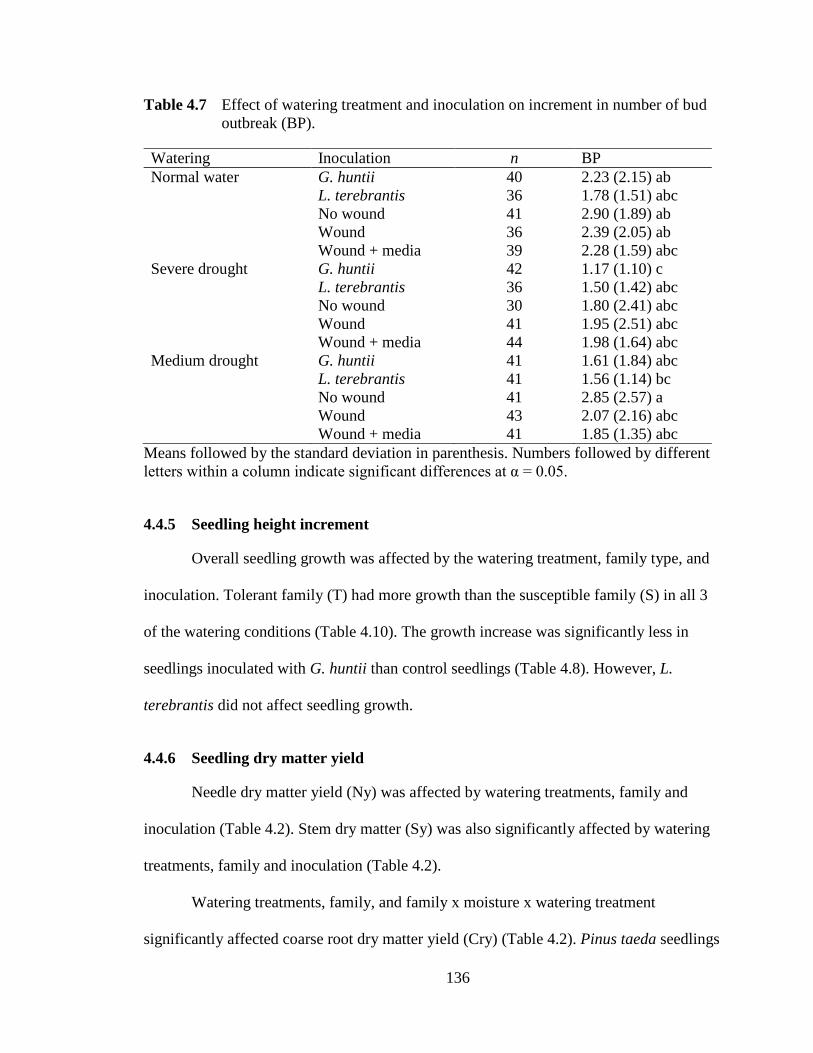
Table 4.7 Effect of watering treatment and inoculation on increment in number of bud outbreak (BP).
Watering Inoculation n BP Normal water G. huntii 40 2.23 (2.15) ab L. terebrantis 36 1.78 (1.51) abc No wound 41 2.90 (1.89) ab Wound 36 2.39 (2.05) ab Wound + media 39 2.28 (1.59) abc Severe drought G. huntii 42 1.17 (1.10) c L. terebrantis 36 1.50 (1.42) abc No wound 30 1.80 (2.41) abc Wound 41 1.95 (2.51) abc Wound + media 44 1.98 (1.64) abc Medium drought G. huntii 41 1.61 (1.84) abc L. terebrantis 41 1.56 (1.14) bc No wound 41 2.85 (2.57) a Wound 43 2.07 (2.16) abc Wound + media 41 1.85 (1.35) abc
Means followed by the standard deviation in parenthesis. Numbers followed by different letters within a column indicate significant differences at α = 0.05.
4.4.5 Seedling height increment
Overall seedling growth was affected by the watering treatment, family type, and
inoculation. Tolerant family (T) had more growth than the susceptible family (S) in all 3
of the watering conditions (Table 4.10). The growth increase was significantly less in
seedlings inoculated with G. huntii than control seedlings (Table 4.8). However, L.
terebrantis did not affect seedling growth.
4.4.6 Seedling dry matter yield
Needle dry matter yield (Ny) was affected by watering treatments, family and
inoculation (Table 4.2). Stem dry matter (Sy) was also significantly affected by watering
treatments, family and inoculation (Table 4.2).
Watering treatments, family, and family x moisture x watering treatment
significantly affected coarse root dry matter yield (Cry) (Table 4.2). Pinus taeda seedlings
136

from susceptible family (S) under severe drought inoculated by L. terebrantis had
significantly lower dry matter yield when compared to both normal watering and moderate
drought. Leptographium terebrantis inoculation resulted in less Cry of the susceptible
family under the normal watering condition. However, under both the moderate and
severe drought, Cry of seedlings inoculated with L. terebrantis did not differ.
Fine root dry matter yield (Fry) was significantly affected by watering treatment,
family, inoculation and watering treatment x inoculation. Drought treatments did not result
in a significant reduction of Fry in the wound, wound + media and no wound inoculated
seedlings. Under normal watering and moderate drought, L. trerebrantis did not reduce
Fry when compared to control seedlings. However, Fry of seedlings inoculated with L.
terebrantis was significantly less than seedlings under severe drought as compared those
under the moderate drought and normal watering condition. Fine root dry matter yield was
not different between the seedlings inoculated with L. terebrantis and G. huntii under any
of the watering conditions (Table 4.11).
The shoot-to-root dry matter yield ratio (Sy/Ry) was significantly different
between the seedlings from two families and three moisture treatments (Table 4.2). The
family considered tolerant to ophiostomatoid fungi had lower Sy/Ry ratio than family
considered susceptible (Table 4.14). Seedlings under severe and moderate drought had
higher Sy/Ry ratio than seedlings receiving normal watering treatment (Table 4.15).
Control and fungal inoculation treatments did not affect Sy/Ry.
Similarly, the coarse-root-to fine root dry matter yield ratio (Cry/Fry) was also
significantly different between seedlings from two families. The family considered
tolerant to ophiostomatoid fungi had significantly higher Cry/Fry ratio than susceptible
137

family. The L. terebrantis inoculated seedlings had higher Cry/Fry ratio than wound
inoculated seedlings (Table 4.14).
Needle-to-fine-root dry matter yield ratio (Ny/Fry) was significantly affected by
watering treatment and fungal inoculation. Seedlings inoculated with G. huntii and L.
terebrantis under severe drought had significantly higher Ny/Fry ratio than that under
normal watering (Table 4.16).
Figure 4.11 Roots of Pinus taeda seedling following harvest; left: Severe drought, right: Medium drought.
138

Figure 4.12 Seedling parts of two different Pinus taeda seedlings grown under different watering treatment. Left: seedling under severe drought and right: seedling under normal watering.
138

140
Table 4.8 Inoculation x family interaction on seedling height, stem dry matter and needle dry matter yield.
Height growth (Ht) Stem dry matter yield (Sy) Needle dry matter yield (Ny) Inoculation Family n cm n (g) n (g) G. huntii T 63 20.7 (10.5) abc 43 2.89 (1.68) c 51 3.47 (2.52) abc S 63 16.0 (10.6) d 43 2.15 (1.27) c 41 3.13 (2.10) abc L. terebrantis T 56 20.3 (8.1) abcd 46 2.98 (1.73) bc 48 3.16 (1.76) bc S 60 15.9 (10.7) d 46 2.52 (1.39) c 55 2.72 (2.41) c Wound T 63 25.2 (10.6) a 41 3.96 (1.24) ab 40 4.46 (2.98) ab S 60 18.3 (8.9) cd 40 2.60 (1.41) c 39 3.23 (2.44) abc Wound + media T 64 23.8 (9.8) abc 43 0.46 (2.03) abc 43 4.60 (2.30) ab S 62 17.9 (12.6) bcd 42 2.30 (1.09) c 44 3.15 (1.71) abc No wound T 58 26.6 (10.1) ab 42 4.35 (2.35) a 44 4.99 (3.99) a S 60 18.2 (10.6) d 44 2.30 (1.09) c 45 3.07 (2.79) bc
Means followed by the standard deviation in parenthesis. Numbers followed by different letters within a column indicate significant differences at α = 0.05.

141
Table 4.9 Inoculation x family interaction on fine and coarse root dry matter yield.
Fine root dry matter yield (Fry) Coarse root dry matter yield (Cry) Inoculation Family n (g) n (g) G. huntii Tolerant 43 0.58 (0.61) ab 43 0.88 (0.65) abcd Susceptible 41 0.33 (0.41) b 41 0.51 (0.42) d L. terebrantis Tolerant 44 0.49 (0.44) b 44 1.20 (1.03) a Susceptible 47 0.35 (0.45) b 47 0.53 (0.38) d Wound Tolerant 41 0.87 (0.95) a 41 1.06 (0.67) ab Susceptible 41 0.52 (0.52) ab 41 0.57 (0.50) cd Wound + media Tolerant 43 0.60 (0.47) ab 43 0.98 (0.69) abcd Susceptible 41 0.40 (0.26) ab 41 0.61 (1.11) bcd No wound Tolerant 45 0.88 (0.92) a 45 1.04 (0.72) abc Susceptible 44 0.54 (0.68) ab 45 0.59 (0.58) cd
Means followed by the standard deviation in parenthesis. Numbers followed by different letters within a column indicate significant differences at α = 0.05.
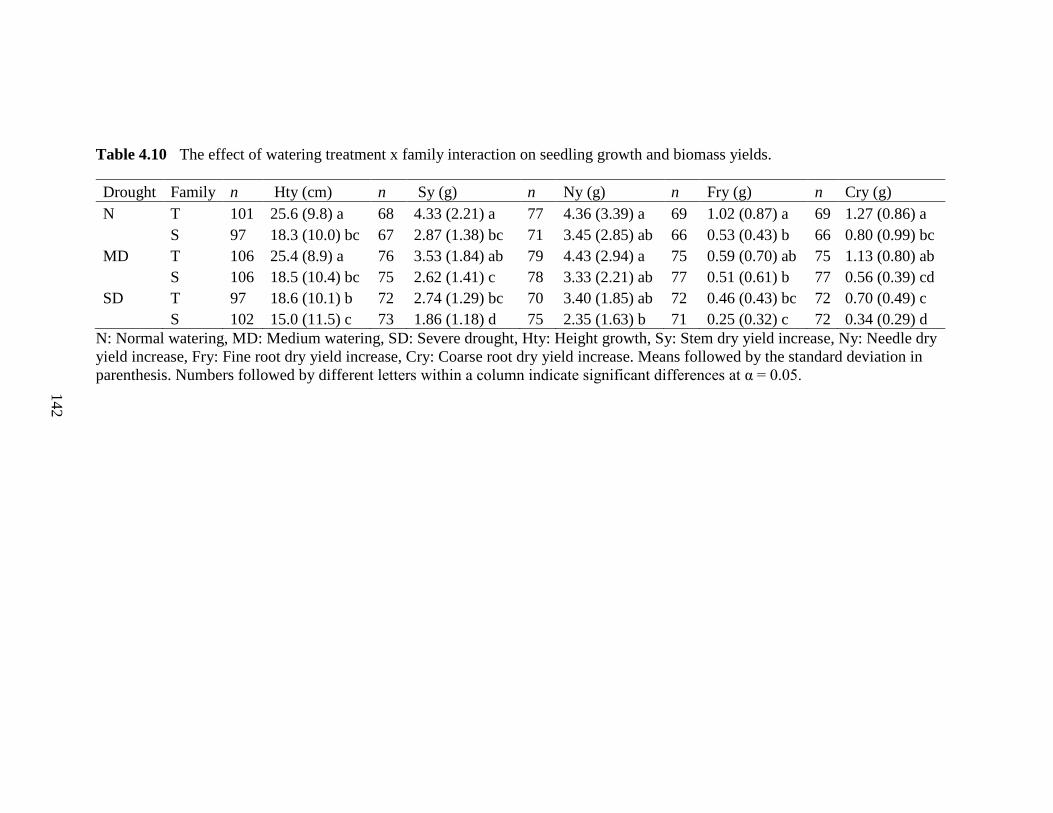
142
Table 4.10 The effect of watering treatment x family interaction on seedling growth and biomass yields.
Drought Family n Hty (cm) n Sy (g) n Ny (g) n Fry (g) n Cry (g) N T 101 25.6 (9.8) a 68 4.33 (2.21) a 77 4.36 (3.39) a 69 1.02 (0.87) a 69 1.27 (0.86) a S 97 18.3 (10.0) bc 67 2.87 (1.38) bc 71 3.45 (2.85) ab 66 0.53 (0.43) b 66 0.80 (0.99) bc MD T 106 25.4 (8.9) a 76 3.53 (1.84) ab 79 4.43 (2.94) a 75 0.59 (0.70) ab 75 1.13 (0.80) ab S 106 18.5 (10.4) bc 75 2.62 (1.41) c 78 3.33 (2.21) ab 77 0.51 (0.61) b 77 0.56 (0.39) cd SD T 97 18.6 (10.1) b 72 2.74 (1.29) bc 70 3.40 (1.85) ab 72 0.46 (0.43) bc 72 0.70 (0.49) c S 102 15.0 (11.5) c 73 1.86 (1.18) d 75 2.35 (1.63) b 71 0.25 (0.32) c 72 0.34 (0.29) d
N: Normal watering, MD: Medium watering, SD: Severe drought, Hty: Height growth, Sy: Stem dry yield increase, Ny: Needle dry yield increase, Fry: Fine root dry yield increase, Cry: Coarse root dry yield increase. Means followed by the standard deviation in parenthesis. Numbers followed by different letters within a column indicate significant differences at α = 0.05.

Table 4.11 The effect of watering treatment x inoculation interaction on fine root dry matter yield (Fry).
Watering Inoculation n Fine root dry yield (g) Normal water G. huntii 26 0.80 (0.56) a
L. terebrantis 27 0.60 (0.49) ab No wound 32 0.78 (0.81) ab Wound 24 1.17 (1.09) a Wound + media 26 0.60 (0.39) ab
Severe drought G. huntii 30 0.24 (0.32) bc L. terebrantis 32 0.17 (0.33) c No wound 23 0.52 (0.43) ab Wound 30 0.49 (0.47) ab Wound + media 28 0.40 (0.30) ab
Medium drought G. huntii 28 0.38 (0.55) ab L. terebrantis 32 0.52 (0.42) ab No wound 34 0.78 (1.02) a Wound 28 0.51 (0.55) ab
Wound + media 30 0.51 (0.45) ab Means followed by the standard deviation in parenthesis. Numbers followed by different letters within a column indicate significant differences at α = 0.05.
143
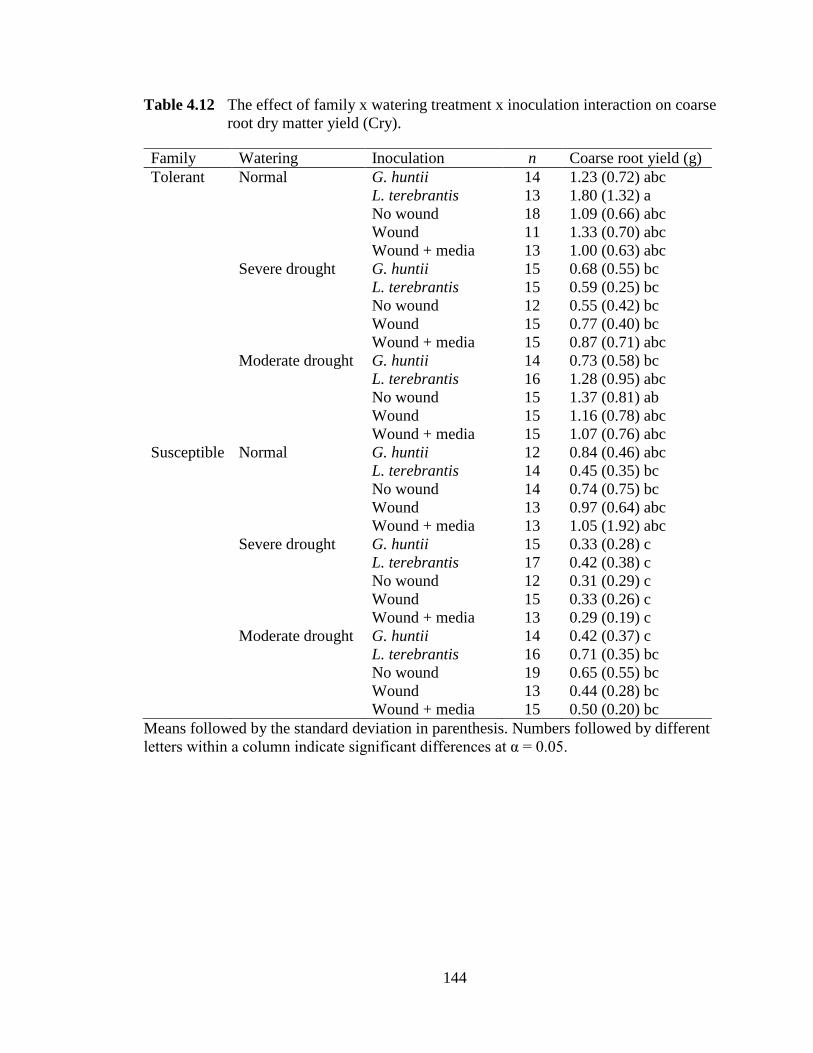
Table 4.12 The effect of family x watering treatment x inoculation interaction on coarse root dry matter yield (Cry).
Family Watering Inoculation n Coarse root yield (g) Tolerant Normal G. huntii 14 1.23 (0.72) abc
L. terebrantis 13 1.80 (1.32) a No wound 18 1.09 (0.66) abc Wound 11 1.33 (0.70) abc Wound + media 13 1.00 (0.63) abc Severe drought G. huntii 15 0.68 (0.55) bc L. terebrantis 15 0.59 (0.25) bc No wound 12 0.55 (0.42) bc Wound 15 0.77 (0.40) bc Wound + media 15 0.87 (0.71) abc Moderate drought G. huntii 14 0.73 (0.58) bc L. terebrantis 16 1.28 (0.95) abc No wound 15 1.37 (0.81) ab Wound 15 1.16 (0.78) abc Wound + media 15 1.07 (0.76) abc
Susceptible Normal G. huntii 12 0.84 (0.46) abc L. terebrantis 14 0.45 (0.35) bc No wound 14 0.74 (0.75) bc Wound 13 0.97 (0.64) abc Wound + media 13 1.05 (1.92) abc Severe drought G. huntii 15 0.33 (0.28) c L. terebrantis 17 0.42 (0.38) c No wound 12 0.31 (0.29) c Wound 15 0.33 (0.26) c Wound + media 13 0.29 (0.19) c Moderate drought G. huntii 14 0.42 (0.37) c L. terebrantis 16 0.71 (0.35) bc No wound 19 0.65 (0.55) bc Wound 13 0.44 (0.28) bc Wound + media 15 0.50 (0.20) bc
Means followed by the standard deviation in parenthesis. Numbers followed by different letters within a column indicate significant differences at α = 0.05.
144

Table 4.13 Shoot-to-root and coarse-to-fine-root dry matter yield ratio (Sy/Ry) of different families.
Family n Sy/Ry n Cry/Fry (log) Tolerant 202 1.56 (0.62) a 202 0.49 (1.09) a Susceptible 198 1.87 (0.73) b 184 0.26 (0.96) b
Means followed by the standard deviation in parenthesis. Numbers followed by different letters within a column indicate significant differences at α = 0.05.
Table 4.14 Coarse-to-fine-root dry matter yield ratio (Cry/Fry) of different inoculation treatment.
Inoculation n Cry/Fry (log) G. huntii 70 0.33 (1.07) ab L. terebrantis 83 0.68 (1.10) a No wound 81 0.33 (1.02) ab Wound 77 0.24 (0.98) b Wound + media 75 0.27 (0.94) ab
Means followed by the standard deviation in parenthesis. Numbers followed by different letters within a column indicate significant differences at α = 0.05.
Table 4.15 Effect of different watering treatment on shoot-to-root dry matter yield ratio (S/R).
Watering treatment n S/R (log) Normal watering 130 1.51 (0.69) b Medium drought 141 1.72 (0.70) a Severe drought 129 1.89 (0.63) a
Means followed by the standard deviation in parenthesis. Numbers followed by different letters within a column indicate significant differences at α = 0.05.
145

Table 4.16 Effect of watering treatment x inoculation on needle-to-fine-root dry matter yield ratio (Ny/Fry).
Watering treatment Inoculation n Ny/Fry (log) Normal watering G. huntii 24 1.43 (1.21) c
L. terebrantis 26 1.61 (0.96) c No wound 29 1.83 (1.35) bc Wound 23 1.69 (0.92) bc Wound + media 25 2.00 (1.07) abc
Severe drought G. huntii 22 2.52 (1.38) ab L. terebrantis 25 2.69 (1.01) a No wound 20 1.96 (0.58) abc Wound 26 1.84 (0.88) abc Wound + media 24 1.98 (0.76) abc
Medium drought G. huntii 21 2.16 (0.56) abc L. terebrantis 31 1.92 (0.83) abc No wound 32 1.87 (1.14) abc Wound 21 2.34 (0.87) abc Wound + media 27 2.10 (0.77) abc
Means followed by the standard deviation in parenthesis. Numbers followed by different letters within a column indicate significant differences at α = 0.05.
4.4.7 Needle greenness and needle chlorophyll content
The needle greenness was significantly different between the inoculation
treatments (P = <0.0001). Seedlings treated with L. terebrantis and G. huntii had
significantly lower needle greenness (Table 4.17). However, the watering treatment did
not significantly impact needle greenness (Table 4.2). The needle chlorophyll content
was not significantly affected by fungi (P = 0.52671), watering treatment, or watering
treatment x inoculation interaction (F (1, 35) = 0.97, P = 0.43770).
146

Table 4.17 The effect of inoculation treatment on needle greenness.
Inoculation treatment n Needle greenness G. huntii 64 42.21 (10.62) b L. terebrantis 63 41.48 (1.96) b No wound 62 50.76 (8.27) a Wound 61 51.71 (10.04) a Wound + media 65 52.19 (10.10) a
Means followed by the standard deviation in parenthesis. Numbers followed by different letters within a column indicate significant differences at α = 0.05.
4.4.8 Pre-dawn water potential measurement
Pre-dawn needle water potential (Ψpd) was significantly affected by inoculation,
(P = 0.00218) (Table 4.2). Seedlings inoculated with L. terebrantis and G. huntii had
significantly more negative Ψpd than the no wound seedlings (Table 4.18). However,
fungal inoculation did not cause significantly negative water potential than wound and
wound + media controls.
Table 4.18 The effect of inoculation treatment interaction on water potential (Ψpd).
Inoculation treatment n Ψpd (-Mpa) G. huntii 19 7.53 (2.37) a L. terebrantis 18 7.52 (1.95) a No wound 21 5.12 (1.49) b Wound 15 5.92 (2.32) ab Wound + media 19 6.29 (1.53) ab
Means followed by the standard deviation in parenthesis. Numbers followed by different letters within a column indicate significant differences at α = 0.05.
4.4.9 Relative water content
The relative water content (RWC) was significantly affected by watering
treatments (Table 4.2). However, it was not significantly affected by the inoculation,
family type and any of the interaction. Seedling under moderate drought had significantly
low needle relative water content than the normal watering condition and severe drought
(Table 4.19).
147

Table 4.19 The effect of watering treatments on relative water content.
Watering treatment n Relative water content (RWC) Normal water 47 84.18 (10.63) a Severe drought 51 82.48 (8.19) a Moderate drought 52 76.79 (9.86) b
Means followed by the standard deviation in parenthesis. Numbers followed by different letters within a column indicate significant differences at α = 0.05.
4.5 Discussion
The relative susceptibility of P. taeda families to vascular-inhabiting
ophiostomatoid fungi is not influenced by different watering conditions. The tolerant
family grew better than the susceptible family selected for susceptibility. Leptographium
terebrantis was consistently more virulent as determined by lesion length to P. taeda than
G. huntii. There was an interaction between watering and inoculation treatment in case of
lesion length and occlusion length. Previous studies by Matusick et al. (2008) and
Chieppa et al. (2017) did not find any evidence of soil moisture and fungal interaction.
The virulence of L. terebrantis when inoculated into seedlings (in terms of LL/Ht,
LD, and OD) increased under severe drought condition. Virulence of G. huntii (in terms
of lesion and occlusion), however, remained same under different watering conditions.
Salle et al. (2008) reported longer length by L. yunnanense in moderately water-stressed
P. yunnanenesis (Franch.). We observed similar results only in terms of occlusion length.
In contrast, Christiansen and Glosli (1996) reported that phloem damage and blue
staining due to Ceratocystis polonica was greater in the well-watered trees than in the
water-stressed trees. This difference in result between their study and the present study
might be due to the variation in the species-specific threshold.
Virulence of G. huntii was increased regarding bud outbreak and Fry. Bud
outbreak and Fry as a measure of seedling productivity was significantly lower in
148

seedlings inoculated with G. huntii under severe drought, nevertheless, LL/Ht and OL/Ht
ratio caused by the fungi did not differ between three watering conditions. This suggests
that virulence of G. huntii increases to some extend under severe drought. Matusick et al.
(2008) found no evidence in bud-break in P. palustris Mill. inoculated with G. alacris
(formerly G. serpens) under varying soil moisture regimes at 16 weeks. This difference in
result between our study and their study may be due to species-specific response.
The infection by vascular-inhabiting fungi L. terebrantis was likely to affect
seedling health under severe drought through increased investment of seedling in LL/Ht
and reduction in fine root dry yield (in both families) and coarse root dry matter yield (in
the susceptible family). However, G. huntii inoculated seedlings under drought did not
show increased defense responses to inoculated fungi than compared to the seedlings
under the normal watering and moderate drought conditions. Also, the seedlings growth
parameters were not different between the control inoculated and the fungal inoculated
seedling. Thus, this may suggest that fungus L. terebrantis may utilize more resources of
the plant under drought conditions (Oliva et al. 2014) and fungus G. huntii may affect the
plant health independent of the drought (Chieppa et al., 2017).
Localized damage to the vascular conducting tissue was observed in inoculated P.
taeda seedlings. The spread of the fungal mycelium into the sapwood might have caused
damage to the tracheid walls. Such damage can result in cavitation and embolism
(Zimmermann, 1983). The xylem blockage can be irreversible due to resin deposition and
tyloses formation. Complete xylem blockage in some of the seedlings under severe
drought treatment was observed. In such seedlings, surprisingly, the development of the
new tissues (Figure 4.7) on the opposite side of the fungal inoculation which would have
149

helped in the survival of the plant. However, the growth of the tissues around the fungi
inoculated side was completely halted. It could be an adaptive trait of P. taeda that would
allow the plant to be decoupled from drought as well as pathogen stress. Moreover, the
growth of such seedlings was halted suggesting a potential tradeoff between this adaptive
trait and plant growth.
Both the present study and few additional studies indicate that in general, the
family chosen for tolerance to ophiostomatoid fungi should have more growth potential
in terms of seedling volume change and height increment e.g., Chieppa et al. (2015) and
Chieppa et al. (2017). Pinus taeda families used in the studies above and in the current
study were the same. Therefore, it is not surprising that the results between studies were
similar. Inoculated and non-inoculated controls did not show any difference in growth
potential suggesting wound and media do not have any effect on seedling growth. Taken
together, the previous studies and present together show some support for the higher
growth potential of tolerant families. Other indicators of plant growth (increment in the
number of new bud-break) was not different between the two families.
The tolerant family tended to yield more stem and needle dry matter than the
susceptible family. Stem and needle dry weight yield was less under severe drought
conditions when compared to the normal water. To our knowledge, this is the first study
to show a two-way interaction of watering x inoculation (in terms of fine root dry matter
yield) and three-way interaction of watering treatment x family x inoculation (in terms of
coarse root dry matter yield) in P. taeda under different watering treatments. Here, L.
terebrantis caused less coarse root biomass yield in severe drought conditions. The
results of our study have been supported by that of Croisé et al. (2001). Unlike, Croisé et
150

al. (2001) we only performed single point inoculation. Massive inoculation of the fungi
might lead to more detrimental effects on the P. taeda seedlings.
The seedlings inoculated with L. terebrantis under severe drought allocated
significantly little biomass to roots as compared to other seedlings within same or other
watering treatments. The allocation of biomass to shoot increases above and root
decreases under adverse environmental conditions. Survival of plant decreases as this
aboveground and belowground biomass ratio reaches a certain threshold. Above that
threshold, evaporative surface (needles) increases as compared to the absorbing root
surface (Cregg, 1994). Adversely, high root-to-shoot-ratio implies that the plant has the
capability to cope with the drought. As the number or the length of the root increases
larger soil volume can be accessed to extract more available water (Niu et al., 2008).
Inoculation of L. terebrantis and G. huntii result in a decrease in the needle
greenness as compared to the control seedlings. Our results are in contrast with the
previous studies performed by Chieppa et al. (2017) where they did not report any
decrease in needle greenness. This discrepancy between the present study and previous
study might be due to the longer study duration deployed in our study.
Inoculated P. taeda had lower needle water potential than the control treatments.
While some seedlings inoculated with L. terebrantis and G. huntii in severe drought had
water potential values lower than -1.4 MPa, no strong overall pattern was observed. The
vulnerability of seedling to physiological damage may depends on individual seedling
vigor. For example, it has been postulated that xylem embolism and cavitation occurs at
low soil moisture levels (Croisé et al., 2001). For instance, the xylem embolism and loss
of hydraulic conductivity begin at -2 MPa xylem water potential in Pinus sylvestris L.
151

(Cochard, 1992). Croisé et al. (2001) reported a drop in hydraulic conductivity and needle
water potential in water stressed Pinus sylvestris following inoculation with L.
wingfieldii. A similar trend was not observed in the present study.
Future studies should be focused on longer-term monitoring of the fungal
inoculated P. taeda seedlings under projected climate change scenario such as drought,
increase in temperature and CO2. The damage on an ecological scale might be higher
than what we observed in our controlled study as we know that the mass attack of the
beetles occurs in trees pre-stressed with drought in the natural scenario. Thus, mass
inoculation of the fungi in the stressed mature P. taeda trees can provide a better
understanding of host-microbe and environment interactions.
4.6 References
Adams, H. D., Germino, M. J., Breshears, D. D., Barron‐Gafford, G. A., Guardiola‐Claramonte, M., Zou, C. B., and Huxman, T. E. (2013). Nonstructural leaf carbohydrate dynamics of Pinus edulis during drought‐induced tree mortality reveal role for carbon metabolism in mortality mechanism. New Phytologist, 197(4), 1142-1151.
Bonan, G. B. (2008). Forests and climate change: forcings, feedbacks, and the climate
benefits of forests. science, 320(5882), 1444-1449. Cailleret, M., Nourtier, M., Amm, A., Durand-Gillmann, M., and Davi, H. (2014).
Drought-induced decline and mortality of silver fir differ among three sites in Southern France. Annals of Forest Science, 71(6), 643-657.
Carnicer, J., Coll, M., Ninyerola, M., Pons, X., Sanchez, G., and Penuelas, J. (2011).
Widespread crown condition decline, food web disruption, and amplified tree mortality with increased climate change-type drought. Proceedings of the National Academy of Sciences, 108(4), 1474-1478.
Chieppa, J., Chappelka, A., and Eckhardt, L. (2015). Effects of tropospheric ozone on
loblolly pine seedlings inoculated with root infecting ophiostomatoid fungi. Environmental Pollution, 207, 130-137.
152

Chieppa, J., Eckhardt, L., and Chappelka, A. (2017). Simulated Summer Rainfall Variability Effects on Loblolly Pine (Pinus taeda) Seedling Physiology and Susceptibility to Root-Infecting Ophiostomatoid Fungi. Forests, 8(4), 104.
Christiansen, E., and Glosli, A. M. (1996). Mild drought enhances the resistance of
Norway spruce to a bark beetle-transmitted blue-stain fungus. United States Department of Agriculture Forest Service general technical report, NC. 192-199.
Cochard, H. (1992). Vulnerability of several conifers to air embolism. Tree
physiology, 11(1), 73-83. Cregg, B. M. (1994). Carbon allocation, gas exchange, and needle morphology of Pinus
ponderosa genotypes known to differ in growth and survival under imposed drought. Tree Physiology, 14(7), 883-898.
Croisé, L., Lieutier, F., Cochard, H., and Dreyer, E. (2001). Effects of drought stress and
high density stem inoculations with Leptographium wingfieldii on hydraulic properties of young Scots pine trees. Tree Physiology, 21(7), 427-436.
Eckhardt, L. G., Goyer, R. A., Klepzig, K. D., and Jones, J. P. (2004). Interactions of
Hylastes species (Coleoptera: Scolytidae) with Leptographium species associated with loblolly pine decline. Journal of economic entomology, 97(2), 468-474.
Eckhardt, L. G., Weber, A. M., Menard, R. D., Jones, J. P., and Hess, N. J. (2007).
Insect-fungal complex associated with loblolly pine decline in central Alabama. Forest Science, 53(1), 84-92.
Eckhardt, L. G., and Menard, R. D. (2008). Topographic features associated with loblolly
pine decline in central Alabama. Forest ecology and management, 255(5), 1735-1739.
Eckhardt, L., Sword Sayer, M. A., and Imm, D. (2010). State of pine decline in the
southeastern United States. Southern Journal of Applied Forestry, 34(3), 138-141. Guo, X. Y., Zhang, X. S., and Huang, Z. Y. (2010). Drought tolerance in three hybrid
poplar clones submitted to different watering regimes. Journal of Plant Ecology, rtq007.
IPCC (2013). Climate Change 2013: The Physical Science Basis. Contribution of Working Group I to the Fifth Assessment Report of the Intergovernmental Panel on Climate Change (IPCC). Cambridge University Press, Cambridge, UK and New York, NY, USA, 1535 pp.
Klos, R. J., Wang, G. G., Bauerle, W. L., and Rieck, J. R. (2009). Drought impact on
forest growth and mortality in the southeast USA: an analysis using Forest Health and Monitoring data. Ecological Applications, 19(3), 699-708.
153
Lindberg, M., and Johansson, M. (1992). Resistance of Picea abies seedlings to infection
by Heterobasidion annosum in relation to drought stress. Forest Pathology, 22(2), 115-124.
Manion, P.D. (1981). Decline diseases of complex biotic and abiotic origin. In: Tree
Disease Concepts. Prentice Hall, Englewood Cliffs, NJ, pp. 324–339, 399p. Maggard, A., Will, R., Wilson, D., and Meek, C. (2016). Response of Mid-Rotation
Loblolly Pine (Pinus taeda L.) Physiology and Productivity to Sustained, Moderate Drought on the Western Edge of the Range. Forests, 7(9), 203.
Matusick, G., and Eckhardt, L. G. (2010). The pathogenicity and virulence of four
Ophiostomatoid fungi on young Longleaf pine trees. Canadian Journal of Plant Pathology, 32(2), 170-176.
Matusick, G., Eckhardt, L. G., and Enebak, S. A. (2008). Virulence of Leptographium
serpens on longleaf pine seedlings under varying soil moisture regimes. Plant Disease, 92(11), 1574-1576.
McDowell, N. G., Beerling, D. J., Breshears, D. D., Fisher, R. A., Raffa, K. F., and Stitt,
M. (2011). The interdependence of mechanisms underlying climate-driven vegetation mortality. Trends in ecology and evolution, 26(10), 523-532.
McDowell, N. G., Ryan, M. G., Zeppel, M. J., and Tissue, D. T. (2013). Feature:
Improving our knowledge of drought‐induced forest mortality through experiments, observations, and modeling. New Phytologist, 200(2), 289-293.
Nevill, R. J., Kelley, W. D., Hess, N. J., & Perry, T. J. (1995). Pathogenicity to loblolly
pines of fungi recovered from trees attacked by southern pine beetles. Southern Journal of Applied Forestry, 19(2), 78-83.
Niu, G., Rodriguez, D. S., and Mackay, W. (2008). Growth and physiological responses
to drought stress in four oleander clones. Journal of the American Society for Horticultural Science, 133(2), 188-196.
Noormets, A., Gavazzi, M. J., McNulty, S. G., Domec, J. C., Sun, G. E., King, J. S., and
Chen, J. (2010). Response of carbon fluxes to drought in a coastal plain loblolly pine forest. Global Change Biology, 16(1), 272-287.
Oliva, J., Stenlid, J., and Martínez‐Vilalta, J. (2014). The effect of fungal pathogens on
the water and carbon economy of trees: implications for drought‐induced mortality. New Phytologist, 203(4), 1028-1035.
154

Peng, C., Ma, Z., Lei, X., Zhu, Q., Chen, H., Wang, W., Liu. S., Li. W., Fang. Xiuqin ., and Zhou, X. (2011). A drought-induced pervasive increase in tree mortality across Canada's boreal forests. Nature climate change, 1(9), 467-471.
Poudel, J., Henderson, J. E., and Munn, I. A. (2016). Economic contribution of hunting
expenditure to the southern United States of America. International Journal of Environmental Studies, 73(2), 236-254.
Raffa, K. F., Aukema, B. H., Bentz, B. J., Carroll, A. L., Hicke, J. A., Turner, M. G., and
Romme, W. H. (2008). Cross-scale drivers of natural disturbances prone to anthropogenic amplification: the dynamics of bark beetle eruptions. Bioscience, 58(6), 501-517.
Salle, A., Ye, H., Yart, A., and Lieutier, F. (2008). Seasonal water stress and the resistance of Pinus yunnanensis to a bark-beetle-associated fungus. Tree physiology, 28(5), 679-687.
Sinclair, W.A. (1966). Decline of hardwoods: possible causes. Proc. Int. Shade Tree
Conf. 42, 17–32. Singh, A., Anderson, D., and Eckhardt, L. G. (2014). Variation in resistance of Loblolly
pine (Pinus taeda L.) families against Leptographium and Grosmannia root fungi. Forest Pathology, 44(4), 293-298.
Turtola, S., Manninen, A. M., Rikala, R., and Kainulainen, P. (2003). Drought stress
alters the concentration of wood terpenoids in Scots pine and Norway spruce seedlings. Journal of chemical ecology, 29(9), 1981-1995.
Van Mantgem, P.J., Stephenson, N.L., Byrne, J.C., Daniels, L.D., Franklin, J.F., Fulé,
P.Z., Harmon, M.E., Larson, A.J., Smith, J.M., Taylor, A.H. and Veblen, T.T. (2009). Widespread increase of tree mortality rates in the western United States. Science, 323(5913), pp.521-524.
Wang, H., Fu, R., Kumar, A., and Li, W. (2010). Intensification of summer rainfall
variability in the southeastern United States during recent decades. Journal of Hydrometeorology, 11(4), 1007-1018.
Yadeta K, Thomma B. 2013. The xylem as battleground for plant hosts and vascular wilt
pathogens. Frontiers in Plant Science 4: art no. 97. Zimmermann, M.H. 1983. Xylem structure and the ascent of sap. Springer-Verlag, Berlin,
143 p
155

CHAPTER V
Towards Biocontrol of Blue-Stain Fungi by Plant Growth-Promoting Rhizobacteria
5.1 Abstract
Leptographium terebrantis, Grosmannia huntii and G. alacris cause blue-staining
of wood and also are associated with the decline of Pinus species in the southeastern U.S.
Twenty-nine plant growth-promoting rhizobacteria (PGPR) were tested for antibiosis
against these ophiostomatoid fungi in vitro. Three PGPR strains were tested for their
capacity to induce resistance of P. taeda L. to these fungi by co-treating seedling with
PGPR and fungus in the greenhouse. The dark necrotic tissue around fungal inoculation
sites and seedling biomass were measured after 8 weeks. In antibiosis test, all PGPR
strains inhibited the growth of the three fungal pathogens. In greenhouse assay, PGPR
treated P. taeda resulted in higher plant biomass and smaller necrotic tissue. In
conclusion, tested PGPR strains have potential as biocontrol agents.
5.2 Introduction
Plant growth-promoting rhizobacteria (PGPR) consist of symbiotic rhizospheric
bacteria that with the capacity to colonize plant roots, stimulate plant growth (Kloepper
and Schroth, 1978; Chanway et al., 1991; Orhan et al., 2006). They often inhibit
pathogenic microorganisms (Beneduzi et al., 2012; Liu et al., 2016a) or induce systemic
resistance (ISR) of the plant to disease (Liu et al., 2016b; Kumar et al., 2016) and abiotic
156

stresses (Bresson et al., 2013; Egamberdieva and Lugtenberg, 2014). Specific strains of
PGPR induce systemic resistance of plants against fungal (Liu et al., 2016b; Enebak and
Carey, 2000), bacterial (Liu et al., 1995) and viral (Raupach et al., 1996) diseases as well
as insects (Zehnder et al., 1997) and nematodes (Kokalis-Burelle et al., 2003). PGPR
have the ability to compete with other microorganisms for nutrients and space (Liu et al.,
2017). PGPR inhibit other microbes by producing antibiotics such as pyrrolnitrin and
pyocyanine, and as well as siderophores which limit the iron required for the growth of
pathogens (Ramamoorthy et al., 2001). More specifically, PGPR strains can act against
fungal pathogens by the producing lytic enzymes such as chitinases and B-1, 3-
glucanases which degrade chitin and glucan present in the fungal cell wall by specific
PGPR isolates (Ramamoorthy et al., 2001).
The use of microbes, including PGPR (Plant Growth Promoting Rhizobacteria),
as a biological control method and, is an environmentally friendly approach (Lugtenberg
and Kamilova, 2009) to disease control, and their use is steadily increasing globally
(Lugtenberg, 2014). Dunham (2016) has projected the market of biocontrol to reach 5
billion dollars by 2020. Adoption of PGPR as a biocontrol in agriculture offers an
attractive way to replace chemical fertilizers, pesticides and other supplements
(Ashrafuzzaman et al., 2009). Also, PGPR strains with a broad spectrum of activity
protect plant through multiple mechanisms (Liu et al., 2017) which are unachievable by
other chemical and management treatments (Beneduzi et al., 2012; Iturritxa et al., 2017).
Recently, application of PGPR is gaining attention in agroforestry (Chanway, 1997;
Enebak and Carey, 2000; Enebak, 2005; Iturritxa et al., 2017). Specific isolates of PGPR
157

have shown effectiveness against sap-stain fungi and wood decaying fungi (Seifert et al.,
1987).
Leptographium terebrantis S.J. Barras and T.J. Perry, L. procerum Kendrick M.J.
Wingfield and Grosmannia huntii R. C. Rob. Jeffr is among the ophiostomatoid fungi
associated with the decline of Pinus species in the southern U.S. (Eckhardt et al., 2007).
These ophiostomatoid fungi infect Pinus root, cause the lesion, thrive in vascular tissues,
and further disturb plant hydraulic conductance (Wingfield, 1988; Matusick et al., 2010;
Hammerbacher et al., 2013; Oliva et al., 2014). Furthermore, they cause blue-stain which
reduce the aesthetic value of wood leading to a significant economic loss in the timber
industries (Bruce et al., 2003). Taking into account, high risk of these fungal pathogens, it
is essential to advance rapidly in understanding the efficient control measures.
The understanding of the activity of the PGPR towards blue-staining
ophiostomatoid fungi could be beneficial to overcome the root disease and pine decline
problems. Thus, the overall aim of this study was to understand the possibility of using
PGPR to control the harmful effects of blue-staining fungi on P. taeda. The specific
objectives of the study were (i) to assess the antibiosis potential of PGPR strains in vitro
against L. terebrantis, G. huntii and G. alacris by PGPR strains and (ii) to evaluate the
capacity of PGPR strains, Bacillus pumilus (INR7), B. pumilus (SE-34) and Serratia
marcescens (90 -166) to induce systemic resistance of P. taeda to L. terebrantis and G.
huntii.
158

5.3 Methodology
5.3.1 In vitro screening of antagonistic activity
Twenty-eight PGPR strains of B. velezensis and a single strain of Paenibacillus
peoriae and Bacillus altitudinis maintained at PGPR lab culture collection at Department
of Entomology and Plant Pathology at Auburn University, Auburn, Alabama, U.S. (Table
1) were studied. All strains were previously identified using 16S rDNA sequencing with
the comparison to sequences of type strains. The bacteria isolates were stored at -80 °C in
Tryptic Soy Broth (TSB) (Difco Laboratories, Detroit, MI, USA) amended with 30 %
glycerol. Each strain was streaked onto Tryptic Soy Agar (TSA) three days before the
start of the experiment. After incubation at 28 °C for 48 h, purity of the culture was
checked. A single colony (10 µl) of PGPR was inoculated in 25 ml TSB and incubated at
28 °C for 48 h with continuous shaking (150 rpm). Pellets obtained by centrifuging
bacterial cultures at 3500 rpm for 15 min were re-suspended in sterile distilled water at a
concentration of 108 CFU ml-1 (Liu et al., 2016a).
159

Table 5.1 Twenty-nine PGPR strains used in the in vitro antagonism screening.
Strains Identification AP52 Bacillus velezensis AP69 Bacillus altitudinis AP136 Bacillus velezensis AP188 Bacillus velezensis AP194 Bacillus velezensis AP195 Bacillus velezensis AP196 Bacillus velezensis AP197 Bacillus velezensis AP198 Bacillus velezensis AP199 Bacillus velezensis AP200 Bacillus velezensis AP201 Bacillus velezensis AP203 Bacillus velezensis AP208 Bacillus velezensis AP210 Bacillus velezensis AP211 Bacillus velezensis AP212 Bacillus velezensis AP213 Bacillus velezensis AP214 Bacillus velezensis AP218 Bacillus velezensis AP241 Bacillus velezensis AP294 Paenibacillus peoriae AP295 Bacillus velezensis AP296 Bacillus velezensis AP297 Bacillus velezensis AP298 Bacillus velezensis AP301 Bacillus velezensis AP305 Bacillus velezensis H57 Bacillus velezensis
160

5.3.1.1 Preparation of fungal cultures
Three fungi, L. terebrantis (ATCC MYA-3316), G. huntii (ATCC MYA-3311)
and L. procerum (ATCC MYA-3313), maintained at 2 % MEA at 4 °C in the culture
collection of Forest Health Dynamics Laboratory, School of Forestry and Wildlife
Sciences at Auburn University were included in the study. These fungal isolates were
obtained from roots of symptomatic P. taeda and P. palustris Mill. as the method
described by Eckhardt et al. (2007). A description of fungal isolates are provided in Table
5.2. Fourteen days before the experiment these isolates were cultured on 2 % Malt
Extract Agar (MEA) and incubated at room temperature.
Table 5.2 Isolation site and source of fungal isolates used in the study.
Fungi Isolate number (ATCC accession no.)
Isolation site Host Species
Grosmannia huntii LLP-R-02-100 (MYA-3311)
Fort Benning Military Reservation, GA
Pinus palustris
Grosmannia alacris
LOB-R-00-309 (MYA-3315)
Westervelt Company Land, AL
Pinus taeda
Leptographium terebrantis
LOB-R-00-805 (MYA-3316)
Talladega National Forest, Oakmulgee Ranger District, AL
Pinus taeda
5.3.1.2 Antibiosis test
A dual agar plate system was designed to support the growth of PGPR strains and
the challenged fungal pathogen in the same Petri plate (Figure 5.1). These plates had four
holes (13-mm diameter) filled with melted TSA at three equidistant edges in a Potato
Dextrose Agar (PDA) plate. Ten µl of the PGPR suspensions prepared earlier were
inoculated in the TSA following solidification. In the control side of the plate, 10 µl of
161
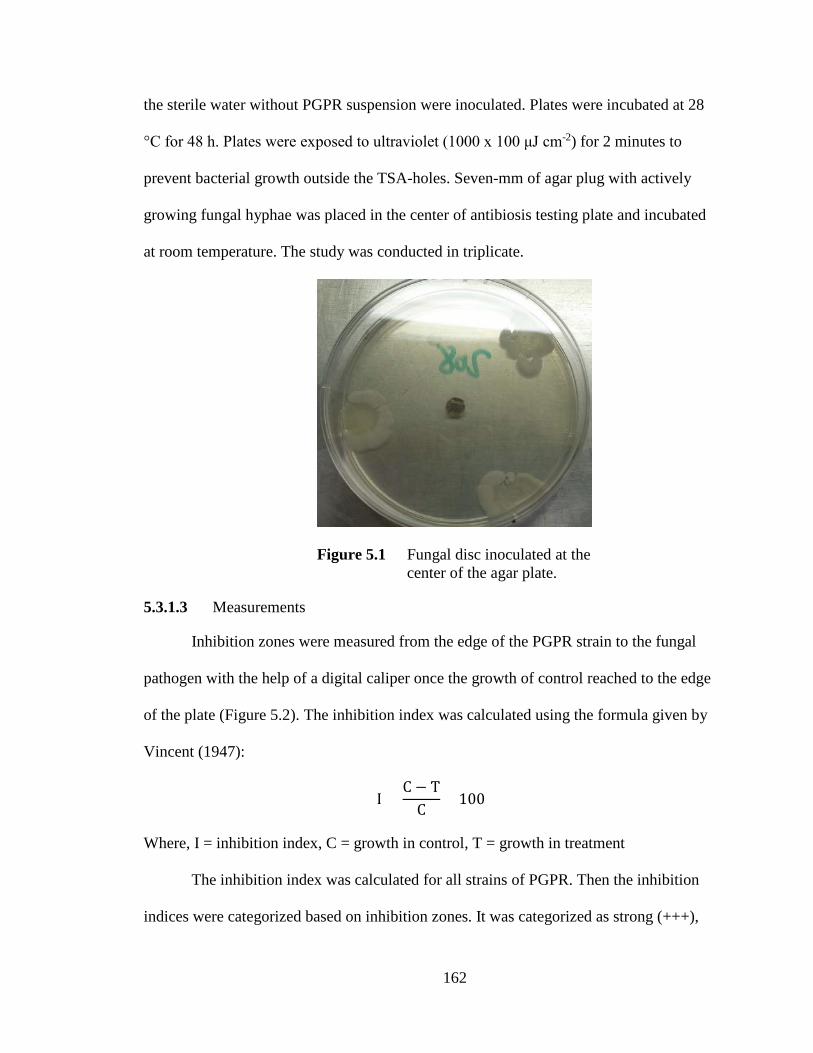
the sterile water without PGPR suspension were inoculated. Plates were incubated at 28
°C for 48 h. Plates were exposed to ultraviolet (1000 x 100 μJ cm-2) for 2 minutes to
prevent bacterial growth outside the TSA-holes. Seven-mm of agar plug with actively
growing fungal hyphae was placed in the center of antibiosis testing plate and incubated
at room temperature. The study was conducted in triplicate.
Figure 5.1 Fungal disc inoculated at the center of the agar plate.
5.3.1.3 Measurements
Inhibition zones were measured from the edge of the PGPR strain to the fungal
pathogen with the help of a digital caliper once the growth of control reached to the edge
of the plate (Figure 5.2). The inhibition index was calculated using the formula given by
Vincent (1947):
I =C − T
C× 100
Where, I = inhibition index, C = growth in control, T = growth in treatment
The inhibition index was calculated for all strains of PGPR. Then the inhibition
indices were categorized based on inhibition zones. It was categorized as strong (+++),
162

medium (++) and weak (+) when I>20%, 10% < I <20% and I<10% respectively
(Wahyudi and Astuti, 2011).
Figure 5.2 Fungal growth inhibited at the three sides.
5.3.2 Induced systemic resistance study
5.3.2.1 Study design
One-year-old P. taeda seedlings were received from Rayonier in January 2016.
Seedlings represented either susceptible (S) or tolerant (T) family to ophiostomatoid
fungi as determined from a study by Singh et al. (2014). Dry biomass of 12 seedlings of
each family was measured by separating needles, stem, coarse root and fine root and
allowing them to dry in the oven at 75 ºC for 72 h. Then 400 seedlings from each family
were planted in one-gallon plastic pots. The potting medium was ProMix BX® (Premier
Tech, Quebec, and Canada) peat-based potting media. The seedlings were kept in the
greenhouse and allowed to acclimatize for 3 months (Figure 5.3). The study was designed
as a completely randomized block design with 3 PGPR and 2 fungal treatment
combinations.
163

Figure 5.3 Loblolly pine seedlings after application of the PGPR and the fungal treatment.
5.3.2.2 PGPR selection
Three PGPR strains: B. pumilus INR7, B. pumilus SE-34 and S. marcescens (90 -
166), previously shown to induce systemic resistance of conifers to fusiform rust (Enebak
and Carey 2000), were included in the study. These strains were obtained from the
culture collection of the PGPR lab maintained at the Department of Entomology and
Plant Pathology at Auburn University, Alabama, U.S. These strains were stored in
Tryptic Soy Broth (TSB) with 30 % glycerol at -80 ºC until used. Pure cultures of PGPR
strains were streaked on TSA plates, three days before inoculations. Suspensions of 108
colony forming unit ml-1 of each rhizobacterial suspension were prepared as described by
Enebak et al. (1998). Seedlings were carefully pulled out and were washed in running tap
164

water. Sixty seedlings of each family were randomly selected, and the root balls were
dipped in each PGPR solution for one hour. Root balls of control seedlings were
immersed in sterile distilled water. Seedlings were carefully replanted following
inoculation.
5.3.2.3 Fungal treatment
Single spore cultures of L. terebrantis (ATCC accession no. MYA-3316) and G.
huntii (ATCC accession no. MYA-3316) were cultured on MEA 14 days before the
inoculation experiment. Two weeks following PGPR inoculation, 30 seedlings of each
family treated with each PGPR were artificially inoculated with each fungus. To
inoculate seedlings, an 8-mm vertical cut (< 2 mm deep) was made in the stem 2 cm
above the soil line. Then a 3-mm plug of agar with actively growing fungal hyphae was
inserted (fungus-side-down) into the cut. The inoculation point was gently wrapped with
a moistened sterile cotton ball and covered with Parafilm® respectively to prevent sudden
desiccation of agar media and prevent any external contamination. The inoculation
experiment was carried out in two replications: one in April 2016 and another in May
2016.
5.3.2.4 Measurements
Eight weeks following fungal inoculation, seedlings were carefully harvested by
clipping each seedling above the soil line. Stems of harvested seedlings were placed in a
solution of stain (FastGreen FCF; Sigma Chemical Co, St. Louis, MO, USA) and water in
a ratio of 0.25 g L-1 for 48 h. Staining allowed easier visualization of infected tissue. The
bark tissue around the inoculation point was scraped, and the length of the necrotic tissue
165

was measured. Biological control efficacy of 3 PGPR strains was calculated using the
following formula:
Biological control efficacy (BCE) = C−TC
× 100
Where, C = average lesion in control, T = average lesion in treatment group
Ten seedlings from each fungal treatment within each family and PGPR treatment
were selected for biomass yield measurements. The seedlings were separated into
needles, stem, coarse root and fine root and dried at 75 °C for 72 h. Whole plant biomass
was calculated by adding the dry weight of all seedling components. Family mean
biomass determined before the start of the experiment was subtracted from each final
seedling biomass to estimate biomass gain by seedlings during the experiment (dry matter
yield). The biological efficacy of 3 PGPR strains for biomass yield was calculated.
5.3.3 Statistical analysis
Data were analyzed by using Proc GLM statement on SAS 9.4 software (SAS
Institute, Cary, NC, USA). Data for lesion and biomass were log transformed. Two-way
analysis of variance was performed on the response variables like lesion and the seedling
biomass. Treatment means were separated by Tukey’s Honest Significant Difference at α
= 0.05.
5.4 Results
5.4.1 In vitro antagonistic activity screening
Growth of the fungal isolates adjacent to PGPR strains were inhibited. The fungi
grew well to the edge of the plate in the control sides. Near the fungal inhibition zone,
fungal sporulation was halted. Different strains of PGPR produced significantly different
inhibition zones to L. procerum (F (28, 232) = 87.08, P = <0.0001), indicating that the
166

ability to inhibit the growth of the fungi varies among strains. Strains AP188 (76.30 %)
and AP195 (76.30 %) had the highest index of inhibition (Table 5.3). Whereas, strain
AP211 (39.26 %) had the lowest inhibition index for L. procerum. Different PGPR
strains showed different antagonistic behavior to L. terebrantis (F (28, 232) = 47.77, P =
<0.0001). Strain AP214 (67.16 %) had the highest inhibition activity, and strain AP69
(9.52 %) had the least inhibition index. The inhibition index for L. terebrantis was lower
than that of the L. procerum. Similarly, the inhibition zones produced for G. huntii also
were significantly different among the PGPR strains (F (28, 232) = 44.35, P = <0.0001).
Strains, AP295 (73.58 %) and AP301 (73.58 %) had the highest inhibition index and
AP69 had the lowest. The inhibition index of all the strains was strong (Table 5.3).
167

Table 5.3 Mean inhibition zone (mm) and inhibition index by 30 PGPR strains to 3 fungi.
Strain N L. procerum L. terebrantis G. huntii Inhibition Index Inhibition Index Inhibition Index AP136 9 12.33 +++ 4.67 ++ 11.78 +++ AP188 9 21.33 +++ 12.44 +++ 16.00 +++ AP194 9 18.44 +++ 7.11 +++ 17.22 +++ AP195 9 21.33 +++ 10.11 +++ 13.33 +++ AP196 9 19.44 +++ 12.78 +++ 14.78 +++ AP197 9 15.11 +++ 12.11 +++ 17.11 +++ AP198 9 9.00 +++ 11.00 +++ 12.78 +++ AP199 9 13.22 +++ 3.44 ++ 18.44 +++ AP200 9 18.89 +++ 7.89 +++ 13.22 +++ AP201 9 9.56 +++ 4.33 +++ 14.89 +++ AP203 9 11.33 +++ 8.33 +++ 16.67 +++ AP208 9 8.44 +++ 8.00 +++ 14.56 +++ AP210 9 9.89 +++ 4.44 ++ 7.67 +++ AP211 9 4.67 +++ 13.44 +++ 12.67 +++ AP212 9 20.56 +++ 11.89 +++ 11.78 +++ AP213 9 20.89 +++ 8.78 +++ 18.11 +++ AP214 9 17.11 +++ 17.22 +++ 16.67 +++ AP218 9 25.22 +++ 11.11 +++ 15.00 +++ AP241 9 13.00 +++ 8.11 +++ 18.89 +++ AP294 9 12.44 +++ 9.33 +++ 19.67 +++ AP295 9 11.89 +++ 13.78 +++ 20.11 +++ AP296 9 20.67 +++ 10.22 ++ 16.11 +++ AP297 9 12.89 +++ 5.89 +++ 14.89 +++ AP298 9 9.33 +++ 5.33 +++ 14.67 +++ AP301 9 18.44 +++ 7.56 +++ 20.11 +++ AP305 9 16.56 +++ 17.00 +++ 16.67 +++ AP52 9 13.56 +++ 15.33 +++ 8.78 +++ AP69 9 5.78 +++ 1.44 + 0.56 + H57 9 8.56 +++ 4.33 ++ 15.33 +++
Index= Inhibition Index (I) [(+++) = strong when I ≥ 20 %, (++) = medium when I < 10 % and I > 20% and (+) = weak when I <10 %)].
168

5.4.2 Resistance Study
5.4.2.1 Infection reduction
The pathogenic fungi caused a dark necrotic lesion in all of the inoculated
seedlings. The lesion length produced by the fungal treatment was significantly different
between the two study periods (F (1, 471) = 15.72, P = <0.0007). Thus, the data were
analyzed individually for each of the replications. Two different P. taeda families did not
produce significantly different (F (1,141) = 2.65, P = 0.1040) lesion length overall. So, the
data were pooled together for further analysis.
In the first replication of the study, L. terebrantis and G. huntii fungi did not
produce significantly different lesion lengths (P = 0.9286) (Table 5.4). Thus, the data
from both of the fungi were pooled together and further analysis was performed for
overall fungi. All the PGPR strains caused significant reductions in the lesion length than
the control. Bacillus pumilus INR7 caused the highest reduction in lesion length (Table
5.5). The strains S. marcescens (90 -166), B. pumilus (INR7), and B. pumilus (SE-34)
reduced the lesion production by 13.26 %, 21.44 %, and 14.73 %, respectively.
In the second replication of the study, lesion length was not different between the
two P. taeda families (F (1, 184) = 1.86, P = 0.1739) (Table 4). However, lesion length was
different among seedlings treated with different PGPR (F (3, 184) = 4.66, P = 0.0036),
indicating that the effect of the PGPR differed between two families. In family S, the
biological efficacy of B. pumulis (INR7) was 10.45 % in terms of lesion reduction.
However, the other two PGPR strains did not cause significantly reduced lesion length
than the control. In family T, the biological efficacy of B. pumilus (INR7) and B. pumilus
169

(SE-34) in terms of lesion reduction was 17.72 % and 11.89 % respectively. However, S.
marcescens (90 -166) did not cause significantly smaller lesion than control (Table 5.5).
Table 5.4 The p-values showing the effect of the independent variables for lesion length.
Replication Source DF F Value Pr > F Replication1 Family 1 1.15 0.2839 Fungi 1 0.01 0.9286 PGPR 3 40.15 <0.0001 Fungi*PGPR 3 1.18 0.3173 Family*PGR 3 0.70 0.5541 Replication 2 Family 1 1.86 0.1739 Fungi 1 5.62 0.0188 PGPR 3 19.45 <0.0001 Fungi*PGPR 3 1.89 0.1328 Family*PGPR 3 4.66 0.0036
Note: PGPR: Plant Growth-Promoting Rhizobacteria treatment, Fungi: Fungal treatment.
Table 5.5 Mean length of the lesion produced by fungi in seedlings inoculated with different PGPR.
Replication 1 Replication 2 Overall Family Family S Family T
PGPR N LL (mm) N LL (mm) N LL (mm) 90 -166 79 18.25 (2.59)a 25 20.77(1.57)ad 25 18.94 (2.24)a INR7 74 16.53 (2.84)b 26 17.83 (2.01)b 26 17.37 (3.20)b SE-34 68 17.93 (2.28)a 24 19.20 (1.63)dc 25 18.60 (1.82)dc Control 71 21.04 (2.34)c 23 19.91 (1.41)a 22 21.11 (1.71)a
Note: LL: Lesion length. Means followed by standard deviation in parenthesis. Different letters indicate that statistical significant differences at α = 0.05, Family S: Susceptible family, Family T: Tolerant family.
5.4.2.2 Biomass yield
The total biomass yield by the seedlings was significantly different between the
replications of the study (F (1, 226) = 103.91, P = <0.0001). Thus, the biomass yield was
calculated separately for each of the replication of study. There was an overall significant
effect of PGPR treatment on biomass yield (F (3,226) = 11.03, P = <0.0001).
170

In the first replication of the study, the biomass gained by two families were
different (F (1,152) = 4.61, P = 0.0334) (Table 5.6). Also, the interaction between the
family and PGPR was significant (P = 0.0055) (Table 5.6) referring that the activity of
PGPR was significantly different among two families. In family S, the biomass of the
seedlings inoculated with B. pumilus (SE-34) was significantly higher than the control. In
family T, mean biomass gain in the seedlings inoculated with all three PGPR was
significantly higher than the control (Table 5.7).
In the second replicate of the study the biomass yield was significantly different
between the families. Family T had higher biomass than family S (P = 0.0093) (Table
5.7). The mean biomass yield of the seedlings treated with PGPR was higher than the
control in both families, although non-significantly (Table 5.8).
Table 5.6 The p-values showing biomass yield for study replicates 1 and 2.
Replication Source DF F value Pr > F Relication 1 (log) Family 1 4.61 0.0334
PGPR 3 8.85 <0.0001 Fungi 1 0.27 0.6226
Fungi*PGPR 3 0.23 0.8435 Family*PGPR 3 4.15 0.0055
Replication 2 (log) Family 1 6.62 0.0093 PGPR 3 0.96 0.2187 Fungi 1 0.62 0.6289 Fungi*PGPR 3 0.31 0.7788 Family*PGPR 3 0.6 0.6178
Note: PGPR: Plant Growth-Promoting Rhizobacteria treatment, Fungi: Fungal treatment.
171

172
Table 5.7 Mean biomass yield of Pinus taeda seedlings inoculated with different PGPR.
Replication 1 Replication 2 Family S Family T Family S Family T
PGPR N Wt (g) N Wt (g) N Wt (g) N Wt (g) 90 - 166 21 7.47 (2.83) ac 18 9.06 (2.59) abc 9 3.22 (0.76) a 10 3.71 (1.41) a INR7 24 6.68 (4.44) ac 20 9.41 (2.56) b 9 2.54 (1.51) a 10 4.19 (2.22) a SE-34 19 8.02 (3.37) ab 20 7.18 (3.14) c 10 3.20 (1.77) a 9 5.00 (2.22) a Control 21 4.98 (1.39) c 21 5.01 (1.58) d 7 2.41 (1.21) a 11 3.28 (1.67) a
Note: LL: Lesion length. Means followed by the standard deviation in parenthesis. Different letters indicate that statistical significant differences at α = 0.05, Family S: Susceptible family, Family T: Tolerant family.

5.5 Discussion
5.5.1 Antibiosis study
The results suggest that the studied PGPR strains have the ability to inhibit the
growth of the ophiostomatoid fungal pathogens in vitro. All the 29 elite strains
outcompeted all three ophiostomatoid fungi. Strains AP195 and AP198 were highly
antagonistic to L. procerum, AP305 to L. terebrantis and AP295 to G. huntii respectively.
These PGPRs were previously shown to have a broad spectrum of antagonistic activity
against foliar pathogens, vascular pathogens and root pathogens (Liu et al., 2016a). Our
results are in agreement with Zhang et al. (2014) who reported that B. subtilis strain B37
exhibited antagonistic activity towards the sap-staining fungi Lasiodiplodia theobromae
and B. subtilis strain C186 towards Ceratocystis sp. and Ophiostoma sp. Similarly,
Gradinger et al. (2009) reported that the filamentous fungi; Trichoderma sp. and
Phlebiopsis gigantica, can inhibit the growth and staining of the fungi Sphaeropsis
sapinea and Ophiostoma minus in both laboratory and field conditions, respectively.
Twenty-seven of the 29 PGPR strains studied in this study were B. velezensis
which are known to contain many strains with potent biocontrol activity (Balhara et al.,
2011; Liu et al., 2016a; Liu et al., 2016b; Liu et al., 2017). These PGPR strains pose a
broad spectrum of activity against plant pathogens from 6 different genera (Liu et al.,
2017). Furthermore, most of these strains were reported to produce five traits related to
plant growth promotion such as nitrogen fixation, phosphate solubalization, indole-3-
acetic acid (IAA production), siderophore production, and biofilm formation. Moreover,
specific strains of B. velezensis have been reported to produce various bioactive
compounds (Ruiz-Garcia, 2005; Yu et al., 2002; Argulles-Arias et al., 2009). It is,
173

therefore, not surprising that all of the tested PGPR strains used in the present study were
antagonistic to the fungal pathogens. Production of bioactive compounds and or other
anti-fungal metabolites might have contributed to the high level of antagonism that we
observed in our study. The study and characterization of these bioactive compounds
might lead to a discovery of novel compounds which can be used by forest product
companies to control the growth of blue stain and other possible fungi that damage wood
products.
This is the first study to show the in vitro antibiosis of blue-stain fungi by strains
of B. velezensis. The dual agar plate study provides a very rapid assay to improve
understanding of the antagonistic activity of the PGPR strains. However, there are cases
where the in vitro and planta studies have been correlated (Gupta et al., 2010; Mesanza et
al., 2016) and have not been correlated (Ran et al., 2005). The PGPR studied in this study
are bacilli. Use of these PGPR may be beneficial in planta under the adverse climatic
condition like drought as bacilli can form dormant endospores which are tolerant to UV
and desiccation (Nicholson, 2002). In the future, the antagonistic ability of rhizobacteria
should be tested both in vitro and in planta.
5.5.2 Induced systemic resistance study
To our knowledge, this is the first study to show certain strains of PGPR can
induce systemic resistance of conifer to L. terebrantis and G. huntii. Furthermore, studied
PGPR strains also have the ability to promote P. taeda growth. Even though co-
inoculation of fungi and PGPR did not induce full resistance against fungal infection in
P. taeda, lesion length caused by fungi in PGPR treated seedlings were relatively longer
than the control (PGPR untreated) seedlings in most cases. Thus, our results are in
174

agreement with similar studies reporting classical ISR against pine tree pathogens. For
example, Enebak and Carey (2000) reported PGPR inoculation reduced that fusiform rust
infection caused by the fungus (Cronartium quercuum f. sp. fusiforme) by 50 % in pine
seedlings. Similarly, Iturritxa et al. (2017) and Mesanza et al. (2016) reported
Pseudomonas fluorescens, Bacillus simplex and Erwinia billingiae isolated from healthy
pine tree promoted the growth and survival of P. radiata against Heterobasidion
annosum and Armallaria malallea, and Fusarium circinatum respectively.
PGPR inoculated P. taeda showed some support for intraspecific variation in
plant growth in terms of biomass gain. The tolerant family (T) not only had the ability to
tolerate the fungal infection but also had the capacity to grow more (in terms of biomass)
than the susceptible family (S). Our results are following Enebak (2005), where he
reported that different rhizobacterial strains had the differential efficacy to promote plant
growth. Furthermore, he suggested that the effect of rhizobacterial inoculations may be
species specific. Our results suggest the effect of rhizobacteria may be intra-specific.
Regarding lesion length, PGPR strain B. pumilus (INR 7) had the highest efficacy
induced plant resistance to the fungal infection. This relatively higher induction
efficiency of a particular strain suggests that potential of PGPR for inducing systemic
resistance against fungal pathogens is rhizobacterial strain-specific.
The biomass yield of the seedlings inoculated with PGPR was significantly higher
in the first replicate of the study. Out results are similar to Shishidio et al. (1996) where
they reported that the biomass of spruce seedlings was improved by 18 % when
inoculated with rhizobacteria. In the second replicate of the study, the biomass yield of
the PGPR inoculated seedlings was still higher than control seedlings even though non-
175

significant. Pinus taeda were in a less active growth phase during the second round of
study than first (Stephen and Paine, 1985). The difference in plant development period
might have caused the differences in seedling biomass gain between two replicates.
One major impediment we faced while performing the experiment was selecting
the best way to measure and rate disease. The tested PGPR strains caused some tolerance
but not total disease resistance. Hence, we measured lesion size following pathogen
inoculation and compared between the PGPR-treated and the control seedlings. Total
biomass gain by the seedling was used as a measure to determine seedling growth.
In a forest ecosystem, soil microorganisms play a vital role in nutrient cycling,
plant growth regulation (Hart et al., 1994) and soil quality maintenance (Jeffries et al.
2003). Fungi and the bacteria are the major components of the rhizosphere microflora
(Chanway, 1996). Rhizosphere soil contains 10-100 times higher bacterial population
than that of the non-rhizosphere soil (Rouatt and Katznelson, 1961). Among those many
microbes in the soil they may be positively impacting the health of the trees. Therefore,
the study of the rhizobacterial community differences in symptomatic and asymptomatic
P. taeda stands would be a promising method to understand and identify the
rhizobacterial strains involved in promoting tree health. Also, the study of the plant
growth promotion by mycorrhizal fungi can be equally exciting. Finally, rhizobacteria
have the ability to promote P. taeda growth and reduce the infection of blue stain fungi.
Thus, future studies should focus on identifying those antimicrobials and the secondary
metabolites of PGPR which inhibited the fungal growth. Also, the study of the various
molecular pathways involved in the induction of the resistance will provide the greater
176

insights in the understanding of the induced systemic resistance of P. taeda to
ophiostomatoid fungi.
5.6 References:
Arguelles-Arias, A., Ongena, M., Halimi, B., Lara, Y., Brans, A., Joris, B., and Fickers, P. (2009). Bacillus amyloliquefaciens GA1 as a source of potent antibiotics and other secondary metabolites for biocontrol of plant pathogens. Microbial Cell Factories, 8(1), 63.
Ashrafuzzaman, M., Hossen, F. A., Ismail, M. R., Hoque, A., Islam, M. Z., Shahidullah,
S. M., and Meon, S. (2009). Efficiency of plant growth-promoting rhizobacteria (PGPR) for the enhancement of rice growth. African Journal of Biotechnology, 8(7).
Balhara, M., Ruhil, S., Dhankhar, S., and K Chhillar, A. (2011). Bioactive compounds
hold up-Bacillus amyloliquefaciens as a potent bio-control agent. The Natural Products Journal, 1(1), 20-28.
Beneduzi, A., Ambrosini, A., and Passaglia, L. M. (2012). Plant growth-promoting
rhizobacteria (PGPR): their potential as antagonists and biocontrol agents. Genetics and molecular biology, 35(4), 1044-1051.
Bresson, J., Varoquaux, F., Bontpart, T., Touraine, B., and Vile, D. (2013). The PGPR
strain Phyllobacterium brassicacearum STM196 induces a reproductive delay and physiological changes that result in improved drought tolerance in Arabidopsis. New Phytologist, 200(2), 558-569.
Bruce, A., Stewart, D., Verrall, S., and Wheatley, R. E. (2003). Effect of volatiles from
bacteria and yeast on the growth and pigmentation of sapstain fungi. International biodeterioration and biodegradation, 51(2), 101-108.
Chanway, C. P. (1996). I Endophytes: they're not just fungi! CP Chanway. Can. J.
Bot, 74, 321-322. Chanway, C. P. (1997). Inoculation of tree roots with plant growth promoting soil
bacteria: an emerging technology for reforestation. Forest Science, 43(1), 99-112. Chanway, C. P., Radley, R. A., and Holl, F. B. (1991). Inoculation of conifer seed with
plant growth promoting Bacillus strains causes increased seedling emergence and biomass. Soil Biology and Biochemistry, 23(6), 575-580.
Dunham, WC (2016) Global Biologicals Market Update March 2016—BPIA.
DunhamTrimmer 406 International Bio Intelligence.
177

Eckhardt, L. G., Weber, A. M., Menard, R. D., Jones, J. P., and Hess, N. J. (2007). Insect-fungal complex associated with loblolly pine decline in central Alabama. Forest Science, 53(1), 84-92.
Egamberdieva, D., and Lugtenberg, B. (2014). Use of plant growth-promoting
rhizobacteria to alleviate salinity stress in plants. In Use of Microbes for the Alleviation of Soil Stresses, Volume 1 (pp. 73-96). Springer New York.
Enebak, S. A. (2005). Rhizobacteria isolated from loblolly pine seedlings mediate
growth-promotion of greenhouse-grown loblolly, slash, and longleaf pine seedlings. Forest Science, 51(6), 541-545.
Enebak, S. A., and Carey, W. A. (2000). Evidence for induced systemic protection to
fusiform rust in loblolly pine by plant growth-promoting rhizobacteria. Plant Disease, 84(3), 306-308.
Enebak, S. A., Wei, G., and Kloepper, J. W. (1998). Effects of plant growth-promoting
rhizobacteria on loblolly and slash pine seedlings. Forest Science, 44(1), 139-144. Gradinger, C., Boisselet, T., Stratev, D., Ters, T., Messner, K., and Fackler, K. (2009).
Biological control of sapstain fungi: From laboratory experiments to field trials 10th EWLP, Stockholm, Sweden, August 25–28, 2008. Holzforschung, 63(6), 751-759.
Gupta, A. K., Khosla, K., Bhardwaj, S. S., Thakur, A., Devi, S., Jarial, R. S., Sharma C.,
Singh K.P., Srivastava D.K., and Lal, R. (2010). Biological control of crown gall on peach and cherry rootstock colt by native Agrobacterium radiobacter isolates. Open Horticulture Journal, 3, 1-10.
Hammerbacher, A., Schmidt, A., Wadke, N., Wright, L. P., Schneider, B., Bohlmann, J.,
Brand W.A., Fenning J.G., and Paetz, C. (2013). A common fungal associate of the spruce bark beetle metabolizes the stilbene defenses of Norway spruce. Plant physiology, 162(3), 1324-1336.
Hart, S. C., Nason, G., Myrold, D. D., and Perry, D. A. (1994). Dynamics of gross
nitrogen transformations in an old‐growth forest: The carbon connection. Ecology, 75(4), 880-891.
Iturritxa, E., Trask, T., Mesanza, N., Raposo, R., Elvira-Recuenco, M., and Patten, C. L.
(2017). Biocontrol of Fusarium circinatum Infection of Young Pinus radiata Trees. Forests, 8(2), 32.
Jeffries, P., Gianinazzi, S., Perotto, S., Turnau, K., and Barea, J. M. (2003). The
contribution of arbuscular mycorrhizal fungi in sustainable maintenance of plant health and soil fertility. Biology and fertility of soils, 37(1), 1-16.
178

Kloepper, J. W., and Schroth, M. N. (1978, August). Plant growth-promoting rhizobacteria on radishes. In Proceedings of the 4th international conference on plant pathogenic bacteria (Vol. 2, pp. 879-882).
Kokalis-Burelle, N., Vavrina, C. S., Reddy, M. S., and Kloepper, J. W. (2003).
Amendment of muskmelon and watermelon transplant media with plant growth-promoting rhizobacteria: Effects on seedling quality, disease, and nematode resistance. HortTechnology, 13(3), 476-482.
Kumar, V., Varma, A., Tuteja, N., Arshi, A., and Kumar, M. (2016). Combinations of
Plant Growth-Promoting Rhizobacteria (PGPR) for Initiation of Systemic Resistance Against Tree Diseases: A Glimpse. In Microbial-mediated Induced Systemic Resistance in Plants (pp. 207-212). Springer Singapore.
Liu, L., Kloepper, J. W., and Tuzun, S. (1995). Induction of systemic resistance in
cucumber against bacterial angular leaf spot by plant growth-promoting rhizobacteria. Phytopathology, 85(8), 843-847.
Liu, K., Garrett, C., Fadamiro, H., and Kloepper, J. W. (2016a). Antagonism of black rot
in cabbage by mixtures of plant growth-promoting rhizobacteria (PGPR). BioControl, 61(5), 605-613.
Liu, K., Garrett, C., Fadamiro, H., and Kloepper, J. W. (2016b). Induction of systemic
resistance in Chinese cabbage against black rot by plant growth-promoting rhizobacteria. Biological Control, 99, 8-13.
Liu, K., Newman, M., McInroy, J. A., Hu, C. H., and Kloepper, J. W. (2017). Selection
and Assessment of Plant Growth-Promoting Rhizobacteria (PGPR) for Biological Control of Multiple Plant Diseases. Phytopathology in press.
Lugtenberg, B. (Ed.). (2014). Principles of Plant-Microbe Interactions: Microbes for
Sustainable Agriculture. Springer. Lugtenberg, B., and Kamilova, F. (2009). Plant-growth-promoting rhizobacteria. Annual
review of microbiology, 63, 541-556. Matusick, G., Eckhardt, L. G., and Somers, G. L. (2010). Susceptibility of longleaf pine
roots to infection and damage by four root-inhabiting ophiostomatoid fungi. Forest ecology and management, 260(12), 2189-2195.
Mesanza, N., Iturritxa, E., and Patten, C. L. (2016). Native rhizobacteria as biocontrol
agents of Heterobasidion annosum ss and Armillaria mellea infection of Pinus radiata. Biological Control, 101, 8-16.
Nicholson, W. L. (2002). Roles of Bacillus endospores in the environment. Cellular and
Molecular Life Sciences, 59(3), 410-416.
179

Oliva, J., Stenlid, J., and Martínez‐Vilalta, J. (2014). The effect of fungal pathogens on
the water and carbon economy of trees: implications for drought‐induced mortality. New Phytologist, 203(4), 1028-1035.
Orhan, E., Esitken, A., Ercisli, S., Turan, M., and Sahin, F. (2006). Effects of plant
growth promoting rhizobacteria (PGPR) on yield, growth and nutrient contents in organically growing raspberry. Scientia Horticulturae, 111(1), 38-43.
Ramamoorthy, V., Viswanathan, R., Raguchander, T., Prakasam, V., and Samiyappan, R.
(2001). Induction of systemic resistance by plant growth promoting rhizobacteria in crop plants against pests and diseases. Crop protection, 20(1), 1-11.
Ran, L. X., Liu, C. Y., Wu, G. J., Van Loon, L. C., and Bakker, P. A. H. M. (2005).
Suppression of bacterial wilt in Eucalyptus urophylla by fluorescent Pseudomonas spp. in China. Biological Control, 32(1), 111-120.
Raupach, G. S., Liu, L., Murphy, J. F., Tuzun, S., and Kloepper, J. W. (1996). Induced
systemic resistance in cucumber and tomato against cucumber mosaic cucumovirus using plant growth-promoting rhizobacteria (PGPR). Plant Disease, 80(8), 891-894.
Rouatt, J. W., and Katznelson, H. (1961). A study of the bacteria on the root surface and
in the rhizosphere soil of crop plants. Journal of Applied Bacteriology, 24(2), 164-171.
Ruiz-Garcia, C., Bejar, V., Martinez-Checa, F., Llamas, I., & Quesada, E. (2005).
Bacillus velezensis sp. nov., a surfactant-producing bacterium isolated from the river Velez in Malaga, southern Spain. International journal of systematic and evolutionary microbiology, 55(1), 191-195.
Seifert, K. A., Hamilton, W. E., Breuil, C., and Best, M. (1987). Evaluation of Bacillus
subtilis C186 as a potential biological control of sapstain and mould on unseasoned lumber. Canadian journal of microbiology, 33(12), 1102-1107.
Shishido, M., Massicotte, H. B., and Chanway, C. P. (1996). Effect of plant growth
promoting Bacillus strains on pine and spruce seedling growth and mycorrhizal infection. Annals of Botany, 77(5), 433-442.
Singh, A., Anderson, D., and Eckhardt, L. G. (2014). Variation in resistance of Loblolly
pine (Pinus taeda L.) families against Leptographium and Grosmannia root fungi. Forest Pathology, 44(4), 293-298.
Stephen, F. M., and Paine, T. D. (1985). Seasonal patterns of host tree resistance to
fungal associates of the southern pine beetle1, 2. Zeitschrift für angewandte Entomologie, 99(1‐5), 113-122.
180

Vincent, J., 1947. Distortion of fungal hyphae in the presence of certain inhibitors.
Nature 159, 850. Wahyudi, A., Astuti, R., 2011. Screening of Pseudomonas sp. isolated from rhizosphere
of soybean plant as plant growth promoter and biocontrol agent. American Journal of Agricultural and Biological Sciences 6, 134-141.
Wingfield, M., Capretti, P., and Mackenzie, M. (1988). Leptographium spp. as root
pathogens of conifers. An international perspective. Yu, G. Y., Sinclair, J. B., Hartman, G. L., and Bertagnolli, B. L. (2002). Production of
iturin A by Bacillus amyloliquefaciens suppressing Rhizoctonia solani. Soil Biology and Biochemistry, 34(7), 955-963.
Zehnder, G., Kloepper, J., Yao, C., and Wei, G. (1997). Induction of systemic resistance
in cucumber against cucumber beetles (Coleoptera: Chrysomelidae) by plant growth-promoting rhizobacteria. Journal of Economic Entomology, 90(2), 391-396.
Zhang, X., Zhao, G., Li, D., Li, S., and Hong, Q. (2014). Identification and evaluation of
strain B37 of Bacillus subtilis antagonistic to sapstain fungi on poplar wood. The Scientific World Journal, 2014. mortality. Trends in ecology and evolution, 26(10), 523-53.
181

CHAPTER VI
Intra-specific variation in virulence and effect of inoculum density of Leptographium
terebrantis to Pinus taeda L.
6.1 Abstract
Leptographium terebrantis, a pathogenic, root-feeding bark-beetle vectored fungi,
causes root infection and blue-staining in conifers. Intra-specific virulence and impact of
different inoculum densities of L. terebrantis on P. taeda are unknown. This study
determined the intraspecific variation in virulence of L. terebrantis to P. taeda and
examined the growth ability of relatively virulent L. terebrantis at different inoculum
densities. Forty-two, L. terebrantis isolates were used to inoculate P. taeda seedling
stems, and the developed lesion was studied. Toothpicks cultured with relatively virulent
L. terebrantis were inoculated into P. taeda stem segments at different densities, and
blue-stain caused by fungi was measured after 8 weeks. The results suggest virulence of
L. terebrantis varies among isolates. At higher inoculation density, L. terebrantis have
higher growth and staining potential which may negatively impact P. taeda.
6.2 Introduction
Leptographium species are distributed worldwide with most species as inhabitants
of conifers (Jacobs and Wingfield, 2001). These fungi are more common in the southern
U.S. where conifer are the major species. Leptographium procerum (W.B. Kendr.) M.J. 182

Wingf and L. terebrantis S.J. Barras and T.J. Perry are among the root-feeding bark
beetle vectored Leptographium species, frequently isolated from roots of declining Pinus
taeda L. (loblolly pine) in the southern U.S. (Eckhardt et al., 2004). Leptographium
terebrantis is relatively more pathogenic blue-staining and root-infecting fungi (Singh et
al., 2014).
Leptographium terebrantis causes lesions in the phloem and resin flow in the
xylem in wound-inoculated seedlings and mature trees of several conifers (Klepzig et al.
1996). Although the pathogenicity of L. terebrantis on loblolly pine is relatively well
established in seedlings and young trees (Eckhardt et al., 2004; Matusick et al., 2016,
Matusick and Eckhardt, 2010; Nevill et al., 1995; Singh et al., 2014), its ability to grow in
and cause occlusion in P. taeda wood and trees at different inoculation densities is
unknown.
Following invasion in wood, the blue-stain fungi initially grow in ray cells in the
sapwood and subsequently start to proliferate in ray parenchyma cells. Fungal hyphae
enter the tracheid by forming a penetration peg. Bordered pit cells facilitate the tracheid
to tracheid movement, leading to the longitudinal movement of the fungus (Bergvinson
and Borden, 1992). Movement of fungi in the tracheid blocks the fundamental water
conducting system in the plant. Resin spillage from the resin duct epithelial cells
destroyed by the fungus restricts the further movement of water (Ballard et al., 1982).
The potential damage by beetle vectored fungus depends upon the inoculation
density and host tree susceptibility (Croise et al., 1998). The inoculum density (the
number of the fungal inoculum per unit), plays a significant role in determining the
183

impact of the blue-stain fungi (Horntvedt et al., 1983; Solheim, 1992). Mass inoculation
loads have been found to cause the sudden decline of tree health (Christiansen, 1985;
Horntvedt et al., 1983; Solheim and Krokene., 1988). However, there have been no
studies which can relate the radial inoculum density to the blockage of the vascular
tissue.
The high frequency of L. terebrantis isolation from Pinus forests (Eckhardt et al.,
2007) shows that the fungus will have the potential to become a devastating pathogen in
the future. However, is it still unclear whether all the isolates have equal potential to
impact the health of the tree? Also, in an ecological scenario, mass inoculation of fungi is
more likely. Moreover, it is important to understand the growing ability of blue-stain
fungus in the absence of the host-tree response before any conclusion can be drawn.
Thus, to get better insights about virulence and pathogenicity of L. terebrantis we will try
to answer following questions: (i) Is there an intra-specific variation in virulence of L.
terebrantis? and (ii) How does L. terebrantis grow at different inoculum densities?
6.3 Material and methods
6.3.1 Leptographium terebrantis pathogenicity testing
An artificial stem inoculation study was performed in P. taeda seedlings from a
single family. In January of 2015, a total of 820 one-year-old bare-root P. taeda seedlings
were lifted from Rayonier and were re-planted in one-gallon pots with ProMix BX®
(Premier Tech, Quebec, and Canada) peat-based potting media. The re-planted seedlings
were placed in an outdoor research facility at Auburn University, allowed to grow under
natural conditions (Figure 6.1), and watered when required. Seedling height and root-
184

collar diameter (RCD) were measured before the fungal inoculation and final
measurements.
Figure 6.1 Pinus taeda seedlings in randomized controlled design in an outdoor space.
185

The experiment was designed as randomized complete block design with 19
seedlings randomly chosen for treatment with an isolate of L. terebrantis forty-two
isolates were maintained at 4 °C in Forest Health Dynamics Laboratory, Auburn
University, Auburn, AL, U.S. These isolates were isolated from the roots of declining
Pinus stands throughout the southern U.S. (Table S9; Eckhardt et al., 2007). Fungal
isolates were plated on Malt Extract Agar (MEA) plates and incubated at room
temperature for 14 days before inoculation in seedlings.
A 1-cm vertical wound 2 cm above the root-collar area was created in each
seedling, and 3 mm agar plug with actively growing fungi were placed (fungus-side-
down). Control seedlings were inoculated with sterile agar. The inoculation point was
covered with a moist cotton ball to prevent desiccation of agar media and gently wrapped
with Parafilm® to prevent further contamination. After 8 weeks, seedlings were cut above
the soil line and placed in stain (FastGreen FCF; Sigma Chemical Co., St. Louis, MO,
USA) and distilled water mixed in a ratio of 0.25 g L-1 for 48 h to allow the dye to move
through them. The bark around the inoculation point was then carefully scraped, and the
dark necrotic tissue was measured as the lesion. The vertical portion of the seedling stem
that did not allow the capillary movement of dye was recorded as occlusion length. The
length and width of the lesion were also measured.
6.3.2 Leptographium terebrantis inoculations in P. taeda stem sections (blots)
6.3.2.1 Wood segment preparation
Seven, five-year-old, P. taeda saplings with no above-ground signs and symptoms
of disease were selected from naturally regenerating forest in Auburn, Alabama, U.S.,
186
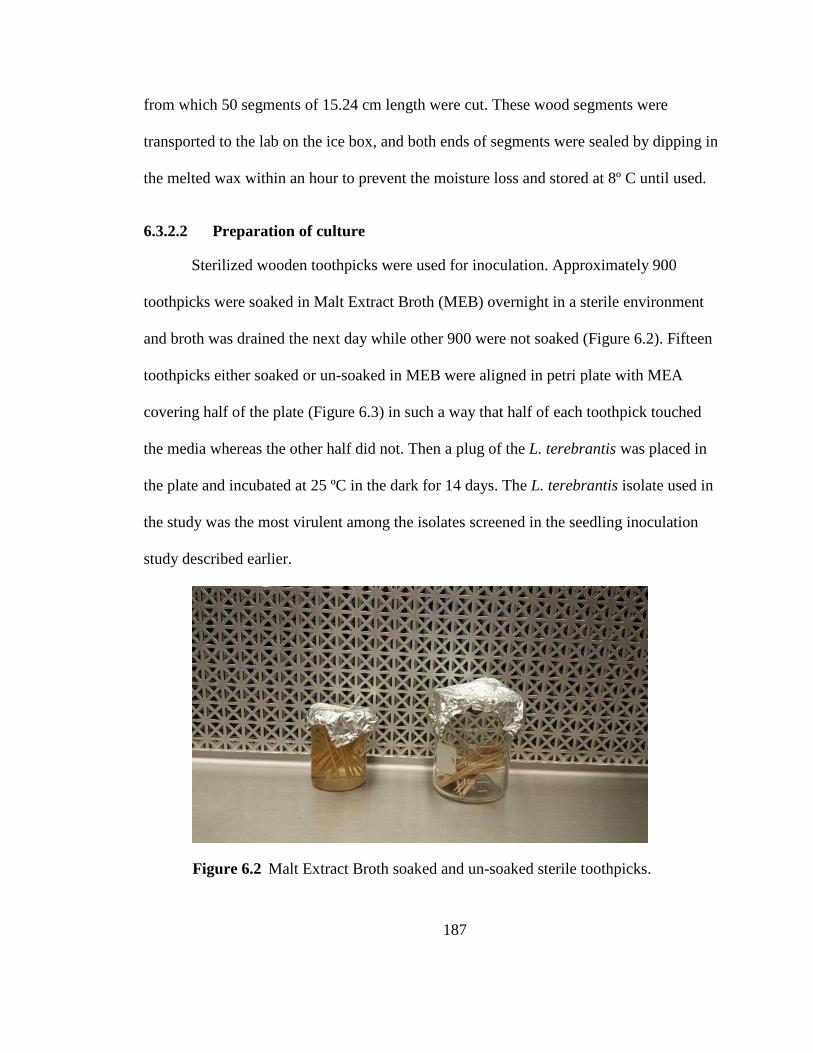
from which 50 segments of 15.24 cm length were cut. These wood segments were
transported to the lab on the ice box, and both ends of segments were sealed by dipping in
the melted wax within an hour to prevent the moisture loss and stored at 8º C until used.
6.3.2.2 Preparation of culture
Sterilized wooden toothpicks were used for inoculation. Approximately 900
toothpicks were soaked in Malt Extract Broth (MEB) overnight in a sterile environment
and broth was drained the next day while other 900 were not soaked (Figure 6.2). Fifteen
toothpicks either soaked or un-soaked in MEB were aligned in petri plate with MEA
covering half of the plate (Figure 6.3) in such a way that half of each toothpick touched
the media whereas the other half did not. Then a plug of the L. terebrantis was placed in
the plate and incubated at 25 ºC in the dark for 14 days. The L. terebrantis isolate used in
the study was the most virulent among the isolates screened in the seedling inoculation
study described earlier.
Figure 6.2 Malt Extract Broth soaked and un-soaked sterile toothpicks.
187

Figure 6.3 Wooden toothpicks placed into the MEA plate.
6.3.2.3 Inoculation of Pinus taeda stem segments
A 0.15-mm diameter drill bit was used to drill a 5-mm deep hole in the wood
segments. The holes in the segments were then inoculated with toothpicks colonized by
fungi. The number and the distance between the holes determined the density of
inoculation treatment. The inoculation points were (i) 1.27 cm apart sideways and
parallel, (ii) 1.27 cm apart in a single line, (iii) 2.54 cm in a parallel line, and (iv) 2.54 cm
apart in single line (Figure 6.4). There were 6 replicates (stem segments) of each
treatment (2 replicates for control) for broth soaked and un-soaked toothpicks. Controls
segments received sterile toothpicks without any fungus. The inoculated stem segments
were then kept in bins with sterilized sand under the shade. (Figure 6.5). The top of the
containers was covered with a moist sterile cheese cloth to prevent moisture loss.
188

Figure 6.4 Pinus taeda stem segments showing different inoculation points for inoculation of Leptographium tererantis. A: 1.27 cm apart sideways and parallel, B: 1.27 cm apart in a single line, C: 2.54 cm in a double line and D: 2.54 cm in a single line.
Figure 6.5 Inoculated stem segments kept in a container with sterile sand.
6.3.2.4 Laboratory Measurement
After 8 weeks, smaller circular segments of wood (wooden cookies) were made
by cutting at the center of each inoculation point with a band saw to observe fungal
growth (Figure 6.6). The area of the fungal stains at a cross-section of each wooden
cookie was traced on a transparent sheet and measured using a Lasico® Planimeter
...
15.24 cm 1.27 cm 2.54 cm2.54 cm
A
B
C
D
189

(Lasico®, Los Angeles, CA, USA). The total volume of each wood segment was
calculated using formula (Vtotal = πr2h). The volume of the entire stained area in each
bole was calculated using the formula (Vstained = S x L where, S = average stained area
of each cross section and L = total length of the bole). The total percentage stains in each
bole was calculated using formula (%stain = SL/πr2h x 100).
Figure 6.6 Cross-section of the stem segment showing point of inoculation, tangential spread, and depth of the stain.
6.3.3 Analysis
Data were analyzed using a general linear model (GLM) in SAS statistical
software (SAS Institute, 9.4 versions, Cary, NC). Data were first checked for normality,
and equal variance and transformations were done using reciprocal transformation for
occlusion from stem segments. Bolt diameter was used as a covariate in the model. Pair-
wise comparisons were undertaken using the Post Hoc Tukey’s test on the four fungal
treatments at α = 0.05.
190

6.4 Results
6.4.1 Leptographium terebrantis pathogenicity
All L. terebrantis isolates caused lesions and occlusions in all of the inoculated
seedlings. Different isolates of L. terebrantis caused significantly different size of lesion
(F (42, 773) = 7.22, P = <0.0001). The lesion depth was also different among the treatments
(F (42, 773) = 2.80, P = <0.0001). Occlusion length and depth was significantly different
between the isolates (F (42,773) = 5.83, P = <0.0001; F (42,772) = 3.99, P = <0.0001).
Among the 42 isolates of L. terebrantis, 41 isolates had significantly longer lesion
length than the control treatment. All the isolates had longer occlusion length than the
control. Isolate MYA-3316 had the highest mean lesion length and occlusion length
(Figure 6.7). The lesion caused by this isolate was 4.77 (± 1.14) mm longer than that
resulting from the control (P = <0.0001) (Table S10). Fungal isolate R-00-44-ss6 resulted
in 2.39 (± 1.14) mm longer lesion than the control (P = <0.0001).
191

Figure 6.7 The mean lesion length produced in Pinus taeda seedlings following inoculation with various Leptographium terebrantis isolates. Error bars indicate 95% confidence intervals at α = 0.05.
192

6.4.2 Growth of L. terebrantis in P. taeda segments
Dark blue pie-shaped staining was observed in stem segments, eight weeks
following inoculation with L. terebrantis isolates. Any signs of damage and fungal
staining were not observed in control stem segments inoculated with sterile toothpicks.
The stem diameter had no significant effect on the stain development, but including it in
the model increased our model performance (Table 6.1). The staining produced by the
soaked and un-soaked toothpick was significantly different (F (1, 39) = 6.72, P = 0.0009) as
shown in Table 6.2 and Figure 6.8.
Figure 6.8 A Cutting of the bolts with the band saw B Development of the fungal stain in different treatments C Staining developed in soaked 2.54 cm treatment.
193

Table 6.1 The effects of different dependent variables for percentage of fungal staining (N = 48).
Source DF F value Pr > F Diameter 1 1.06 0.3103 Media 1 10.24 0.0027 Treatment 3 6.72 0.0009 Media*Treatment 3 0.24 0.8707
(Note: Treatment: different inoculum load; Media: soaked or un-soaked).
Figure 6.9 Cross-section of wood stained with Leptographium terebrantis at different inoculation treatments.
The toothpicks soaked in MEB caused 2.81% more staining than the un-soaked
toothpick (P = 0.0027) (Figure 6.10). When the toothpicks were 1.27 cm apart in a
double line, then they caused 4.73 % more staining than that caused by the lowest load of
inoculation (i.e. 2.54 cm in a single line) (Figure 6.9). There was 100 % occlusion in
some of the stem segments with 1.27 cm apart inoculation points in a double line.
194

Figure 6.10 The percentage of the total tissue stained by L. terebrantis at different
inoculum loads in P. taeda stem sections. Different letters indicate significant differences at α = 0.05. (OIP: 2.54 cm in double line, OIS: 2.54 in single line, HIP: 1.27 cm apart in double line, and HIS: 1.27 cm apart in single line).
Table 6.2 Estimation of the difference in staining caused by various inoculum load in Pinus taeda stem segments.
Parameter Log (Estimate) stain % Standard error T-value Pr > |t| So vs Unso -0.281 0.088 -3.2 0.0027 HIP vs HIS -0.465 0.125 -3.71 0.0006 HIP vs OIP -0.252 0.132 -1.91 0.0639 HIP vs OIS -0.473 0.120 -3.95 0.0003 HIS vs OIP 0.212 0.126 1.68 0.1003 HIS vs OIS -0.009 0.123 -0.07 0.9447 OIP vs OIS -0.221 0.130 -1.7 0.0963
(Notes: So: Toothpicks soaked in broth, Unso: Toothpicks un-soaked in broth, HIP: 1.27 cm apart in a double line, HIS: 1.27 cm apart in a single line, OIP: 2.54 cm in double line, and OIS: 2.54 cm in a single line).
195

6.5 Discussion
Forty-two Leptographium terebrantis isolates showed intraspecific variation in
virulence. Different isolates can act as relatively more or less virulent pathogens on a
single family of P. taeda. Similar results were obtained by Parmeter et al. (1989) when
they inoculated immature Pinus ponderosa Laws. with two different isolates of L.
terebrantis. Our findings are also supported by Lieutier et al. (2004) where they found
variation in the growth virulence of L. wingfieldii Morelet. in P. sylvestris L. (scots pine).
In contrast, Wingfield (1986) did not find any significant differences in the virulence of
different L. procerum isolates in P. strobus L. (white pine) seedlings. Also, Swedjemark
et al. (1999) did not found any evidence of intraspecific variation in growth of
Heterobasidion annosum (Fr.) Bref. in Picea abies (L.)H. Karst. (Norway spruce) and P.
sylvestris. Thus, these previous studies and present study taken together suggests that
intraspecific variation in virulence of the fungi pathogenic to forest trees may be isolate
specific or host specific.
Mortality of P. taeda seedlings were not observed during this study as had been
observed in other pathogenicity studies (Harrington and Cobb, 1983; Parmeter et al.
1989; Eckhardt et al., 2004; Singh et al., 2014). Pathogenicity and virulence of fungal
inoculants to Pinus species are usually assessed based on lesion length and area caused
by the fungus (Nevill et al., 1995; Parmeter et al., 1989). The isolate L. terebrantis
(ATCC accession no MYA – 3316) caused the longest lesion and occlusion. The longer
lesion denotes the higher virulence of some fungi as compared to the other fungal
isolates. With the same level of defense by P. taeda, relatively more virulent fungal
196

isolates were able to cause varying lengths of necrotic lesions and blockage of the water
conducting vascular tissue.
The vertical length of the inoculation points did not cause a difference in fungal
growth. There was no variation in the fungal spread when the inoculum load was 1.27 cm
and 2.54 cm in single lines. This suggests that the frequency of inoculation points at the
radial cross-section plays a significant role in the movement of fungi but not the
frequency of the vertical inoculation. The blue-staining fungi move through the ray
parenchyma cells and grow substantially within ray cells and move to the tracheid
through the bordered pits (Ballard et al., 1982; Ballardt et al., 1984). Therefore, when the
two inoculation points were near, they merged with each other and expanded the dark-
blue-stain. Thus, inoculation points at least 1.27 cm vertically and longitudinally apart
from each other is suggested for future artificial inoculation studies in P. taeda trees to
understand the impact of a high inoculum load.
The results suggest that observed fungal movement might be associated with
embolism formation in living conifer hosts and it might become more severe at higher
loads of L. terebrantis inoculation. Tissue embolism decreases the hydraulic conductance
and concomitantly disturbs the water balance in the plant (Mayr et al., 2014). For
example, sap-fungi inoculation in an embolized drought stressed trees might cause
complete hydraulic failure and plant mortality (Oliva et al., 2014). As bark beetles
usually attack and inocualte fungi in previously stressed tree (Raffa et al., 1993), the
results of the fungal inoculation on an ecological scale might be more detrimental to the
host tree. Future studies should be focused on the consequences of high inoculum loads
197

of L. terebrantis on whole tree physiology to quantify the impact caused by the fungi in
P. taeda health.
6.6 References:
Ballard, R. G., Walsh, M. A., and Cole, W. E. (1982). Blue-stain fungi in xylem of lodgepole pine: a light-microscope study on extent of hyphal distribution. Canadian Journal of Botany, 60(11), 2334-2341.
Ballard, R. G., Walsh, M. A., and Cole, W. E. (1984). The penetration and growth of
blue-stain fungi in the sapwood of lodgepole pine attacked by mountain pine beetle. Canadian Journal of Botany, 62(8), 1724-1729.
Bergvinson, D. J., and Borden, J. H. (1992). Enhanced colonization by the blue stain
fungus Ophiostoma clavigerum in glyphosate-treated sapwood of lodgepole pine. Canadian Journal of Forest Research, 22(2), 206-209.
Christiansen, E. (1985). Ceratocysts polonica inoculated in Norway spruce: Blue‐staining
in relation to inoculum density, resinosis and tree growth. Forest Pathology, 15(3), 160-167.
Croisé, L., Lieutier, F., and Dreyer, E. (1998). Scots pine responses to number and
density of inoculation points with Leptographium wingfieldii Morelet, a bark beetle-associated fungus. Annales des Sciences Forestières, 55(4), 497-506.
Eckhardt, L. G., Goyer, R. A., Klepzig, K. D., and Jones, J. P. (2004). Interactions of
Hylastes species (Coleoptera: Scolytidae) with Leptographium species associated with loblolly pine decline. Journal of Economic Entomology, 97(2), 468-474.
Eckhardt, L. G., Weber, A. M., Menard, R. D., Jones, J. P., & Hess, N. J. (2007). Insect-
fungal complex associated with loblolly pine decline in central Alabama. Forest Science, 53(1), 84-92.
Harrington, T. C., and Cobb Jr, F. W. (1983). Pathogenicity of Leptographium and
Verticicladiella spp. isolated from roots of western North American conifers. Phytopathology, 73(4), 596-599.
Horntvedt, R., Christiansen, E., Solheim, H., and Wang, S. (1983). Artificial inoculation
with Ips typographus-associated blue-stain fungi can kill healthy Norway spruce trees. Medd. Nor. Inst. Skogforsk, 38(4), 1-20.
198

Jacobs, K., and Wingfield, M. J. (2001). Leptographium species: tree pathogens, insect associates, and agents of blue-stain. American Phytopathological Society (APS Press).
Klepzig, K. D., Smalley, E. B., and Raffa, K. F. (1996). Interactions of ecologically
similar saprogenic fungi with healthy and abiotically stressed conifers. Forest Ecology and Management, 86(1), 163-169.
Lieutier, F., Yart, A., Ye, H., Sauvard, D., & Gallois, V. (2004). Variations in growth and
virulence of Leptographium wingfieldii Morelet, a fungus associated with the bark beetle Tomicus piniperda L. Annals of Forest Science, 61(1), 45-53.
Matusick, G., and Eckhardt, L. G. (2010). The pathogenicity and virulence of four
Ophiostomatoid fungi on young Longleaf pine trees. Canadian Journal of Plant Pathology, 32(2), 170-176.
Matusick, G., Nadel, R. L., Walker, D. M., Hossain, M. J., and Eckhardt, L. G. (2016).
Comparative behavior of root pathogens in stems and roots of southeastern Pinus species. Fungal Biology, 120(4), 471-480.
Mayr, S., Kartusch, B., & Kikuta, S. (2014). Evidence for air-seeding: watching the
formation of embolism in conifer xylem. The journal of plant hydraulics, 1. Nevill, R. J., Kelley, W. D., Hess, N. J., and Perry, T. J. (1995). Pathogenicity to loblolly
pines of fungi recovered from trees attacked by southern pine beetles. Southern Journal of Applied Forestry, 19(2), 78-83.
Oliva, J., Stenlid, J., and Martínez‐Vilalta, J. (2014). The effect of fungal pathogens on
the water and carbon economy of trees: implications for drought‐induced mortality. New Phytologist, 203(4), 1028-1035.
Parmeter Jr, J. R., Slaughter, G. W., Chen, M. M., Wood, D. L., and Stubbs, H. A.
(1989). Single and mixed inoculations of ponderosa pine with fungal associates of Dendroctonus spp. Phytopathology, 79(7), 768-772.
Raffa, K. F., Phillips, T. W., & Salom, S. M. (1993). Strategies and mechanisms of host
colonization by bark beetles. Beetle-pathogen interactions in conifer forests, 102-28.
Singh, A., Anderson, D., and Eckhardt, L. G. (2014). Variation in resistance of loblolly
pine (Pinus taeda L.) families against Leptographium and Grosmannia root fungi. Forest Pathology, 44(4), 293-298.
199

Solheim, H. (1992). Fungal succession in sapwood of Norway spruce infested by the bark beetle Ips typographus. European Journal of Forest Pathology, 22(3), 136-148.
Solheim, H., and Krokene, P. (1998). Growth and virulence of Ceratocystis rufipenni and
three blue-stain fungi isolated from the Douglas-fir beetle. Canadian Journal of Botany, 76(10), 1763-1769.
Swedjemark, G., Johannesson, H., and Stenlid, J. (1999). Intraspecific variation in
Heterobasidion annosum for growth in sapwood of Picea abies and Pinus sylvestris. European Journal of Forest Pathology, 29(4), 249-258.
Wingfield, M. J. (1986). Pathogenicity of Leptographium procerum and L. terebrantis on
Pinus strobus seedlings and established trees. European Journal of Forest Pathology, 16(5-6), 299-308.
200

CHAPTER VII
Growth and Staining Ability of Various Blue-Staining Fungi in Pinus taeda L.
Stem Segments
7.1 Abstract
Blue-staining of conifer wood is caused by various ophiostomatoid fungi and is
a major problem in the forest products industry. Toothpicks cultured with
Leptographium terebrantis, Grosmannia huntii, and G. alacris were inoculated in
loblolly pine stem segments. Growth potential (in terms of stain area) were determined
eight weeks after inoculation. Leptographium terebrantis had relatively higher growth
potential than G. alacris and G. huntii. Results indicate that wood staining by
ophiostomatoid fungi is species dependent.
7.2 Introduction
Discoloration of conifer sapwood by the presence of certain fungal hyphae
results in blue-stain (Seifert et al., 1993). The fungi of the genus Ceratocystis,
Ophiostoma, Leptographium, and Grosmannia species are associated with the blue-
staining of lumber (Kirisits, 2007). Staining and discoloration of the wood caused by
the blue-staining fungi decrease the value and the aesthetic quality of the wood.
Although the wood strength is little affected, the discoloration is of a significant
problem in the paper and pulp industry as additional treatment is required for stained 201

wood (Behrendt et al., 1995). Apart from their staining ability some species of
ophiostomatoid fungi can be pathogenic to the host (Matusick et al., 2010). Information
regarding the staining abilities of these fungi on important Pinus species, P. taeda is
limited in literature.
The blue stain is the result of melanin production, a secondary metabolite of
fungal growth, is an important biological pigment (Zimmerman et al., 1995). This
pigment aids in fungal penetration into the host by helping in appressoria formation and
perithecia formation (Zimmermann et al., 1995). Melanization may also help in
adaptation of the organism to changing climate such as increasing temperature and
drought (Roulin, 2014). It may confer UV resistance and desiccation (Bell and
Wheeler, 1986). Thus, melanization in blue stain fungi may provide it with adaptation
mechanisms even in adverse climatic conditions.
Bark beetle associates vector blue-staining fungi into trees (Paine et al., 1997).
Initial fungal growth occurs in the sapwood rays. The hyphae then penetrate to the cell
wall and subsequently ray parenchyma cell where it grows rapidly. It can form an
appressorium-like structure with a penetration peg which can rupture the cell wall and
move to the adjacent cells. Finally, fungal hyphae enter the tracheid by penetrating the
bordered pit cells. Infrequent branching and longitudinal growth of the hyphae causes
further proliferation of the fungi (Ballard et al., 1984).
The hypersensitive responses such as lesion and occlusion following inoculation
of G. huntii, G. alacris, L. terebrantis and L. procerum into roots and stems of living
Pinus trees and seedlings has been studied (Matusick and Eckhardt, 2010, Singh et al.,
202

2014). The lesion and occlusion are the responses produced by the tree after the fungal
inoculation which does not necessarily provide an idea about how far fungi can grow.
Thus, the staining or the growth potential of the various blue-stain fungus has been a
question of much speculation. A simple study was designed to mimic the artificial
inoculation of the different blue-staining fungi by bark-beetles. This study seeks to
determine the growth ability of the three different blue stain fungi: L. terebrantis, G.
huntii and G. alacris in loblolly pine stem segments.
7.3 Materials and methods
7.3.1 Wood section preparation
Seven, five-year-old, P. taeda saplings with no visible signs and symptoms of
disease were selected from a naturally regenerating forest near Auburn, Alabama, U.S.
were cut into 15.24 cm long, 20 stem segments. Stem segments were kept on the ice
and transported to the lab. Further, the exposed ends of the segments were sealed by
dipping in the melted wax within an hour to prevent the moisture loss and stored in a
cooler at 8º C until used.
7.3.2 Preparation of culture
Sterilized wooden toothpicks were soaked in Malt Extract Broth (MEB)
overnight in a sterile environment and drained the next day. Petri plates with Malt
Extract Agar (MEA) covering only half of the plate were prepared and a plug of agar
with L. terebrantis (ATCC MYA-3316) was placed in the agar medium. The toothpicks
were aligned so that half of each toothpick touched the media whereas the other half did
203

not. This allowed the growth and sporulation of the fungi on the exposed ends of
toothpicks. The culture plates were incubated for 14 days at 25ºC in the dark.
7.3.3 Inoculation of P. taeda bolts
Four holes, 2.54 cm apart and 5-mm deep were drilled with 0.15-mm diameter
drill bit. The holes in P. taeda bolts were then inoculated with fungal cultured
toothpicks. The stem segments were kept in a bin containing sterile sand. The top of the
bin was covered with a sterile cheesecloth to prevent the moisture loss.
Figure 7.1 Pinus taeda bolts with inoculation holes for inoculation of fungal cultured toothpicks.
7.3.4 Laboratory Measurement
Eight weeks after inoculation, wood segments were cut at each inoculation point
with a band saw to observe the staining caused by fungi. Then the area of the fungal
staining and cross-section of the wooden cookies were traced on a transparent sheet and
measured using a Lasico® Planimeter (Lasico®, Los Angeles, CA, USA). The total
204

percentage of the area stained by the fungi at the cross-section at the point of toothpick
inoculation was calculated. Also, the depth of the fungal staining below the inoculation
points was calculated. The estimates of the effect caused by three different fungi were
analyzed using the general linear model in R 3.3.1. Estimates of effects were analyzed
at α = 0.05.
7.4 Results
The inoculation of three fungi led to the inward spread of the blue-staining
fungi. The staining was dark-blue and pie-shaped (Figure 7.2). The wood segments
receiving the control toothpicks did not develop blue stain, so they were removed from
the further analysis.
Figure 7.2 Blue-stain caused by various fungi in the stem segments.
The staining in the cross section varied significantly among the fungi (F (2, 69) =
5.06, P = 0.0089). The cross-section area stained by L. terebrantis was 1.69 cm2 (±1.23,
205

95 % CI) higher than that by G. alacris, P = 0.00808, R2 = 0.11. Similarly, the area
stained caused by the G. huntii was 0.16 cm2 (± 1.24, 95% CI) lesser than that of the G.
alacris. However, it was not statistically significant (P = 0.80). Similarly, fungi L.
terebrantis caused 1.85 (± 1.24, 95 % CI) cm2 higher staining than that of G. huntii.
The depth of the staining in the cross section was also significantly different
among the fungi (F (2, 69) = 2.33, P = 0.0375, R2 = 0.11) (Figure 7.3). The depth of the
stain caused by the fungi L. terebrantis was 3.73 (± 3.62, 95 % CI) cm2 higher than that
caused by G. alacris (P = 0.04386). The depth of the fungal staining caused by G.
huntii was 1.60 (± 3.62, 95 % CI) cm2 higher than that caused by G. alacris (P =
0.3796). Similarly, the depth of the fungal staining caused by L. terebrantis was 5.37 (±
3.62, 95 % CI) cm2 higher than that caused by G. huntii (P = 0.00447).
206

Figure 7.3 Percentage of the stain area in the cross-section
caused by three fungi. (GA: Grosmannia alacris, LT: Leptographium terebrantis, GH: Grosmannia huntii). Different letters denote significant differences at α = 0.05.
With 1 cm2 increase in the cross-sectional area the stain increased by 0.21 (±
0.14, 95 % CI), P = 0.0047, R2 = 0.27 when treated with G. alacris. We observed that
when cross sectional area of bolt increased by 1 cm2 then the stain caused by G. huntii
decreased by 0.15 (± 0.35, 95 % CI), P = 0.3812, R2 = 0.04. We found that with 1 cm2
increase in the cross-sectional area of the blot the stain caused by L. terebrantis
decreased by -0.14 (± 0.44, 95 % CI), P = 0.34, R2 = 0.02.
207

7.5 Discussion
There was variation in the staining ability of various blue-staining fungi.
Leptographium terebrantis had the highest blue staining ability among the three fungi
tested. Yang (2001) reported similar findings by evaluating the growth of 20 isolates of
sap-staining fungi on P. banksiana Lamb. log sections. Similarly, Matusick and
Eckhardt (2010) also found that L. terebrantis can cause relatively higher sapwood
occlusions than G. huntii, L. procerum and G. alacris in roots of P. palustris Mill.
These differences in staining ability might be due to the variation in virulence of the
fungi.
Leptographium terebrantis had the ability to stain the wood surface up to the
deeper levels. Singh et al. (2014) also found that L. terebrantis was relatively virulent
than G. huntii when inoculated in the P. taeda seedlings. This also reflects that fungi
can go deeper into the vascular tissues and stain the wood and block the vascular tissues
thus affecting the whole plant physiology.
The differential ability of different blue-staining fungi to grow and stain wood
tissue may depend on the fungal melanin production pathways (Wang and Breuil,
2002). Melanized appressorium is necessary for the cell to cell movement. The
relatively higher level of blue-stain caused by L. terebrantis suggests that melanization
occurs faster in this fungi. More rapid melanization may allow this fungus to quickly
adapt to the changing climate (Roulin, 2014). However, much less is known about the
role of the melanin in the pathogenesis of these blue-staining fungi. It is possible that
the melanin biosynthesis pathways in the three fungi we studied are different. Further
studies should focus on the mechanisms of melanin biosynthesis pathways and blue-208

stain development. Also, the study of wood anatomy associated with the fungal
invasion and the fungal spread in tracheids of P. taeda might give a better insight of the
mechanism behind the different rates of movement of the three different fungi.
Furthermore, studying the fungal growth phase in which fungal pigments are produced
would be an important step towards preventing the stain caused by the blue stain fungi.
7.6 References
Ballard, R. G., Walsh, M. A., and Cole, W. E. (1984). The penetration and growth of blue-stain fungi in the sapwood of lodgepole pine attacked by mountain pine beetle. Canadian Journal of Botany, 62(8), 1724-1729.
Behrendt, C. J., Blanchette, R. A., and Farrell, R. L. (1995). Biological control of blue-
stain fungi in wood. Phytopathology, 85(1), 92-97. Bell, A. A., and Wheeler, M. H. (1986). Biosynthesis and functions of fungal melanins.
Annual review of phytopathology, 24(1), 411-451. Kirisits, T. (2007). Fungal associates of European bark beetles with special emphasis on
the ophiostomatoid fungi. In bark and wood boring insects in living trees in Europe, a synthesis (pp. 181-236). Springer Netherlands.
Matusick, G., and Eckhardt, L. G. (2010). Variation in virulence among four root-
inhabiting ophiostomatoid fungi on. Pinus taeda, 361-367. Paine, T. D., Raffa, K. F., and Harrington, T. C. (1997). Interactions among scolytid
bark beetles, their associated fungi, and live host conifers. Annual review of entomology, 42(1), 179-206.
Roulin, A. (2014). Melanin‐based color polymorphism responding to climate
change. Global change biology, 20(11), 3344-3350. Seifert, K. A., Webber, J. F., and Wingfield, M. J. (1993). Methods for studying species
of Ophiostoma and Ceratocystis. Ceratocystis and Ophiostoma taxonomy, ecology and pathogenicity. Edited by MJ Wingfield, KA Seifert, and JF Webber. American Phytopathological Society Press, St. Paul, Minn. pp, 255-260.
Singh, A., Anderson, D., and Eckhardt, L. G. (2014). Variation in resistance of Loblolly
pine (Pinus taeda L.) families against Leptographium and Grosmannia root fungi. Forest Pathology, 44(4), 293-298.
209

Wang, H. L., and Breuil, C. (2002). A second reductase gene involved in melanin
biosynthesis in the sap-staining fungus Ophiostoma floccosum. Molecular Genetics and Genomics, 267(5), 557-563.
Yang, D. Q. (2001). Staining ability of various sapstaining fungi on jack pine short log
sections. Forest products journal, 51(2), 73. Zimmerman, W. C., Blanchette, R. A., Burnes, T. A., and Farrell, R. L. (1995).
Melanin and perithecial development in Ophiostoma piliferum. Mycologia, 857-863.
210

CHAPTER VIII General Conclusions
8.1 Ophiostomatoid fungi
Ophiostomatoid fungi, include several primary tree pathogens that cause blue-
staining in wood (Repe and Jurc, 2010). They have been widely reported from around
the world (Jacobs and Wingfield, 2001), but more specifically in the southern U.S.,
they are associated with pine decline (PD) (Eckhardt et al., 2007). The important fungal
genera involved in the decline are Leptographium, and Grosmannia species (Eckhardt
et al., 2007). They have sticky conidia at the top of the long conidiophore which is ideal
for attachment and the dispersal by bark beetles (Jacobs and Wingfield, 2001).
8.2 The decline of pine in the southern U.S.
Pine Decline has been regarded as a threat to the sustainable forest production
and management in the southern U.S. The decline was first noticed and documented in
1959 in P. taeda forest in Talladega National Forest in Alabama (Brown and
McDowell, 1968). Then increased incidences of the decline occurred in the 1970s and
2000s. Initially, Phytopthora cinnamomi Rands. was thought to be involved in the
decline. However, further researches reported that root-feeding bark beetles and the
related ophiostomatoid fungi were found to be associated with the decline (Eckhardt et
al., 2007).
211
The symptoms of the decline are short and chlorotic needles, reduction in radial
growth, deterioration of the fine and the lateral roots and finally decline and the
mortality of the trees (Brown and McDowell, 1968; Eckhardt et al., 2007). Manion
(1981), gave the death spiral theory which can be used to understand the process of the
decline. Contributing factors, predisposing factors, and the inciting factors are involved
in this decline process. The predisposing factors are topography, drought, increased
slope and southwest facing aspects and the inciting factors are high ozone, increased
soil moisture, and mechanical damage, stand density, and the contributing factors are
high insect population and the fungi carried by the insects. Thus, pathogens play major
role at the end and cause the decline of the trees (Eckhardt et al., 2007).
8.3 Current understanding
Leptographium terbrantis and G. huntii are the most common pathogens of
Pinus species. Pinus taeda, the most common timber species in the southern U.S. is
susceptible to these fungi. These fungi have been associated with pine decline which is
a threat to forest production and management in the southern U.S. Despite the threat,
little has been done to understand the fungal pathogenicity and host response. Artificial
inoculation studies have provided great insights to our understanding. Trees from
various stages such as seedling, sapling, and mature trees have been used for
inoculation (Matusick and Eckhardt, 2010; Singh et al., 2014). The inoculation of
primary lateral roots of P. taeda with the ophiostomatoid fungi can be considered most
promising as it mimics the natural inoculation of the ophiostomatoid fungi by root
212
feeding bark beetles. Measurement of the necrotic area following the fungal inoculation
has been useful to evaluate the virulence and pathogenicity of the fungi.
8.4 Approaches to improve understanding
This dissertation focuses on improving the previous understanding of the fungi
associated with pine decline. The central hypotheses of this dissertation are: (i) there is
intra-specific variation in tolerance of P. taeda families to L. terbrantis and G. huntii
with some family being more tolerant and some being more susceptible (ii) tolerance to
those fungi is the inherent property of P. taeda family independent of the of the tree
(iii) pathogenicity of the fungi changes under the soil moisture stress conditions and
the (iv) Plant Growth-Promoting Rhizobacteria will inhibit the growth of the fungi and
also induces systemic resistance to fungal infection in P. taeda, (v) Virulence of L.
terebrantis varies among different isolates, and (vi) Leptographium terebrantis has
more staining ability at higher inoculation loads.
Artificial inoculation studies were conducted (Chapter 2-7). In chapters 2, 4, 5
and 6, stems of P. taeda seedlings were inoculated with studied fungi. However, in
chapter 3, the primary lateral roots of mature P. taeda were inoculated. More than 90
families of P. taeda were screened for their tolerance to L. terebrantis and G. huntti.
Two families showing tolerant and two showing the susceptibility to the fungi in the
seedling screening study were inoculated in the field (Chapter 3). In chapter 4, two
loblolly pine families were grown under different moisture regimes and inoculated with
G. huntii and L. terebrantis. In chapter 5, fungi and PGPR were inoculated in media
plate, and antagonistic activity was measured in vitro. Also, in another study fungi were
213

inoculated in stems of P. taeda seedling following the inoculation of the PGPR. In
chapter 6, most virulent L. terebrantis among 42 isolates of L. terebrantis isolated from
roots of declining Pinus species by Eckhardt (2007) was determined. Most pathogenic
L. terebrantis was inoculated into P. taeda bolts at different inoculum densities.
8.5 Research results
Pinus taeda families vary significantly in tolerance to L. terebrantis and G.
huntii. The lesion length was considered the strongest response variable. Bare-root and
container-grown seedlings of the same family behaved similarly with respect to
virulence and host resistance. The tolerant families and susceptible families as
determined from the seedling inoculation study showed a similar pattern of the
response to the fungi indicating that the tolerance of P. taeda to L. terebrantis and G.
huntii is a result of family genetics independent of tree age. Also, the production of
large brown necrotic lesions in the lateral root following the fungal inoculation suggests
that the fungi are root-infecting fungi. Even with a single point inoculation, extended
damage was observed in eight weeks.
Pinus taeda pre-exposed to moderate drought were more likely to cause fungal
infection than seedling pre-exposed to severe drought following the L. terebrantis
inoculation. The interaction between fungi and soil moisture was weak. The seedling
volume change, dry needle biomass, and dry stem biomass were lower in the seedlings
receiving fungal treatments under the drought conditions. The family selected for
susceptibility to L. terebrantis and G. huntii had a bigger infection and had less biomass
gain.
214

In chapter 5, studied PGPR strains had the ability to inhibit the growth of the
fungi in vitro. These results suggest that these PGPR strains produce some metabolites
or antagonistic agents that can inhibit fungal growth. Also, specific strains of PGPR
have the ability to induce systemic resistance of P. taeda to L. terebrantis and G. huntii.
Studied PGPR strains also promoted the plant growth. Results suggest that specific
PGPR strains can be used as biocontrol agents and growth promoters.
In chapter 6, different isolates of L. terebrantis had varying virulence. This
suggests that in ecological scale more virulent strains might exist. Leptographium
terebrantis can cause blue-stain in wood tissues following a week after the inoculation.
The frequency and distance between the radial inoculation lead to the quicker spread of
the fungi following inoculation. Leptographium terebrantis causes and extended blue
staining of the wood tissues than G. huntii, L. procerum, and G. alacris. Results suggest
that L. terebrantis can easily move through the bordered pits and may alter the
hydraulic conductance of P. taeda trees in the field.
8.6 Potential future research
To better understand the host-pathogen interaction, molecular mechanisms
involved in the interaction should be focused. Since our research is only focused on the
phenotypic variations in the tolerance and susceptibility of the P. taeda seedlings,
exploring the differential expression of genes following the fungal inoculation will give
clear insights to our understanding. Continued and long-term monitoring of the
seedlings should be performed to understand the effect of different moisture and the
fungal treatments. Also, isolation of the rhizobacterial communities and studying their
215

anti-fungal activity and growth promoting activity would be an appropriate approach
for site selection for P. taeda plantation. To better understand the impact of L.
terebrantis on P. taeda health long term monitoring of the plant physiological response
at different inoculum densities should be performed.
8.7 References
Brown, H. D., and McDowell, W. E. (1968). Status of loblolly pine die-off on the Oakmulgee District, Talladega National Forest, Alabama-1968. US Dep. Agric. For. Serv. Rept, (69-2), 28.
Eckhardt, L. G., Weber, A. M., Menard, R. D., Jones, J. P., and Hess, N. J. (2007).
Insect-fungal complex associated with loblolly pine decline in central Alabama. Forest Science, 53(1), 84-92.
Jacobs, K., and Wingfield, M. J. (2001). Leptographium species: tree pathogens, insect
associates, and agents of blue-stain. American Phytopathological Society (APS Press).
Manion, P. D. (1981). Tree disease concepts. Prentice-Hall, Inc. New Jersy USA. P 10-
56. Matusick, G., Eckhardt, L. G., and Somers, G. L. (2010). Susceptibility of longleaf pine
roots to infection and damage by four root-inhabiting ophiostomatoid fungi. Forest ecology and management, 260(12), 2189-2195.
Repe, A., and Jurc, M. (2010). Ophiostomatoid fungi (Ascomycota: Ophiostomataceae)
associated with bark beetles and their possible economic impact in forests and timber production. Zbornik gozdarstva in lesarstva, (91), 3-12.
Singh, A., Anderson, D., and Eckhardt, L. G. (2014). Variation in resistance of Loblolly
pine (Pinus taeda L.) families against Leptographium and Grosmannia root fungi. Forest Pathology, 44(4), 293-298.
216

Appendix
Table S1. Mean lesion length and occlusion length (overall and across each fungus) (2013) (N = 1978).
Fam Lesion length Occlusion length Overall mean (mm)
Mean (GH) (mm)
Mean (LT) (mm)
Overall mean (mm)
Mean (GH) (mm)
Mean (LT) (mm)
L05 32.80(12.35) 25.53(4.52) 40.25(13.40) 52.91(26.39) 58.15(46.87) 51.33(17.19) L09 32.13(15.10) 26.67(8.17) 38.61(18.65) 59.78(42.30) 58.43(48.59) 60.62(39.16) L16 30.75(12.37) 25.86(6.35) 36.17(15.00) 59.86(38.16) 45.22(17.92) 62.79(40.65) L38 32.13(16.09) 25.38(5.79) 39.22(20.05) 51.70(23.76) 37.319(15.65) 58.10(24.16) L49 29.98(11.65) 26.41(5.78) 33.55(14.67) 51.32(26.11) 49.23(30.97) 51.86(25.34) L50 29.93(11.59) 24.63(5.83) 36.12(13.50) 48.85(17.41) 41.21(10.32) 52.28(19.02) L51 29.24(13.30) 23.39(4.77) 36.38(16.61) 50.21(32.01) 31.76(6.88) 61.28(36.02) L52 27.64(8.30) 24.65(9.02) 30.57(6.37) 42.97(14.82) 34.00(11.06) 47.65(14.55) L53 29.39(9.53) 24.88(5.22) 34.53(10.73) 55.69(36.72) 36.31(10.36) 58.67(38.49) L54 31.90(15.30) 26.31(6.79) 39.07(19.74) 55.90(28.37) 48.12(28.50) 60.65(28.02) L55 33.48(12.68) 28.83(11.54) 38.02(12.20) 52.18(30.62) 46.27(35.62) 55.94(26.88) L56 34.39(14.32) 27.54(11.49) 41.41(13.62) 72.58(47.22) 60.53(34.70) 77.88(51.52) L57 31.31(11.41) 25.40(5.91) 36.94(12.55) 57.31(33.35) 40.61(8.50) 64.73(37.54) L58 29.81(10.96) 24.689(6.68) 36.21(11.94) 50.56(23.75) 38.02(13.62) 57.45(25.24) L59 32.02(14.47) 26.22(10.53) 38.35(15.64) 51.41(20.37) 42.89(23.07) 55.46(18.15) L60 30.45(12.58) 27.03(12.47) 33.78(11.92) 65.57(46.13) 57.76(32.47) 68.58(50.66) L61 28.48(8.40) 24.18(6.32) 32.47(8.18) 53.23(29.63) 70.75(60.15) 48.69(13.26) L62 31.47(10.92) 28.11(10.67) 34.91(10.02) 62.96(42.13) 55.00(31.45) 68.53(48.24) L63 29.95(9.67) 25.99(8.17) 34.24(9.43) 43.72(18.50) 34.40(13.08) 46.32(19.15) L64 29.89(9.42) 25.90(5.88) 34.29(10.64) 52.39(32.50) 40.49(21.80) 57.84(35.43) L65 30.53(11.52) 25.33(4.89) 36.01(13.82) 46.80(16.79) 39.62(13.70) 50.11(17.28) L66 35.84(16.73) 29.27(11.95) 42.09(18.30) 69.37(52.83) 42.31(23.32) 82.89(58.32) L67 34.80(16.65) 29.57(14.14) 39.67(17.47) 67.83(36.84) 83.96(49.43) 61.15(28.65) L68 34.88(18.88) 27.67(9.73) 42.45(22.94) 55.32(27.73) 39.02(16.25) 65.42(28.82) L69 30.86(13.24) 24.22(4.72) 38.22(15.63) 56.27(41.30) 35.95(13.04) 65.65(46.48) L70 28.48(10.67) 25.68(11.81) 31.14(8.80) 44.84(14.03) 35.07(5.82) 48.66(14.51) L71 29.18(11.53) 24.93(7.41) 33.77(13.37) 47.69(36.76) 36.52(12.84) 52.61(42.66) L72 28.61(8.39) 25.06(5.05) 32.24(9.57) 51.09(26.30) 41.53(15.19) 54.28(28.63) L73 26.30(5.70) 24.00(4.10) 28.35(6.17) 40.30(18.21) 51.72(26.79) 34.59(8.32) L74 29.96(7.39) 26.53(4.97) 34.61(7.65) 48.72(24.16) 41.03(13.57) 53.72(28.28) L75 27.68(7.37) 24.35(5.77) 31.27(7.27) 48.76(29.95) 41.12(17.96) 52.58(34.14) L76 31.02(15.77) 24.82(7.69) 37.38(19.16) 56.69(33.97) 32.68(12.13) 68.18(35.18) L77 32.90(16.43) 27.71(13.41) 38.49(17.68) 55.98(36.27) 47.82(32.55) 60.40(38.06) Note: Means followed by the standard deviation in parenthesis, Fam: Family, GH: Grosmannia huntii; LT: Leptographium terebrantis, W: Wound, and WM: Wound + media.
217

Table S2. Estimate and rank of lesion length (overall and among the fungus) (2013).
Family Overall Estimate Rank Estimate (LT) Rank Estimate (GH) Rank L73 -2.93 1 -2.14 1 0.36 27 L52 -1.99 2 -1.47 2 0.27 26 L75 -1.77 3 -1.15 4 0.08 19 L61 -1.59 4 -0.90 6 -0.06 14 L70 -1.55 5 -1.36 3 0.42 29 L72 -1.30 6 -0.91 5 0.12 21 L71 -0.88 7 -0.55 11 0.02 18 L53 -0.65 8 -0.27 13 -0.12 13 L64 -0.60 9 -0.61 10 0.24 24 L49 -0.58 10 -0.76 8 0.41 28 L51 -0.51 11 0.37 21 -0.67 2 L60 -0.48 12 -0.78 7 0.49 30 L63 -0.42 13 -0.37 12 0.12 20 L58 -0.34 14 0.18 18 -0.39 7 L50 -0.32 15 0.20 19 -0.39 6 L65 -0.11 16 -0.02 15 -0.04 16 L57 -0.02 17 0.27 20 -0.28 10 L74 0.00 18 -0.23 14 0.23 23 L76 0.07 19 0.45 22 -0.40 5 L69 0.11 20 0.78 25 -0.71 1 L16 0.18 21 0.11 16 -0.01 17 L62 0.18 22 -0.66 9 0.77 33 L38 0.62 23 0.78 27 -0.41 4 L59 0.77 24 0.78 26 -0.31 9 L54 0.87 25 0.89 29 -0.36 8 L05 1.02 26 1.12 30 -0.50 3 L77 1.16 27 0.53 23 0.17 22 L09 1.24 28 0.81 28 -0.06 15 L55 1.29 29 0.17 17 0.61 32 L56 1.89 30 1.29 32 -0.14 12 L67 1.97 31 0.63 24 0.56 31 L68 2.17 32 1.59 33 -0.28 11 L66 2.48 33 1.25 31 0.26 25
Note: LT: Leptographium terebrantis; GH: Grosmannia huntii.
218

Table S3. Re-isolation percentage of various fungi from inoculated seedlings of different Pinus taeda families (2013).
Family Overall LT GH L05 96 98 93 L09 96 97 92 L16 96 95 95 L38 98 98 95 L49 98 98 95 L50 97 97 95 L51 96 97 93 L52 95 98 91 L53 96 95 95 L54 95 97 93 L55 95 98 90 L56 98 98 95 L57 99 98 98 L58 99 97 98 L59 96 97 92 L60 99 98 98 L61 96 98 93 L62 96 95 95 L63 96 97 93 L64 90 95 84 L65 95 95 93 L66 96 95 95 L67 96 95 95 L68 95 93 95 L69 92 92 90 L70 98 95 98 L71 93 93 91 L72 96 95 95 L73 98 98 95 L74 96 91 98 L75 98 98 95 L76 96 98 93 L77 91 91 90
Note: LT: Leptographium terebrantis, GH: Grosmannia huntii.
219

Table S4. Mean lesion and occlusion length produced in the families (overall and among the fungal treatments) (2014).
Family Lesion length (mm) Occlusion length (mm) Overall mean Mean (GH) Mean(LT) Overall Mean Mean (GH) Mean (LT) L05 26.91(9.46) 29.86(8.24) 24.03(9.78) 36.17(17.52) 43.85(13.21) 28.66(18.09) L09 27.45(11.71) 31.24(11.73) 23.83(10.59) 36.63(18.48) 44.79(15.93) 29.01(17.56) L100 29.62(14.05) 35.44(15.61) 23.49(8.86) 36.59(18.72) 45.27(16.37) 27.44(16.71) L101 28.15(12.21) 32.41(9.66) 24.31(13.09) 39.66(20.21) 49.18(16.52) 31.07(19.53) L102 32.44(16.19) 35.55(11.83) 29.33(19.25) 42.02(23.18) 49.55(15.01) 34.49(27.32) L103 29.18(13.06) 33.55(11.46) 24.7(13.22) 38.14(20.16) 47.59(16.32) 28.42(19.25) L104 30.99(14.96) 37.47(11.57) 24.11(15.23) 35.96(21.82) 45.36(16.66) 25.31(22.31) L106 28.65(13.20) 33.5(14.12) 23.91(10.38) 35.20(17.66) 42.61(15.80) 27.97(16.49) L107 27.47(11.56) 30.36(10.18) 24.64(12.22) 37.24(20.36) 44.54(13.57) 30.12(23.33) L108 23.07(8.09) 26.14(7.78) 19.85(7.17) 28.51(14.58) 34.87(11.86) 21.83(14.29) L109 30.41(15.55) 35.24(16.41) 25.58(13.11) 36.10(20.86) 42.61(19.68) 29.15(20.03) L110 26.42(12.96) 26.89(12.75) 25.77(13.48) 30.66(16.68) 31.36(13.39) 29.69(20.69) L16 26.53(10.72) 28.77(9.54) 24.28(11.46) 37.06(21.52) 40.08(12.35) 34.03(27.69) L38 27.89(14.13) 30.25(12.57) 25.25(15.44) 33.24(20.28) 38.39(19.89) 27.44(19.34) L49 28.83(14.33) 30.11(11.87) 27.55(16.50) 32.25(17.59) 34.19(12.83) 30.32(21.33) L50 26.81(12.16) 27.29(7.18) 26.38(15.40) 30.20(16.95) 33.58(10.63) 27.18(20.75) L78 31.92(18.42) 37.49(16.94) 26.65(18.42) 35.44(23.52) 44.03(19.16) 27.54(24.61) L79 28.96(14.13) 31.71(12.35) 26.07(15.42) 36.97(20.94) 42.64(15.34) 31.02(24.34) L80 32.31(17.55) 37.07(14.31) 28.02(19.20) 41.49(25.41) 51.14(18.99) 32.54(27.47) L81 37.39(21.59) 38.67(16.66) 36.11(25.81) 43.78(27.02) 45.85(22.09) 41.55(31.72) L82 31.81(16.28) 35.84(16.79) 26.95(14.47) 37.61(19.43) 44.29(15.74) 29.54(20.63) L83 32.44(15.14) 37.61(12.88) 27.51(15.62) 40.68(22.60) 50.74(15.76) 31.11(24.09) L84 26.98(13.27) 30.70(12.84) 22.99(12.76) 34.69(19.37) 42.08(14.56) 26.46(20.97) L85 26.47(10.98) 29.49(10.34) 23.13(10.82) 38.11(19.21) 44.25(13.62) 31.31(22.18) L86 24.93(8.61) 26.13(6.45) 23.67(10.34) 34.36(17.33) 36.94(11.64) 31.67(21.61) L87 33.01(24.29) 38.34(23.88) 28.08(23.91) 41.87(28.72) 49.56(25.58) 34.94(29.92) L88 31.81(16.46) 39.31(16.76) 24.12(12.16) 41.70(23.18) 52.11(20.58) 31.04(20.92) L89 27.37(10.02) 31.60(9.74) 23.23(8.53) 37.03(18.21) 45.15(13.02) 28.92(19.16) L90 30.56(14.46) 35.07(13.42) 25.70(14.11) 41.28(20.97) 47.73(18.52) 33.94(21.42) L91 36.72(20.24) 39.80(12.82) 33.73(25.32) 47.79(32.23) 52.90(16.85) 42.83(41.85) L92 27.87(11.73) 31.28(10.95) 24.26(11.59) 35.75(17.50) 42.75(11.50) 28.34(19.76) L93 30.75(14.54) 35.57(13.52) 25.68(13.98) 37.22(20.62) 43.69(18.31) 30.59(20.97) L94 27.13(13.43) 28.98(11.92) 25.27(14.70) 34.00(19.95) 38.92(15.19) 29.09(22.93) L95 26.02(9.86) 28.72(8.77) 23.18(10.24) 36.13(18.52) 42.79(12.82) 29.13(21.02) L96 30.40(14.22) 35.71(13.74) 25.22(12.82) 39.45(19.87) 48.97(16.74) 30.16(18.37) L97 30.01(13.62) 33.67(12.70) 26.45(13.69) 38.67(20.67) 45.79(15.72) 31.56(22.69) L98 27.52(13.20) 28.02(8.23) 27.00(16.96) 32.31(18.36) 33.14(10.82) 31.42(24.01) L99 24.87(9.14) 27.97(9.08) 21.76(8.18) 33.75(17.11) 42.41(13.92) 25.08(15.66) Note: Means followed by the standard deviation in parenthesis.
220

Table S5. Family estimate and ranking for lesion length (overall and across both the treatments) (year: 2014).
Family Estimate Overall rank Estimate GH rank Estimate LT rank L108 -4.30 1 -0.66 5 -0.36 6 L86 -3.12 2 -1.00 2 0.27 30 L99 -3.09 3 -0.50 9 -0.23 10 L95 -2.35 4 -0.47 10 -0.08 21 L85 -2.14 5 -0.31 14 -0.20 12 L16 -1.92 6 -0.60 8 0.14 27 L110 -1.88 7 0.39 32 -0.84 4 L05 -1.58 8 -0.38 12 0.00 22 L92 -1.57 9 -0.21 15 -0.16 16 L94 -1.34 10 -0.62 6 0.30 31 L50 -1.28 11 -0.94 3 0.64 35 L89 -1.17 12 0.08 22 -0.36 5 L98 -1.14 13 -1.05 1 0.78 37 L107 -1.13 14 -0.31 13 0.05 24 L84 -0.88 15 -0.09 17 -0.12 20 L09 -0.84 16 -0.03 18 -0.17 13 L38 -0.76 17 -0.41 11 0.23 29 L101 -0.72 18 0.00 19 -0.17 14 L49 -0.38 19 -0.60 7 0.51 34 L79 -0.27 20 -0.21 16 0.14 28 L106 -0.15 21 0.33 26 -0.37 4 L100 0.01 22 0.67 33 -0.67 2 L103 0.40 23 0.25 24 -0.16 15 L97 0.49 24 0.04 21 0.08 25 L90 1.00 25 0.47 29 -0.24 9 L93 1.02 26 0.45 28 -0.21 11 L96 1.06 27 0.59 31 -0.34 7 L109 1.31 28 0.62 32 -0.31 8 L82 1.70 29 0.30 25 0.11 26 L88 1.76 30 1.36 38 -0.95 1 L104 1.87 31 0.96 37 -0.52 3 L80 2.26 32 0.49 30 0.04 23 L78 2.28 33 0.70 35 -0.16 17 L83 2.35 34 0.69 34 -0.13 19 L87 2.40 35 -0.14 18 -0.14 18 L102 2.42 36 0.13 23 0.44 33 L91 4.53 37 0.36 27 0.71 36 L81 5.13 38 0.01 20 1.21 38
221

Table S6. Re-isolation and survival percentage of various Pinus taeda families (2014).
Family Total LT GH Survival L05 71 71 71 98 L09 69 68 70 95 L100 67 65 69 99 L101 64 60 68 98 L102 81 71 90 98 L103 74 72 76 99 L104 70 72 68 96 L106 63 73 53 98 L107 73 73 74 99 L108 67 66 69 99 L109 72 76 67 97 L110 74 73 74 89 L16 63 59 68 99 L38 65 60 69 94 L49 77 76 79 95 L50 68 68 67 88 L78 68 63 73 93 L79 68 65 76 99 L80 64 64 64 99 L81 77 85 69 97 L82 72 62 80 94 L83 72 79 66 99 L84 78 82 73 99 L85 68 68 67 99 L86 63 60 67 98 L87 84 85 84 98 L88 78 83 73 99 L89 74 76 73 99 L90 78 76 80 99 L91 69 69 69 99 L92 77 79 75 99 L93 73 74 71 99 L94 74 78 71 99 L95 78 75 81 99 L96 68 63 73 99 L97 75 74 76 99 L98 76 79 73 96 L99 72 71 73 99
222

Table S7. Least square means estimate of lesion caused by Grosmannia huntii (2016).
Family Estimate Standard error DF Lower CI Upper CI L05 0.66 0.05 934 0.57 0.76 L09 0.60 0.05 934 0.51 0.70 L111 0.60 0.05 934 0.51 0.70 L112 0.72 0.05 934 0.62 0.81 L113 0.75 0.05 934 0.65 0.85 L114 0.65 0.05 934 0.56 0.75 L115 0.78 0.05 934 0.69 0.88 L116 0.72 0.05 934 0.63 0.82 L117 0.67 0.05 934 0.58 0.77 L118 0.62 0.05 934 0.52 0.72 L122 0.65 0.05 934 0.55 0.75 L123 0.59 0.05 934 0.49 0.68 L124 0.72 0.05 934 0.62 0.81 L126 0.78 0.05 934 0.68 0.87 L127 0.65 0.05 934 0.55 0.75 L128 0.76 0.05 934 0.66 0.86 L129 0.73 0.05 934 0.64 0.83 L130 0.73 0.05 934 0.63 0.83 L16 0.78 0.05 934 0.67 0.88 L33 0.71 0.05 934 0.61 0.81 L38 0.78 0.05 934 0.68 0.88 L49 0.79 0.05 934 0.69 0.88 L50 0.61 0.05 934 0.52 0.71
Note: CI: Confidence interval.
223

Table S8. Least square mean estimates of lesion caused by Leptographium terebrantis (2016).
Family Estimate Standard Error DF Lower CI Upper CI L05 3.01 0.03 971 2.95 3.08 L09 2.94 0.03 971 2.88 3.00 L111 2.87 0.03 971 2.81 2.94 L112 2.94 0.03 971 2.88 3.01 L113 3.02 0.03 971 2.96 3.08 L114 2.95 0.03 971 2.89 3.01 L115 2.93 0.03 971 2.87 2.99 L116 2.91 0.03 971 2.84 2.97 L117 2.90 0.03 971 2.84 2.96 L118 2.90 0.03 971 2.84 2.96 L122 3.00 0.03 971 2.94 3.06 L123 2.93 0.03 971 2.87 2.99 L124 2.96 0.03 971 2.90 3.02 L126 3.06 0.03 971 3.00 3.12 L127 2.88 0.03 971 2.82 2.94 L128 2.92 0.03 971 2.86 2.98 L129 3.10 0.03 971 3.04 3.16 L130 2.96 0.03 971 2.90 3.02 L16 2.87 0.03 971 2.81 2.93 L33 2.83 0.03 971 2.77 2.89 L38 2.90 0.03 971 2.83 2.96 L49 2.98 0.03 971 2.93 3.04 L50 2.96 0.03 971 2.90 3.02
Note: CI: Confidence interval.
224

225
Table S9. Different isolates of Leptographium terebrantis used in the pathogenicity testing (Eckhardt et al., 2007). No Isolate no Plot Source Insect Location County Physioregion Soil Ownership 1 I-03-3150 C2 Insect Hs N 33 42.889 W 85 34.725 Clebrune Ridge and
Valley Fruithurst loam State
2 I-03-2040 P1 Insect Hs N 33 28.485 W 85 44.315 Clay Piedmont Madison sandy loam Federal 3 I-03-2069 P19 Insect Hs N 32 55.911 W 87 23.147 Bibb Coastal Plain Suffolk loamy sand Federal 4 I-03-3125 P17 Insect Hs N 32 57.850 W 87 22.933 Bibb Coastal Plain Maubila flaggy sandy
loam, eroded Federal
5 I-03-2072 C7 Insect Hs N 32 46.117 W 86 59.283 Chilton Coastal Plain Smithdale sandy loam Federal 6 I-03-1848 P15 Insect Pp N 32 59.835 W 87 29.780 Hale Coastal Plain Smithdale sandy loam Federal 7 I-03-2122 P1 Insect Hp N 33 28.485 W 85 44.315 Clay Piedmont Madison sandy loam Federal 8 I-03-2077 P3 Insect Hp N 33 27.870 W 85 44.325 Clay Piedmont Madison sandy clay
loam, eroded Federal
9 I-03-3107 P14 Insect Pp N 32 57.928 W 87 24.715 Clay Piedmont Louisa sandy loam Federal 10 I-03-2013 P2 Insect Ht N 33 28.194 W 85 44.276 Clay Piedmont Madison sandy clay
loam, eroded Federal
11 I-03-1770 P4 Insect Hs N 33 30.444 W 85 42.114 Cleburne Piedmont Madison sandy loam Federal 12 I-03-2031 P21 Insect Hs N 32 55.818 W 87 25.595 Hale Coastal Plain Smithdale sandy loam Federal 13 I-03-3196 P8 Insect Hs N 33 28.660 W 85 44.663 Bibb Piedmont Maubila flaggy sandy
loam Federal
14 I-03-1953 P9 Insect BTB N 33 28.722 W 85 45.094 Clay Piedmont Louisa sandy loam Federal 15 I-03-1772 P32 Insect BTB N 32 47.302 W 87 01.456 Perry Coastal Plain Suffolk loamy sand Federal 16 I-03-2123 P31 Insect BTB N 33 22.603 W W 87
26.853 Tuscaloosa Cumberland
Plateau Smithdale sandy loam Industry
17 I-03-2030 P18 Insect Pp N 32 57.767 W 87 22.805 Bibb Coastal Plain Maubila flaggy sandy loam
Federal
18 I-03-2098 P16 Insect Ht N 32 50.741 W 87 29.733 Hale Coastal Plain Riverview sandy loam Federal 19 I-03-2099 P5 Insect Hs N 33 30.212 W 85 85
41.895 Cleburne Piedmont Madison sandy loam Federal
20 I-03-3179 P21 Insect Pp N 32 55.818 W 87 25.595 Hale Coastal Plain Smithdale sandy loam Federal 21 Control - 22 I-03-1973 P7 Insect BTB N 33 42.797 W 85 40.100 Calhoun Ridge and
Valley Fine-loamy, mixed, semi-active
State
23 I-03-2163 P10 Insect BTB N 33 23.384 W 85 56.898 Talladega Piedmont Federal 24 I-03-2026 P31 Insect Hs N 33 22.603 W W 87
26.853 Tuscaloosa Cumberland
Plateau Smithdale sandy loam Industry

226
25 I-03-1911 P29 Insect Ht N 33 22.585 W 87 26.694 Tuscaloosa Cumberland Plateau
Smithdale sandy loam Industry
26 I-03-1995 P30 Insect Hp N 33 22.537 W 87 26.882 Tuscaloosa Cumberland Plateau
Smithdale sandy loam Industry
27 I-03-2133 P26 Insect Ht N 32 23.206 W 87 26.245 Tuscaloosa Cumberland Plateau
Sweatman sandy loam Industry
28 I-03-3123 P27 Insect Hp N 33 23.229 W 87 26.356 Tuscaloosa Cumberland Plateau
Suffolk sandy loam Industry
29 R-03-3122 P24 Root LOB N 33 24.697 W 87 26.900 Tuscaloosa Cumberland Plateau
Sweatman sandy loam Industry
30 R-03-2088 P23 Root LOB N 33 24.806 W 87 26.657 Tuscaloosa Cumberland Plateau
Suffolk loamy sand Industry
31 R-03-3134 P21 Root LOB N 32 55.818 W 87 25.595 Hale Coastal Plain Smithdale sandy loam Federal 32 R-03-1687 P6 Root LOB N 33 42.826 W 85 40.920 Calhoun Ridge and
Valley Decatur clay loam, eroded
State
33 R-03-3134 P22 Root LOB N 32 56.113 W 87 26.420 Hale Hale Maubila flaggy sandy loam
Federal
34 R-03-3111 P3 Root LOB N 33 27.870 W 85 44.325 Clay Clay Madison sandy clay loam, eroded
Federal
35 R-03-1593 P6 Root LOB N 33 42.826 W 85 40.920 Calhoun Calhoun Decatur clay loam, eroded
State
36 R-03-1622 P12 Root LOB N 32 58.802 W 87 27.123 Bibb Bibb Maubila flaggy sandy loam
Federal
37 R-00-407 P15 Root LOB N 32 59.835 W 87 29.780 Hale Hale Smithdale sandy loam Federal 38 R-00-366 P19 Root LOB N 32 55.911 W 87 23.147 Bibb Bibb Suffolk loamy sand Federal 39 R-00-87-
ss205 P32 Root LOB N 32 47.302 W 87 01.456 Perry Perry Suffolk loamy sand Federal
40 ATCC MYA-3316
P21 Root LOB N 32 55.818 W 87 25.595 Hale Hale Smithdale sandy loam Federal
41 R-00-44-ss6 P3 Root LOB N 33 27.870 W 85 44.325 Clay Clay Madison sandy clay loam, eroded
Federal
42 I-03-1731 P4 Insect LOB N 33 30.444 W 85 42.114 Cleburne Cleburne Madison sandy loam Federal 43 Clem Unknown Root LOB

Table S10. Estimates of lesion length (log) of 42 different Leptographium terebrantis isolates compared to control treatment.
Isolate name Estimate Standard Error t value Pr > |t| Intercept 2.76 0.04 68.99 <0.0001 I-03-3150 0.18 0.06 3.13 0.0018 I-03-2040 0.15 0.06 2.60 0.0094 I-03-2069 0.19 0.06 3.38 0.0008 I-03-3125 0.14 0.06 2.44 0.0150 I-03-2072 0.24 0.06 4.31 <0.0001 I-03-1848 0.31 0.06 5.53 <0.0001 I-03-2122 0.1 0.06 1.83 0.0677 I-03-2077 0.16 0.06 2.83 0.0048 I-03-3107 0.2 0.06 3.57 0.0004 I-03-2013 0.24 0.06 4.22 <0.0001 I-03-1770 0.25 0.06 4.33 <0.0001 I-03-2031 0.28 0.06 5.01 <0.0001 I-03-3196 0.2 0.06 3.58 0.0004 I-03-1953 0.3 0.06 5.32 <0.0001 I-03-1772 0.23 0.06 4.05 <0.0001 I-03-2123 0.19 0.06 3.33 0.0009 I-03-2030 0.27 0.06 4.81 <0.0001 I-03-2098 0.27 0.06 4.77 <0.0001 I-03-2099 0.23 0.06 4.04 <0.0001 I-03-3179 0.14 0.06 2.48 0.0134 I-03-1973 0.18 0.06 3.07 0.0022 I-03-2163 0.16 0.06 2.76 0.0060 I-03-2026 0.35 0.06 6.16 <0.0001 I-03-1911 0.22 0.06 3.93 <0.0001 I-03-1995 0.19 0.06 3.27 0.0011 I-03-2133 0.44 0.06 7.72 <0.0001 I-03-3123 0.23 0.06 4.01 <0.0001 R-03-3122 0.25 0.06 4.38 <0.0001 R-03-2088 0.19 0.06 3.35 0.0009 R-03-3134 0.31 0.06 5.52 <0.0001 R-03-1687 0.21 0.06 3.77 0.0002 R-03-3134 0.33 0.06 5.80 <0.0001 R-03-3111 0.15 0.06 2.63 0.0088 R-03-1593 0.39 0.06 6.82 <0.0001 R-03-1622 0.31 0.06 5.42 <0.0001 R-00-407 0.13 0.06 2.34 0.0195 R-00-366 0.27 0.06 4.74 <0.0001 R-00-87-ss205 0.17 0.06 3.00 0.0028 *LOB-R-00-805 0.68 0.06 11.93 <0.0001
227

R-00-44-ss6 0.38 0.06 6.73 <0.0001 I-03-1731 0.32 0.06 5.65 <0.0001 Clem 0.21 0.06 3.71 0.0002
(* Singh et al., 2014, ATCC: MYA - 3316).
228


![PINUS TAEDA - Inter Link SAS · PINUS TAEDA [Loblolly Pine] Growing zones and origin The loblolly pine is native to the Southeastern United States. Tree profile The evergreen loblolly](https://img.dokumen.tips/doc/110x75/5c486c1993f3c31f4f7b23c2/pinus-taeda-inter-link-sas-pinus-taeda-loblolly-pine-growing-zones-and-origin.jpg)