Embed Size (px)
Citation preview

Respiratory Effects on Fontan Circulation DuringRest and Exercise Using Real-Time CardiacMagnetic Resonance ImagingZhenglun Wei, Georgia Institute of Technology & Emory UniversityKevin K. Whitehead, Georgia Institute of Technology & Emory UniversityReza H. Khiabani, Children’s Hospital of PhiladelphiaMichael Tree, Georgia Institute of Technology & Emory UniversityElaine Tang, Georgia Institute of Technology & Emory UniversityStephen M Paridon, Georgia Institute of Technology & Emory UniversityMark A. Fogel, Children’s Hospital of PhiladelphiaAjit Yoganathan, Emory University
Journal Title: Annals of Thoracic SurgeryVolume: Volume 101, Number 5Publisher: Elsevier | 2016-05-01, Pages 1818-1826Type of Work: Article | Post-print: After Peer ReviewPublisher DOI: 10.1016/j.athoracsur.2015.11.011Permanent URL: https://pid.emory.edu/ark:/25593/s2npn
Final published version: http://dx.doi.org/10.1016/j.athoracsur.2015.11.011
Copyright information:© 2016 The Society of Thoracic Surgeons.This is an Open Access work distributed under the terms of the CreativeCommons Attribution-NonCommercial-NoDerivatives 4.0 International License(http://creativecommons.org/licenses/by-nc-nd/4.0/).
Accessed March 23, 2022 11:20 AM EDT

Respiratory Effects on Fontan Circulation during Rest and Exercise Utilizing Real Time Cardiac Magnetic Resonance Imaging
Zhenglun Wei, PhD1, Kevin K. Whitehead, MD, PhD2, Reza H. Khiabani, PhD1, Michael Tree1, Elaine Tang1, Stephen M. Paridon, MD2, Mark A. Fogel, MD2, and Ajit P. Yoganathan, PhD1,*
1Wallace H. Coulter Department of Biomedical Engineering, Georgia Institute of Technology & Emory University, Atlanta, GA, USA
2Division of Cardiology and Department of Radiology, Children’s Hospital of Philadelphia, Philadelphia, PA, USA
Abstract
Background—It is known that respiration modulates cavopulmonary flows, but there is little
data comparing mean flows under breath holding and free breathing conditions to isolate the
respiratory effects, as well as effects of exercise on the respiratory modulation.
Methods—Real time phase contrast magnetic resonance combined with a novel method to track
respiration on the same image acquisition was used to investigate respiratory effects on Fontan
caval and aortic flows under breath holding, free breathing and exercise conditions. Respiratory
phasicity indices based on beat-averaged flow was employed to quantify the respiratory effect.
Results—Flow during inspiration was significantly higher than expiration under the free
breathing and exercise conditions for both inferior vena cava (inspiration/expiration: 1.6±0.5 and
1.8±0.5, respectively) and superior vena cava (inspiration/expiration: 1.9±0.6 and 2.6±2.0,
respectively). Changes from rest to exercise in the respiratory phasicity index for these vessels
further showed the impact of respiration. Total systemic venous flow showed no significant
statistical difference between the breath holding and free breathing conditions. In addition, no
significant difference was found between the descending aorta and inferior vena cava mean flows
under either resting or exercise conditions.
Conclusions—This study demonstrated that inferior vena cava and superior vena cava flow time
variance is dominated by respiratory effects, which can be detected by the respiratory phasicity
index. However, the minimal respiration influence on net flow validates the routine use of breath
*Corresponding Author: Ajit P. Yoganathan, 387 Technology Circle, Suite 232, Atlanta, GA, USA 30313, Ph. (404) 894-2849, Fax. (404) 894-1268, [email protected] Wei and Whitehead contributed equally to this manuscript.
Publisher's Disclaimer: This is a PDF file of an unedited manuscript that has been accepted for publication. As a service to our customers we are providing this early version of the manuscript. The manuscript will undergo copyediting, typesetting, and review of the resulting proof before it is published in its final citable form. Please note that during the production process errors may be discovered which could affect the content, and all legal disclaimers that apply to the journal pertain.
HHS Public AccessAuthor manuscriptAnn Thorac Surg. Author manuscript; available in PMC 2017 May 01.
Published in final edited form as:Ann Thorac Surg. 2016 May ; 101(5): 1818–1825. doi:10.1016/j.athoracsur.2015.11.011.
Author M
anuscriptA
uthor Manuscript
Author M
anuscriptA
uthor Manuscript
holding techniques to measure mean flows in Fontan patients. Moreover, the mean flows in the
inferior vena cava and descending aorta are interchangeable.
Keywords
Fontan; MRI; Exercise; Bioengineering
Completion of Fontan palliation in single ventricle patients usually culminates in the total
cavopulmonary connection (TCPC) with either an extra cardiac (EC) or a lateral tunnel (LT)
connection [1]. TCPC hemodynamics are affected in a complicated way by several factors
including anatomical and flow parameters [2], vascular resistances and compliances [3],
exercise, respiration, and peripheral muscular contractions [4]. Further, these complexities
appear related to clinical outcomes [5].
Precise flow measurement in various physiologic states, especially respiration, is key for
numerically assessing TCPC hemodynamics [6]. Current TCPC flow measurements are
commonly acquired either during breath holding or averaged during free breathing (at the
expense of image blurring)[7]. Despite the apparent effects of respiration and exercise, few
studies have focused specifically on delineating these effects [8,9]. Of those that do, some
suggest that because of the high venous capacitance in the lower body, one primary effect of
inspiration is to increase (as much as 80%) the flow rate and pulsatility of the inferior vena
cava [9–14]. Hjortdal et al. examined respiration effects and used an air-filled belt around the
abdomen of patients to monitor their respiration, as their imaging method did not allow
direct tracking of respiratory cycles [9]. Additionally, the literature lacks a comprehensive
study including a comparison of resting breath holding, resting free breathing, and exercise
conditions, in order to isolate respiratory effects while keeping other factors constant.
With the advent of advanced real time phase-contrast magnetic resonance (rtPCMR)
imaging technologies and image processing techniques, a detailed analysis of respiration
effects during rest and exercise is now feasible. In this study, we utilized rtPCMR to
investigate respiration effects during resting free breathing, resting breath hold, and supine
exercise conditions. Respiratory patterns and vessel flow rates were simultaneously
measured in real time using a novel chest wall tracking method. The adequate flow metrics
to accurately quantify respiration effects will also be discussed.
Patients and Methods
Patient Cohort
The patients involved in the current study were identified from our prospective enrolled
Fontan database. Eleven consecutive single ventricle patients with TCPC anatomy (males/
females=7/4; age=20.7±2.9 years, BSA= 1.8±0.2 m2; LT/EC=10/1; left/right/mixed
ventricular morphology = 3/6/2; hypoplastic left heart syndrome (HLHS) = 5; fenestration =
2), who completed rtPCMR at rest and at exercise were included. They all have normal
bilateral diaphragm function and had at most mild ventricular dysfunction (EF = 42–73%).
The inclusion criteria were: 1) TCPC with no other sources of pulmonary blood flow, 2) the
ability to undergo the metabolic exercise stress test, using a stationary cycle ergometer.
Wei et al. Page 2
Ann Thorac Surg. Author manuscript; available in PMC 2017 May 01.
Author M
anuscriptA
uthor Manuscript
Author M
anuscriptA
uthor Manuscript

Patients with pacemakers, or other metal devices producing detrimental imaging artifacts,
and significant differences in heart rate between individual vessel flow measurements were
excluded. Any heart rate difference affected cardiac output which, in turn, impacted the flow
measurements. In this study, 4 patients were excluded because the heart rate difference
between the acquisitions of their Ao and DAo were larger than 20% of the Ao heart rate.
Patients enrolled in this study had all previously completed a routine maximal metabolic
exercise test using a ramp cycle protocol. Ventilatory anaerobic threshold (VAT) was
measured by the V-slope method, and body surface area (BSA) of all patients calculated
using their measured weight and height. Informed consent was obtained from all patients
and all study protocols complied with the Institutional Review Boards of the participating
institutions.
Data acquisition protocol
A 1.5 T Avanto Whole Body system (Siemens Medical Solutions, Malvern, PA) was used in
anatomic and PCMR imaging. The imaging protocol, which utilized parallel imaging, began
with an anatomic survey using static steady state free precession; this data was reformatted
to acquire slice orientations and positions perpendicular to flow for rtPCMR acquisitions.
The rtPCMR was an echoplanar sequence utilizing shared velocity encoding, the details of
which have been described previously [15]. It utilized, in general, the following parameters:
Repetition time =9.5 msec, Echo time =4.1 msec, Flip angle of 30 degrees, Field of
view=320–400 mm, Slice thickness=8–10 mm, and Bandwidth=2841 Hz/pixel. The
acquisition protocol consisted of through-plane PCMR across the superior (SVC) and
inferior (IVC) vena cava, ascending (Ao) and descending (DAo) aorta for at least 10 seconds
(20 frames per second, approximately). The IVC flow was acquired near the diaphragm but
above the hepatic entrance to the IVC. The same imaging protocol was performed under the
resting FB and BH conditions. Flows during the breath holding were acquired at the end of
expiration, while FB flows include inspiration and expiration.
After the resting rtPCMR acquisition, the patients were slid partially out from the magnetic
resonance imaging bore to perform lower leg exercise using an MRI-compatible supine
bicycle ergometer (Lode BV, Groningen, the Netherlands). This ergometer allows
revolutions per minute-independent workload ranging from 10 to 250 Watts while the patient
maintains their position by bracing themselves with hand grips. The goal was to bring the
patients from the resting conditions up to a steady work rate at their VAT as measured in
their metabolic exercise test, which was a sustainable work rate for the completion of the
PCMR data acquisition. Heart rate was monitored continuously. Initially, the workload was
set to 20 watts which was increased progressively at a rate of 20 watts per minute to obtain a
heart rate corresponding to that of the heart rate at VAT on their prior metabolic exercise test
Exercise was then suspended, their feet quickly removed from the ergometer pedals and they
were automatically returned to isocenter for imaging (< 10 seconds). Using this method,
rtPCMR measurements of the Ao, DAo, IVC, and SVC were acquired with repeated exercise
performed in between for the patient to return to the target heart rate.
Wei et al. Page 3
Ann Thorac Surg. Author manuscript; available in PMC 2017 May 01.
Author M
anuscriptA
uthor Manuscript
Author M
anuscriptA
uthor Manuscript

Image processing and data analysis
A semi-automatic protocol for image processing, chest wall tracking, and flow segmentation
was developed using a freely-available software, Segment (Medviso.com). First, time-
varying velocity fields, from through-plane PCMR slices, were integrated spatially over
vessel crosssectional areas (e.g. at DAo) to calculate the associated flow (Q) waveforms.
Inspiration and expiration periods corresponding to each vessel’s flow waveform were
determined by tracking chest wall motion in each vessel’s corresponding magnitude image
and measuring the temporal variations in cross-sectional area of the thoracic cavity (Figure
1). The inspiration period was identified by the time points from the local minimum to local
maximum chest wall cross-sectional area, and the expiration period was from local
maximum to local minimum. This approach, which strongly synchronizes the measurements
of respiration and vessel’s flow, provides better investigation of respiratory effects by
avoiding inscrutable time delays between the patient’s respiratory movement and the
appearance of the respiratory signal [9]. The number of respiratory and cardiac cycles in the
acquisition period and the average respiratory and heart rates (RR and HR, respectively)
were also calculated with this method.
Time averaged flow rates during inspiration and expiration were calculated using the
corresponding times determined from chest wall motion tracking. Since no respiration is
expected under the breath holding condition, the time durations to obtain the time-averaged
vessel flow rates under breath holding were identical to those under free breathing in the
same acquisition. Systemic return (Qs) was calculated by adding IVC and SVC flow rates.
All flow rates were normalized by patient BSA.
General pulsatility index (PI) was calculated to quantify the overall flow pulsations (caused
by both cardiac and respiratory effects) across each vessel i as:
(1)
where Qi,mean was the mean (time-averaged) flow rate over the respiratory cycle, and Qi,min,
and Qi,max were the minimum and maximum instantaneous flow rates during the respiratory
cycle (Figure 2a).
A respiratory phasicity index (PIresp) was defined to quantify the flow pulsations caused
only by respiratory effects. To calculate PIresp in the free breathing condition, the respiratory
cycle was first divided into cardiac cycle timeframes based on the tracked chest wall motion
(Figure 2a). The beat-averaged flow is obtained by averaging the flow rate, as shown in
Figure 2b, based on the cardiac cycle timeframe, which was calculated as the total acquired
flow data time in a respiratory cycle divided by the total number of heart beat in this
respiratory cycle. The heart beat is distinguished by apparent peaks of instantaneous flow
rate, i.e. 3.5 peaks in Figure 2b. These beat-averaged flows were then used to calculate PIresp
as:
Wei et al. Page 4
Ann Thorac Surg. Author manuscript; available in PMC 2017 May 01.
Author M
anuscriptA
uthor Manuscript
Author M
anuscriptA
uthor Manuscript

(2)
where qi,max was the highest beat-averaged flow rate over the respiratory cycle, and qi,min
was the minimum beat-averaged flow rate. PIresp in the breath holding condition, which
quantifies the small temporal variations in vessel flow rates, was calculated in a time frame
equal to the respiratory cycle in the free breathing condition.
Statistical analysis
All variables are presented as mean values with standard deviations, unless otherwise stated.
In all comparisons, a p-value<0.05 was considered significant [16]. Most comparisons of
this study involve three different conditions of the same set of patients (n=11). Therefore, the
one-way ANOVA with Tukey test was employed for normally distributed datasets, and the
Kruskal-Wallis with Dunn test was utilized for non-normal distribution. On the other hand,
for comparisons only involving two conditions, a paired two-tailed test was utilized for
normally distributed datasets, and the Mann-Whitney test was employed for sets with a non-
normal distribution.
Results
The measured flow and respiration parameters during resting FB, resting BH, and exercise
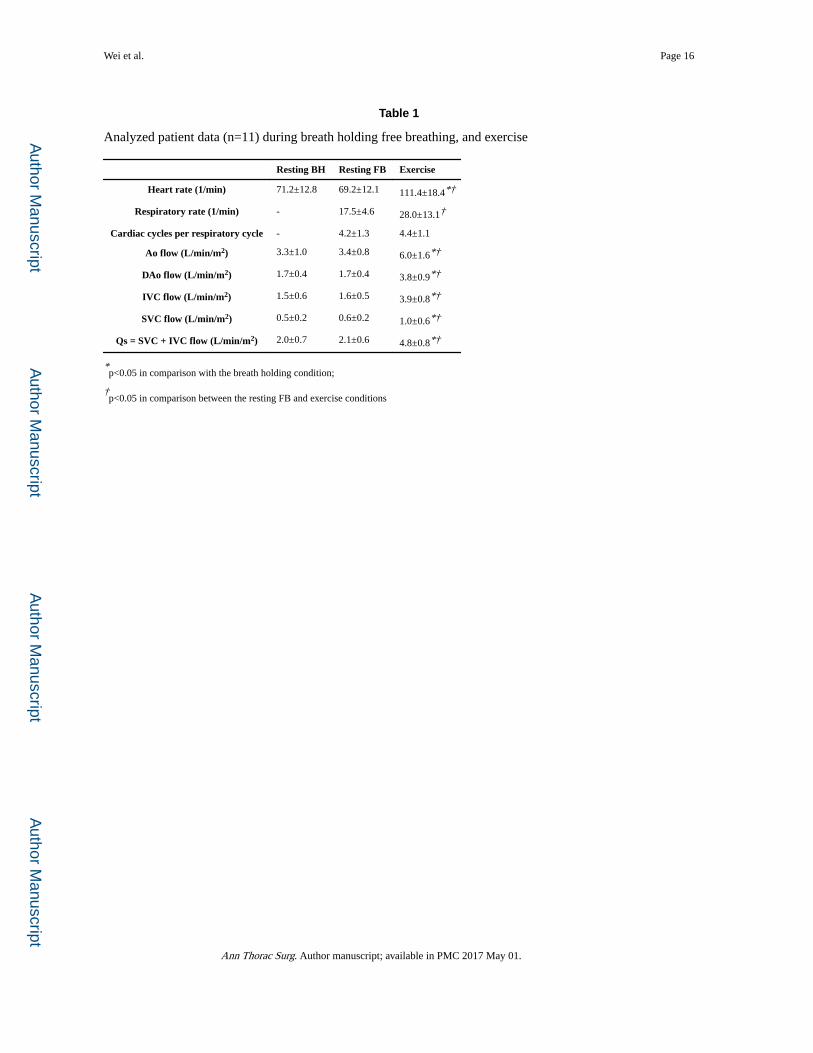
conditions are summarized in Tables 1 and 2.
Respiratory effects at the resting conditions
As presented in Table 1, heart rate did not change significantly between the resting BH and
FB conditions. Each respiratory cycle at free breathing included, on average, 4.2±1.3 cardiac
cycles. Total systemic venous flow did not show significant statistical difference from the
BH to FB conditions (2.0±0.7 L/min/m2 vs. 2.1±0.6 L/min/m2, respectively).
As presented in Table 2, only IVC and SVC flow rates were significantly higher during
inspiration than during expiration at the resting free breathing condition (Qinsp/
Qexpr=1.6±0.5 for IVC and 1.9±0.6 for SVC).
The general pulsatility index at the free breathing condition was significantly higher than the
breath holding condition in only the IVC. Respiratory phasicity index was significantly
higher in both the IVC and SVC at resting free breathing compared with the breath holding
condition.
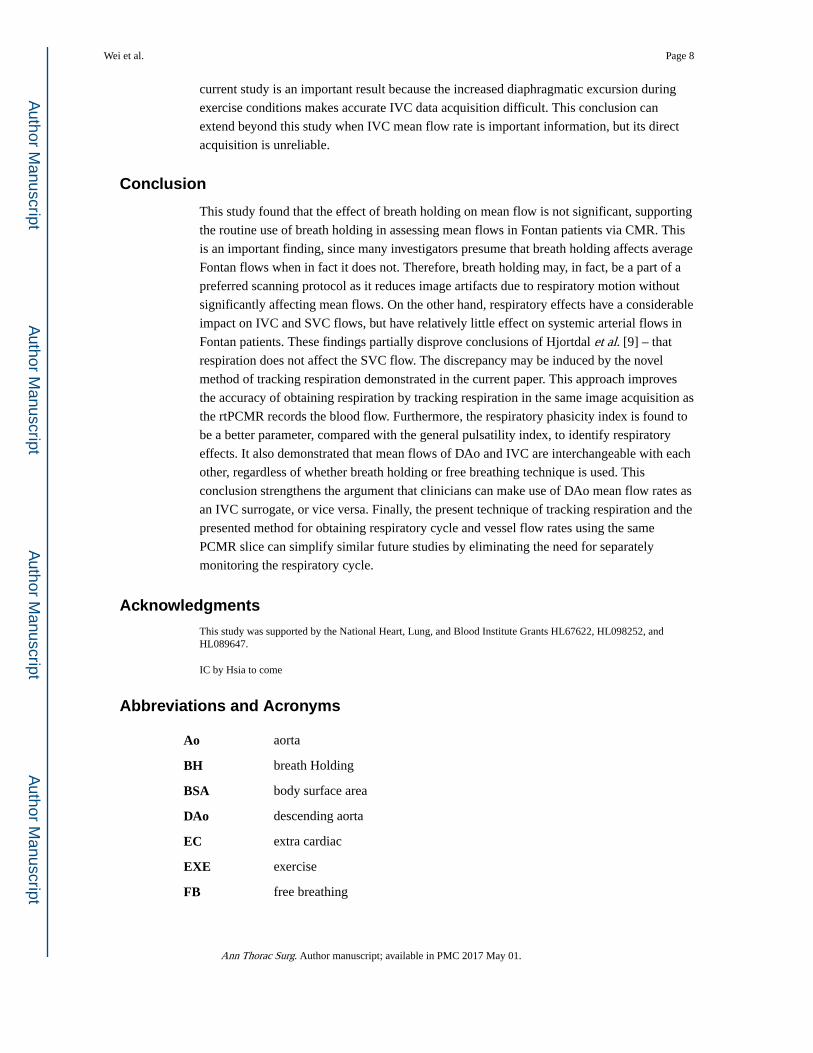
Time varying resting (BH and FB) vessel flow waveforms and corresponding respiratory
cycles of a representative patient (female, 21 years old, EC, BSA=1.7 m2) are presented in
Figure 3.
Respiratory effects at the exercise condition
As presented in Tables 1, both HR and RR increased (1.6×) significantly from resting to the
exercise condition. However, the number of cardiac cycles per respiratory cycle did not
Wei et al. Page 5
Ann Thorac Surg. Author manuscript; available in PMC 2017 May 01.
Author M
anuscriptA
uthor Manuscript
Author M
anuscriptA
uthor Manuscript

change significantly between the resting FB and exercise conditions (4.4±1.1). Aortic,
individual caval, and systemic return flow rates increased significantly in the exercise
condition compared to the resting conditions. Similar to the resting condition, only exercise
IVC and SVC flow rates were significantly higher during inspiration compared to expiration
(Qinsp/Qexpr≈1.8±0.5 for IVC and 2.6±2.0 for SVC) (Table 2).
The IVC general pulsatility and IVC and SVC respiratory phasicity indices under the
exercise condition are significantly higher than the breath holding condition. The DAo
general pulsatility significantly decreases from resting FB to the exercise condition, while
the Ao general pulsatility does not.
Time varying vessel flow waveforms and corresponding respiratory cycles of a
representative patient (female, 21 years old, EC, BSA=1.7 m2) under the exercise condition
are presented in Figure 4.
Equivalent mean flow rates between IVC and DAo
Table 1 demonstrates that the mean flow rates of DAo are 1.7±0.4 L/min/m2, 1.7±0.4
L/min/m2, and 3.8±0.9 L/min/m2 for the resting BH, FB and exercise conditions,
respectively. The counterparts of IVC are 1.5±0.6 L/min/m2, 1.6±0.5 L/min/m2, and 3.9±0.8
L/min/m2. Figure 5 shows the Bland-Altman plots of the time-averaged flow rate of the IVC
versus the DAo under the resting and exercise conditions. The 95% limits of agreement are
indicated by the “2SD” lines. The analyses demonstrate mean difference of 13%, 7%, and
4% corresponding to the mean values of average flow rate in the IVC and DAo under the
BH, FB, and exercise conditions, respectively. None of the differences were statistically
significant.
Comment
The TCPC is a passive low pressure system, and therefore any pressure changes in the
thoracic cavity (due to respiration) can significantly affect its flow waveforms. On the other
hand, external pressure changes have relatively little effect on aortic flows, a higher pressure
system. Utilizing rtPCMR, our study demonstrated that respiration does not affect systemic
venous flow present in single ventricle patients after TCPC, but exercise affects it. Also, IVC
pulsatility indices increased breath holding to free breathing, however, it did not change
between free breathing and exercise. The DAo pulsatility index decreases from resting FB to
the exercise condition, while the Ao pulsatility index does not. In some patients the AAo
may have less pulsatility due to surgically placed non-compliant patch materials. In the
current study, 5 of 11 patients were diagnosed with HLHS, and likely had such a patch.
Therefore, it is reasonable to find a significant decrease in the general pulsatility index in the
DAo between resting FB and exercise conditions, while seeing no such different in the AAo.
Furthermore, neither the mean flow nor pulsatility indices of Ao and Dao changes
significantly during respiration, confirming that the pulmonary circulation acts as a capacitor
to moderate systemic flow even in this passive flow system. Aortic flow was greater that
systemic venous return due to systemic to pulmonary collateral flow.
Wei et al. Page 6
Ann Thorac Surg. Author manuscript; available in PMC 2017 May 01.
Author M
anuscriptA
uthor Manuscript
Author M
anuscriptA
uthor Manuscript

The findings in this study agree with and add to other real-time MRI-based studies. Most
notably, Hjortdal et al.[9] report similar increases in IVC and aortic flow between the resting
and exercise conditions, the augmentation of only IVC flow during inspiration, and the
capacitor-like nature of the pulmonary circulation. However, Hjortdal et al.[9] does not
report an increase in SVC flow during exercise, or the augmentation of SVC flow during
inspiration seen here. The differences in SVC flow results shown here may be attributed to
an older patient cohort (12.4±4.6 years vs 20.0±6.3 years) or of the novel respiration
tracking method. Hjortdal et al. admitted that respiratory pressures are distributed to both the
IVC and SVC equally, and they possibly see effects only on the IVC because of a less
accurate respiration tracking method [9]. This study’s technique employed simultaneous
image processing of blood flow and chest wall motion to better align respiration effects.
Acquiring data at both the resting BH and FB conditions in the present study provided the
framework to independently compare the respiratory effects on mean vessel flows. During
resting free breathing the overall flow pulsatility increased significantly compared to breath
holding in the IVC (Table 2). This finding confirmed previous observations of the
pronounced effect of respiration on the IVC flow waveform [9–11].
Furthermore, as shown in Figure 3, a distinct respiratory pattern was also present in SVC
flow waveforms (a similar SVC respiratory pattern may also be recognized [9]). However,
this was somewhat masked by the SVC cardiac pulsatility at rest. By defining the respiratory
phasicity index (Table 2), this study was better able to quantify the SVC respiratory effect.
While respiration has an effect on both IVC and SVC flow waveforms, the data presented
suggests that it has a minimal effect on net flow. The small mean difference between breath
holding and free breathing conditions (0.1 L/min/m2) challenges the notion that respiration
acts as a significant pump which drives flow through the Fontan physiology [17]. This
change in thinking was previously suggested by Fogel et al. [18] when they estimated
respiratory effects to be only 30% of the overall driving force in the systemic venous
pathway [10]. In addition to challenging the notion of the respiratory pump, the lack of
respiration influence on net flow validates the routine use of breath holding techniques to
measure mean flows in Fontan patients. However, this minimal effect on mean flow should
not lead to false application of time-averaged flow boundary conditions in Fontan circulation
computational models. The significant increase in TCPC inlet flow pulsatility from BH to
FB conditions will introduce noticeable power loss error in computational simulations if
transient boundary conditions are not employed [19]. In addition to this bulk metric,
investigating detailed unsteady flow and pressure [13], stagnation points, wall shear stress,
etc. undoubtedly requires transient boundary conditions. Ultimately, pulsatile boundary
conditions are always recommended for any simulations or in vitro experiments based on FB
conditions.
Previous work has demonstrated that it is inappropriate to substitute DAo flow for IVC flow
in patients with superior cavopulmonary connections, primarily due to the prevalence of
upper body to lower body systemic venous collaterals or veno-veno collaterals. However,
systemic venous collaterals may not be a significant issue in the TCPC population for the
most part [20]. The interchangeability of the DAo and IVC mean flow rates proved in the
Wei et al. Page 7
Ann Thorac Surg. Author manuscript; available in PMC 2017 May 01.
Author M
anuscriptA
uthor Manuscript
Author M
anuscriptA
uthor Manuscript
current study is an important result because the increased diaphragmatic excursion during
exercise conditions makes accurate IVC data acquisition difficult. This conclusion can
extend beyond this study when IVC mean flow rate is important information, but its direct
acquisition is unreliable.
Conclusion
This study found that the effect of breath holding on mean flow is not significant, supporting
the routine use of breath holding in assessing mean flows in Fontan patients via CMR. This
is an important finding, since many investigators presume that breath holding affects average
Fontan flows when in fact it does not. Therefore, breath holding may, in fact, be a part of a
preferred scanning protocol as it reduces image artifacts due to respiratory motion without
significantly affecting mean flows. On the other hand, respiratory effects have a considerable
impact on IVC and SVC flows, but have relatively little effect on systemic arterial flows in
Fontan patients. These findings partially disprove conclusions of Hjortdal et al. [9] – that
respiration does not affect the SVC flow. The discrepancy may be induced by the novel
method of tracking respiration demonstrated in the current paper. This approach improves
the accuracy of obtaining respiration by tracking respiration in the same image acquisition as
the rtPCMR records the blood flow. Furthermore, the respiratory phasicity index is found to
be a better parameter, compared with the general pulsatility index, to identify respiratory
effects. It also demonstrated that mean flows of DAo and IVC are interchangeable with each
other, regardless of whether breath holding or free breathing technique is used. This
conclusion strengthens the argument that clinicians can make use of DAo mean flow rates as
an IVC surrogate, or vice versa. Finally, the present technique of tracking respiration and the
presented method for obtaining respiratory cycle and vessel flow rates using the same
PCMR slice can simplify similar future studies by eliminating the need for separately
monitoring the respiratory cycle.
Acknowledgments
This study was supported by the National Heart, Lung, and Blood Institute Grants HL67622, HL098252, and HL089647.
IC by Hsia to come
Abbreviations and Acronyms
Ao aorta
BH breath Holding
BSA body surface area
DAo descending aorta
EC extra cardiac
EXE exercise
FB free breathing
Wei et al. Page 8
Ann Thorac Surg. Author manuscript; available in PMC 2017 May 01.
Author M
anuscriptA
uthor Manuscript
Author M
anuscriptA
uthor Manuscript

HLHS hypoplastic left heart syndrome
HR heart rate
IVC inferior vena cava
LT lateral tunnel
PCMR phase contrast magnetic resonance
PI general pulsatility index
PIresp respiratory pulsatility index
Q flow rate
Qexpr mean flow rate during expiration
Qinsp mean flow rate during inspiration
Qs systemic return
RR respiratory rate
rtPCMR real time phase contrast magnetic resonance
SVC superior vena cava
VAT ventilatory anaerobic threshold
References
1. Mair DD, Puga FJ, Danielson GK. The Fontan procedure for tricuspid atresia: Early and late results of a 25-year experience with 216 patients. J Am Coll Cardiol. 2001; 37:933–939. [PubMed: 11693773]
2. Dur O, DeGroff CG, Keller BB, Pekkan K. Optimization of Inflow Waveform Phase-Difference for Minimized Total Cavopulmonary Power Loss. J Biomech Eng Asme. 2010; 132
3. Orlando W, Shandas R, DeGroff C. Efficiency differences in computational simulations of the total cavo-pulmonary circulation with and without compliant vessel walls. Comput Methods Programs Biomed. 2006; 81:220–227. [PubMed: 16455152]
4. Hsia TY, Khambadkone S, Deanfield JE, Taylor JFN, Migliavacca F, de Leval MR. Subdiaphragmatic venous hemodynamics in the Fontan circulation. J Thorac Cardiovasc Surg. 2001; 121:436–447. [PubMed: 11241078]
5. Whitehead KK, Pekkan K, Kitajima HD, Paridon SM, Yoganathan AP, Fogel MA. Nonlinear power loss during exercise in single-ventricle patients after the Fontan: insights from computational fluid dynamics. Circulation. 2007; 116:I165–1171. [PubMed: 17846299]
6. Tang E, Haggerty CM, Khiabani RH, de Zelicourt D, Kanter J, Sotiropoulos F, et al. Numerical and experimental investigation of pulsatile hemodynamics in the total cavopulmonary connection. J Biomech. 2013; 46:373–382. [PubMed: 23200904]
7. Gregg CL, Butcher JT. Translational paradigms in scientific and clinical imaging of cardiac development. Birth Defects Res Part C-Embryo Today-Reviews. 2013; 99:106–120.
8. Hsia TY, Khambadkone S, Bradley SM, de Leval MR. Subdiaphragmatic venous hemodynamics in patients with biventricular and Fontan circulation after diaphragm plication. J Thorac Cardiovasc Surg. 2007; 134:1397–1405. [PubMed: 18023650]
9. Hjortdal VE, Emmertsen K, Stenbog E, Frund T, Schmidt MR, Kromann O, et al. Effects of exercise and respiration on blood flow in total cavopulmonary connection - A real-time magnetic resonance flow study. Circulation. 2003; 108:1227–1231. [PubMed: 12939218]
Wei et al. Page 9
Ann Thorac Surg. Author manuscript; available in PMC 2017 May 01.
Author M
anuscriptA
uthor Manuscript
Author M
anuscriptA
uthor Manuscript

10. Fogel MA, Weinberg PM, Hoydu A, Hubbard A, Rychik J, Jacobs M, et al. The nature of flow in the systemic venous pathway measured by magnetic resonance blood tagging in patients having the Fontan operation. J Thorac Cardiovasc Surg. 1997; 114:1032–1041. [PubMed: 9434698]
11. Hsia TY, Khambadkone S, Redington AN, Migliavacca F, Deanfield JE, de Leval MR. Effects of respiration and gravity on infradiaphragmatic venous flow in normal and Fontan patients. 102:2000.
12. Pedersen EM, Stenbøg EV, Fründ T, Houlind K, Kromann O, Sørensen KE, et al. Flow during exercise in the total cavopulmonary connection measured by magnetic resonance velocity mapping. Heart. 2002; 87:554–558. [PubMed: 12010939]
13. Vukicevic M, Conover T, Jaeggli M, Zhou J, Pennati G, Hsia T, et al. Control of respiration-driven retrograde flow in the subdiaphragmatic venous return of the Fontan circulation. ASAIO J. 2014:21–23.
14. Vukicevic M, Chiulli Ja, Conover Ta, Pennati G, Hsia T-Y, Figliola RS. Mock circulatory system of the fontan circulation to study respiration effects on venous flow behavior. ASAIO J. 2013; 59:253–260. [PubMed: 23644612]
15. Lin HY, Bender JA, Ding Y, Chung YC, Hinton AM, Pennell ML, et al. Shared velocity encoding: A method to improve the temporal resolution of phase-contrast velocity measurements. Magn Reson Med. 2012; 68:703–710. [PubMed: 22139889]
16. Miller, Da. “Significant” and “highly significant”. Nature. 1966; 210:1190. [PubMed: 5964197]
17. Rowland TW. The circulatory response to exercise: Role of the peripheral pump. Int J Sports Med. 2001; 22:558–565. [PubMed: 11719890]
18. Fogel, Ma; Weinberg, PM.; Hoydu, aK; Hubbard, aM; Rychik, J.; Jacobs, ML., et al. Effect of surgical reconstruction on flow profiles in the aorta using magnetic resonance blood tagging. Ann Thorac Surg. 1997; 63:1691–1700. [PubMed: 9205169]
19. Khiabani RH, Restrepo M, Tang E, De Zélicourt D, Sotiropoulos F, Fogel M, et al. Effect of flow pulsatility on modeling the hemodynamics in the total cavopulmonary connection. J Biomech. 2012; 45:2376–2381. [PubMed: 22841650]
20. Whitehead KK, Gillespie MJ, Harris MA, Fogel MA, Rome JJ. Noninvasive quantification of systemic-to-pulmonary collateral flow: A Major Source of Inefficiency in Patients With Superior Cavopulmonary Connections. Circ Cardiovasc Imaging. 2009; 2:405–411. [PubMed: 19808629]
Wei et al. Page 10
Ann Thorac Surg. Author manuscript; available in PMC 2017 May 01.
Author M
anuscriptA
uthor Manuscript
Author M
anuscriptA
uthor Manuscript

Figure 1. Chest wall motion tracking, showing the minimum and maximum areas of the thoracic
cavity at the end of a) expiration, and b) inspiration
Wei et al. Page 11
Ann Thorac Surg. Author manuscript; available in PMC 2017 May 01.
Author M
anuscriptA
uthor Manuscript
Author M
anuscriptA
uthor Manuscript

Figure 2. Schematic showing the flow rates used for calculating the flow overall pulsatility index (PI)
and the respiratory phasicity index (PIresp)
Wei et al. Page 12
Ann Thorac Surg. Author manuscript; available in PMC 2017 May 01.
Author M
anuscriptA
uthor Manuscript
Author M
anuscriptA
uthor Manuscript
Figure 3. Resting flow waveforms of a) inferior vena cava (IVC), b) superior vena cava (SVC), c)
aorta (Ao), and d) descending aorta (DAo) at the free breathing (solid line) and breath
holding (dashed line) conditions along with the corresponding respiratory cycles determined
by tracking the chest wall motion for a representative patient
Wei et al. Page 13
Ann Thorac Surg. Author manuscript; available in PMC 2017 May 01.
Author M
anuscriptA
uthor Manuscript
Author M
anuscriptA
uthor Manuscript

Figure 4. Exercise flow waveforms of a) inferior vena cava (IVC), b) superior vena cava (SVC), c)
aorta (Ao), and d) descending aorta (DAo) along with the corresponding respiratory cycles
determined by tracking the chest wall motion for a representative patient
Wei et al. Page 14
Ann Thorac Surg. Author manuscript; available in PMC 2017 May 01.
Author M
anuscriptA
uthor Manuscript
Author M
anuscriptA
uthor Manuscript
Figure 5. Bland-Altman comparisons of flow rate (Q) between IVC (inferior vena cava) and DAo
(descending aorta) during (a) breath holding, (b) free breathing, (c) exercise.
Wei et al. Page 15
Ann Thorac Surg. Author manuscript; available in PMC 2017 May 01.
Author M
anuscriptA
uthor Manuscript
Author M
anuscriptA
uthor Manuscript
Author M
anuscriptA
uthor Manuscript
Author M
anuscriptA
uthor Manuscript
Wei et al. Page 16
Table 1
Analyzed patient data (n=11) during breath holding free breathing, and exercise
Resting BH Resting FB Exercise
Heart rate (1/min) 71.2±12.8 69.2±12.1 111.4±18.4*†
Respiratory rate (1/min) - 17.5±4.6 28.0±13.1†
Cardiac cycles per respiratory cycle - 4.2±1.3 4.4±1.1
Ao flow (L/min/m2) 3.3±1.0 3.4±0.8 6.0±1.6*†
DAo flow (L/min/m2) 1.7±0.4 1.7±0.4 3.8±0.9*†
IVC flow (L/min/m2) 1.5±0.6 1.6±0.5 3.9±0.8*†
SVC flow (L/min/m2) 0.5±0.2 0.6±0.2 1.0±0.6*†
Qs = SVC + IVC flow (L/min/m2) 2.0±0.7 2.1±0.6 4.8±0.8*†
*p<0.05 in comparison with the breath holding condition;
†p<0.05 in comparison between the resting FB and exercise conditions
Ann Thorac Surg. Author manuscript; available in PMC 2017 May 01.

Author M
anuscriptA
uthor Manuscript
Author M
anuscriptA
uthor Manuscript
Wei et al. Page 17
Tab
le 2
Com
pari
son
betw
een
patie
nt (
n=11
) ve
ssel
flo
w w
avef
orm
s du
ring
res
ting
brea
th h
oldi
ng a
nd f
ree
brea
thin
g, a
nd e
xerc
ise
Ao
DA
oIV
CSV
C
Rat
io o
f in
spir
atio
n to
exp
irat
ion
flow
rat
es (
Qin
sp/Q
expr
)F
B1.
1±0.
11.
2±0.
31.
6±0.
5*1.
9±0.
6*
Exe
rcis
e0.
9±0.
21.
0±0.
31.
8±0.
5*2.
6±2.
0*
Gen
eral
pul
sati
lity
ndex
(P
I)
BH
510±
155
569±
202
123±
7220
4±11
6
FB
454±
116
589±
303
231±
120*
264±
160
Exe
rcis
e43
0±11
335
7±15
7*†
259±
98*
320±
174
Res
pira
tory
pha
sici
ty in
dex
(PI r
esp)
BH
72±
5662
±35
36±
3849
±25
FB
67±
5652
±30
120±
59*
134±
69*
Exe
rcis
e53
±28
75±
3711
9±48
*16
6±73
*
* p<0.
05 in
com
pari
son
with
the
brea
th h
oldi
ng c
ondi
tion;
† p<0.
05 in
com
pari
son
betw
een
rest
ing
FB a
nd e
xerc
ise
cond
ition
s;
Ann Thorac Surg. Author manuscript; available in PMC 2017 May 01.
![Missing a Sub-pulmonary Ventricle: The Fontan Circulation · In 1971 Francis Fontan [ 1 ] from Bordeaux, France, reported a new approach to the operative treatment of these malformations,](https://img.dokumen.tips/doc/110x75/5f478ac216677841d5583bdb/missing-a-sub-pulmonary-ventricle-the-fontan-circulation-in-1971-francis-fontan.jpg)


![Managing adult Fontan patients: where do we stand? · 2017-03-24 · This complication of the Fontan circulation has challenged physicians for many years [12, 19], diagnosed by a](https://img.dokumen.tips/doc/110x75/5f478952ccc16543be19555e/managing-adult-fontan-patients-where-do-we-stand-2017-03-24-this-complication.jpg)
![Role of cardiac MRI and CT in Fontan circulation...Cardiac MRI (CMR) is utilised regularly in addition to echocardiography for long-term monitoring of Fontan patients [8]. It is very](https://img.dokumen.tips/doc/110x75/61373f070ad5d20676487f0c/role-of-cardiac-mri-and-ct-in-fontan-circulation-cardiac-mri-cmr-is-utilised.jpg)