Embed Size (px)
Citation preview

7/28/2019 Residential Power Factor Correction Project 2005
http://slidepdf.com/reader/full/residential-power-factor-correction-project-2005 1/15
Whitby Hydro Energy Services Corp.
Power Factor Correction at theResidential Level – Pilot Project
Report to the LDC Tomorrow Fund
September 12, 2005

7/28/2019 Residential Power Factor Correction Project 2005
http://slidepdf.com/reader/full/residential-power-factor-correction-project-2005 2/15
Executive Summary
In December of 2004 Whitby Hydro applied for funding from the EDA Tomorrow Fund to carryout a pilot project to determine the impact of installing capacitors at residential homes on system
capacitance and generation requirements.
The study involved 31 homes within Whitby Hydro’s distribution territory. The houses selectedwere located in a new residential neighbourhood and were consistent in size, age and type of heating.
For the pilot, a bench mark had to be established for the loading of each transformer. The threetransformers where metered for a two month period prior to the installation of the capacitors.The information gathered included KW, KVAR, volts and amps. Once the benchmark wasestablished homes fed from two of the transformers where equipped with capacitors providing3.34 KVAR into there distribution panel. Readings at the transformer continued for an
additional two month period after the units were installed in the homes. In addition two homeswhere equipped with metering devices that allowed the measurement of power factor.
The information gathered allowed analysis to be carried out to determine if the additionalcapacitance improved power factor at the home as well as at the transformer.
Power Factor at the transformer was the first value to be analysed. KW and KVAR wasmeasured at 15 minute intervals for the pilot period (Appendix G). This information was used todetermine monthly power factors and other related billing determinants at the transformer.
The peak Power Factor each month was as follows:
March April May June July(PF) (PF) (PF) (PF) (PF)
TX5545 (BM) 96.6 96.1 95.1 92.7 93.0TX5554 98.4 98.8 99.9 99.1 99.9TX5547 97.9 98.5 98.3 97.1 95.7
(Note: BM is the bench mark transformer of which capacitance was not added)
During the study it was quickly realized that although the study group was selected for itsconsistency, variances in ON and OFF-peak Power Factor clearly indicated that there was littleor no consistency on how or when motor loads were used. Even though an attempt was made to pick homes with similar characteristics there was enough variance in how and when motor loadswhere used to cause inconsistency between the transformers. This made it difficult to determinethe full effect that the added capacitance had on Power Factor at the transformer. However, based on the fact that KW and KVAR were being measured it was easy to see the impact theadded capacitance had on KVAR at the transformer. Also because KVAR is a factor whendetermining generation requirements, this unit of measurement would allowed us to determinethe impact on provincial generation.The improvements in KVAR was as follows:

7/28/2019 Residential Power Factor Correction Project 2005
http://slidepdf.com/reader/full/residential-power-factor-correction-project-2005 3/15
March April May June July(KVAR) (KVAR) (KVAR) (KVAR) (KVAR)
TX5545(BM) 4.2041 3.3670 3.0253 7.1944 7.5343TX5554 2.3756 2.3999 -.9916 -4.3036 -4.0268
TX5547 3.1778 2.6754 .9480 3.0449 2.9364
To further verify the impact of the capacitance on power factor two homes where measured. .These homes where fitted with capacitors that would turn on and off on twenty four hour cyclesto show day to day comparison on power factor. Typically, the average power factor when theunits where off was 87%. When the units were turned on the power factor was over 99%.
To get a real understanding of positive impact power factor correction has on generation costs benefit analysis was carried out to see if such a project would make sense on mass. Four assumptions where used in this analysis:
1. a typical home has a 5kW demand2. the cost of new generation is about $1,000,000 an MVA3. a typical homes power factor is improved from 87% to 99% when 3.34 KVAR of
capacitance is add4. the cost of the Power Medix units is $450,000 installed
With an example of 1000 homes each using the above information, the generation requirementwould be 5.75MVA (5kW/.87PF x 1000). By installing capacitance at the residential level therequirement of the generator for the 1000 homes would now only be 5.05MVA (5kW/.99PF X1000) or 700 KVA less.
Therefore the cost to generate 700 KVA would be $700,000 (.700MVA X $1,000,000). The costto supply and install capacitance at the residential level to free up the same amount of capacitance would be $450,000. The environment and health costs associated with thegeneration of electricity are also removed making the economics even stronger.
The pilot project showed that the installation of capacitors at the residential level is a viableoption in freeing up capacitance within the province is deployed on mass. The savings can also be achieved without having the customer drastically changing their lifestyle.
The following report provides the details and back up information for the analysis.

7/28/2019 Residential Power Factor Correction Project 2005
http://slidepdf.com/reader/full/residential-power-factor-correction-project-2005 4/15
Introduction
Purpose
The following report outlines the process, procedures and results of a pilot project carried out byWhitby Hydro to determine if providing power factor correction at residential homes frees upcapacity at pad mount transformers and therefore reduces load on utility systems. The reportalso determines whether such applications are feasible at this level.
Scope
The report looks at the application and justification of the process for the pilot. Total costswhere also analysed to determine the feasibility of such an application. The report onlyaddresses the resulting impact the pilot had on the customer and the pad-mount transformers.It does not explore system impacts up stream of the transformer other than assumptions of the
system impact if implemented on mass throughout the Town.
Background
Whitby Hydro carried out a project to identify the ability to free up system and generationcapacity by correcting power factor at the residential level. Theoretically, correcting power factor makes the system, which is generator, distribution and consumer, more efficient. BecausekW’s are what the load consumes and kVA is what it takes to push the kW’s through the system, by improving the power factor the more efficient the system becomes.
Take the case of a generator capable of producing 1000 kW into a load of 1000 kW. At unity
power factor, 1000 kW = 1000 kVA. At 70% power factor, 1000 kW = 1429 kVA. Thegenerator output would need to be increased by 429 kW to satisfy a 1000 kW load operating at70% PF. In short improving the power factor at the distribution system and at the load equates toless losses and more efficient use of the energy produced. From the generator’s prospective, heis capable of serving more clients from his fixed output.
The project involved the installation of a capacitor unit developed and manufactured by Cos PhiInc. out of London Ontario. The unit is tied into the residential service panel and providescapacitance and surge suppression. By adding capacitance into the system the power factor for any motor loads (air conditioners, washers, dryers, fans, fridges, and dishwashers) is improved.
Thirty homes were selected for the pilot project. These homes where fed by three 50kVAtransformers. Homes from two of the transformers were supplied with Power Medix Units whilehomes from the third transformer were not be fitted and used as a bench mark.
The dimensions of the units are 12” X8”X4”. The small profile makes them easy to installwithout taking up much physical space in the customers home.
Because the pilot period extended over a number of months, average degree days wherecollected (Appendix ). It was difficult however to determine how weather impacted the resultsof the pilot and we have put greater emphisis on the comparison between the transformersfeeding equipped homes and the transformer feeding the remaining homes.

7/28/2019 Residential Power Factor Correction Project 2005
http://slidepdf.com/reader/full/residential-power-factor-correction-project-2005 5/15
Initially the pilot was to run for 4 months. Each transformer was fitted with KVA meters andconsumption on these transformers was collected for two months prior to the installation of thePower Medix Units. Once the Power Medix Units were installed the measurements at thetransformers would be taken for another two months.
Access to customer homes to install the units caused delays in the pilot which required the pilotto be carried on for an additional two months.
Discussion
To properly determine the success and benefits of the project a comprehensive detailed pilot project was carried out. Three 50 KVA transformers supplying 31 homes in total were selectedin a new residential subdivision. Two of the transformers, TX5545 and TX5547 fed 10customers each with transformer TX5554 feeding the remaining 11 customers. Appendix A lists
the transformers and the associated customers on each transformer.
Although a $10.00 a month incentive was offered to all customers enrolling in the pilot, not allcustomers participated. Only two customers fed from TX 5545 were interested in participating inthe pilot. This transformer was therefore selected as the benchmark site and the homes fed fromit were not equipped with PM units. Transformer TX5554 had 9 customers interested in participating in the pilot and 9 homes where fitted with the units. Transformer TX5547 had 8customers interested in participating in the pilot and 8 homes where fitted with the units. A breakdown of those who did and did not participate is available in Appendix B.
A new subdivision was selected for the pilot so that minimal impact to the home owner wouldoccur. It was assumed that the majority of homes in a new subdivision would not have finished basements allowing easy access to the electrical panel for the installation of the Power Medixunit.
Typical Basement Panel

7/28/2019 Residential Power Factor Correction Project 2005
http://slidepdf.com/reader/full/residential-power-factor-correction-project-2005 6/15
Installed Unit
The houses selected where in a new residential neighbourhood and where consistent in size, ageand type of heating to ensure relative consistency among the usage patterns of each home.
Inventory List per Customer
Part of the pilot was to carry out surveys prior to and after the installation of the units. The firstsurvey provided us with a number of occupants within the house and an inventory of equipmentthat required motor loads. A copy of the survey can be found in Appendix C.

7/28/2019 Residential Power Factor Correction Project 2005
http://slidepdf.com/reader/full/residential-power-factor-correction-project-2005 7/15
The surveys allowed us to determine an average number of family members and equipment withmotor load. .
The assumed family size and motor loads per house are as follows:
Number of Adults 2.1
Number of Children 1.1
Number of Homes with Central AC 29
Number of Homes with Gas Heating 31
Number of Homes with Refrigerators 31
Number of Homes with Freezers 15
Number of Homes with Washing Machines 31
Number of Homes with Electric Cloths Dryer 25
Number of Homes with Dishwashers 25
Number of Homes with Central Vac 15
Number of Homes with Portable Vac 21 (Note: some of these customers also hadcentral vac)
Customers where also surveyed to assess what other motor loads, such as pumps, power tools,extra refrigerators, pools or hot tubs may be within their homes. A complete inventory list can be found in Appendix D.
These averages where applied to the customers fed from the baseline transformer. This gave us acomparator as to the number of appliances and family members were in each home.
Upon completion of the pilot a follow up phone survey was carried out to identify any significantchanges to the number of appliances and or motorized equipment that may have been added tothe home. At the same time we enquired if the customer had noticed any changes or anomaliesto the electrical supply when the Power Medix was added. No anomalies where reportedhowever some did report that since the unit was added they did not experience dimming lightsdue to motors and compressors cycling on and off.
Appliances added included:
One freezer One hot tub

7/28/2019 Residential Power Factor Correction Project 2005
http://slidepdf.com/reader/full/residential-power-factor-correction-project-2005 8/15
One Air conditioner One above ground pool
Meter Readings at the Transformer
For the pilot, a bench mark had to be established for the loading of each transformer. The threetransformers where metered for a two month period (March and April) prior to the installation of the capacitors. The information gathered included KW, KVAR, volts and amps.
Seventeen (17) of the target homes were equipped with Power Medix units beginning in May.Delays in getting access to the customer premises required a longer period of time to install theunits. All units of participating customers were installed by June 7 and a two month datacollection period began. The meters at the transformers continually monitored for the period of the pilot. Two months of data from June 7 to August 7 was collected and used as a comparator to the transformer readings over March and April.
Power Factor at the transformer was the first value to be analysed. KW and KVAR wasmeasured at 15 minute intervals for the pilot period (Appendix G). This information was used todetermine monthly power factors and other related billing determinants at the transformer.
The peak Power Factor each month was as follows:
March April May June July(PF) (PF) (PF) (PF) (PF)
TX5545 96.6 96.1 95.1 92.7 93.0TX5554 98.4 98.8 99.9 99.1 99.9TX5547 97.9 98.5 98.3 97.1 95.7
Beginning May 11 with completion by June 7 the capacitance added to the system was asfollows:
TX5545 3.34 KVAR TX5554 30.06 KVAR TX5547 20.04 KVAR
During the study it was quickly realized that although the study group was selected for itsconsistency, variances in ON and OFF-peak Power Factor clearly indicated that there was littleor no consistency on how or when motor loads were used. This made it difficult to determine thefull effect that the added capacitance had on Power Factor at the transformer. However, basedon the fact that the added capacitance was known, and because we were measuring interval unitsof power at the transformer, the effect on KVAR would be more noticeable and better represented as a comparator to KW.
The transformers where monitored for three months prior to the installation of the capacitors.Two channels of each transformer where measured and the average KVAR per month wasrecorded as follows:
March April May June July

7/28/2019 Residential Power Factor Correction Project 2005
http://slidepdf.com/reader/full/residential-power-factor-correction-project-2005 9/15
(KVAR) (KVAR) (KVAR) (KVAR) (KVAR)
TX5545 4.2041 3.3670 3.0253 7.1944 7.5343TX5554 2.3756 2.3999 -.9916 -4.3036 -4.0268TX5547 3.1778 2.6754 .9480 3.0449 2.9364
An assessment of the changes that occurred between the three months prior to the installation of the units and the three months after the installation showed that significant change occurred inthe KVAR readings of each transformer. This indicates that there may have been an over correction that occurred on Transformer TX5554. This may be due to smaller homes fed fromthat transformer therefore less air conditioning load or less appliance use.
Visually the impact of the capacitance is clear.
TX 5545 (3.34 KVAR added May 20)
5/1 5/3 5/5 5/7 5/9 5/11 5/13 5/15 5/17 5/19 5/21 5/23 5/25 5/27 5/29 5/31
Time (days)
0.2
4.2
8.2
12.2
16.2
20.2
kW,kVAR
Customer ID Date Channel Line # Units
TX5545 05/01/2005 Leg1 05 kVAR
TX5545 05/01/2005 Leg2 06 kW

7/28/2019 Residential Power Factor Correction Project 2005
http://slidepdf.com/reader/full/residential-power-factor-correction-project-2005 10/15
TX5547 (20.04 KVAR added between May16 and June 7)
5/1 5/3 5/5 5/7 5/9 5/11 5/13 5/15 5/17 5/19 5/21 5/23 5/25 5/27 5/29 5/31
Time (days)
-5.0
0.0
5.0
10.0
15.0
20.0
25.0
kW,kVAR
Customer ID Date Channel Line # Units
TX5547 05/01/2005 Leg1 03 kVAR
TX5547 05/01/2005 Leg2 04 kW
TX5554 (30.06 KVAR added between May11 and May 31)
5/1 5/3 5/5 5/7 5/9 5/11 5/13 5/15 5/17 5/19 5/21 5/23 5/25 5/27 5/29 5/31
Time (days)
-10.0
-5.0
0.0
5.0
10.0
15.0
20.0
kW,kVAR
Customer ID Date Channel Line # Units
TX5554 05/01/2005 Leg1 01 kVAR
TX5554 05/01/2005 Leg2 02 kW
Capacitance Comes on Line
CapacitanceComes on Line
7/28/2019 Residential Power Factor Correction Project 2005
http://slidepdf.com/reader/full/residential-power-factor-correction-project-2005 11/15
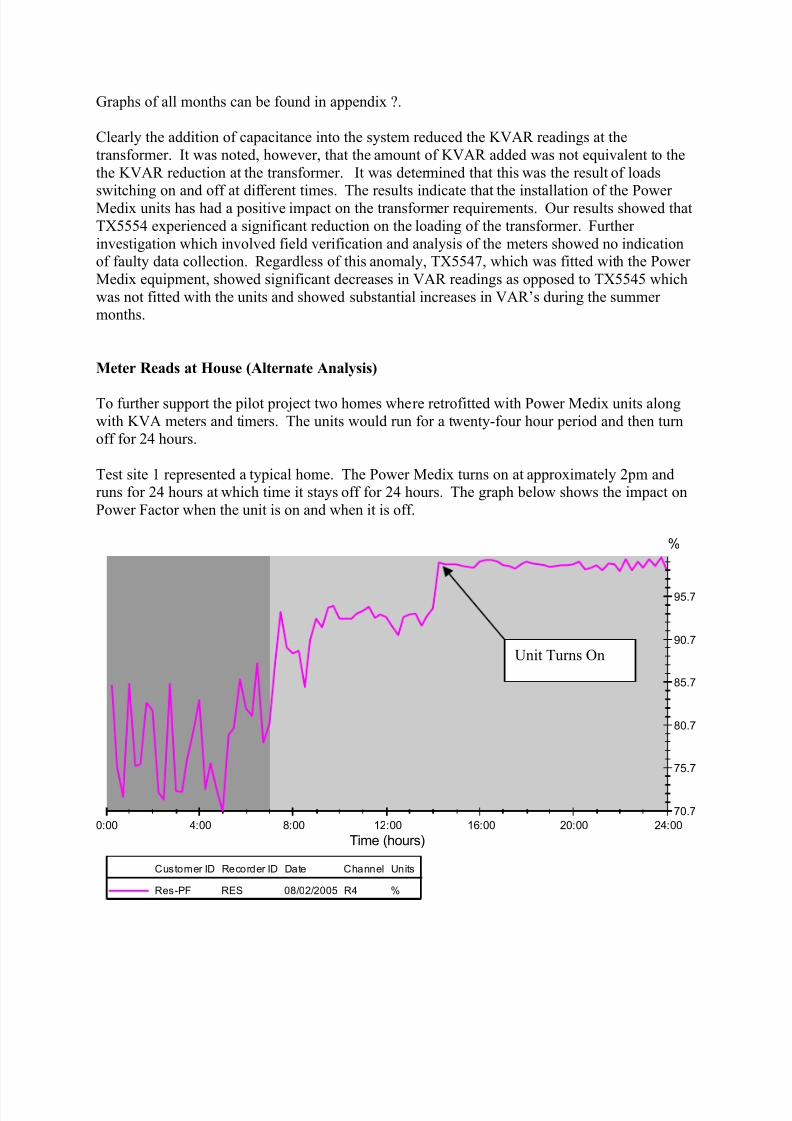
Graphs of all months can be found in appendix ?.
Clearly the addition of capacitance into the system reduced the KVAR readings at thetransformer. It was noted, however, that the amount of KVAR added was not equivalent to thethe KVAR reduction at the transformer. It was determined that this was the result of loads
switching on and off at different times. The results indicate that the installation of the Power Medix units has had a positive impact on the transformer requirements. Our results showed thatTX5554 experienced a significant reduction on the loading of the transformer. Further investigation which involved field verification and analysis of the meters showed no indicationof faulty data collection. Regardless of this anomaly, TX5547, which was fitted with the Power Medix equipment, showed significant decreases in VAR readings as opposed to TX5545 whichwas not fitted with the units and showed substantial increases in VAR’s during the summer months.
Meter Reads at House (Alternate Analysis)
To further support the pilot project two homes where retrofitted with Power Medix units alongwith KVA meters and timers. The units would run for a twenty-four hour period and then turnoff for 24 hours.
Test site 1 represented a typical home. The Power Medix turns on at approximately 2pm andruns for 24 hours at which time it stays off for 24 hours. The graph below shows the impact onPower Factor when the unit is on and when it is off.
0:00 4:00 8:00 12:00 16:00 20:00 24:00
Time (hours)
70.7
75.7
80.7
85.7
90.7
95.7
%
Customer ID Recorder ID Date Channel Units
Res-PF RES 08/02/2005 R4 %
Unit Turns On

7/28/2019 Residential Power Factor Correction Project 2005
http://slidepdf.com/reader/full/residential-power-factor-correction-project-2005 12/15
0:00 4:00 8:00 12:00 16:00 20:00 24:00
Time (hours)
74.7
79.7
84.7
89.7
94.7
99.7
%
Customer ID Recorder ID Date Channel Units
Res-PF RES 08/01/2005 R4 %
As shown the power factor achieves almost 100% when the unit is on. When off, power factor fluctuates between 70 and 90%.
Measurements where also taken at a home that had a ground source heat pump. The unit turnedon at 7 am and ran for 24 hours at which time it would shut off and stay off for a 24 hour period.
0:00 4:00 8:00 12:00 16:00 20:00 24:00
Time (hours)
67.2
72.2
77.2
82.2
87.2
92.2
97.2
%
Customer ID Recorder ID Date Channel Units
Res-PF RES 08/22/2005 R3 %
Unit Turns Off
Unit On

7/28/2019 Residential Power Factor Correction Project 2005
http://slidepdf.com/reader/full/residential-power-factor-correction-project-2005 13/15
0:00 4:00 8:00 12:00 16:00 20:00 24:00
Time (hours)
66.8
71.8
76.8
81.8
86.8
91.8
96.8
%
Customer ID Recorder ID Date Channel Units
Res-PF RES 08/23/2005 R3 %
Significant loads are apparent in the above example but the power factor is improved during periods that the unit is on compared to periods when the unit is off.
Full data on the actual home measurements can be found in Appendix
Cost Benefit Analysis
The reductions in KVAR translate into a reduction in generation requirements and reduction inthe amount of capacity required in the system. Improving system capacity results in less wear and tear on the system. It is difficult, however, to determine exactly what the savings are.
The cost of the units was $491.00/each. These units included surge suppression for cable, phoneand satellite. The cost without this feature is approximately $300.00 and is the value we used tocalculate savings. Installation costs including material and inspection was $150.00 per unit.
There are a number of ways to estimate what the savings are when correcting power factor at the
residential level. For industrial customers, adding capacitance reduces utility penalties and freesup capacity within their system, often reducing the need for new or larger transformers.Although there are no billing incentives to the end use residential customer by correcting power factor the benefits of free capacitance to the utility is similar to that of the industrial customer.
By preventing overloading of a transformer we extend the life expectancy of it, however,residential pad mount transformers are not typically overloaded, however the improvedcapacitance on a transformer allows for the connection of additional residential units. The problem is that the number of units connected to a transformer is typically determined by spaceon the buss or a function of the subdivision planning process.
Unit Off

7/28/2019 Residential Power Factor Correction Project 2005
http://slidepdf.com/reader/full/residential-power-factor-correction-project-2005 14/15
The real benefit of adding capacitance is that it improves the efficiency of the current provincialgeneration and transmission system. In the case of a typical home power factor went from 87%to 99% on average. Assuming each home uses 5 KW the KVA at a home is reduced from 5.75KVA to 5.05 KVA. This means that the reactive power of KVAR of a generator is reduced from2.83 KVAR to 0.708 KVAR or by 2.12 KVAR.
With an example of 1000 homes each using 5KW and not fitted with capacitance, the generationrequirement would be 5 MW. The KVA requirement would there fore be 5.75MVA. Byinstalling capacitance at the residential level the requirement of the generator for the 1000 homeswould now only be 5.05MVA or 700 KVA less.
A ball park figure for building new generation is $1,000,000 per MVA. Therefore the cost togenerate 700 KVA would be $700,000. The cost to supply and install capacitance at theresidential level would be $450,000 to free up the same amount of capacitance.
The installation of the units therefore makes economical sense as a method of reducing the
requirement of generation in the province.
Another advantage to this conservation application is the environmental and health benefits.Improving efficiency of existing generation and displacing the requirement for the addition of new generation have significant advantage in offsetting the environment and health costsassociated with generation in the province. Although a firm number can not be put on the costof generation from a heath and environmental prospective, the following from Ministry of Healtgives an idea of the associated costs.
Health and Environmental Costs
Ontario’s coal-fired plants are the largest industrial source of greenhouse gas emissions, sulphur
dioxide (SO2) and oxides of nitrogen (NOx) in the province. Greenhouse gas emissions are subject to
the Kyoto treaty on climate change, while SO2 and NOx are contributors to smog.
Scenario
1 Status Quo 2 All Gas 3 Refurbished
Nuclear/ Gas
4 Emission Reducing
Technology
Financial Costs $ 985 a $ 2,076 $ 1,529 $ 1,367
Health Damages $3,020 $388 $365 $1,079
Environmental
Damages$371 $141 $48 $356
Total Cost of
Generation$4,377 $2,605 $1,942 $2,802
a: All values are expressed as annualised costs/damages in 2004$ Millions.
The study found a relationship between increased air pollution due to coal-fired electricity generation
and up to 668 premature deaths, 928 hospital admissions, 1,100 emergency room visits and 333,600
minor illnesses annually. These health costs amount to $3 billion annually.

7/28/2019 Residential Power Factor Correction Project 2005
http://slidepdf.com/reader/full/residential-power-factor-correction-project-2005 15/15
In addition to the health costs are economic damages due to environmental effects. The cost of
greenhouse gas control and carbon sequestration from coal-fired emissions is $371 million annually.
Conclusions
The results of the pilot indicated that the addition of capacitance at the residential home reducesthe demand requirements at the transformer. Further assumptions indicate that installation of theunits on mass will reduce the generation requirements throughout the province.
There are a number of other social costs associated with building generation that are difficult to put a price to such as:
• environmental impacts of construction
• emissions
•
fuel costs
Recommendations
We recommend that the findings of this pilot be shared with government officials as a viablemeans to help address the supply and transmission issues within the province.