Embed Size (px)
Citation preview
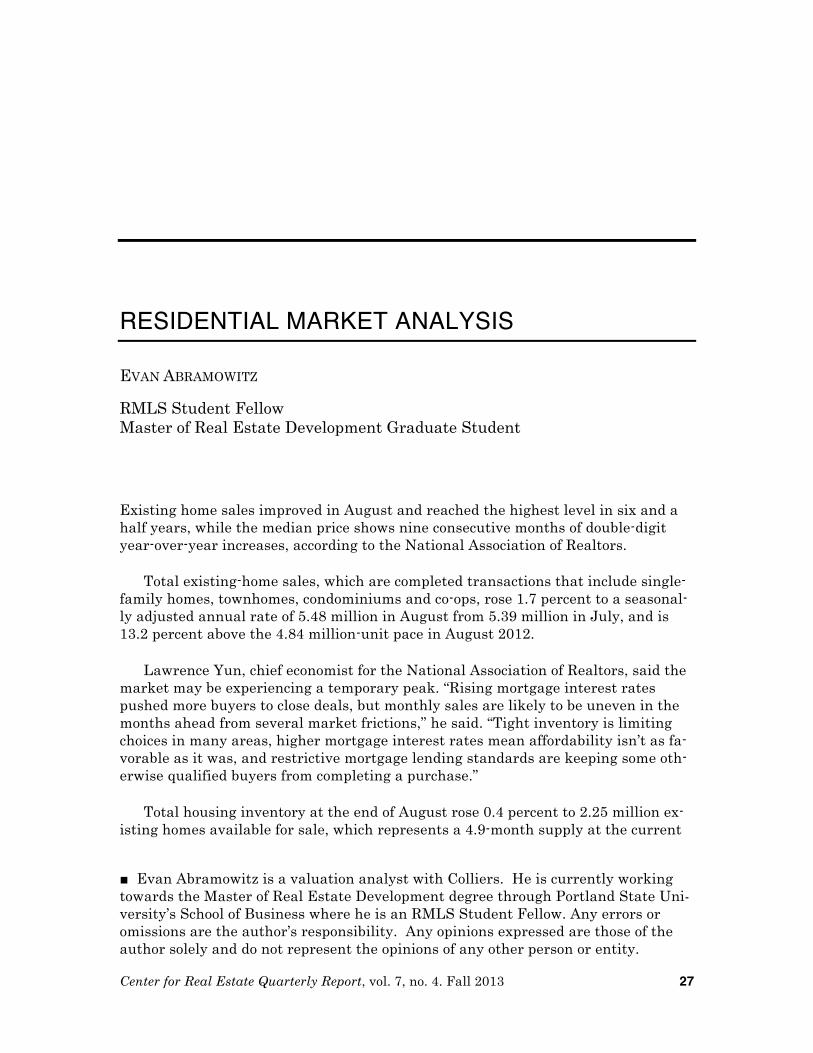
■ Evan Abramowitz is a valuation analyst with Colliers. He is currently working towards the Master of Real Estate Development degree through Portland State Uni-versity’s School of Business where he is an RMLS Student Fellow. Any errors or omissions are the author’s responsibility. Any opinions expressed are those of the author solely and do not represent the opinions of any other person or entity. Center for Real Estate Quarterly Report, vol. 7, no. 4. Fall 2013 27
RESIDENTIAL MARKET ANALYSIS
EVAN ABRAMOWITZ
RMLS Student Fellow Master of Real Estate Development Graduate Student
Existing home sales improved in August and reached the highest level in six and a half years, while the median price shows nine consecutive months of double-digit year-over-year increases, according to the National Association of Realtors.
Total existing-home sales, which are completed transactions that include single-family homes, townhomes, condominiums and co-ops, rose 1.7 percent to a seasonal-ly adjusted annual rate of 5.48 million in August from 5.39 million in July, and is 13.2 percent above the 4.84 million-unit pace in August 2012.
Lawrence Yun, chief economist for the National Association of Realtors, said the market may be experiencing a temporary peak. “Rising mortgage interest rates pushed more buyers to close deals, but monthly sales are likely to be uneven in the months ahead from several market frictions,” he said. “Tight inventory is limiting choices in many areas, higher mortgage interest rates mean affordability isn’t as fa-vorable as it was, and restrictive mortgage lending standards are keeping some oth-erwise qualified buyers from completing a purchase.”
Total housing inventory at the end of August rose 0.4 percent to 2.25 million ex-isting homes available for sale, which represents a 4.9-month supply at the current
HOUSING MARKET ANALYSIS ABRAMOWITZ 28
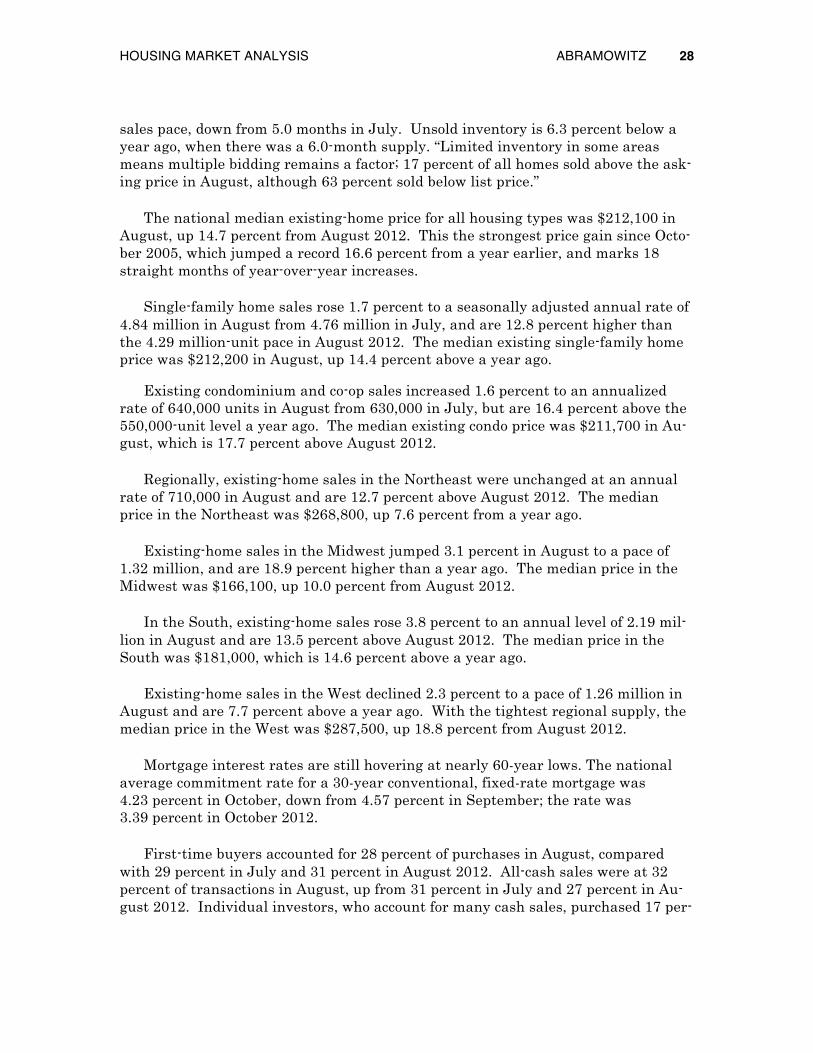
sales pace, down from 5.0 months in July. Unsold inventory is 6.3 percent below a year ago, when there was a 6.0-month supply. “Limited inventory in some areas means multiple bidding remains a factor; 17 percent of all homes sold above the ask-ing price in August, although 63 percent sold below list price.”
The national median existing-home price for all housing types was $212,100 in August, up 14.7 percent from August 2012. This the strongest price gain since Octo-ber 2005, which jumped a record 16.6 percent from a year earlier, and marks 18 straight months of year-over-year increases.
Single-family home sales rose 1.7 percent to a seasonally adjusted annual rate of 4.84 million in August from 4.76 million in July, and are 12.8 percent higher than the 4.29 million-unit pace in August 2012. The median existing single-family home price was $212,200 in August, up 14.4 percent above a year ago.
Existing condominium and co-op sales increased 1.6 percent to an annualized rate of 640,000 units in August from 630,000 in July, but are 16.4 percent above the 550,000-unit level a year ago. The median existing condo price was $211,700 in Au-gust, which is 17.7 percent above August 2012.
Regionally, existing-home sales in the Northeast were unchanged at an annual rate of 710,000 in August and are 12.7 percent above August 2012. The median price in the Northeast was $268,800, up 7.6 percent from a year ago.
Existing-home sales in the Midwest jumped 3.1 percent in August to a pace of 1.32 million, and are 18.9 percent higher than a year ago. The median price in the Midwest was $166,100, up 10.0 percent from August 2012.
In the South, existing-home sales rose 3.8 percent to an annual level of 2.19 mil-lion in August and are 13.5 percent above August 2012. The median price in the South was $181,000, which is 14.6 percent above a year ago.
Existing-home sales in the West declined 2.3 percent to a pace of 1.26 million in August and are 7.7 percent above a year ago. With the tightest regional supply, the median price in the West was $287,500, up 18.8 percent from August 2012.
Mortgage interest rates are still hovering at nearly 60-year lows. The national average commitment rate for a 30-year conventional, fixed-rate mortgage was 4.23 percent in October, down from 4.57 percent in September; the rate was 3.39 percent in October 2012.
First-time buyers accounted for 28 percent of purchases in August, compared with 29 percent in July and 31 percent in August 2012. All-cash sales were at 32 percent of transactions in August, up from 31 percent in July and 27 percent in Au-gust 2012. Individual investors, who account for many cash sales, purchased 17 per-

HOUSING MARKET ANALYSIS ABRAMOWITZ 29
cent of homes in August; they were 16 percent in July and 18 percent in August 2012.
The four counties in the Portland metro area have added 9,000 residential homes or apartment units since 2010. The April 2013 issue of Portland Monthly highlighted residential real estate trends in Portland. The data was provided by Construction Monitor and the images were built by the Metro Data Resource Center.

HOUSING MARKET ANALYSIS ABRAMOWITZ 30
Median Home Values of Existing Detached Homes
U.S. West Portland
Metro Area
August 2012 Median Sales Price $185,500 $233,500 $230,000
August 2013 Median Sales Price $212,200 $287,500 $265,000
% Change in Median Sales Price 14.4% 18.8% 14.1%
% Change in Number of Sales Aug 2012- Aug 2013 12.8% 7.7% 13.6%
Standard & Poor’s Case-Shiller Index was 162.49 through July 2013. The repre-sents an increase of 1.8 percent from June 2013, and a year-over-year increase of 12.4 percent, the largest annual gain since February 2006. Portland was at 157.26 in July, which is a 1.6 percent increase from June, and up 12.4 percent compared to the same time last year. The index data shows that in July all 20 of the major U.S. metropolitan cities, home prices increased from the previous month, for the fourth consecutive month.
Foreclosure filings were reported on 376,931 U.S. properties during the third quarter, a decrease of 7 percent from the previous quarter and a decrease of 29 percent from the third quarter of 2012. Foreclosure activity is at the lowest level since the second quarter of 2007.
“The September and third quarter foreclosure numbers show a housing market that is haltingly returning to health,” said Daren Blomquist, vice president at Real-tyTrac. “In a healthy housing market foreclosures are rare but streamlined while still protecting the rights of the homeowner. While foreclosures are clearly becoming fewer and farther between in most markets, the increasing time it takes to foreclose is holding back a more robust and sustainable recovery.
“The sharp jumps in foreclosure activity in some local markets may come as a surprise to some,” Blomquist added. “These spikes in activity demonstrate that while millions of distressed homeowners have been pulled back from the precipice by foreclosure prevention programs over the past several years, once those programs expire or are exhausted, a percentage of these troubled homeowners are still suscep-tible to falling into foreclosure. In addition even slight economic downturns at the lo-cal or regional level can push these homeowners hanging on by a thread over the edge.”
During the third quarter of 2013 Oregon reported foreclosures on one out of eve-ry 7,954 homes. Multnomah County had the state’s highest level of activity in Octo-ber 2013 with 1,319 homes.
According to RealtyTrac, the ten states that ranked the highest in foreclosure rates in September 2013 were Florida, Nevada, Maryland, Illinois, Ohio, Connecti-
HOUSING MARKET ANALYSIS ABRAMOWITZ 31
cut, Delaware, New Jersey, Indiana, and South Carolina. Of these states, Florida posted the nation’s highest state foreclosure rate, with one in every 126 housing units receiving a foreclosure filing in the third quarter of 2013, more than twice the national average. In Nevada one in every 128 housing units and in Maryland one in every 204 housing units filed for foreclosure during the third quarter of 2013.
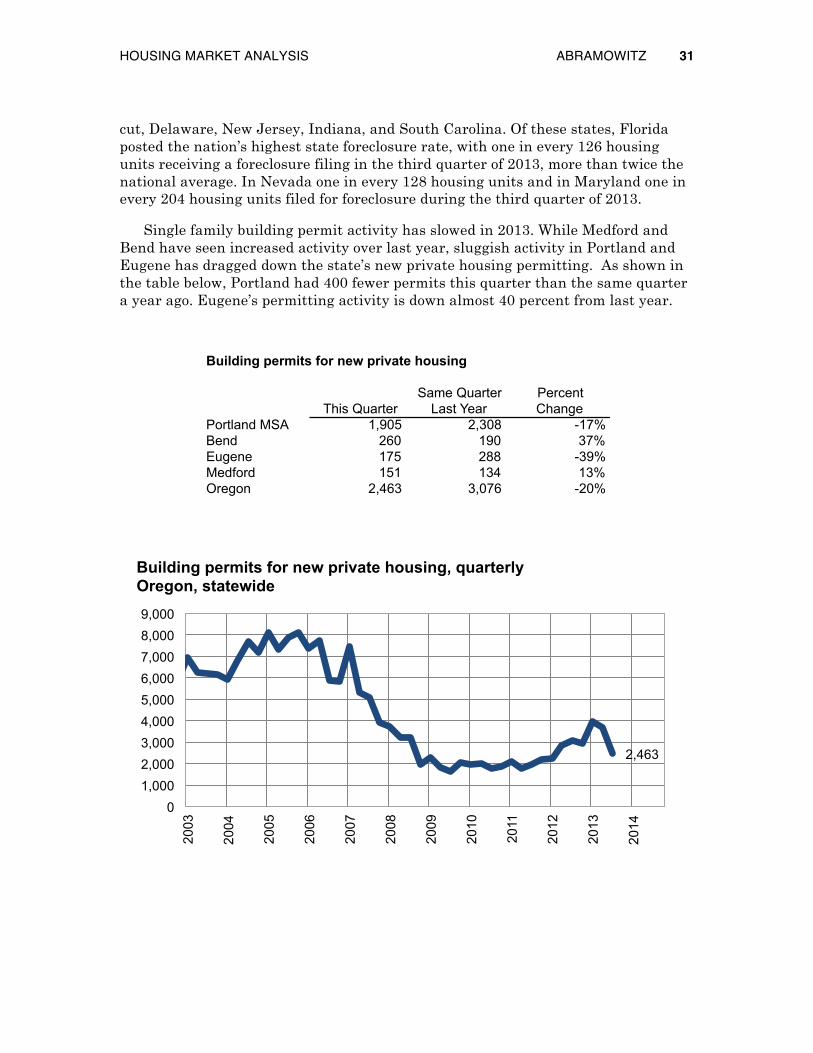
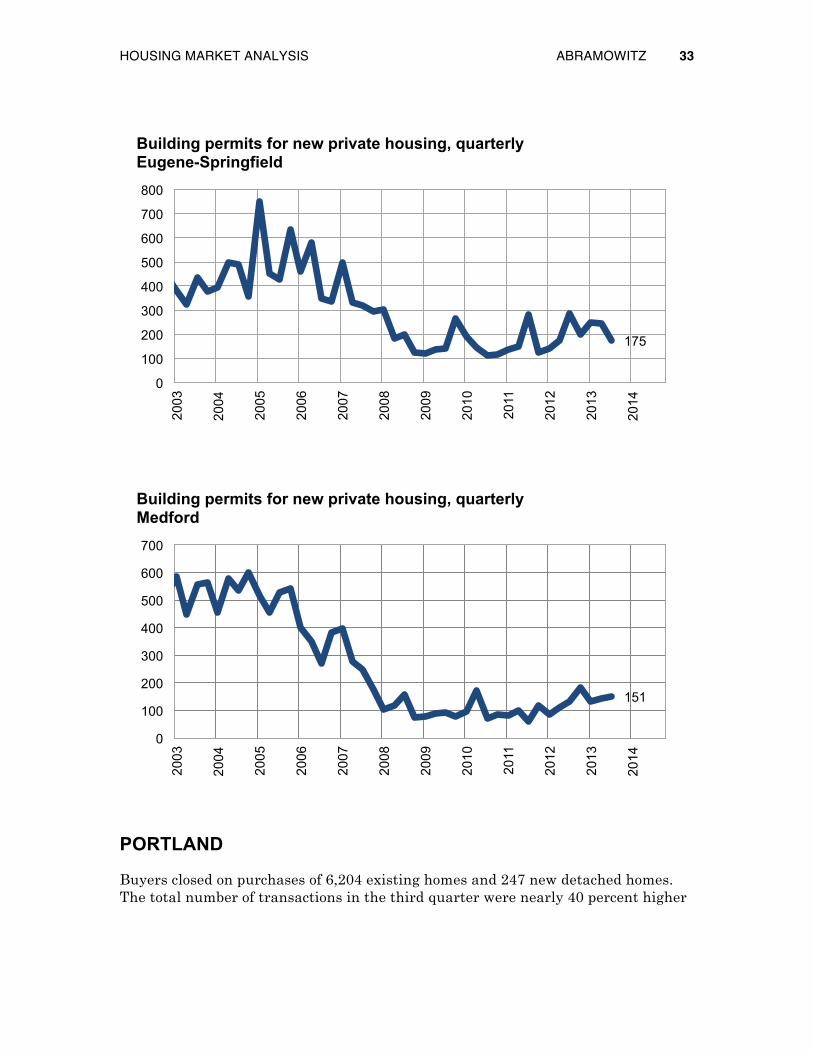
Single family building permit activity has slowed in 2013. While Medford and Bend have seen increased activity over last year, sluggish activity in Portland and Eugene has dragged down the state’s new private housing permitting. As shown in the table below, Portland had 400 fewer permits this quarter than the same quarter a year ago. Eugene’s permitting activity is down almost 40 percent from last year.
Building permits for new private housing
This QuarterSame Quarter
Last YearPercent Change
Portland MSA 1,905 2,308 -17%Bend 260 190 37%Eugene 175 288 -39%Medford 151 134 13%Oregon 2,463 3,076 -20%
2,463
0 1,000 2,000 3,000 4,000 5,000 6,000 7,000 8,000 9,000
2003
2004
2005
2006
2007
2008
2009
2010
2011
2012
2013
2014
Building permits for new private housing, quarterly Oregon, statewide

HOUSING MARKET ANALYSIS ABRAMOWITZ 32
1,905
0
1,000
2,000
3,000
4,000
5,000 20
03
2004
2005
2006
2007
2008
2009
2010
2011
2012
2013
2014
Building permits for new private housing, quarterly Portland-Vancouver-Beaverton MSA
260
0
200
400
600
800
1,000
1,200
1,400
2003
2004
2005
2006
2007
2008
2009
2010
2011
2012
2013
2014
Building permits for new private housing, quarterly Bend
HOUSING MARKET ANALYSIS ABRAMOWITZ 33
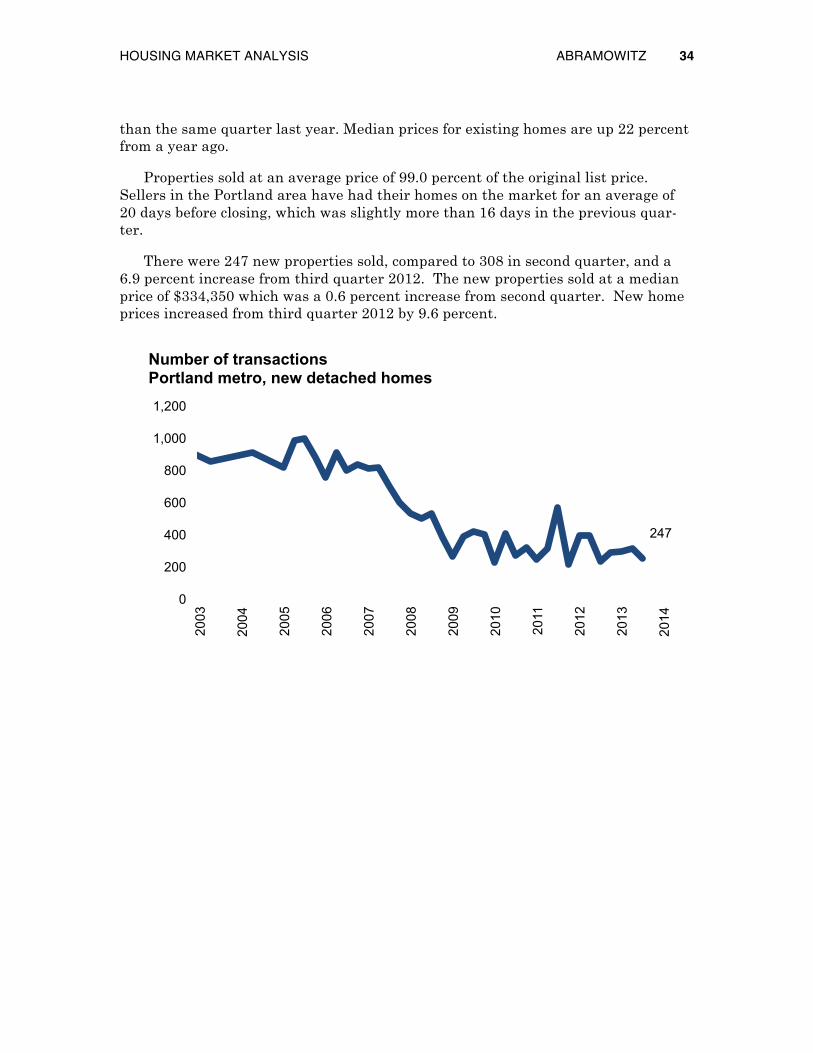
PORTLAND
Buyers closed on purchases of 6,204 existing homes and 247 new detached homes. The total number of transactions in the third quarter were nearly 40 percent higher
175
0
100
200
300
400
500
600
700
800 20
03
2004
2005
2006
2007
2008
2009
2010
2011
2012
2013
2014
Building permits for new private housing, quarterly Eugene-Springfield
151
0
100
200
300
400
500
600
700
2003
2004
2005
2006
2007
2008
2009
2010
2011
2012
2013
2014
Building permits for new private housing, quarterly Medford
HOUSING MARKET ANALYSIS ABRAMOWITZ 34
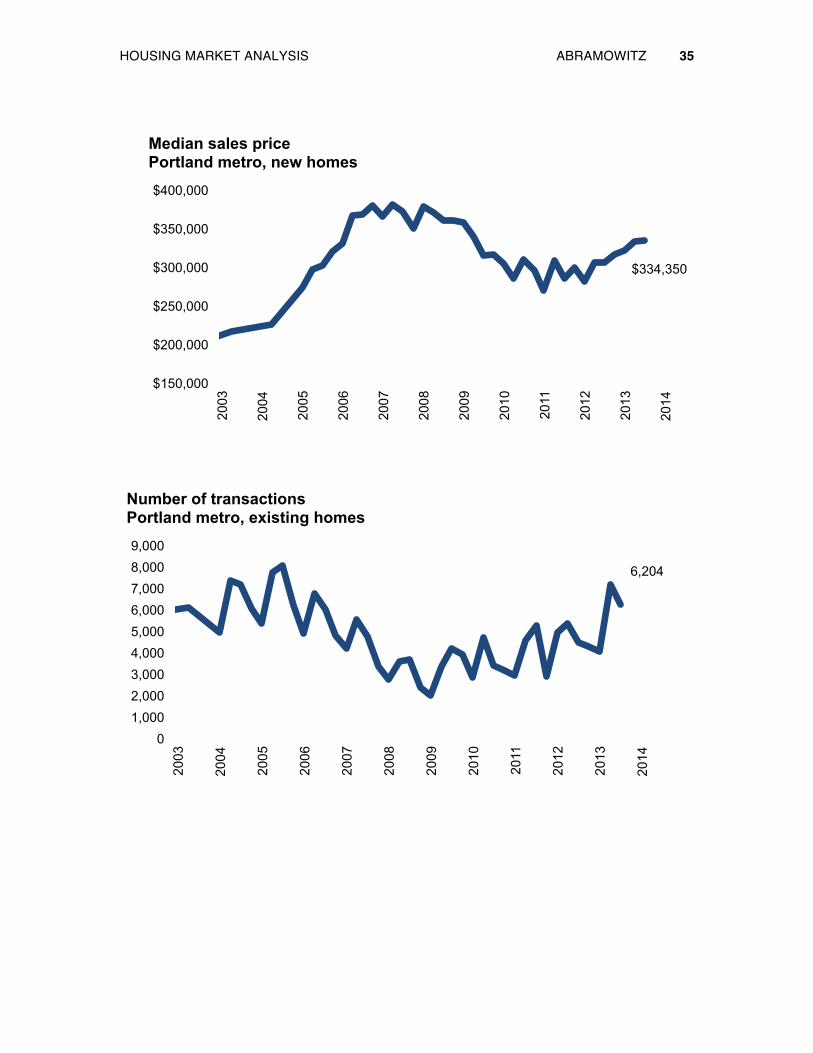
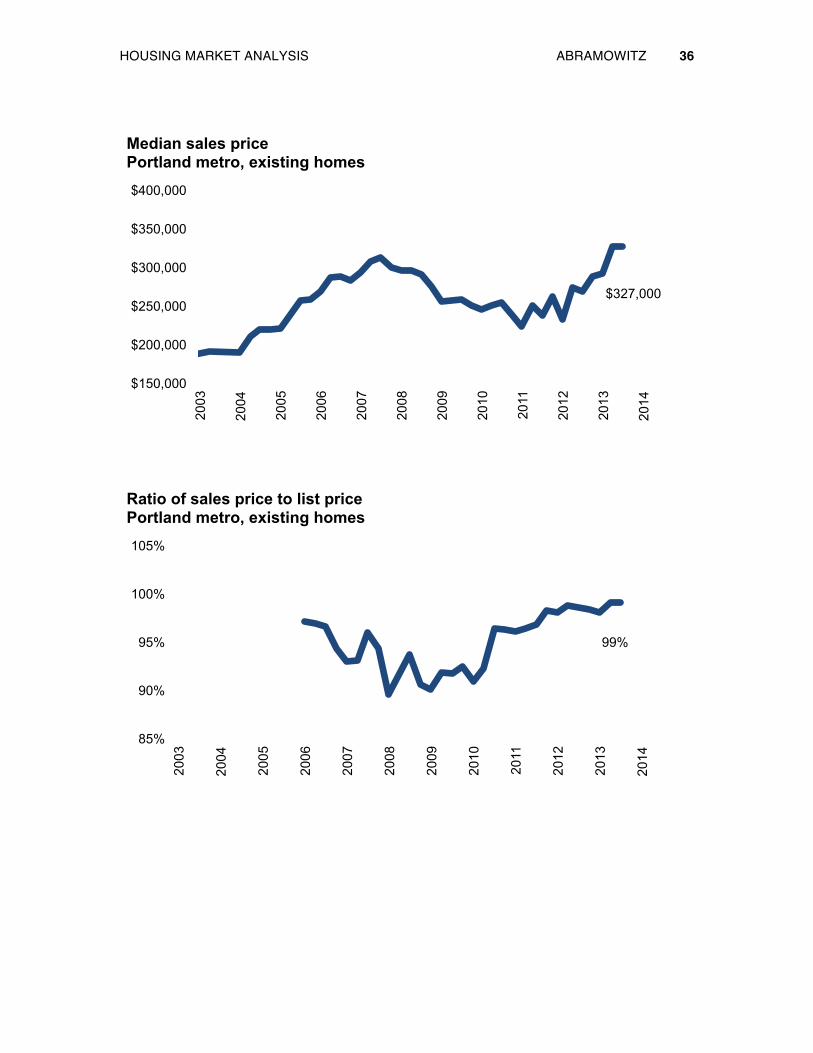
than the same quarter last year. Median prices for existing homes are up 22 percent from a year ago.
Properties sold at an average price of 99.0 percent of the original list price. Sellers in the Portland area have had their homes on the market for an average of 20 days before closing, which was slightly more than 16 days in the previous quar-ter.
There were 247 new properties sold, compared to 308 in second quarter, and a 6.9 percent increase from third quarter 2012. The new properties sold at a median price of $334,350 which was a 0.6 percent increase from second quarter. New home prices increased from third quarter 2012 by 9.6 percent.
247
0
200
400
600
800
1,000
1,200
2003
2004
2005
2006
2007
2008
2009
2010
2011
2012
2013
2014
Number of transactions Portland metro, new detached homes
HOUSING MARKET ANALYSIS ABRAMOWITZ 35
$334,350
$150,000
$200,000
$250,000
$300,000
$350,000
$400,000
2003
2004
2005
2006
2007
2008
2009
2010
2011
2012
2013
2014
Median sales price Portland metro, new homes
6,204
0 1,000 2,000 3,000 4,000 5,000 6,000 7,000 8,000 9,000
2003
2004
2005
2006
2007
2008
2009
2010
2011
2012
2013
2014
Number of transactions Portland metro, existing homes
HOUSING MARKET ANALYSIS ABRAMOWITZ 36
$327,000
$150,000
$200,000
$250,000
$300,000
$350,000
$400,000 20
03
2004
2005
2006
2007
2008
2009
2010
2011
2012
2013
2014
Median sales price Portland metro, existing homes
99%
85%
90%
95%
100%
105%
2003
2004
2005
2006
2007
2008
2009
2010
2011
2012
2013
2014
Ratio of sales price to list price Portland metro, existing homes

HOUSING MARKET ANALYSIS ABRAMOWITZ 37
VANCOUVER
In Vancouver, the median home price in third quarter 2013 was $231,140, represent-ing a 20 percent over last year. The number of homes sold in third quarter decreased by 16.5 percent from the previous quarter to 990, but increased by 75.5 percent an-nually. The number of days on market decreased by 4.2 percent from the previous quarter to 23, down from 40 last year at this time.
In the Vancouver suburbs median home price during the third quarter of 2013 was $279,000, a 1.1 percent increase from second quarter 2013 when it was $275,900. The number of homes sold in third quarter decreased 15.7 percent from the second quarter of 2013 at 742, and increased by 43.3 percent year over year. The number of days on the market increased to 37 from 33 in the previous quarter and 56 in third quarter 2012.
20
0
15
30
45
60
75
90
105
2003
2004
2005
2006
2007
2008
2009
2010
2011
2012
2013
2014
Days on market Portland metro, existing homes

HOUSING MARKET ANALYSIS ABRAMOWITZ 38
990
0
250
500
750
1,000
1,250
1,500 20
03
2004
2005
2006
2007
2008
2009
2010
2011
2012
2013
2014
Number of transactions Vancouver, existing homes
$231,140
$150,000
$200,000
$250,000
$300,000
$350,000
2003
2004
2005
2006
2007
2008
2009
2010
2011
2012
2013
2014
Median sales price Vancouver, existing homes

HOUSING MARKET ANALYSIS ABRAMOWITZ 39
23
0
15
30
45
60
75
90
105
120
2003
2004
2005
2006
2007
2008
2009
2010
2011
2012
2013
2014
Days on market Vancouver, existing homes
742
0
250
500
750
1,000
2003
2004
2005
2006
2007
2008
2009
2010
2011
2012
2013
2014
Number of transactions Clark County, excluding Vancouver, existing homes

HOUSING MARKET ANALYSIS ABRAMOWITZ 40
$279,000
$150,000
$200,000
$250,000
$300,000
$350,000 20
03
2004
2005
2006
2007
2008
2009
2010
2011
2012
2013
2014
Median sales price Clark County, excluding Vancouver, existing homes
37
0 15 30 45 60 75 90
105 120 135
2003
2004
2005
2006
2007
2008
2009
2010
2011
2012
2013
2014
Days on market Clark County, excluding Vancouver, existing homes
HOUSING MARKET ANALYSIS ABRAMOWITZ 41
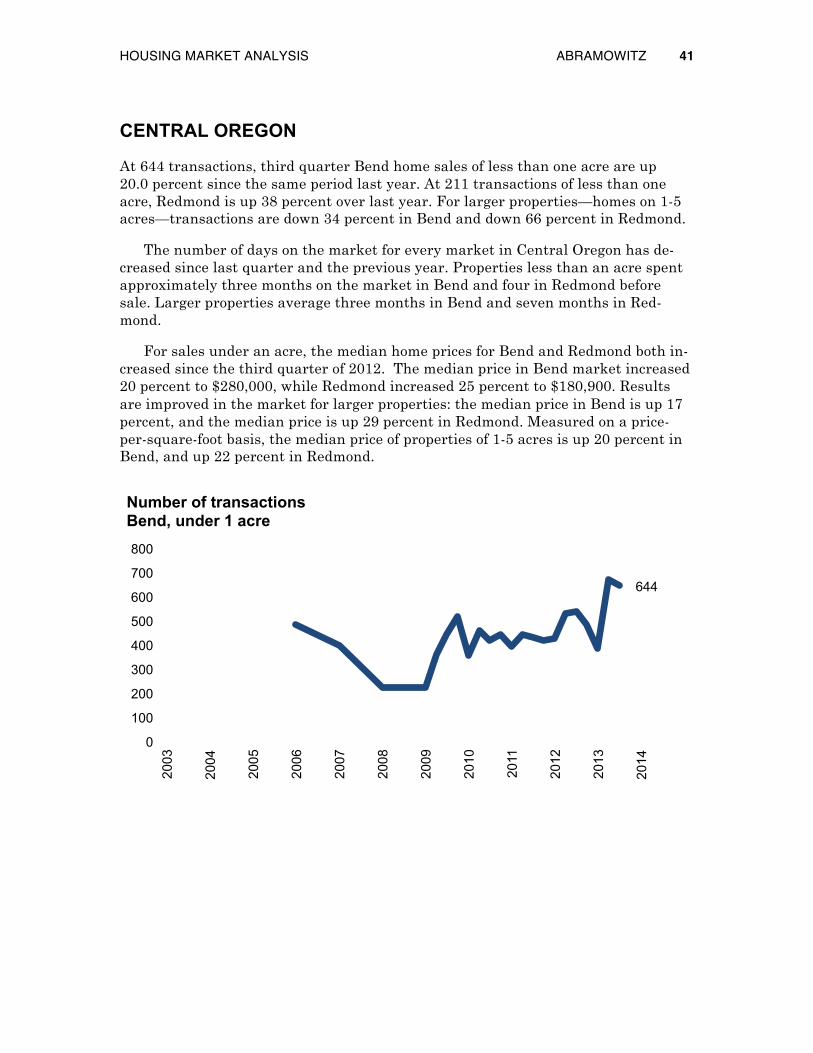
CENTRAL OREGON
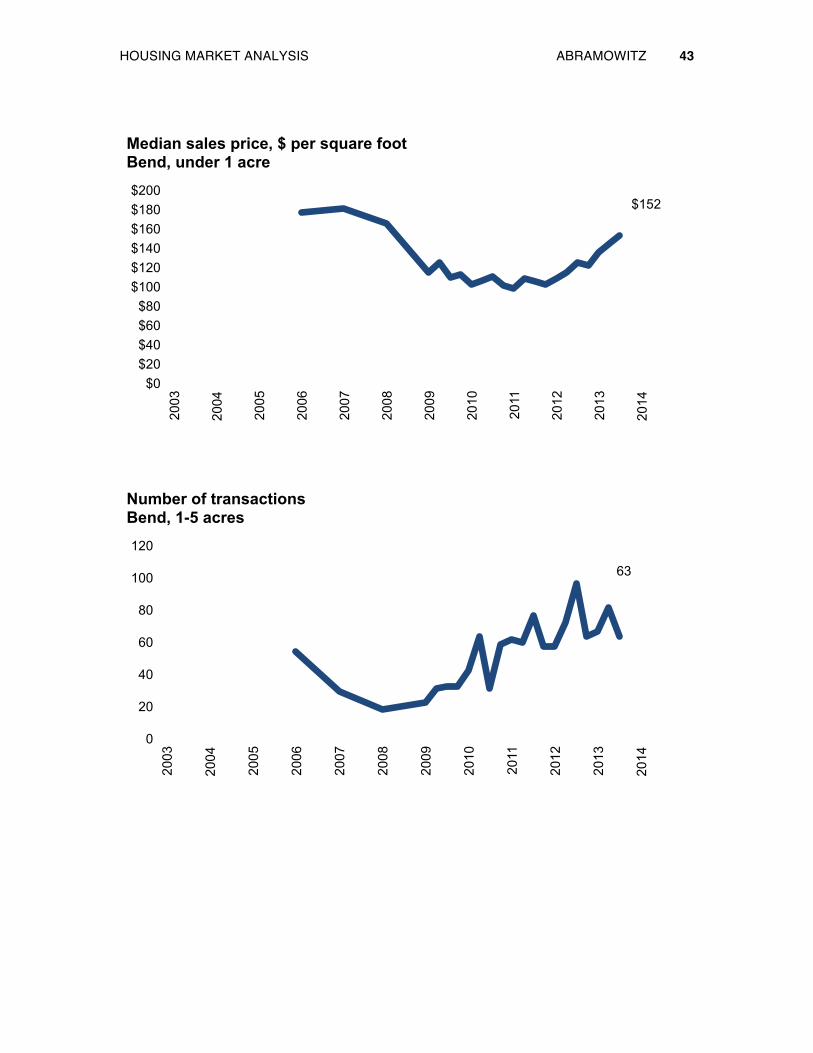
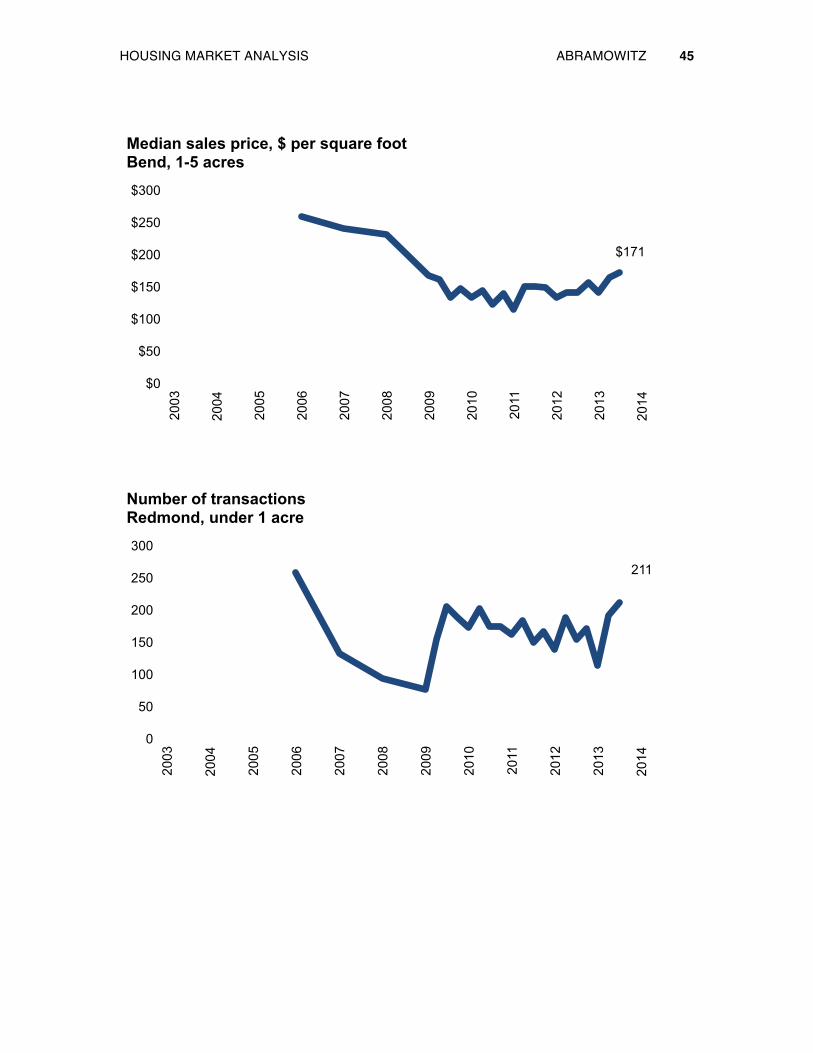
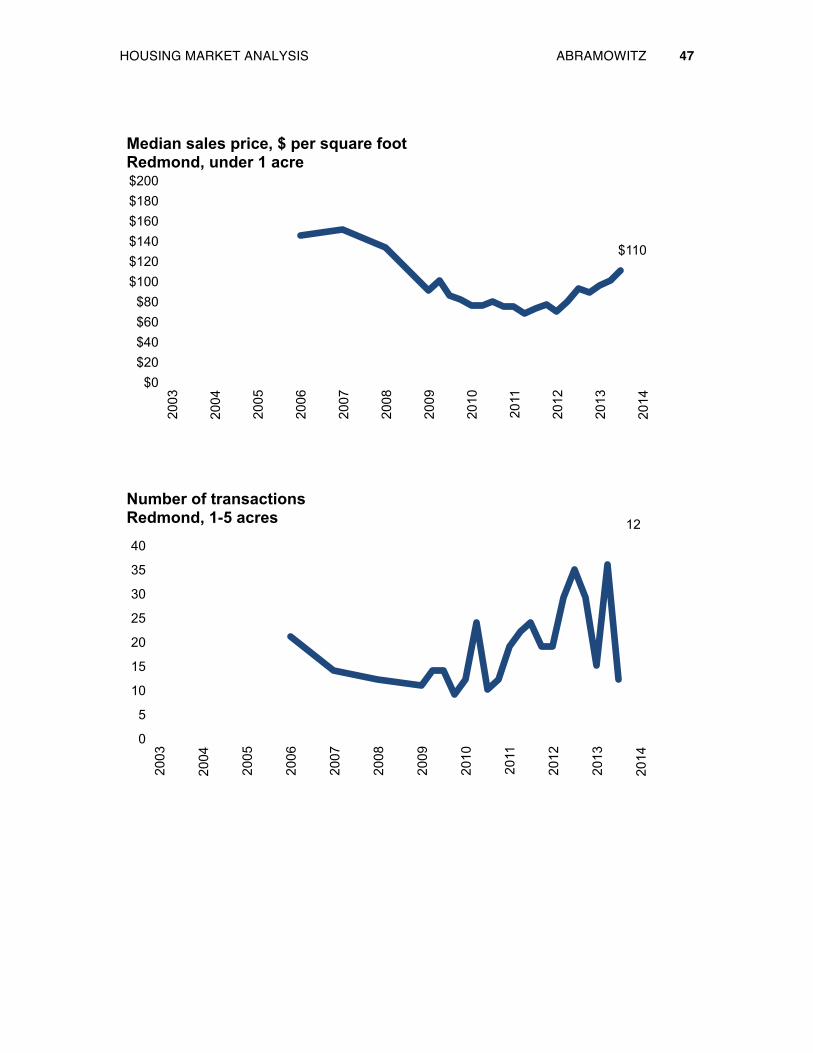
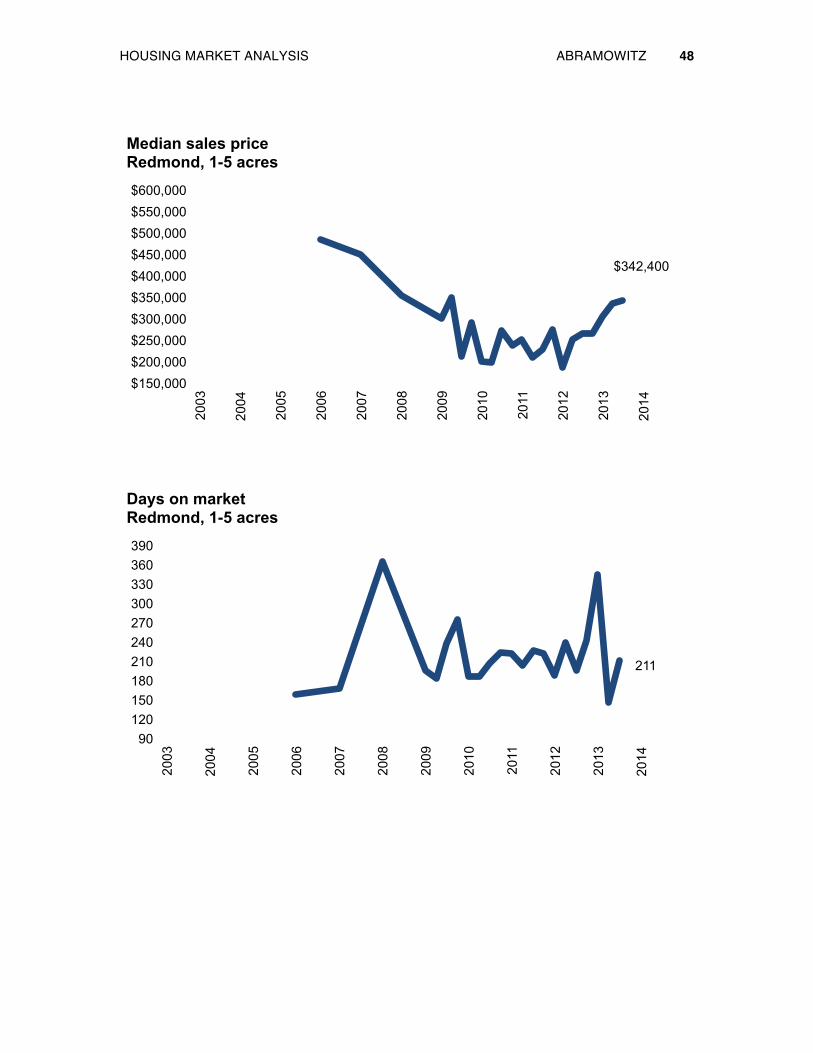
At 644 transactions, third quarter Bend home sales of less than one acre are up 20.0 percent since the same period last year. At 211 transactions of less than one acre, Redmond is up 38 percent over last year. For larger properties—homes on 1-5 acres—transactions are down 34 percent in Bend and down 66 percent in Redmond.
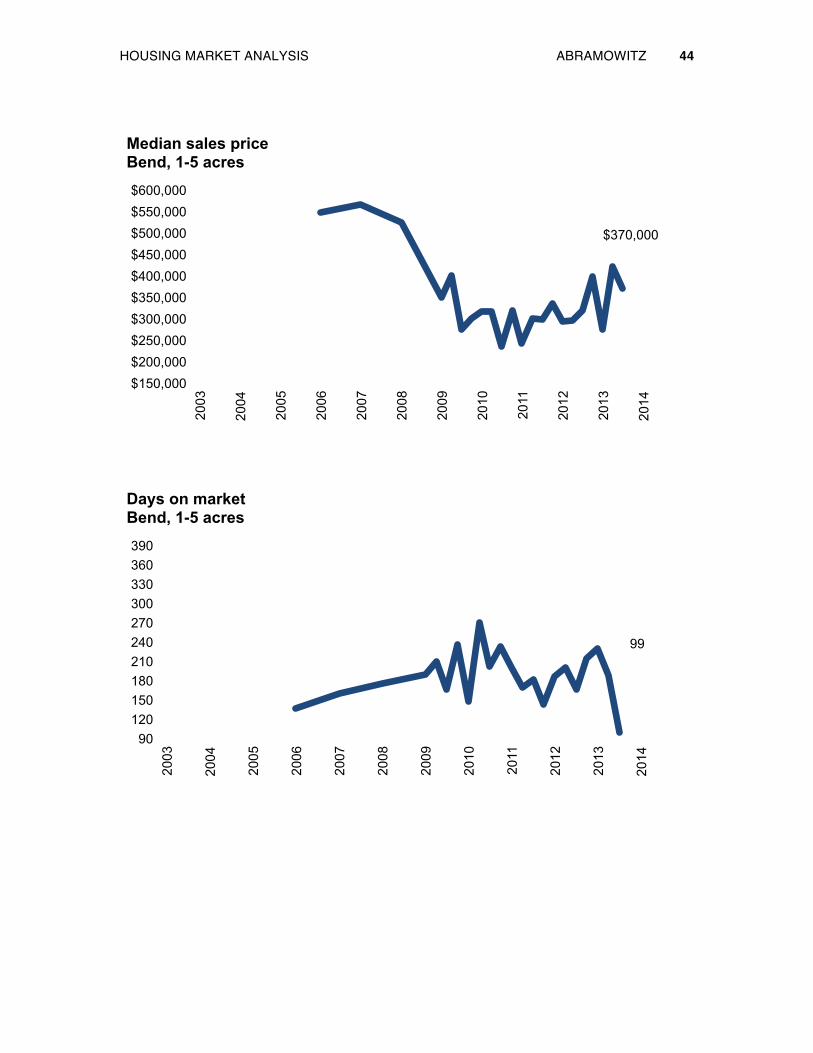
The number of days on the market for every market in Central Oregon has de-creased since last quarter and the previous year. Properties less than an acre spent approximately three months on the market in Bend and four in Redmond before sale. Larger properties average three months in Bend and seven months in Red-mond.
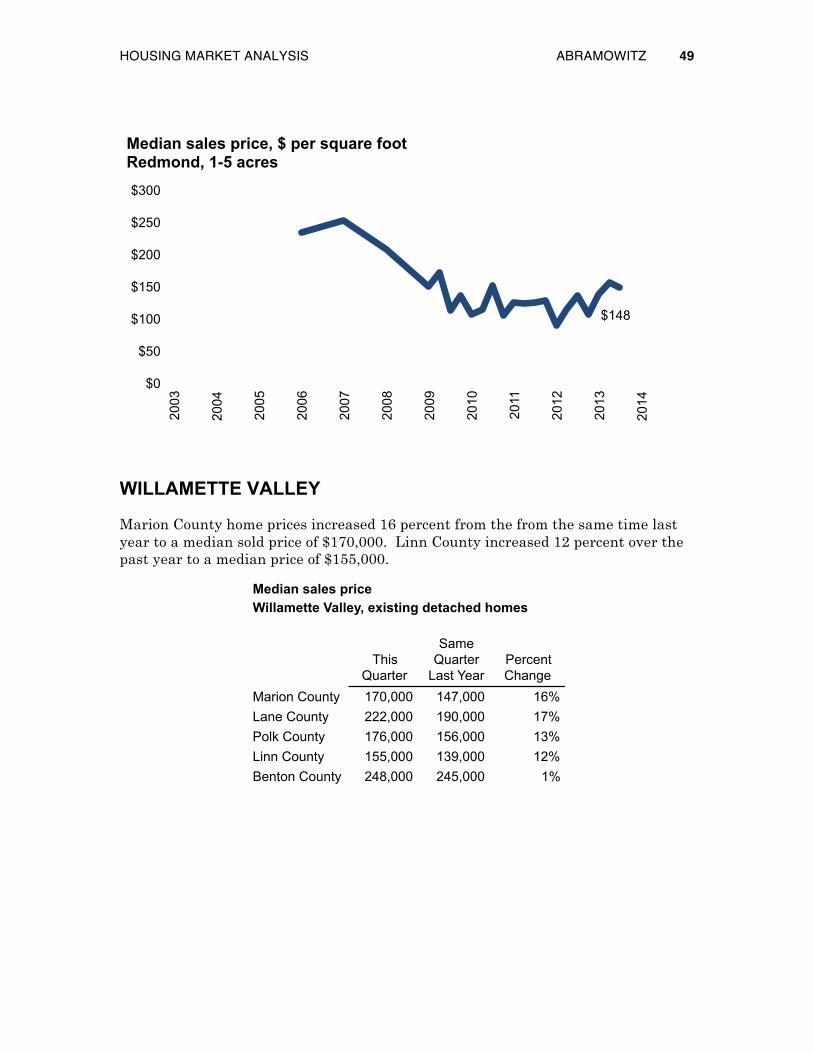
For sales under an acre, the median home prices for Bend and Redmond both in-creased since the third quarter of 2012. The median price in Bend market increased 20 percent to $280,000, while Redmond increased 25 percent to $180,900. Results are improved in the market for larger properties: the median price in Bend is up 17 percent, and the median price is up 29 percent in Redmond. Measured on a price-per-square-foot basis, the median price of properties of 1-5 acres is up 20 percent in Bend, and up 22 percent in Redmond.
644
0
100
200
300
400
500
600
700
800
2003
2004
2005
2006
2007
2008
2009
2010
2011
2012
2013
2014
Number of transactions Bend, under 1 acre

HOUSING MARKET ANALYSIS ABRAMOWITZ 42
$280,000
$100,000
$150,000
$200,000
$250,000
$300,000
$350,000
$400,000 20
03
2004
2005
2006
2007
2008
2009
2010
2011
2012
2013
2014
Median sales price Bend, under 1 acre
99
90
120
150
180
210
240
2003
2004
2005
2006
2007
2008
2009
2010
2011
2012
2013
2014
Days on market Bend, under 1 acre
HOUSING MARKET ANALYSIS ABRAMOWITZ 43
$152
$0 $20 $40 $60 $80
$100 $120 $140 $160 $180 $200
2003
2004
2005
2006
2007
2008
2009
2010
2011
2012
2013
2014
Median sales price, $ per square foot Bend, under 1 acre
63
0
20
40
60
80
100
120
2003
2004
2005
2006
2007
2008
2009
2010
2011
2012
2013
2014
Number of transactions Bend, 1-5 acres
HOUSING MARKET ANALYSIS ABRAMOWITZ 44
$370,000
$150,000 $200,000 $250,000 $300,000 $350,000 $400,000 $450,000 $500,000 $550,000 $600,000
2003
2004
2005
2006
2007
2008
2009
2010
2011
2012
2013
2014
Median sales price Bend, 1-5 acres
99
90 120 150 180 210 240 270 300 330 360 390
2003
2004
2005
2006
2007
2008
2009
2010
2011
2012
2013
2014
Days on market Bend, 1-5 acres
HOUSING MARKET ANALYSIS ABRAMOWITZ 45
$171
$0
$50
$100
$150
$200
$250
$300 20
03
2004
2005
2006
2007
2008
2009
2010
2011
2012
2013
2014
Median sales price, $ per square foot Bend, 1-5 acres
211
0
50
100
150
200
250
300
2003
2004
2005
2006
2007
2008
2009
2010
2011
2012
2013
2014
Number of transactions Redmond, under 1 acre

HOUSING MARKET ANALYSIS ABRAMOWITZ 46
$180,900
$100,000
$150,000
$200,000
$250,000
$300,000
$350,000
$400,000 20
03
2004
2005
2006
2007
2008
2009
2010
2011
2012
2013
2014
Median sales price Redmond, under 1 acre
126
90
120
150
180
210
240
2003
2004
2005
2006
2007
2008
2009
2010
2011
2012
2013
2014
Days on market Redmond, under 1 acre
HOUSING MARKET ANALYSIS ABRAMOWITZ 47
$110
$0 $20 $40 $60 $80
$100 $120 $140 $160 $180 $200
2003
2004
2005
2006
2007
2008
2009
2010
2011
2012
2013
2014
Median sales price, $ per square foot Redmond, under 1 acre
12
0
5
10
15
20
25
30
35
40
2003
2004
2005
2006
2007
2008
2009
2010
2011
2012
2013
2014
Number of transactions Redmond, 1-5 acres
HOUSING MARKET ANALYSIS ABRAMOWITZ 48
$342,400
$150,000 $200,000 $250,000 $300,000 $350,000 $400,000 $450,000 $500,000 $550,000 $600,000
2003
2004
2005
2006
2007
2008
2009
2010
2011
2012
2013
2014
Median sales price Redmond, 1-5 acres
211
90 120 150 180 210 240 270 300 330 360 390
2003
2004
2005
2006
2007
2008
2009
2010
2011
2012
2013
2014
Days on market Redmond, 1-5 acres
HOUSING MARKET ANALYSIS ABRAMOWITZ 49
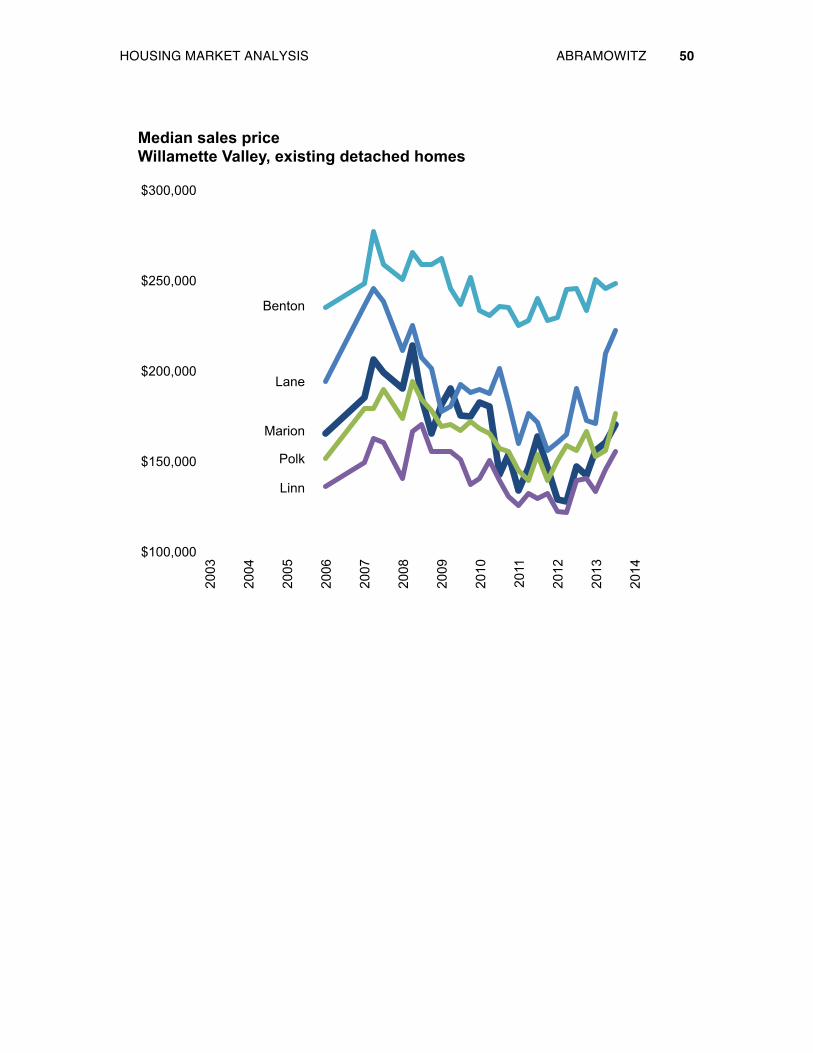
WILLAMETTE VALLEY
Marion County home prices increased 16 percent from the from the same time last year to a median sold price of $170,000. Linn County increased 12 percent over the past year to a median price of $155,000.
$148
$0
$50
$100
$150
$200
$250
$300 20
03
2004
2005
2006
2007
2008
2009
2010
2011
2012
2013
2014
Median sales price, $ per square foot Redmond, 1-5 acres
Median sales priceWillamette Valley, existing detached homes
This Quarter
Same Quarter
Last YearPercent Change
Marion County 170,000 147,000 16%Lane County 222,000 190,000 17%Polk County 176,000 156,000 13%Linn County 155,000 139,000 12%Benton County 248,000 245,000 1%
HOUSING MARKET ANALYSIS ABRAMOWITZ 50
$100,000
$150,000
$200,000
$250,000
$300,000 20
03
2004
2005
2006
2007
2008
2009
2010
2011
2012
2013
2014
Median sales price Willamette Valley, existing detached homes
Benton
Lane
Marion
Polk
Linn
HOUSING MARKET ANALYSIS ABRAMOWITZ 51
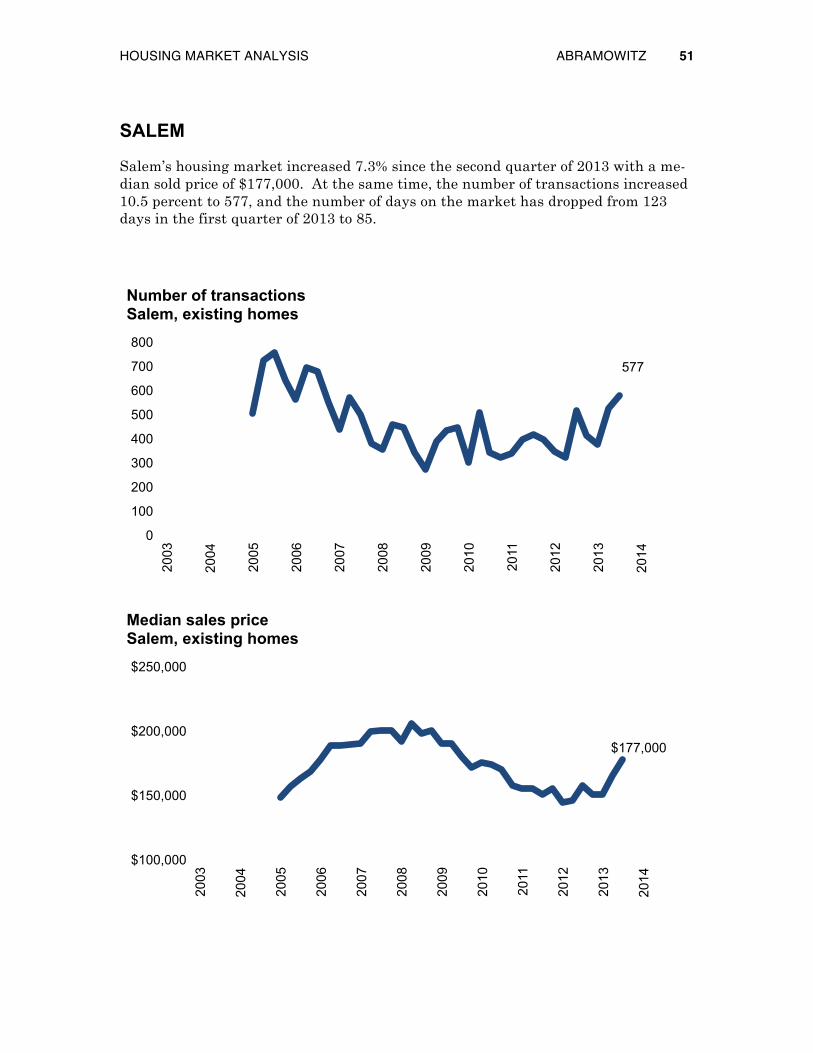
SALEM
Salem’s housing market increased 7.3% since the second quarter of 2013 with a me-dian sold price of $177,000. At the same time, the number of transactions increased 10.5 percent to 577, and the number of days on the market has dropped from 123 days in the first quarter of 2013 to 85.
577
0
100
200
300
400
500
600
700
800
2003
2004
2005
2006
2007
2008
2009
2010
2011
2012
2013
2014
Number of transactions Salem, existing homes
$177,000
$100,000
$150,000
$200,000
$250,000
2003
2004
2005
2006
2007
2008
2009
2010
2011
2012
2013
2014
Median sales price Salem, existing homes

HOUSING MARKET ANALYSIS ABRAMOWITZ 52
85
0
30
60
90
120
150
180
210
2003
2004
2005
2006
2007
2008
2009
2010
2011
2012
2013
2014
Days on market Salem, existing homes
HOUSING MARKET ANALYSIS ABRAMOWITZ 53
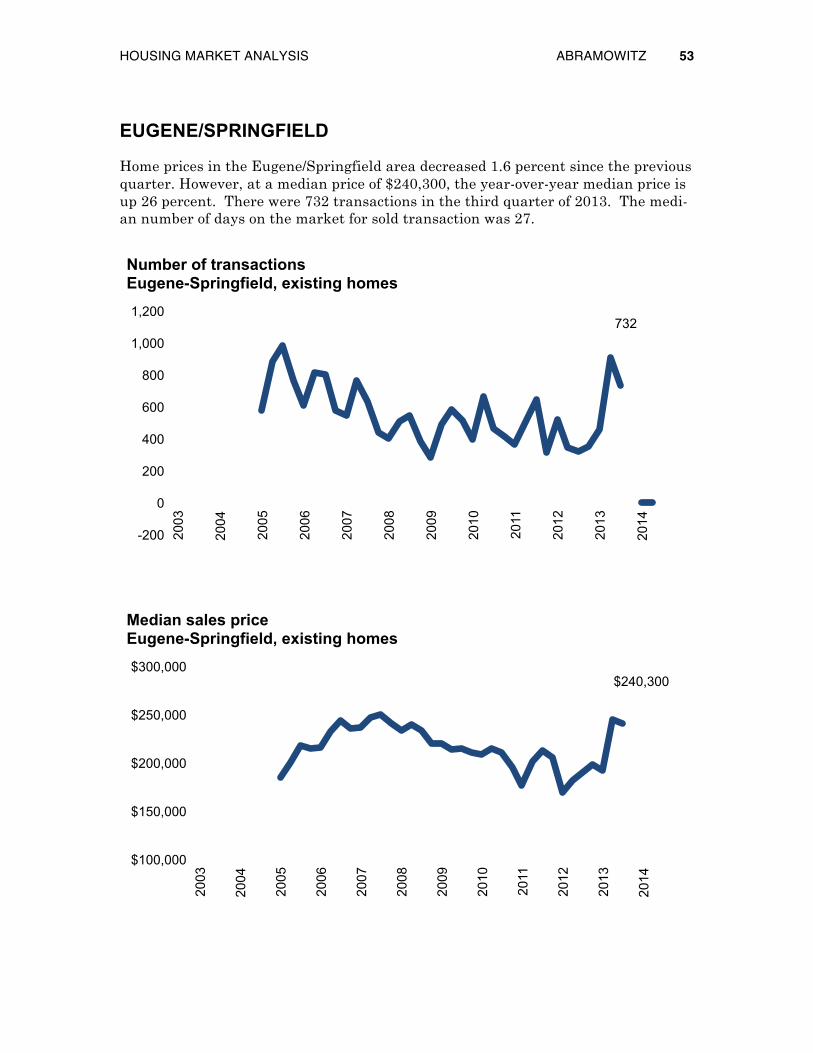
EUGENE/SPRINGFIELD
Home prices in the Eugene/Springfield area decreased 1.6 percent since the previous quarter. However, at a median price of $240,300, the year-over-year median price is up 26 percent. There were 732 transactions in the third quarter of 2013. The medi-an number of days on the market for sold transaction was 27.
732
-200
0
200
400
600
800
1,000
1,200
2003
2004
2005
2006
2007
2008
2009
2010
2011
2012
2013
2014
Number of transactions Eugene-Springfield, existing homes
$240,300
$100,000
$150,000
$200,000
$250,000
$300,000
2003
2004
2005
2006
2007
2008
2009
2010
2011
2012
2013
2014
Median sales price Eugene-Springfield, existing homes

HOUSING MARKET ANALYSIS ABRAMOWITZ 54
27
0 15 30 45 60 75 90
105 120 135
2003
2004
2005
2006
2007
2008
2009
2010
2011
2012
2013
2014
Days on market Eugene-Springfield, existing homes