Embed Size (px)
Citation preview

Market Assessment and Analysis: Learner’s Notes This document presents the “Learner’s Notes” that accompany a distance learning course on Market Assessment and Analysis. The course illustrates how markets operate and how they relate to and affect food security and vulnerable households. It describes market components and how they function and introduces some of the methods and indicators used to assess markets for improving food security analysis. Patricia Bonnard, the Senior Market and Trade Advisor for FEWS NET, developed this course for FAO. It is one component of a larger module on Food Security Information for Action. The larger module includes the following courses:
‐ Food Security Information Systems and Networks ‐ Reporting Food Security Information ‐ Availability Assessment and Analysis ‐ Baseline Food Security Assessments ‐ Food Security Concepts and Frameworks ‐ Collaboration and Advocacy Techniques ‐ Livelihoods Assessment and Analysis ‐ Markets Assessment and Analysis ‐ Nutritional Status Assessment and Analysis ‐ Food Security Policies ‐ Formulation and Implementation ‐ Targeting ‐ Vulnerability Assessment and Analysis
FAO Distance Learning courses offer self‐paced e‐learning, developed by international experts to support capacity building and on‐the‐job Training and Workshops at national and local food security information systems and networks. The Market Assessment and Analysis course available on the internet at http://www.foodsec.org/DL/dlcourselist_en.asp takes approximately 2 hours to complete. It is also available free on CD‐ROM.

Food Security Information for Action
Markets Assessment and Analysis
Lesson 1
Markets and Food Security
Learners’ Notes
© FAO, 2008
This course is funded by the European Union and implemented by the Food and Agriculture Organization
of the United Nations

Course – Markets Assessment and Analysis Lesson 1 – Markets and Food Security
Learners’ Notes 1
Table of contents
Learning objectives .......................................................................................................2
Introduction....................................................................................................................3
What are markets? ........................................................................................................4
Supply and demand ......................................................................................................7
The market system......................................................................................................10
Market networks ..........................................................................................................12
Changes in supply and demands................................................................................13
Summary .....................................................................................................................15
If you want to learn more.............................................................................................16
Annex 1: Example of national supply (Food Balance Sheet)......................................18
Annex 2: Illustration of Supply and Demand Change .................................................19
Annex 3: Elasticity of Supply and Demand .................................................................21

Course – Markets Assessment and Analysis Lesson 1 – Markets and Food Security
Learners’ Notes 2
Learning objectives
At the end of this lesson, you will be able to:
• understand basic market concepts and definitions relevant to food security analysis; and
• understand the basic principles of how markets function and how they are important for food security analysis.

Course – Markets Assessment and Analysis Lesson 1 – Markets and Food Security
Learners’ Notes 3
Introduction
Markets are a part of everyone’s lives. Even in rural areas most people, and especially the poor, rely on markets to provide food, essential goods and services. Markets also provide access to paid work and mechanisms for selling produce. Most livelihoods in low-income countries are thus closely linked to markets.

Course – Markets Assessment and Analysis Lesson 1 – Markets and Food Security
Learners’ Notes 4
What are markets?
Markets are where buyers and sellers come together to trade. They are social arrangements that allow buyers and sellers to obtain information and exchange commodities. A commodity is something tangible, that has value and can be exchanged. Commodities can include food and cash crops, livestock, non-food consumer items and even labor. A market can be organized as a physical market place where products are exchanged (e.g. cereals and household items sold in supermarkets, kiosks, market stalls, etc.). They can also be organized as stock markets, auctions or as informal arrangements, such as barter, between two people. For the purpose of this lesson we will refer to traditional physical markets trading in commodities. Markets make an important contribution to three (availability, access and stability) of the four pillars of food security:
• Availability − Producers are able to purchase inputs for producing food. − Countries can trade with each other to make sure enough food is available.
• Access − Households sell their products (e.g. crops, livestock, non-agricultural commodities)
and their labor in the market and earn income. − The price of food in the market determines whether a household’s income or
resources are sufficient to obtain an adequate quantity and quality of food. • Stability − The movement of food through markets from one location to another, from surplus to
deficit areas and across borders, usually helps to ensure stable food supplies over time and space.
How market information and analysis contributes to food security analysis Market information and analysis contributes to food security analysis by:
• deepening the understanding and analysis of food security; • adding a dynamic aspect to food security analysis; • linking households to local, national, regional and global economies; • yielding more precise estimates of needs; • improving scenario development and monitoring; • clarifying appropriate type, magnitude and timing of response; and • shedding light on the constraints to food security caused by market irregularities
and inefficiencies.

Course – Markets Assessment and Analysis Lesson 1 – Markets and Food Security
Learners’ Notes 5
Each commodity follows a flow, starting with the primary producer and moving up to the final consumer (commodity chain). A commodity chain includes all levels of the market and actors that have a role in the distribution and transformation of the commodity. Table 1: Commodity Chain Channels Commodity Chain Channels Definition
Farm gate/ Producer
Located at or near the farm or place of production. Usually, the location where a commodity is first exchanged.
Assembly
Where smaller quantities of a commodity, usually from different farmers and small scale traders, are accumulated or aggregated. Assembly markets facilitate marketing and the movement of commodities and reduce marketing costs. They also enable sellers of small surpluses from remote locations to reach distant buyers.
Wholesale Usually, where traders sell to other traders. Volumes per transaction tend to be larger, e.g. multiple 50 kg bags and even metric tons.
Retail/ Consumer
Where commodities are largely sold to end users, especially consumers. Volumes per transaction tend to be smaller, e.g. by kg or small bowl.
These different commodity chain channels tend to be sequential. Commodities usually flow from one level to the next, starting with the farm gate, where a commodity is first sold, and ending at the retail or consumer market where the final product is purchased by a consumer. While we tend to talk about the types of market as though they were completely separate things and located in different places, wholesale and retail marketing can occur in the same place. Even in one large market place, there will often be different areas where wholesale and retail activities take place. Example: Multiple types of markets The following map of Haiti shows the distribution of different types of markets. Note that in some places there are multiple types of markets.

Course – Markets Assessment and Analysis Lesson 1 – Markets and Food Security
Learners’ Notes 6
We usually look at the market for one commodity at a time, for example, the market for maize, the market for cattle or the market for labor. However, it is important to consider how the market for one commodity influences the market for another commodity. Examples The following are some examples of how commodity markets are interrelated:
• When the price of millet rises, the demand for sorghum as a substitute for millet rises.
• When there is less maize available in the market, households can reduce their purchases of maize and eat more cassava.
• When coffee prices fall, the demand for casual farm labor on coffee farms decreases.
• When taxes or import duties on rice are reduced or ocean and inland freight costs fall, the price of rice falls.

Course – Markets Assessment and Analysis Lesson 1 – Markets and Food Security
Learners’ Notes 7
Supply and demand
Markets are driven by supply and demand. MARKET SUPPLY Market supply is the amount of a commodity being offered in the market. It can come from:
• local production; • private or public stocks; • regional or international trade; and • food aid.
Suppliers include traders, agricultural producers, shops, government, humanitarian organizations, etc. – whoever is selling on the market. Traders can sell commodities that are produced locally (within the country) or they can bring in commodities from across the border through official (legal and formal) trade, or unofficial (illegal and informal) trade. Please note that market supply and total national supply are not equal. Production that is consumed on the farm is part of the national supply, but is not part of the market supply. National and local supply National food supply (generally including cereals but sometimes significant root crops) is called “food availability”. The term supply can also refer to the provincial or district supply or even regional (West Africa) supply. If you are interested in food security in a certain district of a country, you would be most interested in the supply of food within the district. But you would need to also know about food supplies in other markets and areas that are closely linked to, and influence, the local district level markets.
See Annex 1: Example of national supply (Food Balance Sheet)
The importance of each source of supply varies from country to country. For example, Tanzania produces most of the maize it needs while Lesotho imports much of its maize from South Africa. Sources of supply can also vary within a country. Urban areas tend to have a larger share of imported food compared to rural markets. Areas that are vulnerable to food insecurity may have a lot of food aid available. Markets in border districts may have a significant amount of commodities from across the border, through both formal and informal trade. Cross border trade While cross border trade may not be large in comparison to the total national supply, it can be quite significant within a specific province or district. For example, Mozambique and Malawi have very porous borders and there is a considerable flow of maize and other commodities across the borders. In contrast, the flow of maize from Tanzania to Malawi is very limited and occurs only infrequently.
Course – Markets Assessment and Analysis Lesson 1 – Markets and Food Security
Learners’ Notes 8
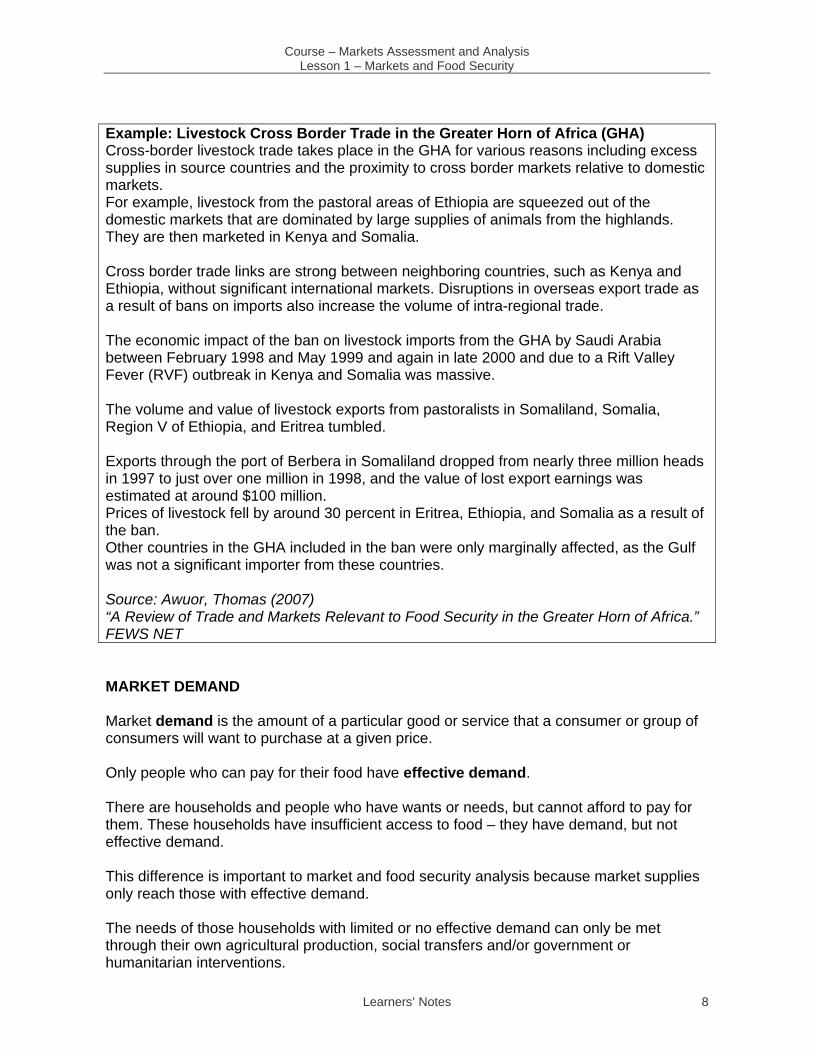
Example: Livestock Cross Border Trade in the Greater Horn of Africa (GHA) Cross-border livestock trade takes place in the GHA for various reasons including excess supplies in source countries and the proximity to cross border markets relative to domestic markets. For example, livestock from the pastoral areas of Ethiopia are squeezed out of the domestic markets that are dominated by large supplies of animals from the highlands. They are then marketed in Kenya and Somalia. Cross border trade links are strong between neighboring countries, such as Kenya and Ethiopia, without significant international markets. Disruptions in overseas export trade as a result of bans on imports also increase the volume of intra-regional trade. The economic impact of the ban on livestock imports from the GHA by Saudi Arabia between February 1998 and May 1999 and again in late 2000 and due to a Rift Valley Fever (RVF) outbreak in Kenya and Somalia was massive. The volume and value of livestock exports from pastoralists in Somaliland, Somalia, Region V of Ethiopia, and Eritrea tumbled. Exports through the port of Berbera in Somaliland dropped from nearly three million heads in 1997 to just over one million in 1998, and the value of lost export earnings was estimated at around $100 million. Prices of livestock fell by around 30 percent in Eritrea, Ethiopia, and Somalia as a result of the ban. Other countries in the GHA included in the ban were only marginally affected, as the Gulf was not a significant importer from these countries. Source: Awuor, Thomas (2007) “A Review of Trade and Markets Relevant to Food Security in the Greater Horn of Africa.” FEWS NET MARKET DEMAND Market demand is the amount of a particular good or service that a consumer or group of consumers will want to purchase at a given price. Only people who can pay for their food have effective demand. There are households and people who have wants or needs, but cannot afford to pay for them. These households have insufficient access to food – they have demand, but not effective demand. This difference is important to market and food security analysis because market supplies only reach those with effective demand. The needs of those households with limited or no effective demand can only be met through their own agricultural production, social transfers and/or government or humanitarian interventions.

Course – Markets Assessment and Analysis Lesson 1 – Markets and Food Security
Learners’ Notes 9
In the case of food staples, demand comes from national and foreign consumers, industries that use a certain commodity as an input (e.g. maize for chicken feed), government grain reserve boards and international organizations that will use the purchased commodities for food distribution programs. It is important to consider derived demand, which is the demand for a commodity as an input. For example, Nigerian chicken producers buy maize or millet because they use it to feed their chickens.
• Derived demand can be significant to food security analysis because when businesses like poultry production buy a lot of grain for feed, they can push up the price of food for household consumers.
Example: External Factors That Determine Food Supply in Niger The hike in food prices in Niger followed steep price rises in Nigeria, caused by lower agricultural production and buoyant demand stemming from high consumer purchasing power and demand from the poultry and food processing sectors. Higher prices in Nigeria caused a drastic drop in exports to Niger, while cereal flows reversed: Niger was supplying Nigeria. This trade-driven supply squeeze was compounded by lower domestic crop production because of locust attacks and some dry spells. Source: excerpt from Humanitarian Practice Network Reports, http://www.odihpn.org/ Let’s answer some questions about supply and demand... • Is market supply equal to the total supply available in the country?
No, market supply refers only to the supply that is exchanged. Production that is consumed on the farm and stocks that are held in storage are not included in market supply, although they are part the total supply.
• Are people who would like to consume more rice, but do not have sufficient money to purchase it, considered part of market demand for rice? No, these are people who have no effective demand – they do not have sufficient money to purchase rice, even if they would like to consume more.

Course – Markets Assessment and Analysis Lesson 1 – Markets and Food Security
Learners’ Notes 10
The market system
The market system includes the whole commodity distribution system from production to consumption. The elements of the market system can be summarized as follows: Actors or participants – producers, traders, transporters, consumers, government, etc. Infrastructure – market buildings and stalls, storage facilities, road networks, etc. Information - bulletins, radio broadcasts, informal exchange, etc. Services – financing, handling, transporting, storing commodities, etc. Relationships - contracts, agreements, familial and informal networks, etc. Decisions and strategies – transactions, purchases, sales, provision of services, etc. Legal framework and norms – grades and standards, property and contract laws, licensing, taxes, etc. Even if we are looking at household food security in just one district, it is important to understand how the larger market system works because it has a strong influence on local markets. A description of the market system should give a good sense of the interrelationships and dynamics present in the system, the overall business environment and the broader sociopolitical environment. Business environment The business environment includes factors such as tax and tariff regimes, trade standards, contract enforcement, official corruption, business regulation, land registries and consumer trends. Table 2: Key attributes of a market system Attribute Description
Geographic distribution
For food security analysis, it is important to know how a market system is spatially distributed. Note that it can extend beyond national boundaries. It is critical to understand how key population groups such as poor, food insecure and vulnerable households, are geographically distributed in a market system.
Functional distribution
Some markets, within a market system, may operate differently from others and provide different services. Urban markets tend to be large in terms of volumes of commodities and numbers or buyers and sellers. The selection of food commodities is diverse and often less seasonal than rural markets. Also, the conduct of market participants can be different depending on the specialization and wealth of the participant. Large-scale traders often own storage facilities, trucks and hire

Course – Markets Assessment and Analysis Lesson 1 – Markets and Food Security
Learners’ Notes 11
people to purchase and assemble commodities. They may import goods from abroad, use cell phones, have many contacts in a wide range of markets and across borders and have access to more credit and other financial resources. Small-scale traders often rely on local buses and trucking services for transportation, have a high turn over of purchases and sales, limited stocks, and may or may not hire some casual labor.
Seasonal patterns
The number and type of participants engaged in the market may change over the year. For example, the numbers of traders and transport services tend to peak around the harvest period. The volume, origin and quality of commodities in the market change over the year. Local products are more common at harvest time and imported products are more common during the lean season. Road infrastructure becomes unusable during the rainy season in areas that do not have all-weather roads. The quality of perishable products such as vegetables and grains changes throughout the year and can influence prices. Market prices at all levels of the market also follow seasonal patterns.
Responses and strategies related to stresses and shocks
When traditional sources of supplies are affected by unfavorable weather, natural disasters, internal/external conflict, etc., traders turn to alternative sources. They may have fairly regular patterns of sourcing supplies between normal and bad seasons. Governments impose bans and other restrictive regulations in times of scarcity. Livestock owners and pastoralists frequently bring animals to the market for sale in larger numbers and earlier in the season when there has been a drought and pasture conditions are poor. Many rural households engage in more causal employment to compensate for revenue losses when harvests are poor or prices of the commodities they grow and sell are low, which can cause a drop in casual wages. All of the elements of the market system can exhibit seasonal patterns as well as somewhat predictable responses to market threats and stresses. Knowing what the typical patterns are can help us interpret the market and anticipate rises in food insecurity and food crises.

Course – Markets Assessment and Analysis Lesson 1 – Markets and Food Security
Learners’ Notes 12
Market networks
Market networks describe commodity flows and points of exchange from production to the final consumer. In its simplest form, a market network refers to how a market system is structured spatially. Market networks are typically represented as maps. Table 3: Key components of a market network Component Description
Market centers
Locations where commodities are exchanged. These locations can be permanent or periodic (weekly, monthly or seasonal). They can be different types of markets - wholesale, retail or a combination of both.
Surplus areas
Market catchments or those areas that produce more than enough of a commodity to meet local needs and can thus supply deficit areas.
Deficit areas
Those areas that do not produce enough of a commodity and rely on an inflow of the commodity to meet local needs.
Commodity flows
The movement of commodities from one location to another. These can be expressed in terms of direction and magnitude. Cross border flows should be included. Seasonal or typical inter-annual (normal verses bad harvest years) variations in market availability and flows.
Course – Markets Assessment and Analysis Lesson 1 – Markets and Food Security
Learners’ Notes 13
Changes in supply and demands
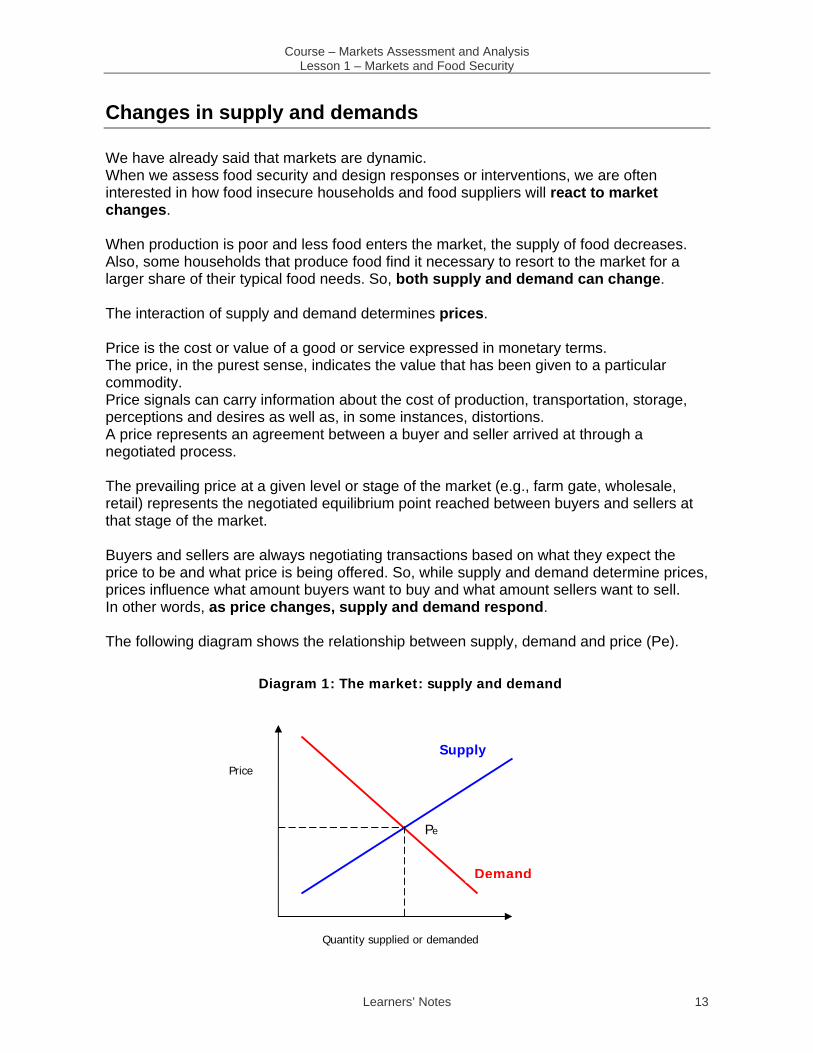
We have already said that markets are dynamic. When we assess food security and design responses or interventions, we are often interested in how food insecure households and food suppliers will react to market changes. When production is poor and less food enters the market, the supply of food decreases. Also, some households that produce food find it necessary to resort to the market for a larger share of their typical food needs. So, both supply and demand can change. The interaction of supply and demand determines prices. Price is the cost or value of a good or service expressed in monetary terms. The price, in the purest sense, indicates the value that has been given to a particular commodity. Price signals can carry information about the cost of production, transportation, storage, perceptions and desires as well as, in some instances, distortions. A price represents an agreement between a buyer and seller arrived at through a negotiated process. The prevailing price at a given level or stage of the market (e.g., farm gate, wholesale, retail) represents the negotiated equilibrium point reached between buyers and sellers at that stage of the market. Buyers and sellers are always negotiating transactions based on what they expect the price to be and what price is being offered. So, while supply and demand determine prices, prices influence what amount buyers want to buy and what amount sellers want to sell. In other words, as price changes, supply and demand respond. The following diagram shows the relationship between supply, demand and price (Pe).
Diagram 1: The market: supply and demand
Quantity supplied or demanded
Demand
SupplyPrice
Pe

Course – Markets Assessment and Analysis Lesson 1 – Markets and Food Security
Learners’ Notes 14
Supply usually falls when the price falls, and demand usually falls when the price rises. That’s why the supply curve slopes upward and the demand curve slopes downward. See Annex 2: Illustration of Supply and Demand Change
Decision makers and food security analysts are often asking the questions:
• What happens when the price of a basic good rises? • Will more supplies come into the market? • Will consumers be willing and able to pay for the good at higher prices if supplies
don’t increase? For food security analysis, it is very important to know how supply or demand responds to changes in market conditions, especially price changes. To predict this response, we use a concept called “elasticity”. Elasticity is the percentage change in one thing relative to a percentage change in another. For example, if the demand for maize is very inelastic, a small increase in the price of maize will cause a very small reduction in the demand for maize. If the demand is very elastic, a small increase in the price of maize will cause a large decrease in demand. Knowing how elastic supply and demand are helps the food security analyst estimate what effect a shift in supply or demand may have on market prices. Understanding elasticity is important because, when the price of a commodity changes, it tells you:
• how likely consumers will be to change the amount of that commodity they demand and, ultimately, consume; and
• how likely traders and other sellers will be to change the amount they supply and
thus how much of a commodity will be available on the market. Knowing how elastic supply and demand are is important if you want to assess changes in market conditions and their impact on food security. See Annex 3: Elasticity of Supply and Demand

Course – Markets Assessment and Analysis Lesson 1 – Markets and Food Security
Learners’ Notes 15
Summary
Markets can be viewed as social arrangements that allow buyers and sellers to obtain information and exchange goods and services. Typically, commodity chain channels comprise four basic types: Farm gate/Producer, Assembly, Wholesale and Retail/ Consumer. Markets are affected by supply and demand:
• market supply is the amount of a commodity being offered in the market; while • market demand is the amount of a commodity desired (demanded) from the market.
The market system includes the whole commodity distribution system from production to consumption. Market networks describe commodity flows and points of exchange from production to the final consumer. Price is the cost or value of a good or service expressed in monetary terms. Food security analysts are typically interested in prices of basic commodities, goods and services that are closely related to food security. Elasticity is the percentage change in one thing relative to a percentage change in another.

Course – Markets Assessment and Analysis Lesson 1 – Markets and Food Security
Learners’ Notes 16
If you want to learn more...
Online resources FEWS NET (http://www.fews.net) RATIN (http://www.ratin.net ACDI/VOCA “Value Chain Approach: Strengthening Value Chains for Economic Opportunities.” (http://www.ACDIVOCA.org Additional reading What Are Markets? Awuor, Thomas (2007). “Review of Trade and Markets Relevant to Food Security in the Greater Horn of Africa.” FEWS NET. Dradri, Simon (July 2007) “A Market Analysis of the Food Security Situation in Southern Africa in 2007/2008.” Lusaka, WFP. Murphy, E. (2006), Sierra Leone Bellmon Analysis FY’06, CORAD: CRS/Africare, CARE/World Vision Sierra Leone Ministere de L’Agriculture de L’Hydraulique et des Resources Halieutiques, Rep. Du Burkina Faso (2004) « Resultates Previsionnel de la Campagne Agricole 2004-2005 et de la Situation Agricole » WFP/FEWS NET “Southern Africa Informal Trade” Bulletins Beekhuis, G., Niger: Profil des Marchees Cerealiers, WFP-SENAC, August 2005, Senegal The Market System CARE (2004)). “Rationale for a Possible Market Support Program in Darfur, Sudan: A Brief Look at Markets and Food Security.” WFP (2006). “Emergency Food Security Assessment Handbook.” Helvetas (2002). Clients First! A Rapid Market Appraisal Toolkit Market Networks FEWS NET “Structure-Conduct-Performance and Food Security.” Market Guidance No. 1 Holtzman (1986) “Rapid Reconnaissance Guidelines for Agricultural Marketing and Food Systems in Developing Countries.” MSU International Development Working Paper No 30. Caves (1992) “American Industry: Structure, Conduct and Performance.” Princeton Hall.

Course – Markets Assessment and Analysis Lesson 1 – Markets and Food Security
Learners’ Notes 17
Supply and Demand Response Tomek and Robinson (1985). Agricultural Product Prices. Cornell University Press. WFP (2007). “PDPE Market Analysis Tool: Price and Income Elasticities.” Dorosh, Paul and Steve Haggblade (2006) “Incorporating Market Responses in Emergency Needs Assessments: A Prototype Spreadsheet Model for Zambia.” Rome, WFP. FEWS NET (2007) “Price Parity and Early Warning” Market Guidance No 2 Dradri, Simon (2007) “A Market Analysis of the Food Security Situation in Southern Africa in 2007/08.” Lusaka, WFP. William A. Ward (1977) “Calculating Import and Export Parity Prices,” Training material of the Economic Development Institute, CN-3 Washington DC, World Bank WFP (2007) “PDPE Market Analysis Tool: Import Parity Price.” CARE (May 2007) “A Market Analysis and Decision Tree Tool for Response Analysis: Cash, Local Purchase and/or Imported Food Aid: A Decision Tree Tool.” Atlanta, CARE. FAO (2007) “FAO/GIEWS Guidelines for Crop and Food Supply Assessments.” Rome, FAO. Murphy, E. (2006), Sierra Leone Bellmon Analysis FY’06, CORAD: CRS/Africare, CARE/World Vision Sierra Leone.

Course – Markets Assessment and Analysis Lesson 1 – Markets and Food Security
Learners’ Notes 18
Annex 1: Example of national supply (Food Balance Sheet)
Bilan céréalier national Prévisionnel de la Campagne 2004-2005
POSTES RIZ BLE MIL,SORGHO MAÏS, FONIO
TOTAL
Burkina Faso POPULATION AU
30/04/05 12 614 854
1. DISPONIBILITES 53 792 0 2 791 221 2 845 013
PRODUCTION BRUTE (CAMP
2004/5) 95 168 0 2 967 334 3 062 502
PRODUCTION DISPONIBLE 52 342 0 2 522 234 2 574 576
STOCKS INITIAUX (AU 01/11/2004) 1 450 0 268 987 270 437
-STOCKS PAYSANS 0 0 234 796 234 796
-AUTRES STOCKS 1 450 0 34 191 35 641
2. BESOINS 165 255 32 762 2 322 918 2 520 934
NORMES DE
CONSOMMATION(kg/hbt/an) 13,1 2,5 174,4 190
CONSOMMATION HUMAINE 165 255 31 537 2 200 031 2 396 822
STOCKS FINAUX (AU 31/10/2005) 0 1 225 122 887 124 112
+ STOCKS PAYSANS 0 0 66 716 66 716
+ AUTRES STOCKS 0 1 225 56 171 57 396
3. EXCEDENT(+)/DEFICIT(-) BRUT -111 462 -32 762 468 303 324 079
4. SOLDE IMPORT/EXPORT 223 654 44 840 -27 310 241 184
IMPORTATIONS COMMERCIALES -
2004/5 217 554 37 320 0 254 874
+ COMMERCANTS PRIVES 210 774 37 320 0 248 094
+ AUTRES IMPORTATIONS 6 780 0 0 6 780
AIDES ALIMENTAIRES 6 100 7 520 8 642 22 262
EXPORTATIONS PREVUES 0 0 35 952 35 952
5. EXCEDENT(+)/DEFICIT(-)NET 112 192 12078 440 993 565 263
6. DISPONIBLE
APPARENT/HBT(kg) 22,0 3,6 219,1 244,6
Source: MAHRH/. DGPSA/ Direction des Préventions et D'Alerte Précoce (DPAP)

Course – Markets Assessment and Analysis Lesson 1 – Markets and Food Security
Learners’ Notes 19
Annex 2: Illustration of Supply and Demand Change
This graph shows how supply and demand determine the price, Pe.
When there is a negative supply shock (e.g., an import ban imposed), the supply shifts back or to the left (S1 to S2). This causes the price to rise and the quantity demanded falls as the price rises. Price increases from P1 to P2 and the quantity sold declines from Q1 to Q2 as shown in the second graph.
Quantity supplied or demanded
Demand
Supply
Price
P2
S1
S2
P1
Figure 2: A supply shock – import ban or production shortfall
Q2 Q1
Quantity supplied or demanded
Demand
SupplyPrice
Figure 1: The market: supply and demand
P0

Course – Markets Assessment and Analysis Lesson 1 – Markets and Food Security
Learners’ Notes 20
The third graph illustrates how when the government enters the market to purchase maize for its strategic reserves, the demand increases and the demand curve shifts out or to the right and the quantity demanded expands from Q1 to Q2. As a result, the price increases, the quantity supplied to the market at the higher price increases and the ultimate price (new equilibrium price) rises from P1 to P2.
Quantity supplied or demanded
Demand
Supply
Price
P2
S1
P1
Figure 3: Increase in Demand – New government SGR
Q1
D2 D1
Q2

Course – Markets Assessment and Analysis Lesson 1 – Markets and Food Security
Learners’ Notes 21
Annex 3: Elasticity of Supply and Demand
Elasticity is the percentage change in one thing relative to a percentage change in another. Supply and Demand Response and Elasticities
• The price elasticity of supply measures how responsive the market it is to price changes.
• The price elasticity of demand measures how responsive demand is to price changes.
Inelastic: If the supply of maize is very inelastic large increases in the price of maize will bring about only very small changes in the supply of maize, all other things being equal. If the demand for maize is very inelastic (steeper), a small increase in the price of maize will cause a very small reduction in demand. Elastic: If supply of maize is very elastic (flatter), small changes in the price of maize will bring about a large increase in the supply of maize, all other things being equal. If the demand for maize is very elastic (flatter), a small increase in the price of maize will bring about a large decrease in the demand for maize. Figures 1 and 2 illustrate how the elasticities of supply and demand have an affect on price. In figure 1 we compare a shift in demand given an elastic supply and an inelastic supply. The elastic supply could depict a situation where there are open borders and commodities can flow freely across the border. The inelastic supply could represent a situation where the border is closed and supplies are relatively fixed until the next harvest. Note that an outward shift in demand from D1 to D2 (e.g., a large-scale brewery opens and enters the market for local cereals) has a different effect on the price, depending on whether the supply is elastic (p1) or inelastic (p2). In both cases, prices increase due to pressure from additional consumers entering the market. However, when supply is elastic, prices rise less than when supply is inelastic.
Quantity supplied and demanded
Demand
Inelastic Price
Figure 1: Elastic and inelastic
Elastic
Price
P2
P1
p
D1 D2
Course – Markets Assessment and Analysis Lesson 1 – Markets and Food Security
Learners’ Notes 22
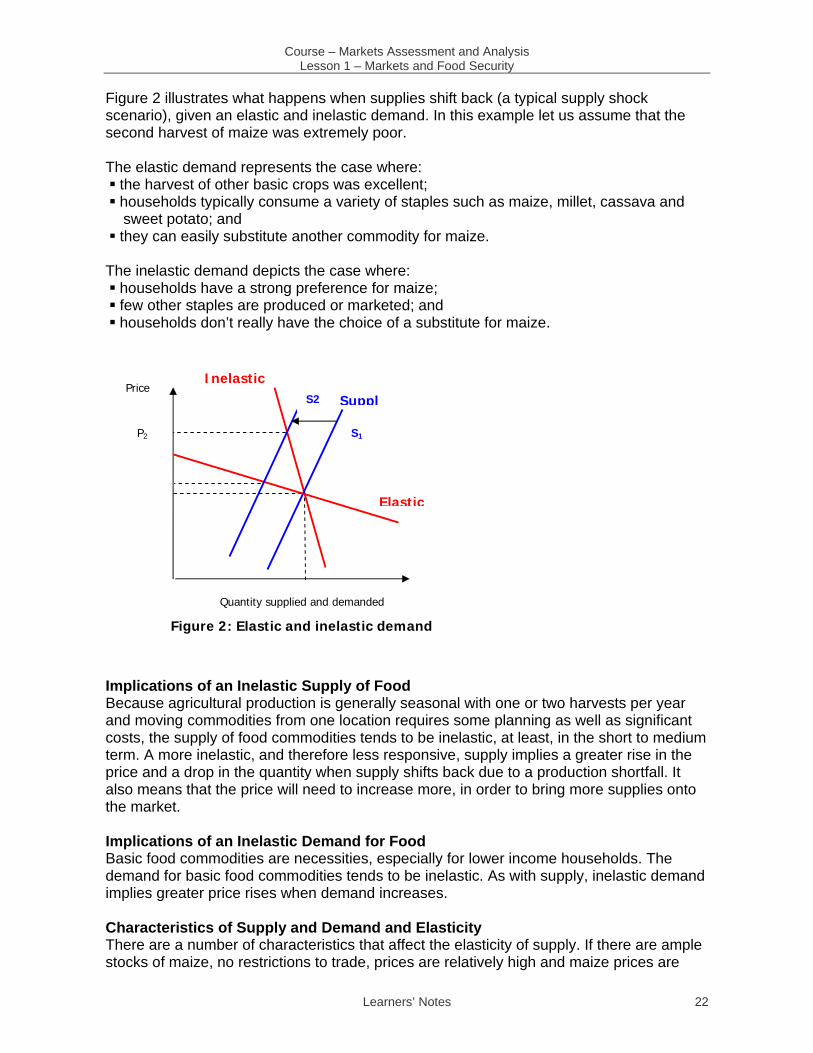
Figure 2 illustrates what happens when supplies shift back (a typical supply shock scenario), given an elastic and inelastic demand. In this example let us assume that the second harvest of maize was extremely poor. The elastic demand represents the case where:
the harvest of other basic crops was excellent; households typically consume a variety of staples such as maize, millet, cassava and sweet potato; and
they can easily substitute another commodity for maize. The inelastic demand depicts the case where:
households have a strong preference for maize; few other staples are produced or marketed; and households don’t really have the choice of a substitute for maize.
Implications of an Inelastic Supply of Food Because agricultural production is generally seasonal with one or two harvests per year and moving commodities from one location requires some planning as well as significant costs, the supply of food commodities tends to be inelastic, at least, in the short to medium term. A more inelastic, and therefore less responsive, supply implies a greater rise in the price and a drop in the quantity when supply shifts back due to a production shortfall. It also means that the price will need to increase more, in order to bring more supplies onto the market. Implications of an Inelastic Demand for Food Basic food commodities are necessities, especially for lower income households. The demand for basic food commodities tends to be inelastic. As with supply, inelastic demand implies greater price rises when demand increases. Characteristics of Supply and Demand and Elasticity There are a number of characteristics that affect the elasticity of supply. If there are ample stocks of maize, no restrictions to trade, prices are relatively high and maize prices are
Quantity supplied and demanded
Elastic
Suppl
Figure 2: Elastic and inelastic demand
Price
P2
InelasticS2
S1

Course – Markets Assessment and Analysis Lesson 1 – Markets and Food Security
Learners’ Notes 23
expected to decline in the near future (reducing potential future returns), the supply of maize is likely to be more elastic. Sellers are likely to take advantage of the high prices and bring supplies into the market hoping to sell before prices are expected to decline. If there a few sellers, limited stocks, relatively low maize prices and maize prices are expected to rise in the near future, supply is inclined to be more inelastic and sellers will be less likely or slower to respond to an initial price increase with increased supplies. Thus, knowing something about the characteristics of supply and elasticity can help a food security analyst determine if a rise in a basic food commodity price will be followed by an inflow of food into the local market or not. Similarly, there are a number of characteristics that affect the elasticity of demand. If households are indifferent about eating maize or millet, substantial supplies of millet are in the market and maize prices are rising, households will probably switch from buying maize to buying millet if the price of maize begins to rise. On the other hand, if households strongly prefer maize over other cereals and all other cereals are in short supply, households may forgo buying other goods in order to continue buying maize despite the higher price, or they may purchase less maize and reduce the size of their meals. Thus, the elasticity of demand can help a food security analyst determine how households will respond to a rise in basic food commodity prices. In different places and at different times, supply and demand for a specific commodity can have any combination of these characteristics. A combination of characteristics will determine whether supply and demand are or more or less elastic. Some of the standard characteristics and effects on elasticities are included in the following table.

Course – Markets Assessment and Analysis Lesson 1 – Markets and Food Security
Learners’ Notes 24
What makes supply or demand elastic?
More Elastic
Demand Supply
• Diverse preferences – people like to eat many different kinds of foods like cassava, millet and rice, not just rice
• Availability of close substitute commodities for final consumption – maize is scarce but millet, sorghum and rice are plentiful
• Availability of close substitutes for derived demand
• The commodity is NOT a necessity • Higher incomes • Luxury commodities
• Many close substitutes • Significant competition among sellers • More continuously produced – more of the
commodity can be brought onto the market • Available stocks • Limited market barriers – few formal or
informal fees and legal restrictions, etc • Good market infrastructure – good roads,
telecommunications, etc • Significant excess or surge capacity • Expectations that prices will be decreasing • Adjustment period is longer – e.g., several
months as opposed to a few days or a week
Less Elastic
Demand Supply
• Rigid preferences – people eat predominantly rice in Asia or predominantly maize in Southern Africa
• Limited or no close substitute commodities are available for final consumption – maize, millet, sorghum and rice are all scarce
• Limited or no close substitutes for derived demand
• The commodity is a necessity • Lower incomes • Additive commodities
• Few close substitutes • Lack of competition among sellers • Produced (harvested) infrequently • Limited or no stocks • Market barriers – formal and informal fees
or restrictions, etc • Poor market infrastructure – poor roads,
telecommunications, etc • Limited or no surge capacity • Expectations that prices will be increasing
(speculation) • Short period of adjustment
Many of these characteristics stay relatively stable over a long period of time. For example, people’s preferences for certain foods stay relatively the same over a long period of time. As a consequence, elasticities are relatively stable over time.

Food Security Information for Action
Markets Assessment and Analysis
Lesson 2
Assessing Markets
Learners’ Notes
© FAO, 2008
This course is funded by the European Union and implemented by the Food and Agriculture Organization
of the United Nations

Course – Markets Assessment and Analysis Lesson 2 – Assessing Markets
Learners’ Notes 1
Table of contents
Learning objectives .......................................................................................................2
Introduction....................................................................................................................3
Components of a market assessment ..........................................................................4
Analysis of demand .......................................................................................................5
Selecting market indicators ...........................................................................................6
Analysis of demand .......................................................................................................7
Selecting market indicators ...........................................................................................8
Analysis of demand .......................................................................................................9
Supply and market systems ........................................................................................10
Types of market assessment ......................................................................................14
Markets and response design .....................................................................................17
Summary .....................................................................................................................18
If you want to know more ............................................................................................19
Annex 1: Listing Important Key Consumption Markets...............................................20
Annex 2: Key Production/Income Commodities..........................................................21
Annex 3: Listing Important Consumption Markets ......................................................22
Annex 4: Listing Important Production or Income-Generating Markets......................23
Annex 5: Using market calendars and market chain diagrams ..................................24
Annex 6: Gathering market information ......................................................................28
Annex 7: Market Questions – Market Baseline or Profile ...........................................30
Annex 8: Typical Market Monitoring and Early Warning Questions ...........................32
Annex 9: Standard Market Questions for Disasters....................................................33
Annex 10: Sample Trader Survey Outline for Disasters .............................................35
Annex 11: Typical Market Recovery - Development for Food Security Questions.....37
Annex 12: Typical Markets Questions for Cash vs Food Response Choices ............39
Annex 13: Choosing between cash and food programming.......................................40

Course – Markets Assessment and Analysis Lesson 2 – Assessing Markets
Learners’ Notes 2
Learning objectives
At the end of this lesson you will be able to:
• identify the components of a typical market assessment for food security; and • understand what are the different market assessment tools and their applications.

Course – Markets Assessment and Analysis Lesson 2 – Assessing Markets
Learners’ Notes 3
Introduction
Information on markets can help you understand worsening or improving food security conditions as well as enhance your food security analysis and identify appropriate responses. It is important to have an understanding of how markets operate and, particularly, how they relate to and affect food security and vulnerable households. This lesson will introduce some methods used to assess markets for improving food security analysis.

Course – Markets Assessment and Analysis Lesson 2 – Assessing Markets
Learners’ Notes 4
Components of a market assessment
Market assessments tend to follow a similar format, using some standard methods, and produce some standard outputs. They can be national, sub-national or regional in scope. A good market assessment should be designed to answer a specific set of questions and objectives. Demand and supply and the market system should be assessed. The assessment should be focused on markets and market performance as they relate to food security. It should consider constraints, opportunities and both demand and supply impacts and capacities to respond. The contents of an assessment typically include:
• Definition of the objectives • Analysis of demand • Analysis of Supply and the market system • Analysis of constraints, opportunities and response • Concrete recommendations for interventions

Course – Markets Assessment and Analysis Lesson 2 – Assessing Markets
Learners’ Notes 5
Analysis of demand
To describe the demand, you first have to identify which commodities are relevant to which population groups (livelihood groups) and how/where households access these commodities. Different commodities can be important to different food insecure populations. For example, some groups eat mostly rice; others eat a combination of different cereals such as millet, maize and sorghum, etc. Livelihoods of food insecure people may also depend on commodities that they do not consume but that are important to production and income generation. Food security relevant commodities might include: Food security relevant commodities might include: food crops, cash crops, livestock and livestock products, fish, non-food items such as fuel wood, carpets, labour. Important food security commodities An important food security commodity can be:
• a staple (maize, rice, wheat, cassava, etc); • one that only the poorest consume even if it is not widely consumed by the rest of
the population; • a poorer quality or lower grade of the country’s basic staple; or • a commodity that is consumed only or mainly when households are under stress
and substitute this inferior food for a more preferred one (substitute commodity).

Course – Markets Assessment and Analysis Lesson 2 – Assessing Markets
Learners’ Notes 6
Selecting market indicators
To select commodities, you need to identify:
• Consumption Commodities, which are the most important commodities from a consumption point of view.
• Production/income Commodities, which are the most important commodities from an income earning point of view.
Consumption Commodities These “food security” commodities may not be the same as those which make up the bulk of what you find in the market. While the majority of the population may consume rice, the poorest may consume cassava. There are those who can afford to eat and purchase a certain desirable quality of wheat, while the poor and food insecure consume and buy an inferior quality of wheat. Also, you want to make sure to include the commodities that food insecure households tend to consume as substitutes for their more preferred foods when these preferred foods are scarce and expensive. Some commodities can play an important role in the diet when there are stresses: poor harvests, price spikes, border closings, etc can inhibit preferred patterns of consumption and it’s useful to note the alternative foods at such times.
See Annex 1: Listing Important Key Consumption Commodities
Earning Commodities You also need to identify which commodities are important to production and income generation and thus food access. Households may or may not consume what they grow or raise predominately for income. Most rural small-scale producers grow and sell basic grains. Pastoralists depend on livestock – cattle, camels, sheep and goats. Women often earn income from small livestock and poultry. Households with secure land tenure may earn income from perennial crops such as cashews, coffee, palm oil and tea. Coastal populations may depend on fish and fish processing. Some households will work for others as casual labour and their employment opportunities are dependent on the markets for a certain commodity, e.g. coffee. For many households that are vulnerable to food insecurity, there are foods that they consume more of when they experience some kind of shock or stress. In Uganda, cassava is often called a “food security” crop because a household can store it in the ground and harvest whenever there is scarcity of other foods such as “matoke” (plantains), a preferred food. Food security crops are important to consider too even if they aren’t eaten as frequently.
See Annex 2: Key Production/Income Commodities

Course – Markets Assessment and Analysis Lesson 2 – Assessing Markets
Learners’ Notes 7
Analysis of demand
You will also need to know some basic characteristics of demand:
• Are theses commodities necessities? • Are there substitutes for these commodities? • Are these commodities consumed in greater or lesser quantities as incomes rise? • How elastic or inelastic do you think the demand is?
Substitute Commodity A substitute (commodity) is a commodity that can replace another in consumption or production, such as millet for sorghum. When the price of one commodity rises, consumers or agro-processors will decrease their consumption of it and increase consumption of the substitute commodity. Wild and gathered products can be substitutes for preferred staples of food insecure households, especially in times of stress or increasing food insecurity. The term “substitute” can also be applied to crops where farmers choose to plant more or less of substitute crops, e.g., sorghum or millet, depending on the prices they expect to receive once they harvest and sell their crop. Whether a substitute in consumption or production, the more easily one commodity (crop) can replace the other, the more important it is to consider the price and price behavior of both commodities in your market analysis. Another important aspect of demand is which markets are important to food security. While the bulk of a country’s marketable cereals may flow through a few key markets or end up being sold to urban consumers in certain towns and cities, the most food insecure populations may depend on or have access to just one or two minor markets to sell their produce, livestock and labour or to buy their food and other basic goods. These minor markets will be important ones to include in your analysis. The few markets that food insecure populations depend upon may be supplied by commodities that were assembled in other major markets. These markets should also be considered. Food insecure groups may also rely on labour markets. E.g., an analysis of the labour market for sugar cane cutters may be helpful, especially if households rely on this sector to buy food rather than grow it.

Course – Markets Assessment and Analysis Lesson 2 – Assessing Markets
Learners’ Notes 8
Selecting market indicators
To select commodities, you need to identify: 1. Consumption Markets, which are the most important markets from a consumption point of view. Key questions To select consumption markets, you need to decide: • At which markets do food insecure and vulnerable populations buy their basic food
commodities? • Which markets have important links to these consumption markets?
− Which markets are these markets dependent on for supplies (e.g. does most of the commodity move through certain provincial or border markets prior to being onward shipped to these less central markets)?
− Do sellers supply other markets that may compete for supplies (e.g. are there major urban centers within the country or across the border with large populations who are willing and able to pay higher prices and typically draw in significant supplies)?
See Annex 3: Listing Important Consumption Markets
2. Production/Income Markets, which are the most important markets from an income earning point of view. Key questions To select production or income-generating markets, you need to decide: • At which markets do food insecure and vulnerable populations sell their produce? • Which markets have important links to these production markets? − Which markets do these markets supply? − Do buyers purchase from other markets that may have larger and cheaper supplies?
See Annex 4: Listing Important Production or Income-Generating Markets

Course – Markets Assessment and Analysis Lesson 2 – Assessing Markets
Learners’ Notes 9
Analysis of demand
When you conduct a market assessment it’s important to consider total demand – vulnerable and food secure households, other consumers, derived demand (breweries, bakeries), government and non-governmental buyers, etc. You should make sure you take into account other consumers in the market who, together with the food insecure population, make up the total demand. They can be:
• relatively wealthy consumers with significant purchasing power and similar food or consumption preferences living in large urban areas within the country or across the border;
• bakeries, breweries, feed processors and poultry producers buying cereals as
inputs; and
• government and/or non-governmental organizations making local purchases to support their strategic grain reserves or humanitarian programmes.

Course – Markets Assessment and Analysis Lesson 2 – Assessing Markets
Learners’ Notes 10
Supply and market systems
Different tools can be used to assess demand, supply and the market systems:
1. Market calendars and market chain diagrams; 2. Market network maps; 3. Basic seasonal and historical price trends; and 4. The Structure-Conduct-Performance framework.
1. Market calendars and market chain diagrams A market calendar is a simple tool that illustrates the availability of a commodity or a group of commodities in the market throughout the calendar year. Market chains illustrate the points within the market system where production, transformation, distribution and consumption of a commodity take place.
See Annex 5: Using market calendars and market chain diagrams 2. Market network maps One of the best ways to identify which markets should be included and who to interview within the market system is to sketch out market maps for the key food security commodities: one for each commodity. Just take a map and draw the network for the commodity and populations you are most interested in. Market network maps help highlight which areas of a country are linked to one another through markets, and which areas of a country are linked to neighbouring countries through cross border trade and markets. Maps can be constructed for sub-national, national and regional market networks. Building market network maps Commodity market maps can be constructed in a number of ways. In general they can be based on data, experience or both. They can use mapping or graphics software, photos and/or sketches. The choice of methods will depend on what you have at hand: the type of data and information and how reliable or representative you think it is; the type of technology that is available such as computers, software, cameras, etc; and what you want to do with the map such as perform spatial analysis, plan an assessment, describe the market system for a report or use at a workshop, etc. Market network maps: example 1 This map was constructed using a review of literature, the collective experience of the analyst and key informants from different countries who the analyst interviewed. He used mapping software to construct the base maps and graphics software to edit and adjust the final product. Because this map is digital, it can be easily shared and adapted using additional information or data.

Course – Markets Assessment and Analysis Lesson 2 – Assessing Markets
Learners’ Notes 11
Market network maps: example 2 These two maps were created at workshops. The attributes such as the classification of areas as surplus or deficit, commodity flow lines, etc were all derived from the experience of the workshop participants, which included staff from local ministries and food security working groups. These maps were photographed, downloaded and recreated using GIS software.
The Somali sorghum network map was constructed on a base map built using software. The Haitian maize network map was drawn on an ordinary road map that had been laminated for easy sketching and editing. 3. Basic seasonal and historical price trends Commodity prices tend to follow a seasonal pattern. Looking at seasonal price movements helps us to understand:

Course – Markets Assessment and Analysis Lesson 2 – Assessing Markets
Learners’ Notes 12
• seasonal patterns of food insecurity (changes in price behaviour make the
access to food more difficult in some periods of the year).
• price expectations (if prices are high and we are nearing the harvest, we can expect them to begin to fall; if they are high and we are just moving into the rainy season and period where crops are growing in the fields, we can expect it to be quite a while before prices come back down).
• market performance (seasonal price patterns also indicate relative scarcity and
abundance of food and wide variations may suggest that markets are not adjusting well – commodities are not efficiently moving from areas with low prices to those with high prices).
Seasonal pattern of prices
Typical Seasonal Price Movement
Prices are low at harvest time and tend to grow throughout the marketing or consumption season, reaching their peak during the hungry season and fall at the next harvest. The variation over the season tends to be more dramatic or accentuated where there are few alternative sources of supply and the market is dependent on local production. The pattern is more pronounced for unimodal (one harvest per year) production system. Bimodal (two harvests per year) production systems can have two price peaks and troughs, but these are frequently less pronounced.
Hungry Season
Price $/kg
Next Harvest Harvest
Time

Course – Markets Assessment and Analysis Lesson 2 – Assessing Markets
Learners’ Notes 13
4. The Structure-Conduct-Performance framework The Structure-Conduct-Performance (S-C-P) approach is based on the idea that the structure of a market influences the conduct of its participants (buyers and sellers) which, in turn, influences its performance. Table 1: Definitions of Structure-Conduct-Performance for Food Security Analysis
Element Definition Structure Relatively stable features of the market environment
(e.g. number of sellers in the market).
Conduct Behaviour and strategies of market actors or participants (e.g. differentiating products).
Performance Outcomes of market interactions (e.g. prices). Central to assessing current and future food security conditions as well as designing responses or interventions, is being able to estimate how food insecure households and food suppliers will react to market changes. What type of demand and supply response will there be? Will traders who have stocks of commodities available in one location or market move them to another market that is experiencing scarcity and rising prices? Wherever there are significant formal or informal cross border flows of commodities, it is important to account for the possibility that commodities could move into and out of border areas and the broader market networks as the market conditions change. It is important to collect all possible information about the market system and how it operates in normal conditions as well as under typical stress conditions (e.g., production shortfalls, post hurricane or cyclone). Collecting information on markets can take time and may be impractical within the tight time frame of an emergency. Much of this information can be gathered and organized once and periodically updated. Often some of this basic market information is already available and just needs to be gathered and incorporated in the food security assessment.
See Annex 6: Gathering market information

Course – Markets Assessment and Analysis Lesson 2 – Assessing Markets
Learners’ Notes 14
Types of market assessment
The types of tools used for data collection and analysis are basically the same for all types of assessments. What changes are the objectives, the questions asked and breadth of the assessment. The following typical applications of assessment are presented on the next screens together with standard questions and tools:
1. Market Food Security Monitoring and Early Warning 2. Markets and Food Security Disaster Assessment 3. Market Assessment of Recovery Programs
1. Market Food Security Monitoring and Early Warning The following process describes how markets fit into food security monitoring:
• Initial baseline market assessment At the beginning of the season, a baseline assessment of the market context, structure, conduct and performance is required if this information does not already exist. The assessment for the coming season is sometimes called an outlook. The following are the sources of information for initial assessments: − available data and information, − output from a food security or vulnerability assessment that was undertaken, and − interviews with key informants at the local ministries, agencies and associations
that deal with the commodities that were deemed food security relevant. Some interviews, or even quick phone calls, can be made to traders and other well-informed and cooperative market participants (e.g., millers, transporters). This type of assessment or outlook only needs be updated infrequently. It does not have to be constantly adjusted by the monitoring system. However, it should be updated at least once during the season. Updates allow you to reassess your previous assumptions and expectations as well as capture the dynamics of markets and their potential impact on food security.
See Annex 7: Standard Questions to develop a Market Baseline or Profile
• Regular monitoring In the process of regular monitoring, current data and information are compared to historical trends, five-year averages or a similar situation in the past looking for anomalies that could suggest significant changes in market and food security conditions. The initial market assessment or market profile is also used as a reference and it allows us to gauge the significance of the anomalies we see and their implications on food security.
For food security monitoring and early warning purposes, market assessments focus on:

Course – Markets Assessment and Analysis Lesson 2 – Assessing Markets
Learners’ Notes 15
• Signs of deterioration or improvement in food security that are related to food availability and access. Some examples of signs of deterioration are: − production shortfalls; − non-seasonal increases in the prices of food; − distress sales of livestock (e.g. sales of breeding stock or draft animals); and − larger numbers of people migrating in search of casual employment.
• Signs of the way the markets are functioning that could have implications on food
security, e.g. declines in world market prices for important crops. Signs of the way the markets are functioning that could have implications on food security, e.g. declines in world market prices for important crops. Important cash crops are, for example, tobacco or crops for which there is usually a high demand for casual labour like cotton or coffee picking. Traders might be buying in areas where they don’t typically buy or where they may have started purchasing commodities earlier in the season. The government might have changed commodity price policies or purchase and sales programs.
See Annex 8: Typical Market Monitoring and Early Warning Questions
As aspects of the market are changing every day and participants are constantly adjusting to these changes, market information and market analysis add a dynamic element to food security analysis. Assessing markets for food security monitoring and early warning works the same way as food security monitoring and early warning work in general. The assessment focuses on the following:
• Look for anomalies (what is different) • Look for trends • Historic (over a number of years) • Seasonal (over one year) • Compare information to reference points/periods (the profile, another drought year) • Project future trends • Estimate demand and supply response • Form expectations, make plausible assumptions and develop outlooks
Food security monitoring and early warning are normally focused on slow onset disasters, that evolve over a period of time (e.g. droughts), and may allow markets, households and decision makers to adjust and either prevent or mitigate impacts. However, monitoring and early warning also help to understand how a rapid onset disaster (e.g. cyclones, earthquakes, policy changes that evoke a massive response from the economy) may have affected the population and what the recovery process might look like.

Course – Markets Assessment and Analysis Lesson 2 – Assessing Markets
Learners’ Notes 16
2. Market and Food Security Disaster Assessment In the best case scenario, a disaster assessment will take place where market baseline or profile already exists and a food security monitoring system is in place. In this case, the response to a rapid onset disaster could initially focus on verification of the early warning systems, situation analysis and assumptions, impact and forecasting the recovery rather than having to piece together and build the basic knowledge about the market system. In the case of a slow onset disaster, a market assessment looks very much like the early warning situation. The following tools can be helpful for emergency assessments:
See Annex 9: Typical Emergency Impact Questions and Annex 10: Sample Trader Survey Outline for Disasters
See also: MSU (2006). “Market Profiles and Emergency Needs Assessments: A Summary of Methodological Challenges.” Rome, WFP/SENAC (VII. Annex Table 1) Typical Market Monitoring and Early Warning Questions documents.wfp.org/stellent/groups/public/documents/ena/wfp095655.pdf 3. Market Assessment of Recovery Programs Markets are an integral part of many recovery programs. Road reconstruction activities following rapid onset or complex emergencies serve as a primary source of employment and the improvement in roads facilitates the inflow of productive inputs, food and other basic goods as well as the output of commodities.
See Annex 11: Typical Market Recovery - Development for Food Security Questions
The following checklist provides guidance on how to select market-based activities that are appropriate for poor and food insecure households that are either chronically food insecure or in the process of recovering from an emergency.
Checklist
• Is there a longer term potential for growth? • Does this include some element of risk management? • Is the allocation of labour flexible? • Are start-up costs very low? • Are the poor facing many buyers and sellers in undertaking this activity? • Is the activity sustainable without external support? • Does the policy and regulatory environment support participation of the
poor? • Do critical services (e.g., credit) reach the poor? • What is the distribution of benefits?
Course – Markets Assessment and Analysis Lesson 2 – Assessing Markets
Learners’ Notes 17
Markets and response design
Markets are an important aspect of the response options to food insecurity. Markets:
• fine tune the determination of unsatisfied needs in terms of magnitude, location and time frame;
• condition the type and extent of humanitarian response; • provide opportunity for earlier response through market related policies; • reduce the need for humanitarian response; • reduce dependence on donors when the private sector is engaged in the response;
and • help to rebuild shattered/destroyed economies in post emergencies.
See: MSU (2006). “Market Profiles and Emergency Needs Assessments: A Summary of Methodological Challenges.” Rome, WFP/SENAC (X. Annex Table 4) documents.wfp.org/stellent/groups/public/documents/ena/wfp095655.pdf In the last several years, many humanitarian agencies have begun to use cash-based responses to address emergency needs following a rapid onset disaster. Such an approach has also been used in regions of chronic food insecurity (e.g. Turkana, Kenya). An important consideration in the choice between a cash or food response is what will be the affect on local markets and ultimately food security. In general, to avoid negative impacts resulting from cash or food aid interventions, a proper market assessment prior to project implementation is needed.
See Annex 12: Typical Markets Questions for Cash vs Food Response Choices
See Annex 13: Choosing between cash and food programming

Course – Markets Assessment and Analysis Lesson 2 – Assessing Markets
Learners’ Notes 18
Summary
A market assessment should be designed to answer a specific set of questions and objectives. Demand and supply and the market system should be assessed. The assessment should be focused on markets and market performance as they relate to food security. Typical types of market assessments include:
• Market food security monitoring and early warning • Markets and food security disaster assessment • Market assessment of recovery programs
Markets are also an important aspect of the response options to food insecurity.

Course – Markets Assessment and Analysis Lesson 2 – Assessing Markets
Learners’ Notes 19
If you want to know more
Online resources MSU (2006). “Market Profiles and Emergency Needs Assessments: A Summary of Methodological Challenges.” Rome, WFP/SENAC (http://documents.wfp.org/stellent/groups/public/documents/ena/wfp095655.pdf) Additional reading MSU (2007). “Market Profiles and Emergency Needs Assessments: A Summary of Methodological Challenges.” Rome, WFP/SENAC. Nyberg, Jennifer (2005) “Pakistan: Market Assessment in Earthquake Affected Areas.” Rome, WFP Dorosh, Paul (2003) “Market Considerations in Emergency Needs Assessments.” Winahyu, R and R Acaye (2005) “Food Aid and the Market in Aceh.” Oxfam Cristóbal, I; E Huertas; P Creti; et al (2004) “Floods in the Southeast of Haiti: An Assessment Report.” Oxfam. CARE (2007) “A Market Analysis and Decision Tree Tool for Response Analysis: Cash, Local Purchase and/or Imported Food Aid? The Decision Tree Tool.” Atlanta, CARE Gentilini, Ugo (2007) “Cash and Food Aid Transfers: A Primer.” Rome, WFP Balzar, N and Gentilini, U. (2006) “WFP and Cash Transfers in Malawi: Issues, Options and Way Forward, Lilongwe and Rome, WFP. Adams, Lesley and Paul Harvey (Sept, 2006). “Learning from Cash Responses to the Tsunami.” Humanitarian Policy Group, Issue Paper No 2. Creti, Pantaleo and Susanne Jaspars, eds. (April, 2007). “Cash Transfer Programming in Emergencies.” Oxfam.

Course – Markets Assessment and Analysis Lesson 2 – Assessing Markets
Learners’ Notes 20
Annex 1: Listing Important Key Consumption Markets
Key Consumption Commodities You can list the important consumption commodities for different groups and different areas of the country. This will help you recall some of the variation among populations and across geographic areas. Key Consumption Patterns (most important commodities from consumption point of view) Commodity Rank Areas1 Population
Groups2 Source4
1Importance: 1=most important, 2=important, 3=significant, 4=key coping food 2Areas can be defined any way that makes sense in your context: everywhere, provinces, districts, vulnerable zones, urban or rural areas, costal areas, etc 3Population group can be defined any way that makes sense in your context: everyone, poor, most vulnerable, ethnic group, etc 4Source can be own production, market, in-kind payment, etc.
Making tables of key consumption and production or income commodities can also be used as a reference for selecting markets to include in your analysis, building market network maps and analyzing the distribution of possible impacts across space and population groups.

Course – Markets Assessment and Analysis Lesson 2 – Assessing Markets
Learners’ Notes 21
Annex 2: Key Production/Income Commodities
You can list the important production or income-generating commodities for different groups and different areas of the country. This will help you recall some of the variation among populations and across geographic areas. Key Production/Income Patterns (most important commodities from a production/income point of view) Commodity Rank1 Areas2 Population
Groups3 Use4
1Importance: 1=most important, 2=important, 3=significant, 4=key coping food 2Areas can be defined any way that makes sense in your context: everywhere, provinces, districts, vulnerable zones, urban or rural areas, costal areas, etc 3Population group can be defined any way that makes sense in your context: everyone, poor, most vulnerable, ethnic group, etc 4Use can be food, market/cash crop, etc. Making tables of key consumption and production or income commodities can also be used as a reference for selecting markets to include in your analysis, building market network maps and analyzing the distribution of possible impacts across space and population groups.

Course – Markets Assessment and Analysis Lesson 2 – Assessing Markets
Learners’ Notes 22
Annex 3: Listing Important Consumption Markets
You can list the important consumption markets for different groups and different areas of the country. Key Markets for Food Consumption Commodity Rank1 Areas/Populations2 Retail or
consumption markets
Wholesale markets
Assembly markets
1Importance: 1=most important, 2=important, 3=significant, 4=key coping food 2Areas/populations can be defined any way that it makes sense in your context: everywhere, provinces, districts, vulnerable zones or populations, urban or rural areas, coastal areas, etc

Course – Markets Assessment and Analysis Lesson 2 – Assessing Markets
Learners’ Notes 23
Annex 4: Listing Important Production or Income-Generating Markets
You can list the important consumption markets for different groups and different areas of the country. Key Markets for Food Production or Income Generation Commodity Rank1 Areas/Populations2 Where
commodity is first sold
Assembly markets
Wholesale markets
Retail or consumption markets
1Importance: 1=most important, 2=important, 3=significant, 4=key coping food 2Areas can be defined any way that makes sense in your context: everywhere, provinces, districts, vulnerable zones, urban or rural areas, coastal areas, etc

Course – Markets Assessment and Analysis Lesson 2 – Assessing Markets
Learners’ Notes 24
Annex 5: Using market calendars and market chain diagrams
Market calendars A market calendar is a simple tool that illustrates the availability of a commodity or a group of commodities in the market throughout the calendar year. It can also be used to describe when employment opportunities are plentiful or scarce. Information used to fill out the calendar can be gathered from a variety of sources such as farmers, households, traders or even discussions with staff from the Ministry of Agriculture. The information can be collected through structured or informal interviews.
Calendar for X Market Month Commodity
J F M A M J J A S O N D Maize Beans Cattle Labour
Available Abundant
Scarce
Availability
Key
Not available
Market Chains Generic Market Chain
Market chains illustrate the points within the market system where production, transformation, distribution and consumption of a commodity take place. Market chains explain the way in which different components of the market are linked (farm gate to assembly, wholesale to retail). A market chain is generally drawn for one commodity and is usually vertical, starting with the primary producer and moving up market system to the final consumer. It includes all levels of the market (assembly, wholesale and retail) and actors that have a role in the distribution and transformation of a commodity. Market chains can be very simple (e.g., a farmer who sells directly to a consumer) or complex: it depends on the number of ways in which the commodity is utilized (and thus transformed), whether it is stored and used at a later date, how widely it is distributed (locally consumed or destined for exportation) and how many different market participants are involved.
Production
Assembly Market
Wholesale Market
Processors
Retail Market
Final Consumer

Course – Markets Assessment and Analysis Lesson 2 – Assessing Markets
Learners’ Notes 25
Typically, value is added at each point or level along the market chain. The process of adding value is relatively obvious when a commodity is transformed or processed: wheat flour is clearly different from wheat grain. Less obvious, is the value that is added when moving a commodity, without any transformation at all, from one location to another (wheat grain at a wholesale market as opposed to at the farm), or in storing a commodity from one season to another (wheat flour just after harvest and wheat flour late in the hungry season). But each of these stages or services represents added value.
The following is the Darfur Grain Market Chain from WFP (2005) “Emergency Food Security Assessment Handbook.”
PLOTTING MARKETING CHANNELS
Producer
Producer
Producers’ & village market level
Grain Traders
Middlemen (Sababa)
Truckers or casual traders
Producer
Producer
Rural Market Level
wholesalers
Retailers
Retailer
Processor
Exporter
Consumer
Consumer
Foreign Consumer
Urban or Hub Market Level
Peripheral deficit market level
Retailer
UrbanConsumer
Consumer
Adaptation from CARE’sDarfur Market Analysis
Main channel
Minor channel
Informal cross-border trade

Course – Markets Assessment and Analysis Lesson 2 – Assessing Markets
Learners’ Notes 26
Market chains can cross international borders. For example, livestock marketing chains in East Africa tend to be oriented toward the large Nairobi market or Djibouti where animals are processed and shipped on to the lucrative Gulf States. Livestock market chains drawn for different countries within the Greater Horn of Africa would include markets across borders as well those centres of final consumption (large capital cities like Nairobi and in the Gulf States) because demand for livestock products in these centres exert considerable influence over the profitability and hence vitality of trade through all the different market centres and back to pastoralists and farmers raising animals. To understand the economic opportunities for pastoralists, one would need to understand these important market linkages.
Example: A Market Chain That Extends Across Borders
A livestock market chain for Ethiopia would include geographic points across its borders. Moyale market in Ethiopia and Mandera market in Kenya are the two largest cross-border terminal markets for livestock trade and distribution between Ethiopia and Kenya. Seventy to eighty percent of live animals sold in these two markets originate in Ethiopia. The Ethiopia/Kenya livestock trade is very important because it links prime cattle production areas of southern Ethiopia to the region’s largest market in Nairobi, Kenya.
Source: Awuor, Thomas (2007) “A Review of Trade and Markets Relevant to Food Security in the Greater Horn of Africa.” FEWS NET
Labour market chains for any Central American country would likely include linkages to several countries within the region. Similarly, the food security of households living in some areas of Afghanistan is highly dependent on labour market opportunities. Households purchase much of their wheat flour (the basic staple) from markets and rely on employment to generate the necessary income to cover the food requirements as well as other basic needs. Example: Labor Markets and Food Security in Afghanistan
For wheat producing provinces in the north, the performance of the wheat harvest correlates with the food security situation of the local population during the following marketing year. In contrast, local production has less of an impact on household food security for populations of the south, southeast, southwest, central and western subregions. In these areas, households have responded to eight years of drought by diversifying

Course – Markets Assessment and Analysis Lesson 2 – Assessing Markets
Learners’ Notes 27
their livelihoods strategies, particularly by expanding reliance on wage employment (e.g. in construction and poppy production). To effectively analyze and monitor the food security of these populations in particular, it is important to consider factors other than, or in addition to, local wheat production such as food prices, trade restrictions, wage rates and employment opportunities.

Course – Markets Assessment and Analysis Lesson 2 – Assessing Markets
Learners’ Notes 28
Annex 6: Gathering market information
Much of the market information can be gathered and organized once and periodically updated, say every five years or when a significant change takes place. All of the more stable market products that do not have to be reproduced every year can be drafted and updated as new information is collected and the knowledge of the market system deepens. Creation of market maps, market chains, market calendars and characterizing typical trader behavior can be done before a food security or vulnerability assessment process gets underway. Often this information is already available and only needs to be gathered and incorporated in the food security assessment. Many government market information systems have monthly prices of key commodities for key markets. For data and information about neighboring countries, some prices can be found on websites of commodity specific trade associations, RATIN regularly reports on East Africa (www.ratin.net) and FEWS NET (www.fews.net) covers countries for which it has a presence. Staff from the Ministry of Agriculture can usually provide up to date information on policies that affect food supplies and food security. Literature and research documents often contain some very useful information about markets, such as the behavior of participants. Key informants Key informants are important too. Structured interviews and rapid informal surveys are typical methods used to gather information about market conduct (e.g. trader behavior). Key informants can describe how the market typically performs over the year as well as in normal and bad years. Market participants can be asked to reflect on how their behaviors and strategies change over the season and in response to different market events and stresses. Small-scale and large-scale traders may exhibit very different conduct and use very different coping strategies so a range of traders should be interviewed. Village groups can describe market performance issues and highlight what are the important performance criteria from their perspective. Because opinions on performance will likely vary among different people within a village – women and men may be most focused on different commodities and women may be concerned with food prices. Information on trader strategies and reactions to particular markets may help to project what you think their responses will likely be.

Course – Markets Assessment and Analysis Lesson 2 – Assessing Markets
Learners’ Notes 29
Quick interviews with traders can yield important insights on market responses. Traders will often have reliable impressions of what is happening in local, national and even regional markets. It is, however, also important to note that traders can manipulate their responses to the interviewer’s questions to suit their own interests. Therefore, it is necessary to utilize tactful interviewing methods and be cautious about the interpretation of information collected from traders. Frequently, market maps and market chains are put together using the collective experience of the members of the national food security or vulnerability working group. Staff of the National Market Information System and Ministry of Agriculture can also provide a wealth of information about market networks.

Course – Markets Assessment and Analysis Lesson 2 – Assessing Markets
Learners’ Notes 30
Annex 7: Market Questions – Market Baseline or Profile
Depending on the characteristics of the commodity and market, the kind of information that is helpful to have in order to establish a market profile or baseline will vary a little. However, there are numerous standard questions that are relevant to almost any situation. To create an accurate baseline, it will be necessary to conduct some interviews with traders, other market participants and key technical informants (e.g., staff at the Ministry of Agriculture or trade associations). It is important to pose these questions and collect the information for each commodity and for each market. Available market services, market participants, behaviour and strategies may differ across commodities and markets. It’s important to identify and account for these differences when you are assessing markets because these characteristics will determine the outcomes in markets and thus the food security outcomes. Market Questions – Market Baseline or Profile Context or Environment What do commodity market networks look like within the country and region (create network maps)? Are there government commodity purchase or sales prices? Are there import or export restrictions – taxes, bans, quotas, licensing requirements? Are there licensing requirements or fees for engaging in trade? Are there import or export restrictions in neighboring countries? Is there food distribution? What is the rate of inflation? What is the exchange rate policy? Structure What are the different types of sellers in the market? How many sellers (of each type) are there in the market? How many buyers are there in the market? Is there transport available to producers? Is the market vertically integrated (create market chains)? Are commodities differentiated (e.g. different qualities of grain, meal or flour)? Conduct Which commodities do you normally buy? When (which months) do you mostly buy? (create a market calendar for purchases) What is the typical volume of purchases over the season? From where do you normally acquire the commodities? From whom do you normally acquire commodities? Do your buying practices change in bad years and, if so, how? When (which months) do you mostly sell? (create a market calendar for sales) What is the typical volume of sales over the season? Which commodities do you normally sell? Where do you normally sell commodities? To whom do you normally sell? Do your selling practices change in bad years and, if so, how?

Course – Markets Assessment and Analysis Lesson 2 – Assessing Markets
Learners’ Notes 31
Do you store commodities, for how long and why? Do your storage practices change in bad years and, if so, how? Do you have your own transport and, if not, how do you transport goods? Do you have access to credit? Do you belong to any market groups or associations? Where do you get your market information? Do you engage in contracting and how? What are the difficulties you face in either buying or selling commodities? Performance Are food prices affordable to food insecure and vulnerable groups? Are commodity prices affordable to food insecure and vulnerable groups in bad years? What are the market margins at different levels of the market? Are there large swings in the supply of commodities over the year? What does the seasonal pattern of supply look like in a bad year? Are there large swings in the prices of commodities over the year? What does the seasonal price pattern look like during a bad year? Are there clear and consistent quality and measurement standards? How well are markets integrated? What is the extent of losses, waste and spoilage throughout the market chain? NOTE: Questions should be asked for each commodity and market While the list is extensive, nearly all of the questions can be answered through a rapid market survey of representative market participants. A range of traders should be interviewed, particularly small-scale traders in relevant target markets and large-scale traders who supply these traders. Large-scale traders are generally more familiar with the bigger picture of market environment, conduct, structure and performance. Nonetheless, small-scale traders possess critical insight at the ground level and can reveal information about market bottlenecks from which large-scale traders may be insulated since they have access to more financial resources and contacts. Other players in the market chain can also provide critical information such as government officials (especially in Customs and Ministry of Agriculture), transporters/freight forwarders, warehouse owners, millers and business support service agencies and cooperatives, if they exist. At a minimum, you want to be able to describe what the market system looks like and how market participants behave over the seasons and during times of stress. Having just a snapshot of one point in time (just the current situation) will not provide enough information for you to anticipate and project how the market is likely to behave and influence food security. You need to take the opportunity while you are in the field conducting the survey to acquire information about market dynamics.

Course – Markets Assessment and Analysis Lesson 2 – Assessing Markets
Learners’ Notes 32
Annex 8: Typical Market Monitoring and Early Warning Questions
Typical Market Monitoring and Early Warning Questions Include: What does the supply situation look like within the market catchments – locally,
regionally or globally? Is there enough food in markets? What is happening to food stocks? Are livestock prices low and declining (high and rising), is this abnormal and will
this trend continue? Have they surpassed a threshold value? Are cereal prices high and rising (low and falling?), is this abnormal and will this
trend continue? Have they surpassed a threshold value? How will demand respond to increasing (decreasing) food prices? How will supply respond to the increasing (decreasing) food prices? What are prices likely to be next month, later in the season, etc? Are wage rates and employment opportunities declining (rising), and is this
abnormal and will this trend continue? What do we expect the employment situation to look like in a month, later in
season, etc? Have there been any important events or changes locally or within the region that
could affect the market like: o Price or exchange rate policies, o Fuel and transport costs, o Civil unrest or insecurity, o New businesses that may compete for food (e.g. poultry for grain as feed)? o Institutional purchases that compete for food (e.g. strategic grain reserves,
WFP)? How will these events affect food security and who’s food security? What will be the food gap given market response? What are appropriate responses?

Course – Markets Assessment and Analysis Lesson 2 – Assessing Markets
Learners’ Notes 33
Annex 9: Standard Market Questions for Disasters
Typical Emergency Impact Questions Include: What is the current situation analysis? Note: not a question? Is the emergency progressing or abating? What is the projected timeline of the emergency? What are the major constraints facing different market participants (traders,
transporters)? Have the costs of transport risen? How have market margins changed? Have purchasing and selling behaviours and strategies altered and how? Have market networks changed or been obstructed and how? What has happened to food stocks? What has happened to the supply of food security relevant commodities? What has happened to the prices of food security relevant commodities? Has the number and type of sellers in the market changed and how? How are market participants responding to the emergency? Are there behaviours that are exacerbating or alleviating the emergency situation? Are there policies that are exacerbating or alleviating the emergency situation? Is there a change in the number and type of people coming to the market? How are buyers responding to the emergency? What has happened to wage rates and employment opportunities? What do we expect to happen to supplies of food security relevant commodities in
the next month/several months? When is the next harvest? What do we expect the employment situation to look like in a month/several
months? What are the needs? What are appropriate market and non-market responses? Have there been any responses to the emergency yet? Are any planned? How will these responses affect markets, food security and who’s food security? What is the damage to roads, telecommunications and other market related
infrastructure? Are there losses to food stocks, livestock and other food security
commodities? Can market participants move around – if restrained, is the restriction
physical or due to civil insecurity? NOTE: Questions in bold tend to be more relevant to rapid onset emergencies such as cyclones, civil unrest To conduct an accurate and complete assessment of markets and food security, it’s important to assess the situation from a number of people’s perspectives – households, traders, transporters, etc. because informants will definitely have different impressions of the emergency, its impact and its recovery. For example, traders may be concerned with access to principal roads whereas households will likely be more concerned about feeder roads that link their villages to minor market centers. While traders may feel that it is reasonable to increase prices because of the increased costs associated with bringing supplies in from more distant locations, households may feel that the higher prices are exploitive and price them out of the market.

Course – Markets Assessment and Analysis Lesson 2 – Assessing Markets
Learners’ Notes 34
All of these questions can be addressed with a formal or informal survey instrument administered to a representative group of market participants, the actual number would be determined by the amount of resources and qualified staff available and timeframe for when the information is needed – this last factor is typically the greatest constraint.

Course – Markets Assessment and Analysis Lesson 2 – Assessing Markets
Learners’ Notes 35
Annex 10: Sample Trader Survey Outline for Disasters
MARKET TRADER - Survey for Emergency Needs Assessment Basic characteristics:
How long have you been engaged in the trade that you are doing now? Do you have your own transport facilities? If yes, what? Do you have your own storage facilities? If yes, how large? Do you belong to a trader or farmer group or association? What communication technology is most important for your trading? Do you have sources of income other than trading?
Discuss what they are doing now: Which commodities are you currently trading? Which commodities did you trade last month? Who are currently your main customers? How are you currently transporting your goods to market?
Discuss what their operations are like in a normal year: Which commodities did you trade one year ago? For each commodity, what is the month of highest sales in a “normal year”? For each commodity, what is the month of lowest sales in a “normal year”? How do you get the goods to sell in a normal year? What volume do you handle per week at this time of year in a normal year? Do you borrow money to buy goods to sell at this time of year in a normal year? Do you extend credit to your customers in a normal year? Who are your main customers at this time of year in a normal year? Does the demand for your produce fluctuate over time? Which commodities do you think will have a good future demand? Which are the most lucrative markets (type, location) for the different commodities? How do you transport your goods to the market in a normal year at this time? How much competition do you face from other traders during the buying process? How do you get market information? What information do you get?
Comparison between this year and a “normal year” How does your volume of sales this week compare to the same period one year
ago? What are the main constraints you are facing as a trader? How are you currently getting the goods to sell?

Course – Markets Assessment and Analysis Lesson 2 – Assessing Markets
Learners’ Notes 36
MARKET TRADER - Survey for Emergency Needs Assessment Where do you purchase the goods? What volume do you get when you purchase? Marketing margins: How much does it cost to transport the goods to this market? Do you have to pay taxes on the purchase? Road taxes or other charges along the
way? If you have to cross a border, are there formalities there? What do you consider to be the most risky part of your business?
How is this year different from a normal year: Transport access Transport costs Border or product transport costs or taxes Storage access Storage Costs Goods to sell Customers to buy Cost of goods for sales Availability of goods for sales Sales prices Credit availability
If current sales are less than “normal sales” for this time of year, why? If current sales are more than “normal sales” for this time of year, why?

Course – Markets Assessment and Analysis Lesson 2 – Assessing Markets
Learners’ Notes 37
Annex 11: Typical Market Recovery - Development for Food Security Questions
Questions
If civil insecurity has been an issue, is it improving or deteriorating and how?
Have market networks changed or evolved, and how?
What is the state of transport, have there been improvements and is there likely to be improvement in the near future?
Are the number of trucks and other vehicles increasing?
What is happening to the costs of transportation?
What has happened to the supply of food security relevant commodities, including inputs?
What are the types, volumes and seasonality of commodities available in the market and are they increasing?
Are supplies becoming more regular over the year?
What are the prices and price trends of food security relevant commodities?
What is happening with food stocks?
Who is involved in buying and selling in the markets?
Has the number and type of sellers in the market changed and how?
How do the poor, food insecure or vulnerable households participate in this market as both buyers and sellers?
Have purchasing and selling behaviours and strategies been changing and how?
How have market margins changed over time and is there a change in the distribution of the market margin shares (e.g., do farmers now capture a larger share of the final product price)?
What are the major constraints facing different market participants (traders, transporters)?
Are markets contributing to the recovery and how?
What is the behaviour of wage rates and employment opportunities?
What do we expect to happen to supplies of food security relevant commodities in the next month/several months?
What do we expect the employment situation to look like in a month/several months?
What are the needs?
What are appropriate responses?
How will these responses affect markets, food security and who’s food security?
For how long will the suggested responses need to be in place and what will be the indication that a change in the response is appropriate?
Some additional points concerning assessments in the recovery situation:

Course – Markets Assessment and Analysis Lesson 2 – Assessing Markets
Learners’ Notes 38
The changing environment as well as the changing market and food security conditions: o warrant frequent assessment and updates o suggest more emphasis on change and evolution of market conditions and
performance rather than monitoring absolute performance o require flexible programming that can be adjusted in accordance with these
changes

Course – Markets Assessment and Analysis Lesson 2 – Assessing Markets
Learners’ Notes 39
Annex 12: Typical Markets Questions for Cash vs Food Response Choices
Questions
• Is food or are particular commodities necessary for therapeutic purposes? • What does the supply situation look like within the market catchments – locally,
regionally or globally? • Is there enough food in markets? • Are stocks available? • Are livestock prices abnormally low and declining (high and rising), is this
abnormal and will this trend continue? • Are cereal prices abnormally high and rising (low and falling), is this abnormal and
will this trend continue? • How will demand respond to increasing food prices (elasticities, integration,
networks, price differentials)? • How will supply respond to the increasing food prices (elasticities, market power,
and traders’ conduct)? • What are prices likely to be next month, later in the season, etc? • When is the next harvest expected? • Do households have access to and regularly resort to markets for food? • Are there aspects of the market environment that could make supply less
responsive? o Consumer preferences differentiated by population (livelihood and wealth
groups) o Price controls (purchase or sales prices) o Licensing, tendering and other regulations on transactions o Trade restrictions within the market catchment areas o Fuel price controls or quotas o Corruption
• What will be the food gap given market response? • Are there currently food or cash transfer programmes? • Is there capacity to design and implement food or cash transfer programmes? • What are appropriate responses?

Course – Markets Assessment and Analysis Lesson 2 – Assessing Markets
Learners’ Notes 40
Annex 13: Choosing between cash and food programming
Food distribution and cash transfer The development of cash programs must be accompanied with a thorough market analysis to forecast the potential impact of cash payments on the economy in the short to medium term. How the decision between a cash or food response relates to the market can be presented using two simplified illustrations. 1. First, if you bring a lot of food for direct distribution into an area, you can upset the balance of supply and demand. Households that receive food won’t need to buy as much food and the overall market demand will go down, especially if many of those households had effective demand and were buying food. The decrease in demand will cause prices to fall and that will hurt sellers’ incomes and reduce the incentive to supply the market. This can lead to further supply problems down the road and the typical circular problem associated with when to reduce or terminate direct distribution programs. 2. Second, if you give people cash transfers it’s like increasing their incomes. With the additional income, they have additional purchasing power. They may not spend all the extra income on food, but if they are food insecure to begin with they will likely spend a good deal of that extra income on food. But if supply is pretty rigid (inelastic), all the extra spending power will simply push the prices of food up and that has the affect of reducing food access. Choosing between cash vs food programming Having an idea of the elasticity of supply provides you with some insights. If supply is elastic, it means that it responds to price signals and sellers will bring more supplies into the market if the price begins to rise, so cash transfers are a good option because the additional demand and increased upward pressure on price will signal to sellers to increase the supply. If supply is inelastic, it means that sellers will not be very responsive and additional demand, causing an upward pressure on prices, will not result in sellers bringing more supplies onto the market. That means a cash transfer will just heat up the market. Here food would be more appropriate. There are some general rules of thumb as to when cash or food transfers are appropriate.
Table 1: Comparing Cash and in-Kind Food Transfers Food Transfers generally recommended when:
Cash Transfers generally recommended when:
• Food consumption/nutrition (including micronutrient) objectives are prioritized
• Markets do not function well • Markets are distant, or during the
lean season • Inflationary risks are a significant
concern • Security risks permit (i.e. highly
visible operations and transfers)
• Overall humanitarian need, as well as choice and flexibility are prioritized
• Markets function well • Markets are nearby, or during the peak, post-
harvest season • Production disincentives due to food aid delivery
are a significant concern • Security risk permit (i.e. less visibility but greater
incentive for theft) • Cash transfer system exist

Course – Markets Assessment and Analysis Lesson 2 – Assessing Markets
Learners’ Notes 41
• Cash transfer systems do not exist • Cost saving is sought through
individual/ household targeting.
• Cost saving is sought through lower logistical and management overhead.
Adapted from: Gentillini 2005 and 2007; Harvey 2007; Levine and Chastre 2004; Barrett and Maxwell 2005. The Oxfam Decision Tree A simple decision tree helps navigate a path through a series of questions relevant to the choice of whether to use cash or food transfers. Each question requires some analysis like whether markets are integrated or competitive.

Course – Markets Assessment and Analysis Lesson 2 – Assessing Markets
Learners’ Notes 42
Negative impacts resulting from cash or food aid interventions have largely been a result of a failure to properly assess the market prior to project implementation. To avoid failure, it is critical to examine both demand and supply situation in the affected areas and markets.
Supply Cause of food or income insecurity Demand
Is food available in neighboring markets?
Food availability is a problem. Consider food aid.
Is the market operating?
Is government restricting food movement?
Is the market
Is the market integrated?
Will traders respond to the demand?
Is there a risk of inflation in the price of key commodities?
Cash intervention may result in price rises. Consider food-aid strategy. Lobby governments to change policy.
Consider whether continuing adjustment of sums disbursed is viable. If not, implement food-aid strategy.
Result of income loss?
Demand failure is the result of high prices. Consider food aid but also market support, such as improving infrastructures, helping value-chain actors to recover.
Prices controlled by traders. Consider food aid but also measures to reduce speculation, e.g. setting prices by means of contracts with traders.
Without market integration, supply will not meet demand. Improve market integration: e.g. supply transport.
If traders do not respond, food prices may increase. Consider food-aid strategy.
Implement cash transfer, targeting women if possible.
YES YES
YES
YES
YES
YES
NO
NO
NO
NO YES
NO
NO
NO YES

Course – Markets Assessment and Analysis Lesson 2 – Assessing Markets
Learners’ Notes 43
In trying to determine the likelihood that the market will respond to an increase in demand following the emergency, traders are a valuable source of information and can help you form expectations or predictions about potential market reactions. Given that emergencies are time sensitive, a rapid market analysis should follow some of the fundamental aspects outlined herein, coupled with queries of traders and other key market participants about market beh

Food Security Information for Action
Markets Assessment and Analysis
Lesson 3
Market Indicators
Learners’ Notes
© FAO, 2008
This course is funded by the European Union and implemented by the Food and Agriculture Organization
of the United Nations

Course – Markets Assessment and Analysis Lesson 3 – Market Indicators
Learners’ Notes 1
Table of contents
Learning objectives .......................................................................................................2
Introduction....................................................................................................................3
Indicators and market analysis......................................................................................4
Policy environment ........................................................................................................5
Profiling the market system...........................................................................................6
Selecting prices .............................................................................................................7
Measuring prices ...........................................................................................................9
Collecting price information.........................................................................................10
Analysing prices ..........................................................................................................11
Use of market indicators..............................................................................................15
Market Centre Food Security Indicators .....................................................................16
Summary .....................................................................................................................17
If you want to know more ............................................................................................18
Annex 1: Typical Market Indicators .............................................................................20
Annex 2: Market Related Policy Questions.................................................................23
Annex 3: Policy impacts on markets and population ..................................................24
Annex 4: Market Integration ........................................................................................25
Annex 5: Parity Pricing ................................................................................................26
Annex 6: Inflation Scenarios .......................................................................................29
Annex 7: Presenting Price Data ..................................................................................30
Annex 8: Market Indicators for Early Warning ............................................................31
Annex 9: Market Indicators for Emergency Impact Assessment ................................32
Annex 10: Market Indicators for Recovery and Transition..........................................34

Course – Markets Assessment and Analysis Lesson 3 – Market Indicators
Learners’ Notes 2
Learning objectives
At the end of this lesson you will be able to:
• understand what typical market indicators are; • understand the role of prices as market indicators; and • select appropriate market indicators in different food security contexts.
Course – Markets Assessment and Analysis Lesson 3 – Market Indicators
Learners’ Notes 3
Introduction
In this lesson you will see what the indicators which allow you to create a market profile or baseline are. You will then find out which sets of indicators are normally used to assess markets in different food security contexts: early warning, emergency, recovery and transition.

Course – Markets Assessment and Analysis Lesson 3 – Market Indicators
Learners’ Notes 4
Indicators and market analysis
The basic characteristics of a market system have a significant affect on how the market operates day by day and on market outcomes. Market indicators can be divided into two broad categories: Indicators that describe the market system and provide context (e.g. locations within the catchment area, types and numbers of market participants). Indicators that track day to day market dynamics (e.g. prices and volumes of commodities in a market on a given day). Some indicators can be directly observed (e.g. the price of rice), but others must be calculated from observed information (e.g., terms of trade, inflation). There is a wide range of possible market indicators. Indicators for a specific situation are selected based on market context, resources and time constraints and analytical capacity. The selection of market indicators should collectively: describe market system dynamics; capture trends and anomalies; evaluate incentives to trade (within national borders, cross border, etc); anticipate response and market outcomes; link market phenomena to households and household food security; measure impact; and triangulate information and verify findings. The type and number of indicators to be selected depend on the context. However, there are a set of typical market indicators.
See Annex 1: Typical Market Indicators

Course – Markets Assessment and Analysis Lesson 3 – Market Indicators
Learners’ Notes 5
Policy environment
Indicators of macroeconomic and policy environment (e.g. inflation, unemployment and exchange rates) help you understand the economic activities of market participants and the supply response. A very useful exercise for food security analysts is to make an inventory of policies that relate to food crops, cash crops, livestock, basic consumer goods and labour markets. They should then trace the effects that these policies have on markets and how these markets affect food security, especially the food security of vulnerable groups. Some additional macroeconomic policies can be included as well.
See Annex 2: Market Related Policy Questions
See Annex 3: Matrix: policy impacts on markets and population This matrix can then be used as a reference to orient assessments and analyze policy changes. It can also be used for developing scenarios by those monitoring food security on an on-going basis throughout the year.
Course – Markets Assessment and Analysis Lesson 3 – Market Indicators
Learners’ Notes 6
Profiling the market system
Information on the structure, conduct and performance of the market helps you understand how the different components of the market system are related. Structure indicators: They describe relatively stable features of the market that influence the rivalry among the buyers and sellers. E.g. number and type of sellers in the market, concentration of total sales among sellers. Structure indicators allow the building of a profile of key markets and the market system. They can be collected all at once during a market profiling exercise or in stages. Conduct indicators: They describe patterns of behaviour that traders and other market participants adopt to affect or adjust to the markets in which they sell or buy. Some indicators are direct measures such as commodity stock management (stocks over time) and the measurement has a direct relation to food security. Other indicators are more indirect. For example, understanding of trader decision variables (e.g. margin calculations) provides the analyst with very useful indicators of conduct.
Trader decision variables Traders often monitor a series of commodities and markets to determine the most lucrative options of commodities to trade and markets to source and provision in a given season. They form expectations of potential returns and subsequently execute their market strategy. Decision variables may change from one context to another. Measures of security risks become important where there is civil insecurity. Relative prices and cross commodity sector comparisons become important where production and consumption patterns are diverse: rice is dominant in a number of Asian countries, whereas a series of cereals, roots and tubers characterize West African food production, consumption preferences and markets.
Performance indicators: They describe how well the market fulfills certain social and private objectives, e.g. supply and price stability over the season. Market efficiency and profitability are indicators of market performance. For food security, equally important are indicators of stability of food availability and affordability over the agricultural season and through time, distribution of income and other measures of social welfare.

Course – Markets Assessment and Analysis Lesson 3 – Market Indicators
Learners’ Notes 7
Selecting prices
Prices are a standard and important element of market analysis. Consequently, prices are probably the indicator most often used, analyzed and reported. Regular monthly or weekly collection of price data for a set of key commodities is a standard component of most food security monitoring systems. Looking at prices helps to estimate how food insecure households and food suppliers will react to market changes. Prices are signals of both food availability and food access. In fact: Producer or farm gate prices tell us how much producers will receive for their products. Consumer or retail prices tell us how much consumers have to pay for their food. The difference between prices at different market locations can tell us if there is an incentive for sellers to sell, and for commodities to move from one location to another. The difference in a commodity price over the season or calendar can tell us whether it is economical to buy, store and sell a commodity later in the season. Changes in prices can help us determine whether a commodity is becoming scarcer or more abundant. As the amount of a commodity available in the market decreases relative to the demand for that commodity, the price normally rises. In this case, the commodity is said to be becoming scarcer. Conversely, as the volume available increases relative to the demand, the price tends to fall. In this case, the commodity is becoming more abundant. Similarly, if demand increases relative to supply, those who can and are willing to pay more bid the price up in order to secure the amount they would like to buy: the price is pushed up as the commodity becomes relatively scarcer. When demand declines relative to supply, sellers lower their expectations of the price they can capture and the price falls. Key commodity prices at different levels of the market (e.g. farmgate, wholesale and retail) and prices of key substitute commodities are nearly always important to include in your market analysis. The selection of prices to include will also depend on the particular market participant’s perspective that we are most concerned with. For example:

Course – Markets Assessment and Analysis Lesson 3 – Market Indicators
Learners’ Notes 8
Table 1: Prices Relevant to Different Market Participants Group Prices Producers Prices relevant for producers
• Farm gate (producer) prices of basic staples to value production and income.
• Retail and wholesale prices of basic staples as indicators of expected producer prices in the future.
• Farm gate (producer), wholesale or international prices for cash crops.
• Retail prices of inputs. Pastoralists For pastoralists/livestock farmers
• Producer, wholesale and retail prices of different livestock. Consumers For consumers (including producers, pastoralist, non-farm, urban
populations) • Retail (consumer) prices of food. • Retail (consumer) prices of basic goods and services.
Traders For traders • Farm gate (producer), wholesale and retail prices along with
margins as incentives. • Prices of fuel and handling, storage and transportation fees. • Typical government taxes and other fees incurred. • Prices of competing imported commodities (e.g. sugar, rice,
etc.). • Prices in foreign markets if exporting.
Labourers For labourers • Wage rates. • Prices of food and basic goods relative to wage rates. • Wholesale and international prices of commodities that are
produced with hired labour as an indication of employment opportunities and expected wage rates.

Course – Markets Assessment and Analysis Lesson 3 – Market Indicators
Learners’ Notes 9
Measuring prices
Prices are measured as a ratio of an amount of a particular currency to a unit of a selected commodity, for example: CFA Franc 120.00/kg of sorghum $US dollars 80/50 kg bag of rice Afghanis 130/day 8000 Kenyan Shillings/head of cattle Typically a local currency is used when the users of the information are local and will be working and thinking in terms of the local currency. Another currency is sometimes used when making comparisons between countries or within a region (e.g. the Nigerian Naira is sometimes converted to CFA in order to more easily compare prices in northern Nigeria with those in the rest of the Sahel). If the users of the information work on different countries, the US dollar, Euro or some other convertible, often quoted currency will be used.

Course – Markets Assessment and Analysis Lesson 3 – Market Indicators
Learners’ Notes 10
Collecting price information
An array of institutions collect price information on a range of commodities. The availability and dissemination of price information varies by country, as does the access to time series data. Usually one market information system (MIS) operates within a country. The MIS tends to track prices of a few key agricultural commodities and livestock in local markets throughout the country. An MIS can be limited to markets in provincial centers, but often some districts markets are also regularly monitored. In addition, there are a few regional systems. Some good examples of regional systems include: FoodNet in Uganda and Rwanda (www.foodnet.cgiar.org) and RATIN in East Africa (www.ratin.net). Case Study: FoodNet in Uganda The International Institute for Tropical Agriculture’s (IITA’s) FoodNet uses market enumerators to collect price data on 19 different agricultural commodities from market centres across the country on a weekly basis and from the main wholesale markets on a daily basis. Price information is disseminated to both farmers and traders through weekly radio broadcasts in several local languages. Price information is also available in national newspapers, e-mail and internet website (http://www.foodnet.cgiar.org/market/market.htm) and SMS text messaging. Additionally, IITA sends weekly price spreadsheets to major trading companies, government departments, agricultural development agencies and famine early warning agencies. It is linked to regional and international market information network. Having collected the information since 1999, researchers can now access time series data for market analysis. The program is funded by ACDI/VOCA through USAID Title II funds.

Course – Markets Assessment and Analysis Lesson 3 – Market Indicators
Learners’ Notes 11
Analysing prices
Analysts are not interested in the price itself but more on relationships among prices of different commodities. In fact, viewing the price of a commodity in relation to incomes (or purchasing power) and prices of other goods allows us to measure the exchange value that determines access to food and incentives to market or trade. Example: How would you determine if rice is expensive? How would you determine if rice is expensive at a price of $2.00/kg? If incomes are just $6.00/day and the average household consumes 1 kg per day, the household’s rice consumption would be equivalent to 30 percent of household income and that would be considered expensive. If the price of rice is compared to the price for maize at $2.85/kg and price of millet is $1.75/kg, you could say rice is less expensive than maize, but more expensive than millet. Knowing how the price of rice relates to the prices of other cereals adds perspective. Therefore, it is important to assess prices of a commodity in relation to incomes or purchasing power and in relation to the prices of other goods, especially those that are substitutes and complements. Price ratio of two commodities: terms of trade “Terms of trade” indicates how many units of one commodity can be exchanged for a unit of another commodity. It is generally defined as the price ratio of the two commodities. E.g. if a goat is exchanged for millet, how much millet the goat herder receives is determined by their relative prices: the price of goat over the price of millet. Example: pastoralists during the dry season For example, “terms of trade” helps to measure the purchasing power of pastoralists. During the dry season, they typically shift their consumption from livestock products to cereals and exchange (sell) their animals in order to purchase cereal. At this time, as the number of animals offered is high and the demand for cereal expands, prices of livestock tend to fall and prices of cereals tend to rise. This shrinks pastoralists’ terms of trade. It is particularly useful to compare the prices of a good with those of substitute and complementary commodities. Substitute Commodity A substitute (commodity) is a commodity that can replace another in consumption or production, such as millet for sorghum. When the price of one commodity rises, consumers or agro-processors will decrease their consumption of it and increase consumption of the substitute commodity. Wild and gathered products can be substitutes for preferred staples of food insecure households, especially in times of stress or increasing food insecurity. The term “substitute” can also be applied to crops where farmers choose to plant more or less of substitute crops, e.g., sorghum or millet, depending on the prices they expect to receive once they harvest and sell their crop.

Course – Markets Assessment and Analysis Lesson 3 – Market Indicators
Learners’ Notes 12
Whether a substitute in consumption or production, the more easily one commodity (crop) can replace the other, the more important it is to consider the price and price behavior of both commodities in your market analysis. Complementary Commodity or Good A complementary commodity is a commodity that is purchased or used in combination with another, sometimes in fixed proportions, but more often with some degree of flexibility in the proportions. An example of complementary inputs would be fertilizer, herbicides and labour in non-organic cotton production. If the price of fertilizer and herbicides increases significantly, the demand for labour decreases. Price differences between different areas may cause movement of commodities from one area to another. If the difference in prices between locations is large enough to cover transport, handling and all other costs, as well as provide some margin of profit, there is an incentive to move commodities from surplus areas (low prices) to areas of scarcity (high prices). Typically, this leads to a reduction in the price difference. Costs of moving commodities You have to consider all the costs associated with moving goods from one place to another. There are transport costs and sometimes taxes and fees. Then there are sometimes risks in moving goods – trucks can be robbed or break down on poor roads, corrupt officials can extract bribes and prices change by the time commodities are shipped. To view how easily and regularly commodities flow from one market to another: See Annex 4: Market Integration
See Annex 5: Parity Pricing
Prices follow seasonal trends, which means that they go up and down regularly over the season. Seasonal trends must be taken into account to understand whether there is any anomaly in price behaviour. If there is an increase of price, you should try to understand whether: the increase in the price is typical for this time of year or not; the magnitude of the increase is particularly large; and the price itself is particularly high. Comparisons can be made to the average price for the same period or to another significant period (e.g. a year of a drought), which is called “reference period”. In the example below, the increase of price from December 2007 to January 2008 is compared to the average period (from 2002/3 through 2006/7) and a reference period (in year 2004/5).

Course – Markets Assessment and Analysis Lesson 3 – Market Indicators
Learners’ Notes 13
Inflation is another common phenomenon which can confound the interpretation of price behavior. Inflation is an overall rise in the prices of goods and services in an economy, due to the decrease of the value of money. When there is little or no inflation, the comparison of prices over time is relatively straight forward. But, if there is inflation, this needs to be considered in order to correctly interpret price behaviour.
See Annex 6: Inflation Scenarios
One way to account for inflation is to take current prices found in the market (nominal prices) and adjust them for inflation in order to derive real prices. Nominal prices are the actual prices that you observe in the market. Real prices are prices that have been adjusted for inflation. They hold the value of currency constant, and allow you to compare the exchange value of a good or service in different time periods. They are calculated, not observed in the market. Example: Nominal and Real prices for maize in Luzaka Nominal and real retail prices for maize in Lusaka from June 1993 through June 1998 are graphed to illustrate this point. When inflation was low during 1993 and 1994, nominal and real prices were nearly the same. In 1996 inflation picked up, and the two prices began to diverge. By February 1998, nominal prices were more than four times that of real prices. Using the nominal price, one would conclude that price of maize in Lusaka had exploded, but once the prices are adjusted for inflation, the real prices suggest that the maize price is actually following its typical season pattern and within a range that should be expected. There is no immediate reason to think that commodities are scarce or the market is somehow not functioning well. This is a critical point because for food security analysts it is important to understand the food security implications of a certain price level or of price changes.

Course – Markets Assessment and Analysis Lesson 3 – Market Indicators
Learners’ Notes 14
Source: Chopak, C, FEWS, 1989 A food security analyst generally needs to report nominal prices because they are the prices people face in the market, but analyze both nominal and real prices. This will help to determine whether higher prices imply that commodities are scarce, production is flattening, traders are manipulating markets, etc. Prices themselves have limited meaning. They need to be seen in context. When monitoring, analysing and reporting prices, the following additional information should be provided: WHEN (what day, week, month, year) the prices were observed. WHERE (in which market) the prices were observed. WHAT TYPE of market, at what level of the market were these prices observed (e.g., wholesale, retail). WHY the price is relevant to the analysis and to food security (e.g. prices of a basic food commodity for the whole population, a segment of the population) HOW do these commodity prices relate to other prices: prices at other levels of the market, prices of substitute and complementary commodities, input prices, etc. IF the prices are the actual observed prices or have been adjusted for inflation. Challenges in analysing prices Prices can be affected by many factors including formal or informal taxes levied at some point along the market chain, changes in input prices and marketing costs that get passed on to buyers, inflation, variations in the exchange rate, etc. Commodities are often bought and sold in different time periods. A commodity may be bought in June, but transported and stored for several months and sold in September. The June farm gate price and transportation costs in June, storage fees in June through August, and retail price in September will be relevant. Often, we just do not have data on all of the prices and factors underlying the determination of prices. In these cases, we can use our best guess. We can also use our best guess of the highest and lowest value for prices and costs and calculate a band within which we feel relatively certain the actual situation lies.
See Annex 7: Presenting Price Data
REAL AND NOMINAL MAIZE PRICE COMPARISON FOR LUSAKA
0
5000
10000
15000
20000
25000
30000
35000
40000
45000
June
'93
August
Octobe
rDec
ember
Febru
ary AprilJu
neAug
ust
Octobe
rDec
embe
rFeb
ruary Apr
ilJu
neAugu
stOcto
ber
Decem
berFeb
ruary April
June
Augus
tOcto
ber
Decem
ber
Febru
ary April
June
Augus
tOcto
ber
Decem
berFeb
ruary Apr
ilJu
ne
MONTH
KW
AC
HA
/90K
g
RealNominal

Course – Markets Assessment and Analysis Lesson 3 – Market Indicators
Learners’ Notes 15
Use of market indicators
Let’s now have a look at how markets indicators are used for different purposes in different food security contexts. 1. Market Indicators for Early Warning For early warning purposes, you want your market indicators to collectively be able to: describe trends; identify anomalies; account for and anticipate both supply and demand response; disaggregate and pinpoint impacts over populations and space; provide a perspective on future events; and help clarify policy and program options.
See Annex 8: Market Indicators for Early Warning
2. Market Indicators for Emergency Impact Assessment For emergency impact assessments, market indicators should:
• verify current conditions on the ground; • provide a clear measure of impact on markets and market related infrastructure; • provide indications of whether the situation is improving or continuing to decline; • disaggregate and pinpoint impacts over populations and space; and • help clarify and prioritize policy and program options.
See Annex 9: Market Indicators for Emergency Impact Assessment
3. Market Indicators for Recovery and Transition For recovery and transition monitoring and analysis, market indicators should:
• measure both diversity and magnitude or volume of activities; • account of changes in quality (improved roads, restored storage, reduced spoilage
of commodities, etc); • measure change and make comparisons over time; • disaggregate and pinpoint impacts and indicators of progress over populations and
space; • incorporate perceptions of market participants on constraints, character and speed
of transition and expectations for the near future; and • help clarify when policies and programs need to be updated and modified to reflect
recovery and transition, including exit strategies.
See Annex 10: Market Indicators for Recovery and Transition

Course – Markets Assessment and Analysis Lesson 3 – Market Indicators
Learners’ Notes 16
Market Centre Food Security Indicators
Market centres can serve as barometers of the current economic and food security conditions of the surrounding population. During periods of stress, households resort to the markets to employ a range of typical coping strategies (e.g. distress sales of livestock). The number of small-scale enterprises and petty traders can swell, the units of measure can shrink and the volume and quality of consumer goods being offered can change. Large-scale traders may reduce premiums paid to suppliers or the employment of ad hoc services (e.g. casual labour to help cart and bag goods). These signs can be translated into indicators and incorporated into regular monitoring plans or assessment tools. Some typical behaviours that could serve as relevant market centre food security indicators include, but are certainly not limited to:
• sales of indicator commodities – e.g. breeding stock; • early sales – e.g. farmers selling green maize, livestock coming on the market
earlier in the season; • rise in the number of people selling certain goods – e.g. charcoal, fuel wood and
gathered commodities; • smaller or altered units of measure – e.g. new, smaller cups for retail purchases; • more farmers acting as petty traders; • new ethnic groups appearing in the market, sometimes migrating from significant
distances; • increased number of children working in the market; and • larger number of idle casual day labourers.

Course – Markets Assessment and Analysis Lesson 3 – Market Indicators
Learners’ Notes 17
Summary
A range of typical market indicators are used to create a market profile or baseline. Prices are probably the indicator most often used, analyzed and reported. The selection of prices depends on the particular market participants’ perspective that we are most concerned with. Prices need to be analysed in relation to seasonal trends in order to determine whether there is any anomaly in price behaviour. Inflation is a common phenomenon which must be taken into account when analysing prices. Different market indicators are used for different purposes in different food security contexts: early warning, emergency, impact assessment and recovery/transition. Market centres can serve as barometers of the current economic and food security conditions of the surrounding population.

Course – Markets Assessment and Analysis Lesson 3 – Market Indicators
Learners’ Notes 18
If you want to know more
Online resources FEWS NET “Southern Africa Monthly Update” http://www.foodnet.cgiar.org/market/market.htm Additional reading Ame, 2006 Awuor, Thomas (2007). “Review of Trade and Markets Relevant to Food Security in the Greater Horn of Africa. FEWS NET Chopak, C (1989). FEWS NET (2008) “Import/Export Price Parity Analysis.” Market Guidance No 1. FEWS NET (2008) “Structure-Conduct-Performance and Food Security” Market Guidance No 2. Tegegne, et.al (1999) Ward, William “Calculating Import and Export Parity Prices,” Training material of the Economic Development Institute, CN-3 (Washington D.C.: World Bank, 1977)

Course – Markets Assessment and Analysis Lesson 3 – Market Indicators
Learners’ Notes 20
Annex 1: Typical Market Indicators
Indicator Updated regularly or Monitored
Updated infrequently/ Knowledge Base
Macro or National Level Indicators Macroeconomic Inflation (rate) X Consumer price index X Exchange rate X Minimum wage ($/hr or day) X Key policies Export/import bans X Import/export quotas X Import/export taxes on key commodities
(percent) X
Price controls (yes/no and $/unit) X Import/export policies of neighbouring
countries X
Availability/ Supply
Cereal imports (total metric tons and by cereal)
X
Cereal exports (total metric tons and by cereal)
X
Cereal production (total metric tons and by cereal)
X
Public cereal stocks (metric tons) X Commercial stocks (metric tons) X Consumption requirements (metric tons) X Import parity prices X Export parity prices X Supply elasticity X Demand elasticity X Meso/Local/Subregional Level Indicators Local markets Informal cross border flows (total metric
tons and by cereal) X
Farmgate prices for key commodities ($/unit)
X
Wholesale prices for key commodities ($/unit)
X
Retail prices for cereals ($/unit) X Transport costs (selected routes) -
different seasons X X
Road conditions – different seasons X Distance/time between markets,
catchment areas (km and hrs) X
Price of fuel ($/unit) X Informal fees (approximate amount) X Public and commercial stocks (metric
tons) X

Course – Markets Assessment and Analysis Lesson 3 – Market Indicators
Learners’ Notes 21
Indicator Updated regularly or Monitored
Updated infrequently/ Knowledge Base
Storage costs ($/bag or metric ton) X Casual labour wage rate ($/day or hr) X Livestock prices ($/herd by species and
type: bull, cow, etc) X
Basic input prices, e.g., fertilizer ($/unit or ha)
X
Supply elasticity X Demand elasticity X Market Structure – Conduct – Performance Indicators Structure Number and type of sellers and buyers in
market X X
% of volume traded by largest market participants
X
Cereal storage capacity (metric tons) X Veterinary services (yes/no, fees) X Access to credit/financing (yes/no,
interest rate) X
Market associations (yes/no) X Conduct Key catchment areas X Alternative catchment areas X Market participant price expectations
($/unit at x time) X
Market participant margin expectations (at x time)
X
Commercial stocking (metric tons) X Large buyer purchasing plans (kgs/
metric tons and when) X X
Government purchasing and selling plans (kgs/MT and when)
Performance Consumer prices for key commodities ($/unit)
X
Wholesale prices for key commodities ($/unit)
X
Farmgate prices for key commodities ($/unit)
X
Terms of trade ($ animal/$grain) X Margins and distribution shares (% share
to participants) X X
Seasonality of supply (annual variation) X Seasonal variation in prices of key
commodities (maximum difference, coefficient of variation)
X X
Seasonal variation in supplies of key commodities
X
Commodity quality measures X X Spatial distribution of key commodities X X Seasonal variation in terms of trade X

Course – Markets Assessment and Analysis Lesson 3 – Market Indicators
Learners’ Notes 22
Indicator Updated regularly or Monitored
Updated infrequently/ Knowledge Base
(maximum difference, coefficient of variation)
Market Center Food Security Proxies Indicators Signs of distress
Distress sellers – ethnic/wealth group, origin, gender
X
Number and type of distress sellers X Number and type of buyers X Indicator animals – number of breeders X Variety of commodities for sale X Quality of commodities sold X Size of transactions (kgs/MT/numbers) X

Course – Markets Assessment and Analysis Lesson 3 – Market Indicators
Learners’ Notes 23
Annex 2: Market Related Policy Questions
In your assessment, you should account for constraints and opportunities that arise as a result of policies, regulations or programmes within the country and across relevant borders. Market Related Policy Questions R*
Are there government controlled commodity purchase or sales prices? Are there import or export restrictions – taxes, bans, quotas?
Are there licensing requirements or fees for engaging in trade?
Are there import or export restrictions in neighbouring countries? Is there food distribution?
What is the rate of inflation? What is the exchange rate policy?
Other: R
Other: R Other: R *R = relevant to the commodity market.
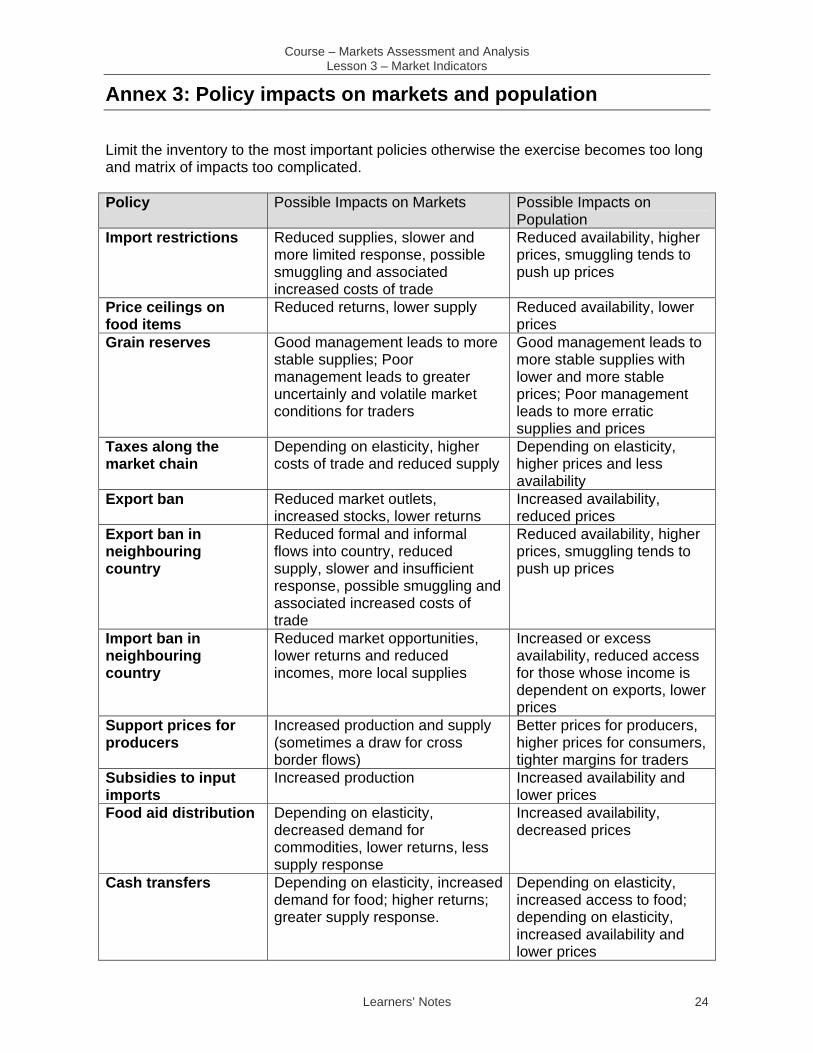
Course – Markets Assessment and Analysis Lesson 3 – Market Indicators
Learners’ Notes 24
Annex 3: Policy impacts on markets and population
Limit the inventory to the most important policies otherwise the exercise becomes too long and matrix of impacts too complicated. Policy Possible Impacts on Markets Possible Impacts on
Population Import restrictions Reduced supplies, slower and
more limited response, possible smuggling and associated increased costs of trade
Reduced availability, higher prices, smuggling tends to push up prices
Price ceilings on food items
Reduced returns, lower supply Reduced availability, lower prices
Grain reserves Good management leads to more stable supplies; Poor management leads to greater uncertainly and volatile market conditions for traders
Good management leads to more stable supplies with lower and more stable prices; Poor management leads to more erratic supplies and prices
Taxes along the market chain
Depending on elasticity, higher costs of trade and reduced supply
Depending on elasticity, higher prices and less availability
Export ban Reduced market outlets, increased stocks, lower returns
Increased availability, reduced prices
Export ban in neighbouring country
Reduced formal and informal flows into country, reduced supply, slower and insufficient response, possible smuggling and associated increased costs of trade
Reduced availability, higher prices, smuggling tends to push up prices
Import ban in neighbouring country
Reduced market opportunities, lower returns and reduced incomes, more local supplies
Increased or excess availability, reduced access for those whose income is dependent on exports, lower prices
Support prices for producers
Increased production and supply (sometimes a draw for cross border flows)
Better prices for producers, higher prices for consumers, tighter margins for traders
Subsidies to input imports
Increased production Increased availability and lower prices
Food aid distribution Depending on elasticity, decreased demand for commodities, lower returns, less supply response
Increased availability, decreased prices
Cash transfers Depending on elasticity, increased demand for food; higher returns; greater supply response.
Depending on elasticity, increased access to food; depending on elasticity, increased availability and lower prices

Course – Markets Assessment and Analysis Lesson 3 – Market Indicators
Learners’ Notes 25
Annex 4: Market Integration
The concept of market integration describes how easily and regularly commodities flow from one market to another. Market integration is related to the ease with which prices are transmitted from one market to another. Integration can be roughly assessed by observing how prices in different markets move together. A comparison of transaction costs with the difference in prices between markets will indicate whether there are incentives to trade between markets. Fewer incentives translate into less integration. The degree of market integration is often determined using basic statistical analysis or correlations. Looking at the market network maps we have created for a specific commodity, we would likely select markets that are connected by commodity flows. To measure market integration, we would typically use time series data for prices of that commodity for one or more markets that we believe are related, connected or integrated. We would run correlations on the different price series and we would check to see if the variation in one market was related to the variation in the other, i.e. if the prices are correlated, then markets are likely to be integrated. Using this method, what we are measuring is how prices move together over time. So, if we found that markets are integrated, we would expect price changes in one market to be transmitted to the other. However, it is important to stress that we can not conclude that a price change in one particular market causes a price change in another market. Within an area such as one province or region of a country, some markets may be well integrated while others may be poorly integrated. Good market infrastructure such as roads and storage and good telecommunications helps to integrate markets. Expanding cell phone networks have made communication of market information about supplies, prices and other important market attributes more accessible. This helps to better integrate markets. Government regulations on the movement of goods can hinder integration, especially informal regulation and corruption. For some traders in some areas, the informal fees and bottlenecks are one of the most significant determinants of whether they will move goods through an area. Civil unrest and banditry also has a major influence on the movement of goods. For pastoralists and livestock transporters in the Greater Horn of Africa banditry is a common problem. Application of Market Integration A study by Tegegne, et.al (1999) showed weak market correlation between cattle prices in Filtu and Dollo Addo. Similarly, prices between Dubluk and Negelle in Ethiopia and Moyale in Kenya are not related. In spatially integrated markets, price movements are transmitted across markets for specific commodities. The implication of the absence of spatial integration is that any intervention in one market or area will not necessarily induce significant changes in other markets. For instance, improvements in livestock price in the neighbouring countries of Kenya and Somalia may not be transmitted to supply markets in the southern rangelands of Ethiopia. Shoats (sheep and goats) and camel prices are significantly integrated to markets across the border in Kenya especially Mandera (Ame, 2006). Awuor, Thomas (2007). “Review of Trade and Markets Relevant to Food Security in the Greater Horn of Africa. FEWS NET

Course – Markets Assessment and Analysis Lesson 3 – Market Indicators
Learners’ Notes 26
Annex 5: Parity Pricing
Parity pricing is used to compare prices across borders. Parity price analysis is a standard method of equating (or comparing) prices in one place with those in another, typically across international borders. There are two types of parity prices: import parity and export parity. Parity pricing refers to making prices of a commodity in one location equivalent to the same commodity in another location, usually in a different country. It accounts for the difference in prices of a given commodity across distances or across borders. Import parity price is the value of a commodity bought from another country in a location within the country (usually the port of entry). It can help to determine whether importing a particular commodity is cheaper or more expensive than producing and procuring it within the country at a given location within the country. Import parity prices are measured as the Cost, Insurance and Freight (CIF) price. Export parity price is the value of a commodity sold at a specific location in a foreign country but valued at a specific location in the country from which it originated. It measures whether a country’s exports are competitive with the same commodity produced in another country. Exports are valued as Free on Board (FOB) price. Which parity price applies to which situation depends on which side of the transaction you stand or whose incentives you want to consider. An importer is interested in the import parity price and this will serve as an indicator of whether it is worth it to buy the commodity, pay for shipping, handling and local transport costs. An exporter is interested in the export parity price and this will serve as an indicator of whether their commodity is competitive with the same type of commodity located in a market across the border. Once all costs associated with moving the commodity to that foreign market are deducted from the price at the foreign location, is there a price difference remaining? Example of the Use of Parity Pricing Consider cotton being exported from Ouagadougou, Burkina Faso to Liverpool, England. In the eyes of an importer in Liverpool, the import parity price of the same cotton is the local price of cotton in Ouagadougou plus all transport and insurance costs to ship the cotton to Liverpool plus unloading charges at the port. However, from Burkina Faso’s point of view, it is more useful to calculate the export parity price valued at Ouagadougou, because we want to compare it with other cotton prices in Liverpool and see if our export price is competitive, after adjusting for shipping costs. Also we want to compare it with local prices and determine whether there is an incentive to export cotton to Liverpool or not. For the cotton to be competitively priced, an importer, after paying shipping costs, must find it cheaper or equivalently priced when comparing it to alternative cotton imports prices in Liverpool. Also, if the export parity price in Ouagadougou is higher than the local price of cotton then it is worthwhile exporting to Liverpool, otherwise we might as well sell the cotton locally. FEWS NET (2007) “Calculating Parity Prices.” Market Guidance No 2.

Course – Markets Assessment and Analysis Lesson 3 – Market Indicators
Learners’ Notes 27
There are standard formulas for calculating parity prices. CIF and FOB prices are available for a number of major ports or trade hubs. Large-scale and commercial traders frequently use these prices in making purchase and sales decisions. The South Africa Futures Exchange (SAFEX) regularly reports parity prices relevant to South African trade. Elements of CIF (Cost Insurance Freight) and FOB (Free on Board) Item Element CIF Includes:
FOB cost at point of export Freight charges to point of import Insurance charges Unloading from ship to pier at port Excludes: Import duties and subsidies Port charges at port of entry for taxes, handling, storage, agents’ fees, and the like
FOB Includes: All costs to get goods on board – but still in harbor of exporting country: Local marketing and transport costs Local port charges including taxes, storage, loading, fumigation, agents’ fees and the like Export taxes and subsidies Project boundary price Farm-gate price
Source: William A. Ward, “Calculating Import and Export Parity Prices,” Training material of the Economic Development Institute, CN-3 (Washington D.C.: World Bank, 1977)
Parity prices for South Africa can be used to evaluate how likely it would be for South African grain to fill a food gap within the region, a country or a particular sub-national region of a country within the region. In some sub-national border regions, local maize from Malawi, Zambia and Tanzania may be more competitive than South African maize. In this case, such local maize flows would reduce somewhat the need for formal and informal cross border flows from South Africa to fill national food gaps. FOB USA and Argentine maize prices compared to white maize SAFEX nearby Jan 2000 – April 2007 International and SAFEX prices The combined effects of high international grain prices as well as limited availability in South Africa have acted to dramatically increase South African domestic prices of maize as indicated by price movements since January on SAFEX. Prices for the nearby contract increased steadily in May and June after having dropped to US$233/MT in April, from a peak of US$261/MT in March. The SAFEX prices are moving in tandem with international prices, which are driven by overall global demand. Rising international prices, and hence import parity, is likely to keep SAFEX prices at much higher levels for most of the marketing year, making South Africa’s maize less competitive when compared to neighboring Malawi, Zambia and Tanzania.

Course – Markets Assessment and Analysis Lesson 3 – Market Indicators
Learners’ Notes 28
FEWS NET Data source: SAFEX and SAGIS
Unfortunately, the data on all other costs are often missing so it may only be possible to make a partial adjustment with existing data. Additional data could be collected to complete the calculations or estimated costs could be used and noted. Finally, even where it is impossible to calculate reasonably accurate parity prices due to data limitations, an analysis of markets should consider the influence that these types of costs would have on prices and narrowing the price gap between markets and countries.
Import Parity Price for Imported Rice to Northern Togo Where price differences exist, once accounting for transaction costs, commodity flows can still be impeded by government restrictions, banditry and civil unrest, seasonally inaccessible road access as well as market participants’ real or perceived risks. Calculating parity prices, accounting for price differentials and utilizing information on trade flows, including cross border flows provides a more accurate picture of supply. The improved assessment of supply, gives a more accurate estimate of food gaps which can help streamline the humanitarian response – better tailor the
response (food, cash, policy action), target areas and populations requiring food and reduce the overall volume and costs of the programme.
USD/MT Vietnam Rice 15% Brokens (FOB) 150 Ocean Freight to Ho Chi Minh, Vietnam to Lome, TOGO 90 Sub-Total – Cost and Freight 240 Import Duty (5%) 12 Sales Tax (15%) 36 Processing Fees 2 Port Handling Fees 3.5 ECOWAS Charges (.5% of C&F) 1.2 ITSH (Bulk handling charges) 2 Sub-Total 296.7 Inland freight to Dapango 70 Storage & Handling in 10 CIF & SH Dapango $377.7 Cost of Locally Produced Rice $350

Course – Markets Assessment and Analysis Lesson 3 – Market Indicators
Learners’ Notes 29
Annex 6: Inflation Scenarios
Let’s look at what happens to the farmer and consumer in the following three scenarios. This provides a good illustration of why it’s important to account for inflation when doing food security analysis of market price behaviour. Scenario 1: Little or no Inflation Farmer Consumer If a farmer sells a kilogram of millet for 100 CFA in October in 2006 and 125 CFA/kg in October of 2007, and there is little of no inflation, s(he) will earn more from the sale of that kilogram of millet in 2007. The farmer will have more income and with that income s(he) will be able to buy more goods and services. So the farmer is better off.
If a consumer buys one kilogram of wheat flour for 15 Rps in December 2006 and one kilogram of wheat flour for 25 Rps in December 2007, and there is very little inflation, it is possible to say that s(he) is worse off in December 2007 compared to December 2006.
Scenario 2: 10% Inflation Farmer Consumer For the farmer, if annual inflation was 10 percent, the farmer is still better off because the price in December 2007 is more than 10 percent higher than in was in December 2006. However, the farmer will have seen some erosion in the purchasing power of his/her income.
For the consumer, if annual inflation was 10 percent, the consumer would still be worse off and wheat flour would have gotten relatively more expensive than other goods and services. S(he) might choose to purchase less wheat flour and maybe more rice, a substitute cereal for wheat, if the price of rice did not rise as much as wheat flour.
Scenario 3: 30% Inflation Farmer Consumer If inflation was 30 percent, the farmer would be worse off because the difference in price from 2006 to 2007 is less than the rate of inflation.
If inflation was 30 percent, wheat flour would be more attractive because it would now be relatively cheaper compared to other goods and services included in the typical consumer basket. The consumer may even purchase more wheat flour and less rice because flour may be relatively cheaper than rice.

Course – Markets Assessment and Analysis Lesson 3 – Market Indicators
Learners’ Notes 30
Annex 7: Presenting Price Data
Although there are a number of ways to present price data, there are standards for graphing price data and price trends. These standards ensure that the information is clear to the user. The following standards clarify what is being measured:
• Always note the units on both the X and Y axis of the graph
• Always note from which market the data was collected (e.g., Tegucigalpa, Mazar e Sharif)
• Always note the type of market/level of the market from which the data is collected (e.g. farmgate, wholesale, retail)
• Prices should be compared to an average, typically a five year average – this allows the user to readily identify anomalies
• A reference year can also be added to provide greater comparability
• Provide an explanation of all calculations – this can be included in a footnote to the graph.
The following standards are used for formatting graphs:
• Present at least one full year of data along the X-axis – this allows the user to readily observe trends. Typically one year is included on the X-axis. Multiple years are used to illustrate long-term trends
• Do not average over different markets and report one average price for a country or subregion – the interpretation of that price will be confusing and may mask important variations within the country or subregion.
• Line graphs are more legible and preferred over bar charts
• Do not crowd the graphs with too many price lines
• Always note the source of the data
• Report on the same commodities over time so that users of the information can keep track of price behaviour over time

Course – Markets Assessment and Analysis Lesson 3 – Market Indicators
Learners’ Notes 31
Annex 8: Market Indicators for Early Warning
Markets Monitoring and Early Warning Questions
Useful Indicators
• What does the supply situation look like within the market catchments – locally, regionally or globally?
• Is there enough food in markets?
• Volume of commodities in the market and other markets within the commodity networks
• Changes in volumes over time
• What is happening to food stocks? • Volume of commodities in public and private stocks
• Flows – direction and magnitude
• Are livestock prices abnormally low and declining, is this anomalous and will this trend continue?
• Are cereal prices abnormally high and rising, is this anomalous and will this trend continue?
• What are the implications for pastoralists?
• Current and average livestock prices • Current and average cereal prices • Current and average terms of trade
• How will demand respond to increasing food prices?
• Elasticities of demand • Prices of substitute commodities • Relative prices • Wage rates
• How will supply respond to the increasing food prices?
• Elasticities of supply • Relative prices in different markets • Stocks • Marketing costs and margins • Market integration • Parity prices
• What are prices likely to be next month, later in the season?
• Prices trends • Expectations of market participants
• Are wage rates and employment opportunities declining, is this abnormal and will this trend continue?
• What do we expect the employment situation to look like in a month, later in season, etc?
• Current and average wage rates • Unemployment rates • Current and expected performance of
markets as sources of employment
• Have there been any important events or changes locally or within the region that could affect the market like:
• Price or exchange rate policies • Fuel and transport costs • Civil unrest • New businesses that may compete for
food (e.g., poultry for grain as feed) • Institutional purchases that may
compete for food (e.g., strategic grain reserves, WFP)

Course – Markets Assessment and Analysis Lesson 3 – Market Indicators
Learners’ Notes 32
Annex 9: Market Indicators for Emergency Impact Assessment
Markets Monitoring and Emergencies Useful Indicators • What is the damage to market related
infrastructure? • Number and percentage of roads
and bridges open and in reasonable condition
• Number of vehicles inoperable • Current and previous transport
routes • Number of warehouses, storage
facilities damaged and operable/inoperable and capacity
• Number of agro-processing facilities (slaughter houses, mills) operable/inoperable and capacity
• Market-related services operable/inoperable
• What are the losses in terms of commodity and stock?
• Type and number of livestock lost • Type and quantity of commodities
lost • Type and quantity of stocks of
commodities lost • Type and quantity of seed lost • Type and quantity of inputs lost
• Which populations are most affected? • Number and impacts to households • Number and impacts to traders • Number and impacts to transporters • Number and impacts to other related
businesses
• What has happened to the supply of food security relevant commodities, including inputs?
• Have purchasing and selling behaviors and strategies changed and how?
• Number of markets open/functioning • Types and volumes of commodities
available • Current catchment for supplies of
different commodities • Change in the number and volume
of commodities available • Market participant expectation of
future trends

Course – Markets Assessment and Analysis Lesson 3 – Market Indicators
Learners’ Notes 33
Markets Monitoring and Emergencies Useful Indicators • How are markets functioning? • How have markets been changing? • Are commodities affordable? • Are poor consumers buying different
types of commodities? • What has happened to employment
opportunities • What are the major needs and constraints
facing different market participants (traders, transporters)?
• When will markets recover? • Are current humanitarian responses
affecting markets and market participants?
• Are coping strategies of the different market participants helping or hindering the response and recovery?
• Number of markets open/functioning • Types and numbers of sellers and
buyers • Change in the type and number of
sellers and buyers • Types and volumes of commodities
in the market • Change in the types and volumes of
commodities in the market • Quality of commodities • Commodity prices • Variation in prices • Spatial variation in prices • Costs (time and financial) of
transport • Commodity margins • Variation in margins • Wage rate • Employment rates • Expectations and impressions of
market participants • Expectations and impressions of
local government staff • Portion of households’ food derived
from the market and change over time
• Timeline for market recovery
• If civil insecurity has been an issue, is it improving or deteriorating and how?
• Number and frequency of incidents • Transport delays • Informal fees and movement
restrictions • Movement of people and
commodities
• What are the expectations for recovery? • What is the expected timeframe for
rehabilitation of certain elements – infrastructure, storage, stocks, herds
• Timeline for the shock or stress factors
• Timeline for rehabilitation of warehouses, storage facilities, market stalls, cold storage
• Timeline for reconstituting stocks of different commodities
• Timeline for next harvest(s)
• What is the current humanitarian response?
• Programme type and coverage (population and area)

Course – Markets Assessment and Analysis Lesson 3 – Market Indicators
Learners’ Notes 34
Annex 10: Market Indicators for Recovery and Transition
Markets Monitoring and Recovery Useful Indicators
• What is the state of transport, have there been improvements and is there likely to be improvement in the near future?
• What is happening to the costs of transportation?
• Number and percentage of roads and bridges open and in reasonable condition
• Numbers and change in the number of vehicles moving goods and passengers
• Cost and time of transport between locations • Formal and informal fees • New routes
• What has happened to the supply of food security relevant commodities, including inputs?
• Have purchasing and selling behaviors and strategies been changing and how?
• Are supplies becoming more regular over the year?
• Is there more diversity in foods to buy?
• Number of markets open/functioning • Types and volumes of commodities available • Change in the number and volume of
commodities available • Period of time over which commodities are
available • Stocks and storage capacities • Existence and capacity of agro-processing
facilities (slaughter houses, mills) • Market participant expectation of future trends
• Are markets becoming more dynamic and recovering?
• How have markets been changing? • Are commodities affordable? • Are poor consumers buying different
types of commodities? • What are the major constraints facing
different market participants (traders, transporters)?
• When will markets fully recover?
• Number of markets open/functioning • Types and numbers of sellers and buyers • Change in the type and number of sellers and
buyers • Types and volumes of commodities in the
market • Change in the types and volumes of
commodities in the market • Quality of commodities • Commodity prices • Variation in prices • Spatial variation in prices • Commodity margins • Variation in margins • Employment rates • Expectations and impressions of market
participants • Portion of households’ food derived from the
market and change over time
• If civil insecurity has been an issue, is it improving or deteriorating and how?
• Number and frequency of incidents • Transport delays • Informal fees and movement restrictions • Movement of people and commodities
• Should current assistance be modified or discontinued
• Availability of commodities in markets • Presence of food aid in markets • Commodity prices • Impressions of market participants • Impressions of local government agencies