Embed Size (px)
Citation preview

RESERVOIR DRAWDOWNS AND AIS MANAGEMENT
Lakes Convention – April 24, 2015
Jim Kreitlow-Lake Biologist, WDNR, RhinelanderTim Plude-AIS Coordinator, WDNR, Plymouth
Two Case Studies: Lac Sault Dore and Musser FlowagesPrice County
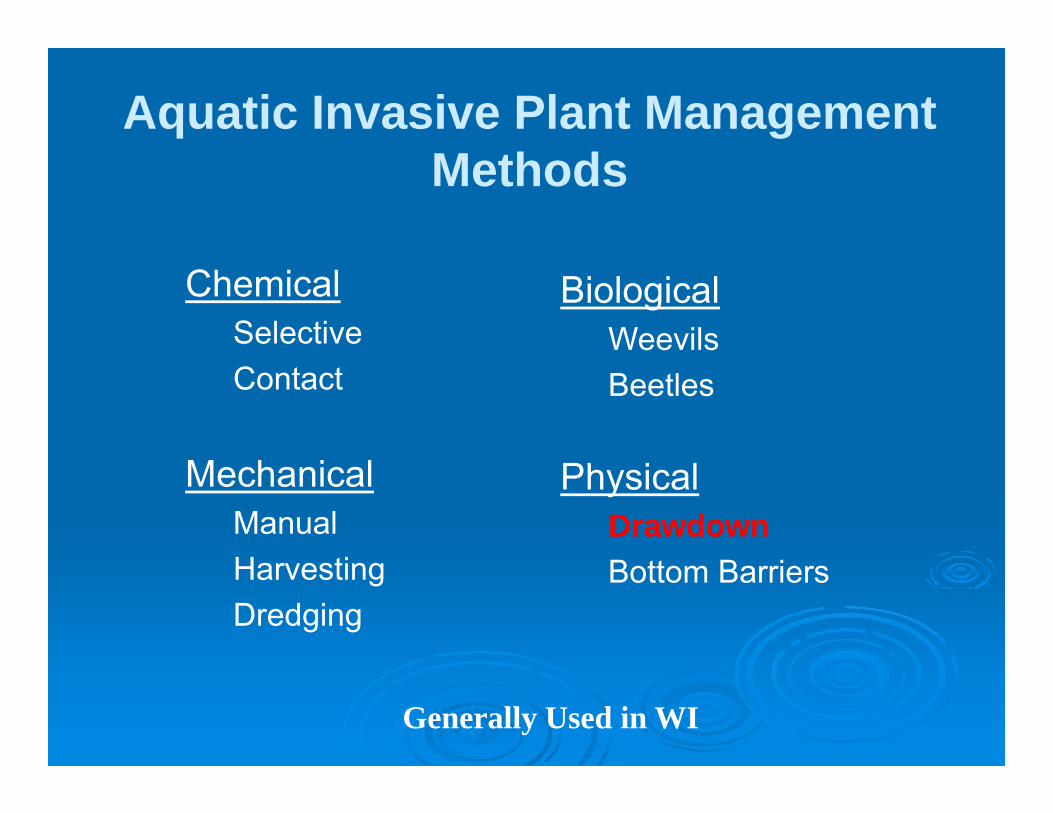
Aquatic Invasive Plant Management Methods
ChemicalSelective Contact
MechanicalManualHarvestingDredging
BiologicalWeevilsBeetles
PhysicalDrawdownBottom Barriers
Generally Used in WI
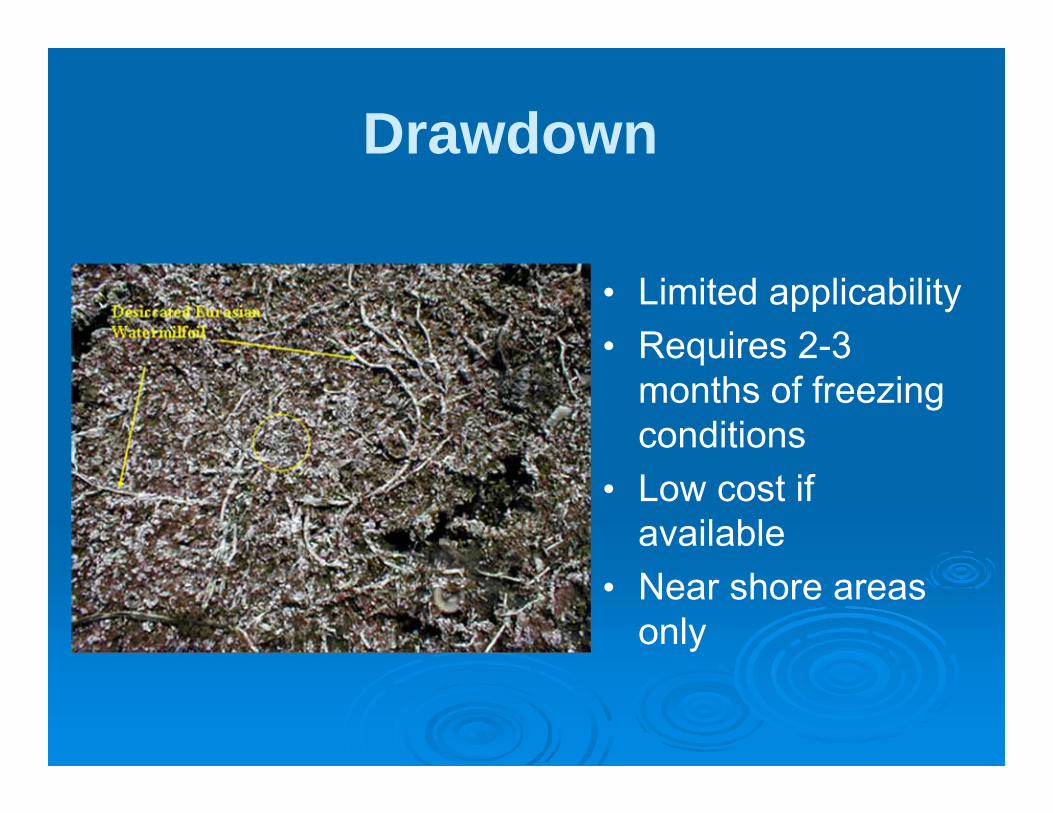
Drawdown
• Limited applicability• Requires 2-3
months of freezing conditions
• Low cost if available
• Near shore areas only

Expected Benefits
• Winter drawdowns have been shown to be effective in controlling Eurasian water milfoil (EWM)
• Need to study what it can do to other invasives like curly-leaf pondweed (CLP)
• Mixed results on controlling CLP (not many studies out there)

Background• Winter drawdowns proposed for dam repair
(both cases).
• Both flowages have AIS/opportunity to evaluate as a management tool.
Lac Sault Dore (Soo) in 2010, EWM
Musser in 2013, CLP

Drawdown pre-planning considerations
• Who has Legal Authority?• Who owns the dam?• Review existing Chapter 31 operating order• May have to request a temporary exemption to the
existing operating order if drawdown is more than what is allowed in current order (obtain permit)
• Is an Environmental Assessment (EA) required?• Meet with County Dam Tender• Meet with Lake Association Board Members• Initiate Consultation with Tribes • Any loss of Hydropower Generation?

Public Participation/Communication (once drawdown plans are set)
• Develop frequently asked questions document
• Meet with County Board• Attend Lake Association Annual
meeting• Complete Environmental
Assessment• Address Tribal Concerns• Receive one year exemption to
operate outside of existing Chapter 31 permit
• Public Information Meeting
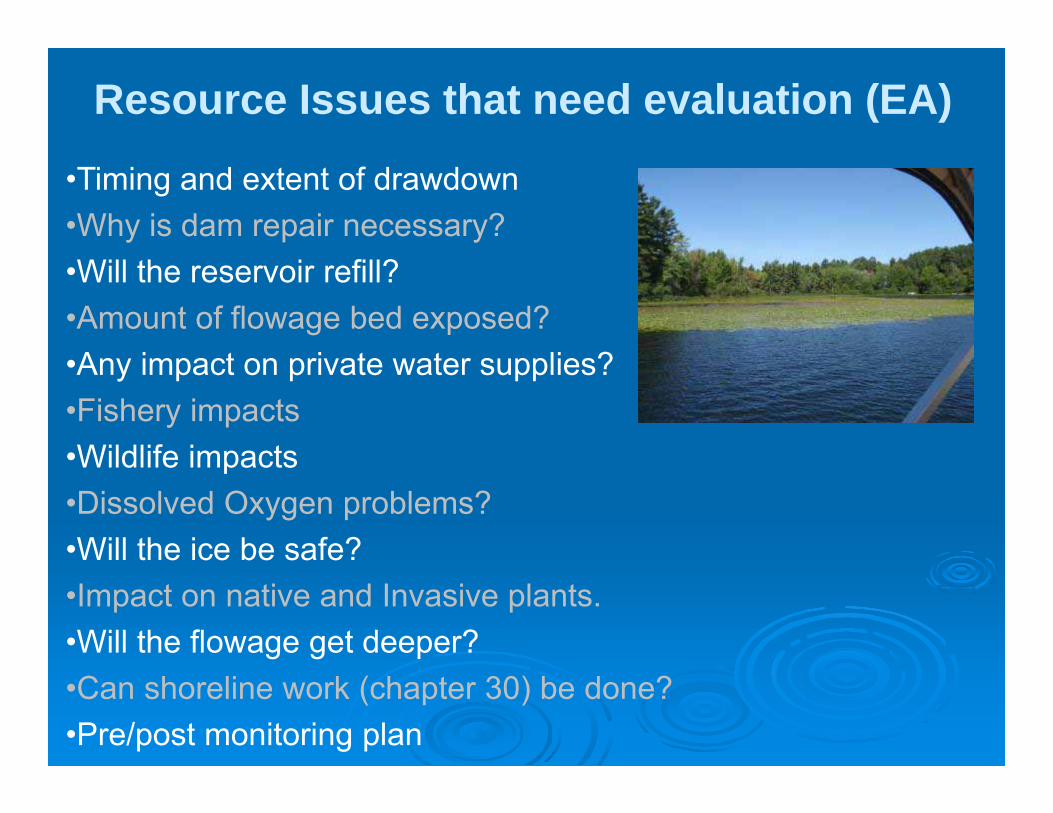
Resource Issues that need evaluation (EA)
•Timing and extent of drawdown•Why is dam repair necessary?•Will the reservoir refill?•Amount of flowage bed exposed?•Any impact on private water supplies?•Fishery impacts•Wildlife impacts•Dissolved Oxygen problems?•Will the ice be safe?•Impact on native and Invasive plants.•Will the flowage get deeper?•Can shoreline work (chapter 30) be done?•Pre/post monitoring plan

SOO LAKE (Lac Sault Dore)DRAWDOWN
WINTER 2010-2011Eurasian Water Milfoil

Introduction• Lac Sault Dore (Soo Lake) on Elk River - Price County,
WI• 561-acre shallow reservoir• Max depth: 21ft, Mean depth: 6ft• 165,981-acre watershed• Eutrophic system, highly stained water• EWM discovered in 2004• 254 acres of EWM in 2010 (pre-drawdown)• No previous management actions to control EWM

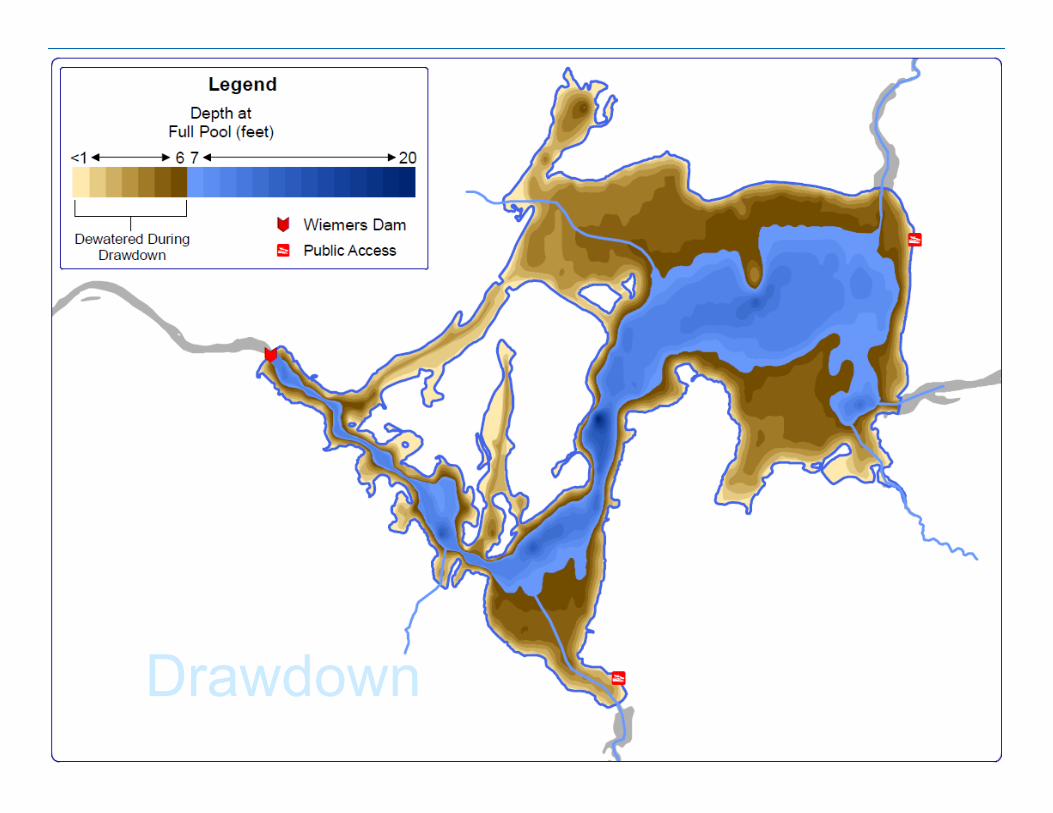
Introduction• Winter drawdown required for maintenance
on Weimer Dam• Limited to 6 feet, per specs of the dam• Start water drawdown after Labor Day 2010• Refill by May 1, 2011• Secondary benefit to possible control EWM
population
Drawdown

‐1
0
1
2
3
4
5
6
7
Feet Below
Full Poo
l
Lac Sault Dore Water Levels
September October November December January February March April
September 2010 ‐May 2011
Drawdown Water Levels
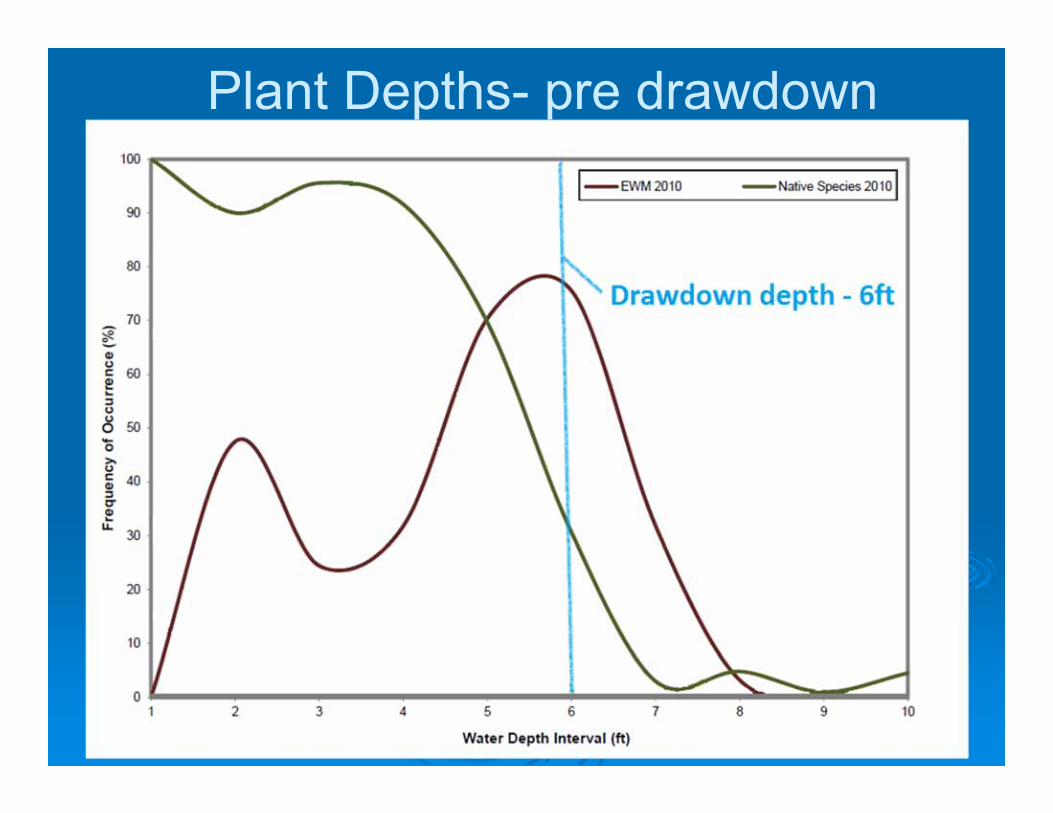
Plant Depths- pre drawdown

• Objective: Evaluate response of EWM and native plants to drawdown• Whole-lake point-intercept survey (2010, 2011,
2012)• EWM colony/density mapping• Emergent/floating-leaf community mapping
Monitoring Methods
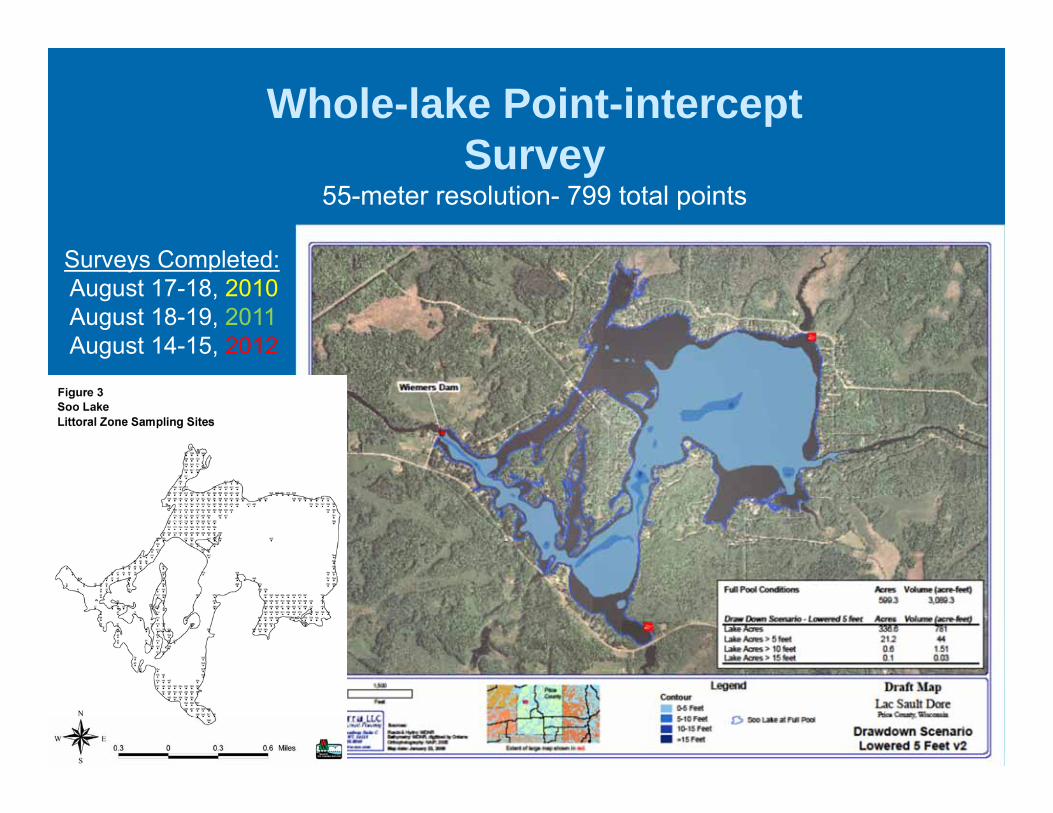
Whole-lake Point-intercept Survey
55-meter resolution- 799 total points
Surveys Completed:August 17-18, 2010August 18-19, 2011August 14-15, 2012
Results:EWM – Point-intercept
Survey

0
10
20
30
40
50
60
70
80
90
100
1 2 3 4 5 6 7 8 9 10
Freq
uenc
y of
Occ
urre
nce
(%)
Water Depth Interval (ft)
EWM 2010
Whole-lake PI Survey
93%
Frequency of Occurrence for EWM in 2010 (pre-drawdown)

0
5
10
15
20
25
30
35
40
Freq
uency of Occurrence (%
)
2010 2011 2012
*
* *
*
*
*
*
*
*
* * *
* **
**
*
*
*
Statistically valid change in occurrence from previous year (Chi-square α= 0.05)
Statistically valid change in occurrence from 2010 to 2012 (Chi-square α= 0.05)*
x x
x
x
x
x x x x x
x
PI Survey Results – changes in frequency of occurrence
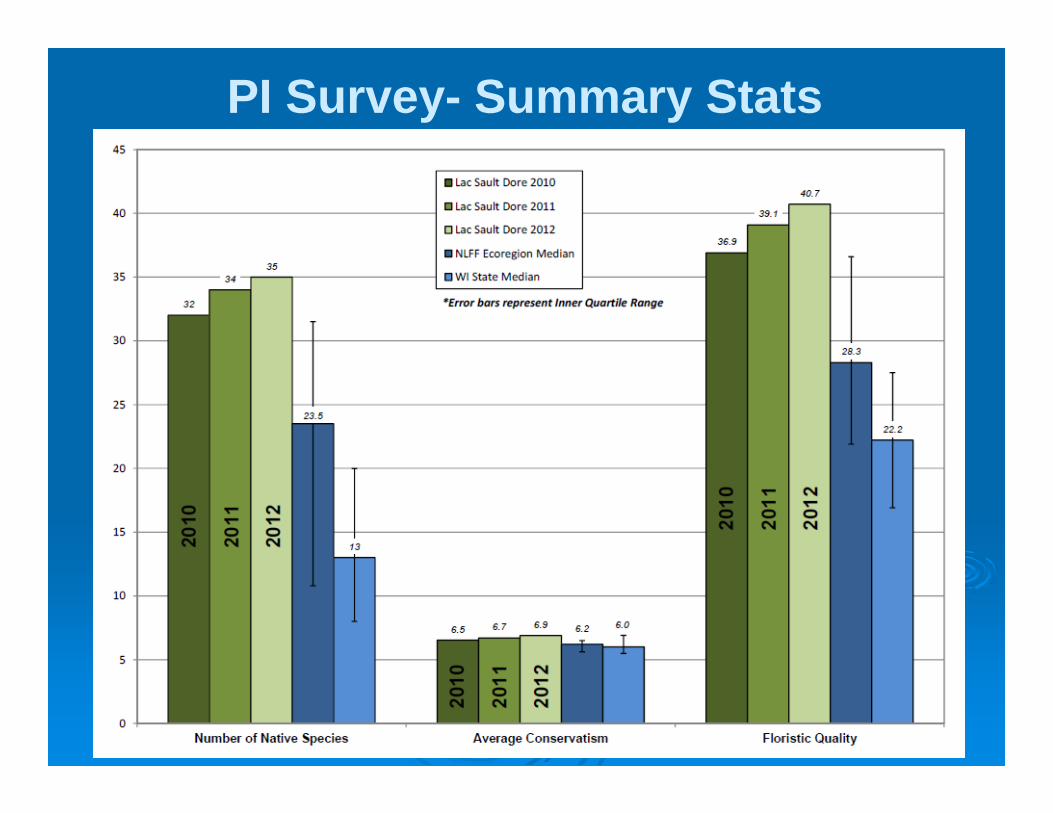
PI Survey- Summary Stats
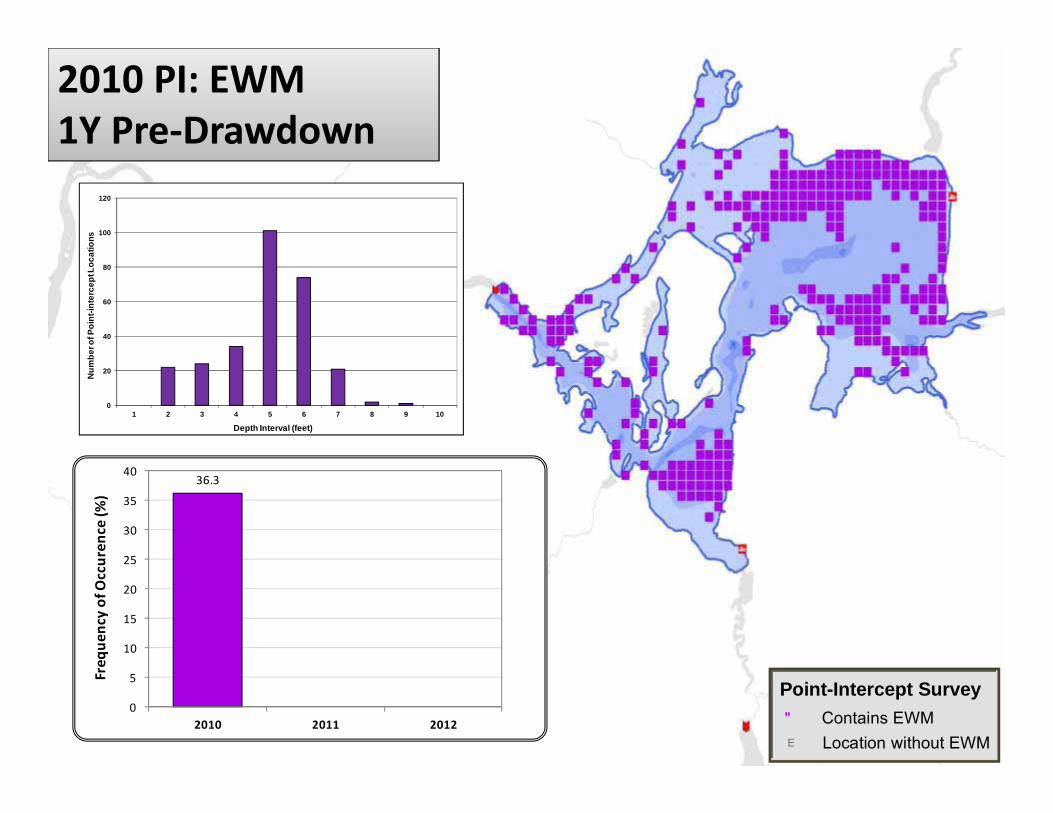
2010 PI: EWM1Y Pre‐Drawdown2010 PI: EWM1Y Pre‐Drawdown
36.3
0
5
10
15
20
25
30
35
40
2010 2011 2012
Freq
uency of Occuren
ce (%
)
Point-Intercept Survey" Contains EWME Location without EWM
0
20
40
60
80
100
120
1 2 3 4 5 6 7 8 9 10
Num
ber o
f Poi
nt-in
terc
ept L
ocat
ions
Depth Interval (feet)

2011 PI: EWM1Y Post Drawdown2011 PI: EWM1Y Post Drawdown
36.3
0.30
5
10
15
20
25
30
35
40
2010 2011 2012
Freq
uency of Occuren
ce (%
)
Point-Intercept Survey" Contains EWME Location without EWM

2012 PI: EWM2Y Post Drawdown2012 PI: EWM2Y Post Drawdown
36.3
0.3 0.50
5
10
15
20
25
30
35
40
2010 2011 2012
Freq
uency of Occuren
ce (%
)
Point-Intercept Survey" Contains EWME Location without EWM

Results:EWM – Colony/Density
Mapping Survey

Legend
Surface Matting
Small Plant Colony!(
Clump of Plants!(
Single or Few Plants!(
DominantScattered Highly Scattered
Highly Dominant
2010EWMLocations1YearPre‐drawdown
254 acres of Colonized EWM
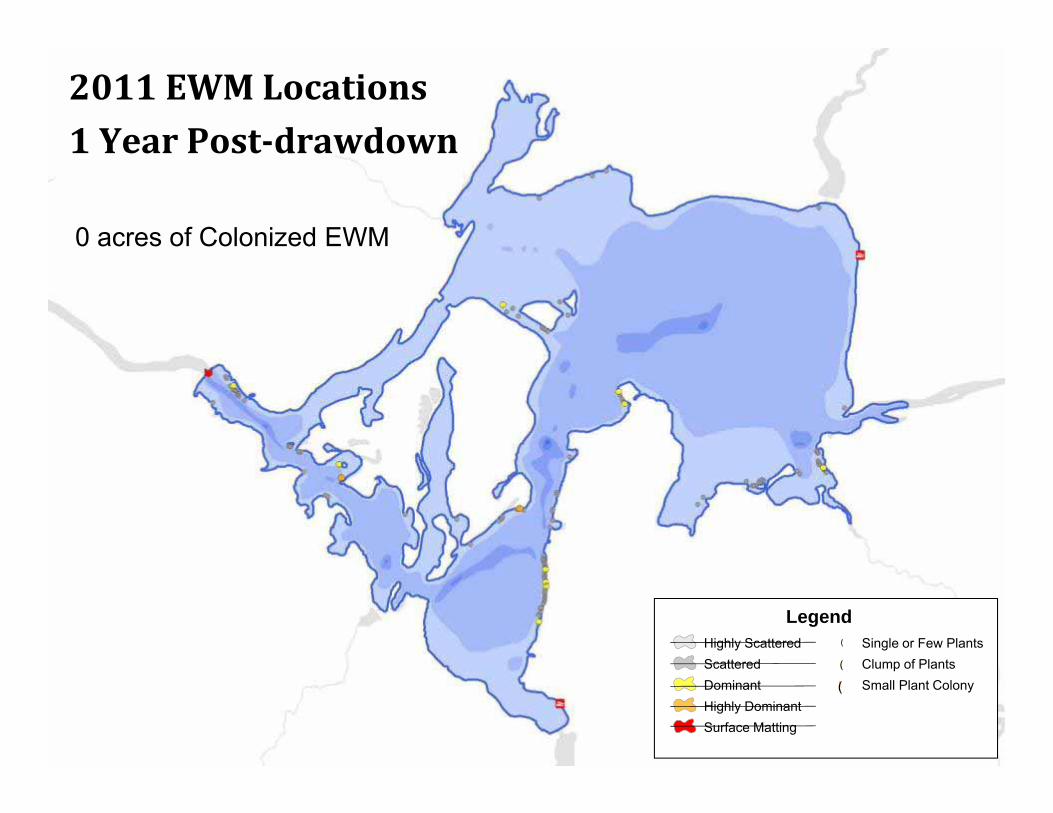
2011EWMLocations1YearPost‐drawdown
Legend
Surface Matting
Small Plant Colony!(
Clump of Plants!(
Single or Few Plants!(
DominantScattered Highly Scattered
Highly Dominant
0 acres of Colonized EWM

2012EWMLocations2YearsPost‐drawdown
Legend
Surface Matting
Small Plant Colony!(
Clump of Plants!(
Single or Few Plants!(
DominantScattered Highly Scattered
Highly Dominant

Results:Floating-leaf & Emergent
Community Mapping
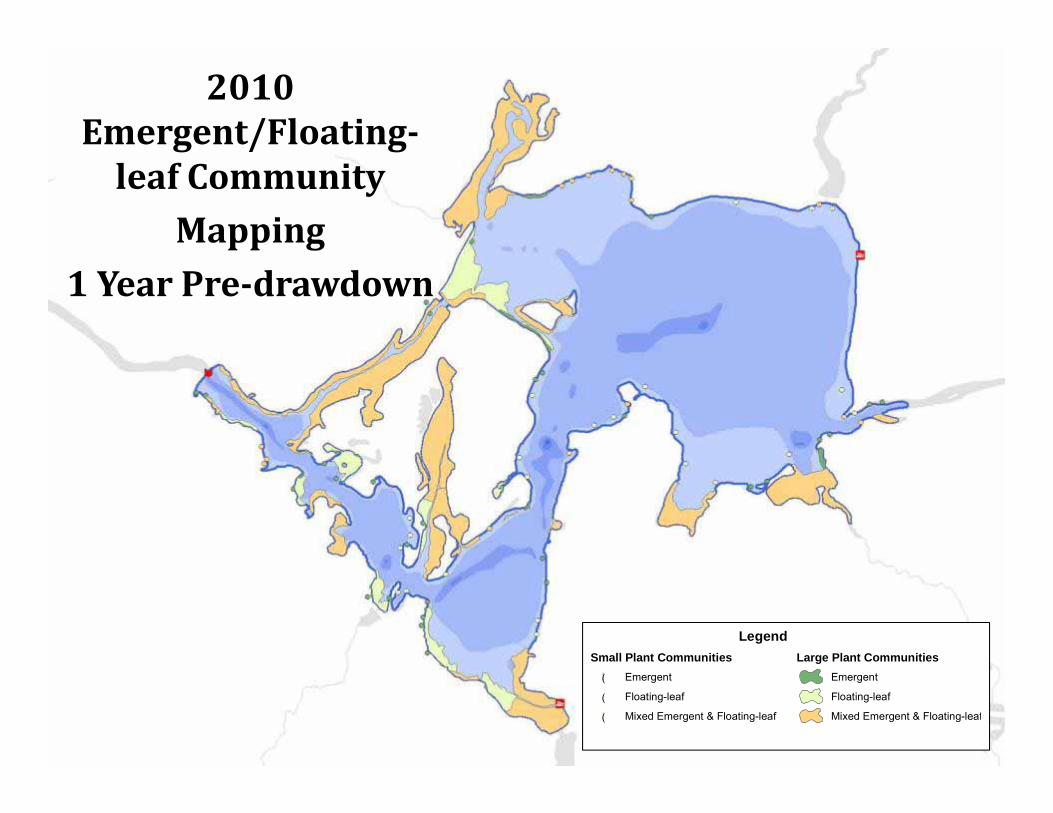
LegendSmall Plant Communities Large Plant Communities
Emergent!(
Floating-leaf!(
Mixed Emergent & Floating-leaf!(
2010 Small Plant Community( 2010 Large Plant Community
Emergent
Floating-leaf
Mixed Emergent & Floating-leaf
2010Emergent/Floating‐leafCommunity
Mapping1YearPre‐drawdown

Plant Community 2010 2011Emergent 1.4 0.0Floating‐leaf 19.3 21.5Mixed Emergent & Floating‐leaf 82.0 88.2Total 102.7 109.7
Acres LegendSmall Plant Communities Large Plant Communities
Emergent!(
Floating-leaf!(
Mixed Emergent & Floating-leaf!(
2010 Small Plant Community( 2010 Large Plant Community
Emergent
Floating-leaf
Mixed Emergent & Floating-leaf
2011CommunityMapping
1YearPost‐drawdown

• Overall success reducing EWM plants (~98% reduction in littoral FOC)
• Colonized acreage of EWM reduced to 0• Drawdown had impacts on native plant
community• Minor changes to Emergent/Floating-leaf
community• The Soo Lake chapter 31 order was amended to
include periodic drawdowns to target EWM (Trigger 30 % or greater littoral frequency, or greater than 175 point intercept locations that contain EWM)
Conclusions:

MUSSER LAKEDRAWDOWN
WINTER 2013-2014Curly Leaf Pondweed

• 563 acre impoundment on the Elk River
• Maximum depth is 15 feet
• Average depth is 5 feet
• The flowage is fertile and considered eutrophic.
•Dam repair needed
Introduction
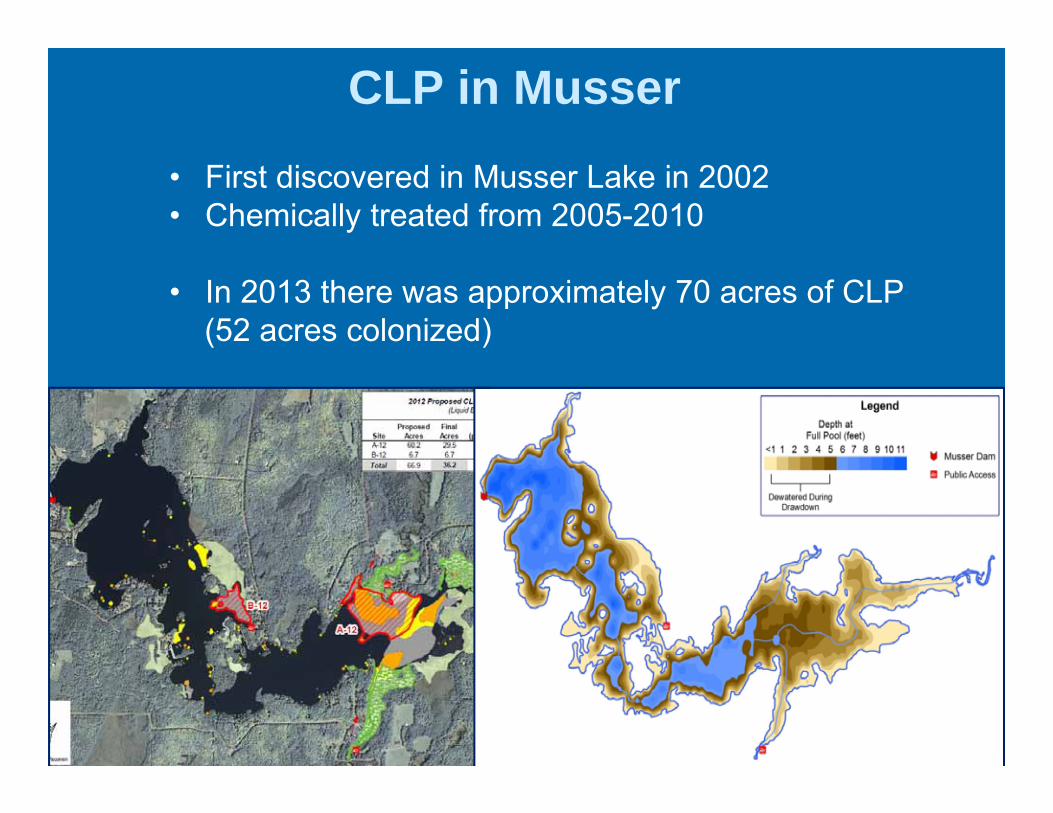
CLP in Musser
• First discovered in Musser Lake in 2002• Chemically treated from 2005-2010
• In 2013 there was approximately 70 acres of CLP(52 acres colonized)

Curly Leaf Pondweed Biology• Life cycle begins in autumn, with turion germination• Plant may grow through the winter under the ice• Maximum growth occurs in May and June• Turions produced late July before plant dies back• Turions fall into sediment and are viable 5-7 years

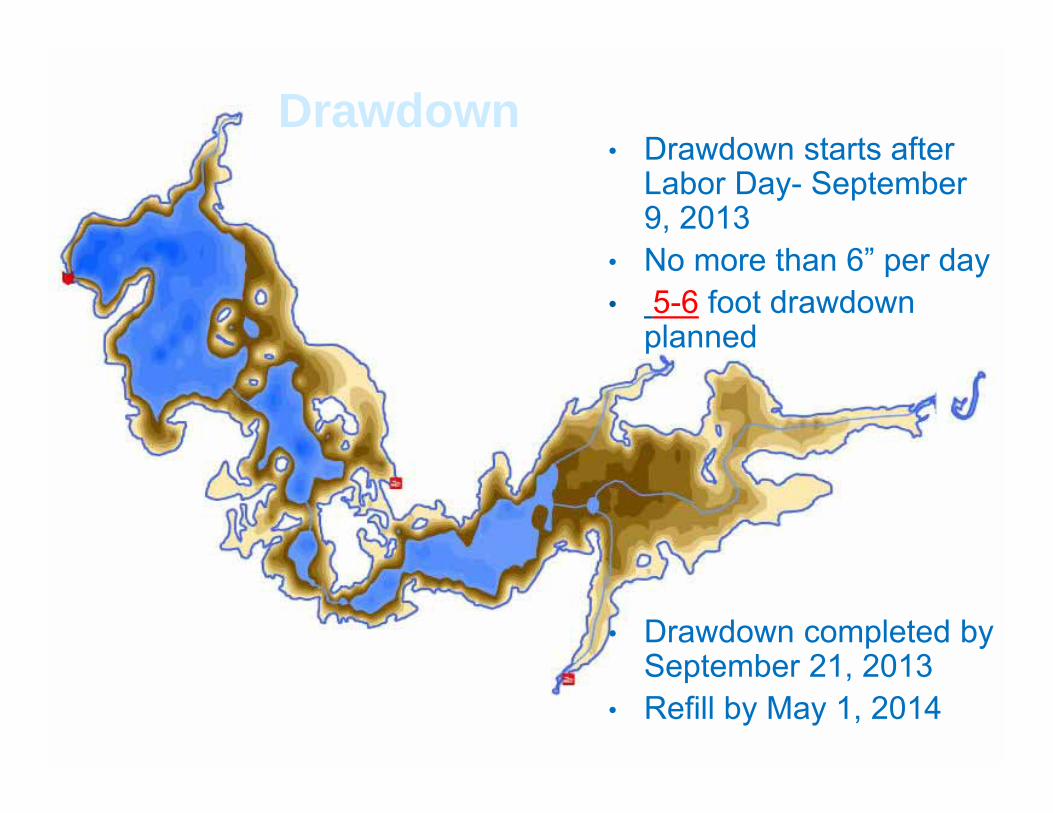
• Drawdown starts after Labor Day- September 9, 2013
• No more than 6” per day• 5-6 foot drawdown
planned
• Drawdown completed by September 21, 2013
• Refill by May 1, 2014
Drawdown

0
5
10
15
20
25
30
35
40
45
1 3 5 7 9 11 13 15 17 19 21 23 25 27 29 31 33 35 37 39
# Si
tes
Depth Bin (feet)
Maximum Depth of Plant Colonization
Drawdown depth

Winter Water Levels
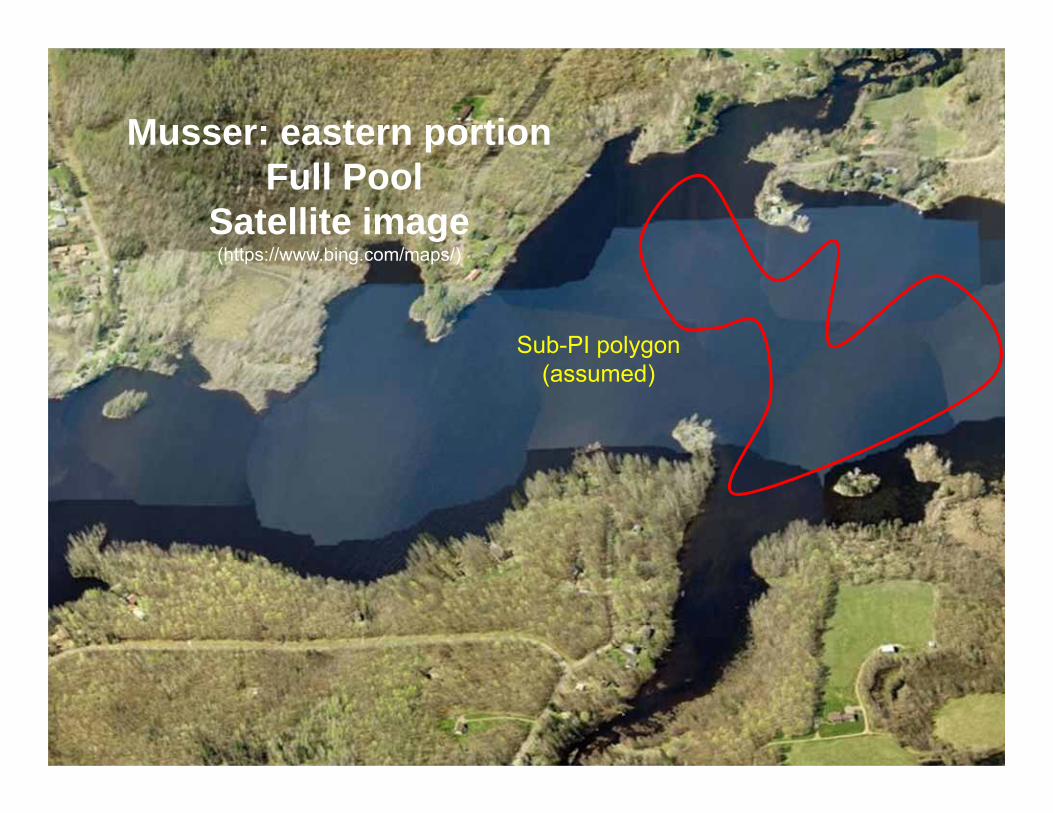
Musser: eastern portionFull Pool
Satellite image (https://www.bing.com/maps/)
Sub-PI polygon (assumed)

Musser: eastern portionDrawdown Pool
Aerial image (Mike Weinfurter-DNR)

• Objective: Evaluate the response of all aquatic vegetation to drawdown
• Whole-lake point-intercept survey - baseline survey for native plant and CLP response (mid-June both 2013, 2014)
• Sub-sample PI survey within dense CLP beds - gain a finer detailed account of the CLP response
• CLP colony/density mapping - track area occupied and density changes qualitatively
• CLP turion sampling -determine turion response to drawdown
MonitoringMethodology

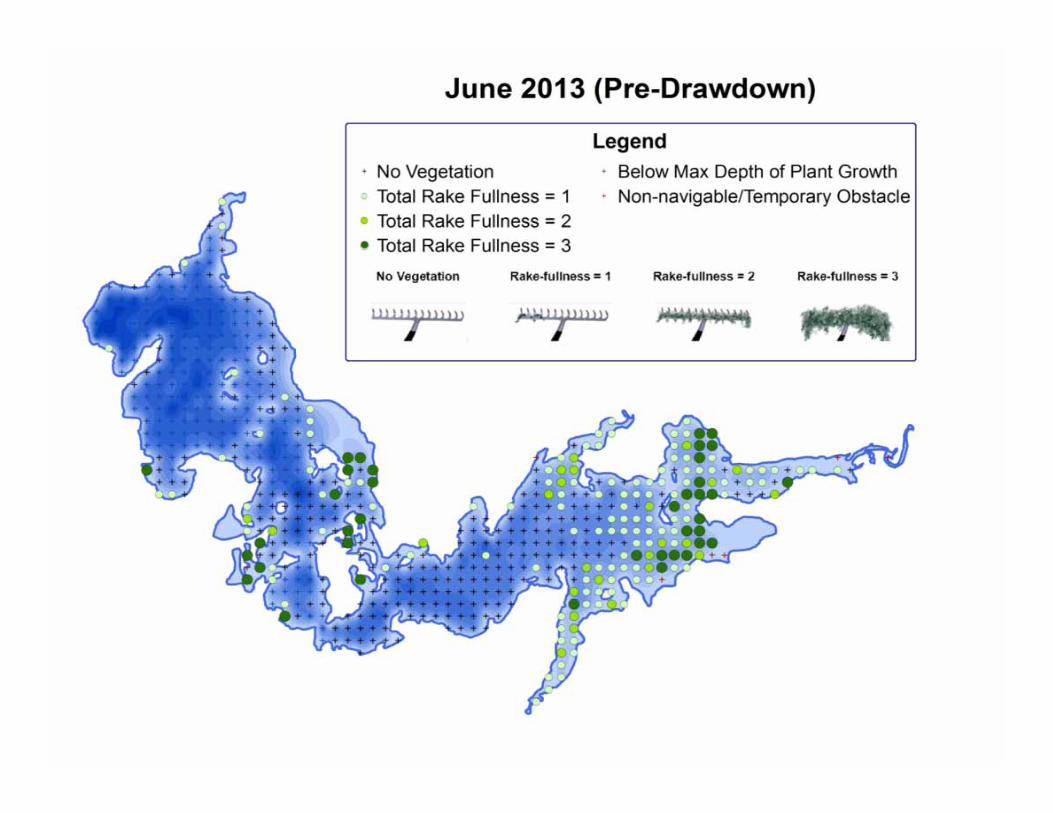
Whole-lake PI Survey
Completed by WI-DNR:
June 19 2013June 18-19 2014
629 sampling points 57 meter spacing
Survey methods follow: Aquatic Plant Management in WI Appendix B -Recommended Baseline Monitoring of Aquatic Plants in Wisconsin: Sampling Design, Field and Laboratory Procedures, Data Entry and Analysis, and Applications
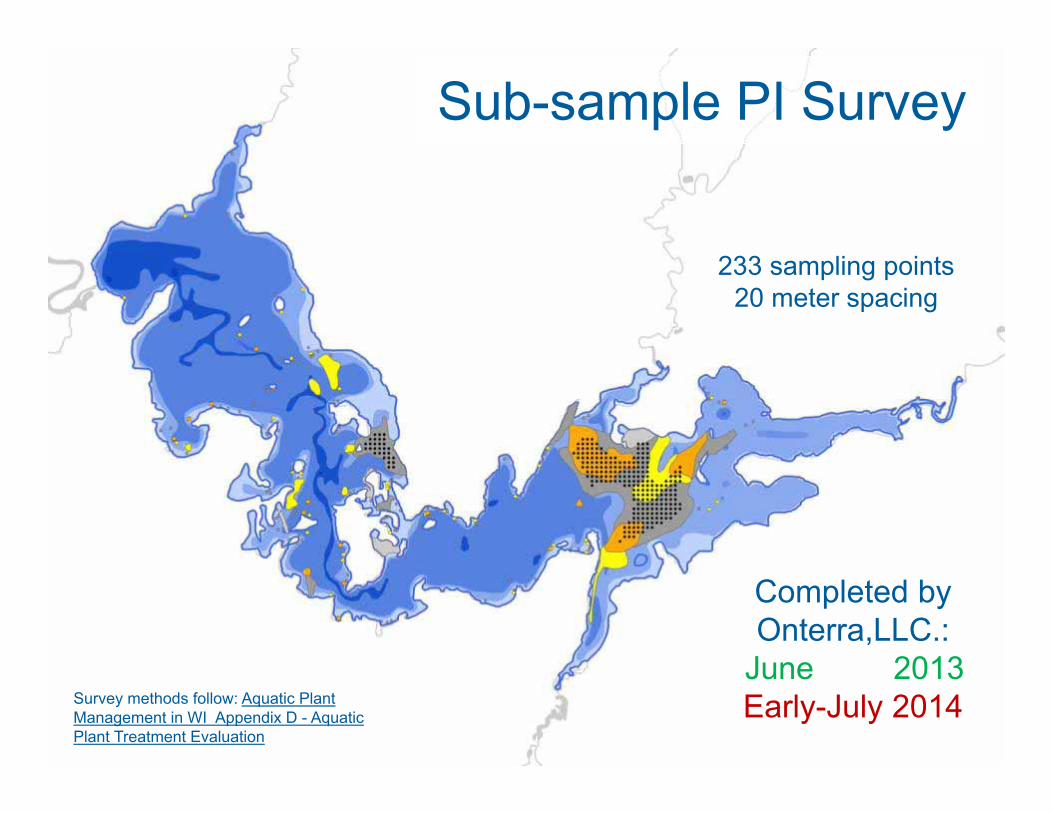
Sub-sample PI Survey
Survey methods follow: Aquatic Plant Management in WI Appendix D - Aquatic Plant Treatment Evaluation
Completed by Onterra,LLC.:
June 2013Early-July 2014
233 sampling points20 meter spacing

Turion Sampling
100 points20 meter spacing
Completed by WI-DNR:
Sept. 4 2013Sept. 9 2014
Methodology based upon: Madsen 1999; Woolf and
Madsen 2003
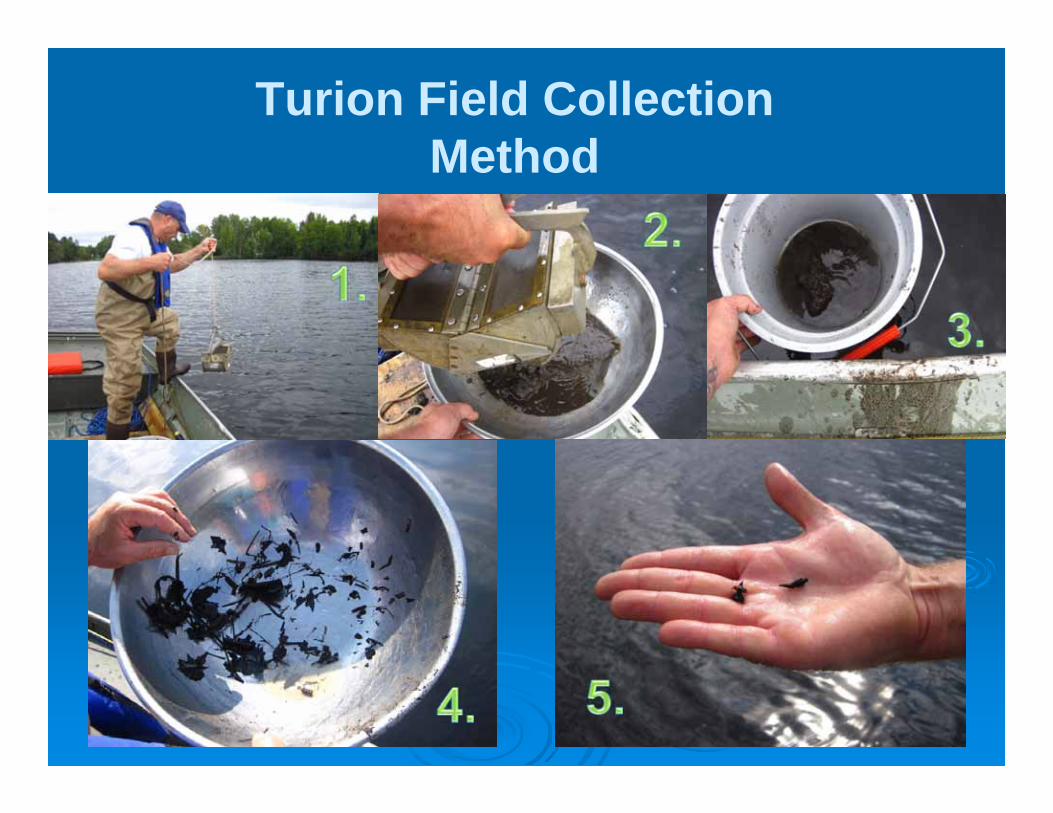
Turion Field Collection Method

Turion Germination Method -Lab
1. Chill turions in a refrigerator for 1 week
2. Place turions in aquarium *some turions floated and after a day I placed plastic paper clips on the floaters to sink them
3. incubate at daily average temp of 81-85°F for 2 weeks *10 light hours/ 14 dark hours*nightly average temperature water=65-70°F air=70-72°F
4. note any sprouting and remove sprouted individuals
Soetikno S. Sastroutomo, 1981, Turion formation, dormancy and germination of curly pondweed, Potamogeton crispus L., Aquatic Botany, Volume 10, Pages 161–173

Results:Point-intercept Survey

Plant Lists 2013 2014
Brasenia schreberi Acorus americanus
Ceratophyllum demersum Brasenia schreberi
Ceratophyllum echinatum Ceratophyllum demersum
Elodea canadensis Ceratophyllum echinatum
Elodea nuttallii Chara sp.
Equisetum fluviatile Elodea canadensis
Lemna minor Elodea nuttallii
Lemna turionifera Equisetum fluviatile
Myriophyllum verticillatum Lemna minor
Nitella sp. Nitella sp.
Nuphar vareigata Nuphar vareigata
Potamogeton amplifolius Potamogeton crispus
Potamogeton crispus Potamogeton epihydrus
Potamogeton epihydrus Potamogeton natans
Potamogeton natans Potamogeton pusillus
Potamogeton pusillus Potamogeton robbinsii
Potamogeton spirillus Potamogeton zosteriformis
Potamogeton zosteriformis Ranunculus aquatilis
Schoenoplectus tabernaemontanii Sparganium angustifolium
Sparganium fluctuans Spirodela polyrhiza
Spirodela polyrhiza Utricularia vulgaris
Utricularia vulgaris Vallisneria americana
Wolffia sp. Zizania palustris
Zizania palustris Aquatic Moss
Aquatic Moss Filmentous algae
Filmentous algae
Ricca sp.
Carex sp.
indicates found in 2013 but not 2014
indicates found in 2014 but not 2013

CLP Coontail Elodea Sm. Duckweed Wild rice Fil. Algae
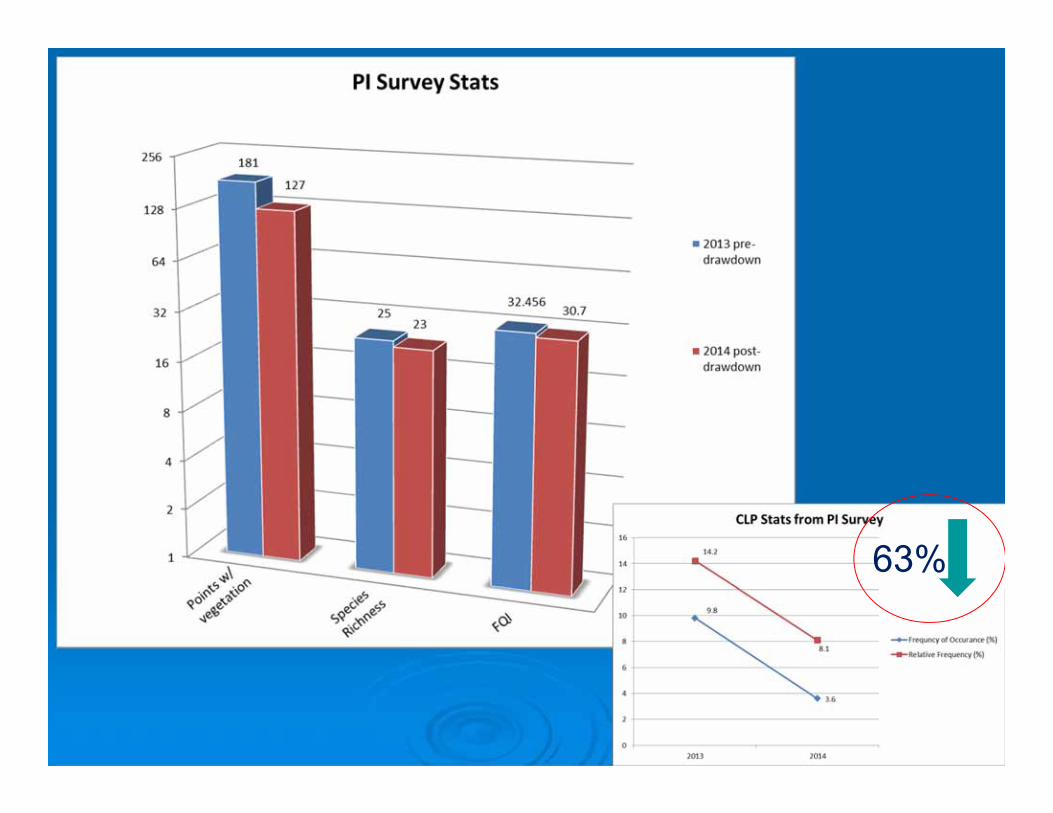
63%

Results:CLP Sub Point-intercept
Survey
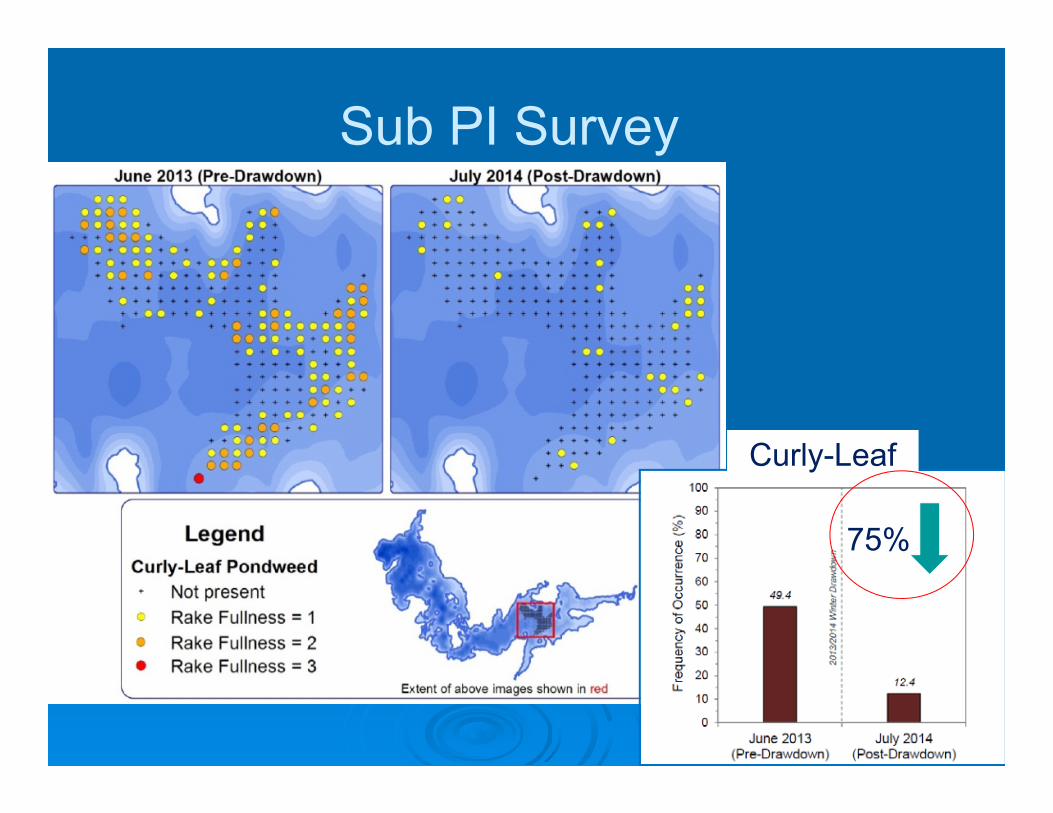
Sub PI Survey
Curly-Leaf
75%

Results:CLP Colony/Density
Mapping

52 acres of colonized CLP

0 acres of colonized CLP

Results:CLP turions
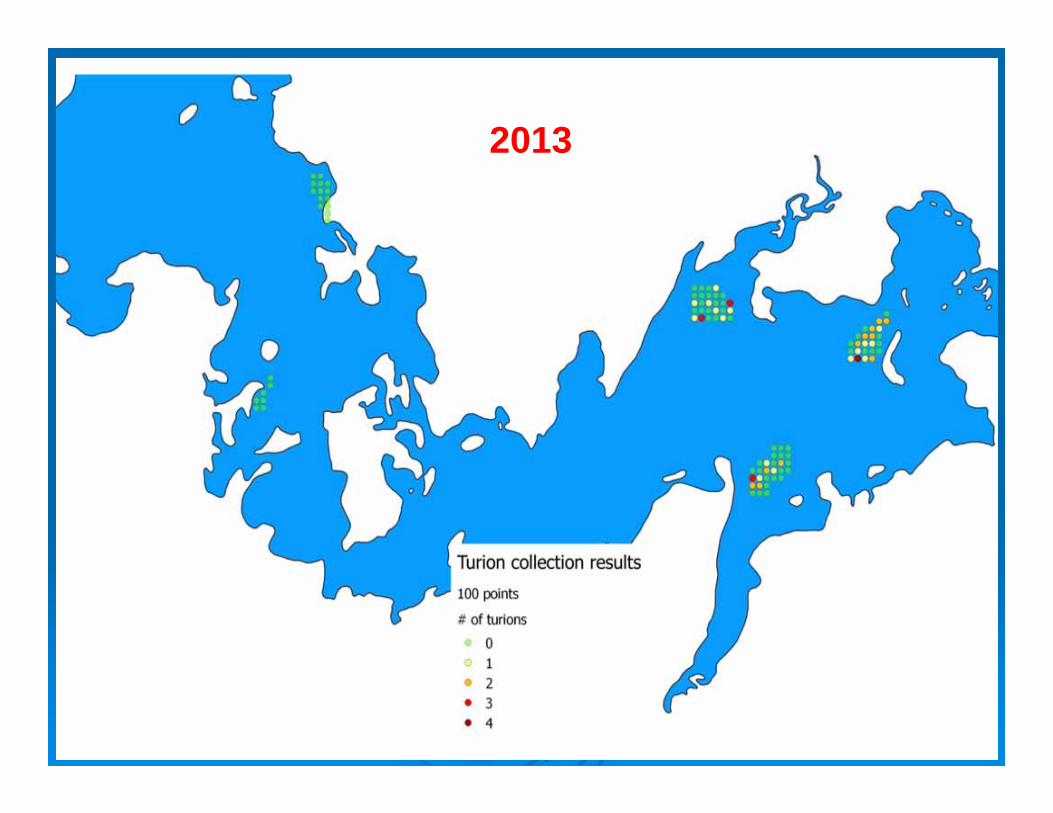
2201232013

2014
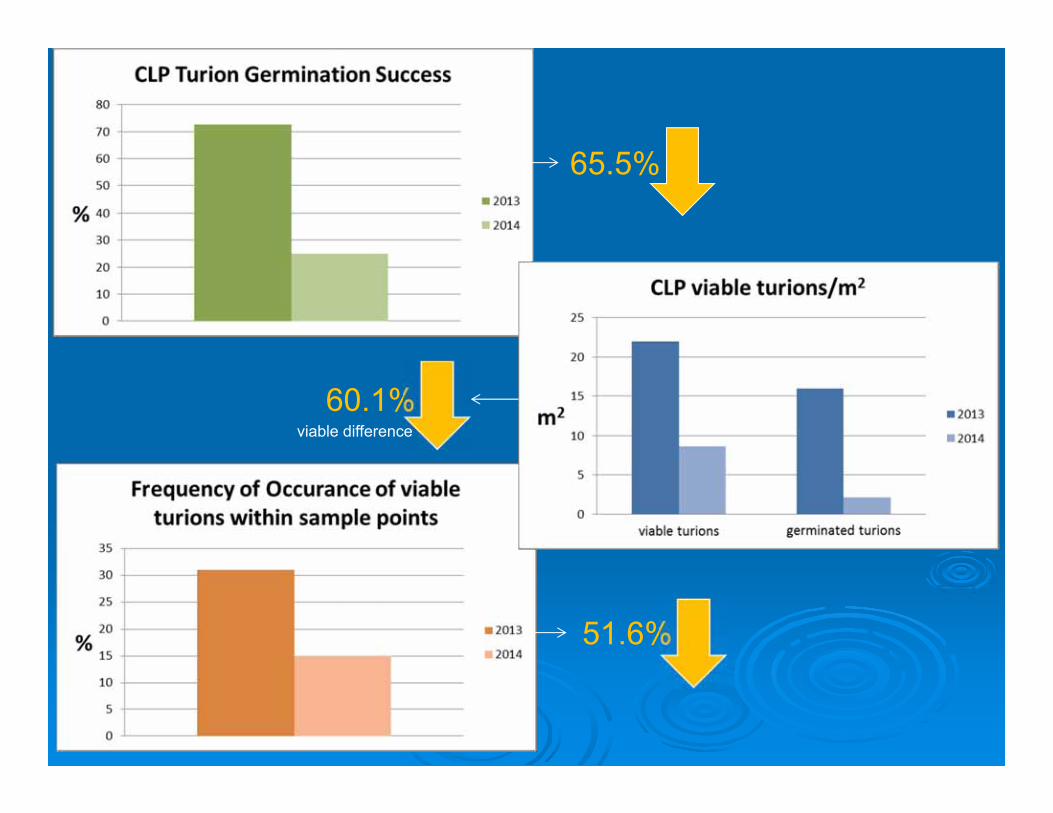
51.6%
60.1%
65.5%
viable difference
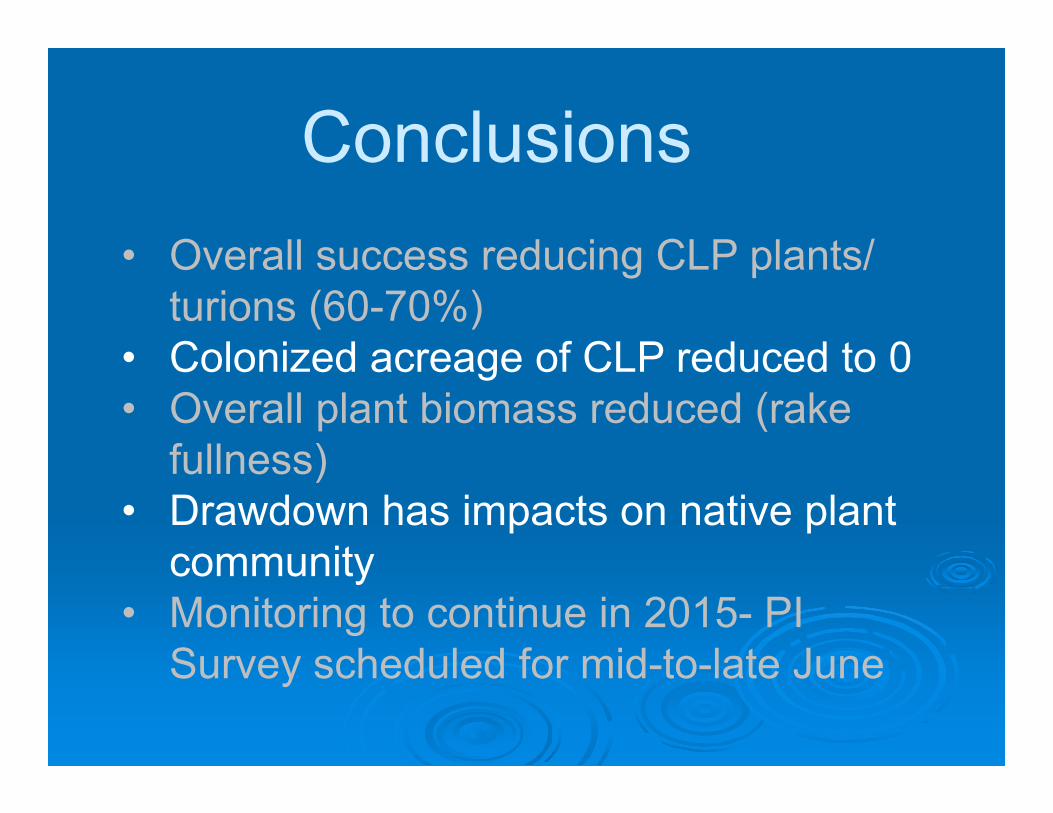
Conclusions• Overall success reducing CLP plants/
turions (60-70%)• Colonized acreage of CLP reduced to 0• Overall plant biomass reduced (rake
fullness)• Drawdown has impacts on native plant
community• Monitoring to continue in 2015- PI
Survey scheduled for mid-to-late June

Special Thanks to Onterra, LLC for providing many graphics for this presentation and being great partners during both of the projects
•Bob Lepke, Price County Dam-tender•Evan Lund, Price County Conservationist•Soo Lake United•Musser Flowage Lake Association•WDNR Staff
Acknowledgments

Questions?