Embed Size (px)
Citation preview


Reservation in Employment, Educationand Legislature — Status and
Emerging Issues
Sukhadeo Thorat and Chittaranjan Senapati
Working Paper Series
Indian Institute of Dalit Studies
New Delhi

Contents
1. Introduction 11.1. Structure of Inequalities 1
1.2. Exclusion and Inter-Social Group Inequalities 2
2. Constitutional Provisions 4
2.1. Government Services 42.2. Education 52.3. Political Safeguards 5
3. Reservation as a Policy – Employment, Education and Legislature 5
3.1. Reservation in Government Sector 63.2. Reservation in Education Sector 73.3. Reservation in Legislative bodies 7
4. Implementation and Monitoring 8
4.1. Department of Personnel and Training 8
4.2. National Commission for Scheduled Castes and Schedule Tribes 94.3. Committee of Parliament on Welfare of Scheduled Castes9
and Schedule Tribes 9
4.4. Ministry Social Justice and Empowerment and Ministry of
Tribal Affairs 9
4.5. Planning Commission, Backward Caste Division 9
5. Financial Mechanisms 9
6. Impact of Reservation 10
6.1. Employment Sector 116.2. Education 136.3. Legislature 136.4. Reservation in Private Sector – Affirmative Action Policy 15
6.5. Human Development of Scheduled Castes and Schedule Tribes 15
7. General Concerns 16
7.1. Problems of Access and Exclusion 167.2. Discrimination and Atrocities 177.3. Problems of Justice 177.4. Extension of Reservation 18
8. Concluding Observations 20Endnotes 23Select Bibliography 24Annexure IList of Tables
Annexure
List of Tables
Table 1 A, Caste, Ethnic Group Inequality, All India, 2000 (Figures in Percentage)
Table 1 B, Present Percentages of Reservation for SCs, STs and OBCs inGovernment services
Table: 1 C, Incidences of Discrimination, Atrocities, and Crime against SC/STs(Number of Cases Registered)
Table 1 D, Cases Registered Under various Crimes on Scheduled Castes andScheduled Tribes
Table 1 E, Reservations in Employment in Government Jobs (Combined)
Table 1 F, Total Government Employees (Decadal Point to Point)
Table 1 G, Combined Government Employment (Decadal Point to Point inAbsolute Numbers)
Table 1 H, Percentage of Combined Government Employments includingInsurance
Table 1 I, SC Central Government Employment (Decadal Point to point byCategories)
Table 1 J, Percentage Distribution of SC Employees in Central Government Jobs(By Categories)
Table 1 K, ST Government Employment (Decadal Point to Point by Categories)
Table 1 L, Percentage Share of STs in Central Government Jobs (By Categories)
Table 1 M, PSEs Employment (Decadal Point to Point)
Table 1 N, Percentage Distribution of SC Employees in PSEs, 1971-2004 (ByCategories)
Table 1 O, PSEs Employment (Decadal Point to Point)
Table 1 P, Percentage of ST Employees in PSEs, 1971-2004 (By Categories)
Table 1 Q, SC Bank Employees (Decadal Point to Point by Categories)
Table 1 R, Percentage Distribution of SC Employees in Public Sector Banks (ByCategories)

Table 1 S, ST Bank Employees (Decadal Point to Point by Categories)
Table 1 T, Percentage Distribution of ST Employees in Public Sector Banks (ByCategories)
Table 1 U, SC Insurance Employment, 1993-2000 (Decadal Point to Point byCategories)
Table 1 V, Percentage Distribution of SC Employees in Insurance Jobs (ByCategories)
Table 1 W, ST Insurance Employment, 1993-2000 (Decadal Point to Point byCategories)
Table 1 X, Percentage Distribution of ST Employees in Insurance Jobs (ByCategories)
Table 1 Y, Members of Parliament by Social Groups from 5th to 14th Parliament,All India
Foreword
This working paper “Reservation in Employment, Education andLegislature — Status and Emerging Issues” is the fifth in the SecondWorking Paper Series of the Indian Institute of Dalit Studies. The purposeof this Series is to disseminate and share the findings of the coreresearch concerns of the Institute for a wider circulation, and tofacilitate informed discussions on a variety of focal issues.
The Working Paper Series disseminate both, empirical and theoreticalfindings of the ongoing research on issues pertaining to the forms andnature of social exclusion and discrimination, caste and untouchability-based discrimination, and inclusive policies for the marginalized socialgroups in the Indian society and in other countries etc.
It is hoped that the Working Paper Series will be beneficial to researchers,students, academics, and activists alike, and will also benefit policymakingbodies and civil society organizations.
This Working paper “Reservation in Employment, Education andLegislature — Status and Emerging Issues” studies the reservation policyof the Government of India with regard to – employment in governmentservices, admission in educational institutions, and representation inlegislative bodies – as envisaged in the Constitution of India. This WorkingPaper systematically reviews the government’s policies and administrativemechanisms for regulating, monitoring and implementing the reservationpolicy. It also addresses issues of private sector reservation.
The Paper brings out that in the last fifty years, the share of SCs/STs inthe government services has improved in all the categories of jobs.However, the SCs/STs are heavily concentrated in Group ‘C’ and Group‘D’ categories of jobs. The representation in educational institutionshas also enabled improved access to the SC/ST students to desiredcourses. Representation in legislative bodies has also provided space tothe SC/ST persons.
The Indian Institute of Dalit Studies gratefully acknowledges the supportprovided by Cordaid, Netherlands, for the publication of this Series.
Sukhadeo ThoratManaging Trustee
About the Authors
Sukhadeo Thorat is Managing Trustee, Indian Institute of DalitStudies, India, Professor of Economics, Jawaharlal Nehru University,India and Chairman, University Grants Commission, Government ofIndia. His areas of interest are agricultural development, economicinstitutions and development, poverty, labour, agrarian structure,caste and economic discrimination, economic problems of theScheduled Castes and Scheduled Tribes, economic ideas ofDr Babasaheb Ambedkar, human rights, and urban slums.
He can be contacted at [email protected].
Dr. Chittaranjan Senapati is currently Research Associate at the IndianInstitute of Dalit Studies, New Delhi, India and PhD in InternationalPolitics from Jawaharlal Nehru University, New Delhi, India. His areasof interest are employment, industrial development, exclusion andgender in South Asia.
He can be contacted at [email protected].

Reservation in Employment, Education andLegislature — Status and Emerging Issues
Sukhadeo Thorat and Chittaranjan Senapati
1. Introduction
1.1 Structure of Inequalities
Indian society is characterized by a high degree of structural inequality basedupon the organization of people into caste and ethnic groups.
The former, known as the caste system, is the social organization of Hinduswho comprise more than 80 per cent of the Indian population. In this system,people are divided into social groups of castes and assigned hierarchal andunequal social positions and rights which are predetermined during birth.The caste system is highly exclusionary in nature: exclusion is integral to thesystem and thus, a consequence of its basic features. Social exclusion betweencaste groups is ensured through the practices of endogamy and socialseparation. In retrospect, every caste – except those at the top of the castehierarchy – has suffered from unequal and hierarchal assignment of rights.The erstwhile untouchables, also known as the Scheduled Castes (SCs), havingbeen located at the bottom of the caste hierarchy, are the ones who sufferedthe most. For instance, apart from manual labor and some occupations thatwere considered impure and polluting, the erstwhile untouchables were deniedthe right to do business or own property. They were even denied the right toeducation and civil, cultural and religious rights. Besides, they have beenmade to suffer from residential segregation and social isolation becausethey are considered impure and polluting and not fit for social association bythe high castes (Ambedkar, 1936 and 1987; Akerlof, 1976; Lai, 1988; Scoville,1991; and Thorat 2005).1
Another source of exclusion is linked with ethnic identity from which groupslike the Adiwasis suffer. This group has been subjected to isolation, exclusion,neglect and underdevelopment owing to their geographical location and culturalexclusivity. Social exclusion in the case of this group has taken various forms:

2
Indian Institute of Dalit StudiesVolume II, Number 05
Including, denial of the right to resources around them – as a result of thepolicies of the government and the societal processes.
Deprivation arising out of caste and ethnic exclusion is suffered by thesetwo groups of people even though they constitute one-fourth of the Indianpopulation. In 2001, the SCs and the STs (Scheduled Tribes or the Adiwasis)accounted for 17 per cent and 8 per cent of the Indian population, respectively.Together they constituted one-fifth (250 million) of India’s population: SCs,167 million and STs, 86 million.
There is another category of erstwhile untouchables who have either convertedinto the Sikh, Buddhist or Christian religion. They account for about 4 percent of India’s population. Though technically they are outside the matrix ofthe Hindu social caste system, they continue to suffer from caste-baseddiscrimination in certain spheres and are known as the ex-untouchable castes.The Government has made efforts to provide them certain benefits thatthey previously enjoyed, but not all. For instance, the ones who have convertedinto Sikhs and Buddhists continue to benefit from the affirmative actionpolicy of Government. However, the Christian converts have been kept outsidethe safety net of affirmative action; hence, their petition for the considerationof inclusion in the list of those eligible for reservation still remains in thecourt.
A third social group termed as the “other backward castes” has recentlybeen awarded reservation in government jobs only. This policy alsoencompasses a group of backward Muslims. However, the author will confinehimself to studying the SCs and STs owing to the lack of data on the backwardMuslims’ economic status and employment situation in the governmentservices.
1.1 Exclusion and Inter-Social Group Inequalities
The historical nature of exclusion (and continuation of the same in sometraditional forms if not all) of the excluded groups is responsible for thesevere deprivation and poverty suffered by them. This is manifested in theirlack of access to income earning capital assets (agricultural land andbusiness); education; employment; lack of civil, cultural and political rights;and finally, in poverty and malnutrition.
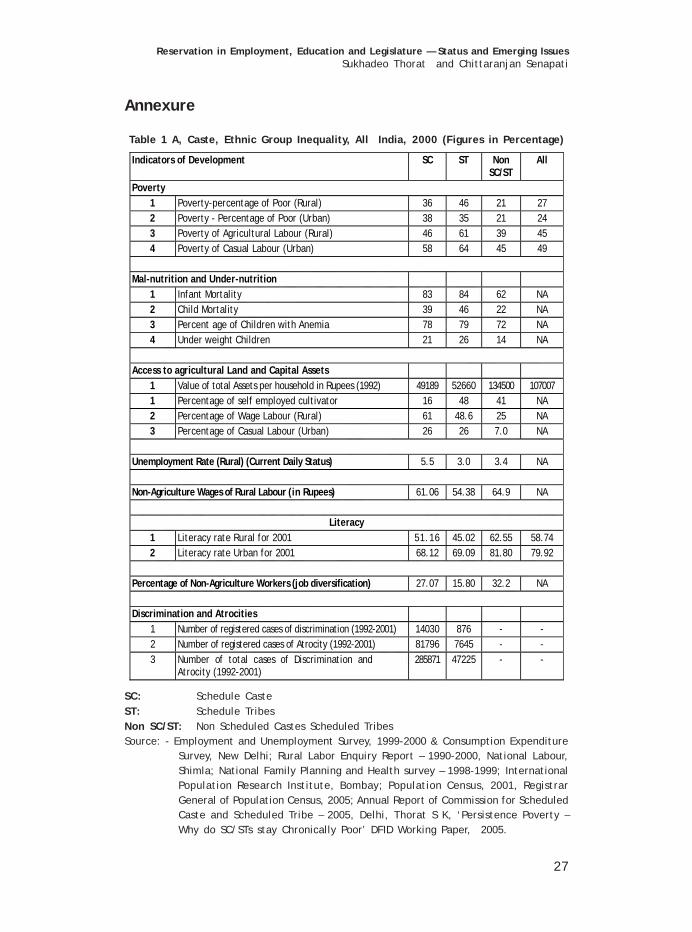
Table 1 A presents the situation of SC/STs with respect to certain indicatorsof human development in comparison to the Non SC/STs during the early2000.

3
Reservation in Employment, Education and Legislature — Status and Emerging IssuesSukhadeo Thorat and Chittaranjan Senapati
In general the SCs have limited access to ownership of capital assets andemployment; they are less educated, suffer from high degree of poverty andare denied full civil, political and cultural rights even today. About 70 percent of the SCs live in the rural areas. In 2000, about 16 per cent of the SCswere self employed cultivators and another 12 per cent were in non-farmbusiness. Therefore, about 28 per cent had access to capital assets – muchlower than the 56 per cent for Non SC/ST group. The per household assetthat is reflective of the disparity in wealth worked out to Rs 49,180 for SCsas against Rs 1, 34,500 for Non SC/ST.
Due to lack of ownership of assets more than 60 per cent of the SC householdsdepend on casual wage labor, much higher than the one-fourths for others.Unemployment ratios among them is 5.5 per cent nearly twice that of othergroups, i.e., 3.5 per cent. Only 51 per cent are literate as compared to 62per cent for others. The cumulative impact of deprivation is reflected in thehigh incidences of poverty – about 37 per cent among SCs as compared toonly 20 per cent among others.
High poverty leads to high infant and child mortality among the SCs (83 percent and 39 per cent respectively) as compared to others (61 per cent and 22per cent respectively). At least 56 per cent of SC women suffered from anemia.More than half of the SC children suffered from either malnutrition or undernutrition. The literacy rate among the SC population was 52 per cent asagainst 63 per cent among others in rural areas in 2001. The correspondingliteracy rate for urban area was 68.5 and 81.5 per cent respectively.
During 1991-2001, about 81,786 cases of atrocities were registered with thepolice by the SCs under Anti-Untouchability Act (or Civil Rights Act) of 1955and Atrocity Act of 1989. In total, 2, 85, 871 cases of discrimination andviolence had been registered. However, the actual magnitude is much higher,as is reflected in the primary studies (See Thorat, 1999).
In the case of ST about 46 per cent of the “tribals” were poor as comparedwith 20 per cent for the others. The literacy rates among them were muchlower, 45 per cent as compared to 62 per cent among others in rural area and69 per cent and 81 per cent for urban area. The child mortality rates amongthem were the highest, 46 per cent as against 22 per cent among Non SC/ST.One of the main problems of tribal is land alienation and displacement inducedby development. So far about 7.5 million ST persons have been displaced;which constitutes 40 per cent of the total person displaced. Out of this onlyabout 1.85 million are resettled.
4
Indian Institute of Dalit StudiesVolume II, Number 05
2. Constitutional Provisions
India’s affirmative action policy, more popularly known as “ReservationPolicy”, is authored by the provisions in the Indian Constitution which wasadopted in 1950, though its initiation at the country level dates back to theearly 1930s.2 The two important features of the provision in the constitutionwhich needs to be acknowledged for the purpose of this working paper are:the principle of “Non-discrimination and Equal opportunity” and the provisionsenshrined in the Constitution empowering the State to take steps to ensureequal opportunity.
Article 16 provides for “equality of opportunity for all citizens in the mattersrelating to employment or appointment to any office under the State”. Itbans discrimination, particularly in any employment or appointment to anyoffice under the state on grounds of religion, race, caste, sex, descent,place of birth, residence, or any of them. In fact Article 17 abolished theinstitution of untouchability which sanctified discrimination and exclusionof the erstwhile untouchables. The Article states: “Untouchability is abolishedand its practice in any form is forbidden”.
Accordingly, the Constitution empowered the state with the responsibility toensure non-discrimination and equal opportunity in practice. Article 46, a‘Directive Principle of State Policy’ states:
The State shall promote with special care the educational andeconomic interests of the weaker sections of the people, and, inparticular, of the Scheduled Castes and the Scheduled Tribes, andshall protect them from social injustice and all forms of exploitation.
Such provisions in the constitution relates to government services, education,political representation and others.
2.1 Government Services
The constitution provides for both appointment and promotion in thegovernment services. Article 16 (4) empowers the State to make “anyprovision for the reservation in appointments, or posts in favour of anybackward class of citizens”. Article 16 (4 A) enables the State to makeprovision for reservation in matters of promotion to any group or groups ofposts in the services under the State in favour of the SCs and STs. Article335 states:

5
Reservation in Employment, Education and Legislature — Status and Emerging IssuesSukhadeo Thorat and Chittaranjan Senapati
The claims of the members of the Scheduled Castes and Scheduled Tribesshall be taken into consideration, consistently with the maintenance ofefficiency of administration, in the making of appointments of services andposts in connection with the affairs of the Union or of a State.
2.2 Education
In the case of education, the provision relates to non-discrimination ineducational institutions, equal representations, and measures for educationalpromotions. Article 15 (4) states that “Nothing in this article shall preventthe State from making any special provision for the advancement of anysocially and educationally backward classes of citizens or for the ScheduledCastes and the Scheduled Tribes”. Article 29(2) provides protection foradmission and against discrimination in any educational institution maintainedby the State or receiving aid out of State funds on grounds only of religion,race, caste, language or any of them.
2.3 Political Safeguards
The constitution empowers the State to take steps to provide duerepresentation to the SC/STs. Various articles contains provisions for thereservation of seats for the SC/STs in the nation’s legislative bodies inproportion to their population: Central Legislative Assembly (Article 330),Legislative Assembly of the States (Article 332), in Municipalities (Article243 T), in various Panchayat (local self government) level bodies, namely,village, taluk (block) and district (Article 243 D).
3. Reservation as a Policy – Employment, Education and Legislature
The Indian Government’s approach towards the SC/ST population has primarilybeen shaped by the provisions in its Constitution which basically guaranteesequality before the law, and empowers the State to make special provisionsto promote the educational and economic interest of the SC/ST and to providelegal and other safeguards against discrimination in multiple spheres.
The Government has applied a two fold strategy which includes:
(a) legal safeguards against discrimination,
(b) pro-active measures in the form of ‘reservation policy’ for statesector and state supported sectors, and
(c) policy in the form of informal affirmative action for private sector(namely agriculture and private industry, in which more than 90 per
6
Indian Institute of Dalit StudiesVolume II, Number 05
cent of the SC/ST workers are engaged) as part of a generaldevelopmental or empowering measure.
Anti-discriminatory measures include enactment of Anti-untouchability actof 1955 (renamed as protection of Civil rights Act in 1979) and ScheduleCaste/Tribe Prevention of Atrocities Act, 1989. Under the first Act, practiceof untouchability and discrimination in public places and services is treatedas offence. The second Act provides legal protection to SC/STs againstviolence and atrocities by the high castes.
Reservation for both SC/ST in government services, educational institutionsand political bodies like legislature also falls under ant-discriminatory, butpro-active measures. These pro-active measures have been used to ensureproportional participation of the SC/ST in various public domains.
The reservation policy is confined to a tiny state-run and state-supportedsector, whereas the vast private sector where more than 90 per cent of theSC/ST population workers are engaged are excluded. They therefore remainunprotected from exclusion and discrimination. In the absence of reservationpolicy in the private sector, the state has used ‘general programmes’ foreconomic, educational and social empowerment of the SC/ST. The focus hasbeen to improve the private ownership of fixed capital assets (land and non-land), education, and improved access to social needs like housing, health,drinking water, electricity and others. The strategy for improving or buildingthe private ownership of capital assets, education and social needs, whichhas been generally taken as a part of the anti-poverty programme, is alsoused as a method of earmarking quotas in an informal manner for the SC/STpopulation of the country.
3.1 Reservation in Government Sector
It is important to note that the Indian affirmative action policy is confinedto government and government aided sector of services and educationalinstitutions;3 the private jobs and educational institutions are completelyexcluded from the purview of the policy. Accordingly, the reservation policyis operative mainly in three spheres: government jobs, admission to publiceducational institutions and seats in central, state and local legislatures andbodies. Over a period of time, as the government sphere expanded, so didthe scope of reservations to include newer spheres like: government housing,government spaces for shops and commercial activities and a number ofother small spheres.

7
Reservation in Employment, Education and Legislature — Status and Emerging IssuesSukhadeo Thorat and Chittaranjan Senapati
The most important is the reservation in government services. Article 16(A)permits reservation in favour of backward castes and in pursuance of thisprovision, the Government has made reservation for SC/ST in proportion totheir share of population (See Table 1 B). There is also reservation in promotionof employed persons. The government services generally include governmentcivil service, public sector undertakings, statutory and semi-governmentbodies, voluntary agencies, etc. which are under the control of theGovernment or receiving grant-in-aid. However, there are also certain servicesat the central level that do not come within the purview of reservation policy:these prominently include the defense and the judiciary.
Reservation policy is accompanied by an array of other special provisionsdesigned to facilitate and enhance the probability of the reserved groups tocompete for government jobs. These include: relaxation of minimum agefor entry into the service, relaxation in minimum standard of suitabilitywithin reasonable limits (subject to required minimum qualification),relaxation in fee, and provision for pre-examination training, separateinterview for SC/ST persons, provision of expert from SC/ST background onselection committee and others.
3.2 Reservation in Education Sector
Second important sphere of reservation is in the education sector. Article15(4) empowers the State to make special provisions for the advancementof the SC/STs. Under this provision, the State has reserved seats for SC/STstudents in educational institutions: in colleges and universities, includingtechnical, engineering and medical colleges run by the central and stategovernments and government aided educational institutions. These provisionsare supported by a number of financial schemes which include scholarships,special hostels for SC/ST students, concession in fees, grants for books,remedial coaching, etc.
3.3 Reservation in Legislative bodies
Third most important sphere of reservation is representation in the centraland state legislatures. A legislative reservation is one of the specific andmandatory constitutional provisions dedicated to SC/STs. Under Articles 330,332 and 334 of the Constitution, seats are reserved for SC/STs in the centraland state legislatures in direct proportion to their population size. Similarly,reservation is provided in local level bodies at the district, taluk and villagelevels. Constituencies (for the seat in parliament and state assemblies) are

8
Indian Institute of Dalit StudiesVolume II, Number 05
reserved for SC/STs in proportion to their share in population. Thus, at theall India level, out of the total number of parliamentary seats, 14 per centand 7 per cent of constituencies (or seats) are earmarked for SC/STsrespectively. Only the person from SC/ST community can contest from thesereserved constituencies. For example, in 2004, of the total of 543constituencies in the parliament, 75 were reserved for SCs and 41 for STs.The number of constituencies to be reserved is assessed in consultationwith the population census which is conducted every ten year. The sameprocedure is followed at the state and sub-state level. For a constituency tobe declared reserved, that constituency must fulfill one sole criterion, i.e.the ratio of SC/ST population to the total population in the constituencymust be comparatively large.
The constitutional provision for reservation in legislative bodies for the SC/STs is complemented by statutory provisions which enhance politicalparticipation from the SC/ST population. For instance, they are required tomake smaller election deposits.
4. Implementation and Monitoring
The Central Government has developed administrative mechanisms forregulating, monitoring and implementing the reservation policy and otheraffiliated programmes. These institutions can be divided into:
(a) ones that are directly involved in regulation (i.e. preparing rulesrelating to reservation from time to time) and monitoring thefulfillment of the required quotas in the central government services,
(b) those acting as investigative agencies in the event of violation ofreservation rules, and
(c) those that are concerned with policymaking and overseeing theoverall development of the SC/STs.
4.1 Department of Personnel and Training
The Department of Personal and Training (DOPT) is the division located inthe Ministry of Personnel, Public Grievance and Pension. It regulates andmonitors the reservation policy in government services. Its main function isto enforce or modify the rules, as well as, monitor the fulfillment of quotasas per given rules in central government services. Each ministry andgovernment supported organization has an administrative unit known as the‘SC/ST Cell’ with liaison officers responsible for ensuring that instructions

9
Reservation in Employment, Education and Legislature — Status and Emerging IssuesSukhadeo Thorat and Chittaranjan Senapati
with regard to the implementation of reservation policy are strictly compliedwith. The DOPT through the administrative heads of the ministries andorganizations, monitor and regulate reservations at the central level.
4.2 National Commission for Scheduled Castes and Schedule Tribes
The other important independent organization is the National Commissionfor SC and ST. It functions as the investigating agency on specific complaintsfrom SC/ST employees regarding service and promotion matters. The mattersmay be related to incidences of discrimination, violation of reservation policy,etc. The Commission has the power of functioning as a Civil Court and hasthe authority to summon an employer for enquiry and action. The Commissionalso oversees the development of SC/STs, prepares report about theirprogress annually, which is accordingly, discussed in the Parliament.
4.3 Committee ofs Parliament on Welfare of Scheduled Castes andScheduled Tribes
Committee of Parliament on Welfare of SCs /STs is another body (comprisingof SC/ST Members of Parliament) entrusted with the task of examining theprogress regarding the representation of SC/STs. It attempts to make suitablerecommen-dations for effective implementation of policies and programmes.
4.4 Ministry Social Justice and Empowerment and Ministry of TribalAffairs
At the policy framing level are the Ministry of Social Justice andEmpowerment, Ministry of Tribal Affair and Committee of Parliament onWelfare of SCs/STs. The Ministries are the nodal bodies which oversee thetask for the development of the SC/STs. The ministries are responsible forthe overall development of the SC/ST population. They carry out variousschemes related to education, and economic development.
4.5 Planning Commission, Backward Caste Division
The Ministry of Social Justice and Empowerment and the Ministry of TribalAffairs work in close collaboration with the Planning Commission (PC) ofIndia; the PC has a special Backward Caste Division that oversees the workof economic planning related to regulation and implementation of thereservation policy.
5. Financial Mechanisms
Funds for the operation of reservation policy and for general developmentprogrammes of SC/STs come through the annual budget of the Government.

10
Indian Institute of Dalit StudiesVolume II, Number 05
The Government has created a special financial mechanism in the form ofSpecial Component Plan (SCP) for SCs and Tribal Sub-Plan (TSP) for STs aspart of its five year plan. The SCP and TSP are designed to channelize theflow of funds (and hence, the benefits) from the general sectors towards theplans of states and central ministries for development of SCs and STs. Thefunds for the annual plans in the case of divisible schemes/programmes aresupposed to be allocated in proportion to their population share.
Table 1 C, in Annexure I, gives the allocation of funds under the SCP and TSPduring 2002-2004. The SCP and TSP and Special Central Assistance (SCA) toSCP and TSP are two innovative strategies to ensure additional flow of fund/s. The SCP, introduced in 1979/80 and TSP few years earlier, involve populationproportionate funds from the general development sectors for the overalldevelopment of SC/STs. The SCA is extended to states as 100 per cent grantto fill the critical gaps in important programmes. So far, 14 Central ministries/departments and 27 states/union territories have been earmarking fundsunder the SCP. The expenditure on implementation of reservation policy isalso included in this allocation of fund under SCP and TSP. The Governmentbudget, however, does not provide separate data on the funds utilized forimplementation of reservation policy.
Table 1 C indicates that both the central and state governments have notearmarked adequate funds for SC/ST. As against a 16 per cent populationshare of the SC, only 11 per cent was allocated as flow from central plan (inrespect of 14 ministries ) to SCP, and flow from state plan to SCP (in respectof 24 states) during 1997-2000. Similarly, as against an 8 per cent populationshare of the ST, only about 5 per cent fund has been allocated as flow fromcentral plan (in respect of 14 ministries) to TSP and about 11 per cent flowfrom state plan to TSP during 1997-2000). Thus, the actual allocation offunds under the SCP and TSP was much lower than what was initially planned;i.e. to allocate population proportionate funds.
The Government has also created separate financial institutions to channelizefunds towards targeted programmes of SC/STs. These include National SC/ST Finance and Development Corporation (NSFDC), Scheduled Castes andTribes Development Corporation (SCTDCs) National Safai KaramacharisFinance and Development Corporation (NSKFDC).
6. Impact of Reservation
In this section we will first examine the impact of the reservation policy onthe employment sector, the education sector and the legislature. Later, an
11
Reservation in Employment, Education and Legislature — Status and Emerging IssuesSukhadeo Thorat and Chittaranjan Senapati
attempt will be made to discuss the status of the informal affirmative actionpolicy in the private sector. Finally, attempt will be made to assess theaggregate impact of both formal and informal affirmative action policies onSC/STs by using the indicators of human development.
6.1 Employment Sector
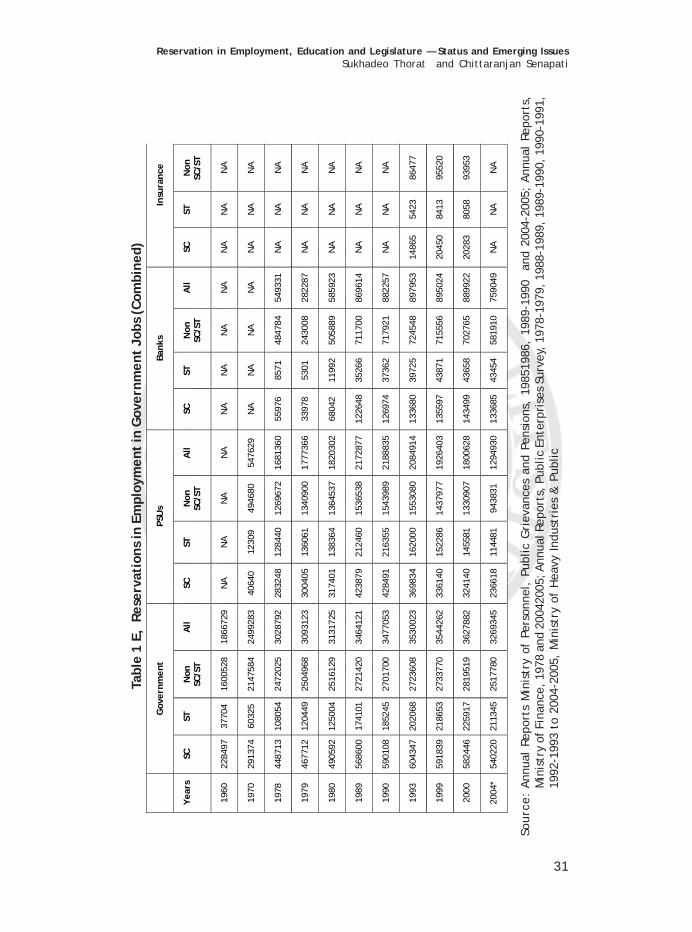
To begin with the employment sector, there has been a striking increase inthe numbers of SC/ST government employees. In 1960, there were 2,18,000SC employees which increased to 6,41,000 in 1991 and 5,40,000 in 2003.The corresponding increase in the percentage of SC employees to totalgovernment employees increased from 12 per cent in 1956 to about 16 percent in 2003 – fairly proportionate to their percentage share in population. Inthe case of ST, the numbers increased from about 3,80,000 in 1960 to 2,03,000in 1991 and further up to 2,11,000 in 2003; a corresponding increase inpercentage from 2 per cent in 1960 to 6 per cent in 2003.
Similarly, the number of employees in public sector undertaking has increasedfrom 40,000 in 1970 to 2,96,000 in 2003 for SC and from 12,000 to 1,38,000for ST during the respective years. In case of nationalized banks, the numberhas increased from 4,000 in 1972 to 1,43,000 in 2000 for SC and from 400 to43,000 for ST during the same period. The corresponding percentage hasincreased from 1.89 to 13.32 per cent for SC and from 00.19 per cent to 4per cent for ST.
Similarly, the number of SC employees in nationalized banks increased from55,000 in 1978 (10 per cent) to l,33,000 in 2004 (17 per cent) and for ST thenumber increased from 8,000 (1.5 per cent) to 44,000 (5.72 per cent). Inpublic insurance companies the number of SC employees increased from 14thousands in 1993 (14 per cent) to 20 thousands (16 per cent) in 2000. Thenumber of ST employees increased from 5,000 (5 per cent) to 8,000 (6 percent) during the same period.
If we take the total number of employees in three services – government,public sector undertaking and public sector banks – we will notice that thenumber of employees in these three services has increased from 7,88,000 to9,10,000 for SCs and from 2,45,000 to 3,69,000 for STs during the period,1978-2004. The percentage of total employees also improved between 1978and 2004; from 15 per cent to 17 per cent in the case of SCs and from 4.7 percent to 6.9 per cent in the case of STs.

12
Indian Institute of Dalit StudiesVolume II, Number 05
If we also include the public sector insurance companies along with theaforementioned three services, then the aggregate number of employees inthe employment sector for the year 2000 (the latest year for which comparabledata is available) comes to 10,70,000 for SCs and 423,000 for STs. It may bementioned that these do not include many other government spheres likeeducational institutions and others. If we did, the absolute number ofemployees in reserved seats will increase further.
Thus, during the last fifty years or so, the share of SC/STs in the governmentservices has improved quite significantly. There are, however, variationsbetween different types of jobs. Generally, reservation is fairly proportionateto the required percentage in group C and D jobs, but unsatisfactory in thecase of A and B category jobs.
For effective implementation of reservation policy in jobs, the Governmenthas tried to developed some safeguards which include maintenance of ModelRoaster for identifying posts under reservation, separate interview of SC/ST candidates, special office with liaison officers to oversee Reservationpolicy in each office, representatives of SC/STs on selection boards, banningde-reservation of reserved posts, banning the full exchange of posts withgeneral category candidates if SC/ST category are not available and othermeasures.
However, reservation in employment and educational institutions, fall shortof the target in some categories of jobs. There is a tendency towardsclustering of reservations in certain categories of services, departmentsand grades. For instance, in 2003, the lower categories of jobs, i.e. C and Dgrade posts, accounted for almost 95 per cent of the total SC/ST posts underreservation in government. Though the target in case of grade C and D jobsare fairly close to the reservation percentage earmarked: 16 per cent forSCs and 8 per cent for STs, but in grade A and B jobs, and also in severalcategories of technical and university jobs, the fulfillment of quotas fellshort.
Also, the slow pace of the process of achieving reservation is a majorimpediment to fulfilling reservation quotas. Implementation of reservationsat the practical level faces immense resistance from various spheres. Thisis reflected in the delay in making provisions, in filling up the posts andresorting to courts for implementation. The magnitude of resistance is muchintense in higher-grade jobs and more so, in technical educational institutions.

13
Reservation in Employment, Education and Legislature — Status and Emerging IssuesSukhadeo Thorat and Chittaranjan Senapati
It is less in lower categories of jobs and in admissions to institutions otherthan technical. Delay and resistance in provision making and in filling upposts is particularly prevalent in the case of State aided autonomousinstitutions which are required to get approval of their decision making bodiesfor reservation.
6.2 Education
In the case of admission in educational institutions, the availability ofassessments about the impact of reservation in higher education is limited.The limited evidence indicates that the student enrolment has increasedunder reservation.. In 1981, one estimate put the proportion of graduatestudents around 3.3 per cent for SCs and 0.8 per cent for STs – which ishighly disproportionate to the actual population share of SC/STs. By the late1990’s, the proportion of SC students to the total number of students enrolledrose to 7.8 per cent and for the STs, it rose to 2.7 per cent. This isnevertheless low if we look at the actual share of the SC/ST population tothe total population – 16 per cent and 8 per cent respectively.
Hence, it is difficult to estimate how many SC/ST students have benefitedby the reservation policy. One estimate indicates that in 1996/97, roughly5,10,000 SC students and 1,80,000 ST students were enrolled. Of these,roughly about 2,00,000 students from both the categories may have beenenrolled in desirable programmes in higher education where reservationmatters. Weisskopf (2005) estimates conclude that about a third of SC/STstudents enrolled in universities were pursuing higher education in desirableprogrammes because of the reservation policy. This implies that out of theapproximately 7,00,000 SC/ST students attending universities, only a portionof them are enrolled into programmes of their choice; SC/STs obtain a muchlower share in preferred institutions. In many cases, despite reservationbeing the norm, it is accepted only in theory and defies implementation ofany sorts. Therefore, there is a substantial amount of catching up to do inorder to reach the required level of 16 per cent and 8 per cent reservationfor SC/STs.
6.3 Legislature
The constitutional provisions for reservation in public sector employmentand educational institutions are mere authorizations empowering the Stateto make special provisions in favour of discriminated groups. But, thelegislative reservations are specifically provided in the Constitution itself.

14
Indian Institute of Dalit StudiesVolume II, Number 05
Legislative seats in each state are reserved in proportion to the populationof SC/STs in the state. Thus, in 2004, 75 seats (13.81 per cent) of 543 seatsin Lok Sabha were reserved for SCs and 41 seats (7.55 per cent) for STs. Ofthe total number of seats reserved in all the states’ legislative assemblies(Vidhan Sabhas), more than 2000 seats were reserved for SC and STs.
In the case of political reservation, two problems continue to receiveattention. Firstly, the Government has been delaying the updating of thepercentage share of seats for SC/STs in the central and state legislatures asper the recent changes in population figures. The present allocation of seatsfor SC/ST is based on the population census of 1981, whereby the populationshare of SCs is about 14 per cent and STs about 7.55 per cent. Whereas,according to the latest population census of 2001, their population is about17 per cent for SCs and 8.50 per cent for STs. Thus, both groups continue tosuffer from under-representation in central and state legislatures.
Another issue relates to the quality of representation afforded by the SC/STrepresentatives in the legislative bodies. Of course, it cannot be denied thatpolitical reservation does provide substantial quantitative presence of theSC/STs in the legislative bodies, which would otherwise have been completelynil, if not for political reservations. Nonetheless, the activities of SC/STrepresentatives are presumably microscopic and concentrated on mattersthat affect these groups only. Also, their effectiveness in representing theinterests of the marginalised groups is most evident in their dealings onmatters directly related to their welfare. However, there have been studiesthat have made the observation that there is a problem of low participation,less articulation, less assertiveness and less independence of SC/STrepresentatives than their colleagues belonging to high castes. To the extentthat the problem of quality of representation exists, it may be attributed tothe “structural constraints imposed by the arrangement for reserved seatsor the method of election under reservation” (Galanter, 1991).
Often, a legislator elected through reserved seat, especially a SC, isresponsible to and dependent upon a constituency made up overwhelminglyof non-members (or high caste members). To the extent that the legislatoris dependent on high caste vote and is thus, obliged to support them; thus aSC legislative candidate suffers from the limitation of not being able torepresent fully the interests of SC/STs, who themselves happen to be aminority in most of the reserved constituencies. This arrangement acts as afilter in keeping the divergent interests of these groups from unifying andchecks direct and forceful expression of their grievances and interests.

15
Reservation in Employment, Education and Legislature — Status and Emerging IssuesSukhadeo Thorat and Chittaranjan Senapati
It is precisely because of this limitation of political reservation that Ambedkarhad suggested an alternative arrangement or method of election of SC/STrepresentatives, namely ‘separate electorate’ as against reservation of seats.The separate electorate would have ensured the representation of moreindependent and representative legislature of SC/STs in legislature.4
6.4 Reservation in Private Sector – Affirmative Action Policy
One of the general qualms about public sector reservation policy in employmentand admission to educational Institutions is that it applies to a tiny governmentand government supported sectors and excludes a large private sector. Forinstance, in employment, the reservation policy excludes private employmentwhere more than 90 per cent of the SC/ST workforce is engaged; with theresult that there is lack of protection against practices of exclusion anddiscrimination in the private sector.5 There is notable exclusion in thefollowing sectors – private industrial, services and agricultural. Similarly, theentire private owned educational institutions are excluded from the provisionof reservation policy. It is only after the introduction of policy of privatizationand back-door de-reservation of government employment in the early 1990sthat the demand for reservation in private sector has picked up. And atpresent, the Government has set up Group of Ministers to develop a consensusbetween the Government and the private sector for adoption of AffirmativeAction Policy for private sector.6
The informal type of affirmative action policy in the private sector, with agroup target approach, has helped the SC/STs to some extent. However, thenet gains are limited in nature since the disparities between the SC/STs andthe non-SC/STs, with respect to the main indicators of human development,continue. It is rather difficult to disaggregate the impact of informalaffirmative action policy, as well as, of formal reservation policy, on thehuman development of SC/STs.
6.5 Human Development of the Scheduled Castes and Scheduled Tribes
It is possible to look at some of the indicators of human development inorder to capture the aggregate impact of formal and informal affirmativeaction policies, as well as, the general economic and social developmenttrends. Over time, there has been a positive improvement in the humandevelopment of SC/STs. The positive changes are reflected in the aggregateindicators of human development – income level, employment, social needslike education and health, and ultimately, in poverty. During 1983/84 and
16
Indian Institute of Dalit StudiesVolume II, Number 05
1999/2000, we observed an improvement in the monthly per capitaconsumption expenditure (proxy indicator for income), literacy rate andincidence of poverty of SC/STs. As mentioned earlier, the share of SC/STemployees in government sector has significantly improved and apparently,it had positive multiplier effects on the social and economic situation ofthese two disadvantaged groups.
However, it needs to be recognized that, although there has been someimprovement as reflected in some of these indicators, improvement inrelation to non SC/ST is low, or lower than the rate which is required tobridge the gap between SC/ST and Non SC/ST groups. Hence, the disparitiesbetween SC/STs and non SC/ST have not been reduced substantially so as tobridge the gap to a reasonable level. Consequently, the socially marginalizedgroups of SC/STs lag behind the non SC/ST section of the Indian populationwith respect to attaining the desirable level in human development.
For instance, in 2000, the infant mortality rate was higher among the SC/STs as compared to non SC/ST. Similarly, compared with non SC/ST, theliteracy rate among the SC/STs is lower by 14 per cent and 21 per cent,respectively.
The SC/STs’ monthly per-capita expenditure is less by about 25 per cent and34 per cent respectively, as compared with consumption expenditure of nonSC/ST. Again compared with non SC/ST, the incidence of aggregate povertyis 70 per cent and about 100 per cent higher among the SC/STs respectively.The percentage of under-nourished children among the SC/STs is higher by23 per cent and 27 per cent, respectively. Finally, the SC/STs’ access topublic health services, compared with non SC/ST, is less by 23 per cent and44 per cent. Thus, despite an improvement at the level of individualindicators, the level of human development among the SC/STs as comparedto non SC/ST in 2000 is relatively lower.
7. General Concerns
Besides sector specific issues, there are other general issues pertaining toimplementation of reservations in employment, education and other spheresthat need attention.
7. Problems of Access and Exclusion
It appears that the continuing disparities in the attainment level are closelylinked to the lower access of the socially marginalized groups of SC/STs to

17
Reservation in Employment, Education and Legislature — Status and Emerging IssuesSukhadeo Thorat and Chittaranjan Senapati
sources of income and human resource capabilities (such as, capital assetslike agricultural land), non land assets, lower urbanization, employmentdiversification away from agriculture, exceptionally high dependence on casualwage labour, higher underemployment, lower daily wages, particularly, innon farm activities, low level of literacy and low level of education, comparedwith Non SC/ST groups (See Table 1 A).
The empirical evidence also shows that low access to resources, employmentand education of marginalized groups, as compared to Non SC/ST groups, isclosely linked with the processes of exclusion and discrimination; partly carriedforward as residual of old caste system to the present. In economic spheres,the empirical evidence points towards the evidence of exclusion anddifferential treatment in various markets namely agricultural land, capital,employment, market in consumer goods, as well as, the transactionsconducted through non-market channels. Discrimination is also experiencedby SCs while trying to access public services – in education, health, watersources, and participation in political institutions.
7.2 Discrimination and Atrocities
The SCs also experience the fangs of violence and atrocity during theirattempts to secure human rights and lawful entitlements. The negativeexperiences, therefore, assume a variety of forms: ranging from social andeconomic boycott to physical violence (Thorat 2005 (a), 2005 (b). About theforms of violence and kinds of atrocities, the observations in the Report ofthe Commission for SC/STs, 1998, are worth mentioning:
Some of the major causes of atrocities and other offences againstSC/STs are related to issues of land and property, access to water,wage payments, indebtedness and bonded or forced labour. Issuesof human dignity, including compulsion to perform distasteful taskstraditionally forced on SCs, and molestation and exploitation of Dalitwomen are also involved. Caste related tension is exacerbated byeconomic factors, which contribute to violence.7
7.3 Problems of Justice
Despite legal measures in seeking legal safeguards against discrimination inemployment, education and other spheres, the SC/STs continue to sufferfrom discriminatory access to the institutions of justices which are responsiblefor delivering justice. Studies relating to this aspect of discrimination indicatethat SC/STs are generally faced with insurmountable obstacles in their efforts

18
Indian Institute of Dalit StudiesVolume II, Number 05
to seek justice in event of discrimination: during registration of a legal caseor while taking up matters at various levels of the institutional setup, fore.g., before the police, the public prosecutors and other official functionaries.Official statistics and various studies based on primary surveys highlight thefollowing characteristics regarding the institutions of justice:
The data present in Civil Rights cases shows that, of the total cases registeredin 1991, only 1.56 per cent were convicted. In fact, the conviction rate hadcome down to 0.60 per cent in 1999 and 0.85 per cent in 2000. The convictionrate in the cases relating to discrimination and atrocities is less than oneper cent. A study based on the analysis of 100 documented cases ofdiscrimination in Andhra Pradesh during 2000-2003, throws some light onthe causes for the low rate of conviction. The study observed that “the casestudies indicated a disturbing trend of subversion of the rights of Dalit tojustice and compensation under the law once an atrocity takes place” (Agrawaland Gonsalves, 2005). It revealed truths about negligence at the stage ofregistration, charge-sheeting and investigation, while seeking justice beforethe law of the court and while giving compensations. It also exposed violationsby the police in refusing registration of cases, in pressurizing a Dalit tocompromise, foisting false cases, refusing to register cases under the SC/ST Atrocity Act, not citing proper section of Act, not arresting the accused,shielding public servants from arrest, not following rules of investigation,not conducting inquiry of the incidence for compensation, not providingallowances, and ignoring the consequences of atrocities in terms of socialboycotts (Agrawal and Gonsalves, 2005, Dalit Human Rights Monitor, 2003).
About the role of judiciary, the Dalit Human Right Monitor, 2003 observed:
If the low conviction rate under the Act is any indication, the Judiciaryhas responded poorly to the Act. Judicial delay and dilution of thescope, applicability and meaning of the SC/ST Act has resulted indenial of justice to the Dalits’ (Dalit Human Right Monitor 2003).The Karnataka study which studied the role of the police and judiciarycovering a sample of 120 police officers, 95 judges and advocatesand 16 public prosecutors dealing the anti-discrimination laws, cameup with similar observations. It observed non-cooperative andunsupportive attitude of the police in dealing with cases of atrocitiesand anti-discrimination (Mumtaz Ali Khan, 1995).
7.4 Extension of Reservation
Political reservation has a time limit. Initially, when it was drafted, reservationwas provided for a ten year period, with a provision for extension after

19
Reservation in Employment, Education and Legislature — Status and Emerging IssuesSukhadeo Thorat and Chittaranjan Senapati
every ten years. Accordingly, since the initiation of reservation for the firsttime in 1937, it has been extended after every ten years. The presentextension is up to 2010.
However, the ten year limit is not applicable to reservation in governmentservices and governmental educational institutions. While the Constitutionmade a general provision for adequate share to be provided for the SC/STs,it is left to the discretion of the Government to decide when the reservationpolicy could be called off; which could be done as and when it believed thatdiscrimination against the SC/STs may no longer be a major problem andthat they are adequately empowered, and have received due representationand participation in normal course. The same criterion was to be utilized forthe extension/calling off of reservation in legislature after every ten year.
It is necessary to recognize that although there is a minority view thatexpresses concern about the indefinite extension of reservations, thedominant view is and has remained in favour of extension. The latter supportreservation as long as discrimination and social exclusion of SC/STs persists.And since social exclusion and discrimination of SC/STs is prevalent on alarge scale in multiple spheres and that these groups continue to be deprivedof basic rights, there is general support in the Government for reservationpolicy without time consideration.
In fact, given the exclusivist character of the Indian social order, reservationin government services have been extended to include other groups: OtherBackward Castes (OBCs, who constitute 27 per cent of India’s population);SCs who have converted into Sikhism and Buddhism; and the backward casteMuslims. The case for reservation for SCs who have converted to Christianityis presently under consideration. Some states have already announcedreservation in government services for Muslims in a limited scale.
However, there is a difference of opinion regarding the targeting of reservationwithin the group that has already been identified for reservation. For example,within the OBCs, the relatively better-off classes are termed ‘creamy layer’and are thus, excluded from the umbrella of reservation. One is categorizedas belonging to the ‘creamy layer’ on the basis of one’s income and othersupplementary indicators. The concept of ‘creamy layer’ however, has notbeen applied to SC/STs because the ones who are relatively better off, aswell as the ones who are worse off, continue to suffer from discriminationand non-participation in development processes. At the same time, the

20
Indian Institute of Dalit StudiesVolume II, Number 05
relatively better-off SC/STs do suffer from exclusion and discrimination basedon the income criterion, although, in theory, they are entitled to reservationin government jobs, educational institutions and the legislature.
8. Concluding Observations
Given the structural inequalities and exclusionary and discriminatory characterof Indian society, the State has developed remedies against caste andethnicity-based exclusion and discrimination and for empowerment ofexcluded groups, the SC/STs, which constitute about one-fifth of India’stotal population. The safeguards against exclusion and discrimination in theforms of legal measures and affirmative actions cover public employment,public education and legislative seats and also other government amenitieslike public housing, etc. However, affirmative action policy in India is confinedto the government sector only and the vast private sector is excluded fromits jurisdiction. The Government has used some sort of an informalaffirmative action policy in the private sector.
Over time, there has been considerable improvement in the share of SC/STreservation and representation in government employment and educationalinstitutions. The reservation in legislative bodies has also ensured the SC/STs some space in the executive and decision making process. The impactof formal reservation policy in government sector and informal affirmativeaction policy in private sector has led to some improvement in the humandevelopment of SC/STs. However, as compared to non SC/ST population ofthe country, the rate of improvement has been rather slow. And as result,despite positive improvements, the disparities in human developmentbetween SC/STs and non SC/ST continue even today.
During the course of the implementation of reservation policy, some problemshave become apparent. Although the Government has taken steps to improvethe implementation of reservation policy, there has been resistance to thepolicy in indirect forms and as result, its success is uneven across sectorsand department. Reservations is close to the population mark of SC/STs inlower categories of jobs, but lower than the population mark in case of highgrade positions and technical education institutions. Owing to the indirectnature of resistance to implementation of reservation policy, the extensionand the percolation of the reservation policy to several government sectorshas been slow.
The other issue that recently acquired prominence is the demand made bySC/ST groups to extend the affirmative action policy of the Government to

21
Reservation in Employment, Education and Legislature — Status and Emerging IssuesSukhadeo Thorat and Chittaranjan Senapati
the private sector employment and educational institutions and other privatesector spheres as well; this is under active consideration by the Governmentof India.
In the Indian context, it must however be mentioned, that given theexclusionary character of Indian society and exclusion linked deprivation ofa vast section of the population, there has been a needs for a generalreorganization of the affirmative action policy for discriminated groups. Infact, the public sector affirmative action policy has been extended to othersimilar groups – OBCs and SCs who have converted to Buddhism/Christianity– with the consequence of angering parties with vested interests that cannotbear to see them rebel. Disputes during elections, animosity due toreservation, jealousy due to increasing economic prosperity, violence relatedto the process of taking possession and retaining Government allotted land,tension due to refusal of SCs to perform tasks such as disposal of dead cattleor cutting umbilical cords of new born babies, are all manifestations of theresentment of the high caste against increase in awareness among SCs.
Land and water are also sensitive issues. Accessibility to water for irrigationis one of the water related issue that runs against the favour of themarginalized groups. Often, the upper castes commit atrocities against theSCs over such issues as drinking water. Caste fervor during religious andsocial ceremonies, disputes arising during sowing and harvesting operations,and during the process of removal of crops from the granary after harvesting,have also been known to a major source of tension. Increase in the level ofSC awareness and their empowerment, manifested in resistance tosuppression, also sometimes results in clashes.
Hence, societal discrimination and exclusion in multiple spheres and violentopposition by the powerful high caste civil society and also some organs ofthe state drastically reduce SC/ST freedom and capacity to enjoy their civil,political and economic rights and equal opportunities. The failure ofentitlements due to caste-based exclusion is of considerable magnitude.Empirical evidence proves that, among others, caste/untouchability-basedexclusion and discrimination of SCs and isolation and exclusion of STs in thepast and continuation in the present through its residual traditional attributescontribute to the low level of human development and high level of deprivationof the SC/STs.
The continuing exclusion induced deprivation of the disadvantaged groups –the SC/STs – indicate that addressing problems of social exclusion is a more
22
Indian Institute of Dalit StudiesVolume II, Number 05
difficult challenge than enforcing a anti-poverty policy. Social and culturalsources of exclusion in economic, civil and political spheres – including, lowself esteem, stigma, discrimination and denial of citizenship – are rooted inthe informal social structure and the institution of caste and untouchability.Social exclusion, discrimination and untouchability are widespread, not only,in the private sector, but also prevalent in the public domain governed by theState. In this context, the inclusion of excluded groups, then, becomes asomewhat different goal than social inclusion of only materially deprivedpeople. Poverty, even when broadly defined, as exclusion from the meansnecessary for full participations in normal activities of society, is largely aquestion of access to resources and services. Whereas, exclusion of groupsor individuals is foremost, a denial of the right to equal opportunity, respectand development; such a curse affects even relatively better off members ofthe group facing social exclusion.
23
Reservation in Employment, Education and Legislature — Status and Emerging IssuesSukhadeo Thorat and Chittaranjan Senapati
Endnotes
1. In this paper, the words erstwhile ‘untouchable’, Scheduled Castes andDalits have been used interchangeably. Similarly ‘Adiwasi’ isinterchangeably used for Scheduled Tribes.
2. The Formal Reservation policy at all India level was adopted by CentralGovernment for Centre and individual States under Poona Pact in 1931,although attempts - formal and informal - were made by individual States/Providences prior to 1930..For instance a formal reservation policy wasadopted in the small State of Kholhapur in 1902 which is now a districtin Maharashtra State (Nalawade, 2003).
3. The Reservation policy in government jobs began in 1931 as part of thePoona Pact. However, reservation with specific quotas in governmentservices was ordered in 1943 through a government order which waslater formalized in 1950 under the provision of Independent India’sconstitution (See Galanter, 1991: 86 ).
4. See Ambedkar B. R., 1945.
5. The provision in the Anti-Untouchability Act, 1955, renamed Civil RightsAct, and in its 1978 amendments, it is an offence to discriminate ongrounds of ‘untouchability’ in connection with “employment in anyjobs”. However, the public is unaware about this provision and as aresult, has never been brought up before the public domain for use.
6. Thorat, 2004 and Thorat et al, 2005.
7. See different Annual Reports of the National Commission for ScheduledCastes and Scheduled Tribes, Government of India.

24
Indian Institute of Dalit StudiesVolume II, Number 05
Select Bibliography
1. Dirish, Agrawal and Colin Gonsalves, Dalit and Law, Human Law Network,Delhi, 2005.
2. Ambedkar, B.R., The Hindu Social Order - Its Essential Features, in VasantMoon (Eds.), Dr. Babasaheb Ambedkar - Writings and Speeches,Department of Education, Government of Maharashtra, Bombay, 1987,Volume 3, pp. 95-115.
3. Ambedkar, B.R., The Hindu Social Order - Its Essential Features, in VasantMoon (Eds.), Dr. Babasaheb Ambedkar - Writings and Speeches,,Department of Education, Government of Maharashtra, Volume 9, 1945.
4. Banerjee, Biswajit and Knight J.B., Caste Discrimination in Indian UrbanLabour Market, Journal of Developing Economics, 1985.
5. Corbridge, Staurat, Competing Inequalities: The Scheduled Tribes andThe Reservation Systems in India’s Jharkhand, The Journal of AsianStudies, Volume 59, Number 1, Feb, 2000, pp. 62 - 85.
6. Dalit Human Rights Monitor, 2004 People’s Watch, Tamilnadu ,Madurai
7. Dalit Human Right Monitor, 2000 Andhra Pradesh Sakshi, Human RightsWatch, Hyderabad
8. Galanter, Mark, Competing Equalities – Law and the Backward Classes inIndia, Oxford, 1984.
9. Hooda, Sagar Preet, Contesting Reservations, Rawat Publications, Jaipur& New Delhi, 2001.
10. Haan, De. Arjan, Poverty and Social Exclusion: A Comparison of Debateson Deprivation, Poverty Research Unit, Sussex, University of Sussex,Brighton, Working Paper, Number 2, 1997.
11. Kuchabhan, Mumtaz Ali, Human Rights and the Dalits, Uppal PublishingHouse, Delhi, 1995.
12. National Crime Records Bureau, Crime in India for the years – 1999, 2000& 2001, Ministry of Home Affairs, Government of India.
13. Kirpal, V. and M. Gupta, Equality Through Reservations, RawatPublications, Jaipur & New Delhi, 1999.
14. Mishra, Narayan, Schedule Castes Education: Issues and Aspects, KalpazPublications, New Delhi, 2001.
15. Nabhi’s Brochure on Reservation and Concessions for Scheduled Castes,Scheduled Tribes, Other Backward Classes, … A Nabhi Publication, 2003.

25
Reservation in Employment, Education and Legislature — Status and Emerging IssuesSukhadeo Thorat and Chittaranjan Senapati
16. Nalwade, M.D., Chhatapati Shahu and His Reservation Policy, MahatmaPublications, 2003
17. Nayak, Vijay and Shailaja Prasad, ‘On Levels of Living of Scheduled Castesand Scheduled Tribes’, Economic and Political Weekly, Volume 19, Number30, 1984, pp. 1205-13.
18. Birdsall, Nancy and Richard Sabot, Unfair Advantage - Labour MarketDiscrimination in Developing Countries, World Bank Studies, Washington,1991.
19. Planning Commission, Mid-Term Appraisal of the 10th Five Year Plan (2002-2007), Planning Commission, Government of India, Delhi, 2005.
20. Pai Panandiker, V.A. (Ed.), The Politics of Backwardness: ReservationPolicy in India, Konark Publishers (for the Centre for Policy Research,New Delhi), 1997.
21. Rao, S.S., Equality in Higher Education: Impact of Affirmative ActionPolicies in India, in Edgar F. Beckham (Ed.), Global Collaborations: TheRole of Higher Education in Diverse Democracies, Association of AmericanColleges and Universities, Washington, 2002.
22. Radhakrishnan, P., ‘Sensitizing Officials on Dalits and Reservations’,Economic and Political Weekly, Volume 37, Number 7, 16 February, 2002.
23. Sundaram, Jomo Kwame, ‘Ethnic Discrimination: A Critical Survey ofEconomic Explanations’, Department of Applied Economics, Universityof Malaya, 50630, Kuala Lumpur, Malaysia, 2003.
24. Sen, Amartya, Social Exclusion: Concept, Application, and Scrutiny, AsianDevelopment Bank, Social Development Papers Number. 1, June, 2000.
25. Scoville, James G.L., Labour Market Underpinnings of a Caste Economy– Failing the Caste Theorem, The American Journal of Economics andSociology, Volume 55, Number 4, October, 1996.
26. Thorat, Sukhadeo; Aryama and Prashant Negi (Eds.), Reservation andPrivate Sector – Quest for Equal Opportunity and Growth, RawatPublications, Jaipur and New Delhi, 2005.
27. _____, Oppression and Denial – Dalit Discrimination in l990’s, Economicand Political Weekly, February, 2002.
28. _____, On Reservation Policy for Private Sector, Economic and PoliticalWeekly, Number 25, June 19, 2004.
29. _____, Caste, Ethnicity, and Religion: An Overview Paper on Exclusion/Discrimination and Deprivation, Concept Paper for DFID, Delhi, 2003(a).
30. _____, Caste, Exclusion/Discrimination and Deprivation: The Situationof Dalits in India, Concept Paper for DFID, Delhi, 2003(b).

26
Indian Institute of Dalit StudiesVolume II, Number 05
31. _____, Persistence of Poverty: Why do Scheduled Castes and ScheduledTribes Stay Chronically Poor? Indian Institute of Public Administration,New Delhi and Centre for Chronic Poverty Study, London, 2005.
32. _____, Human Poverty, Social exclusion and Disadvantaged Groups inIndia, Working Paper, United Nations Development Programme, Delhi,2005(b).
33. _____, Remedies Against Economic Discrimination - InternationalExperience of Reservation Policy in Private Sector, in Bibek Debroy andShyam Babu, The Dalit Question-Reforms and Social Justice, Globus,Delhi 2004.
34. _____, Caste and Untouchability based Economic and MarketDiscrimination –Theory, Concept and Consequences, Artha Vijnana,VoIume XLIII, Numbers 1-2, Journal of Gokhale Institute of Politics andEconomics, 2001.
35. _____, Isolation and Deprivations: Economic Situation of Tribals inIndia in Development Issues in India, Department of Economics, Dr.Babashaheeb Marathwada University, Aurangabad, Maharashtra,2000.
36. Tripathy, R.B., Dalits: A Sub- Human Society, Ashish, New Delhi, 1994.
37. Venkateswarlu, D 1990 Harijan - Upper Class Conflict, Discovery,Delhi.
38. Darity, William, Jr., (Ed.), Economics and Discrimination, Volume I,Edward Elgar Publishing, United States, 1995.
39. _____, Reparations, in Samuel L. Myers, Jr. (Ed.), Civil Rights andRace Relations in the Post Reagan - Bush Era, Praeger Publishers,London, 1997.
40. _____, with Steven Shulman, Question of Discrimination – RacialInequality in the U.S. Labour Market, Wesleyan University Press,Middletown, Connecticut, 1989.
41. Weisskopf, Thomas E., Affirmative Action in the United States andIndia: A Comparative Perspective, Routledge, London, 2004.
27
Reservation in Employment, Education and Legislature — Status and Emerging IssuesSukhadeo Thorat and Chittaranjan Senapati
Annexure
Table 1 A, Caste, Ethnic Group Inequality, All India, 2000 (Figures in Percentage)
Indicators of Development SC ST Non SC/ST
All
Poverty 1 Poverty-percentage of Poor (Rural) 36 46 21 27 2 Poverty - Percentage of Poor (Urban) 38 35 21 24 3 Poverty of Agricultural Labour (Rural) 46 61 39 45 4 Poverty of Casual Labour (Urban) 58 64 45 49
Mal-nutrition and Under-nutrition
1 Infant Mortality 83 84 62 NA 2 Child Mortality 39 46 22 NA 3 Percent age of Children with Anemia 78 79 72 NA 4 Under weight Children 21 26 14 NA
Access to agricultural Land and Capital Assets
1 Value of total Assets per household in Rupees (1992) 49189 52660 134500 107007 1 Percentage of self employed cultivator 16 48 41 NA 2 Percentage of Wage Labour (Rural) 61 48.6 25 NA 3 Percentage of Casual Labour (Urban) 26 26 7.0 NA
Unemployment Rate (Rural) (Current Daily Status) 5.5 3.0 3.4 NA
Non-Agriculture Wages of Rural Labour (in Rupees) 61.06 54.38 64.9 NA
Literacy
1 Literacy rate Rural for 2001 51.16 45.02 62.55 58.74 2 Literacy rate Urban for 2001 68.12 69.09 81.80 79.92
Percentage of Non-Agriculture Workers (job diversification) 27.07 15.80 32.2 NA
Discrimination and Atrocities
1 Number of registered cases of discrimination (1992-2001) 14030 876 - - 2 Number of registered cases of Atrocity (1992-2001) 81796 7645 - - 3 Number of total cases of Discrimination and
Atrocity (1992-2001) 285871 47225 - -
SC: Schedule CasteST: Schedule TribesNon SC/ST: Non Scheduled Castes Scheduled TribesSource: - Employment and Unemployment Survey, 1999-2000 & Consumption Expenditure
Survey, New Delhi; Rural Labor Enquiry Report – 1990-2000, National Labour,Shimla; National Family Planning and Health survey – 1998-1999; InternationalPopulation Research Institute, Bombay; Population Census, 2001, RegistrarGeneral of Population Census, 2005; Annual Report of Commission for ScheduledCaste and Scheduled Tribe – 2005, Delhi, Thorat S K, ‘Persistence Poverty –Why do SC/STs stay Chronically Poor’ DFID Working Paper, 2005.

28
Indian Institute of Dalit StudiesVolume II, Number 05
Table 1 B, Present Percentages of Reservation for SCs, STs andOBCs in Government services
Fixed Percentage of Reservation for
S. No.
Mode of Appointment
SC% ST% OBC%
1. Direct recruitment on all-India basis by open competition (i. e. through the UPSC or by means of written competitive test held by SSC or any other authority)
15
7 ½
27
2. Direct recruitment on all-India basis otherwise than (a) above i. e. by SSC or any other authority by not conducting a written competitive test.
16 2/3
7 ½
27
3. Direct recruitment to Class III & IV posts (Group C&D posts) which normally attract candidates from a locality or region.
Generally in proportion to the population of SCs, STs and OBCs in the respective States/UTs
Posts filled by promotion in grades or services in which the element of direct recruitment, if any, does not exceed 75%
SC%
ST%
1. Through limited departmental competitive examination in Groups B, C & D
15% 7 '/2
2. By Selection from Group B to the lower rung or category in Group A or Groups B, C & D
15% 7 ½
3. On the basis of seniority subject to fitness in Groups A,B, C & D
15% 7 ½
Source: Annual Report, Ministry of Personnel, Public Grievances and Pensions,
Government of India, New Delhi, 2002-2003, Chapter 5, paragraph 5.2.

29
Reservation in Employment, Education and Legislature — Status and Emerging IssuesSukhadeo Thorat and Chittaranjan Senapati
Table: 1C, Incidences of Discrimination, Atrocities, and Crime againstSC/STs (Number of Cases Registered)
Year 1992 1993 1994 1995 1996 1997 1998 1999 2000 2001 Total
Types of cases Crime against SCs
Murder 616 510 546 571 543 513 516 506 526 763 5610
Rape 849 798 992 873 949 1037 923 1000 1083 1316 9820
Kidnapping & Abduction 213 246 251 276 281 243 253 228 268 400 2659
Dacoity 81 102 78 70 90 58 49 36 38 41 643
Robbery 265 197 259 218 213 162 150 109 108 133 1814
Arson 406 369 533 500 464 389 346 337 290 354 3988
Hurt NA NA 4542 4544 4585 3860 3809 3241 3497 4547 32625
Cases registered under Anti-Untouchability Act, 1955
2900 2531 1731 1528 1417 1216 724 678 672 633 14030
Cases registered under Prevention of Atrocity (SC/ST) Act, 1989
NA NA 14938 13925 9620 8070 7443 7301 7386 13113 81796
Others civil right violation 19592 20220 10038 10492 13278 12396 11425 11657 11587 12201 132886
Total 24922 24973 33908 32997 31440 27944 25638 25093 25455 33501 285871
Types of cases Crime against STs
Murder 103 105 105 75 94 95 66 80 59 167 949
Rape 334 328 385 369 314 315 331 384 447 573 3780
Kidnapping & Abduction 62 44 64 74 50 41 56 59 403 67 920
Dacoity 8 9 8 18 32 3 5 3 48 16 150
Robbery 19 21 8 27 21 8 15 8 5 73 205
Arson 47 26 36 40 51 29 38 43 2 108 420
Hurt NA NA 699 688 694 706 638 646 32 756 4859
Cases registered under Anti-Untouchability Act, 1955
248 150 63 71 72 88 50 45 31 58 876
Cases registered under Prevention of Atrocity (SC/ST) Act, 1989
Na Na 1316 1480 754 643 709 574 502 1667 7645
Others 3485 2969 2335 2656 2891 2716 2368 2608 2661 2732 27421
Total 4306 3652 5019 5498 4973 4644 4276 4450 4190 6217 47225
Source: Reports on Crime in India, National Crime Records Bureau, Ministry ofHome Affairs, GoI, New Delhi.

30
Indian Institute of Dalit StudiesVolume II, Number 05
Table 1 D, Cases Registered Under various Crimes on Scheduled Castesand Scheduled Tribes
Type of cases 1991 1999 2000
Total Cases Cases disposed off Conviction cases Acquittal cases Cases pending
8029 -
125 1367 6537
115878 8673 700 7420
107204
116131 12956 982
11605 100891
Percentage Share in total cases 1991 1999 2000
Cases disposed off Conviction cases
Acquittal cases Cases pending
- 1.56
17.03 81.42
7.48 0.60
6.40 92.51
11.16 0.85
9.99 86.88
Source: National Commission for Scheduled Castes and Scheduled Tribes, 1991,1999-2000 & 2000-2001.
31
Reservation in Employment, Education and Legislature — Status and Emerging IssuesSukhadeo Thorat and Chittaranjan Senapati
Tabl
e 1
E, R
eser
vati
ons
in E
mpl
oym
ent
in G
over
nmen
t Jo
bs (C
ombi
ned)
G
over
nmen
t PS
Us
Bank
s In
sura
nce
Yea
rs
SC
ST
Non
SC
/ST
All
SC
ST
Non
SC
/ST
All
SC
ST
Non
SC
/ST
All
SC
ST
Non
SC
/ST
1960
22
8497
37
704
1600
528
1866
729
NA
NA
NA
NA
NA
NA
NA
NA
NA
NA
NA
1970
29
1374
60
325
2147
584
2499
283
4064
0 12
309
4946
80
5476
29
NA
NA
NA
NA
NA
NA
NA
1978
44
8713
10
8054
2472
025
3028
792
2832
48
1284
40
1269
672
1681
360
5597
6 85
71
4847
84
5493
31
NA
NA
NA
1979
46
7712
12
0449
2504
968
3093
123
3004
05
1360
61
1340
900
1777
366
3397
8 53
01
2430
08
2822
87
NA
NA
NA
1980
49
0592
12
5004
25
1612
9 31
3172
5 31
7401
13
8364
13
6453
7 18
2030
2 68
042
1199
2 50
5889
58
5923
N
A
NA
NA
1989
56
8600
17
4101
27
2142
0 34
6412
1 42
3879
21
2460
15
3653
8 21
7287
7 12
2648
35
266
7117
00
8696
14
NA
NA
NA
1990
59
0108
18
5245
2701
700
3477
053
4284
91
2163
55
1543
989
2188
835
1269
74
3736
2 71
7921
88
2257
N
A
NA
NA
1993
60
4347
20
2068
27
2360
8 35
3002
3 36
9834
16
2000
15
5308
0 20
8491
4 13
3680
39
725
7245
48
8979
53
1486
5 54
23
8647
7
1999
59
1839
21
8653
27
3377
0 35
4426
2 33
6140
15
2286
14
3797
7 19
2640
3 13
5597
43
871
7155
56
8950
24
2045
0 84
13
9552
0
2000
58
2446
22
5917
28
1951
9 36
2788
2 32
4140
14
5581
13
3090
7 18
0062
8 14
3499
43
658
7027
65
8899
22
2028
3 80
58
9395
3
2004
* 54
0220
21
1345
25
1778
0 32
6934
5 23
6618
11
4481
94
3831
12
9493
0 13
3685
43
454
5819
10
7590
49
NA
NA
NA
Sour
ce:
Annu
al R
epor
ts M
inis
try
of P
erso
nnel
, Pu
blic
Gri
evan
ces
and
Pens
ions
, 19
8519
86,
1989
-199
0 a
nd 2
004-
2005
; An
nual
Rep
orts
,M
inis
try
of F
inan
ce,
1978
and
200
4200
5; A
nnua
l Rep
orts
, Pu
blic
Ent
erpr
ises
Sur
vey,
197
8-19
79,
1988
-198
9, 1
989-
1990
, 19
90-1
991,
1992
-199
3 to
200
4-20
05,
Min
istr
y of
Hea
vy I
ndus
trie
s &
Pub
lic

32
Indian Institute of Dalit StudiesVolume II, Number 05
Table 1 F, Total Government Employees (Decadal Point to Point)
As on Jan 1 SC ST Non SC/ST All 1978 787937 245065 4226481 5259483 1980 876035 275360 4386555 5537950 1989 1115127 421827 4969658 6506612 1990 1145573 438962 4963610 6548145 1999 1063576 414810 4887303 6365689 2000 1050085 415156 4853191 6318432 2001 1059674 420331 4808668 6288673 2004 910523 369280 4043521 5323324
Source: Annual Report Ministry of Personal, Public Grievances & Pensions, AnnualReport Ministry of Finance and Public Enterprises Survey, Annual ReportVol - I, Ministry of Heavy Industries & Public Interprises, GoI, New Delhi- 1978-2004.
Table 1 G, Combined Government Employment (Decadal Point to Pointin Absolute Numbers)
As on Jan 1 SC ST Non SC/ST All
1994 1124436 409732 5116266 6650434
2000 1070368 423214 4947144 6440726
Source: Annual Report Ministry of Personnel, Public Grievances & Pensions,Annual Report, Ministry of Finance and Public Enterprises Survey,Annual Report Vol - I, Ministry of Heavy Industries & PublicInterprises, GoI, New Delhi - 1993-2000.
Table 1 H, Percentage of Combind Government Employments includingInsurance
Years SC ST Non SC/ST All 1978 15.0 4.7 80.4 100 1980 15.8 5.0 79.2 100 1989 17.1 6.5 76.4 100 1990 17.5 6.7 75.8 100 1999 16.7 6.5 76.8 100 2000 16.6 6.6 76.8 100 2001 16.9 6.7 76.5 100 2004 17.1 6.9 76.0 100 1994* 16.9 6.2 76.9 100 2000* 16.6 6.6 76.8 100
* Percentage of government employees in Insurance.
Source: Annual Report Ministry of Personal, Public Grievances & Pensions, AnnualReport Ministry of Finance and Public Enterprises Survey, Annual ReportVol - I, Ministry of Heavy Industries & Public Interprises, GoI, New Delhi- 1978-2000.

33
Reservation in Employment, Education and Legislature — Status and Emerging IssuesSukhadeo Thorat and Chittaranjan Senapati
Table 1 I, SC Central Government Employment (Decadal Point to Pointby Categories)
On Jan 1 A B C D (Excluding Sweepers)
1960 177 569 67205 160546
1969 593 1513 139803 218034
1970 593 1513 139803 218034
1979 2204 4150 215762 245596
1980 2375 5055 235555 247607
1989 5204 10021 330330 223045
1990 5331 10497 336880 237400
1999 10558 13306 378115 189860
2000 10258 17332 376189 178667
2003 10256 26040 345718 158206
Source: Annual Report, 1985/86, 1989/90- 2004/2005, Ministry of Personnel, PublicGrievences and Pension, GoI, New Delhi.
Table 1J, Percentage Distribution of SC Employees in CentralGovernment Jobs (By Categories)
On Jan 1 A B C D Total
1960 0.1 0.2 29.4 70.3 100
1969 0.2 0.4 38.8 60.6 100
1970 0.1 0.6 41.9 57.5 100
1979 0.5 0.9 46.1 52.5 100
1980 0.5 1.0 48.0 50.5 100
1989 0.9 1.8 58.1 39.2 100
1990 0.9 1.8 57.1 40.2 100
1999 1.8 2.2 63.9 32.1 100
2000 1.8 3.0 64.6 30.7 100
2003 1.9 4.8 64.0 29.3 100
Source: Annual Report, 1985/86, 1989/90- 2004/2005, Ministry of Personnel, PublicGrievences and Pension, GoI, New Delhi.

34
Indian Institute of Dalit StudiesVolume II, Number 05
Table 1 K, ST Government Employment (Decadal Point to Point (ByCategories)
On Jan 1 A B C D (Excluding Sweepers)
1960 26 157 8289 29232
1969 100 156 26811 43246
1970 100 187 22608 37430
1979 435 579 53460 65975
1980 506 763 55334 68401
1989 1373 1720 100425 70583
1990 1593 2222 107103 74327
1999 3172 3512 145482 66487
2000 3251 4267 149950 68449
2003 3593 7863 138685 61204
Source: Annual Report, 1985/86, 1989/90- 2004/2005, Ministry of Personnel, PublicGrievences and Pension, GoI, New Delhi.
TABLE 1 L, Percentage Share of ST in Central Government Jobs (ByCategories)
On Jan 1 A B
C D
1960 0.07 0.42 21.98 77.53
1969 0.14 0.22 38.13 61.50
1970 0.17 0.31 37.48 62.05 T
1979 0.36 0.48 44.38 54.77
1980 0.40 0.61 44.27 54.72
1989 0.79 0.99 57.68 40.54
1990 0.86 1.20 57.82 40.12
1999 1.45 1.61 66.54 30.41
2000 1.4 1.9 66.4 30.3
2003 1.70 3.72 65.62 28.96
Source: Annual Reports Ministry of Personnel, Public Grievances and Pensions,19851986, 1989-1990 and 2004-2005; Annual Reports, Ministry of Finance,1978 and 20042005; Annual Reports, Public Enterprises Survey, 1978-1979,1988-1989, 1989-1990, 1990-1991, 1992-1993 to 2004-2005, Ministry of HeavyIndustries & Public
Table 1 M, PSEs Employment (Decadal Point to Point)On Jan 1 A B C D (Excluding Sweepers)
1971 163 549 19302 20626 1979 1917 3605 203974 90909 1980 2726 5003 230505 79167 1989 10825 13957 270197 128900 1990 11215 14938 270594 131744 1999 21005 18644 199585 16906 2000 21125 19355 191931 91729 2004 20006 19802 141357 55453
Source: Public Enterprises Survey, Annual Report, Volume 1, Ministry of HeavyIndustries and Public Enterprises, 1978-1979, 1988-1989, 1989-1990, 1990-1991 and 1991-1993 to 2004-2005, New Delhi.

35
Reservation in Employment, Education and Legislature — Status and Emerging IssuesSukhadeo Thorat and Chittaranjan Senapati
Table 1 N, Percentage Distribution of SC Employees in PSEs, 1971-2004(By Categories)
On Jan 1 A B C D (Excluding Sweepers) 1971 0.40 1.35 47.50 50.75 100 1979 Ö.64 1.20 67.90 30.26 100 1980 0.86 1.58 72.62 24.94 100 1989 2.55 3.29 63.74 30.41 100 1990 2.62 3.49 63.15 30.75 100 1999 6.25 5.55 59.38 28.83 100 2000 6.52 5.97 59.21 28.30 100 2004 8.45 8.37 59.74 23.44 100
Source: Public Enterprises Survey, Annual Report, Volume 1, Ministry of HeavyIndustries and Public Enterprises, 1978-1979, 1988-1989, 1989-1990, 1990-1991 and 1991-1993 to 2004-2005, New Delhi.
Table 1 O, PSEs Employment (Decadal Point to Point)
On Jan 1 A B C D (Excluding Sweepers) 1971 53 57 4519 7680 1979 440 833 94582 40206 1980 623 1329 98329 38083 1989 2423 3830 125101 81106 1990 2702 4289 126158 83206 1999 5838 7180 90551 48717 2000 6057 7317 85744 46463 2004 6032 8980 67396 32073
Source: Public Enterprises Survey, Annual Report, Volume 1, Ministry of HeavyIndustries and Public Enterprises, 1978-1979, 1988-1989, 1989-1990, 1990-1991 and 1991-1993 to 2004-2005, New Delhi.
Table 1 P, Percentage of ST Employees in PSEs, 1971-2004 (ByCategories)
On Jan 1 A B C D (Excluding Sweepers) 1971 0.43 0.46 36.71 62.39 100 1979 0.32 0.61 69.51 29.55 100 1980 0.45 0.96 71.07 27.52 100 1989 1.14 1.80 58.88 38.17 100 1990 1.25 1.98 58.31 38.46 100 1999 3.83 4.71 59.46 31.99 100 2000 4.16 5.03 58.90 31.92 100 2004 5.27 7.84 58.87 28.02 100
Source: Public Enterprises Survey, Annual Report, Volume 1, Ministry of HeavyIndustries and Public Enterprises, 1978-1979, 1988-1989, 1989-1990, 1990-1991 and 1991-1993 to 2004-2005, New Delhi.
Table 1 Q, SC Bank Employees (Decadal Point to Point by Categories)
Years Officers Clerks Sub Staff
1978 2238 30775 22963 1980 4339 37690 26013 1988 18864 63548 35203 1990 21756 66584 38634 1999 26861 68787 39949 2000 31871 67975 43653 2004 36914 58421 38350
Source: Annual Report 1978 – 2004/ 2005, Ministry of Finance, GoI

36
Indian Institute of Dalit StudiesVolume II, Number 05
Table 1 R, Percentage Distribution of SC Employees in Public SectorBanks (By Categories)
Years Officers Clerks Sub Staff Total 1978 4.00 54.98 41.02 100 1980 6.38 55.39 38.23 100 1988 16.07 53.95 29.98 100 1990 17.13 52.44 30.43 100 1999 19.81 50.73 29.46 100 2000 22.21 47.37 30.42 100 2004 27.61 43.70 28.69 100
Source: Annual Report 1978 – 2004/ 2005, Ministry of Finance, GoI
Table 1 S, ST Bank Employees (Decadal Point to Point by Categories)Years Officers Clerks Sub Staff
1978 182 5438 2951 1980 911 7078 4003 1988 4990 17879 7946 1990 6432 20886 10044 1999 10412 22321 11138 2000 10749 21755 11154 2004 14489 18358 10607
Source: Annual Report 1978 – 2004/ 2005, Ministry of Finance, GoI
Table 1 T, Percentage Distribution of ST Employees in Public SectorBanks (By Categories)
Years Officers Clerks Sub Staff Total 1978 2.12 63.45 34.43 100 1980 7.60 59.02 33.38 100 1988 16.19 58.02 25.79 100 1990 17.22 55.90 26.88 100 1999 23.73 50.88 25.39 100 2000 24.62 49.83 25.55 100 2004 33.34 42.25 24.41 100
Source: Annual Report 1978 – 2004/ 2005, Ministry of Finance, GoI
Table 1 U, SC Insurance Employment, 1993-2000 (Decadel Point toPoint by Category)
Years A B C D 1993 1023 1898 8910 3034 2000 2374 2721 12645 2543
Source: Annual Report 1978 to 2004-2005, Ministry of Finance, GoI.
Table 1 V, Percentage Distribution of SC Employees in Insurance Jobs(By Categories)
Years A B C D Total 1993 6.88 12.77 59.94 20.41 100 2000 11.70 13.42 62.34 12.54 100
Source: Annual Report 1978 to 2004-2005, Ministry of Finance, GoI.

37
Reservation in Employment, Education and Legislature — Status and Emerging IssuesSukhadeo Thorat and Chittaranjan Senapati
Table 1 W, ST Insurance Employment, 1993-2000 (Decadal Point toPoint by Categories)
A B C D 237 565 3798 823 740 856 5632 830
Source: Annual Report 1978 to 2004-2005, Ministry of Finance, GoI.
Table 1 X, Percentage Distribution of ST Employees in Insurancet Jobs(By Categories)
A B C D Total 4.37 10.42 70.04 15.18 100 9.18 10.62 69.89 10.30 100
Source: Annual Report 1978 to 2004-2005, Ministry of Finance, GoI.
Table 1 Y, Member of Parliament by Social Groups from 5th to 14thParliament, All India
Actual No. of Members of Parliament Percentage Share of Members of Parliament
S.No.
Election Year Year SC ST Other Total SC ST Other Total
1 5th Lok Sabha 1971 75 33 440 548 13.69 6.02 80.29 100 2 6th Lok Sabha 1977 64 33 462 559 11.45 5.90 82.65 100 3 7th Lok Sabha 1980 81 31 453 565 14.34 5.49 80.18 100 4 8th Lok Sabha 1984 79 43 449 571 13.84 7.53 78.63 100 5 9th Lok Sabha 1989 81 37 413 531 15.25 6.97 77.78 100 6 10th Lok Sabha 1991 78 39 427 544 14.34 7.17 78.49 100 7 11th Lok Sabha 1996 79 38 428 545 14.50 6.97 78.53 100 8 12th Lok Sabha 1998 74 39 432 545 13.58 7.16 79.27 100 9 13th Lok Sabha 1999 83 41 443 567 14.64 7.23 78.13 100 10 14th Lok Sabha 2004 75 41 427 543 13.81 7.55 78.64 100
Sources: www.parliamentofindia.nic.in.