Embed Size (px)
Citation preview

Research ArticleDevelopment of a Point Pyroshock Source Simulator
Ju-won Jeong,1 Jae hyuk Lim,2 Kyung-won Kim,3 and Jung-ju Lee1
1Department of Mechanical Engineering, Korea Advanced Institute of Science and Technology (KAIST),Daejeon 34141, Republic of Korea2Department of Mechanical Engineering, Chonbuk National University, Jeonju 54896, Republic of Korea3Satellite Mechanical Team, Korea Aerospace Research Institute (KARI), Daejeon 34133, Republic of Korea
Correspondence should be addressed to Jung-ju Lee; [email protected]
Received 11 October 2016; Accepted 7 December 2016; Published 6 February 2017
Academic Editor: Georges Kouroussis
Copyright © 2017 Ju-won Jeong et al. This is an open access article distributed under the Creative Commons Attribution License,which permits unrestricted use, distribution, and reproduction in any medium, provided the original work is properly cited.
We developed a point pyroshock source simulator (PPSS) for the study on the source isolation approach (SIA) in this study. In spiteof the potentiality of the SIA for avionics protection against pyroshock, it has rarely been investigated due to lack of pyroshocksource simulators. To overcome such a situation, we proposed the PPSS using a mechanically excited tuned resonator simulating arelease device itself.The PPSS was designed using explicit finite element analysis and Seigel’s gas gunmodel. To verify the proposedPPSS, the prototype was fabricated and tested. From the results, we have shown that the prototype of the PPSS simulates a near-fieldpyroshock and is able to evaluate the SIA.
1. Introduction
Many separation events occur in aerospace systems: stageseparation of a space launch vehicle, a separation betweena spacecraft and a space launch vehicle, and solar arraydeployment from a satellite. These separation processesare carried out by various release devices. In particular,the operation of release devices emits pyroshock whichis basically a broadband high frequency stress wave. Atthe beginning of the space race, Titan I and Atlas, firstgeneration intercontinental ballisticmissiles, exploded on thelaunch pad due to relay malfunction in the safety destructsystem induced by pyroshock [1, 2]. After the first report ofpyroshock induced failure in the early 1960s,many pyroshockinduced failures have continuously occurred. The number ofpyroshock induced failures is 14 times greater than that ofvibration induced failures. Furthermore, approximately 70%of the pyroshock induced failures resulted in catastrophicloss of mission [3]. It was revealed that the main cause isthe vulnerability of avionics to pyroshock. For this reason,avionics require pyroshock testing and they are commonlymounted through isolators if they cannot survive underpyroshock environments: isolating avionics is called anequipment isolation approach (EIA) as illustrated in Figure 1.
The EIA is a well-developed method for avionics pro-tection against pyroshock. The key principle of the EIA isthe mechanical low-pass filter effect of conventional rubberisolators induced by their low stiffness [4, 5]. Although theycan efficiently isolate avionics from pyroshock, their lowstiffness may make avionics susceptible to both quasi-staticflight loads and structural vibration below 100Hz [6, 7].Furthermore, sway-space, electrical or thermal groundings,and equipment alignment should be also considered. Dueto these reasons, design of an isolated avionic equipmentrequires 25 steps [6]. In contrast, a source isolation approach(SIA) can be an ultimate solution for avionics protectionagainst pyroshock because it provides early protection priorto propagation of pyroshock, as shown in Figure 1. Sucha characteristic of the SIA is expected to minimize therequired number of isolation treatments without any negativeinfluences on avionics.
However, few studies on the SIA were carried out mostlyby using actual flight structure and pyroshock sources [2,8–12]. It is costly and time-consuming to develop sourceisolators using full-scale or actual system and thus a suit-able pyroshock simulator is essential to investigate the SIA.Indeed, the prerequisite for the study on the SIA is apyroshock source simulator which, like an actual source,
HindawiShock and VibrationVolume 2017, Article ID 6834601, 16 pageshttps://doi.org/10.1155/2017/6834601

2 Shock and Vibration
Satellite body panel
Avionicbox 1
Avionicbox 2
Avionicbox 3
box 4 Avionic
box 5Avionic
box 6Avionic
box 7Avionic
Avionicbox 8
Shock source
Stress wave
(a)
Avionicbox 2
Avionicbox 3
box 4 Avionic
box 5Avionic
box 7Avionic
Avionicbox 8
Isolator
Attenuated stress wave
box 6Avionic
Avionicbox 1
Satellite body panel
(b)
Figure 1: Comparison between the EIA and the SIA. (a) The EIA. (b) The SIA.
Pyroshocksource
simulator
Fixture(simulated structure)
Testitem
Propagatingstress wave
Joints
Figure 2: Concept of a pyroshock source simulator.
generates stress waves propagating on its fixture (a simulatedstructure) and has bolted joints for attachment, as shownin Figure 2. Note that source isolators can be insertedinto the joints between an actual source and its structureso that pyroshock could be absorbed or reflected beforepropagation. But the previous pyroshock simulators such aselectrodynamic shakers and mechanically excited resonantfixture techniques shown in Figure 3 are fundamentallybased on their vibrating fixtures whose response satisfiesthe shock response spectrum (SRS) requirements [13–22].In other words, their dominant behavior is not stress wavepropagation but vibration of the whole fixture. Anothersimulation method, pyrotechnically excited resonant fixturetechniques, is suitable to simulate stress wave propagationnear a pyroshock source but they do not have joints like anactual source [13–16, 23]. Above all, they inherently have lowrepeatability and are costly due to use of an explosive charge.
Recently, Dilhan et al. developed a gun-like pyroshock gen-erator using an explosive charge [24]. It is a good pyroshockgenerator satisfying their intention, but its stresswave directlypropagates on its fixture in the same manner as conventionalpyrotechnically excited resonant fixture techniques.
Bateman and Titulaer developed pneumatic pyroshocksimulators to investigate source isolators for V-band clamps(shown in Figure 4) which are a pyroshock source having thecharacteristics of both point and line sources [25, 26]. Thesesimulators provide the simulation of pyroshock inducedby a V-band clamp and also have joints so that sourceisolators could be inserted. However, according to authors’best knowledge, there are no pyroshock simulators suitable toinvestigate the SIA for point sources such as explosive bolts,separation nuts, and pin-pullers. As previously mentioned(Figure 2), a real point source itself should be simulated sothat source isolators could be inserted between the simulatedpoint source and structure. Therefore, the goal of this workis to develop a point pyroshock source simulator (PPSS) byusing a tuned bar-type resonator excited by a pneumaticallypropelled projectile. This tuned resonator generates stresswaves radially propagating on a simulated structure, andsource isolators can be inserted between the resonator andthe simulated structure for evaluation of their pyroshockattenuation. The energy of the stress waves is concentratedat the knee frequency of a target environment especially,thereby minimizing the required trials and errors for tuningthe knee frequency of the PPSS.The PPSS was designed usinga systematic design procedure based on explicit finite elementanalysis (FEA) and Seigel’s preburned propellant ideal gasgun (PPIG) model [27]. According to the design result,

Shock and Vibration 3
Form pad
Test item
Table
Mounting plate
Pneumaticimpactor
(a)
Test
item
Impactor Resonant bar
(b)
Test item
Resonant plate
Impa
ctor
(c)
Figure 3: Schematic diagrams of resonant fixture techniques. (a) MIPS (mechanical impact pyroshock simulator). (b) A bar-type tunedresonant fixture. (c) A plate-type tuned resonant fixture.
we fabricated the prototype for verification. The simulationtarget of the PPSS was the pyroshock environment gener-ated by the ESA M6 pyrotechnic separation nut and threesimulated environments were effectively equivalent to thetarget with high repeatability. To confirm the functionalityof the PPSS as a source isolator evaluator, we tested the SIAtried during Viking program. The principle of the SIA isimprovement of joint attenuation by inserting spacers intopyroshock path and the typical characteristic of the SIA isspectrum peak attenuation. In the test on the SIA using thePPSS, the spectrum peak attenuation was clearly observed,thereby confirming the functionality of the PPSS as a sourceisolator evaluator. The characteristics of the proposed PPSSare summarized in Table 1, including comparison of theprevious simulators.
2. Conceptualization
The major aim of the PPSS is to simulate an actual pointpyroshock source itself for study on the SIA. To pursue highrepeatability, low operating cost, and efficient operation, weplanned to use metal-to-metal impact as means of pyroshockgeneration, not both an explosive charge and an actual releasedevice. Figure 5 shows our target environment producedfrom an M6 pyrotechnic separation nut and ALU benchof the European Space Agency (ESA) [28]. ALU bench isa freely suspended aluminum plate whose dimensions are1,000mm × 1,000mm × 5mm and is a standard pyroshocktest bench of ESA to characterize various release devices. ALU
bench simulates the wall plate of a satellite at which avionicboxes and a pyroshock source are attached. For consistency,a fixture identical to ALU bench was intended to be appliedto the PPSS in that structure configuration strongly influencespyroshock intensity.Themain difference betweenALUbenchand the PPSS is that a release device simulator modulegenerates pyroshock instead of actual sources. This makesefficient and low cost testing possible because release devicesare quite costly and their pyroshock environments are notinherently repeatable.
Generally, it is impossible to make a simulated pyroshockenvironment completely identical to that of a target. Thus,standards such as NASA-STD-7003A [29] and MIL-STD-810G [30] provide tolerance guidelines for pyroshock sim-ulation. According to the two standards, a simulated envi-ronment is regarded effectively equivalent if the followingis satisfied: the simulated SRS magnitudes are within thetolerances (SRS tolerance condition), and at least 50%of themare larger than the nominal specification (SRS magnitudecondition). We set the tolerances according to NASA-STD-7003A, as shown in Figure 5.
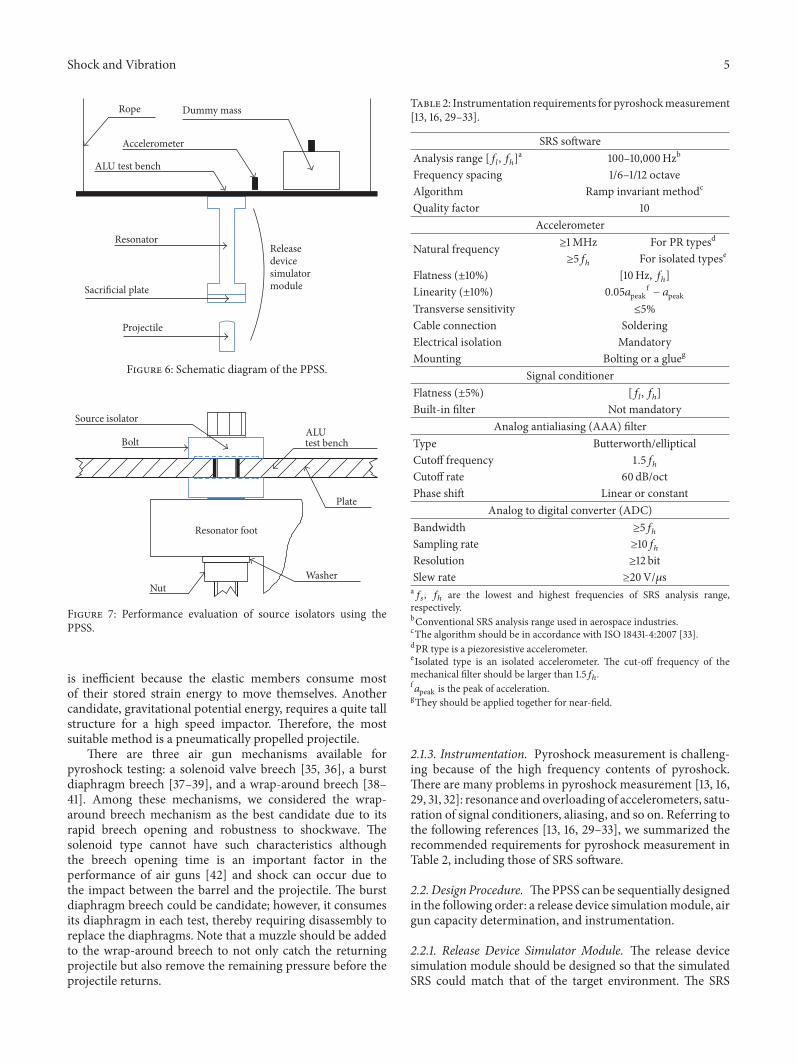
2.1. Preliminary Design. The components of the PPSS are arelease device simulator module, a launcher, a freely sus-pended plate-type fixture (ALUbench), and instrumentation,as shown in Figure 6.The key component is the release devicesimulatormodule consisting of a tuned resonator, a sacrificialplate, and a projectile. Also, a dummy mass can be added forsimulation of an avionic box if required.

4 Shock and Vibration
Table 1: Comparison of the PPSS with the other pyroshock simulators.
Simulator Simulation target Simulated field Resonator Joint simulation ExcitationMERFTa Only pyroshock environment at the
mounting point of avionicsFar and mid No No Mechanically
PERFTb Near No No PyrotechnicallyVBSc V-band Mid Yes Yes MechanicallyPPSSd Point sources Near Yes Yes MechanicallyaMechanically excited resonant fixture technique [13–22].bPyrotechnically excited resonant fixture technique [13–16, 23].cV-band simulator [25, 26].dPoint pyroshock source simulator (still not developed).
(a) (b)
Mild detonating fuse
Frangible joint
(c)
V-band
Structure 1
Structure 2
CBOD (point source)
(d)
Figure 4: Point sources: (a) separation nut and (b) explosive bolt;line source: (c) frangible joint; combined source: (d) V-band clamp.
2.1.1. Release Device Simulator Module. The impacted res-onator generates a radially propagating stress wave on ALUbench. Note that the dominant frequency of the stress waveis determined by the first longitudinal natural frequency ofthe resonator. Thus, the SRS knee frequency of the PPSS canbe matched to that of the target environment without trialsand errors, by adjusting the length of the resonator. Also, the
10
100
1,000
10,000
100,000
100
Acce
lera
tion
(g)
Natural frequency (Hz)
TargetEnvelopeTolerances
1,000 10,000
+9 dB tolerance
+6 dB tolerance
−6 dB tolerance
Figure 5: Target pyroshock environment (the target data was takenfrom [28]). The tolerances are ±6 dB up to 3 kHz and +9 dB/−6 dBfor natural frequencies above 3 kHz according toNASA-STD-7003A[29].
resonator also provides two bolt joints like release devices sothat source isolators could be inserted into the two bolt jointsfor performance evaluation of source isolators, as shown inFigure 7. In the case of the EIA, it can be evaluated by using adummymass in the samemanner. To ensure the repeatabilityof the PPSS, the sacrificial plate should be attached to theimpacted end of the resonator and be replaced for each test.
2.1.2. Launcher. Considering that pyroshock results in essen-tially no velocity change in themounting structure of a releasedevice [30], simulated pyroshock environments should alsohave such a characteristic. To this end, it is necessary to usea light projectile having high speed. Pneumatic energy canbe highly concentrated as a form of compressed air, therebytransferring the concentrated energy to the projectile kineticenergy. In contrast, a projectile propelled by elastic members
Shock and Vibration 5
Releasedevicesimulatormodule
ALU test bench
Rope Dummy mass
Sacrificial plate
Projectile
Resonator
Accelerometer
Figure 6: Schematic diagram of the PPSS.
Resonator foot
Nut
Plate
Bolt
Washer
ALUtest bench
Source isolator
Figure 7: Performance evaluation of source isolators using thePPSS.
is inefficient because the elastic members consume mostof their stored strain energy to move themselves. Anothercandidate, gravitational potential energy, requires a quite tallstructure for a high speed impactor. Therefore, the mostsuitable method is a pneumatically propelled projectile.
There are three air gun mechanisms available forpyroshock testing: a solenoid valve breech [35, 36], a burstdiaphragm breech [37–39], and a wrap-around breech [38–41]. Among these mechanisms, we considered the wrap-around breech mechanism as the best candidate due to itsrapid breech opening and robustness to shockwave. Thesolenoid type cannot have such characteristics althoughthe breech opening time is an important factor in theperformance of air guns [42] and shock can occur due tothe impact between the barrel and the projectile. The burstdiaphragm breech could be candidate; however, it consumesits diaphragm in each test, thereby requiring disassembly toreplace the diaphragms. Note that a muzzle should be addedto the wrap-around breech to not only catch the returningprojectile but also remove the remaining pressure before theprojectile returns.
Table 2: Instrumentation requirements for pyroshockmeasurement[13, 16, 29–33].
SRS softwareAnalysis range [𝑓𝑙, 𝑓ℎ]a 100–10,000Hzb
Frequency spacing 1/6–1/12 octaveAlgorithm Ramp invariant methodc
Quality factor 10Accelerometer
Natural frequency ≥1MHz For PR typesd≥5𝑓ℎ For isolated typese
Flatness (±10%) [10Hz, 𝑓ℎ]Linearity (±10%) 0.05𝑎peakf − 𝑎peakTransverse sensitivity ≤5%Cable connection SolderingElectrical isolation MandatoryMounting Bolting or a glueg
Signal conditionerFlatness (±5%) [𝑓𝑙, 𝑓ℎ]Built-in filter Not mandatory
Analog antialiasing (AAA) filterType Butterworth/ellipticalCutoff frequency 1.5𝑓ℎCutoff rate 60 dB/octPhase shift Linear or constant
Analog to digital converter (ADC)Bandwidth ≥5𝑓ℎSampling rate ≥10𝑓ℎResolution ≥12 bitSlew rate ≥20V/𝜇sa𝑓𝑠, 𝑓ℎ are the lowest and highest frequencies of SRS analysis range,respectively.bConventional SRS analysis range used in aerospace industries.cThe algorithm should be in accordance with ISO 18431-4:2007 [33].dPR type is a piezoresistive accelerometer.eIsolated type is an isolated accelerometer. The cut-off frequency of themechanical filter should be larger than 1.5𝑓ℎ.f𝑎peak is the peak of acceleration.gThey should be applied together for near-field.
2.1.3. Instrumentation. Pyroshock measurement is challeng-ing because of the high frequency contents of pyroshock.There are many problems in pyroshock measurement [13, 16,29, 31, 32]: resonance and overloading of accelerometers, satu-ration of signal conditioners, aliasing, and so on. Referring tothe following references [13, 16, 29–33], we summarized therecommended requirements for pyroshock measurement inTable 2, including those of SRS software.
2.2. Design Procedure. ThePPSS can be sequentially designedin the following order: a release device simulationmodule, airgun capacity determination, and instrumentation.
2.2.1. Release Device Simulator Module. The release devicesimulation module should be designed so that the simulatedSRS could match that of the target environment. The SRS
6 Shock and Vibration
Table 3: Design variables of the release device simulator module.
Component Initially defined variables Major variableParameter Value
Resonator
𝑊𝑅 30mm
𝐿𝑅𝐿𝑓 30mmℎ𝑓 15mm
Material SCM 435a
Projectile
Φ𝑝 20mm
V𝑃𝐿𝑝 40mm𝑅𝑃 200mm
Material SNCM 440aSacrificial plate ℎ𝑆 10mm —
Material SS400aHeat-treated.
Acce
lera
tion
Natural frequency
(a)(d)(b)
(c)(e) (f)
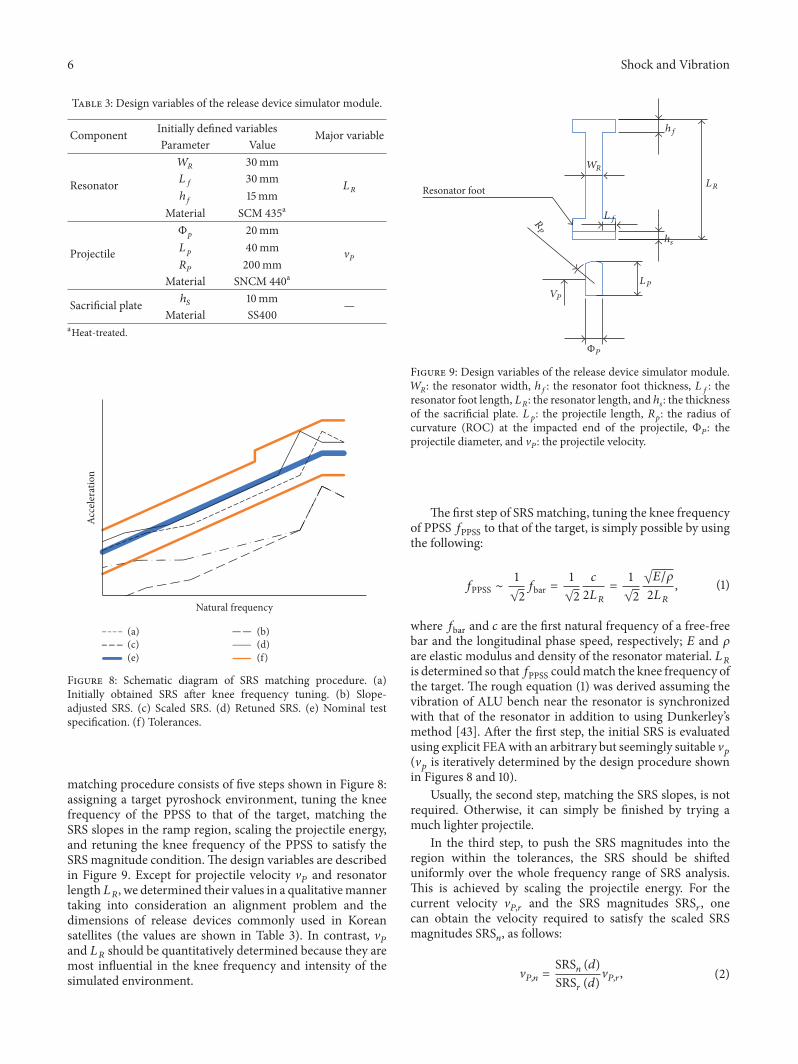
Figure 8: Schematic diagram of SRS matching procedure. (a)Initially obtained SRS after knee frequency tuning. (b) Slope-adjusted SRS. (c) Scaled SRS. (d) Retuned SRS. (e) Nominal testspecification. (f) Tolerances.
matching procedure consists of five steps shown in Figure 8:assigning a target pyroshock environment, tuning the kneefrequency of the PPSS to that of the target, matching theSRS slopes in the ramp region, scaling the projectile energy,and retuning the knee frequency of the PPSS to satisfy theSRS magnitude condition.The design variables are describedin Figure 9. Except for projectile velocity V𝑃 and resonatorlength 𝐿𝑅, we determined their values in a qualitativemannertaking into consideration an alignment problem and thedimensions of release devices commonly used in Koreansatellites (the values are shown in Table 3). In contrast, V𝑃and 𝐿𝑅 should be quantitatively determined because they aremost influential in the knee frequency and intensity of thesimulated environment.
hf
LR
hs
LP
Lf
VP
RP
WR
Resonator foot
ΦP
Figure 9: Design variables of the release device simulator module.𝑊𝑅: the resonator width, ℎ𝑓: the resonator foot thickness, 𝐿𝑓: theresonator foot length, 𝐿𝑅: the resonator length, and ℎ𝑠: the thicknessof the sacrificial plate. 𝐿𝑝: the projectile length, 𝑅𝑝: the radius ofcurvature (ROC) at the impacted end of the projectile, Φ𝑃: theprojectile diameter, and V𝑃: the projectile velocity.
The first step of SRSmatching, tuning the knee frequencyof PPSS 𝑓PPSS to that of the target, is simply possible by usingthe following:
𝑓PPSS ∼ 1√2𝑓bar =1√2
𝑐2𝐿𝑅 =1√2√𝐸/𝜌2𝐿𝑅 , (1)
where 𝑓bar and 𝑐 are the first natural frequency of a free-freebar and the longitudinal phase speed, respectively; 𝐸 and 𝜌are elastic modulus and density of the resonator material. 𝐿𝑅is determined so that𝑓PPSS couldmatch the knee frequency ofthe target. The rough equation (1) was derived assuming thevibration of ALU bench near the resonator is synchronizedwith that of the resonator in addition to using Dunkerley’smethod [43]. After the first step, the initial SRS is evaluatedusing explicit FEAwith an arbitrary but seemingly suitable V𝑝(V𝑝 is iteratively determined by the design procedure shownin Figures 8 and 10).
Usually, the second step, matching the SRS slopes, is notrequired. Otherwise, it can simply be finished by trying amuch lighter projectile.
In the third step, to push the SRS magnitudes into theregion within the tolerances, the SRS should be shifteduniformly over the whole frequency range of SRS analysis.This is achieved by scaling the projectile energy. For thecurrent velocity V𝑃,𝑟 and the SRS magnitudes SRS𝑟, onecan obtain the velocity required to satisfy the scaled SRSmagnitudes SRS𝑛, as follows:
V𝑃,𝑛 = SRS𝑛 (𝑑)SRS𝑟 (𝑑) V𝑃,𝑟, (2)
Shock and Vibration 7
PPSS design
Input initialdesign
variables
Explicit FEA
Withintolerance?
SRS analysis
Projectile energyscaling
Magnitudecondition? End
Matchedslopes?
Reduceprojectile mass
Targetenvironmentassignment
Yes
Yes
Yes
No
No
Tuningknee frequency
No
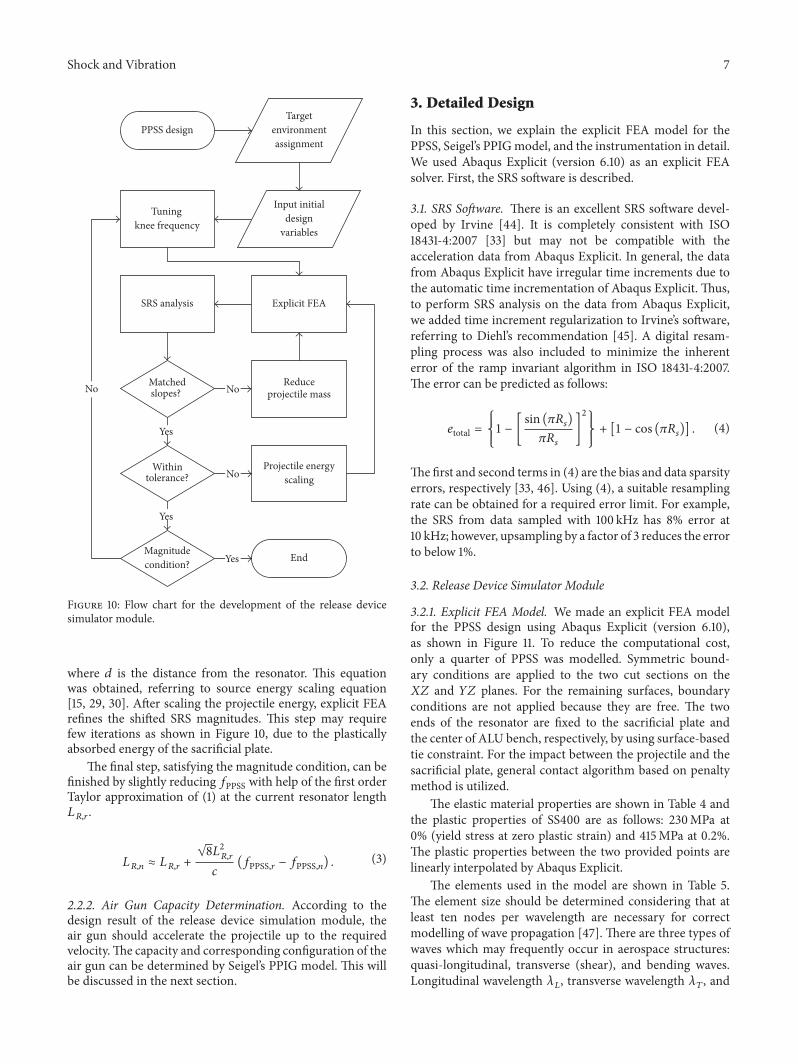
Figure 10: Flow chart for the development of the release devicesimulator module.
where 𝑑 is the distance from the resonator. This equationwas obtained, referring to source energy scaling equation[15, 29, 30]. After scaling the projectile energy, explicit FEArefines the shifted SRS magnitudes. This step may requirefew iterations as shown in Figure 10, due to the plasticallyabsorbed energy of the sacrificial plate.
The final step, satisfying the magnitude condition, can befinished by slightly reducing 𝑓PPSS with help of the first orderTaylor approximation of (1) at the current resonator length𝐿𝑅,𝑟.
𝐿𝑅,𝑛 ≈ 𝐿𝑅,𝑟 + √8𝐿2𝑅,𝑟𝑐 (𝑓PPSS,𝑟 − 𝑓PPSS,𝑛) . (3)
2.2.2. Air Gun Capacity Determination. According to thedesign result of the release device simulation module, theair gun should accelerate the projectile up to the requiredvelocity.The capacity and corresponding configuration of theair gun can be determined by Seigel’s PPIG model. This willbe discussed in the next section.
3. Detailed Design
In this section, we explain the explicit FEA model for thePPSS, Seigel’s PPIGmodel, and the instrumentation in detail.We used Abaqus Explicit (version 6.10) as an explicit FEAsolver. First, the SRS software is described.
3.1. SRS Software. There is an excellent SRS software devel-oped by Irvine [44]. It is completely consistent with ISO18431-4:2007 [33] but may not be compatible with theacceleration data from Abaqus Explicit. In general, the datafrom Abaqus Explicit have irregular time increments due tothe automatic time incrementation of Abaqus Explicit. Thus,to perform SRS analysis on the data from Abaqus Explicit,we added time increment regularization to Irvine’s software,referring to Diehl’s recommendation [45]. A digital resam-pling process was also included to minimize the inherenterror of the ramp invariant algorithm in ISO 18431-4:2007.The error can be predicted as follows:
𝑒total = {1 − [ sin (𝜋𝑅𝑠)𝜋𝑅𝑠 ]2} + [1 − cos (𝜋𝑅𝑠)] . (4)
The first and second terms in (4) are the bias and data sparsityerrors, respectively [33, 46]. Using (4), a suitable resamplingrate can be obtained for a required error limit. For example,the SRS from data sampled with 100 kHz has 8% error at10 kHz; however, upsampling by a factor of 3 reduces the errorto below 1%.
3.2. Release Device Simulator Module
3.2.1. Explicit FEA Model. We made an explicit FEA modelfor the PPSS design using Abaqus Explicit (version 6.10),as shown in Figure 11. To reduce the computational cost,only a quarter of PPSS was modelled. Symmetric bound-ary conditions are applied to the two cut sections on the𝑋𝑍 and 𝑌𝑍 planes. For the remaining surfaces, boundaryconditions are not applied because they are free. The twoends of the resonator are fixed to the sacrificial plate andthe center of ALU bench, respectively, by using surface-basedtie constraint. For the impact between the projectile and thesacrificial plate, general contact algorithm based on penaltymethod is utilized.
The elastic material properties are shown in Table 4 andthe plastic properties of SS400 are as follows: 230MPa at0% (yield stress at zero plastic strain) and 415MPa at 0.2%.The plastic properties between the two provided points arelinearly interpolated by Abaqus Explicit.
The elements used in the model are shown in Table 5.The element size should be determined considering that atleast ten nodes per wavelength are necessary for correctmodelling of wave propagation [47]. There are three types ofwaves which may frequently occur in aerospace structures:quasi-longitudinal, transverse (shear), and bending waves.Longitudinal wavelength 𝜆𝐿, transverse wavelength 𝜆𝑇, and

8 Shock and Vibration
Projectile with initial velocity
Acceleration datarecording point
from the source
Sacrificial plate
Resonator
Tie constraint
ALU bench
50mm apart
x
y
z
Figure 11: Schematic view of explicit FE model and boundary conditions for PPSS design.
Table 4: Material properties of resonator components.
Part Material 𝐸a 𝜌b ]c
Test bench Aluminum 72 2800 0.33Resonator SCM435
205 7850 0.29Projectile SNCM440Sacrificial SS400aElasticmodulus (GPa).bDensity (kg/m3).cPoisson’s ratio.
bending wavelength 𝜆𝐵 can be determined based on thefollowing equations:
𝜆𝐿 = 1𝑓√ 𝐸𝛽𝜌,
𝜆𝑇 = 1𝑓√𝐺𝜌 ,
𝜆𝐵 = √2𝜋𝑓 (𝐸ℎ3/𝛽12𝜌ℎ )0.25 ,
(5)
where 𝑓, 𝛽, 𝐺, and ℎ are frequency, a coefficient of structureconfiguration, shear modulus, and the thickness of a beam ora plate, respectively [48]. 𝛽 is one but is 1 − ]2 for a plate (] isPoisson’s ratio). According to the SRS requirements inTable 2,
Table 5: Elements and their size.
Component Typea Size (mm) Wavelengthb (mm)Sacrificial plate C3D8Rc 1 × 1 × 1 511Resonator 5 × 5 × 5ALU bench S4Rd 7.5 × 7.5 507e69.7faRegardless of element type, enhanced hourglassing option was applied foraccurate bending analysis [34].bWavelengths at 10 kHz which is the highest frequency of SRS analysis.cA first-order solid element with reduced integration.dA first-order shell element with reduced integration.eLongitudinal wavelength.f Bending wavelength.
the corresponding wavelengths were calculated, as shown inTable 5. Subsequently, the element sizes were determinedconsidering the following: the wavelengths, plastic deforma-tion of the sacrificial plate, and the tie constraints.
The most critical consideration when applying explicitFEA to pyroshock is sampling and aliasing. To satisfy thestability limit of explicit FEA [34], quite small time incre-ments are inevitable in explicit FEA. Because recording allof the data is practically impossible due to the small timeincrements, the common process of data recording in explicitFEA is to sample data with much larger time intervals thanthe original time increments. Thus, sampling in explicitFEA must be performed according to Shannon’s sampling

Shock and Vibration 9
10
100
1,000
10,000
100,000
100
Acce
lera
tion
(g)
Natural frequency (Hz)
Aliasing free
1,000 10,000
30kHz100 kHz
Figure 12: SRS distortion due to aliasing in the explicit FEA model.
theorem. However, in the case of pyroshock, it is difficultto satisfy Shannon’s theorem due to its broadband highfrequency feature. Furthermore, force as well as accelera-tion obtained by explicit FEA inherently oscillates severelywith high frequency numerical noises compared to velocityand displacement [49]. Nevertheless, all of the previousresearchers who introduced explicit FEA to pyroshock didnot recognize this sampling issue [19, 21, 50–53]. At first, wealso cannot recognize the effect of aliasing on explicit FEA.During the parameter study using the model described inFigure 11, we could not find the trends because aliasing dis-torts acceleration time history in a random manner. Thus, toinvestigate the effect of aliasing on SRS analysis, we obtainedthree SRSs from the PPSS model at the measurement point(50mm apart from the resonator), as shown in Figure 12.All of the conditions were identical except for a samplingrate. Aliasing-free SRS was obtained by recording the wholeacceleration signal: no aliasing due to no sampling. Samplingrate of 100 kHz satisfies the sampling requirement for the SRSanalysis whose highest frequency is 10 kHz [44, 46]; however,the signal contents below 2 kHz were severely distorted (themaximum error was 200%).
There are two strategies for removal of aliasing in explicitFEA: built-in antialiasing (AA) filter [49] and Diehl’s pro-cedure [45]. The first one is supported in Abaqus Explicitbut the default built-in AA filter cannot satisfy the AA filterrequirement recommended by IEST-RD-DTE012.2 [31] (seeTable 2). Thus, we designed eighth order infinite impulseresponse (IIR) Butterworth filter with sampling rate of100 kHz to satisfy the AA filter requirement. The designedfilter satisfies all of the AA filter requirements as shown inFigure 13.The key principle of Diehl’s procedure is whole data
0 1 2 3 4 5
0
(Hz)
Mag
nitu
de (d
B)0 1 2 3 4 5
0
(Hz)
Phas
e (de
g.)
−200
−400
−500
−1000
×104
×104
X: 3e + 004
Y: −69.03
Figure 13: Bode plot of the designed eighth order IIR Butterworthfilter. (a) Magnitude. (b) Phase.
recording. After whole data recording, the signal is spline-interpolated with the minimum of the time increments. Thefinal step is decimation to reduce the size of data. However,decimation is considered as optional because an accelerationtime history is recorded at only one point: the data size isa few megabytes. Figure 14 proved that both can removealiasing. The two SRSs from Diehl’s procedure and wholedata recording are perfectly matched while aliasing cannot beprevented perfectly in some frequencies by the built-in eighthorder IIR Butterworth filter. Also, the built-in filter shouldbe redesigned if the highest frequency of SRS is changed.Thus, during the design process, we removed aliasing by usingDiehl’s procedure.
3.2.2. Design Result. According to the design procedureshown in Figure 10, the major design variables, V𝑃 and 𝐿𝑅,were determined to be 23.13m/s and 0.2744m, respectively.The values of the other variables are the same as thosedescribed in Table 3. The response of the obtained PPSSdesign satisfies the tolerance and magnitude conditions(Figure 15), thereby being effectively equivalent to the targetenvironment (the corresponding acceleration time history isshown in Figure 16). In a qualitative view, the accelerationfields shown in Figure 17 agree well with the radial propa-gation characteristics of point sources. Thus, based on thisdesign result, we determined the air gun capacity.
3.3. Wrap-Around Breech Air Gun. The design variables ofthe wrap-around breech are shown in Figure 18 and can bedetermined using the Seigel’s PPIG gun model [27]. Thismodel has been used by many researchers [35, 37, 38, 54]

10 Shock and Vibration
10
100
1,000
10,000
100,000
100
Acce
lera
tion
(g)
Natural frequency (Hz)Aliasing free
Diehl’s procedureIIR filter
1,000 10,000
Figure 14: Comparison of Diehl’s procedure and eighth order IIRButterworth filter with sampling rate of 100 kHz.
and is a well-developed gas gun model. This model wasderived assuming the breech length is infinite: the breechlength 𝐿Br should be long enough to be effectively infiniteand the amount of gas should be sufficient. In general, therarefactions reflected from the breech end cause the backpressure 𝑝𝑏 to drop when these reflections reach the rear endof the projectile. To prevent this back pressure drop, the barrellength 𝐿𝐵 should be less than six times the breech length 𝐿Br[54].The second assumption is satisfied for V𝑃/𝑎0 < 0.4, if themass of the gas𝑀𝐺 is larger than one-eighth of the projectilemass𝑀𝑃: here, a0 is the initial sound velocity in the breech.Seigel’s model is described as follows:
𝑀𝑃𝑑V𝑃 (𝑡)𝑑𝑡 = 𝐴𝐵 [𝑝𝑏 (𝑡) − 𝑝𝑓 (𝑡)] , (6a)
𝑝𝑏 (𝑡) = 𝑝0 (1 − 𝛾 − 12 V𝑃 (𝑡)𝑎0 )2𝛾/(𝛾−1) , (6b)
𝑝𝑓 (𝑡) = 𝑝atm{{{1 + [V𝑃 (𝑡)𝑎0 ]2 𝛾 (𝛾 + 1)4
+ 𝛾V𝑃 (𝑡)𝑎0 √1 + (𝛾 + 14 )2 [V𝑃 (𝑡)𝑎0 ]2}}},
(6c)
where 𝐴𝐵 is the inner area of the barrel; 𝑝𝑓 is the resistingpressure due to the air in front of the projectile; 𝑝0 and 𝑝atmare breech and atmospheric pressures, respectively; 𝛾 is theratio of specific heats (for air, 𝛾 = 1.4).We used forward finite
10
100
1,000
10,000
100,000
100
Acce
lera
tion
(g)
Natural frequency (Hz)EnvelopeTolerancesDesign result
1,000 10,000
Figure 15: SRS of the proposed design.
30,000
20,000
10,000
0
−10,000
−20,000
−30,000
Acce
lera
tion
(g)
0.000 0.005 0.010 0.015 0.020
Time (s)
Figure 16: Corresponding acceleration time history to the SRSshown in Figure 14.
difference method with a time interval of 10 𝜇s to solve thismodel, as follows:
V𝑃 (𝑡 + Δ𝑡) = V𝑝 (𝑡) + Δ𝑡𝐴𝐵 [𝑝𝑏 (𝑡) − 𝑝𝑓 (𝑡)] . (7)
And at the same time, 𝐿𝐵 is determined by
𝐿𝐵 (𝑡 + Δ𝑡) = 𝐿𝐵 (𝑡) + Δ𝑡V𝑝 (𝑡) . (8)
For the provided values of 𝑀𝑃, the projectile diameter,Φ𝑃, and the target velocity, Vtarget, the design variable set{𝑝0, 𝐿𝐵, ΦBr, 𝐿Br} are determined by the design steps of thewrap-around breech air gun.

Shock and Vibration 11
1.01ms 1.21ms
1.41ms 16ms
Figure 17: Acceleration contour plots of the proposed design result.
Design steps of the wrap-around breech air gun are asfollows.
(1) Set the initial breech pressure 𝑝0.(2) For the target velocity Vtarget, solve (7) and (8) until|V𝑃(𝑡) − Vtarget|/Vtarget < 𝑒target (𝑒target was set to 0.01 in
this study.).(3) Determine the breech length 𝐿Br such that 𝐿𝐵 < 6𝐿Br.(4) Solve (9) considering that 𝑅𝑀 = 𝑀𝐺/𝑀𝑃 > 1/8 for
V𝑝/𝑎0 < 0.4.(ΦBr and 𝐿Br are the diameter and length of the breech). Inthe first step, the maximum operating pressure (MOP) of aregulator should be considered because its MOP is generallyless than that of the other pneumatic components. We usedPER2020-02which is a high precision regulatormade by TPCMechatronics corp. 𝑝0 was determined to be 0.6MPa (gage)considering the pressure distributed in our department is0.8MPa (gage) and the MOP of PER2020-02 is limited to
below 85% of supply air pressure. In the second step, somemargin should be added to the required velocity (23.1337m/s)when determining Vtarget.We set themaximum velocity of theprojectile as 30m/s for sufficient adjustability of the projectilevelocity. In addition, because Seigel’s model cannot considerthe friction between the projectile O-rings and the barrel, weincluded a margin of 50% for the friction: Vtarget = 45m/s.Solving (7) and (8), 𝐿𝐵 of 0.650m satisfies Vtarget. In thethird and fourth steps, the dimensions of the breech aredetermined.The condition for the first assumption gives 𝐿Br,and ΦBr is determined using both the ideal gas law and thecondition for the second assumption, as follows:
ΦBr = √Φ2𝐵,𝑜 + 4𝜋𝑀𝑃𝑅𝑀𝑎20𝛾𝑝0𝐿Br , (9)
where 𝑅𝑀 is the ratio of 𝑀𝐺 to 𝑀𝑃 and Φ𝐵,𝑜 is the outerdiameter of the barrel. 𝑅𝑀 can be any value as long asthe second assumption is satisfied. According to the third
12 Shock and Vibration
Breech
Barrel
Port on the barrel
Air inlet portTrigger port
Projectilewith O-rings
p0
a0
𝛾
ΦB
ΦBr pf
pb MP
LB
LBr
�P
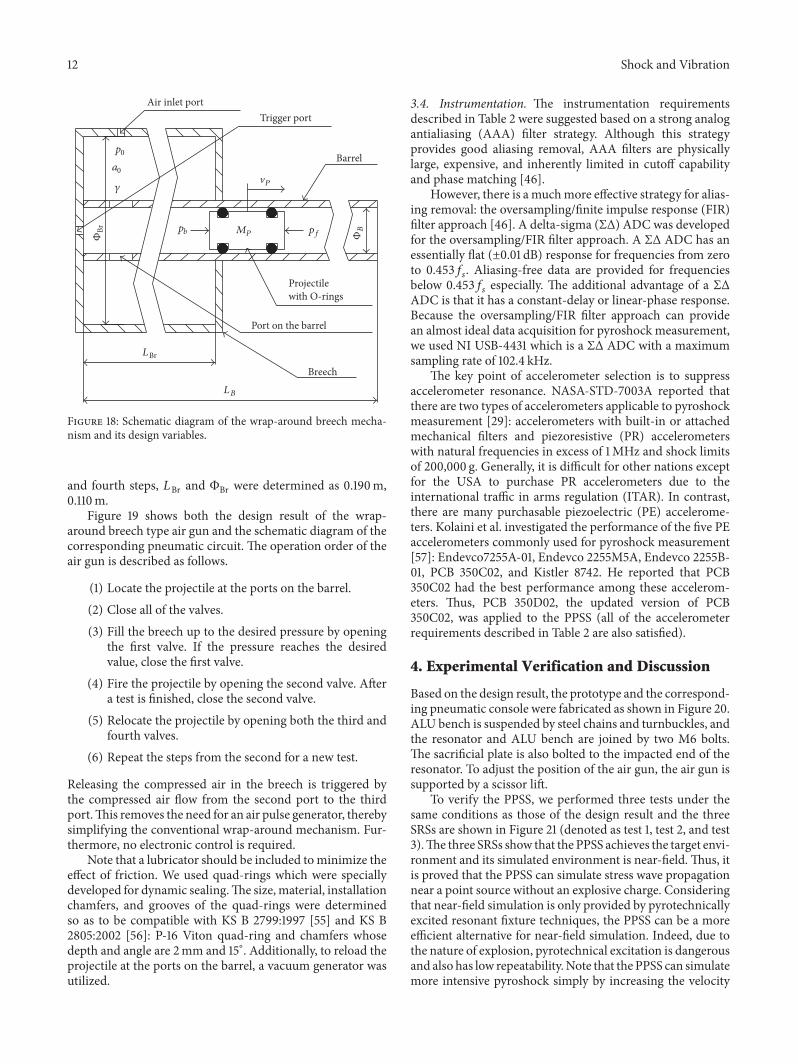
Figure 18: Schematic diagram of the wrap-around breech mecha-nism and its design variables.
and fourth steps, 𝐿Br and ΦBr were determined as 0.190m,0.110m.
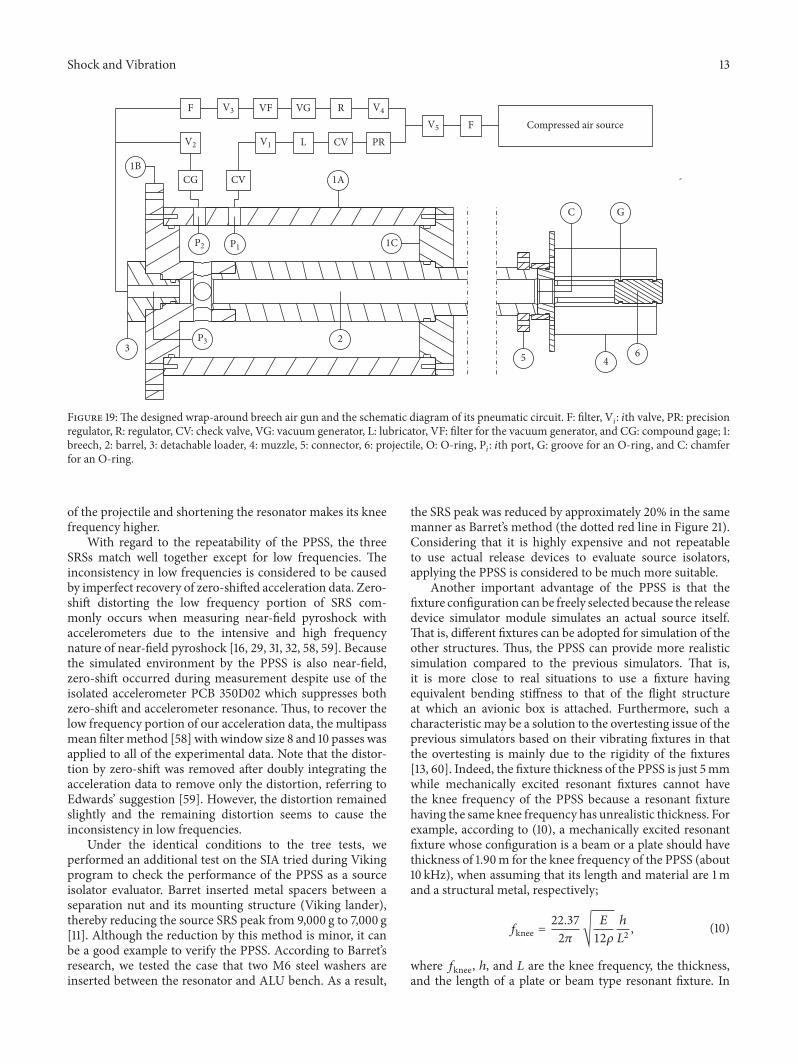
Figure 19 shows both the design result of the wrap-around breech type air gun and the schematic diagram of thecorresponding pneumatic circuit. The operation order of theair gun is described as follows.
(1) Locate the projectile at the ports on the barrel.(2) Close all of the valves.(3) Fill the breech up to the desired pressure by opening
the first valve. If the pressure reaches the desiredvalue, close the first valve.
(4) Fire the projectile by opening the second valve. Aftera test is finished, close the second valve.
(5) Relocate the projectile by opening both the third andfourth valves.
(6) Repeat the steps from the second for a new test.
Releasing the compressed air in the breech is triggered bythe compressed air flow from the second port to the thirdport.This removes the need for an air pulse generator, therebysimplifying the conventional wrap-around mechanism. Fur-thermore, no electronic control is required.
Note that a lubricator should be included tominimize theeffect of friction. We used quad-rings which were speciallydeveloped for dynamic sealing.The size,material, installationchamfers, and grooves of the quad-rings were determinedso as to be compatible with KS B 2799:1997 [55] and KS B2805:2002 [56]: P-16 Viton quad-ring and chamfers whosedepth and angle are 2mm and 15∘. Additionally, to reload theprojectile at the ports on the barrel, a vacuum generator wasutilized.
3.4. Instrumentation. The instrumentation requirementsdescribed in Table 2 were suggested based on a strong analogantialiasing (AAA) filter strategy. Although this strategyprovides good aliasing removal, AAA filters are physicallylarge, expensive, and inherently limited in cutoff capabilityand phase matching [46].
However, there is amuchmore effective strategy for alias-ing removal: the oversampling/finite impulse response (FIR)filter approach [46]. A delta-sigma (ΣΔ)ADCwas developedfor the oversampling/FIR filter approach. A ΣΔ ADC has anessentially flat (±0.01 dB) response for frequencies from zeroto 0.453𝑓𝑠. Aliasing-free data are provided for frequenciesbelow 0.453𝑓𝑠 especially. The additional advantage of a ΣΔADC is that it has a constant-delay or linear-phase response.Because the oversampling/FIR filter approach can providean almost ideal data acquisition for pyroshock measurement,we used NI USB-4431 which is a ΣΔ ADC with a maximumsampling rate of 102.4 kHz.
The key point of accelerometer selection is to suppressaccelerometer resonance. NASA-STD-7003A reported thatthere are two types of accelerometers applicable to pyroshockmeasurement [29]: accelerometers with built-in or attachedmechanical filters and piezoresistive (PR) accelerometerswith natural frequencies in excess of 1MHz and shock limitsof 200,000 g. Generally, it is difficult for other nations exceptfor the USA to purchase PR accelerometers due to theinternational traffic in arms regulation (ITAR). In contrast,there are many purchasable piezoelectric (PE) accelerome-ters. Kolaini et al. investigated the performance of the five PEaccelerometers commonly used for pyroshock measurement[57]: Endevco7255A-01, Endevco 2255M5A, Endevco 2255B-01, PCB 350C02, and Kistler 8742. He reported that PCB350C02 had the best performance among these accelerom-eters. Thus, PCB 350D02, the updated version of PCB350C02, was applied to the PPSS (all of the accelerometerrequirements described in Table 2 are also satisfied).
4. Experimental Verification and Discussion
Based on the design result, the prototype and the correspond-ing pneumatic console were fabricated as shown in Figure 20.ALU bench is suspended by steel chains and turnbuckles, andthe resonator and ALU bench are joined by two M6 bolts.The sacrificial plate is also bolted to the impacted end of theresonator. To adjust the position of the air gun, the air gun issupported by a scissor lift.
To verify the PPSS, we performed three tests under thesame conditions as those of the design result and the threeSRSs are shown in Figure 21 (denoted as test 1, test 2, and test3).The three SRSs show that the PPSS achieves the target envi-ronment and its simulated environment is near-field. Thus, itis proved that the PPSS can simulate stress wave propagationnear a point source without an explosive charge. Consideringthat near-field simulation is only provided by pyrotechnicallyexcited resonant fixture techniques, the PPSS can be a moreefficient alternative for near-field simulation. Indeed, due tothe nature of explosion, pyrotechnical excitation is dangerousand also has low repeatability.Note that the PPSS can simulatemore intensive pyroshock simply by increasing the velocity
Shock and Vibration 13
CV
CV PR
RVGVFF
L
35 4
1B
2
1A
1C
6
CG
GC
Compressed air sourceF
P1P2
P3
V1
V3 V4
V5
V2
Figure 19: The designed wrap-around breech air gun and the schematic diagram of its pneumatic circuit. F: filter, V𝑖: 𝑖th valve, PR: precisionregulator, R: regulator, CV: check valve, VG: vacuum generator, L: lubricator, VF: filter for the vacuum generator, and CG: compound gage; 1:breech, 2: barrel, 3: detachable loader, 4: muzzle, 5: connector, 6: projectile, O: O-ring, P𝑖: 𝑖th port, G: groove for an O-ring, and C: chamferfor an O-ring.
of the projectile and shortening the resonator makes its kneefrequency higher.
With regard to the repeatability of the PPSS, the threeSRSs match well together except for low frequencies. Theinconsistency in low frequencies is considered to be causedby imperfect recovery of zero-shifted acceleration data. Zero-shift distorting the low frequency portion of SRS com-monly occurs when measuring near-field pyroshock withaccelerometers due to the intensive and high frequencynature of near-field pyroshock [16, 29, 31, 32, 58, 59]. Becausethe simulated environment by the PPSS is also near-field,zero-shift occurred during measurement despite use of theisolated accelerometer PCB 350D02 which suppresses bothzero-shift and accelerometer resonance. Thus, to recover thelow frequency portion of our acceleration data, the multipassmean filter method [58] with window size 8 and 10 passes wasapplied to all of the experimental data. Note that the distor-tion by zero-shift was removed after doubly integrating theacceleration data to remove only the distortion, referring toEdwards’ suggestion [59]. However, the distortion remainedslightly and the remaining distortion seems to cause theinconsistency in low frequencies.
Under the identical conditions to the tree tests, weperformed an additional test on the SIA tried during Vikingprogram to check the performance of the PPSS as a sourceisolator evaluator. Barret inserted metal spacers between aseparation nut and its mounting structure (Viking lander),thereby reducing the source SRS peak from 9,000 g to 7,000 g[11]. Although the reduction by this method is minor, it canbe a good example to verify the PPSS. According to Barret’sresearch, we tested the case that two M6 steel washers areinserted between the resonator and ALU bench. As a result,
the SRS peak was reduced by approximately 20% in the samemanner as Barret’s method (the dotted red line in Figure 21).Considering that it is highly expensive and not repeatableto use actual release devices to evaluate source isolators,applying the PPSS is considered to be much more suitable.
Another important advantage of the PPSS is that thefixture configuration can be freely selected because the releasedevice simulator module simulates an actual source itself.That is, different fixtures can be adopted for simulation of theother structures. Thus, the PPSS can provide more realisticsimulation compared to the previous simulators. That is,it is more close to real situations to use a fixture havingequivalent bending stiffness to that of the flight structureat which an avionic box is attached. Furthermore, such acharacteristic may be a solution to the overtesting issue of theprevious simulators based on their vibrating fixtures in thatthe overtesting is mainly due to the rigidity of the fixtures[13, 60]. Indeed, the fixture thickness of the PPSS is just 5mmwhile mechanically excited resonant fixtures cannot havethe knee frequency of the PPSS because a resonant fixturehaving the same knee frequency has unrealistic thickness. Forexample, according to (10), a mechanically excited resonantfixture whose configuration is a beam or a plate should havethickness of 1.90m for the knee frequency of the PPSS (about10 kHz), when assuming that its length and material are 1mand a structural metal, respectively;
𝑓knee = 22.372𝜋 √ 𝐸12𝜌 ℎ𝐿2 , (10)
where 𝑓knee, ℎ, and 𝐿 are the knee frequency, the thickness,and the length of a plate or beam type resonant fixture. In

14 Shock and Vibration
Chain with a turnbuckle
AccelerometerALU bench
Resonator
Projectile
Air gun
PhotogateSacrificial plate
Scissors lift
(a) (b)
Figure 20: Fabricated prototype. (a) PPSS. (b) Pneumatic console.
10
100
1,000
10,000
100,000
100
Acce
lera
tion
(g)
Natural frequency (Hz)
Envelope TolerancesTest 1 Test 2Test 3 Source isolation
1,000 10,000
Figure 21: Simulated pyroshock environments and the attenuatedpyroshock environment by source isolation using washers.
the case that 𝑓knee is 1 kHz, 0.190m, relatively thick comparedto the fixture of the PPSS, is still required. Note that (10)is frequently used to design mechanically excited resonantfixtures whose type is a plate or a beam [13, 16, 26].Therefore,
to further advance simulation of far- and mid-fields, theconcept of the PPSS may be extended to them by using aresonator having low natural frequency.
5. Conclusion
Wedeveloped the PPSS which simulates a release device itselfby using a systematic design procedure based on explicit FEAand Seigel’s PPIG model. The prototype provided simulationof a point source and functioned as a performance evaluatorof source isolators. Thus, one can develop a source isolatorusing the PPSS tomake a breakthrough in avionics protectionagainst pyroshock. Another important aspect of the PPSS isthat its fixture is able to be freely selected for simulation of astructure. Such a characteristic is expected to not only solvethe overtesting issue of the previous simulators based on theirvibrating fixtures but also provide more realistic simulationsof pyroshock. For further improvement of the PPSS, werecommend development of a tunable resonator because thetunable resonator simulates various point pyroshock sourceshaving different knee frequencies.
Competing Interests
The authors declare that there is no conflict of interestsregarding the publication of this paper.
Acknowledgments
This work was supported by Korea Aerospace Research Insti-tute (no. NRF-2014M1A3A4A04062325). Additional support

Shock and Vibration 15
was provided by the National Research Foundation of Korea(NRF) grant funded by the Korea government (MSIP): no.2010-0028680.
References
[1] D. K. Stumpf, Titan II: A History of a ColdWarMissile Program,University of Arkansas Press, 2000.
[2] N. Butterfield, “Pyrotechnic release device,” in Space VehicleMechanisms: Elements of Successful Design, P. L. Colony, Ed.,John Wiley & Sons, New York, NY, USA, 1998.
[3] C. J. Moening, “Pyroshock test failures,” in Proceedings of the31st Annual Technical Meeting of the Institute of EnvironmentalSciences, vol. 3, 1985.
[4] M. A. Talley, “Theory of shock and vibration isolation,” inHarri’s Shock and Vibration Handbook, A. G. Piersol and T. L.Paez, Eds., McGraw-Hill, 6th edition, 2002.
[5] H. LeKuch, “Shock and vibration isolation systems,” in Harri’sShock and Vibration Handbook, A. G. Piersol and T. L. Paez,Eds., McGraw-Hill, New York, NY, USA, 6th edition, 2002.
[6] T. Irvine, “Avionics isolation design guidelines (Revision C),”2009, http://www.vibrationdata.com.
[7] W. J. Kacena, M. B. McGrath, and W. P. Rader, Aerospacesystems pyrotechnics shock data (ground test and flight), vol.6, 1970.
[8] J.Meltzer, J. Rossoff, J. Slaughter, and J. Sterhardt, “Structure andmaterials aspects of the prime flight test vehicle,” in Proceedingsof the 7th Structures andMaterials Conference, CocoaBeach, Fla,USA, April 1966.
[9] W. R. Britton and G. K. Jones, “Pyrotechnic shock testing of afull-scale reentry vehicle,”The Shock and Vibration Bulletin, vol.36, part 2, pp. 71–81, 1967.
[10] W. J. Kacena,M. B.McGrath, andW. P. Rader,Aerospace SystemsPyrotechnic Shock Data, vol. I, NASA, 1970.
[11] S. Barret, W. P. Rader, and K. R. Payne, “Viking dynamicsexperience with application to future payload design,” Tech.Rep. NASA-CR-3014, Martin Marietta Corp, Denver, Colo,USA, 1978.
[12] ECSS Secretariat, Space Engineering: Mechanical Shock Designand Verification Handbook, ECSS-E-HB-32-25A, 2015.
[13] Pyroshock Testing Techniques, IEST-RP-DTE032.2, 2009.[14] J.-R. Lee, C. C. Chia, and C.-W. Kong, “Review of pyroshock
wavemeasurement and simulation for space systems,”Measure-ment: Journal of the International Measurement Confederation,vol. 45, no. 4, pp. 631–642, 2012.
[15] Dynamic Environmental Criteria, NASA-HDBK-7005, 2001.[16] V. I. Bateman and N. T. Davie, “Pyroshock testing,” in Harri’s
Shock and Vibration Handbook, A. G. Piersol and T. L. Paez,Eds., McGraw-Hill, 6th edition, 2002.
[17] E. Filippi, “Pyroshock simulation using the Alcatel Etca testfacility,” in Proceedings of the 1st European Conference onLauncher Technology, Toulouse, France, 1999.
[18] G. Deroissart, G. Kouroussis, L. B. Fekih, and O. Verlinden, “Amatlab toolbox for shock response analysis dedicated to spatialapplications,” in Proceedings of the 22nd International Congresson Sound and Vibration (ICSV22 ’15), Florence, Italy, July 2015.
[19] S. Kiryenko, G. Piret, and J. Kasper, “ESA/ESTEC shock benchpresentation,” in Proceedings of the European Conference onSpacecraft Structures, Materials and Mechanical Testing 2005,pp. 1405–1413, Noordwijk, Netherlands, May 2005.
[20] R.Hsieh, R.M.Moore, S. Sroka, J. Lake, C. Stull, andP.Avitabile,“Analysis and dynamic characterization of a resonant plate forshock testing,” in Special Topics in Structural Dynamics, Volume6: Proceedings of the 31st IMAC, A Conference on StructuralDynamics, 2013, Conference Proceedings of the Society forExperimental Mechanics Series, pp. 515–533, Springer, Berlin,Germany, 2013.
[21] M. Jonsson, Development of a shock test facility for qualificationof space equipment [M.S. thesis], Division Dynamics, ChalmersUniversity of Technology, Goteborg, Sweden, 2012.
[22] S.-H. Youn, Y.-S. Jang, and J.-H. Han, “Compressed meshwasher isolators using the pseudoelasticity of SMA for pyroshockattenuation,” Journal of Intelligent Material Systems and Struc-tures, vol. 21, no. 4, pp. 407–421, 2010.
[23] C. De Fruytier, O. Verlinden, and D. Wattiaux, “Pyroshocksimulation for qualification of space electronic equipments,” inProceedings of the Workshop on Spacecraft Shock Environmentand Verification, Noordwijk, The Netherlands, 2008.
[24] D. Dilhan, A. Piquereau, L. Bonnes, and J. Van de Veire,“Definition and manufacturing of the pyroshock bench,” inProceedings of the 7th ESA/CNES International Workshop onSpace Pyrotechnics, Noordwijk, The Netherlands, 2008.
[25] J. J. Titulaer, B. R. Allen, and J. R. Maly, “An alternative topyrotechnic testing for shock identification,” in Proceedings ofthe 25th Conference and Exposition on Structural Dynamics,IMAC-XXV, pp. 1–11, Orlando, Fla, USA, February 2007.
[26] V. I. Bateman and F. A. Brown, “Evaluation of shock mitigatingmaterials in a V-band pyroshock environment simulated witha resonant fixture,” Journal of the IES, vol. 37, no. 5, pp. 40–45,1994.
[27] A. E. Seigel, “The theory of high speed guns,” NATO-AGARD,Neuilly sur Seine, France, AGARDograph 91, 1965.
[28] D.Dilhan,V.Cipolla,H.Grzeskowiak,N.Cable, and S. Kiryenko,“Pyroshock generation,” in Proceedings of the European Confer-ence on Spacecraft Structures, Materials and Mechanical Testing2005, May 2005.
[29] Pyroshock test criteria, NASA-STD-7003A, 2011.[30] United States Department of Defense, “Environmental engi-
neering considerations and laboratory tests,” MIL TechnicalStandard MIL-STD-810G, 2008.
[31] Institute of Environmental Sciences and Technology, Hand-book for Dynamic Data Acquisition and Analysis, IEST-RD-DTE012.2, 2006.
[32] V. I. Bateman, H. Himelblau, and R. Merritt, “Validation ofpyroshock data,” Sound and Vibration magazine, March 2012.
[33] ISO, “Mechanical vibration and shock—signal processing—part 4: shock-response spectrum analysis,” ISO 18431-4:2007,2007.
[34] Abaqus Analysis User’s Manual, v 6.10, Dassault SystemesSimulia Corp, Providence, RI, USA, 2010.
[35] J. R. Brown, P. J. C. Chappell, G. T. Egglestone, and E. P. Gellert,“A gas-gun facility for material impact studies using low-velocity, low-mass projectiles,” Journal of Physics E: ScientificInstruments, vol. 22, no. 9, pp. 771–774, 1989.
[36] Z. J. Rohrbach, T. R. Buresh, and M. J. Madsen, “Modeling theexit velocity of a compressed air cannon,” American Journal ofPhysics, vol. 80, no. 1, pp. 24–26, 2011.
[37] I. M. Hatchings and R. E. Winter, “A simple small-bore labora-tory gas gun,” Journal of Physics E: Scientific Instruments, vol. 8,no. 2, pp. 84–86, 1989.
16 Shock and Vibration
[38] G. R. Fowles, G. E. Duvall, J. Asay et al., “Gas gun for impactstudies,” Review of Scientific Instruments, vol. 41, no. 7, 1970.
[39] N. Bourne, Materials in mechanical extremes: Fundamentalsand Applications, Cambridge University Press, Cambridge, UK,2013.
[40] C. C. Ho, Assembly and commissioning of NAVAL postgraduateschool gas gun for impact studies [M.S. thesis], DepartmentMechanical Engineer, Naval Postgraduate School, Monterey,Calif, USA, 2009.
[41] B. J. Jensen, C. T. Owens, K. J. Ramos et al., “Impact systemfor ultrafast synchrotron experiments,” Review of ScientificInstruments, vol. 84, no. 1, Article ID 013904, 2013.
[42] R.W.White and R. Fowles, “Effect of valve opening time on gasgun performance,” Review of Scientific Instruments, vol. 39, no.9, pp. 1296–1297, 1968.
[43] W. T. Thomson and M. D. Dahleh, Theory of Vibration withApplications, Prentice Hall, 5th edition, 1997.
[44] T. Irvine, An introduction to the shock response spectrum(revision S), 2012, http://www.vibrationdata.com.
[45] T. Diehl, D. Carroll, and B. Nagaraj, “Applications of DSPto explicit dynamic FEA simulations of elastically-dominatedimpact problems,” Shock and Vibration, vol. 7, no. 3, Article ID931351, pp. 167–177, 2000.
[46] S. Smith, “Shock and vibration data acquisition,” inHarri’s Shockand Vibration Handbook, A. G. Piersol and T. L. Paez, Eds.,McGraw-Hill, 6th edition, 2002.
[47] F. J. Seron, F. J. Sanz, M. Kindelan, and J. I. Badal, “Finite-elementmethod for elastic wave propagation,”Communicationsin Applied Numerical Methods, vol. 6, no. 5, pp. 359–368, 1990.
[48] L. Cremer and M. Heckl, Structure-Borne Sound: StructuralVibrations and Sound Radiation at Audio Frequencies, Springer,Berlin, Germany, 3rd edition, 2004.
[49] Dassault Systemes Simulia, Getting Started with Abaqus: Inter-active Edition, v 6.10, Dassault Systemes Simulia, Providence, RI,USA, 2010.
[50] M. De Benedetti, G. Garofalo, M. Zumpano, and R. Barboni,“On the damping effect due to bolted junctions in spacestructures subjected to pyro-shock,” Acta Astronautica, vol. 60,no. 12, pp. 947–956, 2007.
[51] D. Wattiaux, O. Verlinden, C. Conti, and C. De Fruytier,“Prediction of the vibration levels generated by pyrotechnicshocks using an approach by equivalent mechanical shock,”Journal of Vibration and Acoustics, Transactions of the ASME,vol. 130, no. 4, Article ID 041012, 2008.
[52] J. M. Ndambi, B. Reymen, D. Lecompte, and J. Vantomme,“Numerical simulations of a pyrotechnic shock test,” inProceed-ings of the 8th International Conference on Structural Dynamics, in Proceedings of the 8th international conference on structuraldynamics (EURODYN, Leuven , Belgium, 2011.
[53] R. Velmurugan and E. M. Najeeb, “Study of far-field pyroshockresponses of composite panels,” Journal of Vibration and Acous-tics, Transactions of the ASME, vol. 136, no. 3, Article ID 031014,2014.
[54] M. J. Gouge, S. K. Combs, P.W. Fisher, and S. L.Milora, “Designconsiderations for single-stage and two-stage pneumatic pelletinjectors,” Review of Scientific Instruments, vol. 60, no. 4, pp.570–575, 1989.
[55] O-rings housings—design criteria, KS B 2799, 1997.[56] O-ring, KS B 2805, 2002.[57] A. R. Kolaini, R. Nayeri, and D. L. Kern, “Pyroshock simula-
tion systems: are we correctly qualifying flight hardware for
pyroshock environments?” in Proceedings of the 25th AerospaceTesting Conference, October 2009.
[58] T. Irvine, “A mean filter method for removing saturation frompyrotechnic shock pulses,” 2008, http://www.vibrationdata.com.
[59] T. S. Edwards, “An improved wavelet correction for zero shiftedaccelerometer data,” Shock and Vibration, vol. 10, no. 3, pp. 159–167, 2003.
[60] J. P. Deblois, Analytical and experimental investigation ofovertesting during assembly-level shock testing [M.S. thesis],Department of Mechanical & Industrial Engineering, Concor-dia University, Montreal, Canada, 2009.

International Journal of
AerospaceEngineeringHindawi Publishing Corporationhttp://www.hindawi.com Volume 2014
RoboticsJournal of
Hindawi Publishing Corporationhttp://www.hindawi.com Volume 2014
Hindawi Publishing Corporationhttp://www.hindawi.com Volume 2014
Active and Passive Electronic Components
Control Scienceand Engineering
Journal of
Hindawi Publishing Corporationhttp://www.hindawi.com Volume 2014
International Journal of
RotatingMachinery
Hindawi Publishing Corporationhttp://www.hindawi.com Volume 2014
Hindawi Publishing Corporation http://www.hindawi.com
Journal ofEngineeringVolume 2014
Submit your manuscripts athttps://www.hindawi.com
VLSI Design
Hindawi Publishing Corporationhttp://www.hindawi.com Volume 2014
Hindawi Publishing Corporationhttp://www.hindawi.com Volume 2014
Shock and Vibration
Hindawi Publishing Corporationhttp://www.hindawi.com Volume 2014
Civil EngineeringAdvances in
Acoustics and VibrationAdvances in
Hindawi Publishing Corporationhttp://www.hindawi.com Volume 2014
Hindawi Publishing Corporationhttp://www.hindawi.com Volume 2014
Electrical and Computer Engineering
Journal of
Advances inOptoElectronics
Hindawi Publishing Corporation http://www.hindawi.com
Volume 2014
The Scientific World JournalHindawi Publishing Corporation http://www.hindawi.com Volume 2014
SensorsJournal of
Hindawi Publishing Corporationhttp://www.hindawi.com Volume 2014
Modelling & Simulation in EngineeringHindawi Publishing Corporation http://www.hindawi.com Volume 2014
Hindawi Publishing Corporationhttp://www.hindawi.com Volume 2014
Chemical EngineeringInternational Journal of Antennas and
Propagation
International Journal of
Hindawi Publishing Corporationhttp://www.hindawi.com Volume 2014
Hindawi Publishing Corporationhttp://www.hindawi.com Volume 2014
Navigation and Observation
International Journal of
Hindawi Publishing Corporationhttp://www.hindawi.com Volume 2014
DistributedSensor Networks
International Journal of