Embed Size (px)
Citation preview

SIA RESEARCH
RESEARCH DEPARTMENT Frank A. Fernandez, Senior Vice
President, Chief Economist and Director, Research
Kyle L Brandon, Vice President and Director, Securities Research
Stephen L. Carlson, Vice Pres-ident and Director, Surveys
Lenore Dittmar, Executive Assis-tant
Carmen Lopez, Research Assis-tant
Bella Mardakhaev, Research As-sistant
Rob Mills, Vice President and Di-rector, Industry Research
Amy Sloane, Manager, Surveys Grace Toto, Vice President
and Director, Statistics
Volume V, No. 12 November 17, 2004
STRUCTURAL AND CYCLICAL CHANGES IN EMPLOYMENT
IN THE U.S. SECURITIES INDUSTRY Rob Mills
Frank A. Fernandez
ECONOMIC UPDATE AND OUTLOOK Frank A. Fernandez
MONTHLY STATISTICAL REVIEW Grace Toto
SECURITIES INDUSTRY ASSOCIATION • [email protected], http://www.sia.com 120 Broadway, 35th Floor, New York, NY 10271-0080 • 212-608-1500, fax 212-968-0703 1425 K Street, NW, Washington, DC 20005-3500 • 202-216-2000, fax 202-216-2119 Prepared by SIA Research Department • Copyright © 2004 Securities Industry Association • ISSN 1532-6667

2 SIA Research Reports, Vol. V, No. 12 (November 17, 2004)
Table of Contents Page
3 ..........Structural and Cyclical Changes in Employment in the U.S. Securities Industry, by Rob Mills and Frank A. Fernandez. The demographic and occupational composition of the securities industry has shifted significantly in the past two years. The impact of the cyclical downturn in the industry between April 2001 and June 2003 was not evenly distributed. The youngest and least experienced employees were the first to go, disproportionately impacting women. Deep-seated structural changes, such as increasing automation in order handling, have also had an impact on demographic patterns, with high rates of attrition in occupational groups traditionally dominated by women. These patterns have reduced the aggregate representation of women in the industry to 37.2% from 40.3% of total headcount. Yet these trends in the overall size of different occupational groups hide emerging patterns of compositional change within certain functions. Surveys show that women are making inroads in a variety of professional and revenue-generating positions, including Managing Direc-tor, Investment Banker and general Management positions. In short, while cyclical and structural trends have put pressure on job categories traditionally dominated by women, there is increasing female representation in those professional categories that generate income for securities firms.
13 ........Economic Update and Outlook, by Frank A. Fernandez. The U.S. economy is losing
momentum as 2004 comes to a close. Growth is expected to be slower next year as fiscal stimulus fades, along with positive wealth effects from housing and financial assets. These dampening influences, along with the impact of higher interest rates, higher prices for fuel and other commodities and slower growth of real personal in-come, are expected to trim real GDP growth from 4.4% in 2004 to 2.6% in 2005. Un-employment is expected to stabilize at 5.5% and inflation is expected to rise modestly to an average of 2.9% in 2005 from 2.2% this year.
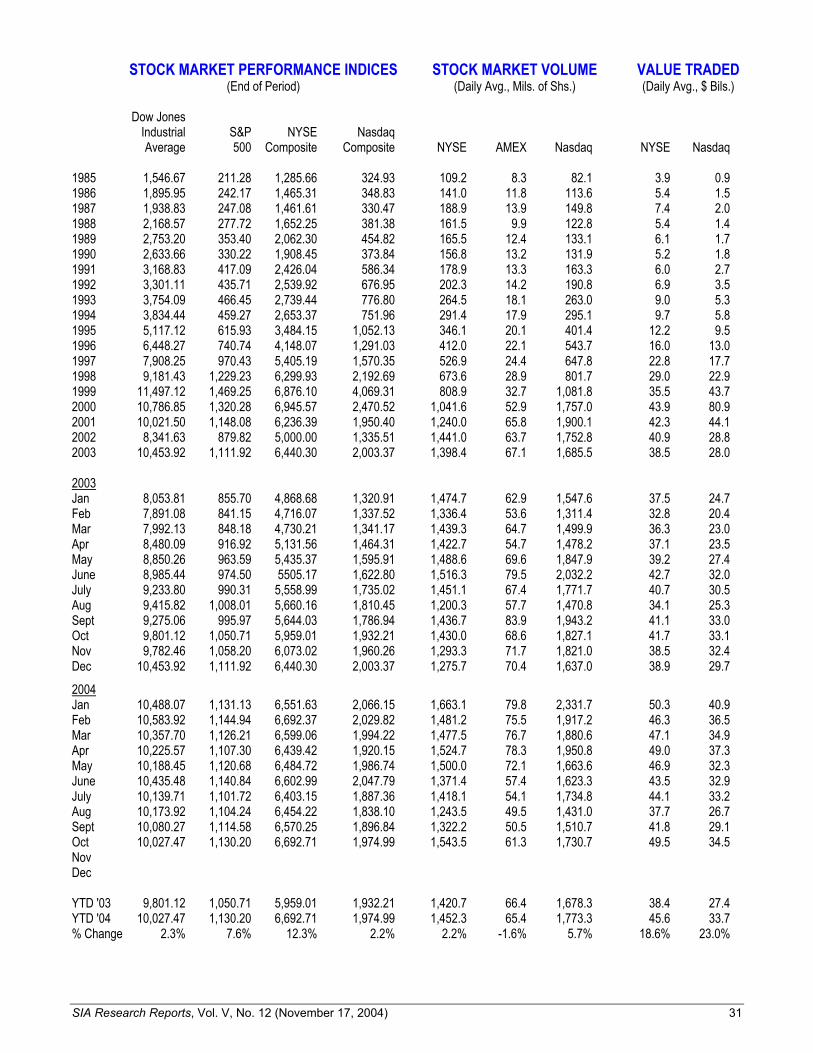
22 ........Monthly Statistical Review, by Grace Toto. In October, the S&P 500 Index ad-
vanced 1.4% (its third-straight monthly increase), the Nasdaq Composite index gained 4.1% (its best monthly performance this year), and the Dow Jones slipped 0.5%. Since the start of the year, the S&P 500 has risen 1.6%, while the DJIA and Nasdaq Composite lost 4.1% and 1.4%, respectively. Share and dollar volumes on both the NYSE and Nasdaq declined in October but are still running ahead of last year’s levels. Overall underwriting activity in the U.S. market sank 50% in October to its lowest monthly level in nearly four years. Year-to-date underwriting volume is tracking 5.0% below results in last year’s first 10 months. On a brighter note, Octo-ber’s domestic IPO volume of $5.7 billion was double September’s level and the sec-ond best monthly showing in over three years. Year-to-date, IPO volume of $37.4 billion is quadruple the $8.8 billion raised in the same period last year.
SIA Research Reports, Vol. V, No. 12 (November 17, 2004) 3
STRUCTURAL AND CYCLICAL CHANGES IN EMPLOYMENT IN THE U.S. SECURITIES INDUSTRY
Introduction
ore often than not, the most interesting questions addressed by SIA’s Research Depart-ment are those posed by our member-firms. Recently, we were asked to explain some of
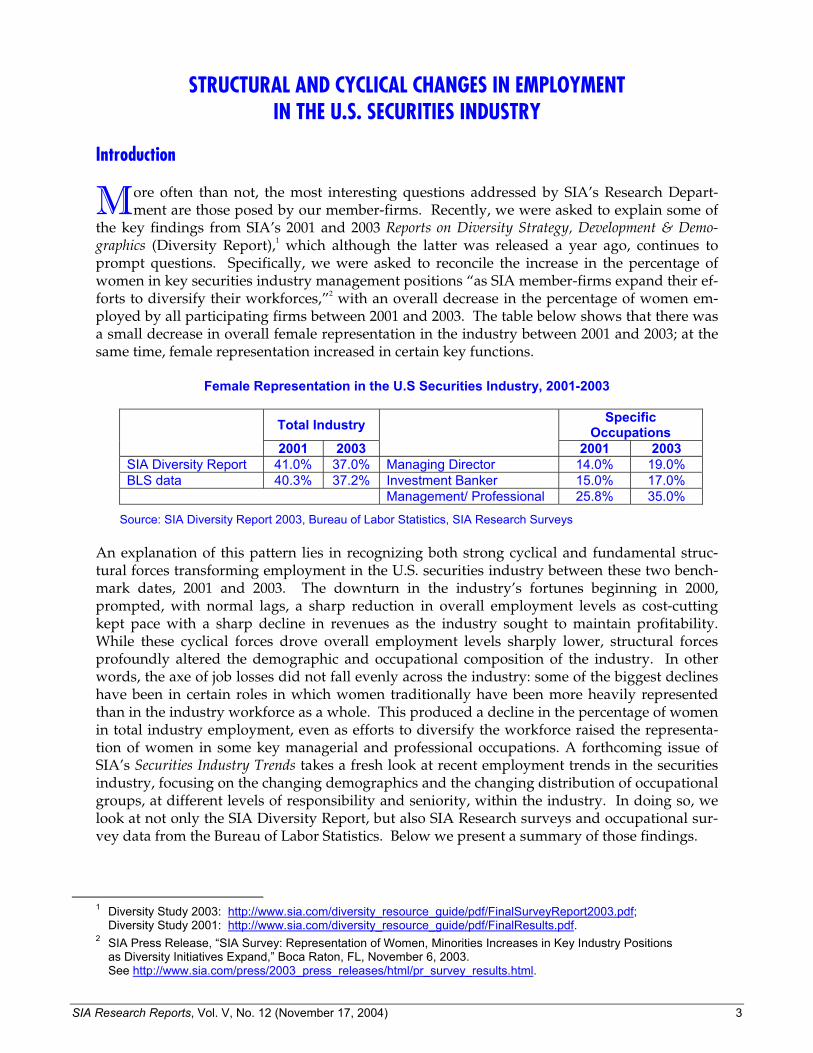
the key findings from SIA’s 2001 and 2003 Reports on Diversity Strategy, Development & Demo-graphics (Diversity Report),1 which although the latter was released a year ago, continues to prompt questions. Specifically, we were asked to reconcile the increase in the percentage of women in key securities industry management positions “as SIA member-firms expand their ef-forts to diversify their workforces,”2 with an overall decrease in the percentage of women em-ployed by all participating firms between 2001 and 2003. The table below shows that there was a small decrease in overall female representation in the industry between 2001 and 2003; at the same time, female representation increased in certain key functions.
Female Representation in the U.S Securities Industry, 2001-2003
Total Industry Specific Occupations
2001 2003 2001 2003 SIA Diversity Report 41.0% 37.0% Managing Director 14.0% 19.0% BLS data 40.3% 37.2% Investment Banker 15.0% 17.0% Management/ Professional 25.8% 35.0%
Source: SIA Diversity Report 2003, Bureau of Labor Statistics, SIA Research Surveys An explanation of this pattern lies in recognizing both strong cyclical and fundamental struc-tural forces transforming employment in the U.S. securities industry between these two bench-mark dates, 2001 and 2003. The downturn in the industry’s fortunes beginning in 2000, prompted, with normal lags, a sharp reduction in overall employment levels as cost-cutting kept pace with a sharp decline in revenues as the industry sought to maintain profitability. While these cyclical forces drove overall employment levels sharply lower, structural forces profoundly altered the demographic and occupational composition of the industry. In other words, the axe of job losses did not fall evenly across the industry: some of the biggest declines have been in certain roles in which women traditionally have been more heavily represented than in the industry workforce as a whole. This produced a decline in the percentage of women in total industry employment, even as efforts to diversify the workforce raised the representa-tion of women in some key managerial and professional occupations. A forthcoming issue of SIA’s Securities Industry Trends takes a fresh look at recent employment trends in the securities industry, focusing on the changing demographics and the changing distribution of occupational groups, at different levels of responsibility and seniority, within the industry. In doing so, we look at not only the SIA Diversity Report, but also SIA Research surveys and occupational sur-vey data from the Bureau of Labor Statistics. Below we present a summary of those findings.
1 Diversity Study 2003: http://www.sia.com/diversity_resource_guide/pdf/FinalSurveyReport2003.pdf;
Diversity Study 2001: http://www.sia.com/diversity_resource_guide/pdf/FinalResults.pdf. 2 SIA Press Release, “SIA Survey: Representation of Women, Minorities Increases in Key Industry Positions
as Diversity Initiatives Expand,” Boca Raton, FL, November 6, 2003. See http://www.sia.com/press/2003_press_releases/html/pr_survey_results.html.
M

4 SIA Research Reports, Vol. V, No. 12 (November 17, 2004)
Cyclical Forces Between 2001 and 2003 the securities industry experienced one of its most severe contractions. The industry lost 83,100 jobs nationwide between the peak of 840,900 in March 2001 and the re-cent low of 757,800 in May 2003. This reduction easily surpassed the second highest job loss for U.S. brokerages, a decline of 38,900, which was sustained over the four-year period from De-cember 1987 to December 1991. Although in percentage terms (net job losses as a percent of to-tal employment) the 9.9% decline from peak-to-trough in the most recent contraction was greater than the 8.5% decline suffered from end-1987 to end-1991, it still represents a smaller percentage of the workforce than the 17% decline (24,300 jobs) in the workforce during the pe-riod 1972-74, which was the most severe period of layoffs since the Great Depression.
U.S. Securities Industry Employment
700
720
740
760
780
800
820
840
860
2000 2001 2002 2003 2004
Source: U.S. Bureau of Labor Statistics
Thousands
*Sept-Oct.2004 preliminary
* 2000 2001 2002 2003 2004
Since the recent May 2003 low the securities industry has regained a total of 37,600 jobs, a 5% increase over the past 15 months to 795,400 in August 2004 — a recovery, thus far, of less than half the job loss from peak to trough. The slow recovery should not be surprising, given that only 16 months have elapsed since the trough in employment was reached, in conjunction with negative factors such as high levels of uncertainty prevailing today and continued strong pro-ductivity gains. After the previous period of sharp employment declines that ended in Decem-ber 1991, industry employment levels did not return to their previous highs until 1995. A full recovery of job losses in the current cycle might take even longer given the pressure on securi-ties firms to continue to contain costs as profit margins on most product and service lines con-tinue to narrow.

SIA Research Reports, Vol. V, No. 12 (November 17, 2004) 5
Securities Industry Quarterly Net Revenueand Monthly Employment
44.3
38.9
42.0
39.0
44.8
41.0
44.6
48.848.0
36.9
38.9
42.341.2
30
35
40
45
50
J A J O J A J O J A J O J A
Source: SIA Databank and Bureau of Labor StatisticsNote: Net Revenue is for NASD- and NYSE-reporting firms.
$ billions
740
760
780
800
820
840
860
thousands
Net RevenueEmployment
2001 2002 2003 2004
The recent fall and rise of employment primarily reflects the cost-cutting efforts taken by firms in response to the plunge in industry revenues and profits in 2001 and 2002 and the subsequent rebound in 2003. Declining revenues ate into industry profitability with pre-tax net income dropping from $31.6 billion in 2000 to $16.0 billion in 2001, and then down to $12.1 billion in 2002, before recovering to $24.1 billion in 2003. Declines in compensation, the industry’s largest expense, kept pace with the fall in net revenues (net of interest expense) as the industry ad-justed to the slump in markets and managed to remain profitable. As a broad-based recovery in demand for the industry’s financial products and services developed during the course of 2003, the industry began, with expected lags, to increase total employment. One of the primary effects of the industry’s retrenchment was a marked shift in the age profile, as the estimated average age of an industry worker rose to 41.4 years in 2003 from 39.3 years in 2001. Layoffs fell heaviest on the 25-34-year-old age group, which dropped to 26% from 32% of the workforce, and to a lesser extent on the 16-24-year-old age group, while all the older age groups showed increases in proportional representation. Employment of women in the indus-try tends to be concentrated in younger age groups. As a result of a “LIFO” (Last-In-First-Out) approach to managing separations, the bulk of layoffs fell on younger and less experienced workers, that disproportionately were women, reversing some of the gains in diversity seen during the expansionary phase of the hiring cycle in the late 1990s. Similarly, recruitment freezes stemmed the inflow of entry-level employees, reinforcing the bias towards older, male workers.

6 SIA Research Reports, Vol. V, No. 12 (November 17, 2004)
2001 Age and Gender Distributionin the U.S. Securities Industry
0%
10%
20%
30%
40%
16-19 20-24 25-34 35-44 45-54 55-64 65+
Source: Bureau of Labor Statistics Current Population Survey (CPS) data
WomenMen
Age range
2003 Age and Gender Distributionin the U.S. Securities Industry
0%
10%
20%
30%
40%
16-19 20-24 25-34 35-44 45-54 55-64 65+
Source: Bureau of Labor Statistics CPS data
WomenMen
Age range
Structural Trends The contraction in industry employment following the U.S. equity market peak in early 2000 differed from the contraction that followed the late 1987 “market crash” in a number of impor-tant respects that are relevant to the interpretation of the results from the two diversity surveys.

SIA Research Reports, Vol. V, No. 12 (November 17, 2004) 7
Between end-1987 and end-1991, the ratio of income-producing personnel at securities firms relative to non income-producing personnel remained relatively stable, slightly below its his-torical average seen in the 1980s, as layoffs were relatively equally distributed across all job classes and income groups.
Ratio of Income-Producing to Non Income-Producing Personnel(1980 - 2003)
65%
70%
75%
80%
85%
90%
95%
100%
105%
1980 1985 1990 1995 2000
Source: SEC FOCUS reports. Data is for the largest 'Focus II' filers (approximately 600 firms)
However as the industry began to expand during the long bull market of the 1990s, net new hires were overwhelmingly income producers (salaried employees that include registered rep-resentatives, managerial and professional personnel) whose numbers steadily rose relative to support (non income-producing) personnel, such as clerical and administrative workers and en-try-level sales and trading employees. This trend has persisted during the contraction and sub-sequent recovery of the current decade.
Ratio of Income-Producing to Non Income-Producing Personnel(1Q01 - 2Q04)
65%
70%
75%
80%
85%
90%
95%
100%
105%
Q1 Q2 Q3 Q4 Q1 Q2 Q3 Q4 Q1 Q2 Q3 Q4 Q1 Q2
Source: SEC FOCUS reports. Data is for the largest 'Focus II' f ilers (approximately 600 f irms)
2001 2002 2003 2004

8 SIA Research Reports, Vol. V, No. 12 (November 17, 2004)
In addition to the broad demographic and occupational changes described above, the steady rise in this key personnel ratio reflects a number of forces transforming the industry over the past decade. These include:
• Substantial improvements in operational systems, as rapid adoption and adaptation of a revolution in communications and information technology yielded dramatic increases in operational speed and efficiency and sharply lower costs. This generated high rates of productivity growth and redundancies in certain occupational categories, such as bro-kerage clerks, while other job types, such as software engineers, expanded, even during a period of steep overall job losses;
• Changes in the supervisory and regulatory framework within which securities firms op-erate have imposed increased reporting and disclosure requirements on firms. This on-going trend has already produced sharp increases in auditing and accounting personnel at all levels of responsibility and is estimated to have generated equally large increases in compliance and legal staff over the past year; and,
• Changes in market structure as a result of a broad range of factors, including: the impact of various industrywide initiatives such as the move to decimal pricing and efforts to achieve straight-through processing of securities transactions; a wave of mergers and acquisitions following the implementation of the Financial Services Modernization Act,3 which allowed the joint operation of insurance, securities and commercial-banking en-terprises; and, the rise and maturation of alternative trade execution venues, such as electronic communications networks (ECNs) and alternative trading systems (ATSs) and increased competition from firms taking advantage of these changes.
Impact on Employment Patterns The impact of these changes can be seen in both the positive and negative trends in individual occupational categories between 2001 and 2003, a period when total industry employment fell sharply. As the table below shows, while most occupations contracted, some showed strong growth. A good example is the 26.5% increase in the number of accountants and auditors, at both junior and professional levels, employed directly by the industry. This has been largely in response to increased regulatory scrutiny and increased disclosure and reporting requirements. Meanwhile, other occupations appear to be in broad-based decline, reflecting increasing auto-mation and efficiency in order handling (the number of brokerage clerks declined by 19.6%) or cultural shifts as desktop computing became ubiquitous (the number of secretaries declined by 15.3%). Women have tended to be disproportionately represented in these occupations. Some occupational changes, such as those in securities industry information technology (IT) ar-eas, reflect very divergent trends. For example, overall employment levels in the IT and sys-tems occupations have declined slightly between 2001 and 2003 — by 4.3%. Yet this headline number masks two very different developments: the “offshoring” of basic programming func-tions is reflected by a 40.3% decline in these positions, while the importance of more sophisti-cated software engineering functions shows up in a 42.2% increase in this category.
3 Terms in bold blue italics are defined in the glossary at the end of this piece.

SIA Research Reports, Vol. V, No. 12 (November 17, 2004) 9
Industry Personnel Totals, by Occupational Groups and Seniority Levels
General andOperational
Change01 - 03
% Increase 01 - 03 IT and Systems Change % Increase
01 - 03Office and Admin
Support Change % Increase 01 - 03
Sales and Trading /Financial
ManagementChange % Increase
01 - 03Sub-TotalChange
Sub-Total% Increase
01 - 03
CEOs (2,248) -24.7% Computer and IT Managers (892) -12.5% Administrative Services
Managers 348 6.0% Marketing and Sales Managers (385) -4.5%
Management General and Ops Managers (1,523) -7.4% Human Resources
Managers (124) -5.4% Financial Managers (12,565) -33.4%
Other (334) -4.3% Managers of Administrative Workers 3,034 17.4% Managers of Sales
Workers (2,267) -26.5%
(4,105) -11.0% (892) -12.5% 3,259 12.8% (15,218) -27.8% (16,956) -13.6%
Compliance Officers (11) -0.3% Computer Programmers (4,871) -40.3% Financial Analysts (3,666) -9.8%
Management Analysts 2,113 35.1% Software Engineers 3,470 42.2% Personal Financial Advisors (5,191) -10.6%
Mid-level / Professional
Accountants and Auditors 3,531 25.4% Computer Support
Specialists (325) -4.5% Market Research Analysts 1,184 28.2%
Financial Examiners (834) -29.4% Other Systems Analysts 330 1.8% Securities Sales
Agents (37,099) -19.3%
Lawyers 90 3.4% Other Sales (1,050) -10.7%
Other (1,948) -5.0% Other Analysts 837 36.8%
2,941 4.3% (1,396) -3.1% (44,985) -15.3% (43,440) -10.6%
Paralegals andLegal Assistants 88 5.6% Customer Service
Reps 6,866 19.8% Cashiers (436) -20.7%
Accounting and Auditing Clerks 4,193 27.4% Receptionists and
Information Clerks (1,476) -17.6% Brokerage Clerks (14,173) -19.6%
Support / Junior
Other Operational Support 985 16.7% Executive Secretaries and
Admin Assistants 1,803 4.6% Telemarketers 2,191 47.1%
Secretaries (2,798) -15.3%
Office Clerks, General 8,055 22.0%
Other (3,735) -8.5%
5,266 23.2% 8,715 4.8% (12,418) -15.7% 1,562 0.6%
TOTAL 4,102 3.2% (2,287) -4.3% 11,974 5.8% (72,621) -16.9%
2001 Total 816,633 2003 Total 757,800
Source: BLS, SIA. Data combines Current Employment Statistics totals with Occupational Employment Statistics occupational splits.

10 SIA Research Reports, Vol. V, No. 12 (November 17, 2004)
Overall, it would appear that during the industry retrenchment, occupational categories tradi-tionally staffed disproportionately by women were among those that bore the brunt of industry job losses, as firms cut recent hires and non revenue-producing posts. In aggregate, this re-sulted in the modest decrease in overall female representation to 37.2% from 40.3% of the indus-try.4 Underlying these macro trends, however, have been some positive developments in workforce diversification. Data from both the SIA Diversity Report and SIA Research surveys show that women have been making inroads in certain key professional and managerial positions tradi-tionally dominated by men. For example, the Diversity Report shows that the percentage of women at the Managing Director level has gone to 19% from 14% between 2001 and 2003. In-vestment bankers have increased to 17% from 15%. Progress appears to have been particularly marked in the industry’s largest firms, where the proportion of Executive Management posi-tions has increased to 20% from 14%. Women in these large firms now represent 19% of Invest-ment Bankers, up from 15% in 2001. The results from SIA Research surveys confirm these trends. SIA member-firms report that there has been a jump in overall representation in man-agement / professional positions to 35.0% from 25.8% in just two years.5 These are positive and welcome trends. Economy-wide labor statistics that look at the composition of different occupations across the country also provide support for the survey data. The percentage of women in the “Securities and Financial Services Sales” occupational group – traditionally a male domain – has crept up in recent years, to 32.0% in 2003 from 29.9% in 2001.6 While this data-point covers an industry sector broader than the securities industry, it backs up the emerging picture of increasing fe-male participation in professional and revenue-generating functions. The flipside of this story is that, at the same time, administrative and clerical positions that have traditionally been female-dominated are starting to show more balance. For example, the Di-versity Report shows that, in 2001, men represented only 35% of General Staff positions. By 2003, this had jumped to 45%. Similarly, Operations Staff went to 47% male representation from 43% male representation. Again, this picture is confirmed in SIA Research surveys. In 2003, men occupied 37.2% of the office positions, up from 30.3% in 2001.7
Conclusion The demographic and occupational composition of the securities industry has shifted signifi-cantly in the past two years. The impact of the cyclical downturn in the industry that led to the retrenchment of almost 10% of industry employees between April 2001 and June 2003 was not evenly distributed. The youngest and least experienced employees were the first to go, dispro-portionately impacting women. Deep-seated structural changes, including increasing automa-tion in order-handling and decreasing reliance on secretarial support, have also had a varied impact on demographic patterns, with high rates of attrition in occupational groups tradition-ally dominated by women. These patterns have reduced the aggregate representation of women in the industry to 37.2% of total headcount in 2003 from 40.3% in 2001.8
4 Bureau of Labor Statistics (BLS). 5 SIA Report on Management and Professional Earnings 2004. 6 BLS. 7 SIA Report on Office Salaries in the Securities Industry 2004. 8 BLS.

SIA Research Reports, Vol. V, No. 12 (November 17, 2004) 11
Yet these trends in the overall size of different occupational groups hide emerging patterns of compositional change within some of these functions. Survey data show that women are mak-ing inroads in a variety of professional and revenue-generating positions, including Managing Director, Investment Banker and general Management positions. These trends are particularly apparent in the largest firms. In short, while cyclical and structural trends have put pressure on job categories traditionally dominated by women, there is increasing female representation in those professional categories that generate income for securities firms. As updated employment data by occupational cate-gory become available later this year, we expect to see a continuation of the pattern seen in re-cent years of net new hires coming in precisely these professional revenue-generating catego-ries. As a result, we anticipate that the upswing in the hiring cycle will show that women con-tinue to increase their representation in key industry management positions. This will aid ef-forts to improve diversity and allow continued progress towards a more balanced securities in-dustry workforce. Rob Mills Vice President and Director, Industry Research
Frank A. Fernandez Senior Vice President, Chief Economist and Director, Research

12 SIA Research Reports, Vol. V, No. 12 (November 17, 2004)
Glossary
Alternative Trading System (ATS): Alternative trading system means any organization, association, person, group of persons, or system that: (1) constitutes, maintains, or pro-vides a marketplace or facilities for bringing together purchasers and sellers of securities or for otherwise performing with respect to securities the functions commonly performed by a stock exchange and (2) does not: (i) set rules governing the conduct of subscribers other than the conduct of such subscribers’ trading on such organization, association, person, group of persons, or system; or (ii) discipline subscribers other than by exclusion from trading. Electronic Communications Network (ECN): Any electronic system that widely dis-seminates to third parties orders entered by an exchange market maker or over-the-counter (OTC) market maker, and permits such orders to be executed against in whole or in part. Financial Services Modernization Act: The Gramm-Leach-Bliley Financial Services Modernization Act of 1999 repealed the restrictions on banks affiliating with securities firms contained in the 1933 Glass-Steagall Act. Among its many provisions, the Act cre-ated a new "financial holding company," which can engage in a statutorily provided list of financial activities, including insurance and securities underwriting and agency activities, merchant banking, and insurance company portfolio investment activities, thus opening up competition among banks, securities companies and insurance companies. For a summary of the Act's provisions, see http://banking.senate.gov/conf/grmleach.htm.

SIA Research Reports, Vol. V, No. 12 (November 17, 2004) 13
U.S. ECONOMIC OUTLOOK
Summary: Losing Momentum
he U.S. economy is losing momentum as 2004 comes to a close. Growth is expected to be slower next year as fiscal stimulus fades, along with positive wealth effects from the appre-
ciation of housing and financial assets. Other dampening influences include the impact of higher interest rates, higher prices for fuel and other commodities and slower growth of real personal income. Combined they are expected to trim real Gross Domestic Product (GDP) growth from 4.4% in 2004 to 2.6% in 2005. Unemployment is expected to stabilize at 5.5% and inflation is expected to rise modestly to an average of 2.9% in 2005 from 2.2% this year.
Contributions to Percent Change in Real Gross Domestic Product and Real GDP Growth(in percent*, quarterly 2003-2005)
-2
-1
0
1
2
3
4
5
6
1Q04 2Q04 3Q04 4Q04 1Q05 2Q05 3Q05 4Q05
*percentage change from preceding period at s.a.a.r.Source: Bureau of Economic Analysis, U.S. Department of Commerce
percent
Consumer Spending
Housing
Business Investment
Government
Net Exports
Inventory Change
Total GDP Growth
Total GDP Growth
actual SIA forecast
T

14 SIA Research Reports, Vol. V, No. 12 (November 17, 2004)
Second Half 2004 Developments: Economic Growth Picked Up in 3Q’04, But Is Expected to Fall Back in 4Q’04. At end-October, the Commerce Department released the first of three estimates of third-quarter 2004 growth for the U.S. economy1. This “advance estimate” placed real GDP growth at an an-nual rate of 3.7%, up from 3.3% in 2Q’042, a result that matched our estimate made last month3 but below the consensus forecast.4 The pick-up in real GDP growth largely reflected an accel-eration of consumer spending and, to a lesser extent, slower import growth (up 7.7% compared with 12.6% in 2Q’04), that was partially offset by weaker growth in housing (up 3.1% after growth of 16.5% in 2Q’04) and a draw down of private inventories (which shaved 0.48 percent-age point from 3Q’04 real GDP growth after adding 0.78 percentage point in 2Q’04). Real consumer spending (personal consumption expenditures or PCE), which represents 70.4% of GDP (the output of goods and services produced by labor and property located in the U.S.) accounted for 87.0% of all growth in GDP during 3Q’04. Motor vehicle sales alone contributed 0.33 percentage point to the 3.71% growth in 3Q’04, after subtracting 0.58 percentage point in the prior quarter. Real PCE expanded 4.6% after an increase of only 1.6% in 2Q’04, as durable goods purchases increased 16.8% in 3Q’04 after a decrease of 0.3% in the prior quarter. Spend-ing on nondurable goods increased 3.9% after a rise of only 0.1% in 2Q’04, while service expen-ditures rose 2.7%, the same pace as in the previous quarter. Growth of business investment slowed slightly but remained robust, increasing 11.7% in 3Q’04 after rising 12.5% at an annual rate in 2Q’04. Housing (real residential fixed investment) in-creased 3.1% in 3Q’04, after a jump of 16.5% in the immediately preceding quarter. Export growth slowed to 5.1% from 7.3%, while state and local government spending contracted 0.5%. Real federal government spending accelerated, rising 4.6% in 3Q’04 after growth of 2.7% in the prior quarter, as a 9.3% surge in defense spending more than offset a 4.7% decrease in non-defense spending. Real GDP growth in the final quarter of 2004 is expected to slow to 3.1%, again led by growth of real PCE, which are forecast to expand 3.6%. The fading of uncertainties surrounding the elec-tions, a retreat of about 15% from the October peak in fuel prices, stronger-than-expected Octo-ber hiring and continued real income gains are bolstering consumer sentiment5 and retail sales in 4Q’04. Industrial production rose 0.7% last month, after a 0.1% increase in September, and housing starts jumped 6.4%, as activity resumed following hurricane season. Additional sup-port for overall growth in real GDP is coming from still strong growth in federal government
1 Gross Domestic Product: Third Quarter 2004 (Advance), U.S. Department of Commerce, Bureau of Economic
Analysis, October 29, 2004. 2 Unless otherwise noted, quarterly real growth of GDP and its components refers to the seasonally adjusted annual
rate of growth from the preceding period. 3 SIA presentation to the N.Y.S. Annual Advisory Board Meeting at the Federal Reserve Board of New York, October
14, 2004. 4 At the time of the release, the Dow Jones Newswires/CNBC survey expected growth of 4.3%, while the Blue Chip
forecast was at 3.8%, after a series of downward revisions. See Economic Trends, November 2004, Federal Re-serve Bank of Cleveland, p. 10.
5 The University of Michigan’s consumer-sentiment index in November rose to 95.5 from 91.7 in October and 94.2 in September.

SIA Research Reports, Vol. V, No. 12 (November 17, 2004) 15
spending (again solely due to sharply higher defense outlays), and an improvement in net ex-ports. Export growth continues to pick up reflecting past declines in the value of the U.S. dol-lar, principally vis-à-vis the euro, while import growth decelerates in line with the overall econ-omy. The growth of business investment is forecast to slow, as concerns about slower expan-sion of final demand in 2005 are reflected in forecasts of single-digit earnings growth, and di-minish the attractiveness of accelerated depreciation provisions that lapse at end-year. The growth of residential investment (housing) is also expected to slow, to 2.0% from 3.1% in 3Q’04.
2003 2004 2005 3Q 4Q 1Q 2Q 3Q 4Q 1Q 2Q 3Q 4Q
GDP 3.0 4.4 2.6 7.4 4.2 4.5 3.3 3.7 3.1 2.6 2.0 1.6 2.6 Personal Consumption Expenditures (PCE) 3.3 3.7 2.9 5.0 3.6 4.1 1.6 4.6 3.6 2.7 2.5 1.5 2.8
—Durables 7.4 6.6 4.3 16.5 3.9 2.2 -0.3 16.8 3.5 4.1 4.0 -2.0 2.8
—Nondurables 3.7 4.3 2.7 6.9 5.1 6.7 0.1 3.9 2.9 2.7 2.5 2.3 3.0
—Services 2.2 2.5 2.6 1.9 2.8 3.3 2.7 2.7 2.5 2.4 2.2 2.0 2.7
Business Investment 3.3 10.0 5.9 15.7 11.0 4.2 12.5 11.7 4.1 4.0 3.1 3.2 3.8
—Structures -5.6 1.8 3.8 -1.3 7.9 -7.6 6.9 1.4 4.2 4.9 3.2 3.2 3.2
—Equipment and Software 6.4 11.5 6.4 21.7 12.0 8.0 14.2 14.9 4.1 2.5 3.1 3.1 4.0
Housing 8.8 9.8 0.2 22.4 9.6 5.0 16.5 3.1 2.0 -3.0 -3.5 -1.5 0.0
Exports 1.9 8.7 6.5 11.3 17.5 7.3 7.3 5.1 6.1 6.0 7.0 6.9 7.5
Imports 4.4 10.0 5.7 2.8 17.1 10.6 12.6 7.7 7.2 5.5 4.0 2.0 4.2
Government 2.8 2.2 2.1 0.1 1.6 2.5 2.2 1.4 3.1 2.5 2.5 -0.6 2.0
—Federal 6.6 5.0 4.3 -3.3 4.8 7.1 2.7 4.6 6.7 7.0 3.3 -1.4 3.2
—State and Local 0.7 0.6 0.7 2.2 -0.1 0.0 1.9 -0.5 0.6 0.4 2.0 0.0 1.3
Inflation(percent change from preceding period)
—GDP deflator 1.8 2.2 2.9 1.4 1.6 2.8 3.2 1.3 2.6 3.2 3.4 3.0 2.9
—PCE deflator 1.9 2.3 2.9 1.6 1.2 3.3 3.1 1.1 2.3 3.6 3.2 3.3 3.4
Source: BEA; SIA estimates and forecast.
20052003 2004
Real GDP: Percent Change from Preceding Periodat seasonally adjusted annual rates (s.a.a.r.)

16 SIA Research Reports, Vol. V, No. 12 (November 17, 2004)
Long vs. Short-Term Interest Rates(monthly averages)
0123456789
101112131415161718
58 60 62 64 66 68 70 72 74 76 78 80 82 84 86 88 90 92 94 96 98 00 02 04
Source: Federal Reserve Board of Governors, SIA forecasts (11/04 - 12/05)
Percent
3-Month T-Bill
10-Year Treasury
Treasury Spread(10-Year Treasury less 3-Month T Bill)
-300
-200
-100
0
100
200
300
400
500
58 60 62 64 66 68 70 72 74 76 78 80 82 84 86 88 90 92 94 96 98 00 02 04
Source: Federal Reserve Board of Governors, SIA forecasts (11/04 - 12/05)
Basis Points

SIA Research Reports, Vol. V, No. 12 (November 17, 2004) 17
Outlook for 2005: Reversion to the Mean Policy Shifts to Neutral Real GDP growth over the 12 quarters from 1Q’02 through 4Q’04 averaged 3.4%, well above the economy’s long run average of 2.6%. In large part this above-trend growth rate over the past three years reflected highly stimulative fiscal and monetary policies. However, both will be neutral in 2005. A series of tax-cut packages during the first Bush term have boosted both con-sumer and investment spending, but their impact has begun to fade. The cost of these meas-ures, when added to higher defense spending, drove fiscal accounts from a surplus of $127 bil-lion in FY’01 (equivalent to 1.3% of GDP) to a deficit of $413 billion in FY’04. This latter figure is equivalent to 3.5% of GDP, a level well above the long-run average for the fiscal deficit (equal to 2.2% of GDP). This shortfall may be sufficiently large to deter further major fiscal stimulus,6 and in the absence of further legislative action, the deficit is expected to stabilize at about 3.5% of GDP. Meanwhile, a period of extraordinarily accommodative monetary policy has come to an end. At its most recent meeting on November 10, the Federal Open Market Committee (FOMC) raised its target federal funds rate 25 basis points (bp) to 2.0%. This was the fourth such quar-ter-point increase since the tightening phase began (on June 30, 2004) to lift this target rate from the historic low of 1.0% reached in June 2003. Limiting the impact of these increases in the tar-get federal funds rate was a downward shift in the yield curve across all intermediate- and long-term maturities. The yields on 5- and 7-year Treasury maturities fell roughly 55 bps, while both the 10- and 20-year yields dropped about 60 bps. As a result the spread between three-month T-bills and the benchmark 10-year Treasury bond narrowed by 140 bps. Corporate credit spreads continued to contract as well, as fears of accelerating inflation were dissipated by the Fed’s action and by better-than-expected price numbers for 3Q’04. The Fed’s successful efforts to ensure greater transparency and maintain a gradualist stance have allowed the market to easily anticipate the first four rate increases and mitigate the impact of these moves. However, the timing and magnitude of prospective interest-rate increases is less certain and will likely be tailored to changes in economic prospects as they emerge.7 With short-term interest rates still negative in real terms (yields below the expected rate of inflation), and inflation picking up in 4Q04,8 further increases are expected. Whether or not the FOMC forgoes the opportunity to raise rates at its next meeting in December, before resuming early in the New Year with a second series of quarter-point increases, is less important than recognizing that higher rates should contribute significantly to slower growth in 2005. Wealth Effects Dissipate These policies have also contributed to significant increases in both the value of residential housing and the value of equities, adding to the wealth and perceived well-being of American households. A significant and rising portion of the increase in the value of residential and secu-
6 U.S. Economy Chartbook, UBS Investment Research, Global Economic & Strategy Research, October 13, 2004,
p.6, from CBO data. 7 See the minutes of the FOMC meeting on September 21. Future rate changes “would need to be increasingly
keyed to incoming data.” See also Greg Ip, “Fed Officials Indicate Willingness to Slow Pace of Rate Increases,” Wall Street Journal, November 15, 2004, p. A5.
8 Producer prices rose 1.7% in October, while the core (excluding food and fuel) rate rose 0.3%. Consumer prices rose 0.6% s.a.a.r. from the prior month, with the core rate up 0.2%.

18 SIA Research Reports, Vol. V, No. 12 (November 17, 2004)
rities investments is extracted by individuals and spent on additional consumption. Take, for example, the increase in the value of residential housing, which has on average increased $947 billion annually during since end-1999. A portion of this increased wealth has been extracted via mortgage equity withdrawals (home equity loans, refinancings and net sales) and a signifi-cant portion of that amount, in turn, is spent on additional consumption apart from spending on capital. This “wealth effect” has, on average, contributed about 0.5 percentage point to GDP growth annually over this period.
Holding Gains on Assets (1)
-3
-2
-1
0
1
2
3
4
5
1998 1999 2000 2001 2002 2003 2004e 2005fSources: U.S. Flow of Funds Accounts; Federal Reserve Board of Governors, Table R.100, September 16, 2004; and SIA estimates (based on data through end October) and forecasts.
$ trillions
Real EstateEquity (2)Mutual FundsOther Assets (3)
(1) Holding gains on assets stated at market value of households and non-profit organizations. Calculated as the change on the amount outstanding less net purchases during the period.
(2) Excludes equity in non-corporate business. (3) Includes: equity on non-corporate businesses; life insurance and pension-fund reserves; and, investment in bank per-
sonal trusts and estates. With over half of all U.S. households now owning equities, either directly or through mutual funds, changes in equity values can have a profound effect on consumption patterns of Ameri-cans. For example, in 2002 the last leg of a long bear market erased more than $1.95 trillion from the value of household holdings of equities and mutual funds, but was followed by a steady rebound across 2003 that restored nearly the same amount ($1.85 trillion) to the value of household financial assets. This cyclical swing first depressed consumption in 2002, then

SIA Research Reports, Vol. V, No. 12 (November 17, 2004) 19
boosted it in 2003, with the estimated value of this “swing” across the course of these two years equal to 1.0% of GDP.
Wealth Effects: Estimated Change in Real GDP GrowthDue to Holding Gains on Household Assets
-0.75
-0.50
-0.25
0.00
0.25
0.50
0.75
1.00
1.25
1.50
1.75
1998 1999 2000 2001 2002 2003 2004e 2005f
Sources: U.S. Flow of Funds Accounts; Board of Governors of the Federal Reserve;BEA; and SIA estimates and forecasts.
percent of GDP
Real EstateEquity and Mutual FundsOther
However, prospects for increases in 2005 in the prices of residential housing and securities are relatively poor. Housing prices are expected to flatten out after years of above-trend gains. Eq-uity prices have, since December 1, 2003, been confined within a relatively narrow trading range, and by most measures stocks remain “overvalued” on a fundamental basis, with real earnings growth expected to decline to the mid-single digit range (6%-8%) in the first half of 2005 and equity prices expected to show, at best, only modest gains. Fixed-income securities are expected to fare even more poorly as rising interest rates, with significant lags, lead to a steepening of the yield curve and a widening of credit spreads. Absent the strong wealth effects seen in the past two years, prospects for growth in 2005 will remain dim. Oil Prices: A Structural Shift Another significant factor weighing heavily on growth prospects for 2005 is the recent increase in energy prices and prospects that prices will remain relatively high, at least during the first half of next year. During 3Q’04, the price of West Texas Intermediate (WTI), an actively traded benchmark for light, sweet crude oil, averaged $43.86 per barrel, an increase of $5.53 per barrel

20 SIA Research Reports, Vol. V, No. 12 (November 17, 2004)
from 2Q’04, and $13.65 per barrel, or 45.2% higher than in 3Q’03. Oil prices continued their as-cent in October to an average of $53.13 per barrel, before falling back some 15% in November. For 2004 as a whole, the price of WTI is expected to average $41.70 per barrel, which is $10.56 per barrel higher than in 2003, and will remain high at an average of $36.75 in 2005.
Spot Oil Price: West Texas Intermediate
0
10
20
30
40
50
60
F-97
M-97
A-97
N-97
F-98
M-98
A-98
N-98
F-99
M-99
A-99
N-99
F-00
M-00
A-00
N-00
F-01
M-01
A-01
N-01
F-02
M-02
A-02
N-02
F-03
M-03
A-03
N-03
F-04
M-04
A-04
N-04
F-05
M-05
A-05
N-05
Source: Economic Data - FRED II (Federal Reserve Bank of St. Louis)
dollars per barrel
1997 1998 1999 2000 2001 2002 2003 2004 2005
The impact of higher oil prices depends not only on how high prices rise but how long they re-main at elevated levels and on the nature of the adjustment process. Currently, global oil sup-ply and demand are again in rough balance, estimated at 82.4 million barrels per day (mbd), af-ter demand rose sharply in response to real global economic growth of 5.0%, the fastest pace in two decades. In 2005, demand is expected to rise more slowly, restrained by higher prices. The degree to which demand growth slows depends in large part on activity and aggregate demand management policies in the countries where demand for oil is growing most rapidly: China, In-dia and the U.S. Inventories are still lean, albeit modestly improving, which leaves consumers vulnerable to a number of potential supply disruptions. This, along with scarce unutilized ca-pacity and greater difficulties and costs incurred to develop new supplies, makes it appear unlikely that oil prices would revert to the range prevailing before prices move sharply higher in the past two years, without a sharp contraction in demand. More likely is that oil markets are in the process of establishing a new price range above $34 per barrel.9 Initially, the increase in oil prices will transfer income from consumers to producers, who, in turn, accumulate a large portion of their windfall in unspent financial balances, unleashing con-tractionary forces and giving a boost to cost-push inflation. During a transition phase, oil pro-ducers gradually deploy their suddenly swollen cash balances, purchasing goods and services
9 See ‘The End of Cheap Money, The End of Cheap Oil’ in “Economic Update and Outlook,” SIA Research Reports,
Vol. V, No. 7 (July 1, 2004), p. 31.

SIA Research Reports, Vol. V, No. 12 (November 17, 2004) 21
Spot Oil Price: West Texas Intermediate
0
5
10
15
20
25
30
35
40
45
50
55
60
72 73 74 75 76 77 78 79 80 81 82 83 84 85 86 87 88 89 90 91 92 93 94 95 96 97 98 99 00 01 02 03 04 05
Source: Economic Data - FRED II (Federal Reserve Bank of St. Louis)
dollars per barrel
from oil consumers and investing a portion of the remainder in financial assets in global finan-cial markets. This “recycling” of a portion of the surplus will offset some of the initial contrac-tionary forces, but only partially and with a lag. In the near term, it is estimated that higher oil prices have trimmed 0.25 percentage point from second-half 2004 growth and 0.4 to 0.5 percent-age point from real GDP growth in the first half of 2005.
Conclusion: Slumping into the New Year All things considered, we have left our June 2004 forecast for next year unchanged. Real GDP growth is expected to decline to 2.6% in 2005 from 4.4% in 2004. Growth is expected to be led by a 2.9% increase in real PCE and 5.9% growth in business investment. Growth will be con-strained by stagnant residential investment and slower growth in government spending and in-ventories. Net exports are expected to stabilize at current levels and begin to make a positive contribution to overall growth as the year progresses. Continued, albeit gradual, improvement in the yawning current account deficit is expected, reflecting both past declines in the dollar and the expectation that the Chinese renminbi will be “unshackled” and permitted to rise modestly, in a controlled manner, along with some other Asian currencies, against the dollar. Inflation is expected to pick up moderately in early 2005, before stabilizing at around 3% in the second half of the year. Annual average employment growth is expected to pick up from 1.0% in 2004 to 1.6% in early 2005, and stabilize unemployment at about 5.5% of the economically active popu-lation, before employment growth slows late next year. Frank A. Fernandez Senior Vice President, Chief Economist and Director, Research

22 SIA Research Reports, Vol. V, No. 12 (November 17, 2004)
MONTHLY STATISTICAL REVIEW
U.S. Equity Market Activity
tock Prices – U.S. stocks slumped through the first three weeks of October, mainly driven by a rise in oil prices to a new all-time high of $55.67 per barrel on the New York Mercantile
Exchange. Also weighing down the market was news of an investigation of abuses in the insur-ance industry by the New York Attorney General and uncertainty about the outcome of the up-coming presidential election. A subsequent decline in crude oil prices to $51.76 a barrel contrib-uted to a rally that sent all three major market indices up around 3% in the final week of Octo-ber. For the month overall, the S&P 500 Stock Index advanced 1.4%, its third-straight monthly in-crease. The Nasdaq Composite index gained 4.1%, its best monthly performance this year, as some bellwether technology companies reported better-than-expected earnings. The Dow Jones Industrial Average slipped 0.5% on the month despite bouncing off a new year-to-date low in the final week. Since the start of the year, the S&P 500 has risen 1.6%, while the DJIA and Nasdaq Composite lost 4.1% and 1.4%, respectively.
700
800
900
1000
1100
1200
1300
J F M A M J J A S O N D J F M A M J J A S O N D J F M A M J J A S O1000
1200
1400
1600
1800
2000
2200S&P 500Nasdaq
S&P 500
Daily Closing Stock PricesNasdaq
Composite
'02 '03 '04
Share Volume – Trading activity on the major exchanges increased for the second consecutive month from depressed August levels. Average daily volume on the NYSE increased 16.7% from 1.32 billion shares in September to 1.54 billion shares in October. That represented the sec-ond busiest month of the year, behind the 1.66 billion daily share average in January. October’s results lifted the year-to-date average to 1.45 billion shares daily, up 3.9% from the 1.40 billion daily average for all of 2003.
S

SIA Research Reports, Vol. V, No. 12 (November 17, 2004) 23
Nasdaq volume climbed 14.6% from September’s level to 1.73 billion shares daily in October, its heaviest monthly volume since July. That brought the year-to-date daily average to 1.77 billion shares, a 5.2% increase over last year’s 1.69 billion daily average.
(Mils. Of Shs.)
0
500
1,000
1,500
2,000
2,500
99 00 01 02 03 04
Nasdaq
NYSE
Average Daily Share Volume
1999 2000 2001 2002 2003 2004
Dollar Volume – Increased trading activity and higher share prices lifted the value of trading in NYSE and Nasdaq stocks the past two months. Average daily dollar volume in NYSE stocks climbed 18.4% to $49.5 billion in October from $41.8 billion in September. Year-to-date, NYSE average daily dollar volume of $45.6 billion stands 18.4% above 2003’s $38.5 billion daily aver-age and is running 3.9% ahead of the $43.9 billion daily record set in 2000.
($ Billions)
Average Daily Dollar Volume
0
20
40
60
80
100
120
99 00 01 02 03 04
Nasdaq
NYSE
1999 2000 2001 2002 2003 2004

24 SIA Research Reports, Vol. V, No. 12 (November 17, 2004)
Nasdaq average daily dollar volume jumped 18.6% in October to $34.5 billion from $29.1 billion in September. Through the first 10 months of 2004, Nasdaq daily dollar volume averaged $33.7 billion, up 20.4% from last year’s $28.0 billion annual average, but still 58.3% below the 2000 re-cord of $80.9 billion. Interest Rates – Long-term Treasury yields trended downward for the fourth consecutive month. Contributing to the recent bond market rally was the Commerce Department report that the U.S. economy grew at a 3.7% annual rate in the third quarter. Although that marked an improvement over the 3.3% growth rate in the second quarter, it was below forecasts for a 4.3% gain. In addition, the core inflation rate increased at a 0.7% annualized pace during the third quarter, the slowest in more than 40 years. The yield on the 10-year Treasury note closed the month at 4.05%, down nine basis points from 4.14% the previous month. On the shorter end of the curve, the 3-month Treasury bill yield rose 19 basis points from September’s close to end October at 1.87%, continuing its year-long up-ward trajectory.
Short vs. Long-Term Interest Rates
0
1
2
3
4
5
6
7
8
99 00 01 02 03 04
3-Mo T-Bill
10-Yr Treasury
(Percent)
1999 2000 2001 2002 2003 2004

SIA Research Reports, Vol. V, No. 12 (November 17, 2004) 25
U.S. Underwriting Activity Total Underwriting – New issuance activity slowed considerably in October. Total underwrit-ing volume sank 49.6% to $137.0 billion in October from September’s $271.8 billion, and marked the lowest monthly total in nearly four years (December 2000). Year-to-date volume of $2.37 trillion is 5.0% below the $2.49 trillion underwritten in last year’s first 10 months.
($ Billions)
Monthly Total Underwriting
0
50
100
150
200
250
300
350
99 00 01 02 03 04
EquityDebt
1999 2000 2001 2002 2003 2004
Source: Thomson Financial
Corporate debt underwriting, which always accounts for around 90% of the total volume, fell 51.9% in October to $122.2 billion from $254.1 billion in September. This was also the slowest monthly debt underwriting volume since December 2000. Preliminary figures indicate that as-set-backed issuance plunged 60.5% from $123.8 billion in September to $48.9 billion in October. However, it should be noted that these figures are subject to substantial upward revisions. Straight corporate publicly underwritten bonds fell 44.3% to $72.3 billion in October from $129.8 billion in September. For the first 10 months of 2004 versus the same period in 2003, both straight corporate and asset-backed debt offerings, as well as total publicly underwritten bond sales, were all down 7%. Demand for debt instruments was weak in October, given investors’ anticipation of an immi-nent bump up in yields, which indeed occurred at the beginning of November when the Fed raised short-term rates for the fourth time this year, effectively doubling the yield from 1% in June to 2%.

26 SIA Research Reports, Vol. V, No. 12 (November 17, 2004)
Monthly Corporate Debt Underwriting
0
50
100
150
200
250
300
350
99 00 01 02 03 04
Asset-BackedConvertsStraight Debt
($ Billions)
1999 2000 2001 2002 2003 2004
Source: Thomson Financial
Equity Underwriting – Although October’s equity underwriting volume of $14.7 billion was off 16.9% from September’s level, the year-to-date total to $170.1 billion is still 35.8% ahead of last year’s January-October volume of $125.2 billion.
($ Billions)
Monthly Equity Underwriting
0
5
10
15
20
25
30
35
99 00 01 02 03 04
All IPOsPreferredsSecondaries
1999 2000 2001 2002 2003 2004Source: Thomson Financial

SIA Research Reports, Vol. V, No. 12 (November 17, 2004) 27
Initial Public Offerings (IPOs) – October’s domestic IPO volume (excluding closed-end funds) of $5.7 billion was double the $2.8 billion in IPO activity in September. Other than the $6.3 bil-lion worth of IPOs sold in July, October’s IPO volume was the highest in more than three years. The strong aftermarket performance of Google’s long-awaited IPO, whose shares have more than doubled from its offering price of $85 in August to $190.64 in October, was a key, but not sole, factor in renewed investor interest in the IPO market. The number of deals also nearly doubled in October, rising to 33 from 18 in September. Year-to-date, true IPO volume of $37.4 billion is quadruple the $8.8 billion underwritten in the same 10 months last year.
Monthly IPO Activity(excluding closed-end funds)
0
3
6
9
12
15
18
99 00 01 02 03 040
12
24
36
48
60
72$ Volume# Deals
$ Volume ($Bils.)
# of Deals
1999 2000 2001 2002 2003 2004Source: Thomson Financial
The IPO backlog fell to $22.2 billion in early November from $33.6 billion a month ago, mainly because more deals were being taken out of the pipeline than could be replenished. With IPO demand increasing, the pipeline is expected to substantially fill up by the holidays.

28 SIA Research Reports, Vol. V, No. 12 (November 17, 2004)
Monthly IPO Backlog(as of first of the month)
$Billions# of
Deals
Source: Dealogic
12.4 10.5
34.742.4
32.4 33.6
22.2
34.542.7
20.5
5.1 6.3 8.614.3 15.5
0
5
10
15
20
25
30
35
40
45
Sep-03
Oct Nov Dec Jan-04
Feb Mar Apr May Jun Jul Aug Sep Oct Nov0
50
100
150
200
250$ Billions# Deals
Secondary Offerings of Common Stock – Secondary offerings of common stock, although down 52.3% in October to $5.3 billion, are still up 33.9% for the year, with $80.4 billion underwritten through October versus $60.0 billion during the same period in 2003.
Common Stock Secondary Offerings
0
5
10
15
20
25
99 00 01 02 03 040
15
30
45
60
75$ Volume# Deals
$ Volume ($Bils.)
# of Deals
1999 2000 2001 2002 2003 '04Source: Thomson Financial
Grace Toto Vice President and Director, Statistics

SIA Research Reports, Vol. V, No. 12 (November 17, 2004) 29
U.S. CORPORATE UNDERWRITING ACTIVITY (In $ Billions)
Straight Con- Asset- TOTAL Corporate vertible Backed TOTAL Common Preferred TOTAL All "True" UNDER- Debt Debt Debt DEBT Stock Stock EQUITY IPOs IPOs Secondaries WRITINGS 1985 76.4 7.5 20.8 104.7 24.7 8.6 33.3 8.5 8.4 16.2 138.0 1986 149.8 10.1 67.8 227.7 43.2 13.9 57.1 22.3 18.1 20.9 284.8 1987 117.8 9.9 91.7 219.4 41.5 11.4 52.9 24.0 14.3 17.5 272.3 1988 120.3 3.1 113.8 237.2 29.7 7.6 37.3 23.6 5.7 6.1 274.5 1989 134.1 5.5 135.3 274.9 22.9 7.7 30.6 13.7 6.1 9.2 305.5 1990 107.7 4.7 176.1 288.4 19.2 4.7 23.9 10.1 4.5 9.0 312.3 1991 203.6 7.8 300.0 511.5 56.0 19.9 75.9 25.1 16.4 30.9 587.4 1992 319.8 7.1 427.0 753.8 72.5 29.3 101.8 39.6 24.1 32.9 855.7 1993 448.4 9.3 474.8 932.5 102.4 28.4 130.8 57.4 41.3 45.0 1,063.4 1994 381.2 4.8 253.5 639.5 61.4 15.5 76.9 33.7 28.3 27.7 716.4 1995 466.0 6.9 152.4 625.3 82.0 15.1 97.1 30.2 30.0 51.8 722.4 1996 564.8 9.3 252.9 827.0 115.5 36.5 151.9 50.0 49.9 65.5 979.0 1997 769.8 8.5 385.6 1,163.9 120.2 33.3 153.4 44.2 43.2 75.9 1,317.3 1998 1,142.5 6.3 566.8 1,715.6 115.0 37.8 152.7 43.7 36.6 71.2 1,868.3 1999 1,264.8 16.1 487.1 1,768.0 164.3 27.5 191.7 66.8 64.3 97.5 1,959.8 2000 1,236.2 17.0 393.4 1,646.6 189.1 15.4 204.5 76.1 75.8 112.9 1,851.0 2001 1,511.2 21.6 832.5 2,365.4 128.4 41.3 169.7 40.8 36.0 87.6 2,535.1 2002 1,303.2 8.6 1,115.4 2,427.2 116.4 37.6 154.0 41.2 25.8 75.2 2,581.1 2003 1,370.7 10.6 1,352.3 2,733.6 118.5 37.8 156.3 43.7 15.9 74.8 2,889.9 2003 Jan 150.3 0.0 162.5 312.7 6.8 1.9 8.8 1.0 0.0 5.8 321.5 Feb 114.7 0.0 104.1 218.8 4.7 3.6 8.3 1.9 0.5 2.8 227.1 Mar 141.9 0.1 140.2 282.3 4.8 1.8 6.5 3.3 0.1 1.5 288.8 Apr 101.5 1.3 113.6 216.5 6.4 3.6 10.0 2.5 0.0 3.9 226.5 May 120.7 3.0 118.7 242.4 10.9 4.1 15.0 3.4 0.1 7.5 257.4 June 118.0 5.1 114.7 237.9 13.1 6.8 19.9 7.0 1.7 6.1 257.8 July 96.4 0.4 114.0 210.8 12.9 2.4 15.3 5.2 1.8 7.7 226.1 Aug 72.7 0.0 97.5 170.3 8.4 2.7 11.1 3.0 1.6 5.5 181.4 Sept 137.4 0.0 133.9 271.3 14.9 3.0 17.9 3.5 1.4 11.4 289.2 Oct 110.5 0.1 90.6 201.2 10.2 2.3 12.4 2.3 1.5 7.8 213.6 Nov 97.4 0.0 103.1 200.6 14.0 2.5 16.6 4.8 2.1 9.3 217.1 Dec 109.1 0.6 59.3 169.0 11.3 3.2 14.5 5.9 5.1 5.5 183.5
2004 Jan 139.4 1.4 80.3 221.1 15.6 2.6 18.2 4.4 0.5 11.2 239.2 Feb 131.8 0.7 108.1 240.5 20.5 6.9 27.4 9.8 5.5 10.7 267.9 Mar 170.0 0.6 145.1 315.7 19.8 3.1 22.8 6.7 2.2 13.0 338.5 Apr 99.2 0.3 101.3 200.8 12.0 2.1 14.1 4.1 1.8 7.9 214.9 May 81.3 0.1 108.1 189.4 12.2 4.8 17.0 4.6 3.8 7.6 206.4 June 106.0 0.0 140.4 246.4 11.8 1.0 12.9 4.5 3.8 7.4 259.2 July 78.1 0.0 112.6 190.8 11.1 0.9 12.0 7.4 6.3 3.7 202.8 Aug 80.5 0.0 134.1 214.6 8.6 4.8 13.4 5.9 5.1 2.6 228.0 Sept 129.8 0.6 123.8 254.1 15.0 2.7 17.7 3.9 2.8 11.1 271.8 Oct 72.3 1.0 48.9 122.2 13.6 1.1 14.7 8.3 5.7 5.3 137.0 Nov Dec YTD '03 1,164.1 10.0 1,189.9 2,364.1 93.1 32.1 125.2 33.0 8.8 60.0 2,489.3 YTD '04 1,088.3 4.7 1,102.6 2,195.6 140.1 30.0 170.1 59.7 37.4 80.4 2,365.7 % Change -6.5% -53.0% -7.3% -7.1% 50.5% -6.6% 35.8% 80.7% 325.6% 33.9% -5.0% Note: IPOs and secondaries are subsets of common stock. “True” IPOs exclude closed-end funds. Source: Thomson Financial

30 SIA Research Reports, Vol. V, No. 12 (November 17, 2004)
MUNICIPAL BOND UNDERWRITINGS INTEREST RATES (In $ Billions) (Averages) Compet. Nego. TOTAL TOTAL Rev. Rev. REVENUE Compet. Nego. TOTAL MUNICIPAL 3-Mo. 10-Year Bonds Bonds BONDS G.O.s G.O.s G.O.s BONDS T Bills Treasuries SPREAD 1985 10.2 150.8 161.0 17.6 22.8 40.4 201.4 7.47 10.62 3.15 1986 10.0 92.6 102.6 23.1 22.6 45.7 148.3 5.97 7.68 1.71 1987 7.1 64.4 71.5 16.3 14.2 30.5 102.0 5.78 8.39 2.61 1988 7.6 78.1 85.7 19.2 12.7 31.9 117.6 6.67 8.85 2.18 1989 9.2 75.8 85.0 20.7 17.2 37.9 122.9 8.11 8.49 0.38 1990 7.6 78.4 86.0 22.7 17.5 40.2 126.2 7.50 8.55 1.05 1991 11.0 102.1 113.1 29.8 28.1 57.9 171.0 5.38 7.86 2.48 1992 12.5 139.0 151.6 32.5 49.0 81.5 233.1 3.43 7.01 3.58 1993 20.0 175.6 195.6 35.6 56.7 92.4 287.9 3.00 5.87 2.87 1994 15.0 89.2 104.2 34.5 23.2 57.7 161.9 4.25 7.09 2.84 1995 13.5 81.7 95.2 27.6 32.2 59.8 155.0 5.49 6.57 1.08 1996 15.6 100.1 115.7 31.3 33.2 64.5 180.2 5.01 6.44 1.43 1997 12.3 130.2 142.6 35.5 36.5 72.0 214.6 5.06 6.35 1.29 1998 21.4 165.6 187.0 43.7 49.0 92.8 279.8 4.78 5.26 0.48 1999 14.3 134.9 149.2 38.5 31.3 69.8 219.0 4.64 5.65 1.01 2000 13.6 116.2 129.7 35.0 29.3 64.3 194.0 5.82 6.03 0.21 2001 17.6 164.2 181.8 45.5 56.3 101.8 283.5 3.39 5.02 1.63 2002 19.5 210.5 230.0 52.3 73.1 125.4 355.4 1.60 4.61 3.01 2003 21.1 215.8 236.9 54.7 87.7 142.4 379.3 1.01 4.02 3.00 2003 Jan 1.4 16.8 18.2 4.4 4.3 8.8 27.0 1.17 4.05 2.88 Feb 1.8 15.6 17.4 5.1 7.6 12.8 30.2 1.17 3.90 2.73 Mar 2.0 16.4 18.4 4.2 5.5 9.7 28.1 1.13 3.81 2.68 Apr 1.6 18.4 20.1 4.6 10.2 14.8 34.9 1.13 3.96 2.83 May 3.0 20.3 23.3 5.5 7.1 12.6 35.8 1.07 3.57 2.50 June 2.1 22.6 24.7 6.6 17.1 23.7 48.4 0.92 3.33 2.41 July 2.2 18.5 20.6 6.5 6.1 12.6 33.3 0.90 3.98 3.08 Aug 1.1 17.6 18.7 3.9 3.4 7.2 25.9 0.95 4.45 3.50 Sept 1.4 17.6 18.9 3.6 3.2 6.8 25.7 0.94 4.27 3.33 Oct 1.6 16.7 18.4 3.8 12.2 16.0 34.3 0.92 4.29 3.37 Nov 1.3 16.2 17.5 4.1 4.2 8.3 25.8 0.93 4.30 3.37 Dec 1.7 19.1 20.7 2.3 6.8 9.1 29.8 0.90 4.27 3.37
2004 Jan 0.7 10.4 11.1 3.6 5.6 9.2 20.4 0.88 4.15 3.27 Feb 1.0 13.0 14.1 4.8 7.7 12.5 26.5 0.93 4.08 3.15 Mar 2.7 19.8 22.4 5.6 10.5 16.1 38.5 0.94 3.83 2.89 Apr 1.0 18.1 19.0 3.5 8.2 11.8 30.8 0.94 4.35 3.41 May 1.4 28.1 29.5 3.1 4.7 7.8 37.3 1.02 4.72 3.70 June 1.3 24.0 25.3 4.5 5.4 9.8 35.1 1.27 4.73 3.46 July 1.8 14.6 16.4 5.1 3.7 8.9 25.3 1.33 4.50 3.17 Aug 0.6 15.5 16.1 4.0 7.6 11.6 27.6 1.48 4.28 2.80 Sept 1.7 13.0 14.6 5.3 4.8 10.1 24.7 1.65 4.13 2.48 Oct 2.3 16.8 19.2 5.2 6.1 11.3 30.5 1.76 4.10 2.34 Nov Dec YTD '03 18.1 180.5 198.6 48.3 76.7 125.0 323.6 1.03 3.96 2.93 YTD '04 14.6 173.2 187.8 44.7 64.3 109.0 296.8 1.22 4.29 3.07 % Change -19.6% -4.0% -5.5% -7.5% -16.1% -12.8% -8.3% 18.4% 8.2% 4.6% Sources: Thomson Financial; Federal Reserve
SIA Research Reports, Vol. V, No. 12 (November 17, 2004) 31
STOCK MARKET PERFORMANCE INDICES STOCK MARKET VOLUME VALUE TRADED (End of Period) (Daily Avg., Mils. of Shs.) (Daily Avg., $ Bils.) Dow Jones Industrial S&P NYSE Nasdaq Average 500 Composite Composite NYSE AMEX Nasdaq NYSE Nasdaq 1985 1,546.67 211.28 1,285.66 324.93 109.2 8.3 82.1 3.9 0.9 1986 1,895.95 242.17 1,465.31 348.83 141.0 11.8 113.6 5.4 1.5 1987 1,938.83 247.08 1,461.61 330.47 188.9 13.9 149.8 7.4 2.0 1988 2,168.57 277.72 1,652.25 381.38 161.5 9.9 122.8 5.4 1.4 1989 2,753.20 353.40 2,062.30 454.82 165.5 12.4 133.1 6.1 1.7 1990 2,633.66 330.22 1,908.45 373.84 156.8 13.2 131.9 5.2 1.8 1991 3,168.83 417.09 2,426.04 586.34 178.9 13.3 163.3 6.0 2.7 1992 3,301.11 435.71 2,539.92 676.95 202.3 14.2 190.8 6.9 3.5 1993 3,754.09 466.45 2,739.44 776.80 264.5 18.1 263.0 9.0 5.3 1994 3,834.44 459.27 2,653.37 751.96 291.4 17.9 295.1 9.7 5.8 1995 5,117.12 615.93 3,484.15 1,052.13 346.1 20.1 401.4 12.2 9.5 1996 6,448.27 740.74 4,148.07 1,291.03 412.0 22.1 543.7 16.0 13.0 1997 7,908.25 970.43 5,405.19 1,570.35 526.9 24.4 647.8 22.8 17.7 1998 9,181.43 1,229.23 6,299.93 2,192.69 673.6 28.9 801.7 29.0 22.9 1999 11,497.12 1,469.25 6,876.10 4,069.31 808.9 32.7 1,081.8 35.5 43.7 2000 10,786.85 1,320.28 6,945.57 2,470.52 1,041.6 52.9 1,757.0 43.9 80.9 2001 10,021.50 1,148.08 6,236.39 1,950.40 1,240.0 65.8 1,900.1 42.3 44.1 2002 8,341.63 879.82 5,000.00 1,335.51 1,441.0 63.7 1,752.8 40.9 28.8 2003 10,453.92 1,111.92 6,440.30 2,003.37 1,398.4 67.1 1,685.5 38.5 28.0 2003 Jan 8,053.81 855.70 4,868.68 1,320.91 1,474.7 62.9 1,547.6 37.5 24.7 Feb 7,891.08 841.15 4,716.07 1,337.52 1,336.4 53.6 1,311.4 32.8 20.4 Mar 7,992.13 848.18 4,730.21 1,341.17 1,439.3 64.7 1,499.9 36.3 23.0 Apr 8,480.09 916.92 5,131.56 1,464.31 1,422.7 54.7 1,478.2 37.1 23.5 May 8,850.26 963.59 5,435.37 1,595.91 1,488.6 69.6 1,847.9 39.2 27.4 June 8,985.44 974.50 5505.17 1,622.80 1,516.3 79.5 2,032.2 42.7 32.0 July 9,233.80 990.31 5,558.99 1,735.02 1,451.1 67.4 1,771.7 40.7 30.5 Aug 9,415.82 1,008.01 5,660.16 1,810.45 1,200.3 57.7 1,470.8 34.1 25.3 Sept 9,275.06 995.97 5,644.03 1,786.94 1,436.7 83.9 1,943.2 41.1 33.0 Oct 9,801.12 1,050.71 5,959.01 1,932.21 1,430.0 68.6 1,827.1 41.7 33.1 Nov 9,782.46 1,058.20 6,073.02 1,960.26 1,293.3 71.7 1,821.0 38.5 32.4 Dec 10,453.92 1,111.92 6,440.30 2,003.37 1,275.7 70.4 1,637.0 38.9 29.7
2004 Jan 10,488.07 1,131.13 6,551.63 2,066.15 1,663.1 79.8 2,331.7 50.3 40.9 Feb 10,583.92 1,144.94 6,692.37 2,029.82 1,481.2 75.5 1,917.2 46.3 36.5 Mar 10,357.70 1,126.21 6,599.06 1,994.22 1,477.5 76.7 1,880.6 47.1 34.9 Apr 10,225.57 1,107.30 6,439.42 1,920.15 1,524.7 78.3 1,950.8 49.0 37.3 May 10,188.45 1,120.68 6,484.72 1,986.74 1,500.0 72.1 1,663.6 46.9 32.3 June 10,435.48 1,140.84 6,602.99 2,047.79 1,371.4 57.4 1,623.3 43.5 32.9 July 10,139.71 1,101.72 6,403.15 1,887.36 1,418.1 54.1 1,734.8 44.1 33.2 Aug 10,173.92 1,104.24 6,454.22 1,838.10 1,243.5 49.5 1,431.0 37.7 26.7 Sept 10,080.27 1,114.58 6,570.25 1,896.84 1,322.2 50.5 1,510.7 41.8 29.1 Oct 10,027.47 1,130.20 6,692.71 1,974.99 1,543.5 61.3 1,730.7 49.5 34.5 Nov Dec YTD '03 9,801.12 1,050.71 5,959.01 1,932.21 1,420.7 66.4 1,678.3 38.4 27.4 YTD '04 10,027.47 1,130.20 6,692.71 1,974.99 1,452.3 65.4 1,773.3 45.6 33.7 % Change 2.3% 7.6% 12.3% 2.2% 2.2% -1.6% 5.7% 18.6% 23.0%

32 SIA Research Reports, Vol. V, No. 12 (November 17, 2004)
MUTUAL FUND ASSETS MUTUAL FUND NET NEW CASH FLOW* ($ Billions) ($ Billions)
Total Long- Money TOTAL Money Term Equity Hybrid Bond Market ASSETS Equity Hybrid Bond Market TOTAL Funds 1985 116.9 12.0 122.6 243.8 495.4 8.5 1.9 63.2 -5.4 68.2 73.6 1986 161.4 18.8 243.3 292.2 715.7 21.7 5.6 102.6 33.9 163.8 129.9 1987 180.5 24.2 248.4 316.1 769.2 19.0 4.0 6.8 10.2 40.0 29.8 1988 194.7 21.1 255.7 338.0 809.4 -16.1 -2.5 -4.5 0.1 -23.0 -23.1 1989 248.8 31.8 271.9 428.1 980.7 5.8 4.2 -1.2 64.1 72.8 8.8 1990 239.5 36.1 291.3 498.3 1,065.2 12.8 2.2 6.2 23.2 44.4 21.2 1991 404.7 52.2 393.8 542.5 1,393.2 39.4 8.0 58.9 5.5 111.8 106.3 1992 514.1 78.0 504.2 546.2 1,642.5 78.9 21.8 71.0 -16.3 155.4 171.7 1993 740.7 144.5 619.5 565.3 2,070.0 129.4 39.4 73.3 -14.1 228.0 242.1 1994 852.8 164.5 527.1 611.0 2,155.4 118.9 20.9 -64.6 8.8 84.1 75.2 1995 1,249.1 210.5 598.9 753.0 2,811.5 127.6 5.3 -10.5 89.4 211.8 122.4 1996 1,726.1 252.9 645.4 901.8 3,526.3 216.9 12.3 2.8 89.4 321.3 232.0 1997 2,368.0 317.1 724.2 1,058.9 4,468.2 227.1 16.5 28.4 102.1 374.1 272.0 1998 2,978.2 364.7 830.6 1,351.7 5,525.2 157.0 10.2 74.6 235.3 477.1 241.8 1999 4,041.9 383.2 808.1 1,613.1 6,846.3 187.7 -12.4 -5.5 193.6 363.4 169.8 2000 3,962.0 346.3 811.1 1,845.2 6,964.7 309.4 -30.7 -49.8 159.6 388.6 228.9 2001 3,418.2 346.3 925.1 2,285.3 6,975.0 31.9 9.5 87.7 375.6 504.8 129.2 2002 2,667.0 327.4 1,124.9 2,272.0 6,391.3 -27.7 8.6 140.3 -46.7 74.5 121.2 2003 3,684.8 436.7 1,240.9 2,051.7 7,414.1 151.4 33.3 31.3 -258.5 -42.5 216.1 2003 Jan 2,597.7 324.7 1,138.2 2,273.6 6,334.2 -0.3 1.1 12.9 -1.1 12.6 13.7 Feb 2,537.8 322.9 1,171.1 2,236.2 6,268.0 -10.9 0.1 19.6 -39.5 -30.7 8.8 Mar 2,551.3 325.3 1,183.3 2,204.7 6,264.6 0.0 0.9 10.5 -32.3 -20.9 11.4 Apr 2,770.3 346.8 1,210.5 2,157.7 6,485.3 16.1 2.7 10.5 -53.8 -24.5 29.3 May 2,958.5 365.8 1,238.7 2,140.6 6,703.6 11.9 3.0 8.9 -18.3 5.6 23.8 June 3,031.1 373.6 1,248.4 2,164.4 6,817.5 18.6 3.9 5.1 22.3 49.9 27.7 July 3,126.0 376.4 1,212.1 2,152.5 6,867.0 21.5 3.4 -10.9 -12.9 1.1 14.0 Aug 3,238.5 382.3 1,209.4 2,141.0 6,971.2 23.6 3.3 -12.6 -20.2 -5.9 14.3 Sept 3,228.5 388.2 1,231.3 2,100.0 6,948.0 17.5 3.8 -5.9 -50.5 -35.1 15.4 Oct 3,440.4 405.9 1,226.6 2,080.1 7,153.0 25.3 4.1 -1.3 -22.1 6.0 28.1 Nov 3,513.3 416.4 1,232.7 2,071.7 7,234.1 14.9 3.0 -2.6 -7.6 7.8 15.3 Dec 3,684.8 436.7 1,240.9 2,051.7 7,414.1 14.2 3.6 -3.3 -22.6 -8.1 14.6
2004 Jan 3,805.1 447.8 1,249.9 2,034.3 7,537.1 43.0 5.5 -0.3 -19.8 28.4 48.2 Feb 3,896.3 458.6 1,262.4 2,016.6 7,633.9 26.2 5.0 1.5 -21.0 11.8 32.8 Mar 3,887.5 456.3 1,278.9 2,006.6 7,629.3 16.0 4.8 7.8 -10.3 18.3 28.6 Apr 3,811.4 452.3 1,246.8 1,961.9 7,472.4 23.0 4.6 -7.8 -46.3 -26.6 19.8 May 3,855.1 456.9 1,224.4 1,969.7 7,506.1 0.4 2.3 -16.2 6.6 -7.0 -13.5 June 3,948.9 466.9 1,221.0 1,948.8 7,585.6 10.4 2.4 -7.6 -21.9 -16.6 5.2 July 3,797.3 462.3 1,230.0 1,947.1 7,436.7 9.4 3.0 -1.2 -3.2 8.0 11.2 Aug 3,803.6 469.9 1,252.8 1,934.7 7,461.0 1.2 2.6 4.2 -13.5 -5.6 8.0 Sept 3,916.0 478.9 1,263.3 1,893.1 7,551.3 10.1 3.0 2.8 -43.2 -27.3 15.9 Oct Nov Dec YTD '03 3,228.5 388.2 1,231.3 2,100.0 6,948.0 98.2 22.1 38.2 -206.2 -47.8 158.4 YTD '04 3,916.0 478.9 1,263.3 1,893.1 7,551.3 139.6 33.2 -16.7 -172.6 -16.6 156.0 % Change 21.3% 23.4% 2.6% -9.9% 8.7% 42.2% 50.3% -143.7% NM NM -1.5% * New sales (excluding reinvested dividends) minus redemptions, combined with net exchanges Source: Investment Company Institute