Embed Size (px)
Citation preview

w
June 2018 Forecasting and Business Analytics, LLC Dr. Gary W. Williams FABA Team and Professor, Texas A&M University Dr. Oral Capps, Jr., FABA Managing Partner and Executive Professor, Texas A&M University
HHOOWW EEFFFFEECCTTIIVVEELLYY DDOOEESS TTHHEE
NNOORRWWEEGGIIAANN SSEEAAFFOOOODD CCOOUUNNCCIILL
PPRROOMMOOTTEE NNOORRWWEEGGIIAANN WWHHIITTEEFFIISSHH
EEXXPPOORRTTSS?? Hvor effektivt fremmer Norges Sjømatråd norsk hvitfiskeksport? Research Report to the Norwegian Seafood Council Forskningsrapport til Norges Sjømatråd
Tromsø, Norway

Hvor effektivt fremmer Norges Sjømatråd norsk hvitfiskeksport?
HOW EFFECTIVELY DOES THE NORWEGIAN SEAFOOD COUNCIL PROMOTE NORWEGIAN WHITEFISH EXPORTS?
Hvor effektivt fremmer Norges Sjømatråd norsk hvitfiskeksport?
Report to the Norwegian Seafood Council (Norges Sjømatråd) by Forecasting and Business Analytics, LLC (FABA), June 2018
Authors: Dr. Gary W. Williams FABA Team and Professor, Texas A&M University
Dr. Oral Capps, Jr. FABA Managing Partner and Executive Professor, Texas A&M University
Abstract: This study undertakes a comprehensive analysis of the effectiveness of the Norwegian Seafood Council (NSC) in promoting the export demand for all Norwegian whitefish species as a group and for the three main categories of Norwegian whitefish that NSC promotes (fresh and frozen whitefish, clipfish (klippfisk) and saltfish (saltfisk), and stockfish (tørrfisk)). Using both econometric and simulation analyses, the study concludes that the NSC programs have been highly effective in boosting the value of Norwegian whitefish exports and in enhancing the profitability of the Norwegian whitefish industry. The NSC programs added a total of about NOK 11.1 billion (7.1%) and NOK 9.6 billion (9.6%) to Norwegian whitefish export revenue and industry profits, respectively, at returns of 9.2 to 1 and 5.9 to 1 in terms of additional whitefish export revenue and industry profit, respectively.
Acknowledgements: We gratefully acknowledge funding for this project from the Norwegian Seafood Council as well as their assistance in understanding the Norwegian seafood industry and in providing us access to their financial, export, and other data for this report. We are particularly grateful to Dr. Asbjørn Warvik Rørtveit, Director of Market Insight and Dr. Ingrid Kristine Pettersen, Market Insight Analyst, for their assistance as well as the assistance of many others on the NSC Staff and Board. Dr. Sigbjørn Tvetarås (Universitetet i Stavanger) and Dr. Frank Asche (University of Florida) provided review comments on an earlier draft and contributed the literature review to this report. We also are greatly indebted to Loren Burns, AFCERC Program Manager, for excellent data and administrative support. Nevertheless, findings and conclusions are those of the authors and do not necessarily represent the views of the Norwegian Seafood Council, the reviewers or their institutions, or Texas A&M University.
A Limited Liability Company formed in Texas in 2001, FABA was founded on the belief that to utilize information effectively in a decision-making process, real world experience, sound econometric
and statistical skills, and advanced analytical ability are necessary. FABA provides a mix of theoretical horsepower and real world experience in designing and implementing research projects for its clients. FABA draws on resources with experience across many different private sector applications, with a common goal of utilizing econometric and statistical tools to create effective forecasting and other analytical tools that enable better decisions. FABA provides complete forecasting and business analytic solutions centering on the development of econometric/statistical models to aid decision-making in the business community in two ways: (1) analyses to better interpret the business, economic, and financial landscape and (2) forecasts to provide a better vison of the future.

Hvor effektivt fremmer Norges Sjømatråd norsk hvitfiskeksport?
ii
EXECUTIVE SUMMARY This study undertakes a comprehensive analysis of the effectiveness of the Norwegian Seafood Council (NSC) in promoting the export demand for all Norwegian whitefish as a group (cod, saithe, haddock, and others) and broken down into the three main categories Norwegian whitefish that are promoted by the NSC: (1) fresh and frozen whitefish, (2) clipfish (klippfisk) and saltfish (saltfisk), and (3) stockfish (tørrfisk). The primary objective of the study is to answer two key questions regarding the whitefish export promotion programs of the NSC: (1) What have been their effects on Norwegian whitefish export demand (in total and across the three main categories promoted by NSC) and on the profitability of the Norwegian whitefish industry? (2) Have Norwegian whitefish industry stakeholders (producers, exporters, and others) benefitted from their investment in the export promotion of all whitefish as a group or of any of the three main categories of whitefish promoted by NSC? The first step in the analysis was to measure the relationship between Norwegian whitefish export demand and NSC whitefish promotion programs through the development of econometric models representing the export demands for all Norwegian whitefish and for the three main categories of whitefish promoted by NSC. The analysis relied on monthly data from January 2003 through December 2017. Econometric analysis allowed for the measurement of the relationship between the demand for Norwegian whitefish exports (all whitefish and the three main categories of whitefish promoted by NSC) and the respective promotion expenditures by controlling for other factors that may affect the demand for Norwegian whitefish exports. The process effectively isolates the specific effect of NSC promotion programs on whitefish export demand. An extensive literature review of past studies of Norwegian and global whitefish demand and supply provided valuable insight in developing the econometric models. In the next step, econometric models were developed to simulate the export demand and price responses of all Norwegian whitefish and of the three main whitefish categories promoted by NSC to their respective NSC export promotion expenditures. In this way, the share of the revenue and industry profit from exports of Norwegian whitefish in total and by main category that can be confidently attributed to their respective NSC export promotion programs over the study period was determined. Finally, the results from the first two steps were used to calculate the return to stakeholders from NSC whitefish promotion programs in a benefit-cost analysis that provides benefit-cost ratios (BCRs) as the primary metrics of the return on investment (ROI) to those programs.
The main conclusion of this study is that NSC export promotion programs have been highly effective in boosting Norwegian whitefish export demand and in enhancing the profitability of the Norwegian whitefish industry. The study calculated a range of results for all whitefish, fresh/frozen whitefish, clipfish/saltfish, and stockfish. The most plausible results as determined in the analysis over the period of 2003 through 2017 include the following:
The NSC whitefish export promotion program generated about NOK 11.1 billion (7.1%) in additional Norwegian whitefish export revenue, a monthly average of NOK 62.7 million

Hvor effektivt fremmer Norges Sjømatråd norsk hvitfiskeksport?
iii
in additional whitefish export revenue. This increase in total whitefish export revenue resulted from NSC promotion-induced additions to:
» Fresh and frozen whitefish export revenue of NOK 3.3 billion (4.0%), a monthly average addition of NOK 18.5 million;
» Clipfish and saltfish export revenue of NOK 7.0 billion (10.8%), a monthly average addition of NOK 39.5 million; and
» Stockfish export revenue of NOK 0.8 billion (8.3%), a monthly average increase of NOK 4.8 million.
The NSC export promotion program had only marginal additive effects on Norwegian whitefish export volume over the 2003 to 2017 period of analysis given the quota-imposed restrictions on whitefish production.
Consequently, most of the export revenue gains from NSC whitefish export promotion over 2003 through 2017 period of analysis resulted from additions to the export prices of: » All whitefish by a monthly average of NOK 1.55 per kg; » Fresh and frozen whitefish by a monthly average of NOK 0.62 per kg; » Clipfish and saltfish by a monthly average of NOK 2.83 per kg; and » Stockfish by a monthly average of NOK 4.34 per kg.
The NSC whitefish export promotion program also generated about NOK 7.6 billion (9.6%) in additional Norwegian whitefish industry profit, a monthly average of NOK 42.6 million in additional whitefish industry profit. This addition to total whitefish industry profit resulted from NSC export-promotion-induced additions to industry profits from: » Fresh and frozen whitefish of NOK 2.2 billion (5.4%), a monthly average increase of
NOK 12.4 million; » Clipfish and saltfish of NOK 4.8 billion (14.8%), a monthly average increase of NOK
26.9 million; and
» Stockfish of NOK 0.6 billion (11.3%), a monthly average increase of NOK 3.3 million.
NSC generated high rates of return to the promotion of: » All Norwegian whitefish exports of NOK 9.2 in additional whitefish export revenue per
NOK of promotion expenditure and NOK 5.9 of additional industry profit per NOK of promotion expenditure;
» Fresh and frozen whitefish exports of NOK 5.5 in additional export revenue and NOK 3.4 in additional industry profits per NOK of promotion expenditure;
» Clipfish and saltfish exports of NOK 13.3 in additional export revenue and NOK 8.7 in additional industry profits per NOK of promotion expenditure; and
» Stockfish exports of NOK 8.1 in additional export revenue and NOK 5.2 in additional industry profit per NOK of promotion expenditure.
The main drivers of the export demand for Norwegian whitefish include: » Export prices of each whitefish type relative to the global price of aquaculture exports; » Income changes in importing countries; » Seasonality that differs substantially across the respective whitefish export categories; » Competition with Norwegian salmon exports and global aquaculture exports; » Major events in world whitefish markets such as weather-related events, increases in
quotas for cod and haddock, the filleting of whitefish by China, the Nigerian currency

Hvor effektivt fremmer Norges Sjømatråd norsk hvitfiskeksport?
iv
exchange restrictions in 2015 and 2016, and the crisis in Brazil from 2014 to 2016, among others; and
» NSC export promotion expenditures whose export impacts are not felt all at once in the month of expenditure but instead are distributed over 3 to 5 months.
These conclusions suggest a number of considerations for NSC promotion and program management purposes: The Norwegian whitefish industry is underinvesting in export promotion as indicated by the
relatively high estimated BCRs across all whitefish promotion programs. The opportunity cost of the funds NOT invested in all whitefish export promotion is 5.9 kroner in profit for the whitefish industry per krone not invested in whitefish promotion.
Differing BCRs for NSC promotion of fresh and frozen whitefish, clipfish and saltfish, and stockfish export demands do not necessarily mean that some reallocation of promotion funds among those three categories of whitefish would enhance the overall profitability of the Norwegian whitefish industry. Whether a reallocation of funds would achieve that goal depends on the relative market expansion opportunities for the various types of whitefish. Consequently, a serious study of future market opportunities would be needed before any reallocation of funding is done based on the results of this study.
A failure to maintain or enhance funding for whitefish promotion in any time period would have negative impacts on the profitability of the Norwegian whitefish industry over many subsequent time periods.
The statistical significance of Norwegian whitefish export prices relative to world prices of aquaculture exports in the whitefish models suggests that consumers in foreign markets are considering the prices of aquaculture products as they make decisions about purchasing Norwegian whitefish. Promotional programs targeting the specific differentiating characteristics of Norwegian products will become increasingly important to effectively induce consumer loyalty to Norwegian whitefish over growing supplies of farmed whitefish.
Perhaps the best metrics to use for measuring and promoting the effectiveness of whitefish export promotion are the gains achieved in whitefish export revenue and industry profit. BCRs simply indicate how much has been earned for every krone invested in promotion. They do NOT indicate the magnitude of export impact realized by the promotional efforts.
Stakeholder concerns about the cost of NSC whitefish promotion programs often result from not understanding how promotion programs return value to them. While the costs are readily apparent, the revenue earned is not. As this study shows, NSC whitefish export promotion programs accounted for 7% of the export revenue earned by the whitefish industry and 10% of industry profits over 2003 through 2017 by committing only about 1% of whitefish industry revenues to promotion. That represents a much higher return to the investment of stakeholder funds than could have been obtained from just about any other investment opportunity available over that period, particularly in the environment of low rates of interest.

Hvor effektivt fremmer Norges Sjømatråd norsk hvitfiskeksport?
v
TABLE OF CONTENTS
ABSTRACT .................................................................................................................................... i
ACKNOWLEDGEMENTS .......................................................................................................... i
EXECUTIVE SUMMARY .......................................................................................................... ii
INTRODUCTION......................................................................................................................... 1
NORWEGIAN WHITEFISH EXPORTS AND PROMOTION .............................................. 2
Norwegian Whitefish Export Volume, Price, and Value ............................................................ 3
NSC Whitefish Export Promotion Expenditures ...................................................................... 12
REVIEW OF PREVIOUS STUDIES ON WHITEFISH EXPORTS .................................... 20
Previous Studies on Whitefish Supply ...................................................................................... 20
Previous Studies on Whitefish Demand ................................................................................... 21
Previous Studies on Whitefish Export Demand Promotion ...................................................... 25
Concluding Summary of the Literature Review ....................................................................... 27
METHODOLOGY ..................................................................................................................... 28
Econometric Model Development ............................................................................................ 28
The Simulation Process ............................................................................................................ 32
ANALYSIS OF NORWEGIAN WHITEFISH EXPORT PROMOTION ............................ 40
Econometric Analysis of NSC Whitefish Export Promotion Programs ................................... 40
Simulation Analysis of NSC Whitefish Export Promotion Programs ...................................... 55
Benefit-Cost Analysis ............................................................................................................... 61
CONCLUSIONS AND IMPLICATIONS ................................................................................ 67
REFERENCES ............................................................................................................................ 72

Hvor effektivt fremmer Norges Sjømatråd norsk hvitfiskeksport?
vi
TABLE OF TABLES
Table 1: Marketing Levies on Norwegian Seafood Exports, 2003–2017 ..................................... 14
Table 2: Previous Studies of Whitefish: Overview of Reported Price and Income Elasticities ... 22
Table 3: Econometric Estimation Results for All Norwegian Whitefish Export Demand ........... 42
Table 4: Econometric Estimation Results for Norwegian Fresh/Frozen Whitefish Export Demand ......................................................................................................................................... 45
Table 5: Econometric Estimation Results for Norwegian Clipfish/Saltfish Export Demand ....... 48
Table 6: Econometric Estimation Results for Norwegian Stockfish Export Demand .................. 51
Table 7: Summary of Key Results from the Norwegian Whitefish Export Demand Models ...... 55
Table 8: Additions to Norwegian Whitefish Export Price, Revenue, Profit, and Volume Attributable to NSC Whitefish Export Promotion under Alternative Export Supply Elasticities, 2003–2017 ................................................................................................................. 57
Table 9: Additions to Norwegian Fresh/Frozen Whitefish Export Price, Revenue, Profit, and Volume Attributable to Fresh/Frozen Whitefish NSC Export Promotion under Alternative Export Supply Elasticities, 2003–2017 ......................................................................................... 58
Table 10: Additions to Norwegian Clipfish/Saltfish Export Price, Revenue, Profit, and Volume Attributable to the NSC Export Promotion Program under Alternative Export Supply Elasticities, 2003–2017 ................................................................................................................. 60
Table 11: Additions to Norwegian Stockfish Export Price, Revenue, Profit, and Volume Attributable to NSC Stockfish Export Promotion Program under Alternative Export Supply Elasticities, 2003–2017 ................................................................................................................. 60
Table 12: Benefit-Cost Ratios (BCRs) for NSC All Whitefish Export Promotion under Alternative Export Supply Elasticities, 2003-2017 ...................................................................... 63
Table 13: Benefit-Cost Ratios (BCRs) for the NSC Fresh/Frozen Whitefish Export Promotion Program under Alternative Export Supply Elasticities, 2003-2017 .............................................. 64
Table 14: Benefit-Cost Ratios (BCRs) for the NSC Clipfish/Saltfish Export Promotion Program under Alternative Export Supply Elasticities, 2003-2017 .............................................. 64
Table 15: Benefit-Cost Ratios (BCRs) for the NSC Stockfish Export Promotion Program under Alternative Export Supply Elasticities, 2003-2017 ............................................................ 66
Table 16: Summary Comparison of the Most Plausible Promotion Effects and BCRs from NSC Whitefish Export Promotion under Alternative Export Supply Elasticities, 2003-2017 ..... 67
TABLE OF FIGURES
Figure 1: Norwegian Annual Whitefish Export Value and Volume, 2003–2017 ........................... 4
Figure 2: Norwegian Annual Seafood Export Value by Type, 2003–2017 .................................... 4
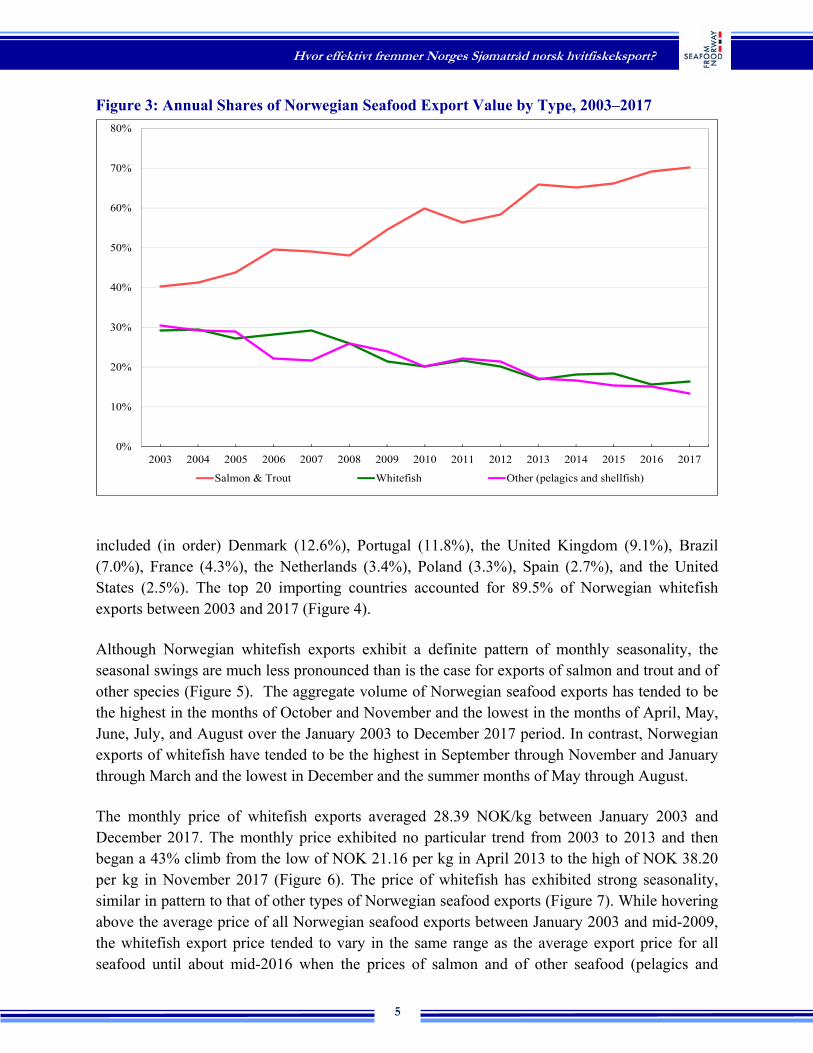
Figure 3: Annual Shares of Norwegian Seafood Export Value by Type, 2003–2017 .................... 5

Hvor effektivt fremmer Norges Sjømatråd norsk hvitfiskeksport?
vii
Figure 4: Top 20 Destinations for Norwegian Whitefish Exports by Destination Share of Exports, 2003–2017 ........................................................................................................................ 6
Figure 5: Monthly Norwegian Seafood Export Volume by Type, January 2003 – December 2017................................................................................................................................................. 6
Figure 6: Monthly Average Price of Norwegian Whitefish Exports, January 2003 – December 2017................................................................................................................................................. 7
Figure 7: Monthly Average Price of All Norwegian Seafood Exports, by Type, January 2003 – December 2017 ............................................................................................................................... 7
Figure 8: Fresh/Frozen, Clipfish/Saltfish, Stockfish, and Other Whitefish Shares of Norwegian Whitefish Export Volume, 2003–2017 ........................................................................ 9
Figure 9: Fresh/Frozen, Clipfish/Saltfish, Stockfish, and Other Whitefish Shares of Norwegian Whitefish Export Value, 2003–2017............................................................................ 9
Figure 10: Volume of Norwegian Fresh/Frozen Whitefish, Clipfish/Saltfish, Stockfish, and Other Whitefish Exports, 2003–2017 ........................................................................................... 10
Figure 11: Value of Norwegian Fresh/Frozen Whitefish, Clipfish/Saltfish, Stockfish, and Other Whitefish Exports, 2003–2017 ........................................................................................... 10
Figure 12: Prices of Norwegian Fresh/Frozen Whitefish, Clipfish/Saltfish, and Stockfish Exports, January 2003 – December 2017 ..................................................................................... 11
Figure 13: Norwegian Clipfish/Saltfish and Stockfish Price Markups over Fresh/Frozen Whitefish Prices, January 2003 – December 2017 ....................................................................... 11
Figure 14: European Union Whitefish Imports, 1990–2015 ........................................................ 13
Figure 15: U.S. Whitefish Imports, 1990–2015 ............................................................................ 13
Figure 16: NSC Seafood Export Promotion Expenditures, Total and by Type, 2003–2017 ........ 15
Figure 17: Monthly NSC Seafood Export Promotion Expenditures by Type, 2003–2017 .......... 15
Figure 18: Annual NSC Whitefish Export Promotion Expenditures, Total and by Type, 2003–2017............................................................................................................................................... 17
Figure 19: Shares of Annual NSC Whitefish Export Promotion Expenditures Allocated to Frozen/Fresh Whitefish, Clipfish/Saltfish, and Stockfish, 2003–2017......................................... 17
Figure 20: Monthly NSC Whitefish Export Promotion Expenditures by Type, 2003–2017........ 18
Figure 21: Annual Nominal vs. Real, Exchange-Rate-Adjusted (2003=100) NSC Whitefish Export Promotion Expenditures and the Real Implied Reduction in the NSC Promotion Budget, 2003-2017 ........................................................................................................................ 18
Figure 22: Promotion Intensity of NSC Whitefish Expenditures, January 2003 – December 2017............................................................................................................................................... 19
Figure 23: Export Demand Promotion: Market and Producer Profit Effects ............................... 34
Figure 24: Export Revenue and Economic Surplus Effect of Norwegian Whitefish Export Promotion ...................................................................................................................................... 38

Hvor effektivt fremmer Norges Sjømatråd norsk hvitfiskeksport?
HOW EFFECTIVELY DOES THE NORWEGIAN SEAFOOD COUNCIL PROMOTE NORWEGIAN WHITEFISH EXPORTS?
Hvor effektivt fremmer Norges Sjømatråd norsk hvitfiskeksport?
The story of the rapid growth in Norwegian seafood exports over the last 15 years is an example of how a country can focus its resources to enhance productive efficiency and achieve scale economies resulting in remarkable national economic benefits (Capps and Williams, 2017). Since 2003, the value of all Norwegian seafood exports has increased at an average annual growth rate of 10% resulting in a 268% increase between 2003 and 2017. Salmon (and trout) was the main driver in that growth, posting a 543% increase in export value over that same period compared to 105% for whitefish (cod, saithe, haddock, and others), and 61% for exports of all other seafood (pelagic and shellfish).
An analysis performed last year concluded that about 9% - 10% of the value of the rapidly growing Norwegian seafood exports from 2003 through 2016 was created by the export promotion programs operated by the Norwegian Seafood Council (NSC) (Capps and Williams, 2017). Other studies have demonstrated the effectiveness of NSC programs in promoting exports of Norwegian salmon (e.g., Kaiser, 2015). Other than one limited study that considered the promotional effects of NSC export programs on cod (CAPIA, 2016), however, little else is known about the effectiveness of NSC programs in promoting whitefish.
Consequently, this study undertakes a comprehensive analysis of the effects of NSC export promotion of all Norwegian whitefish species and of the three main categories of Norwegian whitefish species promoted by NSC (fresh and frozen whitefish, clipfish (klippfisk) and saltfish (saltfisk), and stockfish (tørrfisk)). Exports of all whitefish were divided into these three categories for analysis to match the categories of NSC whitefish promotion expenditures. The primary objective of the study is to answer two key questions regarding the whitefish export promotion programs of the NSC: (1) What have been their effects on Norwegian whitefish export demand (in total and across the three main categories promoted by NSC) and on the profitability of the Norwegian whitefish industry? (2) Have Norwegian whitefish industry stakeholders (producers, exporters, and others) benefitted from their investment in the export promotion of all whitefish or of any of the three main categories of whitefish promoted by NSC? The results of statistically analyzing the answer to the first question are subsequently used to answer the second question in a benefit-cost analysis of NSC whitefish export promotion programs. The analysis relies on monthly data from January 2003 through December 2017. This study first provides some background on Norwegian whitefish exports and NSC expenditures to promote whitefish export demand. A review of past studies related to whitefish exports is then provided. The methodology used in this study to measure the effectiveness of NSC whitefish export promotion is then followed by a discussion of the analytical results. Finally, the major conclusions and implications of the study are discussed.

Hvor effektivt fremmer Norges Sjømatråd norsk hvitfiskeksport?
2
NORWEGIAN WHITEFISH EXPORTS AND PROMOTION Using fees levied on all exports of Norwegian seafood and working cooperatively with the Norwegian seafood industry1, the Norwegian Seafood Council promotes exports of Norwegian seafood across a broad variety of species all over the world. Norwegian seafood exports can be grouped into four main categories: (1) salmon and trout, (2) whitefish, (3) pelagics, and (4) shellfish. Each category of seafood exports includes not only fresh or frozen seafood but also all further processed seafood. Whitefish is a broad category that encompasses several highly diverse fish species around the world when it comes to production technology (capture fisheries vs aquaculture) and habitat (marine vs freshwater), including cod, skrei, saithe, whiting, haddock, pollock, wolfish, anglerfish, redfish, flounder, and others. Norwegian whitefish supply and exports are dominated by Atlantic cod which is the highest priced whitefish species and either the largest or the second largest species by quantity. Saithe alternates with cod as the largest Norwegian whitefish species exported by quantity. Haddock is generally regarded as more important than saithe, however, because of its higher price.
Among the Norwegian whitefish species, the NSC has primarily targeted cod for promotion but also haddock and even saithe at times. Promotion focused on other species has been inconsistent over time and at a much lower level of expenditure. NSC promotes exports of three main categories of whitefish: (1) fresh and frozen, (2) clipfish (klippfisk) and saltfish (saltfisk), and (3) stockfish (tørrfisk). Norwegian whitefish exports not included in one of these three categories have accounted for no more than one percent of total whitefish exports over the years. Fresh and frozen whitefish are not salted, dried, or otherwise further processed. NSC promotes fresh/frozen whitefish mainly in Europe and to some extent in the United States. The main species promoted in a fresh/frozen state include cod but also haddock and saithe. Traditionally, cod exports to distant markets were made possible by drying and/or curing the fish into dried and dried-salted products. Clipfish (klippfisk) and other Salted Whitefish (saltfisk) are salted and dried forms of Norwegian whitefish exports. NSC promotes clipfish and saltfish primarily in Portugal and Brazil but also to some extent in the Dominican Republic, Jamaica and similar markets. The main species of clipfish/saltfish promoted by the NSC include cod (Portugal and Brazil), saithe (Brazil, the Dominican Republic, Jamaica), and ling and tusk (Brazil). Clipfish are often referred to as “bacalhau,” the Portuguese word for cod. Stockfish (tørrfisk) are whitefish exported by Norway that are dried on open-air timber racks or “stocks” for about three months in February through May. The fish are then moved indoors to mature for another twelve months. The two largest markets for Norwegian stockfish exports are Italy and Nigeria. NSC promotion of stockfish, however, targets mainly Italy.
1 In this study, the term “seafood” includes both captured and farmed seafood including fresh and frozen as well as further processed. The term “seafood industry” includes both aquaculture and fisheries.

Hvor effektivt fremmer Norges Sjømatråd norsk hvitfiskeksport?
3
Clipfish/saltfish and stockfish are preferred in some markets while others prefer fresh or frozen whitefish. In fresh and frozen markets, whitefish is used in lower-valued products like cod in Great Britain for fish ‘n chips as well as in higher-valued preparations based on fresh raw materials. Clipfish/saltfish and stockfish, on the other hand, lend themselves to storage in markets where the refrigeration infrastructure is poor. Such is the case of Nigeria which has traditionally been an important market for Norwegian exports of stockfish, primarily cod and saithe of secondary quality (Borch and Korneliussen, 1995; Sogn-Grundvåg, Egeness, and Heide, 2013). Stockfish gained a foothold in Nigerian diets as a result of Norwegian humanitarian contributions to combat famine and malnutrition in Nigeria on an unprecedented scale following the civil war of the late 1960s (Dale and Uwonkunda, 2017). Stockfish was well suited to the cause not only because it does not need refrigeration but also because it is full of protein and vitamins. Fifty years later, Norwegian stockfish has transformed from a means of staving off starvation to a key component of Nigerian culinary tradition (Dale and Uwonkunda, 2017).
Norwegian Whitefish Export Volume, Price, and Value
Both the volume and value of Norwegian whitefish exports experienced substantial growth between 2003 and 2017 (Figure 1). The value of Norwegian whitefish exports grew at a faster annual average rate of 5.6% over that period compared to 3.1% for the export volume. As a consequence, the value of whitefish exports more than doubled between 2003 and 2017 from NOK 7.3 billion to NOK 15.0 billion. The export volume posted only about a 50% increase over that period from 303,091 metric tons (tonnes) to 449,899 tonnes. The jump in the value of Norwegian whitefish exports was facilitated by a 38% increase in the average annual price of whitefish from 24.2 NOK/kg in 2003 to 33.3 NOK/kg in 2017.
The growth in Norwegian whitefish exports since 2003, however, was eclipsed by the remarkable growth of salmon exports (Figure 2). From NOK 10.0 billion in 2003, slightly more than the NOK 7.3 billion for whitefish, the value of Norwegian salmon and trout exports climbed dramatically to NOK 64.5 billion in 2017, an increase of 543%, over 5 times the growth of whitefish export value. By volume, the whitefish share of Norwegian seafood exports remained at around 15% to 20% between 2003 and 2017 while that of the exports of other non-salmon and trout species declined from almost 60% to just under 40% over that same period. The stronger growth in the price of salmon and trout over that period, however, dropped the whitefish share of the value of Norwegian seafood exports from just under 30% to about 15%, about the same pattern followed by the share accounted for by species other than whitefish or salmon and trout (Figure 3).
Between January 2003 and December 2017, Norway exported whitefish to nearly 160 different countries (NSC, 2018a). Over that period, China was the largest importer accounting for 14.4% of all Norwegian whitefish exports. The top 10 importing countries (including China) accounted for 71.1% of those exports. After China, the other top ten importing countries over that period

Hvor effektivt fremmer Norges Sjømatråd norsk hvitfiskeksport?
4
Figure 1: Norwegian Annual Whitefish Export Value and Volume, 2003–2017
0
50,000
100,000
150,000
200,000
250,000
300,000
350,000
400,000
450,000
500,000
0
2
4
6
8
10
12
14
16
2003 2004 2005 2006 2007 2008 2009 2010 2011 2012 2013 2014 2015 2016 2017
tonn
es
NO
K b
illi
on
Value Volume
Figure 2: Norwegian Annual Seafood Export Value by Type, 2003–2017
0
10
20
30
40
50
60
70
80
90
100
2003 2004 2005 2006 2007 2008 2009 2010 2011 2012 2013 2014 2015 2016 2017
NO
K b
illio
n
Total Salmon & Trout Whitefish Other (pelagics and shellfish)
Hvor effektivt fremmer Norges Sjømatråd norsk hvitfiskeksport?
5
Figure 3: Annual Shares of Norwegian Seafood Export Value by Type, 2003–2017
0%
10%
20%
30%
40%
50%
60%
70%
80%
2003 2004 2005 2006 2007 2008 2009 2010 2011 2012 2013 2014 2015 2016 2017
Salmon & Trout Whitefish Other (pelagics and shellfish)
included (in order) Denmark (12.6%), Portugal (11.8%), the United Kingdom (9.1%), Brazil (7.0%), France (4.3%), the Netherlands (3.4%), Poland (3.3%), Spain (2.7%), and the United States (2.5%). The top 20 importing countries accounted for 89.5% of Norwegian whitefish exports between 2003 and 2017 (Figure 4).
Although Norwegian whitefish exports exhibit a definite pattern of monthly seasonality, the seasonal swings are much less pronounced than is the case for exports of salmon and trout and of other species (Figure 5). The aggregate volume of Norwegian seafood exports has tended to be the highest in the months of October and November and the lowest in the months of April, May, June, July, and August over the January 2003 to December 2017 period. In contrast, Norwegian exports of whitefish have tended to be the highest in September through November and January through March and the lowest in December and the summer months of May through August.
The monthly price of whitefish exports averaged 28.39 NOK/kg between January 2003 and December 2017. The monthly price exhibited no particular trend from 2003 to 2013 and then began a 43% climb from the low of NOK 21.16 per kg in April 2013 to the high of NOK 38.20 per kg in November 2017 (Figure 6). The price of whitefish has exhibited strong seasonality, similar in pattern to that of other types of Norwegian seafood exports (Figure 7). While hovering above the average price of all Norwegian seafood exports between January 2003 and mid-2009, the whitefish export price tended to vary in the same range as the average export price for all seafood until about mid-2016 when the prices of salmon and of other seafood (pelagics and shellfish

Hvor effektivt fremmer Norges Sjømatråd norsk hvitfiskeksport?
6
Figure 4: Top 20 Destinations for Norwegian Whitefish Exports by Destination Share of Exports, 2003–2017
0%
2%
4%
6%
8%
10%
12%
14%
16%
Figure 5: Monthly Norwegian Seafood Export Volume by Type, January 2003 – December 2017
0
50,000
100,000
150,000
200,000
250,000
300,000
350,000
Jan-
03
Jul-
03
Jan-
04
Jul-
04
Jan-
05
Jul-
05
Jan-
06
Jul-
06
Jan-
07
Jul-
07
Jan-
08
Jul-
08
Jan-
09
Jul-
09
Jan-
10
Jul-
10
Jan-
11
Jul-
11
Jan-
12
Jul-
12
Jan-
13
Jul-
13
Jan-
14
Jul-
14
Jan-
15
Jul-
15
Jan-
16
Jul-
16
Jan-
17
Jul-
17
tonn
es
All Seafood Salmon & Trout Whitefish Other (pelagics and shellfish)

Hvor effektivt fremmer Norges Sjømatråd norsk hvitfiskeksport?
7
Figure 6: Monthly Average Price of Norwegian Whitefish Exports, January 2003 – December 2017
0.00
5.00
10.00
15.00
20.00
25.00
30.00
35.00
40.00
45.00Ja
n-03
Jul-0
3
Jan-
04
Jul-0
4
Jan-
05
Jul-0
5
Jan-
06
Jul-0
6
Jan-
07
Jul-0
7
Jan-
08
Jul-0
8
Jan-
09
Jul-0
9
Jan-
10
Jul-1
0
Jan-
11
Jul-1
1
Jan-
12
Jul-1
2
Jan-
13
Jul-1
3
Jan-
14
Jul-1
4
Jan-
15
Jul-1
5
Jan-
16
Jul-1
6
Jan-
17
Jul-1
7
NO
K/k
g
Figure 7: Monthly Average Price of All Norwegian Seafood Exports, by Type, January 2003 – December 2017
0.00
10.00
20.00
30.00
40.00
50.00
60.00
Jan-
03
Jul-0
3
Jan-
04
Jul-0
4
Jan-
05
Jul-0
5
Jan-
06
Jul-0
6
Jan-
07
Jul-0
7
Jan-
08
Jul-0
8
Jan-
09
Jul-0
9
Jan-
10
Jul-1
0
Jan-
11
Jul-1
1
Jan-
12
Jul-1
2
Jan-
13
Jul-1
3
Jan-
14
Jul-1
4
Jan-
15
Jul-1
5
Jan-
16
Jul-1
6
Jan-
17
Jul-1
7
NO
K/k
g
All Seafood Salmon & Trout Whitefish Other (pelagics and shellfish)

Hvor effektivt fremmer Norges Sjømatråd norsk hvitfiskeksport?
8
shellfish) began to experience increases relative to that of whitefish. As a consequence, the price of whitefish exports tended to hover below the average price of all Norwegian seafood exports in 2017. Of the three main categories of Norwegian whitefish exports promoted by NSC, fresh and frozen exports clearly dominate, accounting for between about 60% and 70% of whitefish exports over the entire January 2003 to December 2017 period with some upward trend from a low of just under 60% in 2008 to highs of about 70% in 2016 and 2017 (Figure 8). On a value basis, clipfish and saltfish accounted for a higher share Norwegian whitefish exports (40% to 45%) between 2003 and 2008 after which strong growth in the export volume and price of fresh/frozen whitefish reduced the clipfish and saltfish share to 35.5% in 2017 compared to the 58% accounted for by fresh/frozen in that year (Figure 9). The stockfish and other whitefish shares of the value of Norwegian whitefish exports remained fairly stable between 6% and 7% and between 0.3% and 1%, respectively, from 2003 through 2017. From an annual average of just over 200,000 tonnes between 2003 and 2008, fresh and frozen whitefish exports jumped by over 50% to nearly 311,000 tonnes in 2017 (Figure 10). An increasing price of fresh and frozen whitefish facilitated a doubling of the value of fresh and frozen whitefish exports from an average of NOK 4.3 billion during the 2003 to 2008 period to NOK 8.7 billion in 2017 (Figure 11). Meanwhile, the annual export volumes and values of clipfish/stockfish, stockfish, and other whitefish were also increasing but at much different rates. The clipfish and saltfish export volume and value jumped from 96,786 tonnes and NOK 3.0 billion, respectively, in 2003 to 117,449 tonnes and NOK 5.3 billion, respectively, in 2017, increases of about 20% and 74%, respectively. From a low level of 5,643 tonnes in 2003, the volume of stockfish exports grew by 82% to 15,906 tonnes in 2017. The value of stockfish exports grew by somewhat less (52.5%) over that same period due to a declining price over much of that period (Figure 11). The average export price of fresh and frozen whitefish exports remained below the average of all whitefish between 2003 and 2017 (Figure 12). From an average of about NOK 20 per kg between 2003 and 2014, the fresh and frozen whitefish price bounced up to a new a level of between NOK 25 per kg and NOK 30 per kg where it remained through 2017 (Figure 12). Norwegian clipfish and saltfish exports have sold at a substantial but slowly declining percentage markup over fresh/frozen whitefish exports from an average of 70% between January 2003 and December 2012 to an average of 60% thereafter (Figure 13). Nevertheless, movements in the price of Norwegian clipfish and saltfish exports have been highly correlated to those of fresh/frozen whitefish exports over the entire January 2003 to December 2017 period (correlation coefficient of 81%). Stockfish have sold at a much higher percentage markup over fresh/frozen whitefish exports. That markup, however, has declined steadily from an average of 427% in 2003 to an average of

Hvor effektivt fremmer Norges Sjømatråd norsk hvitfiskeksport?
9
Figure 8: Fresh/Frozen, Clipfish/Saltfish, Stockfish, and Other Whitefish Shares of Norwegian Whitefish Export Volume, 2003–2017
0%
10%
20%
30%
40%
50%
60%
70%
80%
2003 2004 2005 2006 2007 2008 2009 2010 2011 2012 2013 2014 2015 2016 2017
Fresh/Frozen Clipfish/Saltfish Stockfish Other
Figure 9: Fresh/Frozen, Clipfish/Saltfish, Stockfish, and Other Whitefish Shares of Norwegian Whitefish Export Value, 2003–2017

Hvor effektivt fremmer Norges Sjømatråd norsk hvitfiskeksport?
10
Figure 10: Volume of Norwegian Fresh/Frozen Whitefish, Clipfish/Saltfish, Stockfish, and Other Whitefish Exports, 2003–2017
0
50,000
100,000
150,000
200,000
250,000
300,000
350,000
2003 2004 2005 2006 2007 2008 2009 2010 2011 2012 2013 2014 2015 2016 2017
tonn
es
Fresh/Frozen Clipfish/Saltfish Stockfish Other Whitefish
Figure 11: Value of Norwegian Fresh/Frozen Whitefish, Clipfish/Saltfish, Stockfish, and Other Whitefish Exports, 2003–2017

Hvor effektivt fremmer Norges Sjømatråd norsk hvitfiskeksport?
11
Figure 12: Prices of Norwegian Fresh/Frozen Whitefish, Clipfish/Saltfish, and Stockfish Exports, January 2003 – December 2017
0.00
20.00
40.00
60.00
80.00
100.00
120.00
140.00
160.00Ja
n-03
Jul-
03
Jan-
04
Jul-
04
Jan-
05
Jul-
05
Jan-
06
Jul-
06
Jan-
07
Jul-
07
Jan-
08
Jul-
08
Jan-
09
Jul-
09
Jan-
10
Jul-
10
Jan-
11
Jul-
11
Jan-
12
Jul-
12
Jan-
13
Jul-
13
Jan-
14
Jul-
14
Jan-
15
Jul-
15
Jan-
16
Jul-
16
Jan-
17
Jul-
17
NO
K/k
g
All Whitefish Fresh/Frozen Clipfish/Saltfish Stockfish
Figure 13: Norwegian Clipfish/Saltfish and Stockfish Price Markups over Fresh/Frozen Whitefish Prices, January 2003 – December 2017
0.00
20.00
40.00
60.00
80.00
100.00
120.00
140.00
160.00
Jan-
03
Jul-
03
Jan-
04
Jul-
04
Jan-
05
Jul-
05
Jan-
06
Jul-
06
Jan-
07
Jul-
07
Jan-
08
Jul-
08
Jan-
09
Jul-
09
Jan-
10
Jul-
10
Jan-
11
Jul-
11
Jan-
12
Jul-
12
Jan-
13
Jul-
13
Jan-
14
Jul-
14
Jan-
15
Jul-
15
Jan-
16
Jul-
16
Jan-
17
Jul-
17
NO
K/k
g
All Whitefish Fresh/Frozen Clipfish/Saltfish Stockfish

Hvor effektivt fremmer Norges Sjømatråd norsk hvitfiskeksport?
12
only 86% in 2017 (Figure 13). In contrast to clipfish, movements in Norwegian stockfish export prices have been completely independent of those of fresh/frozen whitefish exports (correlation coefficient of 0.7%). Given the restrictions in the Norwegian supply of whitefish exports over the years, the implication is that the demands for clipfish/saltfish and stockfish are also unrelated (i.e., impacted by separate drivers or the same drivers but in different ways). In recent years, traditional Norwegian whitefish markets have become more global with the introduction of Alaska pollock, hoki, South Atlantic hake, and others. At the same time, new tropical and sub-tropical whitefish have joined catfish2 and other freshwater species in the global whitefish market with tilapia and pangasius as the two most important. In addition, Norway continues to compete with the whitefish export supplies from other countries such as Iceland, Greenland, Russia, China, and the United States. In 2016, salmon and cod were the main fish species imported by the European Union (EU). Nearly all the salmon imported were fresh and whole (EUMOFA, 2017). In contrast, 45% of EU cod imports were smoked and dried. In general, however, fish products imported by the EU are frozen or further prepared. European Union (EU) imports of cod have grown over the past 10 to 15 years accounting for about 43% of all whitefish in 2016 (Figure 14). Norwegian cod accounted for about 34.5% of all EU cod imports that year. At the same time, tilapia and catfish represented only 10% of EU whitefish imports. The U.S. fish market, which accounts for only a small percentage of Norwegian whitefish exports, has been perhaps most impacted in recent years by the growing global availability of freshwater whitefish (Figure 15). U.S. imports of cod and other traditional species of whitefish have been declining while imports of freshwater species have been increasing rapidly. Tilapia and pangasius now account for about 50% of U.S. whitefish imports.
NSC Whitefish Export Promotion Expenditures
The Norwegian Seafood Council is charged with promoting Norwegian seafood in global markets as a “premium food and ... the best seafood in the world”. NSC promotes Norwegian seafood as a trademark in all major seafood export markets and supports marketing efforts in more than 140 counties worldwide (NSC, 2018b). The promotional activities of the NSC are financed by a levy of 0.30% to 0.75% on the value of Norwegian seafood exports. The export levies are delineated by species, including salmon, trout, whitefish, cured whitefish, pelagics, and shellfish (Table 1). The levy for salmon and trout was reduced from 0.75% to 0.60% in 2016 and then to 0.30% in 2017. The levy for whitefish and shellfish increased from 0.30% in 2003 to 2009 to 0.50% in 2010 and then to 0.75% since 2011. The levy for pelagics rose from 0.30% in 2003 to 2009 and to 0.50% in 2010 and to 0.75% a year later. In 2016, the levy on pelagic exports was reduced to 0.60% in 2016 and again to 0.30% in 2017. The levy for cured whitefish remained at 0.75% over the entire period of 2003 to 2017.
2 As often used, “catfish” generally includes Pangasius from Vietnam.

Hvor effektivt fremmer Norges Sjømatråd norsk hvitfiskeksport?
13
Figure 14: European Union Whitefish Imports, 1990–2015
0
500
1000
1500
2000
2500
3000
1990 1992 1994 1996 1998 2000 2002 2004 2006 2008 2010 2012 2014
1,00
0 to
nnes
Cod, haddock, redfishes, whiting Flatfish Hake Pollock Pangasius, catfish Tilapia
Source: Created by authors from data in FAO (2018a).
Figure 15: U.S. Whitefish Imports, 1990–2015
0
100
200
300
400
500
600
700
1990 1992 1994 1996 1998 2000 2002 2004 2006 2008 2010 2012 2014
1,00
0 to
nnes
Cod, haddock, redfish, whiting Flatfish Pollock Pangasius, catfish Tilapia
Source: Created by authors from data in FAO (2018a).

Hvor effektivt fremmer Norges Sjømatråd norsk hvitfiskeksport?
14
Table 1: Marketing Levies on Norwegian Seafood Exports, 2003–2017
Fish Species
Year Salmon Trout Whitefish Cured
Whitefish Pelagic Shellfish ------------------------------------------------------- % ----------------------------------------------------
2003 0.75 0.75 0.30 0.75 0.30 0.30 2004 0.75 0.75 0.30 0.75 0.30 0.30 2005 0.75 0.75 0.30 0.75 0.30 0.30 2006 0.75 0.75 0.30 0.75 0.30 0.30 2007 0.75 0.75 0.30 0.75 0.30 0.30 2008 0.75 0.75 0.30 0.75 0.30 0.30 2009 0.75 0.75 0.30 0.75 0.30 0.30 2010 0.75 0.75 0.50 0.75 0.50 0.50 2011 0.75 0.75 0.75 0.75 0.75 0.75 2012 0.75 0.75 0.75 0.75 0.75 0.75 2013 0.75 0.75 0.75 0.75 0.75 0.75 2014 0.75 0.75 0.75 0.75 0.75 0.75 2015 0.75 0.75 0.75 0.75 0.75 0.75 2016 0.60 0.60 0.75 0.75 0.60 0.75 2017 0.30 0.30 0.75 0.75 0.30 0.75
Source: NSC (2018a)
Annual NSC promotional expenditures3 on all Norwegian seafood exports declined by 42% from NOK 258.8 million in 2003 to NOK 149.8 million in 2004 and then began a steady increase to NOK 444.6 million in 2014, a nearly 200% increase (Figure 16). Annual expenditures have shown little trend since then, ranging between about NOK 430.9 million to NOK 471.2 million through 2017 (Figure 16). Salmon and trout understandably dominate the promotional expenditures given their dominate share of total Norwegian seafood exports. In about 2014, however, NSC promotional expenditures were rebalanced to provide more emphasis on exports of whitefish and other seafood (pelagics and shellfish) (Figure 16). The share of NSC promotional expenditures allocated to whitefish hit a maximum of 35% in 2009 and then slid to 14% in 2014 (Figure 16). With the rebalancing that year, the whitefish share of NSC export promotion expenditures increased slowly reaching 24% in 2017. The share of those expenditures allocated to species other than salmon/trout and whitefish increased from a low of nearly 7% in 2009 to their high of 21% in 2017.
Monthly expenditures on seafood export promotion have been as variable over time as export revenue (Figure 17). While salmon and trout expenditures have tended to peak in the months of October 3 In the analysis, we consider the total of both “common costs” (defined by NSC as all costs not related to direct investments in market promotion, including offices in Tromsø and in the markets and salaries) and “market investment” (investments for marketing activities and for some market analyses). The correlation of the total of “common costs” and “market investments” and just “market investments” is 0.963. Hence, all references in this report to NSC promotional expenditures refer to the total of both “common costs” and “market investments”.

Hvor effektivt fremmer Norges Sjømatråd norsk hvitfiskeksport?
15
Figure 16: NSC Seafood Export Promotion Expenditures, Total and by Type, 2003–2017
0
100
200
300
400
500
600
2003 2004 2005 2006 2007 2008 2009 2010 2011 2012 2013 2014 2015 2016 2017
NO
K m
illio
n
Total Salmon and Trout All Whitefish Other (pelagics and shellfish)
Figure 17: Monthly NSC Seafood Export Promotion Expenditures by Type, 2003–2017
0
10
20
30
40
50
60
70
Jan-
03Ju
n-03
Nov
-03
Apr
-04
Sep-
04Fe
b-05
Jul-
05D
ec-0
5M
ay-0
6O
ct-0
6M
ar-0
7A
ug-0
7Ja
n-08
Jun-
08N
ov-0
8A
pr-0
9Se
p-09
Feb-
10Ju
l-10
Dec
-10
May
-11
Oct
-11
Mar
-12
Aug
-12
Jan-
13Ju
n-13
Nov
-13
Apr
-14
Sep-
14Fe
b-15
Jul-
15D
ec-1
5M
ay-1
6O
ct-1
6M
ar-1
7A
ug-1
7
NO
K m
illio
n
Salmon and Trout All Whitefish Other (pelagics and shellfish)

Hvor effektivt fremmer Norges Sjømatråd norsk hvitfiskeksport?
16
October through December, expenditures for whitefish promotion have tended to peak in the early months of the year (January through April). Importantly, the pattern of expenditure seasonality does not match that of seafood exports themselves. NSC promotion expenditures for whitefish trended upward between 2003 and 2017 but with notable peaks and troughs (Figure 18). After dropping 24% from NOK 42.8 million in 2003 to NOK 32.7 million in 2004, NSC whitefish promotion expenditures more than tripled to NOK 107.9 million in 2009. In the next year, those expenditures then dropped by 38% to NOK 67.3 million and struggled to recover to NOK 101.9 million in 2013. Again, however, whitefish promotion expenditures were cut, falling by 26% to NOK 75.3 million in 2014. By 2017, the allocation to whitefish export promotion had once again turned around and hit a record of NOK 113.4 million. From 2003 through 2009, clipfish and saltfish dominated NSC whitefish export promotion, accounting for 50% to 60% of those expenditures (Figure 19). Following the same general up and down pattern as for whitefish, promotion expenditures for clipfish and saltfish hit a peak in 2009 at NOK 57.5 million and then began a slow decline to NOK 34.8 million in 2017 (see Figure 18). In consequence, the share of NSC whitefish promotion expenditures accounted for by clipfish steadily declined from a high 62% in 2006 to a low of 31% in 2017. With some fluctuations over the years, expenditures allocated to the promotion of stockfish also followed a downward path from NOK 6.2 million in 2003 (14.5% of whitefish expenditures) to NOK 5.8 million in 2017 (5.1% of whitefish expenditures) (Figures 18 and 19). In contrast, expenditures to promote fresh and frozen whitefish increased substantially in both absolute and relative terms between 2003 and 2017. From NOK 14.8 million in 2003 (34.7% of whitefish promotion expenditures), fresh and frozen whitefish promotion expenditures hit a high of NOK 72.7 million in 2017 (64% of whitefish export promotion expenditures). Whitefish expenditures exhibited definite seasonality patterns over the January 2003 to December 2017 period (Figure 20). Promotion of fresh and frozen whitefish had an increasing tendency to concentrate into the first few months of each year (January through April) over that period. Stockfish expenditures tended to peak in October through December of that period. The month-to-month and year-to-year swings of stockfish export promotion expenditures were more muted and less regular in their pattern over that period (Figure 20). While expenditure peaks tended to occur more regularly in December and surrounding months, month-to-month spurts in spending were not uncommon during other times of the year. Despite the upward trend in the nominal NOK value of NSC whitefish promotion expenditures between 2003 and 2017, price inflation in major foreign markets for Norwegian whitefish and a general depreciation in the value of the NOK against the currencies in those countries over that period eroded the real purchasing power of those expenditures in the markets where NSC conducts promotional activities. While annual nominal whitefish promotion expenditures more than

Hvor effektivt fremmer Norges Sjømatråd norsk hvitfiskeksport?
17
Figure 18: Annual NSC Whitefish Export Promotion Expenditures, Total and by Type, 2003–2017
0
20
40
60
80
100
120
2003 2004 2005 2006 2007 2008 2009 2010 2011 2012 2013 2014 2015 2016 2017
NO
K m
illio
n
All Whitefish Fresh/Frozen Clipfish/Saltfish Stockfish
Figure 19: Shares of Annual NSC Whitefish Export Promotion Expenditures Allocated to Frozen/Fresh Whitefish, Clipfish/Saltfish, and Stockfish, 2003–2017
0%
10%
20%
30%
40%
50%
60%
70%
2003 2004 2005 2006 2007 2008 2009 2010 2011 2012 2013 2014 2015 2016 2017Fresh/Frozen Clipfish/Saltfish Stockfish

Hvor effektivt fremmer Norges Sjømatråd norsk hvitfiskeksport?
18
Figure 20: Monthly NSC Whitefish Export Promotion Expenditures by Type, 2003–2017
0
2
4
6
8
10
12
14
16
18Ja
n-03
Jun-
03N
ov-0
3A
pr-0
4Se
p-04
Feb-
05Ju
l-05
Dec
-05
May
-06
Oct
-06
Mar
-07
Aug
-07
Jan-
08Ju
n-08
Nov
-08
Apr
-09
Sep-
09Fe
b-10
Jul-
10D
ec-1
0M
ay-1
1O
ct-1
1M
ar-1
2A
ug-1
2Ja
n-13
Jun-
13N
ov-1
3A
pr-1
4Se
p-14
Feb-
15Ju
l-15
Dec
-15
May
-16
Oct
-16
Mar
-17
Aug
-17
NO
K m
illio
n
Fresh/Frozen Clipfish/Saltfish Stockfish
than tripled between the low point of 2004 and 2017, the real purchasing power of those expenditures4 increased by only 50% (Figure 21). In other words, each NOK was able to purchase increasingly less in terms of promotional activities in foreign countries in every year between 2003 and 2017 because of inflation in those countries and weakness of the NOK against foreign currencies. The consequence was erosion in the NSC promotion budget by a total of NOK 271.1 million (24.8%) between 2003 and 2017 (Figure 21).
Even though the Norwegian seafood industry invested a total of NOK 1.1 billion to promote exports of their whitefish products between January 2003 and December 2017, those expenditures have actually been quite meager when compared to the actual value of Norwegian whitefish exports. Over that period, the promotion intensity (defined as the ratio of the total investment in Norwegian whitefish to the value of whitefish exports) amounted to an annual average of between 0.41% and 1.17% with an overall average of only 0.68% (Figure 22). A low promotion intensity is common across export promotion programs (Kinnucan and Cai, 2011).
4 To calculate the real purchasing power of NSC expenditures, we divided nominal expenditures by a trade-weighted Consumer Price Index (base 2003) for the top ten countries that have imported Norwegian seafood over 2003-2017 to account for inflation. The deflated expenditures series was then adjusted for changes in the value of the NOK over the same period using a trade-weighted exchange rate index (base 2003) also created by the FABA team for the same top ten countries that have imported seafood from Norway between 2003 and 2017. See the methodology section for more information on how a deflated and exchange-rate-adjusted expenditure variable was used in the econometric analysis.

Hvor effektivt fremmer Norges Sjømatråd norsk hvitfiskeksport?
19
Figure 21: Annual Nominal vs. Real, Exchange-Rate-Adjusted (2003=100) NSC Whitefish Export Promotion Expenditures and the Real Implied Reduction in the NSC Promotion Budget, 2003-2017
0
20
40
60
80
100
120
2003 2004 2005 2006 2007 2008 2009 2010 2011 2012 2013 2014 2015 2016 2017
NO
K m
illion
Nominal Deflated and Rate Exchange Adjusted (2003=100) Real Reduction in Promotion Budget
Source: Developed by authors from data provided by NSC (2018) and data from IMF (2018a). Figure 22: Promotion Intensity of NSC Whitefish Expenditures, January 2003 – December 2017
0.00%
0.50%
1.00%
1.50%
2.00%
2.50%
2003 2004 2005 2006 2007 2008 2009 2010 2011 2012 2013 2014 2015 2016 2017
Source: Developed by authors from data provided by NSC (2018a).

Hvor effektivt fremmer Norges Sjømatråd norsk hvitfiskeksport?
20
REVIEW OF PREVIOUS STUDIES ON WHITEFISH EXPORTS5 As background to the empirical analysis of the NSC whitefish export promotion program presented in the next section, this section briefly reviews three groups of previous studies of whitefish: (1) studies focusing on whitefish supply, (2) studies focusing on whitefish demand, and (3) studies of whitefish export demand promotion.
Previous Studies on Whitefish Supply Few studies have attempted to estimate supply elasticities for capture fisheries like that of cod. One reason for the dearth of studies is the backward-bending supply curve theorized for fisheries. In an unregulated fishery that is underfished, an increasing price would lead to higher supply. However, when the stock is overfished, a higher price would lead to a reduction in the supply. Because most fisheries are regulated, most studies of the supply behavior of cod and other wild whitefish supplies have concluded that their supplies are largely determined by the size of their respective fishery quotas (Arnason, 2004; Asche and Hannesson, 2002; Pascoe and Mardle, 1999; Rudders and Ward, 2015). The implication is the elasticity of whitefish supply is quite low so that price has little bearing on the quota determination. In other words, fishermen will tend to catch according to whatever quota they have at their disposition. Studies using data before the quota systems were fully binding found that the price elasticity of fish supply ranged from inelastic (Salvanes and Squires, 1995) to unitary elastic (Asche, 2009). In the modeling of world fish supply undertaken by the World Bank, capture fish supply is assumed to be completely exogenous to price (price inelastic) (Msangi et al., 2013). The supply elasticity of aquaculture species, however, is assumed to be somewhere between 0.5 and 1.0. So over both capture and aquaculture, the supply of fish in the World Bank model would be somewhere between zero and 1.0. Although the literature suggests that the total supply of cod is highly unresponsive to changes in market prices, Asche and Hannesson (2002) concluded that the form in which cod is sold (fresh/frozen or further processed by drying and/or salting) is determined to some extent by the relative prices of the various product forms. Thus, they conclude that prices of the various forms of cod products (product formats) tend to be highly correlated over time. There are, of course, adjustment costs in switching between product formats that limit the flexibility of producers/processors in switching among those formats as prices change. For instance, Asche and Hannesson (2002) found that investment in freezing capabilities is costly and the return on those investments depends on capacity utilization. Compared to Norway, Iceland appears to have a higher substitutability in production of different cod products. Another study shows that first-hand prices in Norway are integrated across different sales channels such as auctions and direct sales (Helstad, Vassdal, Trondsen, and Young, 2005).
5 Principal authors of this section were Dr. Sigbjørn Tvetarås (Universitetet i Stavanger) and Dr. Frank Asche (University of Florida).

Hvor effektivt fremmer Norges Sjømatråd norsk hvitfiskeksport?
21
While the supply of whitefish from wild fisheries is largely determined by the quota, such is not the case for the aquaculture species playing an increasing role in the market, especially tilapia and pangasius. Although no study has yet estimated the supply elasticities for these aquaculture products, the marginal cost of producing such products likely determines the production of these species given the demand as Asche, Bremnes, and Wessells (1999) demonstrated for salmon. Moreover, supply is expected to continue to increase given the strong productivity growth for aquaculture products discussed by Kumar and Engle (2016) which will likely continue to drive down their prices and enhance their competitiveness in global whitefish markets.
Previous Studies on Whitefish Demand
Whitefish demand studies can be arranged into three groups: (1) demand driver analyses, (2) market integration analyses, and (3) hedonic analyses.
Demand Driver Analyses
A number of studies over many years have examined the drivers of the demand for various whitefish species (Table 2). Many of those studies focus on whitefish products that Norway exports (such as cod, saithe, and haddock). Many of them also focus on markets into which Norway exports its whitefish (such as the EU countries). However, none of the studies focuses specifically on the demand for specifically Norwegian exports of all whitefish or of the main categories of whitefish (fresh and frozen whitefish, clipfish and saltfish, and stockfish) that the NSC promotes.
Many of the studies consider products and markets that are less relevant to Norway such as the tilapia, pangasius, and Alaskan pollock markets in the United States. Most of the studies have been estimated as demand systems and most of them as variations of Almost Ideal Demand System (AIDS) models. Several studies consider aggregate “fish” demand without distinguishing among species, particularly those that use household expenditure surveys where the households do not register the type of fish being consumed. In such studies, the estimated price elasticities vary from inelastic (around 0.3) to slightly elastic (just over one). The span in the estimated consumer expenditure (income) elasticities is larger from around 0.5 to just over 2.
Studies focusing specifically on cod demand have estimated price elasticities of around one and income elasticities slightly below one (Table 2). The estimated price and income elasticities for whitefish species vary from study to study although their range is limited and do not usually exceed about one. The most price elastic demands have been found for catfish, tilapia, whiting and pollock in U.S. markets using scanner and consumer panel data (Chidmi, Hanson, and Nguyen, 2012; Singh, Dey, and Surathkal, 2012; Singh, Dey, and Surathkal, 2014). Xie and Myrland (2010) found relatively high own-price elasticities of over 2.0 for a couple of salted cod products in Spain. An interesting question is whether the variations in quantity demanded of salted cod is driven by price variations or by availability. The consumption of salted cod could salted

Hvor effektivt fremmer Norges Sjømatråd norsk hvitfiskeksport?
22
Table 2: Previous Studies of Whitefish: Overview of Reported Price and Income Elasticities
Species Products Markets Data type Data periodPrice elasticitya
Income elasticity Method Year Reference
Catfish Whole, fillet, other USA Wholesale
Jan 1996 - Jan 2007 0.77-1.83 0.77 - 1.21 Rotterdam 2009
Muhammad and Hanson, 2009
Catfish NA USA Scanner data Jun 2008 - Jun 2010 1.95 1.38 NL-AIDS 2012 Chidmi et al., 2012
Cod Fresh Norway Ex-vessel dataJan 1982 - Dec 1995 1.17
Error correction model 2002
Asche, Flaaten, Isaksen, and Vassdal, 2002
Cod UK Consumer panel
Feb 1992 - Nov 2003 0.80 0.98
Dynamic AIDS 2004
Fousekis and Revell, 2004
Cod Salted, klippfish Spain Export data
Jan 1994 – Dec 2009 0.67 – 2.40 0.70 – 1.84 AIDS 2010 Xie and Myrland, 2010
Cod Frozen unbreaded USA Scanner data
Jun 2007 - Jun 2010 1.10 0.40
Dynamic AIDS 2012 Singh et al., 2012
Cod NA USA Import data 1990(Q1) - 2011(Q4) 0.21 - 0.51b 0.97 - 0.99c IAIDS 2013 Asche and Zhang, 2013
Cod NA USA Consumer panel data
Jun 2005 - Jun 2011 0.97-1.12 0.80 - 0.85
Dynamic AIDS 2014 Singh et al., 2014
Cod NA EU Import data Jan 1988 - Dec 2014 0.58 - 1.13 0.84 - 0.92 LA/AIDS 2015 Hellandsjø, 2015
Cod Frozen fillets Germany Scanner data Jan 2008 – Dec 2012 1.03 1.01 LA/AIDS 2016 Bronnmann, 2016
Fish NA
Various Asian countries
Houshold surveys 2001-2004 0.78 - 1.45 0.61 - 2.19
QUAIDS model 2008 Dey et al., 2008
Fish NA Japan Houshold surveys 1981-1995 0.72 - 1.00
Differential demand system 1999
Eales and Wessells, 1999
Fish NA Japan Houshold surveys
Jan 1980 - Dec 1992 0.87 - 1.18 0.70 - 2.04 AIDS 1997
Eales, Durham, and Wessells, 1997
Fisha Fresh, cured, canned Canada
Household survey 1986 0.88 - 0.99 0.98 - 1.04 LA/LAIDS 1997
Salvanes and DeVoretz, 1997
Fisha NA Spain
National expenditure survey
Apr 1990 - March 1991 0.34 - 0.57 1.23 - 1.32
Cross-sectional demand system 1998 Gracia and Albisu, 1998
Fisha NA
Denmark, Finland, Norway, Sweden
Food disappearance data 1966-1996 0.33 - 0.80 0.49 - 0.79 AIDS 2003
Rickertsen, Kristofersson, and Lothe, 2003
Fishd NA Canada
Food expenditure survey 1992-1996 0.48 - 0.77 0.49 - 0.59 QUAIDS 2006
Lambert, Larue, Yélou, and Criner, 2006
Fishd Canned, fresh and frozen France
Consumer panel data
Jan 1991 - Dec 2002 0.77 0.96 MS-AID 2007 Allais and Nichele, 2007
Fishd NA Japan and USA
Disappearance data/Expenditure survey
1976(Q1)–2001(Q4) 0.69 - 0.77 0.89 - 39.93 GAIDS 2007 Tonsor and Marsh, 2007
Fishd NA Various Fish demand studies Many years 0.78
Meta analysis 2009 Gallet, 2009
Fishd Breaded, frozen USA Scanner data
Jun 2005 - Jul 2010 1.05 0.64 LA-AIDS 2017
(Surathkal, Dey, Engle, Chidmi, and Singh, 2017
Fishd Entrée, frozen USA Scanner data Jun 2005 - Jul 2010 0.93 0.41 LA-AIDS 2017 Surathkal et al., 2017
Fishd Unbreaded, frozen USA Scanner data
Jun 2005 - Jul 2010 1.10 1.24 LA-AIDS 2017 Surathkal et al., 2017
Haddock UK Consumer panel
Feb 1992 - Nov 2004 0.69 1.10
Dynamic AIDS 2004
Fousekis and Revell, 2004
Haddock NA USA Import data 1990(Q1) - 2011(Q4) 0.11 - 0.41b 0.93 - 0.94 c IAIDS 2013 Asche and Zhang, 2013
Pangasius NA EU Import data Jan 1988 - Dec 2014 0.27 - 1.41 0.96 - 1.51 LA/AIDS 2015 Hellandsjø, 2015
Pangasius Frozen fillets Germany Scanner data Jan 2008 – Dec 2012 0.99 0.93 LA/AIDS 2016 Bronnmann, 2016
(Table continued on next page)

Hvor effektivt fremmer Norges Sjømatråd norsk hvitfiskeksport?
23
Table 2: (cont’d)
Species Products Markets Data type Data periodPrice elasticitya
Income elasticity Method Year Reference
Alaska Pollock
Frozen unbreaded USA Scanner data
Jun 2007 - Jun 2010 2.08 0.48
Dynamic AIDS 2012 Singh et al., 2012
Alaska Pollock NA USA Import data
1990(Q1) - 2011(Q4) 0.16 - 0.21 b 0.99 - 1.01 c IAIDS 2013 Asche and Zhang, 2013
Alaska Pollock NA USA
Consumer panel data
Jun 2005 - Jun 2013 0.58 - 1.23 0.62 - 0.71
Dynamic AIDS 2014 Singh et al., 2014
Alaska Pollock NA EU Import data
Jan 1988 - Dec 2014 0.20 - 0.92 1.27 -1.55 LA/AIDS 2015 Hellandsjø, 2015
Alaska Pollock Frozen fillets Germany Scanner data
Jan 2008 – Dec 2012 1.01 0.97 LA/AIDS 2016 Bronnmann, 2016
Saithe NA EU Import data Jan 1988 - Dec 2014 0.39 - 1.09 0.32 - 0.52 LA/AIDS 2015 Hellandsjø, 2015
Saithe Frozen fillets Germany Scanner data Jan 2008 – Dec 2012 1.10 1.25 LA/AIDS 2016 Bronnmann, 2016
Tilapia NA USA Scanner data Jun 2008 - Jun 2010 0.77 1.61 NL-AIDS 2012 Chidmi et al., 2012
Tilapia Frozen unbreaded USA Scanner data
Jun 2007 - Jun 2010 0.83 0.61
Dynamic AIDS 2012 Singh et al., 2012
Tilapia NA USA Import data 1990(Q1) - 2011(Q4) 0.06 - 0.50 b 1.03 - 1.23 c IAIDS 2013 Asche and Zhang, 2013
Tilapia NA USA Consumer panel data
Jun 2005 - Jun 2012 1.19 - 1.27 1.23 - 1.29
Dynamic AIDS 2014 Singh et al., 2014
Tilapia Frozen fillets Germany Scanner data Jan 2008 – Dec 2012 1.01 1.07 LA/AIDS 2016 Bronnmann, 2016
Whiting Frozen unbreaded USA Scanner data
Jun 2007 - Jun 2010 1.67 0.52
Dynamic AIDS 2012 Singh et al., 2012
Whiting NA USA Consumer panel data
Jun 2005 - Jun 2014 1.92 - 2.08 0.86 - 09.95
Dynamic AIDS 2014 Singh et al., 2014
a Marshallian – absolute value. b Price flexibilities. c Scale elasticities. d Fish is an aggregate of different species.
be a result of how much is available as producers shift among product formats as relative prices change. Although cross-price elasticities are not reported in Table 2, many of the studies considered the responsiveness of the demand for one fish product to changes in the prices of other fish products. For example, Singh et al. (2012) found that for frozen unbreaded cod (frozen cod fillets) in the United States, the strongest substitute is salmon (cross price elasticity of 0.40) followed by scallops (0.19), and whiting and tilapia (both 0.09). However, in a subsequent study, Singh et al. (2014) concluded that tilapia and whiting were the strongest substitutes for cod in the United States followed by salmon. Asche and Zhang (2013), however, found that Alaska Pollock was the strongest substitute for cod in the U.S. market over the early years in their study period of 1990 – 2011. Then, a structural break in the U.S. cod market occurred after which tilapia took over as the most important substitute. The Asche and Zhang (2013) study also concluded that haddock went through a similar transition in which haddock prices were strongly influenced by cod imports before the structural break after which tilapia imports became more important for cod price development.

Hvor effektivt fremmer Norges Sjømatråd norsk hvitfiskeksport?
24
In a study of EU whitefish demand, Hellandsjø (2015) concluded that only saithe prices appeared to have a slight influence on cod prices before June 2005 after which pangasius from Vietnam had a significant influence on cod prices (0.20 cross-price elasticity). On the other hand, the Hellandsjø (2015) study also found that cod prices exercise a strong influence on the demands for both saithe and pangasius concluding that cod remains the whitefish price leader in EU markets. A study of retail fish demand in the UK found that salmon and haddock were the closest substitutes for cod (Fousekis and Revell, 2004). Market Integration Analyses
A number of studies analyze market integration in the European Union import markets for whitefish, including Gordon and Hannesson (1996), Asche, Salvanes, and Steen (1997), Asche, Gordon, and Hannesson (2002), Asche, Gordon, and Hannesson (2004), Nielsen (2005), and Nielsen, Smit, and Guillen (2009). Three main insights emerge from that literature:
The markets for whitefish are integrated among EU countries in all cases examined and also between the EU and the U.S.
The cod market is strongly integrated with markets for all other whitefish.
Cod appears to be the whitefish market leader. However, Nielsen et al. (2009) found that while cod is the price leader in the fresh market for whitefish, hake and haddock were the leaders in the frozen whitefish market.
Nielsen (2005) only found partial integration of the whitefish market when investigating first-hand prices in the European Union. This finding may be explained by some combination of preferences for locally caught fish, seasonality, and local market power of fishermen. More importantly, a weaker link found between locally produced fish across European countries provides evidence that EU whitefish imports of hake, Alaska Pollock, cods, tilapias etc. are the main engine of integrating these markets. A more recent branch of the literature on the whitefish market investigates market integration in the EU, Russia and the U.S. across capture and aquaculture species (Asche, Roll, and Trollvik, 2009; Berg Andersen, Lien, Tveterås, and Tveterås, 2009; Bronnmann, Ankamah-Yeboah, and Nielsen, 2016; Norman-Lopez, 2009). These more recent studies were motivated by the inroads of tilapia and catfish species into the global whitefish market from the late 1990s and onwards. Both Berg Andersen et al. (2009) and Bronnmann et al. (2016) found strong evidence of market integration between traditional wild and new farmed species. In fact, the former study found that pangasius was a price leader in the Russian market for imported frozen white fish. The Vietnamese catfish has a high market share in the Russian market that makes their result appear reasonable. Bronnmann et al. (2016) found that pangasius and tilapia clearly are part of the whitefish market in Germany. In contrast, they found that tilapia only accounted for a small share of the German whitefish market. They conclude that tilapia is not clearly as integrated as strongly with the German whitefish market as is pangasius.

Hvor effektivt fremmer Norges Sjømatråd norsk hvitfiskeksport?
25
Norman-Lopez (2009) conducted an investigation of the whitefish market that was more limited in scope since it tested for integration in the U.S. market between farmed species of tilapia and catfish and some more fringe capture species like sea dab, blackback flounder, and red snapper. Important whitefish species like cod, pollock and hake were not included. Nevertheless, the study found integration across farmed and wild-caught species indicating that the U.S. whitefish market is changing. The study by Asche and Zhang (2013) compensated for this lack of generality as they tested for structural demand changes in the U.S. whitefish market. Their study provided empirical evidence that tilapia imports have changed the U.S. whitefish market by estimating that cod prices have become increasingly sensitive to tilapia prices. The diversity of species in the whitefish market can be an important factor in explaining why price volatility in this market is lower than in the salmon market (Dahl and Oglend, 2014). The strength of the international competition can also be linked to the fact that there are limited restrictions on fish trade. Guillotreau and Péridy (2000) reported that the more processed seafood products appeared to be most affected by EU trade regulation while prices of less processed fish products were little influenced. An implication of this diversity for Norwegian cod is that international competition is increasing. Another perspective on the importance of trade competition in the whitefish market is that prices of Norwegian exported cod to Portugal do not seem to be driven by upstream prices in Norway, but rather on international frozen cod prices (Asche, Menezes, and Dias, 2007). This finding contrasts with most domestic supply chains like that of U.S. beef, for example. Hedonic Analyses In recent years, a literature using hedonic price functions has emerged which focuses on the contribution of the different attributes of fish products to price formation. This literature concludes that despite increased competition between cod and other species in the whitefish market, there remain opportunities to obtain a price premium paid for cod. Cod already has a price premium relative to most other white fish species (Roheim, Gardiner, and Asche, 2007). Asche, Chen, and Smith (2015) and Lee (2014) showed that there could be large price variations based on differing attributes even within a product category like cod. For instance, these studies found that there are price differences that can be linked to indicators of freshness, size, production method, and availability. Price differences are also reflected through labeling such as private labels, ecolabels, and branding (Asche and Bronnmann, 2017; Blomquist, Bartolino, and Waldo, 2015; Bronnmann and Asche, 2016; Roheim, Asche, and Santos, 2011; Sogn-Grundvag, Larsen, and Young, 2014).
Previous Studies on Whitefish Export Demand Promotion
A major strategic concern for the Norwegian whitefish industry is that the exporters who pay the levy that funds NSC whitefish advertising and promotion programs operate at the front end of

Hvor effektivt fremmer Norges Sjømatråd norsk hvitfiskeksport?
26
the Norwegian whitefish supply chain while consumers are far downstream at the opposite end, often in distant countries. Thus, to enhance exports of Norwegian whitefish, the NSC must conduct its advertising and promotion campaigns at the retail end of the supply chain in many foreign markets under the assumption that sufficient benefits will migrate upstream to the various stakeholders to more than cover the cost of the advertising and promotion funded by the export levy. The vast majority of the large and growing body of literature demonstrates that, by and large, generic export promotion programs have successfully expanded the export demand for their respective products across a broad range of commodities. What’s more, the studies overwhelmingly conclude that stakeholders have earned substantial returns on their investments in those programs6. A study of U.S. agricultural and food export promotion programs concluded that the average return to exporters across a large number of commodity promotion programs is $US 10.81 per U.S. dollar invested in export promotion with a range of $US 3.5 to $US 25.7 (Williams et al., 2016). A number of studies have examined NSC export demand promotion programs. A recent study by Capps and Williams (2017) concluded that NSC seafood promotion in general added about 10% to the aggregate export value of Norwegian seafood between 2003 and 2016 resulting primarily from an export price increase of up to 12% and an export volume increase of up to 6.5% depending on the price elasticity of Norwegian seafood export supply. They estimated that the ratio of benefit-to-cost over that period for the Norwegian seafood industry ranged from 4.2 to 15.7. A number of studies have examined the NSC salmon export demand promotion program (for example, Myrland and Kinnucan, 2000; Kinnucan and Myrland, 2000, 2001, 2002, 2003, 2006; Xie, Kinnucan and Myrland, 2009; Xie, 2008 and 2015; and Kaiser, 2015)7. The studies concluded that the salmon export promotion elasticity ranges from 0.01 to 0.054 and that the benefit-cost ratio (NOK returned per NOK of expenditure) ranges from as low as -0.08 to as high as 9.53. Only one known study has considered any aspect of the NSC whitefish export demand promotion program. An econometric analysis of NSC promotion of skrei and fresh cod by CAPIA AS (2016) was conducted based on the methodology of Kaiser (2015) for salmon. Using quarterly data for 2003-2015, they reported an average BCR for NSC skrei and fresh cod promotion over that period of 1.02 and 4.56, respectively. However, they found the marginal export promotion BCR for skrei to be higher at 10.3 over the 2003-2013 period and 13.7 over the 2014-2015 period. Likewise, for fresh cod, they found a higher marginal BCR of 14.5 over the full 2003 to 2015 period.
6 Capps and Williams (2017) provide a summary analysis of those studies. 7 Capps and Williams (2017) provide a detailed analysis of the many past studies of the NSC salmon export demand promotion program.

Hvor effektivt fremmer Norges Sjømatråd norsk hvitfiskeksport?
27
Concluding Summary of the Literature Review The literature regarding the supply for whitefish clearly indicates that the supply of these capture species is largely determined by the quotas set and not so much by price (Arnason, 2004; Pascoe and Mardle, 1999). In contrast, aquaculture can respond to increasing prices with larger supply. Given that capture and farmed fish of many varieties from many countries interact in whitefish markets, there may be some spillover from NSC whitefish export promotion to other whitefish exported by other countries. If so, then NSC marketing efforts targeting the characteristics that differentiate Norwegian whitefish from those of other countries are becoming increasingly important. On the demand side, the literature concludes that the demands for specific whitefish species are generally price inelastic with income elasticities that vary from relatively low (about 0.5) to relatively high (about 2.0). The price inelastic findings of the demand analyses are at odds with the findings from the market integration studies of growing competition for capture whitefish markets from growing global supplies of farmed whitefish. In general, the more substitutes a given product faces in a market, the higher the price elasticity would be expected to be. If markets of capture whitefish like Norwegian cod are becoming increasingly integrated with farmed whitefish in global markets, then price elasticities of greater than one would be expected. Regardless, the market integration literature demonstrates that the global whitefish market within which Norwegian exports of whitefish compete is changing. In particular, new aquaculture species like pangasius and tilapia have entered those markets and are influencing price formation to some extent in the EU but more particularly in the United States. In the U.S. whitefish market, tilapia is the largest aquaculture species while in the EU it is pangasius. Cod still appears to be the price leader, however. Also, in the U.S. market there are signs that the dominant aquaculture species, tilapia, increasingly influences cod prices. Nevertheless, consumers distinguish between the species and are willing to pay price premiums for preferred species and product attributes. In this sense, investment in promotion can be efficient in maintaining or increasing the price markup for premium species like cod and haddock. Although many studies have focused on Norwegian seafood export promotion, nearly all have focused on salmon and only one has considered any aspect of NSC whitefish export promotion. The recent study by Capps and Williams (2017) concludes that the overall NSC seafood export promotion program has been successful in boosting Norwegian seafood price and value and in generating an impressive return on investment for stakeholders. A number of other studies arrived at similar conclusions for the NSC salmon promotion program. Likewise, the one study on Norwegian cod concludes that NSC expenditures to promote cod have been successful. None of these studies, however, considered the effectiveness of the entire whitefish export promotion program or of the expenditures made to promote different forms of Norwegian whitefish exports such as fresh and frozen whitefish, clipfish and saltfish, and stockfish.

Hvor effektivt fremmer Norges Sjømatråd norsk hvitfiskeksport?
28
METHODOLOGY The first step in the analysis is to measure the relationship between Norwegian whitefish export demand and NSC whitefish promotion programs through the development of econometric models representing the export demands for all Norwegian whitefish and for the three main categories of whitefish promoted by NSC. The analysis relies on monthly data from January 2003 through December 2017. Econometric analysis allows for the measurement of the relationship between the demand for Norwegian whitefish exports (all whitefish and the three main categories of whitefish promoted by NSC exports) and the respective promotion expenditures by controlling for other factors that may affect the demand for Norwegian whitefish exports. The process effectively isolates the specific effect of NSC promotion programs on whitefish export demand. The next step is to use the results of the econometric analyses to simulate the effects of the NSC export promotion program on Norwegian whitefish exports (in total and across the three main categories promoted by NSC) and on the profitability of the Norwegian whitefish industry. In the process, the shares of the prices and values of Norwegian whitefish exports in total and by main category that can be confidently attributed to their respective export promotion efforts of the NSC over the study period are determined. The final step is the use of the results from the first two steps to calculate the return to stakeholders from NSC whitefish promotion in a benefit-cost analysis. Even if the NSC export promotion programs have successfully increased the levels of Norwegian whitefish export revenues and/or the export revenues of any of the three whitefish categories they promote, an important question for stakeholders is whether or not the cost to them of those programs over time has outweighed the additional export revenues and profit that may have accrued to their industry as a result. Put another way, stakeholders want to know what the return has been to the funds they have contributed to promoting Norwegian whitefish exports and, therefore, whether those funds might have been more profitably invested elsewhere. Addressing these questions requires a benefit-cost analysis of the returns to the stakeholders from the additional export revenues and profit generated by the NSC export promotion programs for whitefish. To this end, pertinent benefit-cost ratios (BCRs) for NSC whitefish programs are calculated which represent economic measures of return on investment (ROI) to those programs for all whitefish as well as for the three main whitefish categories promoted by NSC.
Econometric Model Development Similar to the work done for all Norwegian seafood exports, an assessment of the effectiveness of NSC whitefish export promotion activities first required the development and estimation of econometric export demand models. In this study, four Norwegian whitefish export demand models were developed: (1) aggregate whitefish, (2) fresh and frozen whitefish, (3) clipfish and saltfish, and (4) stockfish. The analysis of each model covered the period of January 2003

Hvor effektivt fremmer Norges Sjømatråd norsk hvitfiskeksport?
29
through December 2017, a total of 180 monthly observations for each model. Control or explanatory variables considered for each of the four models included: (1) Norwegian export prices of the respective whitefish type; (2) prices of Norwegian and other fish exports; (3) income or the gross domestic product (GDPs) of importing countries; (4) exchange rates of the importing countries relative to the NOK; (5) inflation in importing countries; (6) expenditures by the NSC to promote exports of the respective whitefish types; (7) inertia or rigidities in month-to-month changes in exports of the respective Norwegian whitefish types; and (8) qualitative factors, essentially representing market events that affect the level of exports of the respective Norwegian whitefish types. The dependent variable in each of the four econometric models is the corresponding monthly Norwegian whitefish exports. The key results of the modeling process are measures of the change in the export demand for all Norwegian whitefish for the three main categories of whitefish promoted by NSC in response to their respective NSC export promotion expenditures at fixed prices, controlling for the effects of all other variables. This measure of change metric is commonly referred to as the expenditure elasticity of export demand. In addition to including the export prices of Norwegian whitefish in their respective models, we also tested for the significance of the Norwegian salmon price as a driver of export demand in each of the four models as have other studies (Fousekis and Revel, 2004; Singh et al., 2012 and 2014). The whitefish export prices and the price of salmon are calculated as ratios of their respective values to their export volumes. The resulting weighted average prices of Norwegian whitefish and salmon exports are expressed in NOK per kilogram (kg). To be consistent with economic theory, exports of Norwegian whitefish products should be inversely related to the respective whitefish export price and positively related to the salmon price. Given the potential effects of growing exports of competing aquaculture whitefish species on global whitefish markets and Norwegian whitefish exports as discussed in the background section and emphasized in the literature review of this report, we divide the export prices of whitefish and salmon by a price index associated with exports of competing aquaculture species developed by Tveterås et al. (2012) and published by the Food and Agriculture Organization (FAO, 2018b)8. To account for changes in currency values against the NOK, the monthly relative price of Norwegian whitefish exports was multiplied by a monthly trade-weighted exchange rate index (base period 2010) across the top ten importing countries in each month of each year. The trade weights used were the shares of Norwegian whitefish exports accounted for by the top ten importing countries. The trade weights were calculated for each month in each year from 2003 to 2017 because the top ten countries were not uniform from year to year. The trade-weighted NOK exchange rate was developed by FABA staff using monthly trade weights calculated from monthly Norwegian whitefish export data and exchange rate data available from the International Monetary Fund (IMF, 2018). Economic theory suggests that exports of Norwegian whitefish should be directly related to the incomes of consumers in the importing countries. Nominal incomes alone, however, do not 8 The monthly FAO aquaculture price index series was obtained directly from Tveterås (2018).

Hvor effektivt fremmer Norges Sjømatråd norsk hvitfiskeksport?
30
reflect consumer purchasing power because of inflation and exchange rate changes over time. Because Norway exports whitefish to a large number of countries each year, a trade-weighted and exchange-rate-adjusted measure of the real (deflated) Gross Domestic Products (GDP) across the top ten importing countries was calculated to represent the purchasing power of consumers in importing countries. The (inflation-adjusted) GDPs of the top ten countries were converted to NOK, multiplied by their trade weights, deflated by an aggregate trade-weighted Consumer Price Index (base period 2010) representing the top ten importing countries, and aggregated into a single real GDP measure for each month in each year (2010 NOK). The real aggregate GDP measure was then multiplied by the monthly trade-weighted exchange rate index to account for changes in currency values against the NOK. Accounting for the effects of NSC export promotion programs on Norwegian whitefish exports is not straightforward for several reasons, including: (1) exports and promotion expenditures exhibit seasonality; (2) nominal promotion expenditures do not reflect the purchasing power of the kroner spent on promotion; (3) promotion expenditures tend to have carryover effects; and (4) promotion expenditures normally exhibit effects of wearout or diminishing marginal returns. Seasonal patterns (albeit different) are evident in both NSC expenditures and the volume of Norwegian whitefish exports. To avoid confounding associated with seasonality, we seasonally adjust the NSC expenditures using the X13 technique (EVIEWS 8.0 software program). The actual purchasing power of promotion expenditures is affected by the rates of inflation and changes in the exchange rates of the countries where promotion occurs as discussed in the background section of this report. Consequently, NSC nominal expenditures to promote exports of all whitefish and of each of the three main categories of whitefish (fresh and frozen whitefish, clipfish and saltfish, and stockfish) in this study were deflated and exchange-rate-adjusted following the process used for the aggregate GDP measure previously discussed. Third, carryover or lagged effects in promotion expenditures are likely. That is, promotion expenditures in a given period often do not have their full impact within that period. Rather, the effects of promotion are normally found to be spread over various subsequent periods and, thus, impact sales over an extended period of time. Generic promotion activities, like those of the Norwegian Seafood Council, are generally directed toward longer-term responses and, therefore, have often been found to generate lagged or carryover effects, sometimes quite lengthy (Forker and Ward, 1993). In a recent study, Capps and Williams (2017) found that the impact of NSC seafood export promotion on Norwegian seafood exports over the period of January 2003 and December 2016 was not felt all at once in the specific months of expenditure but instead tended to be distributed over those months as well as the following five months. The impact tended to grow from the current period through the second and third months out and then to dissipate over the fourth and fifth months. Their finding is consistent with the conclusions of most evaluations of export promotion programs.

Hvor effektivt fremmer Norges Sjømatråd norsk hvitfiskeksport?
31
To capture the dynamic carryover effects of NSC whitefish export promotion programs in this study, we implement a polynomial distributed lag specification in the econometric analysis as commonly done in evaluations of U.S. domestic and export promotion programs. A usual difficulty in accounting for the carryover or lagged effects is determining the specific nature of the lag structure of expenditures on exports. Economic theory provides relatively little guidance as to the structure and length of this dynamic process, however. We follow the common procedure of using the Almon polynomial distributed lag (PDL) formulation to account for the time lag in the impact of the promotion investments on Norwegian whitefish exports. Conventionally, researchers, using statistical criteria like the Akaike Information Criterion (AIC), the Schwarz Loss Criterion (SLC), or the Hannan-Quinn Criterion (HQC), allow the data to suggest the optimal number of lags to include in the specification. Previous research on a broad range of agricultural and food products suggests that full impacts of promotion expenditures within a given month occur within no more than a year following the expenditure. Hence, we consider lags of NSC expenditures up to twelve months, which allows us to capture the short-run (immediate or contemporaneous) effects and long-run or (cumulative) effects as well as the average length of time (in months) before changes in export market development expenditures begin to affect the demand for Norwegian whitefish exports. Promotional expenditures also are subject to wearout related to the law of diminishing returns. That is, equal increments in promotional expenditures over time will have declining impacts on export demand. Thus, as promotion expenditures increase, they do not have a linear effect on demand. Rather the increase in the impact tends to decline as those expenditures increase. For that reason, promotion programs with little funds often experience large increases in revenue relative to their small promotion expenditures whereas well-funded programs tend to find larger impacts on their revenue than the smaller programs, of course, but which are smaller relative to their much larger expenditures (Capps, Williams, and Hanselka, 2018). There are many reasons for the diminishing returns to promotion expenditure. For example, increases in expenditures to promote a specific fish species in a country unfamiliar with that species and the associated preparation and recipe requirements are likely to have a declining impact on sales of that fish species in that country over time as that species becomes increasingly adopted into standard diets and recipes in the country of promotion. To capture the effects of diminishing marginal returns to NSC expenditures to promote whitefish exports over time, we implement a logarithmic transformation of the exchange rate-adjusted and deflated NSC export promotion expenditures as commonly done in many econometric analyses of export promotion (Capps and Williams, 2017). While economic variables just discussed like purchasing power in importing countries, the export prices of whitefish, salmon, and other competing species, exchange rates, and promotion expenditures explain the long-term trends in exports, various events in global whitefish markets may have impacts in specific years or across many years. For example, the seasonal patterns evident in the volume of monthly Norwegian whitefish exports discussed earlier must be accounted for in the analysis. Also, various qualitative events may affect global markets for whitefish in particular years and must be taken into account to more accurately isolate the effects
Hvor effektivt fremmer Norges Sjømatråd norsk hvitfiskeksport?
32
of promotion on exports. The major global events with potential to impact Norwegian whitefish exports were identified in discussion with NSC personnel. Those events were treated as indicator variables in the econometric models associated with exports of Norwegian whitefish and included: (1) weather events, particularly in 2006 and 2015; (2) the presence of bigger cod beginning in 2010; (3) increases in quotas for cod (2011 and 2013) and haddock (2009 to 2011 and in 2016); (4) increased competition in the whitefish market beginning in 2005; (5) the filleting of whitefish by China beginning in 2004; (6) the global financial meltdown in 2007 and 2008; (7) the economic recession in 2008 and 2009; (8) Nigerian currency exchange restrictions in 2015 and 2016; and (9) the crisis in Brazil in 2014 to 2016.
The Simulation Process Like any generic export promotion program, the Norwegian Seafood Council’s objective is to shift out the foreign demand for the good that the industry it represents sells (Norwegian whitefish in this case) and, thereby, increase its price and value. An export promotion program that successfully moves out the foreign demand curve also will raise the price to some extent. In raising the price, however, promotion can also stimulate a greater level of production over time than otherwise would have occurred which in turn moderates the extent of the price increase. Thus, the extent of the effect of NSC promotion expenditures on the levels of export sales and prices of all Norwegian whitefish and of the three categories of whitefish promoted by NSC depends critically on three factors: (1) the magnitude of the rightward shift in the export demand for the respective Norwegian whitefish attributable to the programmatic activities of the NSC, (2) the price responsiveness of consumers in countries where NSC promotion of the respective Norwegian whitefish type occurs, and (3) the price responsiveness of the export supplies of the respective Norwegian whitefish types. The magnitudes of the shifts in the export demands for all Norwegian whitefish and for the three categories of whitefish promoted by NSC are determined in this study through econometric analysis. The key metric from the econometric analyses that reflects the magnitude of a shift in export demand is commonly referred to as the expenditure elasticity of export demand or the promotion elasticity of export demand. The expenditure elasticity is the estimated percentage change in exports from a 1% change in promotion expenditures and is provided by the econometric estimation process. Research has shown that the response of sales to advertising is normally positive and statistically significant but fairly small in magnitude or elasticity. Williams et al. (2016) reviewed the major studies of U.S. agricultural commodity export promotion programs and determined that the mean reported response of U.S. exports to a 1% change in promotion expenditures is 0.256% (i.e., an average promotion elasticity of 0.256). Thus, the overwhelming bulk of empirical evidence supports the notion that export promotion has a positive and statistically significant impact on the demand for U.S. exports. They also concluded, however, that the promotion effect on exports was relatively small in magnitude, especially when compared with other demand factors such as prices and exchange rates. This is not to say that promotion is ineffective. On the contrary, such programs have been shown to have large benefits

Hvor effektivt fremmer Norges Sjømatråd norsk hvitfiskeksport?
33
relative to their costs. However, although promotion boosts export demand, the magnitude of the impact of promotion on export demand normally is less important than that of the main traditional export demand drivers like prices and income. The price responsiveness of consumers is another measure provided by the econometric analysis required for the simulation analysis. The key measure of the price sensitivity of consumers in foreign markets from the econometric analysis is known as the price elasticity of export demand. The price elasticity is the estimated percentage change in foreign consumer purchases (export sales) from a 1% change in the export price. The price elasticity of export demand can differ substantially across different products (like fresh/frozen whitefish compared to clipfish/saltfish or stockfish) reflecting different market circumstances for each product, uses of the products, the number of competing products in the market, and a host of other factors. Price elasticities greater than one indicate that a given percentage change in price (say, 10%) results in a greater percentage change in export sales (say, 20%). In that case, the price elasticity is 2 (calculated as 20% divided by 10%). In this case, consumers would be deemed to be highly responsive to price changes and export demand would be considered to be highly price elastic. On the other hand, if that same 10% change in price results in a 5% change in export demand, then the price elasticity of export demand is calculated to be 0.5 (5% divided by 10%). In this case, consumers would be deemed to be fairly unresponsive to price changes and export demand would be considered to be price inelastic. The importance of the supply response to a price increase generated by promotion was first discussed in a now classic article by Nerlove and Waugh (1961) and demonstrated in the recent evaluation of the NSC seafood promotion program by Capps and Williams (2017). Numerous researchers have concluded that when there are no supply controls, the supply response to promotion can effectively prevent a long-term rise in producer price or even completely offset the effects of promotion programs (for example, Carman and Green, 1993; Kinnucan, Nelson, and Xiao, 1995; Williams, Capps, and Lee, 2014; Capps and Williams, 2017). On the other hand, supply controls can help insure that a supply increase will not erode any price increase, and therefore, profit, resulting from a commodity promotion program. The importance of the response of supply to a promotion-induced price increase is illustrated in Figure 23. Assume, for example, that the promotion of Norwegian whitefish exports shifts out the demand for those exports in a given year from ED (without promotion) to ED (with promotion) as depicted in Figure 23. Given an export supply of Norwegian whitefish of ESe, the export demand shift would tend to raise the export price for Norwegian whitefish from P0 to Pe. In this case, the export supply is so responsive to price changes (i.e., price elastic) that most of the adjustment to a successful promotion program is manifest as an increase in export volume (Q0 to Qe) rather than an increase in export price. Even though the export price increase from the promotion-induced export demand shift is moderated by the vigorous export supply response in this case, export sales revenue increases by a greater percentage than the export price increases over time because the export quantity sold at the somewhat higher export price also increases.

Hvor effektivt fremmer Norges Sjømatråd norsk hvitfiskeksport?
34
Figure 23: Export Demand Promotion: Market and Producer Profit Effects
Although the total cost of exporting also increases with the higher exports, the increase in export revenue given a demand shift is greater than the export cost increase. As a result, the net effect on producer profits is positive, represented by the small blue-lined area in Figure 23. Thus, while it could appear to individual stakeholders that the export promotion program was not highly successful because the export price did not increase much or as much as expected over time, in fact the program is quite successful in boosting stakeholder revenues and even profits. A much less price-responsive export supply (such as ESi in Figure 23), however, would result in a greater export price increase (P0 to Pi) relative to the increase in export sales (Q0 to Qi) as a result of the same export demand increase (ED without promotion to ED with promotion) and, thus, a larger positive effect on the profit from whitefish exports (represented by the light red area in Figure 23). Thus, the extent of the increase in the profitability of a promotion-induced increase in export demand depends on the responsiveness of export supply to changes in the export price over time (i.e., the long-run price elasticity of Norwegian whitefish export supply). The stronger the competition from competing foreign suppliers of whitefish, the more likely the long-run Norwegian whitefish export supply curve will look like ESe (price elastic) rather than
P0
Pi
Pe
Q0 QeQi
price
quantity
ESi
ES*
ESe
P*
Q*
ED withpromotion
ED withoutpromotion

Hvor effektivt fremmer Norges Sjømatråd norsk hvitfiskeksport?
35
ESi (price inelastic) in Figure 23. The more controlled or restricted whitefish exports are, however, the more the whitefish export supply curve will look like ESi. A few studies have estimated or assumed some level of the price responsiveness of Norwegian seafood supplies in their analyses. As indicated in the literature review, the estimated price elasticity of whitefish supply across a number of studies ranges from close to zero to about 1.0. Studies that have estimated or assumed a price elasticity of Norwegian salmon supply provide broad support for those whitefish supply elasticity estimates. Capps and Williams (2017) reported that the salmon supply elasticities estimated or assumed by a number of studies ranged from close to zero to 2.0. Consequently, a reasonable and conservative range of estimates for the price elasticity of the export supply of Norwegian whitefish and of the main whitefish categories would be zero to 2.0 representing a range of absolutely no price responsiveness to quite high price responsiveness of the Norwegian export supply of all whitefish and of the three main categories of whitefish promoted by NSC. Consequently, using the estimated price and promotion elasticities from the econometric analysis, we simulate five different levels of the whitefish price and export quantity effects of whitefish promotion assuming a range of five different export supply elasticities: (1) 0, (2) 0.5, (3) 1.0, (4) 1.5, and (5) 2.0. This range of export supply elasticities provides an appropriately broad, conservative range of the likely impacts of NSC export promotion programs on the export volumes, prices, revenues, and profits of all Norwegian whitefish as well as of Norwegian fresh and frozen whitefish, clipfish and saltfish, and stockfish. Given the lower reported range of export supply elasticities for whitefish than for salmon discussed in the literature review, the whitefish export supply curve (even in the long run) certainly resembles the inelastic export supply curve (ESi) in Figure 23 more than that of the elastic export supply curve (ESe). Thus, the lower end of the range of the five whitefish export elasticities used in the simulation analysis seems most plausible particularly if the Norwegian captured whitefish supply can be assumed to have been limited by production controls in most years over the study period. Some low level of long-run price responsiveness of the Norwegian whitefish export supply over the 2003 to 2017 period, however, seems reasonable for various reasons. First, the whitefish catch has been under the total allowable catch (TAC) in some years (HAVFISK, 2015). During such periods, price likely plays at least some role in the corresponding supply changes. The demand enhancing efforts of NSC during those periods help push production towards the TAC limits by enhancing demand and, thus, price. Second, the export supply of whitefish (which is the focus of this study) is not precisely the same thing as the domestic production of whitefish. Export supply curves are normally more elastic than domestic supply curves because they are the difference between the domestic supply and demand curves. According to FAO data (2018c), Norway exports about 75% of the domestic catch of demersal fish. NSC estimates that Norway exports about 90% of its seafood supply (NSC, 2018a). Given that there is a robust domestic Norwegian market of some size, the export supply can increase to some small extent at least as the export price increases by drawing down the supply available to the domestic market. This is a

Hvor effektivt fremmer Norges Sjømatråd norsk hvitfiskeksport?
36
well-known feature of the interrelationship between domestic and international commodity markets9. Third, the level at which the quota is set may be somewhat responsive to price trends over time. For example, after a period of increasing cod quotas and declining prices from 2009 through 2013, the quotas were then reduced several years in a row with dramatic price supporting effects. Between 2013 and 2016, the export price of Norwegian frozen whole cod jumped by over 80% (Statista, 2018). Then for 2017, with continuing high cod prices, Norway and Russia agreed on a total cod TAC of 890,000 tonnes, more than 11% above the International Council for the Exploration of the Seas (ICES) recommendation of 805,000 tonnes, leaving the TAC total little changed from the previous year. Then for 2018 when the ICES recommended a 20% cut in the cod TAC, Norway and Russia agreed on only a 13% cut to 775,000 tonnes. The higher negotiated levels of the TAC over the ICES recommendations in each year may reflect, at least to some small degree, the higher prices for cod in export markets. Consequently, an export supply elasticity of 0.5 more appropriately represents the long-run relationship between the Norwegian whitefish export supply and price over the 2003 to 2017 period of analysis than an elasticity of absolute zero. For that reason, the simulation results corresponding to the export supply elasticity of 0.5 are highlighted in the discussion and in corresponding tables as the most plausible estimated impacts of the NSC whitefish promotion program. Two sets of simulation scenarios are analyzed for each of the five assumed export supply elasticities for all whitefish and for each of the three whitefish categories promoted by NSC: (1) a with NSC export promotion expenditures scenario (referred to as the “with scenario”) and (2) a without NSC export promotion expenditures scenario (referred to as the “without scenario”). Thus, a total of eight simulations are conducted, including four with and four without promotion expenditure scenarios for whitefish in total and for each of the three main whitefish categories promoted by NSC (fresh/frozen whitefish, clipfish/saltfish, and stockfish) for each of the five assumed export supply elasticities. The with scenarios represent actual history, that is, the levels of Norwegian export volume, value, and price of all whitefish and of each of the three main whitefish categories promoted by NSC (fresh/frozen whitefish, clipfish/salted, and stockfish) which include any effects from their respective NSC export promotion expenditures. The without scenario analyses are conducted by setting the historic values of Norwegian promotion expenditures for whitefish and for the three main whitefish categories to zero in their respective econometric models and then simulating the volumes, values, and prices of each under the five alternative export supply elasticity assumptions. The result is a reasonable range of the volumes, values, and prices of those whitefish exports that would have existed if the NSC had not promoted whitefish. Because the changes in the export volumes, values, and prices of all whitefish and of the three main whitefish categories in these alternative without scenarios are generated by changing only the levels of the respective promotion expenditures under different export supply elasticity assumptions, the resulting calculated levels for those variables represent those that would have existed over time if
9 See Williams, Capps, and Lee (2014) for a discussion of this issue for the U.S. soybean industry.

Hvor effektivt fremmer Norges Sjømatråd norsk hvitfiskeksport?
37
there had been no NSC export promotion programs for all whitefish or for fresh/frozen whitefish, clipfish/saltfish, or stockfish, respectively. Differences in the simulated levels of Norwegian export volumes, values, and prices of all whitefish and of the three whitefish subcategories promoted by NSC in the with scenarios from those in the alternative without scenarios (using the five alternative export supply elasticities) are taken as direct measures of the effects of the respective NSC promotion program. Because no exogenous variables in the model (e.g., levels of inflation, exchange rates, income levels, etc.) other than the respective NSC promotion expenditures are allowed to change in either scenario for whitefish or for the three main whitefish categories, this process effectively isolates the effects of the respective NSC promotion expenditures on their export volumes, values, and prices.
The simulation results for each whitefish type under the five different export supply elasticity assumptions are used to conduct a benefit–cost analysis of NSC promotion of whitefish exports. In evaluations of export promotion programs, one common measurement of the “benefit” of those programs used in benefit-cost analyses is the additional export revenue generated over time. Another measurement of the “benefit” of export promotion relies on standard economic welfare analysis (consumer and producer surplus concepts) in which the calculated net changes to national economic welfare as a result of the promotion program over time are considered to be the “benefits” of the promotion program. The cost of the program is the total amount of funds invested in the promotion program. Figure 24 illustrates the generally expected export revenue “benefits” of export promotion applied to Norwegian whitefish exports. As discussed earlier, the objective of export demand promotion is to shift out the export demand curve, shown in Figure 24 in the case of Norwegian whitefish as a shift from ED (without promotion) to ED (with promotion). Given the elasticity of the export supply curve (ES*), the expected result is an increase in the Norwegian whitefish export price from P0 to P* on a higher volume of Norwegian whitefish export sales over time from Q0 to Q* in Figure 24. The result is an increase in Norwegian whitefish export revenue represented in Figure 24 as the sum of the dark and light green areas in the right-hand panel of that figure. The sum of the dark and light brown areas in right-hand panel of Figure 24 represents the export revenue before promotion is conducted. A reasonable range for the increase (the sum of dark and light green areas in right-hand panel in Figure 24) in Norwegian whitefish export revenue generated by the NSC export promotion program is calculated using the five alternative export supply elasticities discussed earlier. The simulated additions to Norwegian whitefish export revenue induced by the NSC whitefish export promotion program over time, under each of the assumed export supply elasticities, are used as the export revenue “benefits” of the program for the benefit-cost analysis. Two key export revenue BCRs are computed for each of the export supply elasticities assumed. The Gross Revenue BCR (GRBCR) is calculated as the additional export revenue generated over the period conducted

Hvor effektivt fremmer Norges Sjømatråd norsk hvitfiskeksport?
38
Figure 24: Export Revenue and Economic Surplus Effect of Norwegian Whitefish Export Promotion
SD ES*
ED withoutpromotion
P0
Q0 Q*
P*
ED withpromotion
of promotion (R) per NOK of promotion expenditures (E) over that period: (1) GRBCR = where t represents a given year and T represents the last year of the promotion period. Because the promotion represents a cost of generating the additional export revenue, the promotion expenditures in each year must be netted out of the additional export revenue generated in each corresponding year (Rt) to arrive at the net export revenue BCR: (2) NRBCR = . A shortcoming of export revenue BCR measures is that they account for the additional export revenue associated with additional exports but do not subtract out the additional costs required to generate the additional exports. Such costs include the additional production costs (crew, fuel, gear, maintenance, etc.), transport costs, freight, and insurance costs, and so on. To account for those costs, we can calculate a measure referred to as the export “economic surplus”. This measure is the difference between the amount that exporters receive for their exports and the minimum amount they would be willing to accept to just cover their costs. In Figure 24, the
T
t=1
Rt - Et
Et
T
t=1
Rt
Et

Hvor effektivt fremmer Norges Sjømatråd norsk hvitfiskeksport?
39
Norwegian whitefish export supply curve (ES*) indicates the prices that exporters would be willing to accept for each additional unit of whitefish export sales to just cover costs. Thus, the area under the export supply curve (ES*) at Q0 where the export demand curve (ED without promotion) crosses ES*, which is the light brown area in Figure 24, is a measure of the minimum total amount exporters would be willing to accept for the Q0 level of exports demanded in the market. Of course, however, producers do not sell each additional quantity of whitefish exports at the price that would just cover their costs. Rather, they sell all units of whitefish exports at the export market price of P0. Thus, their export revenue for selling Q0 units of whitefish exports is the sum of the dark and light brown areas. The dark brown area then is the “surplus” of export revenue over and above the costs of exporting that export volume. Although not precisely the same thing, “export surplus” can be thought of as a measure of Norwegian exporters’ profit from exporting whitefish. The concept of the export surplus as “profit” is particularly applicable to the Norwegian whitefish industry because Norwegian fishers have individual fishery quotas (IFQs). Thus, a higher price for their quota just increases their profit10.
When export promotion shifts the whitefish export demand out to ED (with promotion) in Figure 24, whitefish export revenue increases by the amount represented by the sum of the dark and light green areas in the right-hand panel in Figure 24 but the light green represents the additional costs of that additional level of whitefish exports. Thus, the dark green area on the right side of Figure 24 represents the additional “surplus” (or profit) to whitefish exporters for the additional exports up to the new level of Norwegian whitefish exports (Q*). That area is equal to the difference between what economists call the additional “producers surplus” and the additional “consumer surplus” in the domestic market (the dark green area in the left-hand panel of Figure 24). Because the ES* curve is just the horizontal difference between the Norwegian domestic whitefish supply curve (S) and the Norwegian domestic whitefish demand curve (D) in the left-hand panel of Figure 24, the dark green area in that panel is equal to the dark green area in the right-hand panel of that figure. Thus, the “surplus” (or profit) to Norwegian whitefish exporters is a measure of the net change in their economic welfare as a result of exporting whitefish. Because Figure 24 represents the Norwegian whitefish export sector, the dark green area (in both panels) represents the net additional economic welfare to the Norwegian whitefish industry and to the overall Norwegian economy resulting from NSC whitefish export promotion. The export surplus (profit) or net additional welfare from export promotion is calculated through the same simulation scenario process used to calculate the additional export revenue from export promotion over time described above. In the process, however, the additional export surplus or profit portion of the additional export revenue is calculated using simple formulas. Then the additional export surplus (call it “P”) is used as the measure of the “benefit” or additional profit from NSC whitefish export promotion in place of export revenue (R) in equations (1) and (2) to calculate a Gross Export Surplus or “Profit” BCR (GPBCR) and a Net Export Surplus or “Profit” BCR (NPBCR), respectively, for Norwegian whitefish export promotion.
10 Our thanks to Sigbjørn Tvetarås for this observation.

Hvor effektivt fremmer Norges Sjømatråd norsk hvitfiskeksport?
40
ANALYSIS OF NORWEGIAN WHITEFISH EXPORT PROMOTION Recall that the two key questions that are the specific focus of this examination of the effectiveness of the NSC whitefish export promotion programs are: (1) What have been their effects on Norwegian whitefish exports (in total and across the three main categories promoted by NSC) and on the profitability of the Norwegian whitefish industry? (2) Have Norwegian whitefish industry stakeholders (producers, exporters, and others) benefitted from their investment in the export promotion of all whitefish as a group or of any of the three main categories of whitefish promoted by NSC? To answer these questions, the results of the econometric analyses of the NSC whitefish promotion programs based on the procedures outlined in the preceding methodology section are first presented in this section of the report. Then the results of the simulation analyses of the effects of NSC promotion programs on Norwegian exports of all whitefish and of the three whitefish categories promoted by NSC are presented. Finally, the results of the benefit-cost analysis of the NSC whitefish export promotion programs based on the simulation results are then presented.
Econometric Analysis of NSC Whitefish Export Promotion Programs Four econometric models were developed for this study representing all whitefish, fresh and frozen whitefish, clipfish and saltfish, and stockfish. The models were estimated in double log form. Thus, the estimated coefficients of each of the four models are elasticities, including the own-price elasticities of export demand, income elasticities, cross price elasticities, elasticities of adjustment, and the promotion elasticities. By design, these elasticities are constant over the period of the analysis (January 2003 to December 2017). The parameters of the models initially were estimated using ordinary least squares. Despite the relatively large number of control or explanatory variables, to avoid the inadvertent omission of any other quantitative or qualitative factors, the residuals associated with each of the four estimated econometric models were examined to determine if systematic patterns exist in those residuals by testing the models for the presence of serial correlation or autocorrelation. The tests concluded that serial correlation, a non-random pattern in the residuals, was present only in the econometric model associated with clipfish/saltfish. Consequently, the use of generalized least squares in lieu of ordinary least squares was necessary to estimate the clipfish/saltfish model parameters. For clipfish/saltfish, the analysis determined that the pattern in the residuals was attributable to moving average processes of orders 7 and 19, denoted as MA(7) and MA(19) in the econometric model for clipfish/saltfish. These moving average patterns of the error terms likely are associated with production cycles, government policies and other unspecified forces that affect the demand for exports of Norwegian clipfish/saltfish. For the remaining econometric models associated with all whitefish, fresh and frozen whitefish, and stockfish, however, no serial correlation was evident. The estimated coefficients, the standard errors, t-statistics, p-values and other pertinent information associated with the econometric models are exhibited in Tables 3-6. As previously discussed, model selection criteria (AIC, SIC, and HQC) are used to determine the most appropriate model specification.

Hvor effektivt fremmer Norges Sjømatråd norsk hvitfiskeksport?
41
Econometric Analysis for All Norwegian Whitefish Export Demand
The econometric model for exports of all Norwegian whitefish explains slightly more than 83% (adjusted R2) of the variation in export demand over the period of analysis (Table 3). Importantly, the signs and magnitudes of all the estimated coefficients are consistent with prior expectations. As well, the within-sample mean absolute percent error (MAPE) over the sample period is 6.29%. In other words, the absolute percent error between the actual values and the predicted values of the volume of exports of all Norwegian whitefish is slightly more than six percent on average. Simply put, the econometric analysis provides an excellent fit of the movements in all Norwegian whitefish export demand over the study period (January 2003 to December 2017). The relatively high goodness-of-fit and the relatively low MAPE characteristics of the model indicate a high degree of reliability of the econometric analysis. The econometric results indicate that Norwegian exports of all whitefish are inversely related to the export price of Norwegian whitefish relative to the price of competing aquaculture exports. The estimated whitefish export price elasticity is -0.307 indicating that an increase in the export price of Norwegian whitefish or a decrease in the price of aquaculture exports tends to reduce the export demand for Norwegian whitefish (Table 3). Thus, a 10% change in the relative, exchange-rate-adjusted price of all Norwegian whitefish exports leads to a 3.07% change in the demand for whitefish exports in the opposite direction. The magnitude of this estimated own-price elasticity suggests that consumers in importing countries are somewhat sensitive to changes in the price of Norwegian whitefish. Further, the export price of Norwegian salmon relative to that of aquaculture exports was found to be a determinant of the export demand for all Norwegian whitefish. The relative export price of Norwegian salmon and Norwegian whitefish export demand are positively related indicating that consumers in importing countries consider Norwegian salmon and Norwegian whitefish to be substitutes. This result is consistent with the findings of Singh et al. (2012 and 2014) and Fousekis and Revell (2004). The estimated cross-price elasticity was low, however, at 0.112 (price inelastic) so that a 10% change in the exchange-rate-adjusted export price of Norwegian salmon relative to the price of aquaculture exports leads to only a 1.12% change in the demand for whitefish exports in the same direction. The empirical results also indicate that Norwegian whitefish exports are directly related to real income changes in importing countries. The estimated elasticity of all whitefish export demand with respect to the inflation- and exchange-rate-adjusted GDP of the major importing countries is 0.249. Thus, a 10% change in the real, exchange-rate-adjusted GDP of importing countries results in a 2.49% change in Norwegian whitefish exports in the same direction. Seasonality also plays a role in the demand for Norwegian whitefish exports, holding all other explanatory factors invariant, as indicated in Table 3. To account for seasonality, we employ indicator
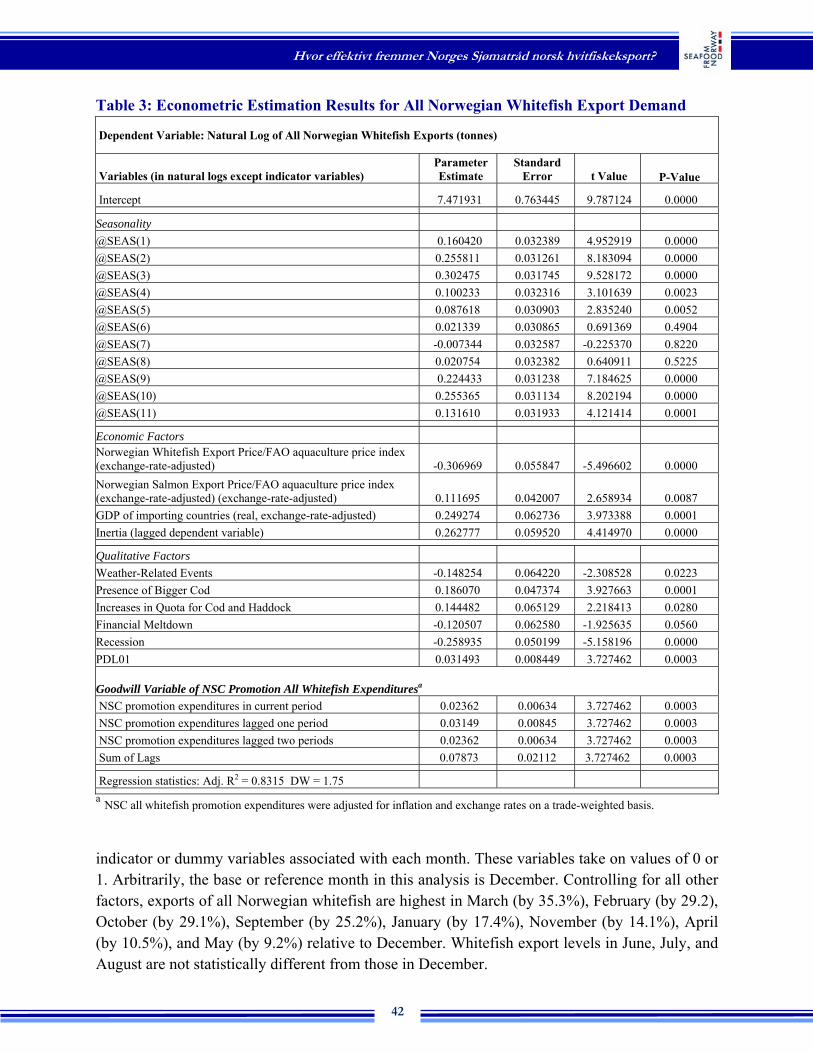
Hvor effektivt fremmer Norges Sjømatråd norsk hvitfiskeksport?
42
Table 3: Econometric Estimation Results for All Norwegian Whitefish Export Demand
Dependent Variable: Natural Log of All Norwegian Whitefish Exports (tonnes)
Variables (in natural logs except indicator variables)Parameter Estimate
Standard Error t Value P-Value
Intercept 7.471931 0.763445 9.787124 0.0000
Seasonality
@SEAS(1) 0.160420 0.032389 4.952919 0.0000
@SEAS(2) 0.255811 0.031261 8.183094 0.0000
@SEAS(3) 0.302475 0.031745 9.528172 0.0000
@SEAS(4) 0.100233 0.032316 3.101639 0.0023
@SEAS(5) 0.087618 0.030903 2.835240 0.0052
@SEAS(6) 0.021339 0.030865 0.691369 0.4904
@SEAS(7) -0.007344 0.032587 -0.225370 0.8220
@SEAS(8) 0.020754 0.032382 0.640911 0.5225
@SEAS(9) 0.224433 0.031238 7.184625 0.0000
@SEAS(10) 0.255365 0.031134 8.202194 0.0000
@SEAS(11) 0.131610 0.031933 4.121414 0.0001
Economic Factors Norwegian Whitefish Export Price/FAO aquaculture price index (exchange-rate-adjusted) -0.306969 0.055847 -5.496602 0.0000
Norwegian Salmon Export Price/FAO aquaculture price index (exchange-rate-adjusted) (exchange-rate-adjusted) 0.111695 0.042007 2.658934 0.0087
GDP of importing countries (real, exchange-rate-adjusted) 0.249274 0.062736 3.973388 0.0001
Inertia (lagged dependent variable) 0.262777 0.059520 4.414970 0.0000
Qualitative Factors
Weather-Related Events -0.148254 0.064220 -2.308528 0.0223
Presence of Bigger Cod 0.186070 0.047374 3.927663 0.0001
Increases in Quota for Cod and Haddock 0.144482 0.065129 2.218413 0.0280
Financial Meltdown -0.120507 0.062580 -1.925635 0.0560
Recession -0.258935 0.050199 -5.158196 0.0000
PDL01 0.031493 0.008449 3.727462 0.0003
Goodwill Variable of NSC Promotion All Whitefish Expendituresa
NSC promotion expenditures in current period 0.02362 0.00634 3.727462 0.0003
NSC promotion expenditures lagged one period 0.03149 0.00845 3.727462 0.0003
NSC promotion expenditures lagged two periods 0.02362 0.00634 3.727462 0.0003
Sum of Lags 0.07873 0.02112 3.727462 0.0003
Regression statistics: Adj. R2 = 0.8315 DW = 1.75 a NSC all whitefish promotion expenditures were adjusted for inflation and exchange rates on a trade-weighted basis.
indicator or dummy variables associated with each month. These variables take on values of 0 or 1. Arbitrarily, the base or reference month in this analysis is December. Controlling for all other factors, exports of all Norwegian whitefish are highest in March (by 35.3%), February (by 29.2), October (by 29.1%), September (by 25.2%), January (by 17.4%), November (by 14.1%), April (by 10.5%), and May (by 9.2%) relative to December. Whitefish export levels in June, July, and August are not statistically different from those in December.

Hvor effektivt fremmer Norges Sjømatråd norsk hvitfiskeksport?
43
Besides seasonality, the econometric analysis suggests that selected qualitative events were drivers of Norwegian whitefish product exports, namely: (1) weather-related events, particularly in 2006 and 2015; (2) the presence of bigger cod beginning in 2010; (3) increases in quotas for cod (2011 and 2013) and haddock (2009 to 2011 and in 2016); (4) the global financial meltdown in 2007 and 2008; and (5) the recession in 2008 and 2009. The aforementioned weather events reduced export demand for Norwegian whitefish by 13.8% in certain years. The increase in quotas for cod and haddock resulted in a rise in export demand for Norwegian whitefish products by 15.5% in 2009 through 2011, 2013, and 2016. The presence of bigger cod led to increases in export demand for Norwegian whitefish by 20.5% beginning in 2010. The global financial meltdown and recession gave way to decreases in the export demand for Norwegian whitefish on the order of 11.4% in 2007 and 2008 and 22.8% in 2008 and 2009, respectively.
Moreover, statistical evidence was found regarding rigidities or inertia in Norwegian exports of all whitefish. Roughly 74% of the long-run response to changes in the demand for exports of all Norwegian whitefish products was made in one month. In essence, the demand for all Norwegian whitefish exports tends to respond rather quickly to changes in economic and other market forces.
Importantly for this study, the econometric analysis provides evidence that NSC expenditures positively impacted the demand for Norwegian whitefish exports over the study period. In the analysis, we considered polynomial distributed lags of order 2 and order 3 with and without endpoint restrictions for lag lengths of order 1 through 12. As noted previously, we relied on model selection criteria to determine the most appropriate polynomial distributed lag specification. We found that the specification which minimizes the model selection criteria consists of a second degree polynomial with endpoint constraints together with a lag of two months. Thus, the impact of NSC export promotion is not felt all at once but instead is distributed over the current month of expenditure as well as the subsequent two months. Importantly, this finding is consistent with prior expectations based on previous evaluations of export promotion programs.
Specifically, the econometric results indicate a short-run (contemporaneous) elasticity of NSC export promotion of 0.02362 with a long-run (cumulative) elasticity of NSC export promotion of 0.07873. Both results are in accord with those reported for many U.S. export promotion programs (Williams et al., 2016). Hence, contemporaneously, a 10% change in NSC export promotion expenditures results in a 0.24% change in the demand for all Norwegian whitefish exports. Cumulatively, over a period of two months, that same 10% percent change in NSC export promotion expenditures leads to a 0.79% change in the demand for all Norwegian whitefish exports. Based solely on the econometric analysis, ignoring any price effects or supply response by Norwegian producers, had there been no export promotion by the NSC over the period January 2003 to December 2017, the demand for all Norwegian whitefish exports would have been lower by 7.87%. Put another way, again ignoring price effects and supply response for now, export promotion by the NSC increased the demand for exports of all Norwegian whitefish
Hvor effektivt fremmer Norges Sjømatråd norsk hvitfiskeksport?
44
on average by 2,448 tonnes per month over the period of January 2003 to December 2017 compared to what that demand would have been in the absence of such promotion. Econometric Analysis for Norwegian Fresh and Frozen Whitefish Export Demand
The econometric export demand model for fresh and frozen Norwegian whitefish explains close to 80% (adjusted R2) of the variation in that demand over the period of analysis (Table 4). Importantly, the signs and magnitudes of all the estimated coefficients are consistent with prior expectations. As well, the within-sample mean absolute percent error (MAPE) over the sample period is 7.70%. In other words, the absolute percent error between the actual values and the predicted values of the Norwegian fresh and frozen whitefish exports is slightly less than eight percent on average. Simply put, the econometric analysis provides an excellent fit of the movements in the export demand for fresh and frozen Norwegian whitefish over the study period (January 2003 to December 2017). The relatively high goodness-of-fit and the relatively low MAPE characteristics of the model indicate a high degree of reliability of the econometric analysis. The econometric results exhibited in Table 4 indicate that the demand for Norwegian exports of fresh and frozen whitefish is inversely related to its export price relative to the price of aquaculture exports. The estimated export price elasticity is -0.434 so that a 10% change in the exchange-rate-adjusted relative export price of Norwegian of fresh and frozen whitefish leads to a 4.34% change in the export demand for Norwegian fresh and frozen whitefish in the opposite direction. The magnitude of this estimated own-price elasticity suggests that consumers of fresh and frozen whitefish in importing countries are somewhat responsive to relative price changes. Further, the export price of Norwegian salmon was found to be a determinant of the export demand for Norwegian fresh and frozen whitefish. The export price of Norwegian salmon relative to the export price of aquaculture exports and the demand for Norwegian fresh and frozen whitefish exports are positively related. In essence, Norwegian salmon and Norwegian whitefish are considered to be substitutes by consumers in importing countries. This finding is consistent with those of Singh et al. (2012 and 2014) and Fousekis and Revell (2004). The cross-price elasticity was estimated to be 0.201 meaning that a 10% change in the exchange-rate-adjusted, relative export price of Norwegian salmon leads to a 2.01% change in the export demand for fresh and frozen Norwegian whitefish in the same direction.
In contrast, neither the export price of clipfish/saltfish nor the export price of stockfish was found to significantly influence the export demand for Norwegian fresh and frozen whitefish as indicated by the high p-values for the prices of each in the fresh and frozen whitefish export demand model (Table 4). In economic parlance, fresh/frozen whitefish and clipfish/saltfish are independent products and fresh and frozen whitefish and stockfish are independent products.

Hvor effektivt fremmer Norges Sjømatråd norsk hvitfiskeksport?
45
Table 4: Econometric Estimation Results for Norwegian Fresh/Frozen Whitefish Export Demand
Dependent Variable: Natural Log of Norwegian Fresh and Frozen Whitefish Exports (tonnes)
Variables (in natural logs except indicator variables)Parameter Estimate
Standard Error t Value P-Value
Intercept 7.381195 0.787307 9.375245 0.0000
Seasonality
@SEAS(1) 0.156873 0.040633 3.860722 0.0002
@SEAS(2) 0.198191 0.039022 5.078987 0.0000
@SEAS(3) 0.295187 0.040021 7.375851 0.0000
@SEAS(4) 0.117710 0.041796 2.816274 0.0055
@SEAS(5) 0.097622 0.043571 2.240536 0.0265
@SEAS(6) 0.039992 0.042797 0.934462 0.3515
@SEAS(7) 0.040638 0.040461 1.003630 0.3171
@SEAS(8) -0.043143 0.039247 -1.099268 0.2734
@SEAS(9) 0.062710 0.040461 1.549915 0.1232
@SEAS(10) 0.105855 0.039647 2.669930 0.0084
@SEAS(11) 0.117057 0.039622 2.954343 0.0036
Economic Factors
Export Price of Fresh/frozen Whitefish//FAO aquaculture price index (exchange-rate-adjusted) -0.433705 0.108880 -3.983332 0.0001 Norwegian Export Price of Salmon/FAO aquaculture price index (exchange-rate-adjusted) 0.200850 0.053518 3.752918 0.0002 Export Price of Clipfish and Saltfish/FAO aquaculture price index (exchange-rate-adjusted) -0.137075 0.092917 -1.475250 0.1422
Export Price of Stockfish/FAO aquaculture price index (exchange-rate-adjusted) -0.025056 0.038763 -0.646398 0.5190
GDP of importing countries (real, exchange-rate-adjusted) 0.271729 0.089100 3.049720 0.0027
Inertia (lagged dependent variable) 0.266288 0.060520 4.400011 0.0000
PDL01 0.014244 0.008184 1.74047 0.0838
Qualitative Factors
Recession -0.213564 0.063214 -3.378453 0.0009
Presence of Bigger Cod 0.324793 0.065462 4.961528 0.0000
China Filleting 0.303006 0.078245 3.872520 0.0002
Brazil Crisis -0.294511 0.110892 -2.655831 0.0087
Goodwill Variable of NSC Fresh/Frozen Promotion Expendituresa
NSC F/F promotion expenditures in current period 0.01068 0.00614 1.74047 0.0838
NSC F/F promotion expenditures lagged one period 0.01424 0.00818 1.74047 0.0838
NSC F/F promotion expenditures lagged two periods 0.01068 0.00614 1.74047 0.0838
Sum of Lags 0.03561 0.02046 1.74047 0.0838
Regression statistics: Adj. R2 = 0.7995 DW = 1.91 a NSC Fresh/Frozen promotion expenditures were adjusted for inflation and exchange rates on a trade-weighted basis. The empirical results also indicate that Norwegian exports of fresh and frozen whitefish are directly related to income changes in importing countries. The econometric results indicate that the elasticity of fresh and frozen whitefish export demand with respect to the inflation- and exchange-rate-adjusted GDP of the major importing countries is 0.272. Thus, a 10% change in
Hvor effektivt fremmer Norges Sjømatråd norsk hvitfiskeksport?
46
the real, exchange-rate-adjusted GDP of importing countries results in a 2.72% change in Norwegian whitefish export demand in the same direction. Seasonality also plays a role in the export demand for fresh and frozen Norwegian whitefish, holding all other explanatory factors invariant, as indicated in Table 4. As in the previous demand model, we employ indicator or dummy variables associated with each month to account for seasonality. These variables take on values of 0 or 1. Arbitrarily, the base or reference month in this analysis is December. Controlling for all other factors, exports of Norwegian whitefish products are highest in March (by 34.3%), February (by 21.9%), January (by 17.0%), April (by 12.5%), November (by 12.4%), October (by 11.2%), and May (by 10.3%) relative to December. The levels of all fresh and frozen whitefish exports in June, July, August, and September are not statistically different from those in December. Besides seasonality, the econometric analysis suggests that selected qualitative events were drivers of the export demand for Norwegian fresh and frozen whitefish over the study period, namely: (1) the presence of bigger cod beginning in 2010; (2) the recession in 2008 and 2009; (3) the filleting of whitefish by China; and (4) the crisis in Brazil in 2014 through 2016. Thus, the presence of bigger cod led to increases in the export demand for Norwegian fresh and frozen whitefish by 38.4% beginning in 2010. The recession gave way to decreases in the export demand for Norwegian fresh and frozen whitefish on the order of 19.2% in 2008 and 2009. The filleting of whitefish by China led to increases in the export demand for Norwegian fresh and frozen whitefish by 35.4%. The crisis in Brazil reduced the export demand for Norwegian whitefish by 25.5% in 2014 through 2016, all other factors held constant. Moreover, statistical evidence was found regarding rigidities or inertia in the demand for Norwegian exports of fresh and frozen whitefish. Approximately 73% of the long-run response to changes in Norwegian fresh and frozen whitefish export demand was made in one month. In essence, the export demand for Norwegian fresh and frozen whitefish exports responded rather quickly to changes in economic and other market forces. As was the case for all whitefish export demand, the econometric analysis provides evidence that NSC expenditures positively impacted the demand for Norwegian fresh and frozen whitefish exports over the study period. In the analysis, we considered polynomial distributed lags of order 2 and order 3 with and without endpoint restrictions for lag lengths of order 1 through 12. As noted previously, we relied on model selection criteria (AIC, SIC, and HQC) to determine the most appropriate polynomial distributed lag specification. We found that the specification which minimizes the model selection criteria consists of a second degree polynomial with endpoint constraints together with a lag of two months. Thus, the impact of NSC export promotion is not felt all at once but instead is distributed over the current month of expenditure as well as the subsequent two months. As indicated for all whitefish, this finding is consistent with prior expectations based on previous evaluations of export promotion programs.

Hvor effektivt fremmer Norges Sjømatråd norsk hvitfiskeksport?
47
Specifically, the econometric results indicate a short-run (contemporaneous) elasticity of NSC export promotion of 0.01068 with a long-run (cumulative) elasticity of NSC export promotion of 0.03561. As indicated for whitefish export demand, these results are in accord with those reported for many U.S. export promotion programs (Williams et al., 2016). Both results are in accord with checkoff programs in general. Hence, contemporaneously, a 10% change in NSC export promotion expenditures results in a 0.11% change in the demand for Norwegian fresh and frozen whitefish exports. Cumulatively, over a period of two months, that same 10% percent change in NSC export promotion expenditures leads to a 0.36% change in Norwegian fresh and frozen whitefish export demand. Based solely on the econometric analysis, ignoring any price effects or supply response by Norwegian producers, had there been no export promotion by the NSC over the period January 2003 to December 2017, the demand for Norwegian fresh and frozen whitefish exports would have been lower by 3.56%. Put another way, again ignoring price effects and supply response for now, export promotion by the NSC increased the export demand for Norwegian fresh and frozen whitefish by 726 tonnes per month on average over the period January 2003 to December 2017 compared to that demand would have been in the absence of such promotion.
Econometric Analysis for Norwegian Clipfish/Saltfish Export Demand
The econometric model of the export demand for Norwegian clipfish and saltfish explains slightly more than 80% (adjusted R2) of the variation in the clipfish and saltfish export demand over the period of analysis (Table 5). Importantly, the signs and magnitudes of all but one of the estimated coefficients are consistent with prior expectations. As well, the within-sample mean absolute percent error (MAPE) over the sample period is 8.15%. In other words, the absolute percent error between the actual values and the predicted values of the export demand for Norwegian clipfish and saltfish is slightly more than eight percent on average. Simply put, the econometric analysis provides an excellent fit of the movements in the export demand for clipfish and saltfish over the study period (January 2003 to December 2017). The relatively high goodness-of-fit and the relatively low MAPE characteristics of the model indicate a high degree of reliability of the econometric analysis. The econometric results exhibited in Table 5 indicate that the export demand for Norwegian clipfish and saltfish is inversely related to the clipfish/saltfish export price relative to the price of global aquaculture exports. The estimated clipfish/saltfish export price elasticity of -0.168 means that a 10% change in the export price of Norwegian clipfish/saltfish relative to the global aquaculture leads to a 1.68% change in clipfish and saltfish export demand in the opposite direction. The magnitude of this estimated own-price elasticity suggests that clipfish and saltfish consumers in importing countries are quite unresponsive to price changes.
Not surprisingly, the econometric results indicate that fresh and frozen whitefish are not considered to be a substitute for clipfish and saltfish by consumers in importing countries as indicated by the high p-value for the relative export price of fresh and frozen whitefish in the indicated

Hvor effektivt fremmer Norges Sjømatråd norsk hvitfiskeksport?
48
Table 5: Econometric Estimation Results for Norwegian Clipfish/Saltfish Export Demand
Dependent Variable: Natural Log of Norwegian Clipfish/Saltfish Exports (tonnes)
Variables (in natural logs except indicator variables)Parameter Estimate
Standard Error t Value P-Value
Intercept 6.554773 1.364115 4.805146 0.0000
Seasonality
@SEAS(1) 0.246587 0.058582 4.209234 0.0000
@SEAS(2) 0.424948 0.059769 7.109831 0.0000
@SEAS(3) 0.273325 0.057435 4.758871 0.0000
@SEAS(4) 0.013169 0.057783 0.227896 0.8200
@SEAS(5) 0.100107 0.069435 1.441736 0.1514
@SEAS(6) -0.104174 0.056857 -1.828991 0.0693
@SEAS(7) -0.220727 0.071181 -3.100917 0.0023
@SEAS(8) 0.100243 0.065270 1.535803 0.1267
@SEAS(9) 0.360539 0.061320 5.879592 0.0000
@SEAS(10) 0.418839 0.058487 7.161207 0.0000
@SEAS(11) 0.098620 0.059717 1.651464 0.1007
Economic Factors
Norwegian Clipfish and Saltfish Export Price/FAO aquaculture price index (exchange-rate-adjusted) -0.167912 0.081984 -2.048116 0.0423
Norwegian Fresh and Frozen Export price Whitefish/FAO aquaculture price index (exchange-rate-adjusted) 0.052776 0.109553 0.481741 0.6307
Norwegian Stockfish Export Price/FAO aquaculture price index (exchange-rate-adjusted) -0.063378 0.022582 -2.806585 0.0057
GDP of importing countries (real, exchange-rate-adjusted) 0.250200 0.199939 1.251385 0.2127
Inertia (lagged dependent variable) 0.311240 0.063461 4.904390 0.0000
PDL01 0.027167 0.008614 3.153657 0.0019
Qualitative Factors
Increases in Quotas for Cod and Haddock 0.383467 0.101591 3.774609 0.0002
Weather-Related Events -0.473687 0.097166 -4.875052 0.0000
Brazil Crisis -0.587196 0.103768 -5.658753 0.0000
Competition in the Whitefish Market -0.285847 0.058304 -4.902720 0.0000
Nigeria Currency Restrictions -0.514742 0.114442 -4.497825 0.0000
Goodwill Variable of NSC Promotion Expendituresa
NSC promotion expenditures in current period 0.02037 0.00646 3.15366 0.0019
NSC promotion expenditures lagged one period 0.02717 0.00861 3.15366 0.0019
NSC promotion expenditures lagged two periods 0.02037 0.00646 3.15366 0.0019
Sum of Lags 0.06792 0.02154 3.15366 0.0019
Autoregressive Factors
MA(7) -0.467818 0.045041 -10.38644 0.0000
MA(19) -0.480837 0.041686 -11.53463 0.0000
Regression statistics: Adj. R2 = 0.8008 DW = 1.99 a NSC Fresh/Frozen promotion expenditures were adjusted for inflation and exchange rates on a trade-weighted basis.

Hvor effektivt fremmer Norges Sjømatråd norsk hvitfiskeksport?
49
clipfish/saltfish export demand model. In contrast, the negative sign on the statistically significant coefficient of the relative price of stockfish suggests that consumers in clipfish/saltfish importing countries may tend to consider stockfish and clipfish/saltfish as complementary products. The empirical results also indicate that income in importing countries is only marginally significant as a driver of clipfish/saltfish export demand as indicated by the high p-value for the inflation- and exchange-rate-adjusted GDP variable in the clipfish/saltfish export demand equation (Table 5). In other words, Norwegian clipfish and saltfish export demand is largely independent of income changes in importing countries. Consumers in those countries tend to purchase clipfish and saltfish regardless of how their incomes change. However, seasonality plays a role in the export demand for clipfish and saltfish, holding all other explanatory factors invariant, as indicated in Table 5. As in the previous models, we employ indicator or dummy variables associated with each month to account for seasonality. These variables take on values of 0 or 1. Arbitrarily, the base or reference month in this analysis is also December. Controlling for all other factors, exports of Norwegian clipfish/saltfish are highest in February (by 53.0%), October (by 52.0%), September (by 43.4%), March (by 31.4%), and January (by 28.0%) relative to December. On the other hand, exports of Norwegian clipfish/saltfish are lower in July relative to December by 19.8%. The demand for clipfish/saltfish exports in April, May, June, August, and November are not statistically different from that in December. Besides seasonality, the econometric analysis suggests that selected qualitative events were drivers of Norwegian clipfish/saltfish export demand over the period of analysis, namely: (1) increases in quotas for cod (2011 and 2013) and haddock (2009 through 2011 and 2016); (2) weather-related events; (3) the crisis in Brazil in 2014 to 2016; (4) increased competition in the whitefish market; and (5) the Nigerian currency exchange restrictions in 2015 and 2016. The increases in quotas of cod and haddock resulted in a rise in the demand for Norwegian exports of clipfish/saltfish by 46.7% in 2009 to 2011, 2013, and 2016. Weather-related events led to decreases in Norwegian clipfish/saltfish export demand by 37.7% in certain years. The crisis in Brazil reduced Norwegian clipfish/saltfish export demand by 44.4% in 2014 through 2016. An increase in competition in the whitefish market gave way to decreases in the demand for Norwegian exports of clipfish/saltfish by 24.9% in certain years. The Nigerian currency restrictions led to reductions in the demand for Norwegian exports of clipfish/saltfish on the order of 40.2% during 2015 and 2016. Moreover, statistical evidence was found that there are some rigidities or inertia in Norwegian exports of clipfish/saltfish. Approximately 69% of the long-run response of clipfish/saltfish export demand to changes in clipfish/saltfish market forces was made in one month. In essence, the export demand for Norwegian clipfish/saltfish responded rather quickly to changes in economic and other market forces.

Hvor effektivt fremmer Norges Sjømatråd norsk hvitfiskeksport?
50
Importantly for this study, the econometric analysis provides evidence that NSC expenditures have positively impacted the demand for Norwegian clipfish/saltfish exports over the study period. In the analysis, we considered polynomial distributed lags of order 2 and order 3 with and without endpoint restrictions for lag lengths of order 1 through 12. As with the other whitefish models, we relied on model selection criteria (AIC, SIC, and HQC) to determine the most appropriate polynomial distributed lag specification. We found that the specification which minimizes the model selection criteria consists of a second degree polynomial with endpoint constraints together with a lag of two months. Thus, the impact of NSC export promotion is not felt all at once but instead is distributed over the current month of expenditure as well as the subsequent two months. As indicated for all whitefish and fresh and frozen whitefish, this finding is consistent with prior expectations based on previous evaluations of export promotion programs.
Specifically, the econometric results indicate a short-run (contemporaneous) elasticity of NSC export promotion of 0.02037 with a long-run (cumulative) elasticity of NSC export promotion of 0.06792. These results are in accord with those reported for many U.S. export promotion programs (Williams et al., 2016). Hence, a 10% change in NSC export promotion expenditures results in a 0.20% change in the demand for Norwegian clipfish/saltfish exports in the month of expenditure. Over a period of two months, however, that same 10% percent change in NSC export promotion expenditures leads to a cumulative of 0.68% change in the export demand for Norwegian clipfish/saltfish. Based solely on the econometric analysis, ignoring any price effects or supply response by Norwegian producers, had there been no export promotion by the NSC over the period of January 2003 to December 2017, the demand for Norwegian clipfish/saltfish exports would have been lower by 6.79%. Put another way, again ignoring price effects and supply response for now, export promotion by the NSC increased the export demand for clipfish/saltfish on average by 664 tonnes per month at fixed prices over the period of January 2003 to December 2017 compared to what that demand would have been in the absence of such promotion.
Econometric Analysis for Norwegian Stockfish Export Demand
The econometric export demand model for Norwegian stockfish explains slightly more than 88% (adjusted R2) of the variation in that demand over the period of analysis (Table 6). Importantly, the signs and magnitudes of all the statistically significant estimated coefficients are consistent with prior expectations. As well, the within-sample mean absolute percent error (MAPE) over the sample period is 13.88%. The absolute percent error between the actual values and the predicted values of Norwegian stockfish exports is close to fourteen percent on average. Simply put, the econometric analysis provides an excellent fit of the movements in the export demand for clipfish/saltfish over the study period (January 2003 to December 2017). The relatively high goodness-of-fit and the relatively low MAPE characteristics of the model indicate a high degree of reliability of the econometric analysis.

Hvor effektivt fremmer Norges Sjømatråd norsk hvitfiskeksport?
51
Table 6: Econometric Estimation Results for Norwegian Stockfish Export Demand
Dependent Variable: Natural Log of Norwegian Stockfish Exports (tonnes)
Variables (in natural logs except indicator variables)Parameter Estimate
Standard Error t Value P-Value
Intercept 5.708696 0.916627 6.227935 0.0000
Seasonality
@SEAS(1) 0.069510 0.069025 1.007016 0.3155
@SEAS(2) 0.067125 0.070945 0.946157 0.3456
@SEAS(3) -0.200512 0.072478 -2.766535 0.0064
@SEAS(4) -0.679167 0.081185 -8.365717 0.0000
@SEAS(5) -0.600009 0.091548 -6.554070 0.0000
@SEAS(6) -0.213537 0.89405 -2.388434 0.0181
@SEAS(7) 0.016849 0.074608 0.225830 0.8216
@SEAS(8) 0.155230 0.068411 2.269065 0.0247
@SEAS(9) 0.636290 0.070441 9.032920 0.0000
@SEAS(10) 0.569833 0.071501 7.969541 0.0000
@SEAS(11) 0.279445 0.071128 3.928755 0.0001
Economic Factors Norwegian Stockfish Export Price/FAO aquaculture price index (exchange-rate-adjusted) -0.677005 0.060848 -11.12624 0.0000 Norwegian Fresh/Frozen Whitefish Export Price/FAO aquaculture price index (exchange-rate-adjusted) -0.190697 0.185744 -1.026663 0.3062 Norwegian Clipfish and Saltfish Export Price/FAO aquaculture price index (exchange-rate-adjusted) 0.385563 0.174040 2.215377 0.0282
GDP of importing countries (real, exchange-rate-adjusted) 0.317914 0.170368 1.866041 0.0639
Inertia (lagged dependent variable) 0.208973 0.054477 3.835983 0.0002
PDL01 0.015237 0.007925 1.922611 0.0564
Qualitative Factors
Increases in Quotas for Cod and Haddock 0.740465 0.195045 3.796389 0.0002
Weather-Related Events -0.542500 0.192620 -2.816420 0.0055
Presence of Bigger Cod 0.553526 0.093894 5.895248 0.0000
Competition in the Whitefish Market -0.590048 0.109751 -5.376223 0.0000
Nigeria Currency Restrictions -0.095476 0.049781 -1.917913 0.0570
Goodwill Variable of NSC Promotion Expendituresa
NSC promotion expenditures in current period 0.01270 0.00660 1.92261 0.0564
NSC promotion expenditures lagged one period 0.02032 0.01057 1.92261 0.0564
NSC promotion expenditures lagged two periods 0.02286 0.01189 1.92261 0.0564
NSC promotion expenditures lagged three periods 0.02032 0.01057 1.92261 0.0564
NSC promotion expenditures lagged four periods 0.01270 0.00660 1.92261 0.0564
Sum of Lags 0.08888 0.04623 1.92261 0.0564
Regression statistics: Adj. R2 = 0.8847 DW = 2.04 a NSC Fresh/Frozen promotion expenditures were adjusted for inflation and exchange rates on a trade-weighted basis. The econometric results (Table 6) indicate that Norwegian stockfish export demand is inversely related to its relative export price with an export price elasticity of -0.677. That is, a 10% change in the export price of Norwegian stockfish relative to the global aquaculture export price leads to a 6.77% change in the demand for stockfish exports in the opposite direction. The
Hvor effektivt fremmer Norges Sjømatråd norsk hvitfiskeksport?
52
magnitude of this estimated own-price elasticity suggests that importers of this type of whitefish are somewhat sensitive to changes in prices. The empirical results also indicate that exports of Norwegian whitefish of this type are directly related to income changes in importing countries at a 10% significance level. The estimated elasticity of whitefish exports with respect to the inflation- and exchange-rate-adjusted GDP of the major importing countries is 0.318. Thus, a 10% change in the real, exchange-rate-adjusted GDP of importing countries results in a 3.18% change in Norwegian whitefish exports in the same direction. The results also indicate that the export price of fresh and frozen whitefish was not a statistically significant driver of the export demand for Norwegian stockfish. The implication is that, not surprisingly, consumers in importing countries do not consider fresh and frozen whitefish to be a substitute for stockfish. In economic parlance, they are independent products. The relative export price of Norwegian clipfish/saltfish, however, is positively related to and a statistically significant driver of the export demand for Norwegian stockfish suggesting the possibility that clipfish and saltfish may be substitute products for stockfish to some extent in some markets. Seasonality also plays a role in the export demand for Norwegian stockfish, holding all other explanatory factors invariant, as indicated in Table 6. Again, we employ indicator or dummy variables associated with each month to account for seasonality. The base or reference month in the analysis is also December again. Controlling for all other factors, the export demand for Norwegian stockfish is highest in September (by 89.0%), October (by 76.8%), November (by 32.2%), and August (by 16.8%) relative to December. On the other hand, the export demand for Norwegian stockfish is lowest in April (by 49.3%), May (by 45.1%), June (by 19.2%), and March (by 18.2%) relative to December. The demand for stockfish exports in January, February, and July is not statistically different from that in December. Besides seasonality, the econometric analysis suggests that selected qualitative events were drivers of the export demand for Norwegian stockfish, namely: (1) weather-related events; (2) increases in quotas for cod (2011 and 2013) and haddock (2009 to 2011 and in 2016); (3) the presence of bigger cod beginning in 2010; (4) increased competition in the whitefish market; and (5) the Nigerian currency exchange restrictions in 2015 and 2016. Thus, weather-related events led to decreases in Norwegian exports of stockfish by 41.8% in various years. The increases in quotas of cod and haddock resulted in a doubling of the export demand for Norwegian stockfish in 2009 to 2011, 2013, and 2016. Increased competition in the whitefish market gave way to decreases in the demand for Norwegian exports of stockfish by 44.6% in various years. The Nigerian currency restrictions led to reductions in the export demand for Norwegian stockfish on the order of 9.1% in 2015 and 2016. The presence of bigger cod resulted in increases in the export demand for Norwegian stockfish by 73.9% beginning in 2010, all other factors held constant. Moreover, the analysis found rigidities or inertia in Norwegian stockfish export demand. Approximately 79% of the long-run response of the export demand for Norwegian stockfish to

Hvor effektivt fremmer Norges Sjømatråd norsk hvitfiskeksport?
53
changes in market conditions was made in one month. In essence, the export demand for Norwegian stockfish tends to respond rather quickly to changes in economic and other world market forces. Consistent with the other whitefish models, econometric analysis of the stockfish export demand model finds evidence of a positive and statistically significant impact of NSC promotion programs over the study period. In the analysis, we considered polynomial distributed lags of order 2 and order 3 with and without endpoint restrictions for lag lengths of order 1 through 12. As with the other whitefish export demand models, we relied on model selection criteria (AIC, SIC, and HQC) to determine the most appropriate polynomial distributed lag specification. We found that the specification which minimizes the model selection criteria consists of a second degree polynomial with endpoint constraints together with a lag of four months. Thus, the impact of NSC export promotion is not felt all at once but instead is distributed over the current month of expenditure as well as the subsequent four months. This optimal lag length differs from the lag length of two months for all whitefish, fresh and frozen whitefish, and clipfish/saltfish. Nevertheless, this finding also is consistent with the findings of prior studies evaluating of export promotion programs. Specifically for stockfish export demand, the econometric results indicate a short-run (contemporaneous) elasticity of NSC export promotion of 0.01270 with a long-run (cumulative) elasticity of NSC export promotion of 0.08888. These results are in accord with those reported for other export promotion programs and indicate that a 10% change in NSC export promotion expenditures results in a 0.13% change in the export demand for Norwegian stockfish in the month of expenditure. Over a period of two months, that same 10% percent change in NSC export promotion expenditures leads to a cumulative change of 0.89% in the export demand for Norwegian stockfish. Based solely on the econometric analysis, ignoring any price effects or supply response by Norwegian producers, had there been no export promotion by the NSC over the period January 2003 to December 2017, the demand for Norwegian stockfish exports would have been lower by 8.89%. Put another way, again ignoring price effects and supply response for now, export promotion by the NSC increased the demand for stockfish exports on average by 71 tonnes per month at fixed prices over the period of January 2003 to December 2017 compared to what that demand would have been in the absence of such promotion. Summary of Key Results from the Econometric Analysis
Econometric analysis allows the measurement of the relationship between the export demand for whitefish types and NSC promotion expenditures by controlling for other factors that may affect the export demand for Norwegian whitefish, thus isolating the specific effect of NSC promotion programs on those exports. The analysis covers the period from January 2003 to December 2017, a total of 180 monthly observations. The modeling process considers the export demand for aggregate Norwegian whitefish as well the export demand for the main categories of Norwegian whitefish (fresh/frozen whitefish, clipfish/saltfish, and stockfish) promoted by NSC to various

Hvor effektivt fremmer Norges Sjømatråd norsk hvitfiskeksport?
54
international markets. Control or explanatory variables considered in the modeling process included real income (GDP) measures for importing countries, exchange rates relative to the NOK for those countries, the weighted average prices of exported whitefish products, the weighted average export price of Norwegian salmon, the price of global aquaculture exports, inertia or habitual persistence, seasonality, and other qualitative variables as appropriate. Four econometric models of Norwegian export demand were developed and estimated: (1) aggregate whitefish; (2) fresh and frozen whitefish; (3) clipfish and saltfish; and (4) stockfish. The result of this process for each export demand model was a measure of the change in each export demand in response to the respective NSC export promotion expenditures, controlling for the effects of all other variables. A summary of key results from the estimation of the four econometric export demand models is provided in Table 7. Export prices of each whitefish type relative to the global price of aquaculture exports were found to be statistically significant drivers of their respective export demands (Table 7). The respective own-price elasticities were -0.307 for all whitefish; -0.434 for fresh and frozen whitefish; -0.168 for clipfish and saltfish; and -0.677 for stockfish. These estimated export demand price elasticities suggest that importers of whitefish are not highly sensitive to changes in relative prices. Further, the empirical results indicate that the export demands for all categories of Norwegian whitefish except clipfish/saltfish are directly related to income changes in importing countries. The statistically significant income elasticities of export demand were estimated to be 0.249 for all whitefish; 0.272 for fresh and frozen whitefish; and 0.318 for stockfish. The estimation of the export demand models also provides evidence that NSC expenditures have had a positive and statistically significant impact on the demand for Norwegian whitefish across all categories over the study period of January 2003 to December 2017. We found that the impact of NSC export promotion is not felt all at once but instead is distributed over the current month of expenditure as well as subsequent months. The optimal lag length is two months for all whitefish, fresh/frozen whitefish, and clipfish/saltfish but four months for stockfish. This finding is consistent with those of previous export demand promotion studies including the recent study of aggregate Norwegian seafood export demand (Capps and Williams, 2017). The cumulative elasticities of NSC export promotion were estimated to be: (1) 0.079 for all whitefish; (2) 0.036 for fresh and frozen whitefish; (3) 0.068 for clipfish/saltfish; and (4) 0.089 for stockfish. In all models, seasonality was evident but quite different across the respective whitefish categories. In addition, inertia or habitual persistence was present in all categories of Norwegian exports of whitefish. Across the board, the Norwegian whitefish export demand responded rather quickly to changes in economic and other market forces over the study period. Evidence was found that Norwegian salmon and whitefish (and specifically fresh and frozen whitefish) are substitutes (but not close substitutes) in importing countries. The possibility that frozen
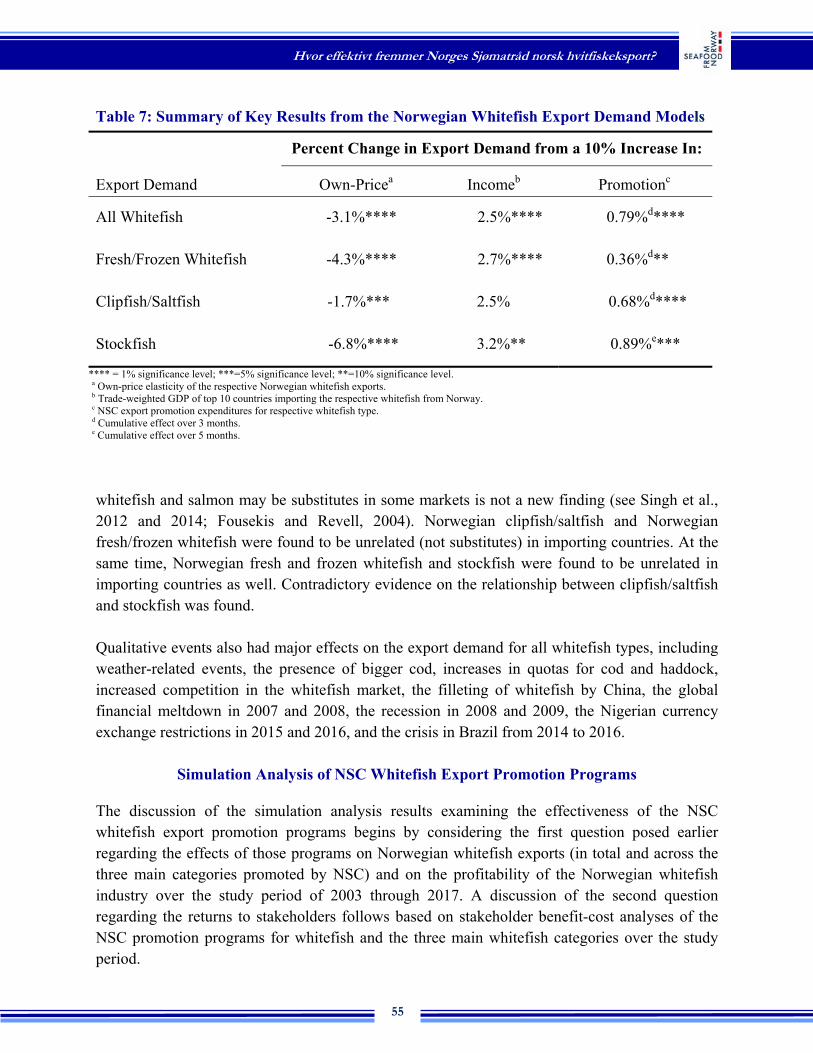
Hvor effektivt fremmer Norges Sjømatråd norsk hvitfiskeksport?
55
whitefish and salmon may be substitutes in some markets is not a new finding (see Singh et al., 2012 and 2014; Fousekis and Revell, 2004). Norwegian clipfish/saltfish and Norwegian fresh/frozen whitefish were found to be unrelated (not substitutes) in importing countries. At the same time, Norwegian fresh and frozen whitefish and stockfish were found to be unrelated in importing countries as well. Contradictory evidence on the relationship between clipfish/saltfish and stockfish was found. Qualitative events also had major effects on the export demand for all whitefish types, including weather-related events, the presence of bigger cod, increases in quotas for cod and haddock, increased competition in the whitefish market, the filleting of whitefish by China, the global financial meltdown in 2007 and 2008, the recession in 2008 and 2009, the Nigerian currency exchange restrictions in 2015 and 2016, and the crisis in Brazil from 2014 to 2016.
Simulation Analysis of NSC Whitefish Export Promotion Programs The discussion of the simulation analysis results examining the effectiveness of the NSC whitefish export promotion programs begins by considering the first question posed earlier regarding the effects of those programs on Norwegian whitefish exports (in total and across the three main categories promoted by NSC) and on the profitability of the Norwegian whitefish industry over the study period of 2003 through 2017. A discussion of the second question regarding the returns to stakeholders follows based on stakeholder benefit-cost analyses of the NSC promotion programs for whitefish and the three main whitefish categories over the study period.
Table 7: Summary of Key Results from the Norwegian Whitefish Export Demand Models
Percent Change in Export Demand from a 10% Increase In:
Export Demand Own-Pricea Incomeb Promotionc
All Whitefish -3.1%**** 2.5%**** 0.79%d****
Fresh/Frozen Whitefish -4.3%**** 2.7%**** 0.36%d**
Clipfish/Saltfish -1.7%*** 2.5% 0.68%d****
Stockfish -6.8%**** 3.2%** 0.89%e***
**** = 1% significance level; ***=5% significance level; **=10% significance level. a Own-price elasticity of the respective Norwegian whitefish exports. b Trade-weighted GDP of top 10 countries importing the respective whitefish from Norway. c NSC export promotion expenditures for respective whitefish type. d Cumulative effect over 3 months. e Cumulative effect over 5 months.

Hvor effektivt fremmer Norges Sjømatråd norsk hvitfiskeksport?
56
As discussed earlier in the methodology section of the report, a comparison of the results of the with and without scenario analyses provide measures of the effects of the Norwegian Seafood Council’s whitefish export promotion program on Norwegian whitefish exports (in total and across the three main categories promoted by NSC) and on the profitability of the Norwegian whitefish industry. The with scenarios for whitefish and each category of whitefish are represented by their respective historical levels of export volume, value, and price as well as the profits from those exports because the actual levels of each achieved over time are due in part to the promotion program. The without scenarios are represented by the values of each that would have existed if a fee had not been levied on the respective category of Norwegian whitefish exports to finance their respective export promotion operations through the Norwegian Seafood Council. The simulated differences in the levels of export volume, price, value, and profit for whitefish and each category of whitefish between the respective with and without scenarios represent the additions to each as a direct result of investment by the Norwegian whitefish industry in the NSC promotion programs. Those differences are often referred to as the “lift” provided by a promotion program over the period of analysis, in this case January 2003 to December 2017. In general, the “lift” achieved by a promotion program is the addition to total sales value or other industry measures as a result of the promotion program, that is, how much higher sales or other industry measures were over time than they would have been if the promotion had not been conducted.
As also discussed in the methodology section, five alternative without scenarios are simulated for all whitefish and for each of the whitefish categories corresponding to a reasonable range of five different export supply elasticities: (1) 0, (2) 0.5, (3) 1.0, (4) 1.5, and (5) 2.0. The simulation results provide a reasonable and reliable yet conservative range of impacts of NSC export promotion programs on Norwegian whitefish export volumes, revenues, prices, and profits. The results corresponding to an export supply elasticity of 0.5 are highlighted in the discussion and corresponding tables as the most plausible estimated impacts of the NSC whitefish promotion program as discussed in the methodology section.
All Whitefish Export Promotion
For all whitefish exports, the results indicate that over the January 2003 through December 2017 period of analysis, the lift from investment by Norwegian stakeholders in all whitefish export promotion through the NSC ranged from 0% to 4.6% for the export volume, 2.3% to 19.7% for the average price, 4.8% to 16.1% for export revenue, and 3.3% to 32.0% for industry profit depending on the export supply elasticity (Table 8). Note that as the export supply elasticity decreases, the estimated lift of the whitefish export volume also decreases while the lift to the average export price, revenue, and profit increases. The most plausible effects of the NSC export promotion program for all Norwegian whitefish (corresponding to a low whitefish export supply elasticity of 0.5) include a nearly 6% lift of the export price, a 7% lift of export revenue, a nearly 10% lift of industry profit, and a marginal export volume lift of 2% or less.

Hvor effektivt fremmer Norges Sjømatråd norsk hvitfiskeksport?
57
Table 8: Additions to Norwegian Whitefish Export Price, Revenue, Profit, and Volume Attributable to NSC Whitefish Export Promotion under Alternative Export Supply Elasticities, 2003–2017a
Alternative Export Supply Elasticities Addition to: 0 0.5 1.0 1.5 2.0
Exports (tonnes) - All Years 0 114,508 212,016 231,902 243,146 - Average Monthly 0 643 1,191 1,303 1,366 - Percent 0 2.1 4.0 4.4 4.6
Export Revenue (NOK million) - All Years 25,237 11,155 8,952 8,035 7,529 - Average monthly 141.8 62.7 50.3 45.1 42.3 - Percent 16.1 7.1 5.7 5.1 4.8
Industry Profit (NOK million) - All Years 25,237 7,584 4,575 3,287 2,568 - Average monthly 141.8 42.6 25.7 18.5 14.4 - Percent 32.0 9.6 5.8 4.2 3.3
Export Price (NOK/kg)
- Average Monthly 4.68 1.55 1.01 0.77 0.64 - Percent 19.7 5.7 3.7 2.8 2.3
a The results considered most plausible are highlighted in the table.
When the whitefish export supply elasticity is zero (absolutely no responsiveness of export supply to price over the 15-year period of the analysis), export promotion generates only a higher price with no export volume response to the promotion. As the addition to the export volume decreases and the addition to the export price increases with lower export supply elasticities, the lift of (additions to) export revenue and industry profit increase due to the estimated price inelasticity of whitefish export demand (elasticity of -0.307 as, discussed in the previous section of the report). Note that as the price responsiveness (elasticity) of the Norwegian export supply of whitefish goes to zero, the promotion lift to whitefish export price and, therefore, to the revenue and profit from whitefish exports increase more than proportionally given the inelasticity of export demand. This result may explain why whitefish export prices and revenues tend to increase dramatically as supplies are constrained by quotas during the year. Fresh and Frozen Whitefish Export Promotion
The results for fresh and frozen whitefish exports differ substantially from those of all whitefish primarily because of the higher estimated price responsiveness (elasticity) of the export demand for fresh and frozen Norwegian whitefish (-0.434 compared to -0.307 for all whitefish) and the lower responsiveness of fresh and frozen promotion to changes in expenditure (promotion elasticity of 0.036 compared to 0.079 for all whitefish) as discussed in the previous section of the report. The results indicate that over the January 2003 through December 2017 period of analysis, the lift from the investment by Norwegian stakeholders in the promotion of fresh and freshest

Hvor effektivt fremmer Norges Sjømatråd norsk hvitfiskeksport?
58
Table 9: Additions to Norwegian Fresh/Frozen Whitefish Export Price, Revenue, Profit, and Volume Attributable to Fresh/Frozen Whitefish NSC Export Promotion under Alternative Export Supply Elasticities, 2003–2017a
Alternative Export Supply Elasticities Addition to: 0 0.5 1.0 1.5 2.0
Exports (tonnes) - All Years 0 48,324 62,942 70,001 74,159 - Average Monthly 0 271 354 393 417 - Percent 0 1.4 1.8 2.0 2.1
Export Revenue (NOK million) - All Years 4,802 3,288 2,843 2,631 2,506 - Average monthly 27.0 18.5 16.0 14.8 14.1 - Percent 5.9 4.0 3.5 3.2 3.1
Industry Profit (NOK million) - All Years 4,802 2,215 1,440 1,066 847 - Average monthly 27.0 12.4 8.1 6.0 4.8 - Percent 11.8 5.4 3.5 2.6 2.1
Export Price (NOK/kg)
- Average Monthly 1.33 0.62 0.40 0.30 0.24 - Percent 6.6 2.8 1.8 1.4 1.1
a The results considered most plausible are highlighted in the table. frozen whitefish through the NSC ranged from 0% to 2.1% for the export volume, 1.1% to 6.6% for the export price, 3.1% to 5.9% for export revenue, and 2.1% to 11.8% for industry profit depending on the export supply elasticity (Table 9). The most plausible effects of the NSC fresh/frozen whitefish export promotion program (corresponding to a low fresh/frozen whitefish export supply elasticity of 0.5) include a 3% lift of the export price, a 4% lift of the export revenue, a 5.4% lift of industry profit, and a marginal 1% lift of export volume. As for all whitefish, the estimated lift of the fresh/frozen export volume decreases as the export supply elasticity of fresh/frozen whitefish decreases while the lift to the average fresh/frozen export price and value and industry profit increases. When the fresh/frozen whitefish export supply elasticity is zero (absolutely no price responsiveness of export supply to price over the 15 year period of the analysis), export promotion generates only a higher fresh/frozen export price with no export volume response to the promotion. Because the demand for fresh/frozen whitefish exports is price inelastic, as is the case for all whitefish exports, the lift of fresh/frozen whitefish export revenue and industry profit from fresh/frozen whitefish exports increase more than proportionally with lower export supply elasticities. The promotion lift of fresh/frozen export revenue, price, and industry profit increase by less than for all whitefish exports as the export supply elasticity declines primarily because fresh/frozen whitefish export demand is less price inelastic than is the case for all whitefish.

Hvor effektivt fremmer Norges Sjømatråd norsk hvitfiskeksport?
59
Clipfish/Saltfish Export Promotion
The results for clipfish/saltfish promotion are more closely related to the pattern of effects for all whitefish than to those of fresh/frozen whitefish owing to the similarity of their promotion effects (long-run promotion elasticities for all whitefish and clipfish/saltfish of 0.079 and 0.068, respectively) and the inelastic nature of their export demands (-0.307 and -0.168 for all whitefish and clipfish/saltfish, respectively) as discussed in the econometric analysis section. For clipfish/saltfish exports, the results indicate that over the January 2003 through December 2017 period of analysis, the lift from investments by Norwegian stakeholders in clipfish and saltfish export promotion through the NSC ranged from 0% to 4.6% for the export volume, 6.6% to 30.0% for export revenue, 2.4% to 44.3% for the average export price, and 4.5% to 60% for industry profit depending on the export supply elasticity (Table 10). The low estimated price responsiveness (low price elasticity) of the clipfish/saltfish export demand is responsible for the wide range in the results over the various assumed export supply elasticities. The most plausible effects of the NSC clipfish/saltfish export promotion program within that range (corresponding to a clipfish/saltfish export supply elasticity of 0.5) include an 8% lift of the export price, an 11% lift of export revenue, a 15% lift of industry profit, and a small export volume lift of up to 4%. Note that as the export supply elasticity decreases, the estimated lift of the clipfish/saltfish export volume also decreases like those of all whitefish and fresh/frozen whitefish while the lift to the average clipfish/saltfish export price increases. Once again, when the clipfish/saltfish export supply elasticity is zero (absolutely no price responsiveness of export supply to price over the 15-year period of analysis), export promotion generates only a higher price with no export volume response to the promotion. As the addition to the export volume decreases and the addition to the export price increases with lower export supply elasticities, the lift of (addition to) export revenue and industry profit increase due to the estimated price inelasticity of clipfish/saltfish export demand. Also, like the previous cases of all whitefish and fresh/frozen whitefish, as the price responsiveness (elasticity) of the Norwegian export supply of clipfish/saltfish goes to zero, the lift of the clipfish/saltfish export price and, therefore, of the revenue and industry profit from clipfish/saltfish exports, increase much more than proportionally due to the low estimated price elasticity of clipfish/saltfish export demand. Again, this result may help explain the sometimes dramatic clipfish/saltfish export price increases as supplies are constrained by the quota during the year. Stockfish Export Promotion
The percentage impacts of promotion on stockfish export volume, price, revenue, and profit are similar to those of all whitefish and clipfish/saltfish given the similarity of their responsiveness to promotion (promotion elasticity of 0.089 compared to 0.079 for all whitefish and 0.068 for clipfish/saltfish). However, because the price responsiveness of stockfish export demand (-0.677)

Hvor effektivt fremmer Norges Sjømatråd norsk hvitfiskeksport?
60
Table 10: Additions to Norwegian Clipfish/Saltfish Export Price, Revenue, Profit, and Volume Attributable to the NSC Export Promotion Program under Alternative Export Supply Elasticities, 2003–2017a
Alternative Export Supply Elasticities Addition to: 0 0.5 1.0 1.5 2.0
Exports (tonnes) - All Years 0 62,369 71,335 74,926 76,861 - Average Monthly 0 350 401 421 432 - Percent 0 3.7 4.3 4.5 4.6
Export Revenue (NOK million) - All Years 19,422 7,029 5,334 4,661 4,300 - Average monthly 109.1 39.5 30.0 26.2 24.2 - Percent 30.0 10.8 8.2 7.2 6.6
Industry Profit (NOK million) - All Years 19,422 4,794 2,734 1,913 1,471 - Average monthly 109.1 26.9 15.4 10.7 8.3 - Percent 59.9 14.8 8.4 5.9 4.5
Export Price (NOK/kg)
- Average Monthly 11.24 2.83 1.62 1.13 0.87 - Percent 44.3 8.2 4.6 3.1 2.4
a The results considered most plausible are highlighted in the table.
Table 11: Additions to Norwegian Stockfish Export Price, Revenue, Profit, and Volume Attributable to NSC Stockfish Export Promotion Program under Alternative Export Supply Elasticities, 2003–2017a
Alternative Export Supply Elasticities Addition to: 0 0.5 1.0 1.5 2.0
Exports (tonnes) - All Years 0 3,816 5,356 6,189 6,711 - Average Monthly 0 22 30 35 42 - Percent 0 2.7 3.9 4.5 4.9
Export Revenue (NOK million) - All Years 1,013 839 776 743 723 - Average monthly 5.8 4.8 4.4 4.2 4.1 - Percent 10.0 8.3 7.6 7.3 7.1
Industry Profit (NOK million) - All Years 1,013 575 401 308 250 - Average monthly 5.8 3.3 2.3 1.7 1.4 - Percent 19.9 11.3 7.9 6.1 4.9
Export Price (NOK/kg)
- Average Monthly 0.76 4.34 3.02 2.31 1.86 - Percent 11.8 6.1 4.2 3.2 2.5
a The results considered most plausible are highlighted in the table.

Hvor effektivt fremmer Norges Sjømatråd norsk hvitfiskeksport?
61
is higher than for either whitefish (-0.307) or clipfish/saltfish (-0.168), the ranges in the lifts of the export price, revenue, and profit are not as wide with increases in its export supply elasticity as is the case for fresh/frozen whitefish exports. For stockfish exports, the results indicate that over the January 2003 through December 2017 period of analysis, the lift from investment by Norwegian stakeholders in stockfish export promotion through the NSC ranged from 0% to 4.9% for the export volume, 7.1% to 10.0% for export value, 2.5% to 11.8% for the average price, and 4.9% to 19.9% for industry profit depending on the export supply elasticity (Table 11). The most plausible effects of the NSC stockfish export promotion program within that range (corresponding to a stockfish export supply elasticity of 0.5) include a 6% lift of the export price, an 8% lift of the export revenue, an 11% lift of industry profit, and a small export volume lift of up to 3%. Note again that as the export supply elasticity decreases, the estimated lift of the stockfish export volume also decreases as occurs with all whitefish and the other classes of whitefish exports while the lift to the average stockfish export price increases. As with the other classes of whitefish (or, indeed, for any exported commodity) when the export supply elasticity is zero (no price responsiveness of export supply to price), export promotion generates only a higher price with no export volume response to the promotion. As the addition to the export volume decreases and the addition to the export price increases with lower export supply elasticities, the lift of (additions to) export revenue and industry profit increases due to the estimated price inelasticity of the stockfish export demand. Like the other types of whitefish exports, when the price responsiveness (elasticity) of the Norwegian export supply of stockfish goes to zero, the stockfish export price and, therefore, the revenue and profit from stockfish exports increases but less extremely than the cases of all whitefish and clipfish/saltfish and more like the case of fresh/frozen whitefish exports. This result is due to the greater similarity of the stockfish price elasticity of export demand to that of fresh/frozen whitefish export demand (-0.678 compared to -0.434, respectively) than to that of either all whitefish (-0.307) or clipfish/saltfish (-0.168).
Benefit-Cost Analysis
Clearly, based on a comparative analysis of the with and without NSC whitefish promotion expenditure scenarios as summarized in the previous section and Tables 8 - 11, NSC export promotion has effectively boosted the prices and revenues from Norwegian exports of whitefish and from the three categories of whitefish promoted by NSC (fresh/frozen whitefish, clipfish/saltfish, and stockfish) along with profits in the Norwegian whitefish industry. A critical concern, of course, is whether the lift (gains) in export revenue and industry profit induced by the NSC whitefish export promotion programs has been substantial enough to more than cover the cost of the promotion to whitefish industry stakeholders (those who pay the fees) over time. If not, then the conclusion would be that the promotion of whitefish or of any of the categories of whitefish that do not at least pay for themselves should be discontinued because the promotion costs stakeholders more than it returns to them. On the other hand, if the revenue and/or profits generated for the promotion of whitefish or any of the categories of whitefish more than cover

Hvor effektivt fremmer Norges Sjømatråd norsk hvitfiskeksport?
62
the costs, the programs would be deemed a successful investment opportunity for the Norwegian whitefish industry. This section, then, provides a benefit-cost analysis of the NSC whitefish export promotion programs to answer these questions based on the results of the scenario analyses discussed above.
Based on equations (1) and (2) from the methodology section, we calculated the BCRs (GRBCR, NRBCR, and NPBCR) for the NSC export promotion programs for all whitefish as well as for fresh/frozen whitefish, clipfish/saltfish, and stockfish over the period of January 2003 to December 2017. A BCR that is greater than 1 is interpreted as meaning that the program has more than paid for itself. Otherwise, the program would be considered to have created an economic loss because the benefit generated would be less than the cost of the program. Because the calculations of the BCRs are based on the simulation results, the BCR estimates corresponding to an export supply elasticity of 0.5 are highlighted in the discussion and corresponding tables as the most plausible for the respective NSC whitefish promotion program. All Whitefish Promotion Benefit-Cost Analysis
The estimated net export revenue benefit-cost ratio (NRBCR) of the NSC export promotion program for all whitefish over the 2003 to 2017 period of analysis ranges between 5.9 and 22.1 (from higher to lower export supply elasticities) (Table 12). That is, for every krone of export promotion expenditure, the net return to stakeholders in additional export revenue, net of the promotion expenditures, ranges from 5.9 kroner to 22.1 kroner depending on the responsiveness of the Norwegian export supply of all whitefish. The results in Table 12 corresponding to an export supply elasticity of 0.5 may most accurately reflect the BCR from Norwegian whitefish export promotion. That is, the most plausible net export revenue BCR for the NSC whitefish export promotion program is about 9.2 to 1. The net economic surplus or profit BCR (NPBCR) for all whitefish export promotion is calculated to range from 1.4 assuming a high whitefish export supply elasticity to 22.1 for a zero export supply elasticity. These results imply a net addition to Norwegian economic welfare (whitefish industry profit) of 1.4 to 22.1 kroner per krone spent on whitefish export promotion (Table 12). The most plausible net export surplus (profit) BCR is about 5.9 to 1 which is associated with a Norwegian whitefish export supply elasticity of 0.5. This export surplus or profit BCR measure is necessarily smaller than the NRBCR because additional economic costs have been netted out of the additional export revenue to calculate the additional export surplus (whitefish industry profit) generated by the program. These calculated returns to the NSC whitefish export promotion program tend to be in line with the BCRs for salmon calculated in various studies and with the average BCRs calculated for cod and skrei by CAPIA (2016).

Hvor effektivt fremmer Norges Sjømatråd norsk hvitfiskeksport?
63
Table 12: Benefit-Cost Ratios (BCRs) for NSC All Whitefish Export Promotion under Alternative Export Supply Elasticities, 2003-2017
Alternative Export Supply Elasticities Addition to: 0 0.5 1.0 1.5 2.0 Additional Export Revenue (NOK million)
25,237 11,155 8,952 8,035 7,529
Additional Industry Profit (NOK million)
25,237 7,584 4,575 3,287 2,568
NSC Promotion Investment (NOK million)
1,092 1,092 1,092 1,092 1,092
Gross Export Revenue BCR (GRBCR) (NOK added/NOK spent)
23.1 10.2 8.2 7.4 6.9
Net Export Revenue BCR (NRBCR) (NOK added/NOK spent)
22.1 9.2 7.2 6.4 5.9
Net Export Surplus (Profit) BCR (NPBCR)(NOK added/NOK spent)
22.1 5.9 3.2 2.0 1.4
Fresh/Frozen Whitefish Promotion Benefit-Cost Analysis The net export revenue benefit-cost ratio (NRBCR) of the NSC export promotion program for fresh and frozen whitefish over the 2003 to 2017 period of analysis is calculated to have ranged between 3.9 and 8.5 (from higher to lower export supply elasticity) (Table 13). That is, for every krone of fresh/frozen export promotion expenditure, the net return to stakeholders in additional fresh/frozen export revenue, net of the promotion expenditures, ranges from 3.9 kroner to 8.5 kroner depending on the responsiveness of the Norwegian export supply of fresh and frozen whitefish. As is the case for all whitefish export promotion, the results in Table 13 corresponding to an export supply elasticity of 0.5 may most accurately reflect the BCR from Norwegian fresh and frozen whitefish export promotion. That is, the most plausible net export revenue BCR for the NSC fresh and frozen whitefish export promotion program is about 5.5 to 1. Over the same period, the net economic surplus or profit BCR (NPBCR) for fresh and frozen whitefish export promotion is calculated to have ranged from 0.7 for a high whitefish export supply elasticity to 8.5 for a zero export supply elasticity. These results imply a range in the net addition to Norwegian economic welfare (whitefish industry profit) of 0.7 to 8.5 kroner per krone spent on fresh and frozen whitefish export promotion (Table 13). For the same reasons indicated above for all whitefish, the most plausible net export surplus (profit) BCR for fresh and frozen whitefish export promotion is 3.4 to 1 which is associated with a Norwegian fresh and frozen whitefish export supply elasticity of 0.5. Again, this export surplus or profit BCR measure

Hvor effektivt fremmer Norges Sjømatråd norsk hvitfiskeksport?
64
Table 13: Benefit-Cost Ratios (BCRs) for the NSC Fresh/Frozen Whitefish Export Promotion Program under Alternative Export Supply Elasticities, 2003-2017
Alternative Export Supply Elasticities Addition to: 0 0.5 1.0 1.5 2.0 Additional Export Revenue (NOK million)
4,802 3,288 2,843 2,631 2,506
Additional Industry Profit (NOK million)
4,802 2,215 1,440 1,066 847
NSC Promotion Investment (NOK million)
508 508 508 508 508
Gross Export Revenue BCR (GRBCR) (NOK added/NOK spent)
9.5 6.5 5.6 5.2 4.9
Net Export Revenue BCR (NRBCR) (NOK added/NOK spent)
8.5 5.5 4.6 4.2 3.9
Net Export Surplus (Profit) BCR (NPBCR)(NOK added/NOK spent)
8.5 3.4 1.8 1.1 0.7
Table 14: Benefit-Cost Ratios (BCRs) for the NSC Clipfish/Saltfish Export Promotion Program under Alternative Export Supply Elasticities, 2003-2017
Alternative Export Supply Elasticities Addition to: 0 0.5 1.0 1.5 2.0 Additional Export Revenue (NOK million)
19,422 7,029 5,334 4,661 4,300
Additional Industry Profit (NOK million)
19,422 4,794 2,734 1,913 1,471
NSC Promotion Investment (NOK million)
492 492 492 492 492
Gross Export Revenue BCR (GRBCR) (NOK added/NOK spent)
39.4 14.3 10.8 9.5 8.7
Net Export Revenue BCR (NRBCR) (NOK added/NOK spent)
38.4 13.3 9.8 8.5 7.7
Net Export Surplus (Profit) BCR (NPBCR)(NOK added/NOK spent)
38.4 8.7 4.6 2.9 2.0

Hvor effektivt fremmer Norges Sjømatråd norsk hvitfiskeksport?
65
is necessarily smaller than the NRBCR because additional economic costs have been netted out of the additional fresh and frozen export revenue to calculate the additional export surplus (whitefish industry profit) generated by the program. Clipfish/Saltfish Promotion Benefit-Cost Analysis The net export revenue benefit-cost ratio (NRBCR) of the NSC export promotion program for clipfish/saltfish over the 2003 to 2017 period of analysis is calculated to have ranged between 7.7 and 38.4 (from higher to lower export supply elasticity) (Table 14). That is, for every krone of clipfish/saltfish export promotion expenditure, the net return to stakeholders in additional export revenue from clipfish/saltfish, net of the promotion expenditures, ranges from 7.7 kroner to 38.4 kroner depending on the responsiveness of the Norwegian export supply of clipfish and saltfish. The range in the BCRs across the various export supply elasticities is so much wider than for all whitefish and for fresh/frozen whitefish because the estimated price elasticity of the export demand for clipfish/saltfish is so much smaller than is the case for either all whitefish or fresh/frozen whitefish. Again, for the same reasons as for the other types of whitefish exports analyzed so far, the results in Table 14 corresponding to a clipfish/saltfish export supply elasticity of 0.5 may most accurately reflect the BCR from Norwegian clipfish/saltfish export promotion. That is, the most plausible net export revenue BCR for NSC clipfish/saltfish export promotion is about 13 to 1. The net economic surplus or profit BCR (NPBCR) for clipfish/saltfish is calculated to have ranged from 2.0 assuming a high whitefish export supply elasticity to 38.4 for a zero export supply elasticity over the 2003 to 2017 period of analysis. These results imply a net addition to Norwegian economic welfare (whitefish industry profit) of 2.0 to 38.4 kroner per krone spent on Norwegian clipfish/saltfish export promotion (Table 14). For the same reasons indicated above, the most plausible net export surplus (profit) BCR for clipfish/saltfish export promotion is 8.7 to 1 which is associated with a Norwegian clipfish/saltfish export supply elasticity of 0.5. As for the other whitefish types analyzed, the export surplus or profit BCR measure for clipfish/saltfish is necessarily smaller than the corresponding NRBCR. Stockfish Promotion Benefit-Cost Analysis The net export revenue benefit-cost ratio (NRBCR) of the NSC export promotion program for stockfish over the 2003 to 2017 period of analysis is calculated to have ranged between 6.9 and 10.0 (from higher to lower export supply elasticity) over the period of analysis (Table 15). That is, for every krone of stockfish export promotion expenditure, the net return to stakeholders in additional export revenue from stockfish, net of the promotion expenditures, ranges from 6.9 kroner to 10.0 kroner depending on the responsiveness of the Norwegian export supply of stockfish. For the same reasons as for the other types of whitefish exports analyzed already, the results in Table 15 corresponding to a stockfish export supply elasticity of 0.5 may most accurately

Hvor effektivt fremmer Norges Sjømatråd norsk hvitfiskeksport?
66
Table 15: Benefit-Cost Ratios (BCRs) for the NSC Stockfish Export Promotion Program under Alternative Export Supply Elasticities, 2003-2017
Alternative Export Supply Elasticities Addition to: 0 0.5 1.0 1.5 2.0 Additional Export Revenue (NOK million)
1,013 839 776 743 723
Additional Industry Profit (NOK million)
1,013 575 401 308 250
NSC Promotion Investment (NOK million)
92 92 92 92 92
Gross Export Revenue BCR (GRBCR) (NOK added/NOK spent)
11.0 9.1 8.4 8.1 7.9
Net Export Revenue BCR (NRBCR) (NOK added/NOK spent)
10.0 8.1 7.4 7.1 6.9
Net Export Surplus (Profit) BCR (NPBCR)(NOK added/NOK spent)
10.0 5.2 3.4 2.3 1.7
accurately reflect the BCR from Norwegian stockfish export promotion. Thus, the most plausible net export revenue BCR for NSC stockfish export promotion is about 8 to 1. The net economic surplus or profit BCR (NPBCR) for stockfish is calculated to range from 1.7 assuming a high stockfish export supply elasticity to 10.0 for a zero export supply elasticity. This result implies a net addition to Norwegian economic welfare (whitefish industry profit) of 1.7 to 10.0 kroner per krone spent on Norwegian stockfish export promotion (Table 15). For the same reasons indicated above, the most plausible net export surplus (profit) BCR for stockfish export promotion is about 5 to 1 which is associated with a Norwegian stockfish export supply elasticity of 0.5. As for the other whitefish types analyzed, the export surplus or profit BCR measure for stockfish is necessarily smaller than the corresponding NRBCR. Summary Comparison of Promotion Effects and BCRs
Comparing the most plausible results (at a price elasticity of export supply of 0.5) from the simulation and BCR analyses indicates that nearly two-thirds of the NOK 11.1 billion gain in total whitefish export revenue and NOK 7.6 billion gain in whitefish industry profits from the NSC whitefish export promotion programs over 2003 through 2017 is the result of gains in clipfish/saltfish export revenue and profit, respectively (Table 16). At the same time, clipfish/saltfish promotion over that period also generated higher returns to stakeholders in terms of additional revenue and profit earned per NOK of expenditure (13.3 and 8.7, respectively) than promotion of either fresh/frozen whitefish (5.5 and 3.4, respectively) or stockfish (8.1 and 5.2, respectively

Hvor effektivt fremmer Norges Sjømatråd norsk hvitfiskeksport?
67
Table 16: Summary Comparison of the Most Plausiblea Promotion Effects and BCRs from NSC Whitefish Export Promotion under Alternative Export Supply Elasticities, 2003-2017
a Values of export revenue and industry profit lifts and BCRs at assumed price elasticity of export supply of 0.5. b The addition to export revenue or industry profit for each whitefish type as a direct result of investment by the Norwegian
whitefish in promotion through the Norwegian Seafood Council (cumulative over 2003 through 2017). c Kroner of export revenue or industry profit earned by the Norwegian whitefish industry due to promotion per krone of
investment in promotion.
respectively). Overall, whitefish export promotion garnered 9.2 kroner in additional export and 5.9 kroner in additional profits to the Norwegian whitefish industry per krone of promotion.
A comparison of the fresh/frozen and the stockfish results in Table 16 provides a good example of why a BCR is not always the best metric of export promotion effectiveness. The per krone profit return to stockfish promotion (5.2) was about 1.5 times that of the promotion of fresh and frozen whitefish (3.4). Even so, promotion of fresh/frozen whitefish added nearly 4 times more to the total whitefish industry profit lift than did promotion of stockfish (NOK 2.2 billion compared to NOK 0.6 billion) over the 2003 to 2017 period. NSC export promotion spending on fresh/frozen whitefish contributed nearly 30% to the overall lift in whitefish industry profit while stockfish promotion contributed about 7.6% despite the higher BCR perhaps due to the limited export market growth opportunities for stockfish. The lower BCR for fresh/frozen whitefish promotion is likely due to the relative strength of drivers other than Norwegian promotion in contributing to the global growth in whitefish consumption such as income growth, growing consumer preferences for healthy foods, and rapidly improving technologies that reduce costs and allow fish to be kept fresh during transportation, holding, and display (Lem, Bjorndal, and Lappo, 2014).
CONCLUSIONS AND IMPLICATIONS The main conclusion of this study is that the Norwegian Seafood Council’s export promotion programs have been highly effective in boosting Norwegian whitefish export demand and in enhancing the profitability of the Norwegian whitefish industry. Major findings of this study for the promotion of all whitefish species as a group as well as for the three main categories of
Liftb BCRc
Whitefish Type Export Revenue Industry Profit Export
Revenue Industry
Profit
NOK billion
Percent
NOK billion
Percent
NOK per NOK of promotion
All Whitefish 11.1 7.1% 7.6 9.6% 9.2 5.9
Fresh/Frozen Whitefish 3.3 4.0% 2.2 5.4% 5.5 3.4
Clipfish/Saltfish 7.0 10.8% 4.8 14.8% 13.3 8.7
Stockfish 0.8 8.3% 0.6 11.3% 8.1 5.2

Hvor effektivt fremmer Norges Sjømatråd norsk hvitfiskeksport?
68
whitefish promoted by NSC (fresh and frozen whitefish, clipfish and saltfish, and stockfish) over the period of 2003 through 2017 include the following11:
The NSC whitefish export promotion program added a total of about NOK 11.1 billion (7.1%) to Norwegian whitefish export revenue, a monthly average of NOK 62.7 million in additional whitefish export revenue.
About 7% of the total value of Norwegian whitefish exports since 2003 is directly attributable to NSC export promotion programs. In other words, Norwegian whitefish industry revenues from exports would have been 7% lower if there had not been an NSC whitefish export promotion program.
The additional NOK 11.1 billion (7.1%) in total whitefish export revenue generated by NSC promotion programs resulted from promotion-induced additions to the export revenue from:
» Fresh and frozen whitefish of NOK 3.3 billion (4.0%), a monthly average addition of NOK 18.5 million;
» Clipfish and saltfish of NOK 7.0 billion (10.8%), a monthly average addition of NOK 39.5 million; and
» Stockfish of NOK 0.8 billion (8.3%), a monthly average addition of NOK 4.8 million.
The NSC export promotion program had only a marginal additive effect on Norwegian whitefish export supplies over the 2003 to 2017 period of analysis given the quota-imposed restrictions on whitefish production.
Consequently, most of the export revenue gains from NSC whitefish export promotion over 2003 through 2017 period of analysis resulted from additions to the export prices of:
» All whitefish by a monthly average of NOK 1.55 per kg;
» Fresh and frozen whitefish by a monthly average of NOK 0.62 per kg;
» Clipfish and saltfish by a monthly average of NOK 2.83 per kg; and
» Stockfish by a monthly average of NOK 4.34 per kg.
The NSC whitefish export promotion program also generated about NOK 7.6 billion (9.6%) in additional Norwegian whitefish industry profit, a monthly average of NOK 42.6 million in additional whitefish industry profit.
The addition to total whitefish industry profit resulted from NSC export promotion-induced additions to profits from:
» Fresh and frozen whitefish of NOK 2.2 billion (5.4%), a monthly average addition of NOK 12.4 million;
» Clipfish and saltfish of NOK 4.8 billion (14.8%), a monthly average addition of NOK 26.9 million; and
» Stockfish of NOK 0.6 billion (11.3%), a monthly average addition of NOK 3.3 million.
NSC generated high rates of return to the promotion of:
11 Results corresponding to an export supply elasticity of 0.5 are highlighted here as the most plausible for the respective NSC whitefish promotion program as discussed in the report.

Hvor effektivt fremmer Norges Sjømatråd norsk hvitfiskeksport?
69
» All Norwegian whitefish exports of NOK 9.2 in additional whitefish export revenue per NOK of promotion expenditure and NOK 5.9 of additional industry profit per NOK of promotion expenditure;
» Fresh and frozen whitefish exports of NOK 5.5 in additional export revenue and NOK 3.4 in additional industry profits per NOK of promotion expenditure;
» Clipfish and saltfish exports of NOK 13.3 in additional export revenue and NOK 8.7 in additional industry profits per NOK of promotion expenditure; and
» Stockfish exports of NOK 8.1 in additional export revenue and NOK 5.2 in additional industry profit per NOK of promotion expenditure.
Other key conclusions of this study include the following:
The main drivers of the export demand for Norwegian whitefish include:
» Export prices of each whitefish type relative to the global price of aquaculture exports.
A 10% increase in the respective Norwegian whitefish export prices relative to global export prices of aquaculture results in a decline in the export demand of all whitefish by 3.1%; fresh and frozen whitefish by 4.3%; clipfish and saltfish by 1.7%; and stockfish by 6.8%.
» Income changes in importing countries.
A 10% increase in real, exchange-rate adjusted income (GDP) in importing countries leads to a 2.5% increase in all Norwegian whitefish export demand; a 2.7% increase in Norwegian fresh and frozen whitefish export demand; and a 3.2% increase in Norwegian stockfish export demand. Clipfish and saltfish export demand was found to be unaffected by changes in income in importing countries.
» Seasonality that differs substantially across the respective whitefish export categories.
» Competition among fish species.
Reductions in the price of Norwegian salmon were found to have a positive effect on aggregate Norwegian whitefish export demand and specifically on the export demand for fresh and frozen whitefish in importing countries. This result is consistent with findings of other studies. A decrease in global prices of aquaculture exports was found to have a negative effect on the export demand for all Norwegian whitefish types.
» Major events in world whitefish markets.
The major events found to impact the export demand for all whitefish types included weather-related events, the presence of bigger cod, increases in quotas for cod and haddock, increased competition in the whitefish market, the filleting of whitefish by China, the global financial meltdown in 2007 and 2008, the recession in 2008 and 2009, the Nigerian currency exchange restrictions in 2015 and 2016, and the crisis in Brazil from 2014 through 2016.
» NSC export promotion expenditures.
The impact of NSC export promotion is not felt all at once in the month of expenditure but instead is distributed over the current month and subsequent months as well. The length of the lag in the impact of promotion expenditures on all whitefish, fresh/frozen

Hvor effektivt fremmer Norges Sjømatråd norsk hvitfiskeksport?
70
whitefish, and clipfish/saltfish exports is two months but four months for stockfish exports. A 10% increase in the respective NSC promotion expenditures has a cumulative impact of 0.79% for all whitefish exports, 0.36% for fresh and frozen whitefish exports; 0.68% for clipfish/saltfish exports; and 0.89% for stockfish exports.
These conclusions suggest a number of considerations for NSC promotion and program management purposes. First, the high estimated average BCR across all whitefish programs of 5.9 kroner of industry profit per krone of promotion indicates not only that the NSC whitefish promotion program has been effective and profitable for stakeholders in the Norwegian whitefish industry over time but also that the industry is underinvesting in whitefish export promotion despite the steady increase in funding of the NSC whitefish promotion program since 2004. The opportunity cost of the funds NOT invested in whitefish export promotion is 5.9 kroner in profit for the whitefish industry per krone not invested in whitefish promotion. As the level of expenditures increase, the BCR would be expected to drop to some extent because of diminishing returns. But because the current level of expenditure is still low relative to the value of Norwegian whitefish exports (about than 1% on average), even an extraordinary expansion in the current level of investment in whitefish promotion would likely have only a modest negative effect on the benefit-cost ratio. Second, the differing BCR levels for the various whitefish categories promoted by the NSC (fresh/frozen whitefish, clipfish/saltfish, and stockfish) might suggest that some reallocation of promotion funds among the three categories could enhance the overall profitability of the Norwegian whitefish industry. However, whether or not such a reallocation would achieve that goal depends on the relative export market expansion opportunities for the three categories of Norwegian whitefish. For example, the BCR for fresh and frozen whitefish is 3.4 while that of clipfish and saltfish is much higher at 8.7. If market growth opportunities for clipfish and saltfish are limited, however, while those of fresh and frozen whitefish are much more dynamic, then a smaller return on a large and growing volume of fresh and frozen whitefish may well be more profitable than a large return on a smaller volume of sluggish clipfish and saltfish exports. As noted in the background section of the report, fresh and frozen whitefish exports are experiencing rapid growth while growth of clipfish and saltfish exports has been anemic. Consequently, caution is recommended in interpreting the differences in BCRs as indications of the need to reallocate funding. A careful study of future market opportunities would be needed before any reallocation of funding is done based on the results of this study. Third, the lag measured between the expenditure of whitefish promotion funds and their impact on whitefish exports along with the dynamic nature of whitefish markets indicates that any failure to maintain or enhance funding for whitefish promotion would have serious negative impacts on the profitability of the Norwegian whitefish industry over many subsequent time periods. Whitefish promotion expenditures create a stream of new revenues over time to the whitefish industry. The export demand effects are not realized immediately but rather are distributed over time. Consequently, a reduction in funding over a period of a year, for example,

Hvor effektivt fremmer Norges Sjømatråd norsk hvitfiskeksport?
71
would negatively impact the whitefish industry not just in that year but over a longer period of time. Raising promotion funding after some period of lapse in funding would require an extended period of time before the benefits of the promotion begin to be realized once again. Fourth, the statistical significance of the Norwegian whitefish export prices relative to the world prices of aquaculture exports in all of the whitefish export demand models (all whitefish, fresh/frozen whitefish, clipfish/saltfish, and stockfish) implies that foreign consumers take aquaculture prices into account as they consider whether to purchase Norwegian whitefish. As exports of tilapia, pangasius, and other farmed whitefish create increasing price competition for Norwegian whitefish exports, promotional programs targeting the specific differentiating characteristics of Norwegian products will become increasingly important to effectively induce consumer loyalty to Norwegian whitefish and to maintain their recent export growth path. Fifth, for measuring and promoting the effectiveness of investments by whitefish producers and exporters in funding export promotion programs, perhaps the best metrics to use are the gains achieved in whitefish export revenue and industry profits. Although the BCRs for the whitefish promotion program presented in this report are impressive, they simply indicate how much has been earned for every krone invested in promotion. They do NOT, however, indicate the magnitude of export impact realized by the promotional efforts. Consider the BCRs and industry profit gains estimated in this study for fresh/frozen whitefish promotion and for stockfish promotion. The per krone profit return to stockfish promotion (5.2) is about 1.5 times that for the promotion of fresh and frozen whitefish (3.4). Even so, promotion of fresh/frozen whitefish added nearly 4 times more to the total whitefish industry profit lift from promotion than did promotion of stockfish (NOK 2.2 billion compared to NOK 0.6 billion) over the 2003 to 2017 period. Export promotion spending on fresh/frozen whitefish contributed nearly 30% to the overall lift in whitefish industry profit while stockfish promotion contributed about 7.6% despite its much higher BCR. Finally, concerns about having to pay the levy are often the result of a lack of understanding of the results of evaluation studies like this one but also and, perhaps more importantly, of how promotion programs return value to them. All stakeholders can readily identify the line on their balance sheets reflecting the cost to them of the levy on their exports. But there is no line on their balance sheets for what that cost has returned to them in additional export revenues and profits. What this study and similar promotion program studies conclude is that the benefits to stakeholders are included in the revenue and profit lines on their balance sheets. Some part of that revenue and profit has come from the additional export demand and higher export prices that the NSC export promotion program has generated. This study concludes that the NSC whitefish export promotion program accounted for about 7% of the export revenue and 10% of the profit earned by the whitefish industry over 2003 through 2017 by committing about 1% of whitefish industry revenues to promotion over that period. The result is a much higher return to the investment of stakeholder funds than could have been obtained from just about any other investment opportunity that was available over that period, particularly in the environment of

Hvor effektivt fremmer Norges Sjømatråd norsk hvitfiskeksport?
72
low rates of interest over the last decade or so. The investment not only contributes to higher levels of export prices, revenue, and industry profit in many years but also helps defend against powerful negative forces that restrain growth of the industry such as disease issues, restrictive import policies, seasonality in import purchases, political changes, and more.
REFERENCES Allais, O., and V. Nichele. 2007. “Capturing Structural Changes in French Meat and Fish
Demand over the Period 1991-2002.” European Review of Agricultural Economics 34(4):517-538.
Arnason, R. 2004. “Optimal Feedback Controls: Comparative Evaluation of the Cod Fisheries in Denmark, Iceland, and Norway.” American Journal of Agricultural Economics 86(2):531-542.
Asche, F. 2009. “Adjustment Cost and Supply Response in a Fishery: A Dynamic Revenue Function.” Land Economics 85(1):201-215.
Asche, F., H. Bremnes, and C.R Wessels. 1999. “Product Aggregation, Market Integration, and Relationships Between Prices: An Application to World Salmon Markets.” American Journal of Agricultural Economics 81(3):568.
Asche, F., and J. Bronnmann. 2017. “Price Premiums for Ecolabelled Seafood: MSC Certification in Germany. Australian Journal of Agricultural and Resource Economics 61(4):576-589. On-line at: https://doi.org/10.1111/1467-8489.12217.
Asche, F., Y. Chen, and M.D. Smith. 2015. “Economic Incentives to Target Species and Fish Size: Prices and Fine-scale Product Attributes in Norwegian Fisheries.” ICES Journal of Marine Science 72(3):733-740. On-line at: https://doi.org/10.1093/icesjms/fsu208.
Asche, F., O. Flaaten, J.R. Isaksen, J. R., and T. Vassdal. 2002. “Derived Demand and Relationships between Prices at Different Levels in the Value Chain: A Note.” Journal of Agricultural Economics 53(1):101-107. On-line at: https://doi.org/10.1111/j.1477-9552.2002.tb00008.x.
Asche, F., D.V. Gordon, and R. Hannesson. 2004. “Tests for Market Integration and the Law of One Price: The Market for Whitefish in France.” Marine Resource Economics 19(2):195-210.
Asche, F., D.Y. Gordon, and R. Hannesson. 2002. “Searching for Price Parity in the European Whitefish Market.” Applied Economics 34(8):1017-1024. On-line at: http://www.tandfonline.com/loi/raec20.
Asche, F., and R. Hannesson. 2002. “Allocation of Fish between Markets and Product Forms.” Marine Resource Economics 17(3):225-238.
Asche, F., R. Menezes, and J. Dias. 2007. “Price Transmission in Cross Boundary Supply Chains.” Empirica 34(5):477-489.
Asche, F., K.H. Roll, and T. Trollvik. 2009. "New Aquaculture Species - The Whitefish Market." Aquaculture Economics & Management 13(2):76-93. On-line at: https://doi.org/10.1080/13657300902881641.

Hvor effektivt fremmer Norges Sjømatråd norsk hvitfiskeksport?
73
Asche, F., K.G. Salvanes, and F. Steen. 1997. “Market Delineation and Demand Structure.” American Journal of Agricultural Economics 79(1):139-150.
Asche, F., and D. Zhang. 2013. “Testing Structural Changes in the U.S. Whitefish Import Market: An Inverse Demand System Approach.” Agricultural and Resource Economics Review 42(3):453-470. On-line at: http://ageconsearch.umn.edu/handle/36551.
Berg Andersen, T., K. Lien, R. Tveterås, and S. Tveterås. 2009. “The Russian Seafood Revolution: Shifting Consumption Towards Aquaculture Products.” Aquaculture Economics & Management 13(3):191-212. On-line at: https://doi.org/10.1080/13657300903083767.
Blomquist, J., V. Bartolino, and S. Waldo. 2015. “Price Premiums for Providing Eco-labelled Seafood: Evidence from MSC-Certified Cod in Sweden.” Journal of Agricultural Economics 66(3):690-704. On-line at: http://onlinelibrary.wiley.com/journal/10.1111/%28ISSN%291477-9552/issues.
Borch, O.J. and T. Korneliussen. 1995. Norsk tørrfisknæring, Markedstilpasning og Eksportorganisering. (Norwegian Stockfish Industry, Markets and Export Organization), Bodø: Nordland Research Institute, Report no. 2.
Bronnmann, J. 2016. “The German Whitefish Market: An Application of the LA/AIDS Model Using Retail-Scanner-Data.” Aquaculture Economics & Management 20(4):330-341. On-line at: https://doi.org/10.1080/13657305.2016.1212125.
Bronnmann, J., I. Ankamah-Yeboah, and M. Nielsen. 2016. “Market Integration between Farmed and Wild Fish: Evidence from the Whitefish Market in Germany.” Marine Resource Economics 31(4):421-432.
Bronnmann, J., and F. Asche. 2016. “The Value of Product Attributes, Brands and Private Labels: An Analysis of Frozen Seafood in Germany.” Journal of Agricultural Economics 67(1):231-244. On-line at: http://onlinelibrary.wiley.com/journal/10.1111/%28ISSN%291477-9552/issues.
CAPIA AS. 2016. “Effect of Generic Marketing of ‘Skrei’ and ‘Fresh Cod’.” Report to the Norwegian Seafood Council, Trømso, Norway, February 15.
Capps, Jr., O. and G.W. Williams. 2017. “How Effectively Does the Norwegian Seafood Export Council Promote Norwegian Seafood Exports?” Research Report to the Norwegian Seafood Export Council, Forecasting and Business Analytics, LLC (FABA), College Station, Texas, June.
Carman, H.F. and R.D. Green. 1993. “Commodity Supply Response to a Producer-Financed Advertising Program: The California Avocado Industry.” Agribusiness: An International Journal 9(6):605-621.
Chidmi, B., T. Hanson, and G. Nguyen. 2012. “Substitutions Between Fish and Seafood Products at the U.S. National Retail Level.” Marine Resource Economics 27(4):359-370.
Dahl, R.E., and A. Oglend. 2014. “Fish Price Volatility.” Marine Resource Economics 29(4):305-322.
Dale, P. and V. Uwonkunda. 2017. "Nigeria's Love Affair with a Norwegian Fish." BBC Africa, lagos and Lofoten. November 28. On-line at: http://www.bbc.com/news/world-africa-42137476.

Hvor effektivt fremmer Norges Sjømatråd norsk hvitfiskeksport?
74
Dey, M.M., Y.T. Garcia, P. Kumar, S. Haque, M.S. Haque, L. Li, S. Piumsombun, A. Radam, A. Senarathne, N.T. Khiem, and S. Koeshendrajana. 2008. “Demand for Fish in Asia: A Cross‐Country Analysis. Australian Journal of Agricultural and Resource Economics 52(3):321-338.
Eales, J., C. Durham, and C.R. Wessells. 1997. “Generalized Models of Japanese Demand for Fish.” American Journal of Agricultural Economics 79(4):1153.
Eales, J., and C.R. Wessells. 1999. “Testing Separability of Japanese Demand for Meat and Fish within Differential Demand Systems.” Journal of Agricultural and Resource Economics 24(1):114-126.
European Market Observations for Fisheries and Aquaculture Products (EUMOFA). 2017. “The EU Fish Market.” On-line at http://www.eumofa.eu/the-eu-fish-market.
EVIEWS 8.0. 2018. IHS Global Inc. On-line at: www.eviews.com. Food and Agriculture Organization of the United Nations (FAO). 2018a. Fisheries and
aquaculture software. FishStatJ - software for fishery statistical time series. In: FAO Fisheries and Aquaculture Department [online]. Rome. Updated 21 July 2016. On-line at: http://www.fao.org/fishery/.
Food and Agriculture Organization of the United Nations (FAO). 2018b. GLOBEFISH - Analysis and information on world fish trade. Rome. On-line at: http://www.fao.org/in-action/globefish/fishery-information/resource-detail/en/c/338601/.
Food and Agriculture Organization of the United Nations (FAO). 2018c. “FAOSTAT Database, Commodity Balances – Livestock and Fish Primary Equivalent.” On-line at: http://www.fao.org/faostat/en/#data/BL
Forker, O.D. and R.W. Ward. 1993. Commodity Advertising: The Economics and Measurement of Generic Programs. New York: Lexington Books.
Fousekis, P., and B.J. Revell. 2004. “Retail Fish Demand in Great Britain and its Fisheries Management Implications.” Marine Resource Economics 19(4):495-510.
Gallet, C.A. 2009. “The Demand for Fish: A Meta-Analysis of the Own-price Elasticity.” Aquaculture Economics & Management 13(3):235-245.
Gordon, D.V., and R. Hannesson. 1996. “On Prices of Fresh and Frozen Cod Fish in European and U.S. Markets.” Marine Resource Economics 11(4):223-238.
Gracia, A., and L.M. Albisu. 1998. “The Demand for Meat and Fish in Spain: Urban and Rural Areas.” Agricultural Economics 19(3):359-366.
Guillotreau, P., and N. Péridy. 2000. “Trade Barriers and European Imports of Seafood Products: A Quantitative Assessment.” Marine Policy 24(5):431-437. On-line at: https://doi.org/10.1016/S0308-597X(00)00018-X.
HAVFISK. 2015. Industry Handbook: The Whitefish Industry 2015. On-line at: http://www.havfisk.no/en/investor-relations/reports-and-presentations/industry-handbook-.
Hellandsjø, L.V. 2015. Demand Analysis of the Whitefish Market in the EU-Has Pangasius Taken Over Market Shares in the Whitefish Market? UiT Norges arktiske universitet.
Helstad, K., T. Vassdal, T. Trondsen, and J.A. Young. 2005. “Price Links between Auction and Direct Sales of Fresh and Frozen Fish in North Norway (1997-2003).” Marine Resource Economics 20(3):305-322.

Hvor effektivt fremmer Norges Sjømatråd norsk hvitfiskeksport?
75
International Monetary Fund (IMF). 2018. “International Financial Statistics.” On-line at: http://data.imf.org/?sk=388DFA60-1D26-4ADE-B505-A05A558D9A42.
Kaiser, H.M. 2015. “Economic Analysis of Norwegian Seafood Council Salmon Export Promotion to the European Union.” Report to the Norwegian Seafood Council, Tromsø, Norway.
Kinnucan, H.W. and H. Cai. 2011. “A Benefit-Costs Analysis of U.S. Agricultural Trade Promotion.” American Journal of Agricultural Economics 93(1):194-208.
Kinnucan, H.W. and Ø. Myrland. 2000. “Optimal Advertising Levies with Application to the Norway-EU Salmon Agreement.” European Review of Agricultural Economics 27:39–57.
Kinnucan, H.W. and Ø. Myrland. 2001. “A Note on Measuring Returns to Nonprice Export Promotion.” Agribusiness: An International Journal 17(3):423–433.
Kinnucan, H.W. and Ø. Myrland. 2002. “Relative Impact of the Norway-EU Salmon Agreement: a Midterm Assessment.” Journal of Agricultural Economics 53(2):195-219.
Kinnucan, H.W. and Ø. Myrland. 2003. “Free-Rider Effects of Generic Advertising: The Case of Salmon.” Agribusiness: An International Journal 19(3):315–324.
Kinnucan, H.W. and Ø. Myrland. 2006. “The Effectiveness of Antidumping Measures: Some Evidence for Farmed Atlantic Salmon.” Journal of Agricultural Economics 57(3):459–477.
Kinnucan, H.W., R.G. Nelson, and H. Xiao. 1995. “Cooperative Advertising Rent Dissipation.” Marine Resource Economics 10:373-384.
Kumar, G., and C.R. Engle. 2016. “Technological Advances that Led to Growth of Shrimp, Salmon, and Tilapia Farming.” Reviews in Fisheries Science & Aquaculture 24(2):136-152. On-line at: https://doi.org/10.1080/23308249.2015.1112357.
Lambert, R., B. Larue, C. Yélou, and G. Criner. 2006. “Fish and Meat demand in Canada: Regional Differences and Weak Separability.” Agribusiness 22(2):175-199.
Lee, M.-Y. 2014. “Hedonic Pricing of Atlantic Cod: Effects of Size, Freshness, and Gear.” Marine Resource Economics 29(3): 259-277.
Lem, A., T. Bjorndal, and A. Lappo. 2014. Economic Analysis of Supply and Demand for Food Up to 2030 – Special Focus on Fish and Fishery Products. FAO Fisheries and Aquaculture Circular No. 1089 (FIPM/C1089), Food and Agriculture Organization of the United Nations, Rome, Italy. On-line at: http://www.fao.org/3/a-i3822e.pdf.
Msangi, S., M. Kobayashi, M. Batka, S. Vannuccini, M. Dey, and J. Anderson. 2013. “Fish to 2030: Prospects for Fisheries and Aquaculture.” World Bank Report (83177-GLB), 102.
Muhammad, A., and T.R. Hanson. 2009. “The Importance of Product Cut and Form when Estimating Fish Demand: The Case of U.S. Catfish.” Agribusiness 25(4):480-499.
Myrland, Ø. and H.W. Kinnucan. 2000. “Effects of Generic Advertising on Consumers’ Attitudes, Revealed Preferences, and At-Home Food Consumption of Salmon in Germany and France.” in R.S. Johnston (editor), Proceedings of the International Institute of Fisheries Economics and Trade, Corvallis, OR, Oregon State University.
Nerlove, M. and F.V. Waugh. 1961. "Advertising without Supply Control: Some Implications of a Study of the Advertising of Oranges." Journal of Farm Economics 43:813-37.
Nielsen, M. 2005. “Price Formation and Market Integration on the European First-Hand Market for Whitefish.” Marine Resource Economics 20(2):185-202.

Hvor effektivt fremmer Norges Sjømatråd norsk hvitfiskeksport?
76
Nielsen, M., J. Smit, and J. Guillen. 2009. “Market Integration of Fish in Europe.” Journal of Agricultural Economics 60(2):367-385. On-line at: http://onlinelibrary.wiley.com/journal/10.1111/%28ISSN%291477-9552/issues.
Norman-Lopez, A. 2009. “Competition between Different Farmed and Wild Species: The U.S. Tilapia Market.” Marine Resource Economics 24(3):237-251.
Norwegian Seafood Council (NSC). 2018a. Data and information provided by direct communication with NSC and/or online from “Market Insight: Statistics.” On-line at: http://en.seafood.no/market-insight/.
Norwegian Seafood Council (NSC). 2018b. “The Norwegian Seafood Council.” On-line at: https://fromnorway.com/policies/the-norwegian-seafood-council/.
Pascoe, S., and S. Mardle. 1999. Supply response in fisheries-the North Sea. University of Portsmouth, Centre for the Economics and Management of Aquatic Resources.
Rickertsen, K., D. Kristofersson, and S. Lothe. 2003. “Effects of Health Information on Nordic Meat and Fish Demand.” Empirical Economics 28(2):249-273.
Roheim, C.A., F. Asche, and J.I. Santos. 2011. “The Elusive Price Premium for Ecolabelled Products: Evidence from Seafood in the UK Market.” Journal of Agricultural Economics 62(3):655-668. On-line at: http://onlinelibrary.wiley.com/journal/10.1111/%28ISSN%291477-9552/issues.
Roheim, C.A., L. Gardiner, and F. Asche. 2007. “Value of Brands and Other Attributes: Hedonic Analysis of Retail Frozen Fish in the UK.” Marine Resource Economics 22(3):239-253.
Rudders, D.B., and J.M. Ward. 2015. “Own-price Elasticity of Open Access Supply as a Long-run Measure of Fish Stock Abundance.” Marine Policy 53:215-226. On-line at: https://doi.org/10.1016/j.marpol.2014.10.003.
Salvanes, K.G., and D.J. DeVoretz. 1997. “Household Demand for Fish and Meat Products: Separability and Demographic Effects.” Marine Resource Economics 12(1):37-55.
Salvanes, K.G., and D. Squires. 1995. “Transferable Quotas, Enforcement Costs and Typical Firms: An Empirical Application to the Norwegian Trawler Fleet.” Environmental and Resource Economics 6(1):1-21. On-line at: https://doi.org/0.1007/BF00691408.
Singh, K., M.M. Dey, and P. Surathkal. 2012. “Analysis of a Demand System for Unbreaded Frozen Seafood in the United States Using Store-Level Scanner Data.” Marine Resource Economics 27(4):371-387.
Singh, K., M.M. Dey, and P. Surathkal. 2014. “Seasonal and Spatial Variations in Demand for and Elasticities of Fish Products in the United States: An Analysis Based on Market‐Level Scanner Data.” Canadian Journal of Agricultural Economics/Revue canadienne d'agroeconomie 62(3):343-363.
Sogn-Grundvåg, G., F.-A. Egeness, and M. Heide. 2013. “Plan for markedsrettet FoU-arbeid i Afrika.” Research Report for Nofima.
Sogn-Grundvag, G., T.A. Larsen, and J.A. Young. 2014. “Product Differentiation with Credence Attributes and Private Labels: The Case of Whitefish in UK Supermarkets.” Journal of Agricultural Economics 65(2): 368-382. On-line at: https://onlinelibrary.wiley.com/doi/pdf/10.1111/1477-9552.12047.

Hvor effektivt fremmer Norges Sjømatråd norsk hvitfiskeksport?
77
Surathkal, P., M.M. Dey, C.R. Engle, B. Chidmi, and K. Singh. 2017. “Consumer Demand for Frozen Seafood Product Categories in the United States.” Aquaculture Economics & Management 21(1):9-24.
Statista. 2018. “Average Export Price of Frozen Whole Cod from Norway from 2008 to 2017.” On-line at: https://www.statista.com/statistics/666081/average-export-price-of-frozen-whole-cod-from-norway/.
Tonsor, G.T., and T.L. Marsh. 2007. “Comparing Heterogeneous Consumption in U.S. and Japanese Meat and Fish Demand.” Agricultural Economics 37(1):81-91.
Tveterås, S., F. Asche, M.F. Bellemare, M.D. Smith, A.G. Guttormsen, A. Lem, K. Lien, and S. Vannuccini. 2012. “Fish is Food - The FAO’s Fish Price Index,” PLoS ONE 7(5):e36731. On-line at: https://doi.org/10.1371/journal.pone.0036731.
Tveterås, S. (2018). Personal communication. February 19. Undercurrent News. 2017. “Cod Prices Brought Norwegian Fleet Highest Profit Margins on
Record.” November 27. On-line at: https://www.undercurrentnews.com/2017/11/27/high-cod-prices-brought-norwegian-fleet-highest-profit-margins-on-record-in-2016/.
Williams, G.W., O. Capps, Jr., and D. Hanselka. 2018. “The National Economic Contribution of Generic Food and Agricultural Product Advertising and Promotion.” International Journal of Food and Agribusiness Marketing 30(2):191-210. On-line at: https://doi.org/10.1080/08974438.2017.1402729.
Williams, G.W., O. Capps, Jr., and S.H. Lee. 2014. “The Return to Soybean Checkoff Investments.” Report to the Audit and Evaluation Committee of the United Soybean Board, St. Louis, Mo., July. On-line at: http://unitedsoybean.org/wp-content/uploads/ USB_Return_on_Investment.pdf.
Williams G.W., J.J. Reimer, R.M. Dudensing, B.A. McCarl, H.M. Kaiser, and J. Somers. 2016. “Economic Impact of USDA Export Market Development Programs.” Informa Economics, IEG, Prepared for U.S. Wheat Associates, USA Poultry & Egg Export Council, Pear Bureau Northwest, and the USDA Foreign Agriculture Service, June. On-line at: http://www.uswheat.org/newsMeetings/emd-2b.
Xie, J. 2008. “Halo Effect of Norwegian Salmon Promotion on EU Salmon Demand.” IIFET 2008 Vietnam Proceedings, University of Tromsø, Tromsø, Norway. On-line at: https://ir.library.oregonstate.edu/xmlui/bitstream/handle/1957/36942/172.pdf?sequence=1
Xie, J. 2015. “Testing Advertising-Induced Rotation of Demand Curves in the EU Salmon Market.” Aquaculture Economics and Management 19(2):175-191.
Xie, J., H.W. Kinnucan and Ø. Myrland. 2009. “Demand Elasticities for Farmed Salmon in World Trade.” European Review of Agricultural Economics 36(3):425–445.
Xie, J., and Ø. Myrland. 2010. “Modeling the Market Structure of the Spanish Salted Fish Market.” Food Economics–Acta Agricult Scand C 7(2-4): 19-127.