Embed Size (px)
Citation preview

New Abstract Form I:/forms/newblankabstractsheet (3/2002) Technical Report Documentation Page 1. Report No.
Research Report RC-1438 2. Government Accession No. 3. MDOT Project Manager
Roger Till
4. Title and Subtitle Durable Link Slabs for Jointless Bridge Decks Based on Strain-Hardening Cementitious Composites
5. Report Date November 16, 2003
7. Author(s) Victor C. Li (Principal Investigator)
G. Fischer, Y. Kim, M. Lepech, S. Qian, M. Weimann and S. Wang
6. Performing Organization Code
9. Performing Organization Name and Address The Advanced Civil Engineering Material Research Laboratory
Department of Civil and Environmental Engineering University of Michigan, Ann Arbor, MI 48109-2125, U. S. A.
8. Performing Org Report No.
10. Work Unit No. (TRAIS)
11. Contract Number: Master Contract #95-0242
12. Sponsoring Agency Name and Address Michigan Department of Transportation Construction and Technology Division P.O. Box 30049 Lansing, MI 48909
11(a). Authorization Number: Work Auth #12
13. Type of Report & Period Covered Nov.1,2001- Nov.16,2003
15. Supplementary Notes
14. Sponsoring Agency Code
16. Abstract The research presented herein describes the development of durable link slabs for jointless bridge decks based on strain-hardening cementitious composite - engineered cementitious composite (ECC). Specifically the superior ductility of ECC was utilized to accommodate bridge deck deformations imposed by girder deflection, concrete shrinkage, and temperature variations, providing a cost-effective solution to a number of deterioration problems associated with bridge deck joints. Current design concept of link slabs was first examined to form the basis of design for ECC link slabs. Microstructurally optimized ECC material, with good workability and satisfactory mechanical properties was then developed. After the material design, the shrinkage, shrinkage crack resistance and the freeze-thaw behavior of the pre-selected mix proportion was investigated and revealed excellent for the durability concern. Improved design of ECC link slab/concrete deck slab interface was confirmed in numerical analysis and further strengthened by excellent reinforcement pullout and shear stud pushout behavior in ECC. Based on the above findings, monotonic and subsequent cyclic tests of full-scale ECC link slab specimens were performed and compared with those of a conventional concrete link slab. It was revealed that the inherent tight crack width control of ECC decouples the dependency of crack width on the amount of reinforcement. This decoupling allows the simultaneous achievement of structural need (lower flexural stiffness of the link slab approaching the behavior of a hinge) and durability need (crack width control) of the link slab. Overall investigation supports the contention that durable jointless concrete bridge decks may be designed and constructed with ECC link slabs. Finally, a simple design guideline is presented. 17. Key Words ECC link slab, Jointless bridge deck, Strain-hardening, Durability, Crack width control
18. Distribution Statement No restrictions. This document is available to the public through the Michigan Department of Transportation.
19. Security Classification (report) Unclassified
20. Security Classification (Page) Unclassified
21. No of Pages 22. Price

Final Report on
Durable Link Slabs for Jointless Bridge Decks
Based on Strain-Hardening Cementitious Composites
By
Victor C. Li (Principal Investigator), G. Fischer, Y. Kim, M. Lepech, S. Qian, M. Weimann and S. Wang
The Advanced Civil Engineering Material Research Laboratory
Department of Civil and Environmental Engineering University of Michigan, Ann Arbor, MI 48109-2125, U. S. A.
Submitted to Michigan Department of Transportation
November 16, 2003
Research Sponsor: Michigan Department of Transportation MDOT Project Manager: Roger Till Award Reference No: Master Cont #95-0242 Wrk Auth #12 Contract Period: Nov. 1, 2001 – Nov.16, 2003

DISCLAIMER The contents of this report reflect the views of the authors, who are responsible
for the facts and accuracy of the information presented herein. This document is
disseminated under the sponsorship of the Michigan Department of Transportation, in the
interest of information exchange. The Michigan Department of Transportation assumes
no liability for the contents or use thereof.

Acknowledgments The presented research has been sponsored by the Michigan Department of
Transportation which is gratefully acknowledged. The authors thank the Michigan DOT
projector manager David Juntunen, Roger Till and other members of the MDOT
Research Advisory Panel for their useful comments, discussions and support.

i
Table of Contents
Table of Contents i
List of Tables i i
List of Figures i i i
1.0 Introduction-------------------------------------------------------------------------------------- 1
1.1 Background -----------------------------------------------------------------------------1
1.2 Goal and impact------------------------------------------------------------------------ 3
1.3 Overview --------------------------------------------------------------------------------4
2.0 Literature review --------------------------------------------------------------------------------4
2.1 Current design concept of link slabs-------------------------------------------------5
2.2 Analysis of current design procedure-----------------------------------------------10
3.0 ECC material design---------------------------------------------------------------------------13
3.1 Property Requirements of ECC for link slabs-------------------------------------13
3.2 Freeze-thaw durability consideration on design of ECC------------------------ 15
3.3 ECC designed for link slab application --------------------------------------------16
3.4 Long term tensile strain capacity ---------------------------------------------------20
4.0 Shrinkage and shrinkage crack resistance---------------------------------------------------21
4.1 Determination of free shrinkage properties ---------------------------------------22
4.2 Determination of restrained shrinkage properties --------------------------------25
5.0 Freeze-thaw durability ----------------------------------------------------------------------- 29
5.1 Pore size distribution ---------------------------------------------------------------- 29
5.2 Freeze-thaw exposure testing ------------------------------------------------------ 30
5.3 Tensile testing of freeze-thaw specimens ---------------------------------------- 35
5.4 Compression testing of freeze-thaw specimens----------------------------------36
6.0 Design of ECC link slab/concrete deck slab interface----------------------------------- 40
6.1 Conventional and improved interface design methods------------------------- 40
6.2 Analysis of bridge model----------------------------------------------------------- 42
7.0 Testing of ECC link slab/concrete deck slab interface ----------------------------------44

ii
7.1 Development length of reinforcements in ECC ---------------------------------45
7.1.1 Specimen design and experimental setup/procedure ----------------45
7.1.2 Pullout test results --------------------------------------------------------49
7.2 Lap splice length of reinforcements in ECC -------------------------------------51
7.3 Stud shear connection in ECC -----------------------------------------------------53
7.3.1 Experimental preparation and setup -----------------------------------53
7.3.2 Pushout behavior of concrete and ECC specimens ------------------55
7.3.3 Load capacity of stud shear connection in concrete and ECC ------58
8.0 Laboratory testing of ECC link slab --------------------------------------------------------59
8.1 Design of test specimens ------------------------------------------------------------59
8.2 Experimental setup and procedure -------------------------------------------------65
8.3 Monotonic Behavior of Link Slab Specimens ----------------------------------- 68
8.4 Fatigue crack resistance ------------------------------------------------------------- 74
8.5 Conclusions from laboratory testing of ECC link slab --------------------------78
9.0 Design Guideline of ECC link slab ---------------------------------------------------------81
10.0 Conclusions ---------------------------------------------------------------------------------- 87
11.0 Appendix --------------------------------------------------------------------------------------90
11.1 Non-Linear Sectional Analysis ----------------------------------------------------90
11.2 Simplified Loading of Bridge Span----------------------------------------- 92
12.0 References-------------------------------------------------------------------------------------94
List of Tables
Table 3.1 ECC mix proportions by weight -----------------------------------------------16
Table 3.2 PVA-ECC initial tensile test results -------------------------------------------19
Table 3.3 Mix proportion of Mix 45 ECC by weight in a cubic yard -----------------19
Table 3.4 Tensile Strain Capacity Development of M45 ECC ------------------------20
Table 5.1 ECC and reference concrete mix designs (lb/yd3) --------------------------31
Table 5.2 Freeze-thaw tensile test results -------------------------------------------------36
Table 5.3 Freeze-thaw and fog room curing compressive strength -------------------37
Table 7.1 Mix Proportion of ECC and concrete by weight and compressive strength
(fiber by volume) ---------------------------------------------------------------- 45

iii
Table 7.2 Calculated, measured strength, and slip capacity of a stud in concrete and
ECC --------------------------------------------------------------------------------59
Table 8.1 Comparison between laboratory testing condition and field condition--- 67
List of Figures
Figure 1.1 Typical tensile strain-stress behavior of ECC ------------------- ------------- 2
Figure 2.1 Simplified geometry and loading of two-span bridge structure -------------5
Figure 2.2 Cross-sectional dimensions and reinforcement of link slab in uncracked
condition - --------------------------------------------------------------------------6
Figure 2.3 Deformed shape of link slab at imposed rotation angle θ --------------------6
Figure 2.4 Cross-sectional dimensions and reinforcement of link slab in cracked
condition --------------------------------------------------------------------------- 7
Figure 2.5 Stress in longitudinal reinforcement at expected rotation angle as a
function of reinforcement ratio --------------------------------------------------9
Figure 2.6 Stress state in link slab at imposed rotation angle θ ------------------------ 10
Figure 2.7 Analogous deformation controlled element in tension ----------------------11
Figure 2.8 Moment rotation relationship of link slab element -------------------------12
Figure 3.1 Permeability coefficient as a function of crack width -----------------------14
Figure 3.2 Schematical simply supported two span bridge with jointless deck
(Assuming hinge-roller-roller-hinge support) ------------------------------- 14
Figure 3.3 Particle size distributions of solids -------------------------------------------- 17
Figure 3.4 Representative tensile stress-strain behavior of ECC (M34 and M45) ---18
Figure 3.5 Tensile stress-strain and crack width-strain curves for ECC M45 ------- -18
Figure 3.6 Demonstrations of ECC workability in patching of a bridge deck for
(a) mixing in a 12ft3 capacity drum mixer; and (b) pouring without any
vibration ---------------------------------------------------------------------------20
Figure 3.7 Typical stress-strain curve for M45 ECC at 6 months---------------------- 21
Figure 3.8 Tensile strain capacity development of M45 ECC---------------------------21
Figure 4.1 Specimen dimensions and test setup ------------------------------------------ 22
Figure 4.2 Drying shrinkage as a function of relative humidity------------------------ 23
Figure 4.3 Mean annual relative humidity in the U.S.A. (AASHTO, 1996) ----------24

iv
Figure 4.4 Test setup for measurement of the crack width of restrained shrinkage---26
Figure 4.5a Dimension of test specimen (plan view) --------------------------------------26
Figure 4.5b Dimension of test specimen (side view section A-A) -----------------------27
Figure 4.6 Average crack width development over time (obtained from ring tests) -28
Figure 4.7 Permeability coefficient as a function of crack width (from Wang et al.,
1997) -------------------------------------------------------------------------------29
Figure 5.1 ECC pore size distribution ------------------------------------------------------30
Figure 5.2 Freeze-Thaw test results showing (a) dynamic modulus, and (b) relative
dynamic modulus ---------------------------------------------------------------- 32
Figure 5.3 Regular Concrete Normal Curing and Freeze-Thaw Specimens---------- 33
Figure 5.4. M34 ECC Normal Curing and Freeze-Thaw Specimens------------------ 34
Figure 5.5 M45 ECC normal curing and Freeze-Thaw specimens ---------------------34
Figure 5.6 M45LA ECC normal curing and Freeze-Thaw specimens -----------------35
Figure 5.7 Stress-Strain Curve for ECC Normal Curing and Freeze-Thaw Specimens
---------------------------------------------------------------------------------------36
Figure 5.8 Comparison between (a) M45LA Freeze-thaw specimen: and
(b) M45LA fog room curing specimen after compression testing ---------37
Figure 5.9 Concrete compressive strength vs. maturity (Mindess, 1981) -------------39
Figure 6.1 Comparison of interface design in LS between (a) conventional method
and (b) improved method -------------------------------------------------------41
Figure 6.2 Model of the bridge (close look at the link slab) -----------------------------42
Figure 6.3 Normalized envelope stress developed at the top surface of link slab--44
Figure 7.1 Exposed reinforcements before patch repair ---------------------------------46
Figure 7.2 Exposed No.3 reinforcementand threaded bars of pullout specimen before
casting-----------------------------------------------------------------------------47
Figure 7.3 Pullout test setup -----------------------------------------------------------------48
Figure 7.4 LVDTs attached to the reinforcement for measurement of pullout
displacement-----------------------------------------------------------------------48

v
Figure 7.5 Comparison of pul lout load-displacement curves for No. 3
reinforcement(a) in concrete; (b) in ECC; and (c) No. 3 epoxy-coated
reinforcement in ECC, with 6 inch embedment length (where yield load
corresponds to the yield strength of bare steel reinforcement) -------------50
Figure 7.6 Lap splice of bars in concrete (J. G. MacGregor, 1998) -------------------52
Figure 7.7 Comparison of pullout failure modes between ECC and concrete
specimen --------------------------------------------------------------------------53
Figure 7.8 Geometry of a shear stud -------------------------------------------------------53
Figure 7.9 Geometry of the pushout specimen (unit: inch) -----------------------------54
Figure 7.10 Setup of pushout tests and close view of LVDTs --------------------------- 55
Figure 7.11 Comparison of pushout load per stud–average slip curves for specimens
made of (a) concrete; (b) ECC M45+; (c) ECC M45----------------------- 56
Figure 7.12 Macro cracks developed in concrete pushout specimen show a brittle
failure mode---------------------------------------------------------------------- 57
Figure 7.13 Microcracks developed outside (left) and inside (right, cut section along
shear stud) of ECC specimen ------------------------------------------------ 57
Figure 8.1 Schematics of two span bridge subjected to point load at midspan for (a)
deformed shape of bridges; and (b) moment distribution on bridge span
and corresponding deformed shape of link slab region ---------------------61
Figure 8.2 Geometry of link slab specimens for (a) LS-1; (a) LS-2; and (b) LS-3 ---62
Figure 8.3 Required minimum reinforcement ratio 0.013 (0.014 used in the test)
designed at expected rotation angle (0.0015rad) -----------------------------63
Figure 8.4 Laboratory test setup and instrumentation of specimen -------------------- 66
Figure 8.5 Loading sequence, in which the midspan deflections at step4 corresponds
to the load at the reinforcement stress equal to 0.4σy in specimen LS-1--67
Figure 8.6 Applied load vs. midspan deflection curves during pre-loading test (step1:
0.06in., step2: 0.10in., step3: 0.14in., step4: 0.185in., and step5: 0.375in.
in midspan deflection) on (a) LS-1; (b) LS-2; and (c) LS-3 --------------- 69

vi
Figure 8.7 Strain distribution measured at three data points across the midspan
section at each loading step (step1: 0.06in., step2: 0.10in., step3: 0.14in.,
step4: 0.185in., and step5: 0.375in. in midspan deflection) for (a) LS-1; (b)
LS-2; and (c) LS-3 ---------------------------------------------------------------70
Figure 8.8 Compatible deformation between ECC and steel reinforcement (right)
showing microcracking in ECC with load transmitted via bridging fibers.
In contrast, the brittle fracture of concrete in normal R/C (left) causes
unloading of concrete, resulting in high interfacial shear and bond
breakage (Fischer and Li, 2002) -----------------------------------------------72
Figure 8.9 Comparison of reinforcementstress in between R/C beam and R/ECC
beam with the same geometry and reinforcement ratio at identical rotation
angle,θ, and curvature, Φ -------------------------------------------------------73
Figure 8.10 The response of midspan deflection vs. actuator force (load) behavior to
cyclic deflection during cyclic test on specimen LS-3 ----------------------74
Figure 8.11 Stiffness change and crack width evolution of link slab specimens during
cyclic test -------------------------------------------------------------------------75
Figure 8.12 Crack pattern marked with magic ink pen after cyclic test for (a) LS-1; (b)
LS-2 and (b) LS-3 ----------------------------------------------------------------77
Figure 8.13 Crack pattern marked with magic ink pen at interface zone for (a) LS-2;
and (b) LS-3 ----------------------------------------------------------------------79
Figure 9.1 Simplified geometry and loading of two-span bridge structure -----------83
Figure 9.2 Cross-sectional dimensions and reinforcement of link slab in uncracked
condition -------------------------------------------------------------------------84
Figure 9.3 Deformed shape of link slab at imposed rotation angle θ -----------------84
Figure 9.4 Schematic stress and strain profile in a cross section of link slab for
calculation of required longitudinal reinforcement ratio (profile of R/C is
shown for comparison) -------------------------------------------------------- 85
Figure 9.5 Design chart for required longitudinal reinforcement ratio ----------------86
Figure 9.6 Conceptual illustration of the interface design between ECC link slab and
concrete deck ---------------------------------------------------------------------87

vii
Figure 11.1 Strain and stress profile in a cross section of ECC link slab for calculation
of required longitudinal reinforcement ratio/moment capacity ------------90
Figure 11.2 Schematics of two span simply supported bridge and loading for (a)
resultant of HS-20, and (b) HS-20 ---------------------------------------------93

1
1.0 Introduction
1.1 Background
Many highway bridges are composed of multiple span steel or prestressed
concrete girders simply supported at piers or bents. The girders support cast-in-place
concrete decks. A mechanical joint is typically employed at the end of the simple span
deck to allow deck deformations imposed by girder deflection, concrete shrinkage, and
temperature variations. It is well known that bridge deck joints are expensive to install
and maintain. Deterioration of joint functionality due to debris accumulation can lead to
severe damage in the bridge deck and substructure. The durability of beam ends, girder
bearings, and supporting structures can be compromised by water leakage and flow of
deicing chemicals through the joints. A significant negative economic impact of
mechanical joints in all phases of bridge service life, from design to construction and
maintenance, was documented by Wolde-Tinsae and Klinger (1987). A possible
approach to alleviate this problem is the elimination of mechanical deck joints in
multispan bridges.
Two solutions to elimination of deck joints have been attempted in the US,
specifically an integral construction concept with girder continuity and a jointless bridge
deck concept with simply supported girders. Alampalli and Yannotti (1998) found that
the jointless deck construction practice is generally more efficient than the integral bridge
construction practice. Based on field inspection of 105 jointless bridge decks, including
72 with concrete superstructures and 33 with steel superstructures, it was found that the
bridges were functioning as designed without significant problems except for minor deck
cracking. The performance of the jointless decks was inferior in bridges with concrete
superstructures, with 12 out of 72 decks receiving condition rating of 4. While further
improvement on jointless bridge deck construction practice was recommended, Alampalli
and Yannotti concluded that as a group, they generally perform better than decks with
joints.
The section of the deck connecting the two adjacent simple-span girders is called
the link slab. Caner and Zia (1998) experimentally analyzed the performance of jointless
bridge decks and proposed design methods for the link slab. These investigations
revealed that the link slab was subjected to bending under typical traffic conditions rather

2
than axial elongation. Tensile cracks were observed at the top of the link slab under
service conditions due to a negative bending moment. For steel girders, the measured
maximum crack width was 0.012” at 40% of ultimate load and 0.030” at 67% of ultimate
load. They pointed out that additional tensile stress may be imposed on the link slabs due
to shrinkage, creep, and temperature loading, and that crack width must be carefully
controlled. The recommendation was to use epoxy coated reinforcing bars in the link
slab in order to avoid reinforcement corrosion. To reduce the stiffness of the link slab,
debonding of the link slab over the girder joint for a length equal to 5% of each girder
span was also recommended. This link slab concept can be used for new bridge decks
and also for replacement of deteriorated joints of existing bridge decks.
Figure 1.1 Typical tensile stress-strain behavior of ECC Engineered Cementitious Composite (ECC) is a high performance fiber
reinforced cementitious composite designed to resist tensile and shear force while
retaining compatibility with normal concrete in almost all other respects (Li, 2002).
Figure1.1 shows the uniaxial tensile stress-strain curve of an ECC reinforced with Poly-
vinyl Alcohol (PVA) fiber. After first cracking, the composite undergoes plastic yielding
and strain-hardening to a tensile strain of 3.5% prior to developing a macroscopic crack.
The tensile strain capacity of ECC is about 350 times that of normal concrete (0.01%).
ECC achieves strain-hardening with moderate amount of fibers (typically less than or
equal to 2% by volume) compared to other high performance fiber reinforced concrete.
0
200
400
600
800
1000
0 1 2 3 4
Strain, ε (%)
Stre
ss,
σ (p
si)
Schematic curve for concrete (0.01%, 10 times enlarged)

3
This is particularly important for practical field applications, where the mixing process
must be simple and similar to that used in mixing and placing conventional concrete. As
confirmed by studies on self-compacting ECC (Kong et al, 2003) and sprayable ECC
(Kim et al, 2003), the fresh properties of ECC can be adjusted by optimizing the
composition of ECC for given workability requirements. Thus, the introduction of ECC
to link slab construction is proposed for its ability to control crack widths and its
processing flexibility.
1.2 Goal and impact
The goal of this research is to provide a cost-effective solution to bridge deck
deterioration problems associated with joints, by developing durable and maintenance-
free ECC link slabs used in jointless bridge decks. To achieve this goal, a number of
requirements must be met. These include the design of ECC with properties satisfying
mechanical requirements in the link slab under normal service and environmental loading
conditions, and assuring the durability of the link slab, including the interface between
ECC link slab and concrete bridge deck.
The effective use of ECC link slabs for retrofitting simple span bridges is
expected to remedy a number of deterioration problems experienced by Michigan bridges,
particularly those related to bridge deck joints. It is expected that the high resistance to
cracking in ECC and its ability to accommodate deformation imposed by shrinkage,
thermal variation, and live load will lead to crack free decks, effectively prolonging the
life of bridge decks while minimizing the cost and inconvenience to the motorist public
of continual maintenance.
The research program is expected to significantly impact the aged infrastructure
locally and nationally. It directly addresses Item 2 (Methods to eliminate or improve
bridge joints) identified as focus areas beneficial to the Michigan Department of
Transportation (MDOT) in the document entitled “Strategic Research Program for Next
Five Years – Bridges and Structures”. The proposed research also contributes to
addressing Item 5 (Methods to increase life of bridge decks from 30 years to 75 years)
and Item 7 (High performance concrete). Furthermore, according to Federal Highway
Administration (FHWA) officials, 42% of the highway bridges in the USA should be

4
urgently rehabilitated, and the cost of rehabilitation is estimated at $50 billion by the year
2010 (Ashley, 1996). The cost effective, maintenance-free ECC link slab may greatly
improve the durability and service life of the country’s bridges.
1.3 Overview
In Section 2, current design concept of link slabs will be discussed and examined.
This information will form the basis of design for new link slabs by taking into account
the superior ductility of the ECC material. For the ECC material design, property
requirements of ECC for link slabs, particularly the tensile strain capacity, will first be
determined, providing input for micromechanical design of ECC. As a result,
microstructurally optimized ECC material, with good workability and satisfactory
mechanical properties, will be available for use for link slabs. This part of work will be
presented in Section 3. After the material design, the shrinkage, shrinkage crack
resistance and the freeze-thaw durability of the pre-selected mix proportion will be
investigated for the durability concern in Section 4 and 5, respectively.
The interface between ECC and concrete may form a weak link since the fibers in
the ECC cannot penetrate the concrete. To address this potential problem, Section 6 and
7 will focus on the design and testing of ECC link slab/concrete deck slab interface. To
reduce interfacial stress, special attention will be placed on strengthening measures, such
as extension of shear studs into ECC link slab and lap splice of the existing longitudinal
reinforcements with new reinforcing bars within the ECC link slab.
Based on the above findings, monotonic and subsequent cyclic tests of full-scale
ECC link slab specimens were performed. The test results were compared with those of a
conventional concrete link slab. The mode of deformation, fatigue cracking resistance,
and design of link slab associated with the development of reinforcement stress and crack
width, will be discussed in Section 8, followed by design guidelines of ECC link slabs in
Section 9. The overall conclusions will be presented in Section 10.
2.0 Literature review of current link slab design concept
The assessment of current link slab design concepts is primarily based on a
previous investigation carried out by Caner and Zia (1998). This design procedure has

5
been adopted by MDOT for laboratory investigations as well as for field applications. In
addition, design recommendations from an FHWA report (Oesterle et al., 1999) are
reviewed. Although the design procedure as recommended by FHWA report is not
adopted in its entirety by MDOT, it will be included in this document.
2.1 Current design concept of link slabs (Caner and Zia, 1998)
The design concept for a reinforced concrete link slab with two identical adjacent
spans outlined in Caner and Zia (1998) will be summarized in the following.
Notation of live load, geometry and material properties:
As = Total area of longitudinal reinforcement in link slab
Bls = Width of link slab
Ec = Elastic modulus of concrete
Hls = Height of link slab
Ils,cr = Moment of inertia of link slab (cracked)
Ils,g = Moment of inertia of link slab (uncracked)
Isp = Moment of inertia of span (girder and concrete deck)
Ldz = Debond zone length = (5% of span length) x 2
Lsp = Span length (assuming same length for adjacent spans)
P = Live load
σcr = Flexural tensile strength of concrete
Step 1 Determine end rotation angle of spans θ
Figure 2.1 Simplified geometry and loading of two-span bridge structure
P P
θ θ
Lsp, Isp Lsp, Isp

6
The rotation angle θ is a function of the geometry of the spans, their loading, and
material properties. Assuming both spans are simply supported, the rotation angle can be
derived as
spC
sp
IEPL
16
2
=θ . (Eq. 2-1)
Step 2 Determine moment of inertia of link slab (uncracked)
Figure 2.2 Cross-sectional dimensions and reinforcement of link slab in uncracked condition
The moment of inertia of the link slab in the uncracked conditions is a function of
the cross-sectional geometry and independent of the reinforcement ratio lslss HBA /=ρ .
12
3
,lsls
glsHBI = . (Eq. 2-2)
Step 3 Determine moment Ma developed in the link slab at rotation angle θ
Figure 2.3 Deformed shape of link slab at imposed rotation angle θ
The moment developed in the uncracked link slab is a function of the material
properties and geometrical dimensions. It is proportional to the imposed rotation angle θ.
θ
Ldz, Ils,g
Hls θ
Bls
Hls
As
d

7
θdz
glsCa L
IEM ,2
= (Eq. 2-3)
Step 4 Determine cracking moment Mcr in link slab
The cracking moment Mcr is a function of the first cracking strength of the
cementitious material used in this particular link slab with given geometry.
62
2, lsls
crls
glscrcr
HBH
IM σ
σ== . (Eq. 2-4)
Compare applied moment Ma to cracking moment Mcr.
Step 5 Select reasonable longitudinal reinforcement ratio ρ = 0.01
Step 6 Determine cracked moment of inertia Icr
Figure 2.4 Cross-sectional dimensions and reinforcement of link slab in cracked condition
The cracked moment of inertia results from contributions of the uncracked portion
below the neutral axis, of the reinforcement itself, and from the eccentricity of the
reinforcement with respect to the neutral axis. With
C
S
EEn = (Eq. 2-5)
and
( ) ( )ρρρ nnnk 22 ++−= (Eq. 2-6)
Bls
Hls
As
d kd
Neutral axis

8
follows
( ) ( )
( ) ( )23
223
,
3
212
kddnAkdB
kddnAkdkdBkdB
I
sls
slsls
crls
−+=
−+⎟⎠⎞
⎜⎝⎛+=
. (Eq. 2-7)
The cracked moment of inertia is a function of the cross-sectional dimensions as
well as of the reinforcement ratio ρ. Assuming a fixed position of the neutral axis and
elastic material behavior, it will remain constant at increasing rotation angles θ.
Step 7 Determine stress in longitudinal reinforcement σs and compare with
allowable stress 0.40σy
The stress in the link slab reinforcement σs as derived in Caner and Zia (1998) is
expressed as
( ) ⎟⎠⎞
⎜⎝⎛ ⎟
⎠⎞⎜
⎝⎛ +−+
=ρρρργ
σσnnnM
M cr
cr
as
23116 22
. (Eq. 2-8)
This expression indicates a dependency of the stress in the reinforcement on the
ratio of applied moment Ma to the cracking moment of the link slab Mcr. However, with
lsHd
=γ (Eq. 2-9)
follows
y
s
dz
glsC
s
a
s
lslscr
cr
a
lslsls
s
cr
cr
as
kddA
LIE
kddA
M
kddA
HB
MM
kHd
HBAM
M
σθ
σ
γ
σσ
40.0
31
2
31
316
3116
,
2
2
≤⎟⎠⎞
⎜⎝⎛ −
=⎟⎠⎞
⎜⎝⎛ −
=
⎟⎠⎞
⎜⎝⎛ −
=
⎟⎠⎞
⎜⎝⎛ −⎟⎟
⎠
⎞⎜⎜⎝
⎛=
(Eq. 2-10)

9
In order to satisfy this condition (σs < 0.40σy), the amount of reinforcement As,
i.e. the reinforcement ratio ρ, is to be adjusted (Figure 2.5). Although the ratio of applied
moment Ma to cracking moment Mcr apparently enters the expression, the cracking
moment ultimately cancels out and does not affect the stress in the longitudinal
reinforcement. Note that in this expression, only the denominator is a function of the
reinforcement ratio, while the numerator, i.e. the applied moment Ma, is independent of
the amount of reinforcement provided.
Stress in reinforcement at rotation angle 0.0015rad
0.0
20.0
40.0
60.0
80.0
100.0
120.0
140.0
160.0
180.0
0.000 0.002 0.004 0.006 0.008 0.010 0.012 0.014 0.016 0.018 0.020
Reinforcement ratio
Stre
ss [k
si]
24ksi = 0.40 yield strength
Figure 2.5 Stress in longitudinal reinforcement at expected rotation angle as a function of
reinforcement ratio
Step 8 Check surface crack width criterion (w < wmax)
Besides the stress limit state described above, the current design procedure also
limits the maximum crack width at the top of the link slab. The expected crack width is a
function of the stress in the reinforcement as determined in Step 7 as well as a function of
the geometry of the link slab. The following expression has been adopted from Gergely
and Lutz (1968).
3076.0 Adw csβσ= [0.001 in], (Eq. 2-11)
ρmin according to current limit stress criterion

10
with
dHkdH
ls
ls
−−
=β , (Eq. 2-12)
dc = concrete cover depth [in],
A = effective concrete area per reinforcing bar [in2]
In addition to the crack width criterion adopted in this design guideline (Caner
and Zia, 1998), FHWA recommends a minimum reinforcement ratio ρ=0.015 with a clear
cover of 2.5in for the purpose of controlling the crack width in the link slab.
In essence, the design criteria of this procedure are the stress in the reinforcement
σs at an expected rotation angle θ and the maximum crack width wmax at the tension face
of the link slab.
2.2 Analysis of current design procedure
The derivation of the stress in the reinforcement σs as described above is
conservative, yet incorrect since the expected applied moment Ma is determined
assuming an uncracked link slab, which is consequently relatively stiff and will develop a
relatively large moment at a given imposed rotation angle. The link slab is then designed
to resist the moment Ma in the cracked condition, however, the reinforcement ratio ρ is
chosen for an expected moment Ma in the uncracked condition.
The dependency of link slab deformation and maximum stress experienced within
the structural element can be explained as follows (Figure 2.6).
Figure 2.6 Stress state in link slab at imposed rotation angle θ
θ θ
Ldz, Ils,g
Hls
σmax
σmin
Imposed rotation angle

11
The moment Mls developed in the link slab at a given rotation angle θ is dependent on
the moment of inertia Ils,g of the link slab.
θdz
glsls L
IEM ,2
= . (Eq. 2-13)
The maximum stress in the link slab at a moment Mls is also a function of Ils,g
gls
lsls
IHM
,max 2
=σ . (Eq. 2-14)
Combining these two expressions results in
θσdz
ls
LHE=max , (Eq. 2-15)
which indicates that the stress in the link slab is independent of the moment of
inertia of the link slab with a given height Hls. This means that a link slab with a high
stiffness (large Ils,g) will develop a relatively large moment Mls at a given rotation angle θ
while a link slab with a low stiffness (small Ils,g) will develop a relatively small moment
Mls at the same rotation angle θ. However, the stress in both link slabs is identical at a
given rotation angle θ.
This can be further illustrated using an analogous deformation controlled element
in tension (Figure 2.7).
Figure 2.7 Analogous deformation controlled element in tension
Considering a single steel bar fixed at both ends and elongated by a given
displacement u, the applied load P to achieve this deformation can be expressed as
u P1
L, A
1
u Px
L, A
x

12
uL
EAP 11 = . (Eq. 2-16)
Considering a second configuration with x number of steel bars, the applied load
is proportionally higher than that in the case of one reinforcementdue to the larger
reinforcement ratio ρ of this configuration.
uL
EAP xx = , (Eq. 2-17)
However, the stress in the reinforcementσ in both cases can be determined as
uL
EAP
AP
x
x 1
1
1 ===σ , (Eq. 2-18)
which is independent of the area of the reinforcement Ax, i.e. independent of the
reinforcement ratio ρ.
Thus, the stress in the reinforcement σ is not a suitable criterion to determine the
reinforcement ratio required in the design of this example configuration as well as in the
design of a link slab.
The effect of using the uncracked moment of inertia Ils,g instead of the cracked
moment of inertia Ils,cr on the derivation of the moment Ma in the link slab at an expected
rotation angle θexp can be visualized in the following graph (Figure 2.8).
Figure 2.8 Moment rotation relationship of link slab element
Actual moment
Design moment Ils,g
Ils,cr
θexp θ
Ma,cr
Ma,g
M
Mcr

13
By assuming the link slab in an uncracked condition, the design moment Ma at the
expected rotation angle θexp far exceeds the actual moment Ma,cr that the link slab
develops at this angle in the cracked condition. This leads to an overestimation of the
required amount of longitudinal reinforcement in the link slab to satisfy the limit stress
criterion.
A more appropriate link slab design guideline is given in Section 9.
3.0 ECC material design
3.1 Property Requirements of ECC for link slabs
For material selection based on the Integrated Structure-Material Design concept
(Li and Fischer, 2002), property requirements of ECC material for link slabs were
examined prior to material design. A minimum compressive strength of 4,500 psi was
adopted on the basis of the compressive strength requirement of concrete in bridge deck
slabs (MDOT guideline). Current AASHTO Standard Specifications for Highway
Bridges (AASHTO code hereafter) provide a maximum permissible crack width of
0.013” in reinforced concrete bridge decks in severe exposure conditions. The influence
of reduced crack width on the permeability of water contaminated by harmful substances,
such as chlorides introduced by deicing salt, can be evaluated using reference data (Wang
et al, 1997). The data in Figure 3.1 indicate that for crack widths below 0.004”, the
permeability coefficient remains relatively small and constant (10-9in./s). At increasing
crack widths however, the permeability coefficient increases rapidly and reaches values
four orders of magnitudes higher (10-5in./s at 0.013” crack width). Therefore, the desired
crack width in ECC was minimized to less than 0.004” to approach transport properties
of sound uncracked concrete for corrosion resistance of reinforcements.
Assuming a 5% debond length between deck and girder at the end of each bridge
span, of length Lsp, as shown in Figure 3.2, the strain capacity (εls) of the ECC link slab
needed to accommodate the movement imposed by a ∆T = 90°F temperature variation
can be calculated using Eq.3-1. The shrinkage strain, εsh (~0.1%, Section 4), and the
maximum tensile strain, εLL (< 0.1%, Section 8), in the link slab due to the imposed

14
bending moment from the end rotations caused by live loading of adjacent spans are also
taken into account.
%37.1001.0001.01.0
2900000065.02≈++
⋅
××=++
⋅∆⋅=
sp
spLLsh
dz
spTls L
LL
LTεε
αε (Eq. 3-1)
where αT is the coefficient of thermal expansion of steel. With a safety factor of two, the
minimum required tensile strain capacity of ECC material was estimated to be 2.74% for
link slab applications. It is worth mentioning that this value is only valid for the worst
case, i.e., hinge-roller-roller-hinge support, while for other cases, the tensile strain
capacity requirement may be greatly reduced. It is noted that much of the tensile strain
capacity demand in Eq. (3-1) comes from temperature induced deformation of the bridge
deck.
Figure 3.1 Permeability coefficient as a function of crack width.
Figure 3.2 Schematical simply supported two span bridge with jointless deck (Assuming hinge- roller-roller-hinge support)
1.0E-10
1.0E-08
1.0E-06
1.0E-04
1.0E-02
1.0E+00
0 0.005 0.01 0.015 0.02 Crack Opening Displacement COD (in.)
Permissible crack width by AASHTO
Permissible crackwidth in this study
Perm
eabi
lity
Coe
ffic
ient
k (i
n./s
)
Lsp Lsp
Ldz = (5%Lsp) x 2

15
3.2 Freeze-thaw durability consideration on design of ECC
Besides above considerations on property requirement of ECC for link slab, the
freeze-thaw durability concern needs to be addressed since this is critical for successful
implementation of ECC link slab in Michigan.
The most important factor leading to freeze-thaw resistance in both plain
concrete and fiber-reinforced composites is air entrainment. By providing space for
freezing water to expand, resistance to freezing and thawing cycles can be dramatically
improved. However, the types of air voids provided must be correctly sized and spaced
to allow for entrapped water to expand and also permeate out of the matrix when
necessary. From numerous studies, and according to ASTM 457-71, the critical spacing
for these voids is shown to be less than 0.008”. The critical size of the voids, however,
can vary. For plain concrete, voids approximately 0.040” in diameter appear to impart
good freeze-thaw resistance, however it has been shown that these voids are difficult to
produce when using super-plasticized mortar. Litvan (1983), and Cheng-yi and Feldman
(1985) found that when using superplasticizer, much smaller air voids ranging from
0.0001” to 0.0008” become critical in maintaining freeze-thaw resistance. Therefore the
ECC design criteria focused on forming both large air voids (0.040” diameter) and small
air voids (0.0004” diameter).
There are a number of techniques for entraining the desired air voids mentioned
above into fiber-reinforced mortars such as ECC. First among these is the addition of fly
ash to the mortar (Cheng-yi and Feldman 1985). During mixing and hydration, calcium
hydroxide present in the cement accumulates in interface regions surrounding the
aggregates and fibers. Fly ash reacts with the calcium hydroxide to create a boundary
zone filled with small pores approximately 0.0004” diameter.
A second method for entraining air is using diatomaceous earth or clay as filler in
the matrix. Micro-pores present in the clay provide the void spaces necessary for freeze-
thaw protection. However, using clay has proven difficult due the tendency of the clay
particles to absorb large amounts of mixing water and drastically altering the fresh and
hardened properties of the matrix. Finally, introduction of the fiber itself into the mixing
process entrains large amounts of air. The mechanical action of the fibers stiffening the
fresh mortar allow it to form large air voids and maintain them throughout mixing,

16
casting, and hydration. Air contents around 15% have been observed when mixing
mortar with steel fibers (Pigeon et al., 1996).
3.3 ECC designed for link slab application
Based on the property requirements of ECC material aforementioned, design of
ECC has focused on achieving high tensile ductility, good durability and workability. A
number of mix proportions were attempted using the above design criteria and are
summarized in Table 3.1. Using both fly ash and clay in three of the four initial mixes,
an acceptable amount of air entrainment is possible. However, in Mix 31, 32, and 33 the
ECC was so viscous that it was difficult to pour. This is likely due to the clay absorbing
much of the mixing water resulting in poor flowability and a need for more
superplasticizer. Finally, use of clay was abandoned and both the water and
superplasticizer were reduced for the initial test mix, Mix 34. Further work on the ECC
design for the second round of freeze-thaw testing yielded a further increase in the
amount of fly ash to promote formation of small air voids with an accompanying increase
of water for both hydration and flowability of the ECC when casting (Mix 45).
Table 3.1 ECC Mix Proportions by Weight
Mix No. Vf (%) Cement Water Sand Fly Ash MC SP Clay M31 2.0 1.0 0.43 0.8 0.5 0.001 0.03 0.1 M32 2.0 1.0 0.48 0.8 0.6 0.001 0.04 0.2 M33 2.0 1.0 0.48 0.8 0.8 0.001 0.04 0.05 M34 2.0 1.0 0.44 1.0 0.8 0.001 0.02 0.0 M45 2.0 1.0 0.53 0.8 1.2 0.0 0.03 0.0
(MC: Methyl Cellulose, SP: Superplasticizer) Furthermore, a dense microstructure of the particle system was achieved in this
study by optimizing the particle size distribution of the composite and maintaining a
comparable size distribution of different particles. Particularly, a type F fly ash was
chosen due to its comparable size distribution with cement and sand used in the
investigation. The particle size distributions of the individual solids used in this study are
given in Figure 3.3.

17
0
10
20
30
40
50
60
70
80
90
100
0.001 0.01 0.1 1 10 100
Particle diameter (mil, logarithmic scale)
Cum
ulat
ive
fract
ion
(%)
Cement
Sand
Fly ash
Figure 3.3 Particle size distributions of solids
As shown in Figure 3.4, both ECC proportions used for testing, Mix 34 and Mix
45 exhibited a strain capacity around 3.5% before freeze-thaw exposure (Table 3.2).
Therefore, the expected maximum imposed strain (2.74% with a safety factor of two)
remains within the strain-hardening regime of these ECCs, with microcrack widths
maintained below 0.003”. The tensile stress-strain and crack width-strain curves for a
ECC M45 specimen is shown in Figure 3.5, where the crack width increases in the initial
stage and then remains constant during the steady state cracking stage. Mechanical
properties for Mixes 31, 32, and 33 were not determined since these mixes were too
difficult to mix and are deemed not suitable. Likewise, these three mixes were not
subjected to the extensive freeze-thaw testing regimen (Section 5).
(0.001”, logarithmic scale)

18
0
200
400
600
800
1000
0 1 2 3 4
Figure 3.4 Representative tensile stress-strain curves of ECC M34 and M45
0
100
200
300
400
500
600
700
800
0 1 2 3 4 5Strain (%)
Stre
ss (p
si)
0
1
2
3
4C
rack
wid
th (m
il)
Stress-Strain Crack Width Curve Fitting
Figure 3.5 Tensile stress-strain and crack width-strain curves for ECC M45.
0
200
400
600
800
1000
0 1 2 3 4
Tensile strain, ε (%)
Tens
ile s
tress
, σ (p
si)
Tens
ilest
ress
,σ(p
si)
Tensile strain, ε (%)
M34
M45
Cra
ck w
idth
(0.0
01”)

19
Table 3.2 PVA-ECC Initial Tensile Test Results Mix No.
First cracking strength (psi)
Ultimate strength (psi)
Ultimate strain (%)
M31 508 ± 46 653 ± 36 1.2 ± 0.44 M32 450 ± 38 609 ± 22 0.8 ± 0.28 M33 566 ± 45 667 ± 33 1.7 ± 0.39 M34 580 ± 22 725 ± 44 3.6 ± 0.44 M45 580 ± 32 841 ± 54 3.7 ± 0.35
(± means standard deviation of three specimens tested for each mix proportion. Unless otherwise stated, it remains the same throughout the report)
Table 3.3 Mix Proportion of Mix 45 ECC by weight in a cubic yard (Unit: lb/yard3)
Mix C W S FA SP Fiber M45 983 502 787 1,180 29 44
(C: Type I normal Portland cement produced by LaFarge; W: water; S: silica sands named SILICA SAND F-110 Natural Grain from U.S. Silica co.; FA: a Type F fly ash from Boral Material Technology; SP: Superplasticizer from W.R. Grace & Co. named Daracem ML330; Fiber: a type of poly(vinyl alcohol) fiber (PVA fiber), KURALON K-II REC15, developed by Kurary Co., LTD (Japan) in collaboration with ACE-MRL)
A uniaxial tensile test was carried out to characterize the tensile behavior of ECC.
The coupon specimen dimensions used herein were 12”x 3”x 0.5”. Aluminum plates
were glued at the end of the coupon specimen to facilitate gripping. Tests were
conducted in an MTS machine with a 5.6 kip capacity under displacement control. The
loading rate was 0.2mil/s throughout the test. Two external linear variable displacement
transducers (LVDTs) were mounted to specimen surface with a gage length
approximately 7 inch to measure the displacement. Further test configuration details can
be found in the literature (Li et al, 1996).
As shown in Table 3.2, tensile strain capacity of ECC M45 (which was finally
chosen as the ECC mix for link slab applications) can meet and exceed the deformation
requirement of a link slab. Furthermore, the compressive strength of ECC M45 cured in
air is around 8700 psi, well above 4500 psi acceptable for a bridge deck. The mix
proportion of M45 by weight in a cubic yard is shown in Table 3.3. In addition to the
hardened properties, the mixing process and workability are also critical for practical
applications. The fresh properties of M45 were demonstrated in a bridge deck patching
project. The ECC was mixed in a 12ft3 capacity drum mixer (Figure 3.6), and then
placed into the patch. The ECC patch was hand finished with steel trowels to a smooth
surface followed by tining to create transverse grooves in the pavement. It was found

20
that ECC exhibited excellent workability, eliminating the need for vibration between the
reinforcing steel, and moderate finishability as well.
Figure 3.6 Demonstrations of ECC workability in patching of a bridge deck for (a) mixing in a 12ft3
capacity drum mixer; and (b) pouring without any vibration.
3.4 Long term tensile strain capacity
Concerning the long-term strain capacity, uniaxial tensile tests have been used to
evaluate the tensile strain capacity of ECC M45 over time. This ECC composite
exhibited a strain capacity more than 3% at 28 days, as reported previously. The 3-month
and 6-month strain capacity of M45 is slightly lower than the 28-day strain capacity
(Figure 3.7 and Figure 3.8), however the observed 3.0% strain capacity remains
acceptable for an ECC link slab application. The overall effect of this slight drop in long-
term strain capacity is minimal. Based on the test results up to 6 months, the tensile
strain capacity seems to stabilize near 3.0% after 28 days.
Table 3.4 Tensile Strain Capacity Development of M45 ECC Curing time
(days) 7 14 18 22 28 98 183
5.10 4.55 4.20 3.80 3.60 3.50 3.70 4.40 4.50 3.92 3.50 3.20 2.95 3.10 4.28 4.06 3.58 3.22 3.00 2.90 1.90*
Strain capacity (%)
4.22 4.10 2.96 2.85 Average
strain capacity (%)
4.50± 0.41
4.30± 0.26
3.90± 0.31
3.51± 0.29
3.19± 0.29
3.05± 0.30
3.40± 0.42
(* indicates premature failure due to alignment problem, excluded from calculation of average strain capacity and standard deviation; ± means standard deviation of the specimens tested at the same age)

21
0
200
400
600
800
1000
0 0.5 1 1.5 2 2.5 3 3.5
Strain (%)
Stre
ss (p
si)
Figure 3.7 Typical stress-strain curve for M45 ECC at 6 months.
0
1
2
3
4
5
6
0 50 100 150 200 250 Figure 3.8 Tensile strain capacity development of M45 ECC.
4.0 Shrinkage and shrinkage crack resistance
The investigation of the shrinkage properties of ECC and assessment of cracking
due to restrained shrinkage are of interest for the estimation of the shrinkage
deformations and the durability of a steel reinforced ECC link slab, which may be subject
to aggressive agent (e.g. chlorides) penetration. In this section, first, the free and
restrained shrinkage behavior of ECC (M45) were determined and compared to that of a
concrete. It is expected that ECC will show higher shrinkage deformation as compared to
concrete due to the relatively high total cement and water content. However, due to the
Age (days)
Stra
in C
apac
ity (%
)

22
multiple cracking and strain hardening behavior of ECC, it is expected that restrained
shrinkage crack widths will be much smaller than that of normal concrete.
Furthermore, the free and restrained shrinkage behavior of ECC produced with a
normal Portland cement (from Lafarge Cement) and with a low alkali content Portland
cement (from Lafarge Cement, Alpena Michigan) were compared. It can be expected
that ECC made with a low alkali content Portland cement (M45 LA) will show lower
shrinkage deformation as compared to ECC produced with a normal Portland cement
(M45). The explanation for this behavior was published by Beltzung et al. (2001).
4.1 Determination of free shrinkage properties
The investigation of drying shrinkage of ECC (M45) was conducted in
accordance to ASTM C157/C157M-99 and ASTM C596-01. Six specimens were cast
and demolded after one day. After storage under water for two days the specimens were
in equilibrium with 100% relative humidity. After two days of water storage three
specimens were stored in a relative humidity of 66% and three specimens were stored in
a relative humidity of 33%. The drying shrinkage deformation was measured as a
function of drying time until the hygral equilibrium was reached. Figure 4.1 shows the
dimensions and test setup of the specimen used to determine the free shrinkage properties
of ECC.
Figure 4.1 Specimen dimensions and test setup
1.6 in
8 in
.
t = 1 in.
Specimen (sides sealed)

23
The drying shrinkage was equal to the relative deformation between any R.H and
100% R.H. divided by specimen length at 100% R.H. The measured average drying
shrinkage as a function of the relative humidity is plotted in Figure 4.2. In addition to the
drying shrinkage of ECC (M45), the drying shrinkage of a concrete control specimen is
also shown. The drying shrinkage of the ECC (M45) is found to be approximately twice
as high as the drying shrinkage of the investigated concrete. This is due to a total cement
and water content per volume of the ECC (M45) twice as high as those in concrete.
While the total shrinkage deformation is relatively large (0.15% at 20%R.H.) it should be
noted that the average value of the relative humidity in Southeast Michigan is
approximately 75%, which corresponds to shrinkage deformations of approximately
0.1%. Figure 4.3 shows the mean annual relative humidity in the U.S.A. (AASHTO,
1996).
0.00
0.05
0.10
0.15
0.20
0.25
0.30
0 20 40 60 80 100Relative Humidity h (%)
Tot
al D
ryin
g Sh
rink
age
ε hyg
(%)
Mix 45Mix 45LAConcreteFit (Mix 45)Fit (Mix 45LA)Fit (Concrete)
Mean Annual Relative Humidity Southeast Michigan according to
AASHTO, 1996
Figure 4.2 Drying shrinkage as a function of relative humidity

24
Figure 4.3 Mean annual relative humidity in the U.S.A. (AASHTO, 1996)
To reduce shrinkage deformation, ECC made with a low alkali content Portland
cement (M45 LA) was investigated and compared to ECC produced with a normal
Portland cement (M45). Same ASTM standards were applied as before. Twenty-one
specimens were cast and demolded after one day. After storage under water for two
days, the specimens were in equilibrium with 100% relative humidity. Specimens were
stored in seven separate containers with relative humidities of 93%, 85%, 75%, 66%
33%, 12% and 0%. With three specimens in each container, the drying shrinkage
deformation was measured as a function of drying time until hygral equilibrium was
reached.
The measured drying shrinkage deformation as a function of the relative humidity
is plotted in Figure 4.2. The drying shrinkage of ECC produced with a low alkali content
Portland cement is similar to the drying shrinkage of the ECC produced with normal
Portland cement above 66% relative humidity. At a relative humidity lower than 66%,

25
the drying shrinkage of M45 LA is slightly lower than M45. The total amount of drying
shrinkage of M45 LA is 5% lower compared to M45 at 0% R.H.
At 75% humidity (for Southeast Michigan), the amount of drying shrinkage of
M45 LA was similar to that of the normal M45. Thus, the use of a low-alkali cement in
ECC to reduce drying shrinkage is unlikely to be an advantage over using ordinary
Portland cement. It should be noted that even with the large shrinkage strain in ECC
(~0.1%), it remains much smaller than its ultimate tensile strain capacity (>3.5%) at early
age. Thus when shrinkage cracks form in ECC, the material will still be in the early
strain hardening stage.
4.2 Determination of restrained shrinkage properties
The investigation of restrained shrinkage utilizes a ring test (Shah et al, 1992)
(Figure 4.4 and 4.5) to determine the number and width of cracks in the cementitious
matrix exposed to 30% relative humidity. First, two specimens of ECC (M45) and two
concrete control specimens were compared. Furthermore, two specimens of ECC (M45
LA) were cast for a second round of tests to examine the possible improvement on the
shrinkage properties of ECC by using low alkali content cement.
During casting, a plastic covered paper cyclinder was used as an outer mold. The
outer mold was removed three days after casting. Subsequently, the specimen was
exposed to 30% relative humidity. Drying of the specimen leads to an internal radial
pressure in the specimen resulting from the restraint of the drying shrinkage deformation
provided by the steel ring. Using the dimensions shown in Figure 4.5 it can be shown
that the difference between the value of the circumferential stress on the outer and inner
surfaces is only 14%. Also the maximum value of the radial stress is only 14% of the
maximum circumferential stress. This justifies the assumption that the specimen is
subject to a uniaxial tensile stress state when it is restrained from shrinkage deformation
by the steel ring.

26
Figure 4.4 Test setup for measurement of the crack width of restrained shrinkage
Figure 4.5a Dimension of test specimen (plan view)
Steel ring
Specimen
Measurement of crack width
Microscope
A
A
Steel Ring
Specimen
10.7
in.
12.1
in.
13.9
in.

27
Figure 4.5b Dimension of test specimen (side view section A-A)
The measured crack widths due to drying shrinkage in ECC (M45) and concrete
are shown in Figure 4.6. In the concrete control specimen, one crack was formed with an
approximate crack width of 0.040”. The crack width shown (Figure 4.6) represents the
average value of three measurements of the crack width at three different locations of the
crack length as shown in Figure 4.4. For the ECC specimen with multiple cracking, the
average value of the crack width was taken over the number of cracks and specimen
height. In the ECC (M45) specimen, ten cracks were observed. The average crack width
observed in the ECC (M45) specimen is relatively small, about 0.003”, and is
approximately one order of magnitude smaller than that in the concrete specimen.
Furthermore, it was found that the average value of crack width measured in M45 LA
ECC specimen was similar to the crack width measured in M45 ECC specimen, as shown
in Figure 4.6. Thus, the use of a low-alkali cement in ECC to is unlikely to be an
advantage over using ordinary Portland cement in terms of restrained shrinkage and crack
width.
In terms of durability of an ECC link slab, the influence of reduced crack width
on the permeability of harmful substances can be evaluated using reference data (Figure
6.0
in.
10.7 in.
12.1 in.
13.9 in.
Sealer
Section A-A
Base

28
3.1 and reproduced in Figure 4.7 with expanded scale). The graph shows the dependency
of the permeability coefficient as a function of crack width (Wang et al, 1997) in
concrete. These data indicate that for crack widths below 0.004” the permeability
coefficient remains relatively small and constant (10-9inch/s). At increasing crack widths,
however, the permeability coefficient increases rapidly and reaches values several
magnitudes higher (10-3inch/s at 0.020” crack width). For the reference concrete with a
crack width measured at about 0.040” (Figure 4.6) at steady state, the expected
permeability will exceed 1 inch/s. It is expected that the low permeability of ECC due to
relatively small crack widths (0.003”) will positively affect the durability of an ECC link
slab particularly under severe environmental conditions, such as in regions where deicing
salts are used.
0.0
0.2
0.4
0.6
0.8
1.0
1.2
1.4
0 20 40 60 80 100 120Drying Time t (d)
Cra
ck W
idth
w (m
m)
0.00
0.01
0.02
0.03
0.04
0.05
Cra
ck W
idth
w (i
nch)
Concrete FitMix 45 FitMix 45LA Fit
Figure 4.6 Average crack width development over time (obtained from ring tests based on 2 specimens. Crack width measurement made at three points along each crack observed.)

29
1.0E-10
1.0E-08
1.0E-06
1.0E-04
1.0E-02
1.0E+00
1.0E+02
0 0.01 0.02 0.03 0.04 0.05Crack Opening Displacement COD (inch)
Perm
eabi
lity
Coe
ffici
ent k
(inc
h/s)
ECC
Reference concrete
Figure 4.7 Permeability coefficient as a function of crack width (from Wang et al., 1997)
5.0 Freeze-thaw durability
5.1 Pore size distribution
The entrainment of correct size air voids is critical to good freeze-thaw
resistance. Methods such as the addition of fly ash, silica fume, and the fibers
themselves, have been shown to entrain an adequate size range and number of air voids.
Verification of these techniques was carried out through mercury intrusion and
porisemetry of a standard ECC mix according to standard test specifications (ASTM C-
457). The results from this test are summarized in the cumulative pore volume
distribution (Figure5.1). Through the reaction of the added fly ash with calcium
hydroxide at the fiber and aggregate interface, a large number of pores in the target range
between 0.000014” and 0.00008” have been created. Furthermore, the large porosity
value of 21.6% seen from porisemetry indicates that a large number of these small pores
exist. From this pore distribution, good freeze-thaw protection can be expected from all
ECC specimens. Furthermore, porisemetry cannot detect voids larger than 0.040” in
diameter. The existence of these voids will only further enhance the freeze-thaw
durability of the ECC beyond that shown in the pore distribution.

30
Figure 5.1 ECC pore size distribution
Additionally, the spacing of air voids in the matrix is critical to imparting good
freeze-thaw resistance. Using the cumulative distribution curve shown in Figure 5.1 and
some simple geometrical assumptions, the average spacing between each micro-pore is
found to be approximately 0.000033”. This spacing is well below the maximum 0.008”
recommended by ASTM. This close spacing is critical for the excellent freeze-thaw
resistance of ECC specimens.
5.2 Freeze-thaw exposure testing
Preparation of freeze-thaw and concrete specimens was conducted under ASTM
Method C 192 for preparation of laboratory concrete specimens. Four separate test series
were conducted. Three series consisted of various ECC mix designs while the fourth was
a standard concrete for reference. For consistency, no air entrain was applied in any of
the material tested. The three ECC mix designs are designated M34, M45, and M45 LA.
Mix proportions for each of these versions are given in Table 5.1. For each series, three
prismatic specimens for determination of durability factor and three standard cylinders
for compressive strength were subjected to freeze-thaw cycles (carried out at Purdue
(0.001 in)
(in3 /o
z/0.
001i
n)

31
University). Additionally, seven ECC tensile test plates in each series were subjected to
freeze-thaw cycles in addition to prisms and cylinders. ASTM C666 Procedure A was
conducted to test the freezing and thawing durability of prismatic specimens. Dynamic
moduli measurements were conducted each week (one week corresponded to
approximately 36 cycles of freezing and thawing). The flexural resonant frequency was
obtained by using Grindstone Resonant Frequency equipment. The dynamic modulus
was calculated based on the procedure described in ASTM C 215. Overall test results
indicate that ECC provides superior resistance to deterioration subjected to freeze-thaw
cycles when compared to standard concrete.
Table 5.1 ECC and Reference Concrete Mix Designs (lb/yd3)
Mix No. Cement Gravel Sand Fly Ash Water Superplaticizer MC
PVA Fiber
M34 1370 0.0 1370 150 584 27.3 1.37 43.8 M45 945 0.0 757 1134 551 23.6 0.0 43.8
M45 LA 945* 0.0 757 1134 551 23.6 0.0 43.8 Concrete 728 1456 1456 0.0 324 7.25 0.0 0.0
(* Denotes the use of low alkali cement, MC: Methyl Cellulose)
For each ECC specimen subjected to freeze-thaw cycles the dynamic modulus
remained nearly constant or increased while the dynamic modulus of the regular concrete
dropped dramatically (Figure 5.2). The three rounds of freeze-thaw testing show an
average durability factor over 100 for M34 ECC samples and an average durability factor
of 20 for the concrete samples. Furthermore, the regular non-air-entrained concrete
samples failed after only 110 of the 300 recommended freeze-thaw cycles while the ECC
specimens survived all 300 test cycles. Similar to M34, M45 specimens subjected to
freeze-thaw cycles exhibited a constant or slight increase in dynamic modulus when
compared to regular concrete (Figure 5.2). Also similar to M34, the average durability
factor of M45 ECC is 104, far above the concrete durability factor.
Unlike previous results, M45LA specimens subjected to freeze thaw cycles
exhibited an increase in dynamic modulus while undergoing freeze thaw exposure
(Figure 5.2). While the relative dynamic modulus of M45 after 300 freeze-thaw cycles
increased only 3%, the relative dynamic modulus of M45LA increased approximately

32
20%, showing a substantial change. However, this increase is in accordance with the
companion M45LA ECC specimens cured in a fog room, which showed an analogous
increase. According to ASTM freeze thaw testing procedures, freeze-thaw exposure
begins 14 days after specimens are cast. While all other specimens were tested in this
manner, due to testing machine availability, freeze thaw cycles for M45LA ECC
specimens commenced 11 days after casting. The increase in dynamic modulus of
M45LA ECC during the early portion of freeze-thaw exposure may be partially credited
to the early start of testing, but may more likely be due to a slightly different hydration
rate of low alkali content cement when compared with normal Portland cement quarried
and ground at different manufacturing facilities.
0
1000
2000
3000
4000
5000
0 50 100 150 200 250 300 350
0
20
40
60
80
100
120
140
0 50 100 150 200 250 300 350
Number of Freeze Thaw Cycles
Rel
ativ
e Dy
nam
ic M
odul
us (%
) .
M34(F-T)
Regular concrete (F-T)
M45 (F-T)
M45LA(F-T)
Dyn
amic
Mod
ulus
(ksi
)
Figure 5.2 Freeze-Thaw test results showing (a) dynamic modulus, and (b) relative dynamic modulus
(a)
(b)
Representative standard deviation

33
The mass loss experienced by the ECC freeze-thaw specimens was less than the
mass loss from the regular concrete samples. Each ECC prism subjected to freeze-thaw
conditions lost an average of 0.9% of initial mass over 300 cycles while the concrete
specimens lost an average of 2.0% of initial mass after completing only 110 cycles. A
number of regular concrete cylinder specimens were left exposed to freeze-thaw
conditions after 110 cycles but were reduced to loose aggregates by 144 cycles.
Photographs of ECC specimens and regular concrete specimens are shown below (Figure
5.3-5.6).
Figure 5.3 Regular Concrete Normal Curing and Freeze-Thaw Specimens

34
Figure 5.4. M34 ECC Normal Curing and Freeze-Thaw Specimens
Figure 5.5 M45 ECC Normal Curing and Freeze-Thaw Specimens

35
Figure 5.6 M45LA ECC normal curing and Freeze-Thaw specimens
5.3 Tensile testing of freeze thaw specimens
After undergoing 300 freeze-thaw cycles in a 14 weeks test, the ECC specimens
retain much of their initial tensile ductility. For each mix tested, all tensile specimens
subjected to freeze-thaw show an average ultimate strain capacity over 2.0%, with most
nearing 3.0%. This is close to the 2.5% - 3.0% strain capacity seen from specimens of
the same age not subjected to freeze-thaw conditions. Typical tensile stress-strain curves
are shown in Figure 5.7 and Table 5.2 for M34, M45, and M45LA for both normal cured
and freeze thaw tensile specimens. From this, it is seen that freeze-thaw exposure has
little effect on the tensile performance of ECC material. Furthermore, the strain capacity
seen in these freeze thaw specimens remains acceptable for the ECC link slab application.

36
Figure 5.7 Stress-Strain Curve for ECC Normal Curing and Freeze-Thaw Specimens
Table 5.2. Freeze-Thaw Tensile Test Results (Based on 3 test specimens per mix)
Mix No. First Cracking Strength (PSI) Ultimate Strength (PSI) Ultimate Strain (%) 34 NC* 650 ± 60 710 ± 100 2.5 ± 0.23 34FT** 630 ± 30 740 ± 50 2.1 ± 0.34 45NC* 580 ± 30 800 ± 110 3.0 ± 0.52 45FT** 580 ± 50 740 ± 70 2.8 ± 0.60
45LA NC* 620 ± 50 680 ± 40 2.9 ± 0.4 45LA FT** 670 ± 30 680 ± 60 2.8 ± 0.9
*Indicates Normal Curing Samples, age= 14 weeks
**Indicates Freeze-Thaw Samples, age= 14 weeks
5.4 Compression testing of freeze-thaw specimens
Along with prisms and tensile plates, three 3” x 6” compressive cylinders were
also subjected to freeze-thaw conditions. Upon completion of 300 freeze thaw cycles,
three cylinders were tested using a Satec testing machine based on ASTM C39 procedure
(conducted at Purdue University). In addition to the freeze-thaw cylinders, companion
specimens cured in a fog room were also tested at the same age. M45 and M45LA ECC
0
100
200
300
400
500
600
700
800
900
0 0.5 1 1.5 2 2.5 3 3.5
Strain (%)
Stre
ss (P
SI)

37
compressive strengths for specimens subjected to freeze-thaw conditions and fog room
curing are shown in Table 5.3. Due to testing problems, compressive strengths were not
obtained for Mix 34 specimens. The appearance of Mix 45LA cylinders subjected to
compression testing after both freeze-thaw exposure and fog room curing are shown in
Figure 5.8. As seen from this figure, the failure mode for both of these specimens seems
quite similar from outward appearance.
Table 5.3 Freeze-thaw and fog room curing compressive strength
Mix No. Curing Condition Average Compressive Strength (PSI) Fog Room Curing 11600 ± 300 M45
Freeze Thaw 8800 ± 300 Fog Room Curing 9100 ± 300 M45LA
Freeze Thaw 5700 ± 200
Figure 5.8 Comparison between (a) M45LA Freeze-thaw specimen: and (b) M45LA fog room
curing specimen after compression testing
The compressive strength for M45 ECC is well above minimum requirements for
bridge deck applications both before and after freeze thaw testing. The same is true for
M45LA ECC. Specimens of M45 ECC exhibited compressive strengths of 11,600 psi
and 8,800 psi after fog room curing and freeze thaw exposure, respectively. Analogously,
specimens of M45LA ECC cured in a fog room showed an average compressive strength
of 9,100 psi and 5,700 psi when exposed to freeze-thaw cycles. As mentioned above,
(a) (b)

38
while the compressive strength is lower after freeze-thaw exposure, the compressive
strength for both ECC mixes after freeze thaw cycles is still well above the 4,500 psi
recommendation by MDOT for minimum compressive strength of bridge deck material.
While the compressive strength is adequate, the 24% difference in compressive
strength for M45 ECC and 38% difference for M45LA ECC, both between fog room
curing and freeze thaw condition, is a source of concern. A number of mechanisms may
be at work affecting the compressive strength of the freeze-thaw exposed ECC specimens.
As seen in Figure 5.8, compressive failures are primarily at specimen ends, which may be
the cause of the premature failure and low compressive strength test results. In this case,
dynamic modulus measurements should be used to evaluate the condition of the material
as a whole. Dynamic modulus data discussed earlier show excellent durability of the
entire prism specimens throughout the entire freeze thaw test.
Another likely reason for the lower compressive strength of freeze thaw ECC is
the difference in maturity between specimens subjected to freeze-thaw conditions and
specimens stored in a fog room. Maturity is calculated using the Nurse-Saul equation.
Maturity (ºF ·days) = ( )[ ]∑ + 50Ta t (Eq. 2-1)
where at is time of curing in days and T is curing temperature in ºF. The maturity of ECC
specimens after fog curing is approximately 8600ºF ·days while the maturity of ECC
specimens after freeze thaw is 5700ºF ·days. This significant difference in maturity
levels would result in a significant difference in compressive strength of ECC material.
Figure 5.9 exhibits the relation between concrete compressive strength gain and maturity.
From this relationship, the fog room specimens are expected to exhibit 100% of potential
compressive strength. However, the freeze thaw specimens are expected to exhibit about
90% of the potential compressive strength. While this only accounts for a portion of the
difference between freeze thaw and fog room specimens, maturity differences most likely
have a significant effect on the lower compressive strength of the freeze thaw ECC
cylinders.

39
Figure 5.9 Concrete compressive strength vs. maturity (Mindess, 1981)
While relatively few studies have focused on the compressive strength of concrete
after freeze thaw exposure, previous work does show, with varying magnitudes, that
concrete regularly exhibits a lower compressive strength after freeze-thaw exposure.
Toutanji and Deng (2002) found that FRP wrapped concrete cylinders showed lower
compressive strength after freeze-thaw exposure. Cylinders cured in normal conditions
showed a strength of 21,825 psi compared to freeze thaw cylinders with showed a
compressive strength of 20,100 psi, a difference of 8% drop in compressive strength.
Unwrapped cylinders were also tested by Toutanji and Deng, but these specimens did not
survive freeze-thaw exposure. Toutanji and Balaguru (1999) found a 28% lower strength
in GFRP wrapped concrete cylinders when exposed to freeze thaw cycles. Finally,
Soudki and Green (1997) experienced a 48% difference in compressive strength from
7,300 psi to 3,900 psi after freeze-thaw exposure of unwrapped plain concrete cylinders.
While the reduction in compressive strength of ECC after freeze-thaw exposure is
substantial, a similar phenomenon has been documented in concrete.
After 300 freeze-thaw cycles, M45LA ECC exhibits a substantial increase in
dynamic modulus, a high durability factor, and no significant change in tensile strain
capacity. However, a 38% reduction in compressive strength is significantly larger than
the 23% reduction in compressive strength seen in M45 ECC. The use of low alkali
content cement exhibits no improvement in freeze thaw durability, but reveals a

40
substantial drop in compressive strength after freeze thaw exposure when compared to
normal Portland cement, at the same age. As a result of these findings, the replacement
of normal Portland cement with low alkali content cement in ECC is not suggested for
this project. While the use of low alkali content cement may be beneficial in some
normal concrete applications, its benefits in ECC applications are minimal and not
extensive enough to promote replacement of normal Portland cement.
6.0 Design of ECC link slab/concrete deck slab interface
6.1 Conventional and improved interface design methods
In this project, ECC link slab is used to accommodate bridge deck deformations,
replacing typical expansion joint. However, the interface between ECC and concrete
may become a weak link due to cold jointing and load transfer between the existing
concrete and link slab. This has been demonstrated by MDOT in a preliminary
laboratory investigation. During monotonic test to failure on their specimen 1C, the
interfacial crack grew noticeably while the width of cracks in the ECC link slab was
maintained below 0.002”.
Previous experiments suggested that the bond strength between concrete and ECC
(hot joint: both materials are cast at the same time) is roughly 0.3 ksi (Zhang and Li,
2002). In the current project, the interface is cold jointed when an ECC link slab is used
for the replacement of an expansion joint, meaning that the bond strength could be
considerably lower than that of a hot joint. Methods to strengthen the interface between
concrete and ECC and design approaches to reduce stress concentrations at the interface
are of major concern for interface design.
The existing design procedure for concrete link slabs does not give enough
attention to the design of the deck slab/link slab interface. In conventional concrete link
slab design, additional reinforcement is spliced with the existing reinforcement to
strengthen the link slab. However these reinforcements typically end at the interface.
Additionally, the debond zone (part of the link slab is deliberately debonded from the
steel girder to provide additional flexibility to the link slab) begins at the interface (Figure
6.1a). This imposes high stress concentration at the interface. Overall, this design
procedure makes the interface the weakest part of the bridge deck system.

41
In order to strengthen the interface, various methods may be applied such as using
continuous longitudinal reinforcement through the interface, installing shear studs, or
additional concrete surface preparation. In the proposed design of ECC link slabs, shear
studs connecting the steel girder and the deck are extended to within the ECC link slab;
therefore the debond zone begins at the end of the lap splice (Figure 6.1b). It is also
expected that the stress developed at the interface will be much lower than that of
conventionally designed link slabs while at the same time the interface will be
strengthened by using the methods aforementioned. Numerical structural analysis
(Section 6.2) demonstrates the advantage of improved interface design of an ECC link
slab.
(a)
Figure 6.1 Comparison of schematic interface design in LS between (a) conventional method and (b)
improved method
Concrete link slab Debond zone
Interface
Lap splice New reinforcements of LS
Shear studsExisting reinforcements of
concrete bridge deck
Debond zone
Transition zone New reinforcements of LS
Shear studs
Interface Existing reinforcements of concrete bridge deck
ECC link slab
(b)

42
6.2 Analysis of Bridge Model
Structural analysis software (RISA) is used to model a simply supported two-span
bridge to determine the critical stress induced by a standard AASHTO HS-20 load
available in RISA. By applying a moving load, the envelope solution is obtained for the
maximum stress state such that both the top and bottom surface have maximum tensile or
compressive stress. Both the improved design and conventional link slab design
approaches described above (Section 6.1) are modeled and analyzed for comparison.
For simplicity, a general-purpose beam element is used to model both the girder
and bridge deck. Furthermore, an infinitely rigid link is used to model the composite
action provided by the shear stud between girder and bridge deck. This rigid link has
infinite moment of inertia and infinite elastic modulus while the density is zero. Besides
this rigid link, other materials defined in this model are steel, concrete, and ECC with
elastic moduli of 29000 ksi, 4348 ksi, and 2173 ksi respectively. The thickness and width
of link slab are 9” and 63” respectively. The I section used is W24X117.
Both of the adjacent spans modeled are 65.6 feet in length with a debond length of
3.3 feet for each span. Two shear studs (modeled by rigid link) penetrate into the ECC
link slab. The distance between shear studs is chosen as 1.64 feet according to AASHTO
Standard Specifications for Highway Bridges (AASHTO, 1996). Details of the structural
model of the link slab and adjacent parts are shown below (Figure 6.2), where M1 means
the concrete deck slab adjacent to the interface and M2 is debond zone of ECC link slab.
The corresponding physical model is shown in Figure 6.1b. Since the support condition
has a large influence on the analysis results (Caner and Zia, 1998), two typical types of
supports are used in the analysis. These include the hinge-roller-roller-hinge condition
(HRRH), and the hinge-roller-hinge-roller (HRHR) condition.
Figure 6.2 Model of the bridge (close look at the link slab)
Girder
Concrete deck slabConcrete deck slab
Bridge deck

43
From the analysis results, member M1 is found to be always subjected to
compressive stress (less than 218 psi for all sections) for the HRRH type support, while
the debond zone of ECC link slab (M2) is in bending with a maximum tensile stress of
725 psi at the top surface. This means that the deck slab/link slab interface will always
be subjected to compressive stress. Hence this type of support does not govern the design
of the interface.
For the HRHR type support, member M1 is in tension while member M2 is in
bending. The maximum tensile stresses for M1 and M2 are 183 psi and 943 psi,
respectively, at the top surface. Therefore, the HRHR type support governs the design of
the interface and forces the interface test design to focus on tension rather than bending.
Due to the limitation of the RISA (name of commercial structural analysis software), the
unique strain hardening behavior cannot be represented in the material model. The linear
elastic behavior was “assumed” for ECC. Therefore, in reality, the member M2 should
have entered strain hardening stage with a yielding stress of around 580 psi instead of a
maximum tensile stress 943 psi.
After analyzing the improved design, the additional shear studs (rigid link in the
model) are removed and the analysis for conventional design is performed. Figure 6.3
shows the normalized maximum tensile stresses of the members near the interface for
both conventional and improved design (Normalized by the maximum tensile stress of
the improved interface design at the interface location). All stresses are on the top
surface of the section since these are of major interest. It is found that the maximum
tensile stress of the improved interface design at the interface location was only one fifth
of that of the conventional design due to the extension of shear studs into the ECC link
slab. The additional shear studs shift the peak stress value from the interface to the bulk
part of the link slab, which has higher strength and enough strain capacity to
accommodate this stress. Therefore, the interface of improved design will perform much
better than that of conventional design. Furthermore, with the help of longitudinal
reinforcement on the interface, which is not considered in the current model, removal of
the potential weakness at the deck slab/link slab interface seems assured. The integrity of
the joint will also be demonstrated as a part of the full-scale link slab test (Section 8).

44
0
1
2
3
4
5
6
-2 0 2 4 6 8Distance from interface (ft)
Nor
mal
ized
max
imum
tens
ile st
ress
.
Figure 6.3 Normalized envelope stress developed at the top surface of link slab, ■ computed stress
envelope for Improved Design, ♦computed stress envelope for Conventional Design
7.0 Testing of ECC link slab/concrete deck slab interface
In the proposed interface design between the ECC link slab and concrete deck
slab, the location of the shear studs connecting the steel girder and the deck are extended
into the ECC link slab to reduce interfacial stress (Figure 6.1b). In addition to shear studs,
the existing longitudinal reinforcements are lap spliced with new reinforcing bars within
the ECC link slab.
Given these two improved methods to strengthen the interface, however, the
development length of the reinforcement in ECC has not been examined. With sufficient
embedment length, undesirable cracking at the interface or failure associated with the
reinforcement pullout can be prevented. Current design codes such as ACI 318 and
AASHTO code provide requirements for the development length of reinforcement in
concrete, but the applicability of these codes needs to be demonstrated if these codes
were to be directly adopted for ECC link slab design. Therefore, it is desirable to obtain
the development length of reinforcement embedded in ECC by implementing a
reinforcement pullout test. Companion concrete specimens were tested as well. Since
Concrete ECC
Interface
Conventional design
Improved design

45
epoxy-coated reinforcement is widely used in bridge construction in Michigan, epoxy-
coated reinforcement embedded in ECC specimens were also tested in pullout mode. In
this test, ECC M45 was investigated, along with reference concrete.
Similarly, the load capacity of a stud shear connection in ECC also needs to be
examined. With sufficient load capacity, the composite action of the girder and link slab
within the transition zone can prevent undesirable cracking at the ECC/concrete interface.
The current AASHTO code provides requirements for the ultimate strength (load
capacity) of a stud shear connection in concrete, but the applicability of the code must be
validated when ECC is used to replace concrete. To obtain the load capacity of shear
connections in ECC, a pushout test on studs in ECC was performed. Companion
concrete pushout specimens were tested as well. In this test, ECC M45 and its modified
version M45+ (higher water/cement ratio to reduce compressive strength) were
investigated, along with reference concrete, in which M45+ has a comparable
compressive strength as concrete, as shown in Table 7.1.
Table 7.1 Mix Proportion of ECC and concrete by weight and compressive strength (fiber by volume)
Mix C W S CA FA SP Fiber fc’ (ksi)
concrete 1 0.45 2 2 0 0 0 5.5 ± 0.2
M45+ 1 0.58 0.8 0 1.2 0.03 0.02 6.7 ± 0.1
M45 1 0.53 0.8 0 1.2 0.03 0.02 8.7 ± 0.3
(C: Type I Portland cement; W: water; S: silica sands for M45, regular sand for concrete; CA: coarse
aggregate with max size ¾ inch; FA: Type F fly ash; SP: Superplasticizer; Fiber: PVA fiber, KURALON
K-II REC15, developed by Kurary Co., LTD (Japan) in collaboration with ACE-MRL: fc’: Average
compressive strength based on 3 specimens)
7.1 Development length of reinforcements in ECC
7.1.1 Specimen design and experimental setup/procedure
According to Section 8.20 of AASHTO code, reinforcements for resisting
shrinkage and temperature stresses are required, and the total area of reinforcement
should be at least 1/8 inch2/foot in each direction. To provide this amount of
reinforcement, No.3 or No.4 reinforcement with spacing of 10 in. or 18 in. are placed
longitudinally in the decks of simple span bridges. An observation of a patch repair of a

46
Michigan bridge deck (Curtis Rd over M14, Ann Arbor) confirms that the longitudinal
reinforcements are No.3 bars with approximately 18 inch spacing (Figure 7.1).
Considering the retrofit of an existing bridge using an ECC link slab, No.3
reinforcements are expected to be lap spliced with new reinforcing bars of the ECC link
slab. Thus, pullout specimens were employed to assess the required development length
as well as pullout failure mode focusing on No. 3 bars in concrete and ECC since the
existing No. 3 bars have the potential to pull out from concrete or ECC link slabs.
Figure 7.1 Exposed reinforcements before patch repair
The specimen had cross-sectional dimensions of 6in. by 6in. and length of 16in.
Exposed No. 3 reinforcement inside the mold is shown in Figure7.2. Specimens with
embedment lengths of 6 in. along with different surrounding materials (ECC and
concrete) were prepared for pullout tests.
The load was applied by a steel plate attached to the four threaded bars with nuts
at the end to enhance anchoring. During casting, plexiglass plates (on the left end of the
mold) were used to ensure the steel plates conformed to the ECC surface such that the
applied load can be uniformly transferred. To assure the alignment of reinforcement, two
parallel plates were set up with the same size hole at the center. All specimens were
demolded after 24 hours and were then cured in air for 28 days.
Traffic direction
No.3 bar
~18in.

47
Figure 7.2 Exposed No.3 reinforcement and threaded bars of pullout specimen before casting
All specimens were tested on a MTS testing machine, as shown in Figure7.3. The
protruding reinforcement was gripped at the top with a frictional grip while the steel plate
with a welded steel tab was gripped at the bottom. The pullout displacement was
measured by a pair of linear variable displacement transducers (LVDTs) on either side of
the specimen attached to the steel reinforcement close to the embedded portion of the
specimen (Figure7.4). Loading was applied under displacement control at a rate of
0.0002 in/second.

48
Figure 7.3 Pullout test setup
Figure 7.4 LVDTs attached to the reinforcementfor measurement of pullout displacement

49
7.1.2 Pullout test results
From the comparison of the pullout load-displacement curves of No.3
reinforcement in concrete and ECC (Figure7.5 (a) and (b)), both yield at 7.1 kips
corresponding to a yield strength of 65 ksi for the bare steel reinforcement. After the
yield plateau, reinforcement in both concrete and ECC show a strain hardening regime
before the pullout process begins at peak load. The average peak load from pullout tests
are 10.8 kips and 10.3 kips for concrete and ECC specimens respectively. This indicates
that a 6 inch embedment length (half of the code recommended minimum development
length) is adequate to develop the yield strength of reinforcement in ECC, and that
reinforcement embedded in ECC has comparable bond properties with that of
reinforcement embedded in concrete, in terms of the peak load.
Furthermore, with ECC material as the surrounding matrix, there is no major
difference between the pullout behavior of bare and epoxy-coated reinforcement, as
shown in Figure7.5 (b) and (c). Epoxy-coated reinforcement shows only a slightly higher
yield load (7.5 kips) and average peak load (10.7 kips) than regular reinforcement (7.1
kips and 10.3 kips).
From the above observations, a 6 inch embedment length is found to be
acceptable for both regular and epoxy-coated reinforcement in ECC since peak pullout
loads exceed the yield load. Additionally, AASHTO requires a 12 inch development
length for No. 3 reinforcement of grade 60. Given the increased modification factor of
1.2 or 1.5 for epoxy-coated reinforcement in the AASHTO code, a safety factor of two
exists for the development length of epoxy-coated reinforcement in ECC.

50
0
2
4
6
8
10
12
0 0.1 0.2 0.3 0.4 0.5 0.6Displacement (inch)
Pul
lout
load
(kip
s) .
0
2
4
6
8
10
12
0 0.1 0.2 0.3 0.4 0.5 0.6Displacement (inch)
Pul
lout
load
(kip
s) .
0
2
4
6
8
10
12
0 0.1 0.2 0.3 0.4 0.5 0.6Displacement (inch)
Pul
lout
load
(Kip
s) .
Yield load
Yield load
Yield load
Average peak load: 10.8kips
Average peak load: 10.3kips
Average peak load: 10.7kips
(a) No. 3 reinforcement in concrete
(c) No. 3 epoxy-coated reinforcement in ECC
(b) No. 3 reinforcement in ECC
Figure 7.5 Comparison of pullout load-displacement curves for No. 3 reinforcement (a) in concrete; (b) in ECC; and (c) No. 3 epoxy-coated reinforcement in ECC, with 6 inch embedment length (where yield load corresponds to the yield strength of bare steel reinforcement)
Premature failure due to concrete splitting

51
7.2 Lap splice length of reinforcement in ECC
In a lapped splice, the force in one reinforcement is transferred to the surrounding
matrix, which then forwards it to the adjacent lapped bar. The force transfer mechanism
is shown in Figure7.6 (a), along with the typical associated crack pattern in Figure7.6 (b)
in concrete. The transfer of forces out of the bar into the concrete is accompanied by
radially outward pressures acting on the matrix by the deformed lugs on the bars, as
shown in Figure7.6 (c), which in turn results in splitting cracks along the bars. Once
these occur, the splice fails as shown in Figure7.6 (d). Splitting cracks typically initiate
at the ends of the splice where the splitting pressure is usually largest. In addition to
splitting cracks, large transverse cracks, which may occur at the ends of the spliced
reinforcement, also contribute to the failure of the lap splice. To address this potential
brittle failure of the lap splice in concrete, the AASHTO design code requires an increase
of splice length over development length by a factor of 1.3 or 1.7, depending on the ratio
of the amount of reinforcement (As) provided to required, and the percentage of As
spliced within required lap length.
The ductile pullout failure mode of ECC indicates that the brittle failure of lap
splices in concrete would not happen in ECC. As shown in Figure7.7, it is obvious that
the pullout failure mode of the reinforcement from the ECC specimen (frictional pullout)
is much more ductile than that of the concrete specimen (splitting), due to the high
toughness and ductility of ECC material. In ECC, the reinforcement exhibits frictional
pullout failure without causing splitting or transverse macroscopic cracks. Similar ductile
failure modes were observed in epoxy-coated reinforcement pullout tests with ECC. In
some concrete specimens, the reinforcement pullout process results in catastrophic
splitting failure of the specimen accompanied by noticeable transverse cracks. The
corresponding pull-out curve is shown in Figure7.5 (a) with a pre-mature sudden load-
drop.
From the above observations, the modification factor of 1.3 or 1.7 for
reinforcement lap splice length with respect to development length cannot be directly
applied to ECC. However, for design purposes and convenience, adoption of the
AASHTO code is expected to be conservative for the design of reinforcement splicing in
ECC.

52
Figure 7.6 Lap splice of bars in concrete (J. G. MacGregor, 1998)
(a) Forces on bars at splice.
(d) Failure of a tension lap splice.
(c) Radial forces on concrete and splitting stresses shown on a section through the splice.
(b) Internal cracks at splice.

53
(a) Ductile frictional pullout failure in ECC
Figure 7.7 Comparison of pullout failure modes between ECC and concrete specimen.
7.3 Stud shear connection in ECC
7.3.1 Experimental preparation and setup
The ECC mix M45 and M45+ was used in this test. The ECC mix M45+ has a
higher water cement ratio compared with M45 (Table 7.1), so that the compressive
strength of M45+ can be comparable to that of the concrete used. M45+ shows a strain
capacity around 3% at 28 days age (2.9±0.4% based on 3 specimens), similar to M45.
The shear studs used in this test are made from Grade 1018 cold drawn bars,
conforming to AASHTO M169 (ASTM A108) Standard Specification for Steel Bars,
Carbon, Cold-Finished, Standard Quality. The studs have a minimum yield and tensile
strength of 50 ksi and 60 ksi, respectively. The geometry of a shear stud is shown in
Figure7.8.
Figure 7.8 Geometry of a shear stud
2.5” 0.5”
0.75’’
1.25’’
(b) Brittle splitting failure in concrete accompanied
by noticeable transverse cracks.

54
The geometry of the pushout specimen is shown in Figure7.9. Two substrate
slabs 12”x12”x6” of matrix material (concrete or ECC) are connected with a wide flange
steel beam W8X40 with two shear studs welded on each side of the beam. The geometry
is adopted from Ollgaard et al. (1971). During casting, the material is poured from the
top of the specimen. Therefore, the steel beam will remain vertical, such that the loading
plane is horizontal. Even though this casting orientation is different from field
conditions, the pouring direction is thought to be unimportant since PVA fibers in ECC
are likely to be distributed in a 3-dimensional state.
Figure 7.9 Geometry of the pushout specimen (unit: inch)
The ECC specimens were cured in air, and concrete specimens cured in water for
28 days. To ensure the symmetry of the two slabs, the plywood molds were constructed
using two integral side plates and a single bottom plate. Testing was conducted on a 500-
kip capacity Instron testing machine, as shown in Figure7.10. Four LVDTs were
mounted on the steel beam at the level of the shear studs to measure the slip between the
beam and concrete slabs. An average value was taken from these four measurements.
6” 8.25”
2”
12”
2”
12”
6”
Loading plane

55
The loading surface was ground for uniform load distribution before testing, and a ball
support was used to maintain the alignment of the specimen.
7.3.2 Pushout behavior of concrete and ECC specimens
The overall performance of the ECC/stud system is revealed to be better than the
concrete/stud system in terms of failure mode, slip capacity (ductility), and load capacity.
Failure modes are switched from brittle matrix failure in concrete specimens to ductile
steel yielding in ECC specimens, leading to a higher ductility of ECC specimens at
higher loads, as illustrated by Figure7.11.
Figure 7.10 Setup of pushout tests and close view of LVDTs
In concrete pushout tests, as loading approached the peak value, large cracks
formed near the shear studs and developed rapidly throughout the entire specimen as the
peak load was reached. As seen in Figure7.12, concrete specimens fractured into several
parts after testing, clearly initiated from the head of the shear studs. The sudden drop
after peak load in Figure 7.11(a) demonstrates that after the concrete was fractured, the
bearing resistance of concrete was drastically reduced. The concrete under the shear stud
was crushed due to large bearing stress of the stud shank. The brittle nature of concrete
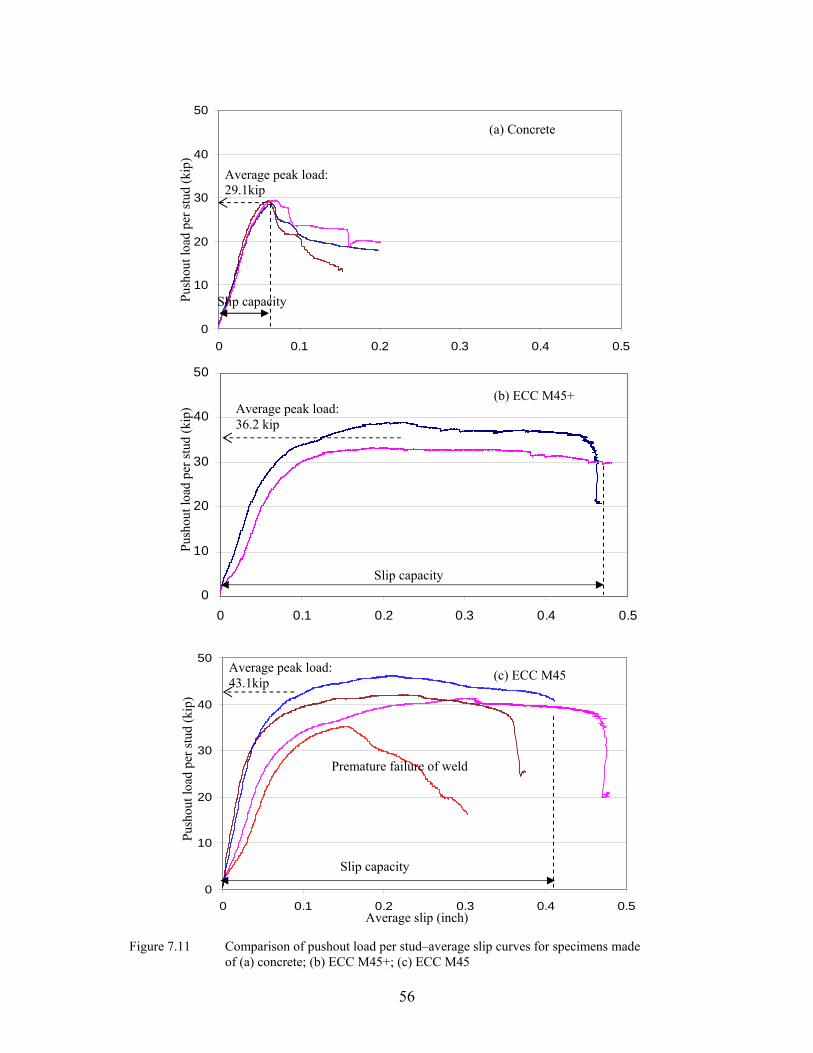
56
0
10
20
30
40
50
0 0.1 0.2 0.3 0.4 0.5
0
10
20
30
40
50
0 0.1 0.2 0.3 0.4 0.5
0
10
20
30
40
50
0 0.1 0.2 0.3 0.4 0.5
Push
out l
oad
per s
tud
(kip
)
(a) Concrete
Average peak load: 29.1kip
Slip capacity
Average slip (inch)
(c) ECC M45
Push
out l
oad
per s
tud
(kip
)
Average peak load: 43.1kip
Premature failure of weld
Slip capacity
Push
out l
oad
per s
tud
(kip
)
Figure 7.11 Comparison of pushout load per stud–average slip curves for specimens made of (a) concrete; (b) ECC M45+; (c) ECC M45
(b) ECC M45+ Average peak load: 36.2 kip
Slip capacity

57
Figure 7.12 Macro cracks developed in concrete pushout specimen show a brittle failure mode
Figure 7.13 Microcracks developed outside (left) and inside (right, cut section along shear stud) of
ECC specimen
lead to the rapid development of macro cracks, resulting in the catastrophic failure of
concrete pushout specimens.
Conversely, ECC specimens show a ductile failure mode due to their unique
strain hardening property. As can be seen from outside of the specimens, few cracks
were initiated as the load increased, accompanied by starting of inelastic range in the
load-slip curve. When peak load is reached, many microcracks are present, as revealed in
Figure7.13. In some cases, a dominant crack was initiated, but diffused into many
microcracks (µcrack width = 0.00165” ± 0.0008”) due to the ductile nature of ECC in
tension. Since the ECC near the stud head developed a large microcrack zone, and the
Crushed into powder
Macro cracks
Loading plane

58
bearing side resists the compressive force well, the ECC load-slip curve shows a large
inelastic range (Figure7.11 (b), (c)). The large slip capacity revealed in the ECC
specimens indicates the feasibility of engaging adjacent shear studs in carrying the shear
load.
Except for one specimen, which prematurely failed with a fracture of the stud
welds, ECC specimens failed due to yielding and large deformation of the shear studs.
This indicates that the use of ECC allows for “plastic yielding” of the matrix material,
resulting in large deformation of the shear stud, and finally a shift of the failure from the
matrix to the steel stud.
7.3.3 Load capacity of stud shear connection in concrete and ECC matrix
According to the AASHTO code, the ultimate strength of a stud in concrete is as
follows:
uscccscn FAEfAQ ≤= '5.0 (Eq. 7-1)
with: scA = cross-sectional area of a stud shear connector (inch2);
'cf = specified 28-day compressive strength of concrete (ksi);
Ec = Elastic modulus of concrete (ksi);
uF = specified minimum tensile strength of a stud shear connector (ksi).
Table 7.2 shows the ultimate strength of a shear stud in the matrix, calculated assuming
the validity of AASHTO code (Eq. 7-1) for both concrete and ECC. The tested average
peak load per stud in concrete is 29.1kips, slightly lower than the calculated value of 31.4
kips. Considering the influence of reinforced concrete, which shows a load increase of
approximately 6% (An, et al 1996) over plain concrete, the average peak load can be up
to 30.8kips. This agrees well with calculated values, which is expected since the
specimen setup is similar to the pushout tests performed by Ollgard et al (1971, adopted
by AASHTO). In both tests, the brittle fracture of concrete was the dominant factor
controlling the peak load.

59
Table 7.2 Calculated, measured strength, and slip capacity of a stud in concrete and ECC
Material
Compressive
strength, 'cf
(ksi)
Young’s
modulus,
Ec (ksi)
Computed
strength/stud
Qn (kip)
Measured
strength/stud
(kip)
Slip
capacity
(inch)
Concrete 5.5 ± 0.2 3700 31.4 29.1 0.07
M45+ 6.7 ± 0.1 2800 30.2 36.2 0.48
M45 8.7 ± 0.3 2900 34.9 43.1 0.41
From the test results (Figure7.11(b), (c)), the average peak load (ultimate strength)
of a shear stud in ECC M45+ and M45 is about 36.2kips and 43.1kips, 18% and 23%
higher than the calculated values, respectively. Interestingly, the average peak load per
stud of ECC M45+ is around 25% higher than that of concrete while according to
AASHTO they should have about the same ultimate strength. This is mainly due to the
fact that the compressive strength, a main contributing factor in AASHTO design for
studs in concrete, is not relevant to the failure of ECC specimens. Instead, the ductile
strain hardening behavior caused “yielding” of the ECC, accompanied by a large
deformation of the stud, leading to the higher load capacity of the ECC specimens.
Therefore the direct adoption of AASHTO code is not suitable for ECC material.
However, for design purposes and convenience, adoption of the AASHTO code leads to a
large safety margin.
8.0 Laboratory testing of ECC link slab 8.1 Design of Test Specimens
While previous laboratory investigation of link slabs (Caner and Zia, 1998)
involved testing of a 1/6 scaled bridge including a link slab with two adjacent spans, the
present study focused on testing of a full-scale link slab portion exclusively. Therefore,
the end rotations imposed on the link slab by the adjacent spans in a bridge were replicated
in the laboratory.
The deformed shape and moment distribution due to applied load of a two-span
bridge structure are schematically shown in Figure 8.1(a). Flexural crack formation was

60
expected at the top of the link slab as illustrated in Figure 8.1(b). Therefore, the link slab
specimens were designed to include the link slab within the distance between the points of
inflection in the adjacent spans. The location of inflection point should be determined by
the stiffness of the link slab. In case of zero stiffness, the point of inflection is located at
the support, while for a continuous girder and deck its location is around 25% of the span
length from the support. In the case of a link slab with girder discontinuity, the point of
inflection is located within these boundaries.
As described above, the specimen test setup focused on the link slab portion
between the points of inflection in the adjacent spans as illustrated in Figure 8.1(b). Figure
8.2 shows the specimen geometry of both concrete and ECC link slabs, including the total
debond zone length (50 in.) equal to 5.2% of adjacent span. For simplicity, the concrete
specimen was cast continuous without the interface, which is conservative for the overall
comparison of concrete and ECC link slabs. It is noted that the length and height
dimensions of specimens are identical to a link slab between two adjacent 80’ span
bridges. The thickness of the link slabs was 9 in., which corresponds to typical deck slabs
in simply supported composite girder bridges. The width of the link slabs was 28”. As
described earlier, the location of inflection point should be located in the range from 0%
up to 25% of the span. The bridge model in Section 6.2 was used to find the inflection
point of the bridge. First, a certain load P was applied at midspan of the bridge. After
running the RISA program, the moment distribution of the bridge induced by load P was
calculated. The location of zero moment was away from the support about 6.7% of the
span length. Hence, we employed an inflection point at 6.7% of the span length based on
aforementioned numerical analysis.

61
(a)
(b)
Figure 8.1 Schematics of two span bridge subjected to point load at midspan for (a) deformed shape of bridges; and (b) moment distribution on bridge span and corresponding deformed shape of link slab region.
θ
P P
θ
Lsp, Isp Lsp, Isp
+ +
-
Debond zone θ θ
Girder rotation Link slab deformation and
flexural crack formation
Inflection point (M=0) Inflection point (M=0)
6.7% of span length

62
(b)
(c)
Figure 8.2 Geometry of link slab specimens for (a) LS-1; (a) LS-2; and (b) LS-3.
Three link slab specimens (Figure 8.2) were tested. Specimen LS-1, in which a
concrete link slab reinforced with continuous No. 6 reinforcing bars and adjacent spans
were cast together, was used to simulate the concrete link slab new construction.
According to the current limit stress criterion of reinforced concrete link slabs (Caner and
Shear studs Concrete bridge deck
14”
No.6 bar
Girder (W14x82)
Debond zone (roofing paper)
9”
ECC Link slab Shear studs Concrete bridge deck
14”
No.6 bar
9”
(a)
142”
14”
New No.5 bar
50”
96”
2”
9”
ECC Link slab Concrete deck slab
Shear studs
Existing No.6 bar 128”
Debond zone (roofing paper) Girder
(W14x82)
Debond zone (roofing paper)
Girder (W14x82)
8 No. 6 bars (ρ=0.014)
8 No. 6 bars (ρ=0.014)
8 No. 5 bars (ρ=0.01)

63
Zia, 1998), the reinforcement ratio of the concrete link slab was determined to satisfy the
stress criterion (σs < 0.40σy) at 0.0015 rad. end rotation angle. This is the expected
rotation angle as derived by Caner and Zia (1998). The moment Ma developed in the
uncracked concrete link slab is a function of the elastic modulus of concrete Ec and
geometrical dimensions. It is proportional to the imposed end rotation angle
θdz
glsca L
IEM ,2
= (Eq. 2-3)
where Ils,g is the moment of inertia of link slab based on uncracked section and Ldz is the
debond zone length. Figure 8.3 illustrates the stress in the reinforcement at 0.0015 rad.
end rotation angle and the reinforcement ratio chosen in this test. According to Eq. 2-6
and 2-10, ( ) ( )ρρρ nnnk 22 ++−= , ))3/(/( kddAM sas −=σ . Given a known Ma in
this test, and substituting k into σs, we can derive a relationship between stress and
reinforcement ratio, as shown in Figure 8.3. In the debond zone, no shear connectors were
used and 15-lb roofing paper was placed at the top of flange of the W14x82 girder.
Figure 8.3 Required minimum reinforcement ratio 0.013 (0.014 used in the test) designed at expected rotation angle (0.0015 rad.).
Stress in reinforcement at rotation angle 0.0015rad
0.0
20.0
40.0
60.0
80.0
100.0
120.0
140.0
160.0
180.0
0.000 0.002 0.004 0.006 0.008 0.010 0.012 0.014 0.016 0.018 0.020
Reinforcement ratio
Stre
ss [k
si]
24ksi = 0.40 yield strength

64
Specimen LS-2 was prepared by removing the concrete from the link slab portion
of specimen LS-1 and replacing it with an ECC link slab. This specimen was used to
simulate the replacement of a concrete link slab with a new ECC link slab since the
continuous reinforcement remained. The length of the link slab was 96 in. including 50 in.
length of debond zone. The debond zone in the conventional concrete link slab has been
designed to begin at the interface between deck slab and link slab, which results in locating
the interface at the weakest part of the bridge deck system. In the present study, four shear
studs were welded on the top of the girder flange (Figure 8.2 (b)) in order to strengthen the
interface between ECC link slab and concrete bridge deck. The debond zone was 2.5% of
span length for conservative concern (Calculated by Eq. 2-3 and shown in Table 8.1). The
following steps were followed to prepare specimen LS-2 after the fatigue test on specimen
LS-1.
1. Mark the section of the deck to be removed.
2. Provide a 1 in. deep saw cut across the width of the deck.
3. Chip out the concrete using hand held pneumatic breaker; care was taken not to
damage the existing reinforcements and shear studs.
4. Place formwork; the interface was located behind the four shear studs.
5. Place a layer of 15-lb roofing paper on the top flange for debonding.
6. Pour two batches of ECC mixed in a 15.9 ft3 capacity drum mixer.
In order to investigate the effects of the reinforcement ratio on fatigue performance
of ECC link slab, a third specimen LS-3 was prepared. Specifically, the focus of this test
was on the fatigue performance of ECC link slab reinforced with a smaller amount of
reinforcement compared to the design value and the fatigue cracking resistance of interface
reinforced with the lap spliced existing reinforcement. As shown in Figure 8.2 (c),
specimen LS-3 simulates the retrofit of an existing bridge replacing mechanical joints with
an ECC link slab. This specimen was prepared by removing the ECC from the link slab
portion of specimen LS-2 and pouring new ECC into the removed portion. The existing
No.6 reinforcements were cut out with 20 in. left at both ends of link slab. These 20 in.
exposed No.6 bars were lap spliced with new No.5 bars to simulate the retrofit of an
existing bridge. A reinforcement ratio of 0.01, which is lower than that of specimen LS-1

65
and LS-2, was employed as the reinforcement ratio of the specimen LS-3. The following
steps were followed to prepare specimen LS-3 after the fatigue test on specimen LS-2.
1. Mark the section of the deck to be cut out.
2. Provide saw cut across the width and depth of the deck to cut out the link slab
portion of specimen LS-2 except for the lap splice portion.
3. Mark the section of the deck to be chipped out and provide a 1 in. deep saw cut
across the width of the deck.
4. Chip out the ECC using hand held pneumatic breaker.
5. Place new reinforcements with 20 in. lap splice length.
6. Place formwork and a layer of roofing paper on the top flange for debonding.
7. Mix and Pour ECC into formwork to create the ECC link slab.
8.2 Experimental Setup and Procedure
The experimental investigation of ECC link slabs was conducted using a
representative section (28” wide) of a link slab between the inflection points of the
adjacent deck slabs (128” long). The zero moment condition at the inflection points as
well as the boundary conditions at the pier were simulated by roller supports at the
specimen end supports and at the load points (Figure 8.4). For practical purposes, the test
setup represents an inverted orientation of the link slab region.
The loading sequence chosen was similar to the procedure adapted by MDOT. As
shown in Figure 8.5, all specimens were subjected to sequential static loading up to two
times the deflection causing a reinforcement stress in the specimen LS-1 of 40% of its
yield strength, which is the current limit stress criterion for concrete link slab design. The
final step of sequential static loading stage simulates potential overload (midspan
deflection 0.375 used). In the subsequent cyclic loading procedure, the load at 40% yield
of the reinforcement in LS-1 is chosen as the mean load with amplitude up to maximum
deflection at 0.00375 rad. end rotation angle (Figure 8.5). This maximum rotation angle
θmax (0.00375 rad.) corresponds to the allowable deflection of a bridge span under live load
(∆max, Lsp/800 in AASHTO code).

66
radL
LEI
PLEIPL sp
sp
sp
sp
spsp
00375.038001648/
2
3maxmax
max ==∆
=∆
∆= θθ (Eq. 8-1)
where Lsp is bridge span length and EIsp is flexural rigidity of the bridge section. Cyclic
loading was carried out to 100,000 cycles due to restrictions in the availability of the
testing equipment. It should be noted that these test conditions are five times that
assumed under field conditions in terms of the bending moment since the debond length
is 2.5% of span in test instead of 5%.(Calculated by Eq. 2-3 and shown in Table 8.1).
Figure 8.4 Laboratory test setup and instrumentation of specimen.
128”
9’
14”96”50”

67
Figure 8.5 Loading sequence, in which the midspan deflections at step4 corresponds to the load at the reinforcement stress equal to 0.4σy in specimen LS-1. Table 8.1 Comparison between laboratory testing condition and field condition
Condition End Rotation Angle θ Debond length Ma *
Field
Lab. testing
0.0015 rad.**
0.00375 rad.
5.0% of span length
2.5% of span length
Ma in field
5 times of Ma in field
* Moment developed in the link slab at end rotation angle θ; (Eq. 2-3) ** End rotation angle expected in field as derived in Caner and Zia (1998)

68
During testing, the applied load, displacements, rotation angles, strains at the
compressive face of link slab at midspan and interfacial crack width of the specimen as
indicated in Figure 8.4 are monitored using a data acquisition system. Cracks are marked
and crack widths are measured at each loading sequence during the monotonic pre-loading
procedure as well as at every 10,000 cycles during the cyclic loading procedure.
8.3 Monotonic Behavior of Link Slab Specimens
A monotonic test on the link slab specimen was conducted before fatigue testing.
After this initial test, the experimental data were examined and fatigue testing was
continued. For LS-1, at a midspan deflection of 0.06” (first step), a small transverse crack
formed across the deck near the midspan of the link slab. The crack width gradually grew
wider during subsequent loading and reached 0.005” at the final deflection step (0.37”) of
the monotonic pre-loading test. Additional cracks appeared and propagated across the
width of the link slab as the midspan deflection was increased. Ultimately, seven cracks
were observed during pre-loading test. Two of those cracks formed within the gage length
(9”) of LVDTs at midspan. The crack widths within the gage length were below 0.002” up
to final deflection step while the width of the largest cracks that deveolped kept growing
(0.005” at final deflection step) as the loading step increased. In contrast to that, several
microcracks appeared in the debond zone of LS-2 and LS-3 at a midspan deflection of
0.06” (first step) and 0.1” (second step). Additional hairline cracks formed as the midspan
deflection was increased. All the crack widths remained below 0.002” up to the final
deflection step (0.375”) of pre-loading test.
Figure 8.6 shows the load vs. midspan deflection curves of the three specimens
tested. Significant differences in the global response of specimens LS-1 and LS-2 are not
apparent. However, the responses in an individual cross section were distinct for the
concrete and ECC link slabs. Figure 8.7 illustrates the strain distribution at three locations
across the midspan section at each loading step. In this figure, the matrix strain at the
tension face and the reinforcement strain were calculated by dividing the measured LVDT

69
0
5
10
15
20
25
30
0 0.05 0.1 0.15 0.2 0.25 0.3 0.35 0.4
Load
(kip
s)
Midspan Deflection (in.)
(a) LS-1
0
5
10
15
20
25
30
0 0.05 0.1 0.15 0.2 0.25 0.3 0.35 0.4
(b) LS-2
Load
(kip
s)
Midspan Deflection (in.)
0
5
10
15
20
25
30
0 0.05 0.1 0.15 0.2 0.25 0.3 0.35 0.4
(c) LS-3
Load
(kip
s)
Midspan Deflection (in.) Figure 8.6 Applied load vs. midspan deflection curves during pre-loading test (step1: 0.06in., step2:
0.10in., step3: 0.14in., step4: 0.185in., and step5: 0.375in. in midspan deflection) on (a) LS-1; (b) LS-2; and (c) LS-3.
1
23
4
5
1 2
34
5
1 2
34
5
θ = 0.0015rad.
θ = 0.0015rad.
θ = 0.0015rad.
(a) LS-1

70
(a) LS-1
-9
-6
-3
0
-0.15 -0.1 -0.05 0 0.05 0.1 0.15 0.2 0.25 0.3
Strain (%)
Dis
tanc
e fro
m te
nsio
n fa
ce (i
n.) .
Rebar
1 2 3 4 5
0.4 of Rebar yield
(b) LS-2
-9
-6
-3
0
-0.15 -0.1 -0.05 0 0.05 0.1 0.15 0.2 0.25 0.3
Strain (%)
Dis
tanc
e fro
m te
nsio
n fa
ce (i
n.) .
Rebar
1 2 3 4 5
0.4 of Rebar yield
(c) LS-3
-9
-6
-3
0
-0.15 -0.1 -0.05 0 0.05 0.1 0.15 0.2 0.25 0.3
Strain (%)
Dis
tanc
e fro
m te
nsio
n fa
ce (i
n.)
.
Rebar
1 2 3 4 5
0.4 of Rebar yield
Figure 8.7 Strain distribution measured at three data points across the midspan section at each
loading step (step1: 0.06in., step2: 0.10in., step3: 0.14in., step4: 0.185in., and step5: 0.375in. in midspan deflection) for (a) LS-1; (b) LS-2; and (c) LS-3.
0.4 of Reinforcement yield
Reinforcement
0.4 of Reinforcement yield
0.4 of Reinforcement yield
Reinforcement
Reinforcement

71
displacement by the gage length (9 in.) while strains at the compression face were obtained
by averaging data measured from two strain gages placed on the compression face of the
link slab at midspan. A comparison of stresses in the reinforcement at the design rotation
angle 0.0015 rad. revealed the reinforcement strain of the ECC link slab LS-2 (~0.02%)
was relatively smaller than that of the concrete link slab LS-1 (~0.03%). The difference
between these two reinforcement stresses became larger as the midspan deflection was
increased. This is due to the strain hardening and microcracking of ECC material allowing
for compatible deformation of the ECC matrix with reinforcing bars as well as due to the
lower stiffness of ECC as compared to concrete in compression.
A comparison of the sequential strain development at midspan section in the three
specimens confirms the strain compatibility of ECC link slabs (Figure 8.7). Because of the
different distances from the neutral axis of the beam, the measured strain on the tensile
face (of concrete and ECC) should be higher than that in the reinforcing bar, if the beam is
acting elastically. At a midspan deflection of 0.14 in. (third step), the strain of
reinforcement became almost identical to the concrete strain at the tension face in LS-1
specimen. The reinforcement strain became even larger than the concrete strain at the
tension face during subsequent loading. This indicates that the concrete in specimen LS-1
lost compatibility with reinforcements due to the localized cracks outside the gage length
of the LVDT. For the ECC link slabs, the difference between the strain of reinforcement
and the ECC strain at tension face was maintained in a proportional manner, i.e., the three
strain data points; ECC at tension face, reinforcement depth, and ECC at compression face,
recorded at each step can be plotted on a straight line (Figure 8.7).
As shown in Figure 8.8, the compatible deformation between reinforcement and
ECC initiate minimal interfacial shear stress if it exists at all, resulting in intact interface
between steel bar and ECC. There is basically no shear lag between reinforcing bars and
the surrounding ECC material in steel-reinforced ECC (R/ECC) while the brittle fracture
of concrete in R/C causes unloading of concrete, resulting in high interfacial shear and
interfacial bond failure (Li, 2002). Stress concentrations on the reinforcement are
nonexistent even as the ECC is experiencing micro crack damage. Subsequently, the
yielding of the reinforcement is delayed in the ECC matrix compared with that in the
concrete matrix. In a study conducted by Fischer and Li (2002) on the tension stiffening

72
behavior of R/C and R/ECC, strain jumps were measured locally by strain gages attached
to the reinforcing bar in concrete whenever the concrete cracked, but these stress jumps
were not observed in the reinforcement in the ECC matrix. This unique behavior is caused
by ECC material exhibiting a metal-like behavior and deforming compatibly with
reinforcing bars. The micro cracks (< 0.002” in widths) developed in ECC act as inelastic
damage distributed over the bulk volume of ECC. In contrast, beyond the elastic limit,
concrete experienced localized fracture.
Figure 8.8 Compatible deformation between ECC and steel reinforcement (right) showing microcracking in ECC with load transmitted via bridging fibers. In contrast, the brittle fracture of concrete in normal R/C (left) causes unloading of concrete, resulting in high interfacial shear and bond breakage (Fischer and Li, 2002).
Assuming the same end rotation angle, θ, in both R/C and R/ECC members as seen
in Figure 8.9, the members must have an identical curvature, Φ, based on identical span
length L as shown in the following equation:
LEILEI
EIM θθ 212
===Φ (Eq. 8-2)

73
where M is the moment induced by end rotation angle, as determined by Eq.2-3, and EI is
flexural rigidity. The neutral axis in R/ECC section is located closer to reinforcement
when compared to a R/C section, since ECC in tension carries force while deforming
compatibly with the reinforcement. Due to the difference in the location of neutral axis,
however, the reinforcement strain in R/C is higher than in R/ECC (Figure 8.9). Lower
reinforcement stress developed in the ECC link slab indicates that the amount of
reinforcement in an ECC link slab can be reduced, resulting in lower structural stiffness.
This will be discussed again in the next section on the fatigue cracking resistance of link
slabs.
Figure 8.9 Comparison of reinforcement stress in between R/C beam and R/ECC beam with the
same geometry and reinforcement ratio at identical rotation angle, θ, and curvature, Φ.
Reinforcement strain (~0.03%) of the concrete link slab at the design rotation angle
of 0.0015 rad. did not reach 40% of the yield strain (~0.08%). This demonstrates that the
assumption of the link slab in an uncracked condition caused the design moment Ma, based
on current limit stress criterion (Caner and Zia, 1998), overestimates the required amount
R/C
R/ECC
Neutral Axis
Neutral Axis
H
H
Strain Section
B
B
Hct εε −
=Φ
ct εε −
ct εε −
θ θ
θ θ
LEILEI
EIM θθ 212
===Φ
L
L
ssEε
ssEε
Stress

74
of longitudinal reinforcement in the link slab (see Section 2). It should also be noted that
the maximum strain at the tension face was measured to be lower than 0.1% at a design
load corresponding to 0.0015rad. end rotation angle. Considering the relative magnitude
of these quantities (0.1% strain caused by end rotation, 3% strain capacity), the ECC
material in link slabs remains in the early strain-hardening regime.
8.4 Fatigue Cracking Resistance of Link Slab Specimens
Based on the monotonic test results of concrete specimen LS-1, the load at 40%
yield of the reinforcement (~15 kips) was chosen as the mean load level with an
amplitude up to a maximum deflection that created an end rotation of 0.00375 radians.
Consequently, 0.16in. deflection amplitude was cyclically imposed on the link slab
specimens. Figure 8.10 illustrates the response to cyclic loading as a function of midspan
deflection during the test of specimen LS-3. This specimen was loaded from 5.8 kips up
to 23.2 kips (mean load level = (23.2-5.8)/2+5.8 =14.5 kips) with the maximum midspan
deflection of 0.24in. calculated by subtracting initial residual deflection (~0.13in. caused
by pre-loading test) from total deflection (~0.37in.). This maximum midspan deflection
corresponds to the maximum end rotation angle of approximately 0.00375 radians.
0
5
10
15
20
25
0.1 0.15 0.2 0.25 0.3 0.35 0.4
Appl
ied
Load
(kip
s)
Midspan Deflection (in.) Figure 8.10 The response of midspan deflection vs. actuator force (load) behavior to cyclic deflection
during cyclic test on specimen LS-3.
Max. deflection during cyclic test 0.24”
Deflection amplitude 0.16”

75
Cyclic test data (Load, midspan displacement and rotation at load point and
support) was periodically recorded at every 10,000 cycles. The recorded data indicates
that the stiffness of the specimens (slope of load-midspan deflection curve) remained
unchanged during the cyclic testing, i.e., there was no global damage observed (Figure
8.11). However, the structural stiffness of specimen LS-3 was measured to be lower than
those of the other two specimens while specimen LS-1 and LS-2 had a similar stiffness.
This is due to the relatively low reinforcement ratio of LS-3, which was deliberately
chosen based on relatively low reinforcement stress in ECC link slabs compared to
concrete link slab. Realization of low structural stiffness will be an advantage of an ECC
link slab since the structural effect on the main bridge span can be minimized when the
link slab acts more like a hinge rather than a continuous element.
0
20
40
60
80
100
120
140
0
0.01
0.02
0.03
0.04
0.05
0 2 104 4 104 6 104 8 104 1 105
Stif
fnes
s (k
ips/
in.) Crack W
idth (in.)
Number of Loading Cycles
Stiffness
Crack Width
LS-2
LS-1
LS-3
LS-1
LS-2, LS-3
Figure 8.11 Stiffness change and crack width evolution of link slab specimens during cyclic test
Although global damage did not occur in any of the specimens, the cracking
patterns were distinctly different for the concrete and ECC link slabs. For LS-1, no
additional cracks were seen and the existing cracks generated during the pre-loading stage
gradually grew wider. The crack widths in concrete ultimately reached 0.025” at 100,000
Stif
fnes
s of
Spe
cim
ens

76
loading cycles (Figure 8.11), which corresponds to a permeability coefficient of 10-2in/s,
as revealed in Figure 4.7. In contrast, additional microcracks appeared as the number of
loading cycles increased for in ECC link slab specimens (LS-2 and LS-3), while the
existing crack widths were maintained below 0.002”, slightly opening and closing at the
maximum and minimum loads, up to 100,000 cycles. As shown in Figure 4.7, the 0.002”
crack width in ECC specimens relates to a small permeability of 10-9in/s, which is 7
magnitudes lower than that of concrete. This laboratory testing of ECC link slab again
suggests that the low permeability of ECC due to tight crack width control by itself is
expected to positively affect the durability of an ECC link slab, particularly under severe
environmental conditions.
Figure 8.12 presents the comparison of the marked crack pattern between LS-1,
LS-2, and LS-3. A large number of hairline cracks were observed in the ECC link slab
specimens while a small number of large cracks in LS-1 specimen were observed. This
demonstrates that fatigue cracking resistance of ECC link slabs, in terms of crack width, is
independent of the reinforcement ratio because of the inherent multiple cracking and tight
crack width control of ECC. Such reduced crack width and high ductility in ECC indicate
the potential realization of macroscopically crack free concrete bridge deck systems with
ECC material in link slabs. It is also expected that the low permeability of ECC due to
relatively small crack widths will enhance the durability of an ECC link slab particularly
under severe environmental conditions, such as in regions where deicing salts are
frequently used.
Besides the stress limitation requirement described above, the current design
procedure of concrete link slab also requires limiting the maximum crack width at the top
of the link slab. A minimum reinforcement ratio 0.015 has been suggested with a clear
cover of 2.5 in. for controlling the crack width in the concrete link slab (Oesterle et al,
1999). Therefore, the inherent tight crack width of ECC material is expected to provide a
more efficient link slab design due to the decoupling of crack width and reinforcement
ratio in addition to other advantages represented by enhanced durability, lower structural
stiffness and compatible deformation of ECC link slabs.

77
Figure 8.12 Crack pattern marked with black ink pen after cyclic test for (a) LS-1; (b) LS-2 and (b)
LS-3.
(a) LS-1
(b) LS-2
(c) LS-3

78
It should also be noted that there was no cracking observed at the interface between
R/C deck slab and ECC link slab (Figure 8.13). In contrast, the cracking formed over the
debond span of link slab up to the location of shear studs. This indicates that cracks
should have appeared at the concrete/ECC interface if it had been located at the end of
debond zone. The modification of the design to locate the concrete/ECC material interface
away from the structural interface between the debond zone and girder/deck composite
zone prevented cracking at the material interface. Furthermore, the additional shear studs
placed between these two interfaces provided composite action between girder and ECC
slab. As a result, concrete/ECC interface cracking caused by stress concentrations is
prevented. Instead, cracking is limited to within the bulk part of ECC, where higher
strength and sufficient strain capacity exist to accommodate the higher stress. This
modification of the interface from conventional link slab design will provide enhanced
integrity of concrete/ECC interface, preventing undesirable interfacial cracking, which has
been partially demonstrated in Section 6.
8.5 Conclusions from laboratory testing of ECC link slab
To demonstrate the potential realization of a durable concrete bridge deck system
by the use of an ECC material in link slabs, monotonic and subsequent cyclic tests of full-
scale ECC link slabs were performed. The test results were compared with those of a
conventional concrete link slab. Prior to the preparation of the link slab specimens, a
proper ECC material was chosen for meeting the property requirements for link slab
applications. The following conclusions can be drawn from the current experimental
results:
1. Property requirements of ECC material for link slabs were examined prior to
material choice. It was revealed that the property requirements for link slab applications
were satisfied with the hardened properties of ECC material chosen in the present study.
This ECC exhibited strain-hardening behavior with tensile strain capacity of 3-5%
accompanied by multiple cracking with crack widths below 0.004” while maintaining
workability suitable for large volume mixing and casting in the field.

79
Figure 8.13 Crack pattern marked with black ink pen at tension surface of transition region between debond zone and composite section in (a) LS-2; and (b) LS-3.
composite debond
Shear stud
Concrete ECC
(a) LS-2
Shear stud
(b) LS-3
Concrete ECC composite debond

80
2. Monotonic test results revealed the compatible deformation mode of the ECC
link slab. The high tensile ductility of ECC material allows the ECC matrix to deform
compatibly with the reinforcing bars. As a result, yielding of the reinforcement was
delayed in the ECC matrix when compared with that in the concrete matrix. Lower
reinforcement stress in the ECC link slab implies a smaller amount of reinforcing bars
required, resulting in lower structural stiffness of the link slab. The lower reinforcement
stress is confirmed in the ECC link slab, in comparison to the reinforcement stress in the
concrete link slab, at the same reinforcement ratio.
3. From the monotonic tests, the maximum tensile strain in the ECC link slab
measured at the design end rotation angle remained within the early strain-hardening
regime. This confirmed the adequacy of the strain capacity of the ECC used in this study.
Indeed, there is room to employ an ECC with slightly lower tensile strain capacity, with
potential material cost saving.
4. The cyclic tests performed on three link slabs revealed that the stiffness of the
three specimens remained unchanged during cyclic testing. However, the crack widths of
the concrete link slab (0.025”) at 100,000 loading cycles were substantially larger than
those of the ECC link slabs (< 0.002”), by one order of magnitude. The tight crack width
of ECC under cyclic loading will positively contribute to the durability of an ECC link
slab and the potential realization of durable concrete deck systems as well. In terms of
crack width limitations, the use of ECC, with crack widths and spacing as inherent
material properties, will decouple the dependency of crack width on the amount of
reinforcement, i.e. the reinforcement ratio. This decoupling allows the simultaneous
achievement of structural need (lower flexural stiffness of the link slab approaching the
behavior of a hinge) and durability need (crack width control) of the link slab.
5. There was no cracking observed at the interface between ECC link slab and
R/C deck slab during cyclic testing, while cracking formed over the debond span of the
link slab up to the shear studs. This is due to the fact that the modified location of
concrete/ECC interface as well as the additional shear studs installed in ECC link slab,
caused a shifting of the stress concentration from the concrete/ECC interface to the inner
part of the ECC link slab. This modification is expected to provide enhanced integrity of
the interface, preventing interfacial cracking.

81
The above conclusions support the contention that durable jointless concrete bridge
decks may be designed and constructed with ECC link slabs.
9.0 Design guideline of ECC link slab
Notation of live load, geometry, material properties
As = Total area of longitudinal reinforcement in ECC link slab
Bls = Width of ECC link slab (same as width of bridge deck)
EECC = Elastic modulus of ECC
EIsp = Flexural rigidity of the bridge section (girder and concrete deck)
Hls = Height of ECC link slab
Ils,g = Moment of inertia of ECC link slab (uncracked)
Ldz = Length of debond zone = (5 % Lsp) x 2
Lls = Length of ECC link slab
Lsp = Length of bridge span (assuming same length for adjacent spans)
Ma = Design moment assuming a uncracked link slab
Ma,cr = Actual moment developed in a cracked link slab
P = Live load
wmax = Maximum crack width at the tension face of the link slab
θ = Expected rotation angle
ρ = Reinforcement ratio of ECC link slab, As/ Bls Hls
σf = First crack strength of ECC
σs = Stress of reinforcement
σy = Yield strength of steel
Current design criteria for concrete link slabs are the stress in the reinforcement
(σs) at an expected rotation angle (θ), and the maximum crack width (wmax) at the tension
face of the link slab. As detailed in Section 1, the derivation of the stress in the
reinforcement is conservative, yet incorrect since the expected applied moment (Ma) is
determined assuming a uncracked link slab, which is consequently relatively stiff and
will develop a relatively large resisting moment at a given imposed rotation angle. In

82
reality, the concrete link slab resists the moment Ma in the cracked condition. However,
the reinforcement ratio ρ is chosen for an expected moment Ma in the uncracked
condition.
By assuming the ECC link slab in an uncracked condition, the design moment
(Ma) at the expected rotation angle (θexp) will exceed the actual moment (Ma,cr) that the
ECC link slab develops at this angle in the cracked condition. This leads to a conservative
estimate of the required amount of longitudinal reinforcement in the link slab to satisfy
the limit stress criterion(σs<0.4σy). Unlike the concrete link slab, however, the minimum
reinforcement ratio for limiting crack width is not considered in ECC link slab design,
since the use of ECC, with crack width and spacing as inherent material properties,
decouples the dependency of crack width on the amount of reinforcement, i.e. the
reinforcement ratio.
Based on the results of the present study, a simple design method can be
developed as follows:
Scope
This design guideline provides minimum requirements for design of ECC link
slab for retrofit of existing simple span bridges.
For ECC material used in this design, the specified ultimate tensile strain capacity
shall not be less than computed by equation 9-1.
The material shall exhibit multiple cracking with controlled crack width
(< 0.004”) and spacing (< 0.1”) in uniaxial tension test.
The specified compressive strength shall not be less than 4,500psi.
LLshdz
spTls L
LTεε
βαε ++
⋅∆⋅= (Eq. 9-1)
where:
lsε : required tensile strain capacity
shε : shrinkage strain of ECC
LLε : maximum tensile strain due to live load
Tα : coefficient of thermal expansion of the span
T∆ : temperature variation
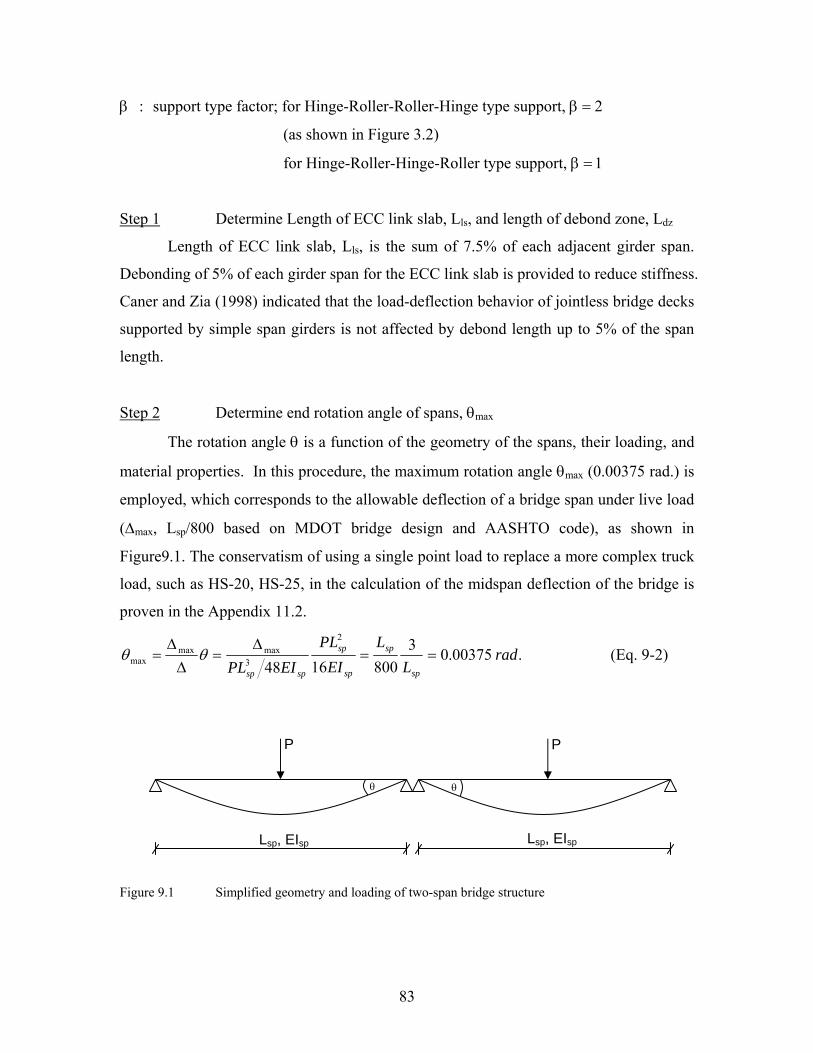
83
β : support type factor; for Hinge-Roller-Roller-Hinge type support, β = 2
(as shown in Figure 3.2)
for Hinge-Roller-Hinge-Roller type support, β = 1
Step 1 Determine Length of ECC link slab, Lls, and length of debond zone, Ldz
Length of ECC link slab, Lls, is the sum of 7.5% of each adjacent girder span.
Debonding of 5% of each girder span for the ECC link slab is provided to reduce stiffness.
Caner and Zia (1998) indicated that the load-deflection behavior of jointless bridge decks
supported by simple span girders is not affected by debond length up to 5% of the span
length.
Step 2 Determine end rotation angle of spans, θmax
The rotation angle θ is a function of the geometry of the spans, their loading, and
material properties. In this procedure, the maximum rotation angle θmax (0.00375 rad.) is
employed, which corresponds to the allowable deflection of a bridge span under live load
(∆max, Lsp/800 based on MDOT bridge design and AASHTO code), as shown in
Figure9.1. The conservatism of using a single point load to replace a more complex truck
load, such as HS-20, HS-25, in the calculation of the midspan deflection of the bridge is
proven in the Appendix 11.2.
.00375.038001648
2
3maxmax
max radL
LEI
PLEIPL sp
sp
sp
sp
spsp
==∆
=∆
∆= θθ (Eq. 9-2)
Figure 9.1 Simplified geometry and loading of two-span bridge structure
P P
θ θ
Lsp, EIsp Lsp, EIsp

84
Step 3 Determine moment of inertia of link slab (uncracked) The moment of inertia of the link slab in the uncracked condition is a function of
the cross-sectional geometry and independent of the reinforcement ratio.
12
3
,lsls
glsHB
I = (Eq. 9-3)
Figure 9.2 Cross-sectional dimensions and reinforcement of link slab in uncracked condition
Step 4 Determine moment Ma developed in the link slab at rotation angle θmax
The moment developed in the uncracked ECC link slab is a function of the material
properties and geometrical dimensions. It is proportional to the imposed rotation angle
θmax.
max,2
θdz
glsECCa L
IEM = (Eq. 9-4)
Figure 9.3 Deformed shape of link slab at imposed rotation angle θ
Step 5 Determine required longitudinal reinforcement ratio
The amount of reinforcement is calculated by non-linear sectional analysis
(shown in the Appendix 11.1), based on the assumption that ECC is an elastic-perfectly
plastic material, as shown in Figure 9.4. The reinforcement ratio is designed using a
conservative working stress, such as 40% of the yield strength of the reinforcement,
based on Ma. In order to satisfy this condition ( ys σσ 40.0≤ ), the amount of
reinforcement (As), i.e. the reinforcement ratio ρ , is to be adjusted.
Bls (same as width of bridge deck)
Hls As
θmax
Ldz, Ils,g
Hls θmax

85
Figure 9.4 Schematic stress and strain profile in a cross section of link slab for calculation of required longitudinal reinforcement ratio (profile of R/C is shown for comparison)
As shown in Figure 9.5, a simple design chart has been developed based on
aforementioned concept and assuming a link slab width b of 28 in (Appendix 11.1). To
use this design chart, first calculate the 28 inch portion of the imposed maximum moment
Ma, i.e., M = (28/Bls) Ma. Then find the corresponding reinforcement ratio from the
design curve, revealed in Figure 9.5, which is the required longitudinal reinforcement
ratio.
StrainSection Stress
N.A. H
b
sε ssEε
R/C
cε
N.A. H
StrainSection
b
Stress
sε
R/ECC
cε
ssEε

86
0
200
400
600
800
1000
0 0.002 0.004 0.006 0.008 0.01 0.012 0.014
Reinforcement Ratio
Moment M (kip-in)
Note: b = 28 inch, h = 9 inch, EECC = 2500 ksi, σf = 0.5 ksi, Es = 29000 ksi, σy = 60 ksi assumed.
Figure 9.5 Design chart for required longitudinal reinforcement ratio
Step 6 Shear connectors (Shear studs) in the interface region
In the interface region between the ECC link slab and the concrete deck, the
location of shear studs connecting the steel girder and the bridge deck are extended
within the ECC link slab by 2.5% of span length, reducing interfacial stress (Figure 9.6).
The AASHTO code can be applied for the design of shear studs in the transition zone.
According to the results of pushout tests on ECC specimens, the shear load capacity of
ECC/stud connection is higher than that determined based on the AASHTO code. Fifty
percent more shear studs, compared to that in simple span bridge, is suggested to be
placed in the transition zone to account for the stress concentration at the end of debond
zone.

87
Figure 9.6 Conceptual illustration of the interface design between ECC link slab and concrete deck
Step 7 Lap splice in the interface region
In addition to these shear studs, the existing longitudinal reinforcement is lap
spliced with new reinforcing bars in the interface region. The AASHTO code can be
used for the design of lap splices. From the test of reinforcementpullout in ECC, it was
found that ECC specimens show ductile frictional pullout behavior, without any splitting
and transverse macrocracking; therefore the adoption of the AASHTO code will provide
a conservative design. The end of the new reinforcement is suggested to be placed away
from the interface by 6” and staggered by 24”. This is for the purpose of preventing a
stress concentration at the end of the new reinforcement located at the concrete/ECC
interface.
10.0 Conclusions
The mechanical property requirements of ECC material for link slabs were
examined prior to material design. It was revealed that the requirements for link slab
applications were satisfied by the hardened properties of the specific ECC material
chosen (M45). This ECC exhibited strain-hardening behavior with tensile strain capacity
of around 3.5%, accompanied by multiple cracking with crack widths below 4mil, while
maintaining workability suitable for large volume mixing and casting in the field. The 3-
month and 6-month strain capacity of M45 is roughly 3.0%, which remains acceptable
for an ECC link slab application.
Debond zone
Transition zone New reinforcement of LS
Shear studs Existing reinforcement
ECC link slab

88
Despite relatively large free shrinkage deformations in ECC, the durability of an
ECC link slab is expected to be superior to that of a concrete link slab due to the tight
crack widths in ECC (~0.003”) under restrained drying shrinkage, resulting in drastically
reduced permeability. Even with the large shrinkage strain in ECC (~0.1%), it remains in
the early strain-hardening regime (>3% strain capacity). The use of a low-alkali cement
in ECC is not recommended since it has mininal influence on drying shrinkage as
compared with using ordinary Portland cement in Michigan.
Testing on freeze-thaw behavior indicates that ECC provides superior resistance
to deterioration when subjected to freeze-thaw cycles. Due to the high number of micro-
pores entrained in the matrix, the void space provided for water expansion and escape by
the ECC is adequate for excellent freeze-thaw protection. These micro-pores may be
accompanied by larger pores not sensitive to mercury intrusion, which may be adding to
the freeze-thaw protection capability.
A 6 inch embedment length (1/2 of the development length required by AASHTO
code) was shown to ensure yielding of epoxy-coated reinforcement in ECC pullout
specimens. This demonstrates that the development lengths determined according to the
AASHTO code will be adequate (on the conservative side) for the design of the ECC link
slab/concrete bridge deck interface. It is also noted that there was no reduction in bond
properties observed for epoxy-coated reinforcement in ECC compared to bare steel
reinforcement.
The pullout failure mode of reinforcement within ECC specimens (frictional
pullout) is more ductile when compared to concrete specimens (splitting) due to the high
toughness and ductility of ECC material. Therefore, the required lap splice length
determined according to the AASHTO code is expected to be conservative for the design
of reinforcing bars in ECC since the modification factors (1.3 or 1.7) were employed to
address potential brittle failure of the lap splice in concrete.
The pushout behavior and failure mode of ECC specimens were found to be much
more ductile than concrete due to the ductile nature of ECC and resulting microcracks
developed around shear studs, followed by large deformation of the studs. The average
load capacity per stud in ECC specimens sustained higher value than calculated based on
AASHTO code requirements, due to the shift of failure mode from brittle matrix fracture

89
to ductile steel yielding. The adoption of the AASHTO code for stud design in ECC is
expected to be conservative in terms of load capacity and failure mode.
Monotonic testing of ECC link slab revealed the compatible deformation mode of
the ECC link slab. The high tensile ductility of ECC material allows the ECC matrix to
deform compatibly with the reinforcing bars. As a result, yielding of the reinforcement
was delayed in the ECC matrix when compared with that in the concrete matrix. Lower
reinforcement stress in the ECC link slab implies a smaller amount of reinforcing bars
required, resulting in lower structural stiffness of the link slab. The lower reinforcement
stress is confirmed in the ECC link slab, in comparison to the reinforcement stress in the
concrete link slab, at the same reinforcement ratio.
From the monotonic tests, the maximum tensile strain in the ECC link slab
measured at the design end rotation angle remained within the early strain-hardening
regime. This confirmed the adequacy of the strain capacity of the ECC used in this study.
Indeed, there is room to employ an ECC with slightly lower tensile strain capacity, with
potential material cost saving.
The cyclic tests performed on three link slabs revealed that the stiffness of the
three specimens remained unchanged during cyclic testing. However, the crack widths of
the concrete link slab (0.025”) at 100,000 loading cycles were substantially larger than
those of the ECC link slabs (< 0.002”), by one order of magnitude. The tight crack width
of ECC under cyclic loading will positively contribute to the durability of an ECC link
slab, and the potential realization of durable concrete deck systems as well. In terms of
crack width limitations, the use of ECC, with crack widths and spacing as inherent
material properties, will decouple the dependency of crack width on the amount of
reinforcement, i.e. the reinforcement ratio. This decoupling allows the simultaneous
achievement of structural need (lower flexural stiffness of the link slab approaching the
behavior of a hinge) and durability need (crack width control) of the link slab.
There was no cracking observed at the interface between ECC link slab and R/C
deck slab during cyclic testing, while cracking formed over the debond span of the link
slab up to the shear studs. This is due to the fact that the modified location of
concrete/ECC interface as well as the additional shear studs installed in ECC link slab,
caused a shifting of the stress concentration from the concrete/ECC interface to the part of

90
the ECC link slab. This modification is expected to provide enhanced integrity of the
interface, preventing interfacial cracking.
The above conclusions support the contention that durable jointless concrete bridge
decks may be designed and constructed with ECC link slabs. Based on the above findings,
a simple design guideline is presented.
11.0 Appendix 11.1 Non-Linear Sectional Analysis
Figure 11.1 Strain and stress profile in a cross section of ECC link slab for calculation of required
longitudinal reinforcement ratio/moment capacity
Note: In this calculation, the geometry of the link slab is the same as these tested
and described in this research project (shown in Figure 11.1) and the material properties
are assumed as follows:
EECC = 2500 ksi
σf = 0.5 ksi
Es = 29000 ksi
σy = 60 ksi
Assuming a certain reinforcement ratio ρ (ρ=Αs/BH, defined in step 2 of Section
2.1), we can solve for moment capacity M by non-linear sectional analysis and by
limiting the stress in reinforcement to 0.4σy. (Alternatively, given a known moment
N. A. H = 9”
StrainSection
B = 28”
Stress
R/ECC
sε
cε
3” sσ
cσ
c x-c
3”
x
6-x Compression
Tension
fσfε
tε
d

91
capacity M, we can solve for the required reinforcement ratio ρ utilizing the same
method. However, it is more convenient to calculate using the first procedure while the
result should be the same.)
0008276.029000
)60(4.04.0====
s
y
s
ss EE
σσε
0002.02500
5.0===
ECC
ff E
σε
0008276.0
0002.0==
s
f
xc
εε
⇒ cx 14.4=
Similarly, c
cx
c
c
f
14.466 −==
− εε
⇒ c
cc
)14.46(0002.0 −=ε
Since the net force ∑ F equal to zero over the cross section of the link slab, therefore,
028)6(5.0285.028)3(289 =×−−×+×+−+×× xEccx cECCffs εσσρσ
Plug the actual value into above equation as follows:
0)14.46(0002.025005.05.05.0)314.3(5.09242
=−
×−××+++××c
cccρ
The above equation can be reduced to:
065.363.8765.52 =+−− ccc ρ
Assuming ρ equal to 0.01, therefore, the above equation becomes:
065.353.62 =+− cc
⇒ ⎩⎨⎧
=±
=×−±
=)("615.0
)_("915.52
30.553.62
65.3453.653.6 2
ApplyapplyNot
c
Hence, the moment capacity of the section can be calculated as follows (moment about
neutral axis):
3/2285.05.0))14.33(5.0(28)14.33( cccccM fECCTen ×××+++××+= σ
)(4.214
8.16.212inkip −=
+=
)(0.15414.42894.0 inkipcM ySteelTen −=×××= ρσ

92
)(7.3123/2)14.46(285.0 2 inkipcEM cECCECCComp −=×−×= ε
Finally, )(1.6817.3120.1544.214 inkipMMMM ECCCompSteelTenECCTen −=++=++=
Therefore, given ρ equal to 0.01, M is revealed 681.1 kip-in and vice versa. With
varying ρ, M can be obtained correspondingly and plotted as shown in Figure 9.5, which
can then be utilized for the design of the reinforcement ratio of the link slab.
Check: 11.05461.5615.0
14.43==
+=
cc
t
f
εε
)_%(3%18.0_max_ capacityStrainstraintensile t <<=⇒ ε OK
)_(7.88.2)14.46(0002.02500 strengtheCompressivksiksic
cE cECCc <=−
== εσ
OK
11.2 Simplified Loading of Bridge Span Using the bridge model shown in Figure 11.2 (For simplicity, only a I section
W44X335 with a moment of inertia of 31100 in4 is used), the conservatism of using a
single point load to replace a more complex truck load, such as HS-20, HS-25, in the
calculation of the midspan deflection of the bridge can be proven as follows:
First, a single point load with the same magnitude as HS-20 is applied in the
midspan, as shown in Figure11.2 (a), the deflection at the midspan, δ1=PL3/48EI, is 0.8 in.
Then the HS-20 truck load was applied in the midspan (Figure11.2 (b)) and a deflection,
δ2, of 0.7 in was obtained, which means the single point load does give a conservative
value as compared to HS-20 truck load. Similar conclusion can be drawn for HS-25
truck load since deflection is proportional to the load applied. Therefore, it is appropriate
and conservative to use a simplified midspan point load to replace the more complicated
HS-20 or HS-25 truck load in the structural analysis in terms of the deflection.

93
(a)
(b)
Figure 11.2 Schematics of two span simply supported bridge and loading for (a) resultant of
HS-20, and (b) HS-20
θ
P (Resultant of HS-20)
θ
Lsp, Isp Lsp, Isp
δ1 δ1
P (Resultant of HS-20)
θ
HS-20
θ
Lsp, Isp Lsp, Isp
HS-20
δ2 δ2

94
12.0 References: AASHTO, 1996, Standard specifications for highway bridges, 16th edition, American
Association of State Highway and Transportation Officials, Washington D.C., p.205
AASHTO, 2002, Standard Specifications for Highway Bridges, 17th edition, American
Association of State Highway and Transportation Officials, Washington D.C., 1052p.
ACI 318-2002, Building Code Requirements for Structural Concrete and Commentary,
2002, American Concrete Institute, Farmington Hills, Michigan 48333-9094
Alampalli, S. and A.P. Yannotti, 1998, In-Service Performance of Integral Bridges and
Jointless Decks, Transportation Research Record 1624, Paper No. 98-0540,.
An, L., and Cederwall, K., 1996, Pushout tests on studs in high strength and normal
strength concrete, Journal of constructional steel research, Vol. 36, No. 1, pp15-29
Ashley, S., 1996, Bridging the cost gap with composites. Mech. Eng., 118, pp76-80
Beltzung, F., Wittmann, F.H. and Holzer, L., 2001, Influence of composition of pore
solution on drying shrinkage, in Creep, Shrinkage and Durability Mechanics of
Concrete and other Quasi-Brittle Materials, edited by Ulm, F.-J., Bazant, Z.P. and
Wittmann, F.H., Elsevier Science Ltd.
Caner, A. and P. Zia, 1998, Behavior and Design of Link Slab for Jointless Bridge Decks,
PCI J., May-June, pp.68-80.
Cheng-yi, H., and Feldman, R.F., 1985. Dependence of Frost Resistance on the Pore
Structure of Mortar Containing Silica Fume. ACI Journal. Pp. 740-743.
Fischer, G. and V.C. Li, 2002, Influence of Matrix Ductility on Tension-Stiffening
Behavior of Steel Reinforced Engineered Cementitious Composites (ECC), ACI
Structural Journal, Vol.99, No.1, Jan.-Feb., pp.104-111.
Gergeley, P., and Lutz, L.A.,1968, Maximum crack width in reinforced concrete flexural
members, Causes, Mechanisms, and Control of Cracking in Concrete, SP-20, ACI,
Farmington Hills, MI
Kim, Y.Y., V.C. Li and H.J. Kong, 2003, Development of Sprayable Engineered
Cementitious Composites, HPFRCC4, Univ of Michigan, Ann Arbor, MI, pp233-243
Kong, H.J., S. Bike and V.C. Li, 2003, Constitutive Rheological Control to Develop a
Self-Consolidating Engineered Cementitious Composite Reinforced with Hydrophilic

95
Poly(vinyl alcohol) Fibers, Cement and Concrete Composites, Vol.25, No.3, pp.333-
341.
Li, V.C., Wu, H.C., Maalej, M., and Mishra, D.K., 1996, Tensile Behavior of Cement
Based Composites with Random Discontinuous Steel Fibers, J. American Ceramics
Society, Vol. 79, No. 1, pp. 74-78.
Li, V.C., 2002, Reflections on the Research and Development of Engineered
Cementitious Composites (ECC), Proceedings of the JCI International Workshop on
Ductile Fiber Reinforced Cementitious Composites (DFRCC) - Application and
Evaluation (DRFCC-2002), Takayama, Japan, Oct. pp.1-21.
Li, V.C., and G. Fischer, 2002, Reinforced ECC - An Evolution from Materials to
Structures, Proceedings of the First FIB Congress, Osaka, Japan, pp.105-122.
Litvan, G.G., 1983, Air Entrainment in the Presence of Superplasticizers. ACI Journal.
Pp. 326-331
MacGregor, J.G., 1998, Reinforced Concrete, Prentice-Hall, Inc., New Jersey. 939 pp.
Mindess, S., and Young, J.F., 1981, Concrete, Prentice-Hall, Inc., New Jersey. 391 pp.
Oesterle, R.G., H. Tabatabai, T.J. Lawson, T.M. Refai, J.S. Voltz and A. Scanlon, 1999.
Jointless and Integral Abutment Bridges – Summary Report, Final Report to Federal
Highway Administration, Washington D.C.,
Ollgaard, J.G., Slutter, R.G., and Fisher, J.W., 1971, Shear strength of stud connectors in
lightweight and normal-weight concrete, AISC Engineering Journal, April, pp.55-64.
Pigeon, M., Pleau, R., Azzabi, M., Banthia, N., 1996, Durability of Microfiber-
Reinforced Mortars., Cement and Concrete Research. Pp. 601-609
Shah, S.P., Karaguler, M.E. and Sarigaphuti, M.,1992, Effect of Shrinkage-Reducing
Admixtures on Restrained Shrinkage Cracking of Concrete, American Concrete
Institute Materials Journal, 89, pp. 289-295, May-June
Soudki, K., and Green, M., 1997, Freeze-Thaw Response of CFRP Wrapped Concrete,
Concrete International, Vol.19, No.8, pp. 64-67
Toutanji, H., and Balaguru, P., 1999, Effects of Freeze-Thaw Exposure on Performance
of Concrete Columns Strengthened with Advanced Composites, ACI Materials
Journal, Vol.96, No.5, pp. 605-610

96
Toutanji, H., and Deng, Y., 2002, Strength and Durability Performance of Concrete
Axially Loaded Members with AFRP Composite Sheets, Composites Part B:
Engineering, Vol.33, No.4, pp. 255-261
Wang, K., D.C. Jansen, and S. Shah, 1997, Permeability study of cracked concrete,
Cement and Concrete Research, Vol.27, No.3, pp. 381-393.
Wolde-Tinsae, A.M. and J.E. Klinger, 1987, Integral Bridge Design and Construction,
Report FHWA/MD-87/04, Maryland Department of Transportation, Jan.,
Yeih, W., Huang, R., Chang, J.J., and Yang, C.C., 1997, A pullout test for determining
Interface properties between reinforcementand concrete, Advanced cement based
materials No. 5, pp8-57-65.
Zhang, J., and Li, V.C., 2002, Introducing Ductile Strip for Durability Enhancement of
Concrete Slabs, ASCE J. of Materials in Civil Engineering, Vol .14, No. 3, June, pp.
253-261