Embed Size (px)
Citation preview

PRECAST LINK SLABS FOR JOINTLESS BRIDGE DECKS
Joel Reyes
and
Ian N. Robertson
Research Report UHM/CEE/11-09
December 2011
Prepared in cooperation with the:
State of Hawaii
Department of Transportation Highways Division
and U.S. Department of Transportation Federal Highway Administration

ii
iii
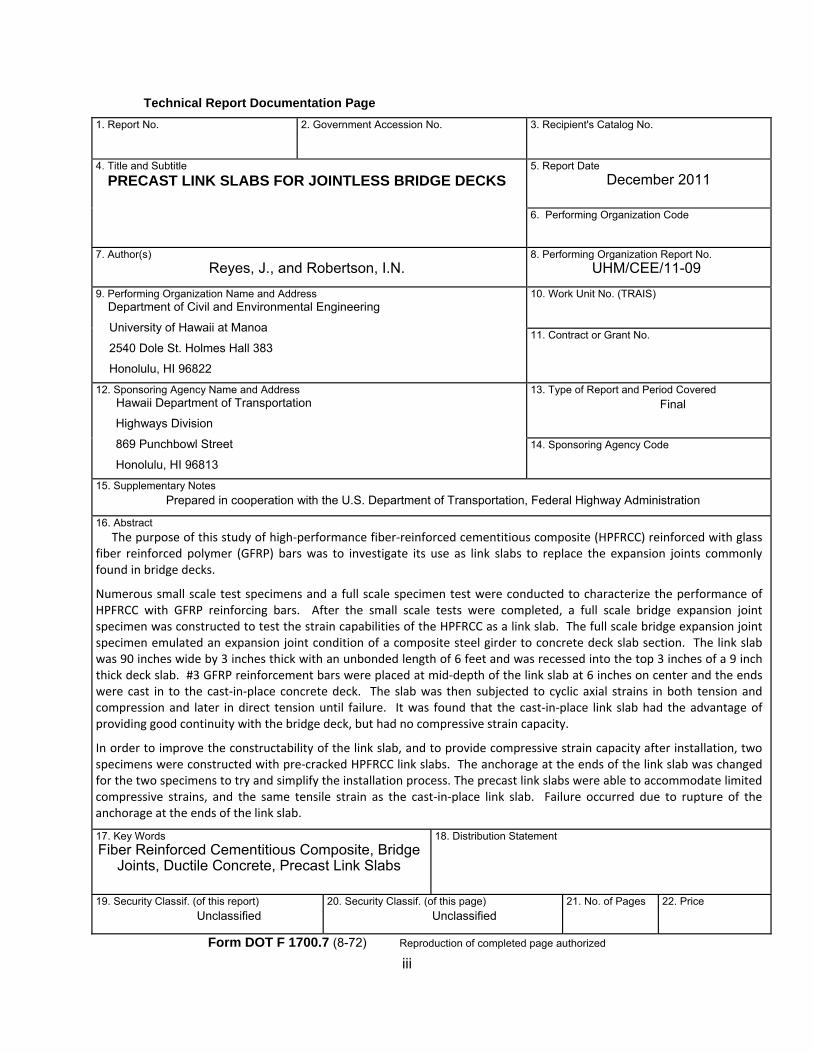
Technical Report Documentation Page
1. Report No.
2. Government Accession No.
3. Recipient's Catalog No.
4. Title and Subtitle
PRECAST LINK SLABS FOR JOINTLESS BRIDGE DECKS 5. Report Date
December 2011
6. Performing Organization Code
7. Author(s)
Reyes, J., and Robertson, I.N. 8. Performing Organization Report No.
UHM/CEE/11-09
9. Performing Organization Name and Address Department of Civil and Environmental Engineering
University of Hawaii at Manoa
2540 Dole St. Holmes Hall 383
Honolulu, HI 96822
10. Work Unit No. (TRAIS)
11. Contract or Grant No.
12. Sponsoring Agency Name and Address Hawaii Department of Transportation
Highways Division
869 Punchbowl Street
Honolulu, HI 96813
13. Type of Report and Period Covered
Final
14. Sponsoring Agency Code
15. Supplementary Notes
Prepared in cooperation with the U.S. Department of Transportation, Federal Highway Administration
16. Abstract
The purpose of this study of high‐performance fiber‐reinforced cementitious composite (HPFRCC) reinforced with glass fiber reinforced polymer (GFRP) bars was to investigate its use as link slabs to replace the expansion joints commonly found in bridge decks.
Numerous small scale test specimens and a full scale specimen test were conducted to characterize the performance of HPFRCC with GFRP reinforcing bars. After the small scale tests were completed, a full scale bridge expansion joint specimen was constructed to test the strain capabilities of the HPFRCC as a link slab. The full scale bridge expansion joint specimen emulated an expansion joint condition of a composite steel girder to concrete deck slab section. The link slab was 90 inches wide by 3 inches thick with an unbonded length of 6 feet and was recessed into the top 3 inches of a 9 inch thick deck slab. #3 GFRP reinforcement bars were placed at mid‐depth of the link slab at 6 inches on center and the ends were cast in to the cast‐in‐place concrete deck. The slab was then subjected to cyclic axial strains in both tension and compression and later in direct tension until failure. It was found that the cast‐in‐place link slab had the advantage of providing good continuity with the bridge deck, but had no compressive strain capacity.
In order to improve the constructability of the link slab, and to provide compressive strain capacity after installation, two specimens were constructed with pre‐cracked HPFRCC link slabs. The anchorage at the ends of the link slab was changed for the two specimens to try and simplify the installation process. The precast link slabs were able to accommodate limited compressive strains, and the same tensile strain as the cast‐in‐place link slab. Failure occurred due to rupture of the anchorage at the ends of the link slab.
17. Key Words
Fiber Reinforced Cementitious Composite, Bridge Joints, Ductile Concrete, Precast Link Slabs
18. Distribution Statement
19. Security Classif. (of this report)
Unclassified 20. Security Classif. (of this page)
Unclassified 21. No. of Pages
22. Price
Form DOT F 1700.7 (8-72) Reproduction of completed page authorized

iv
v
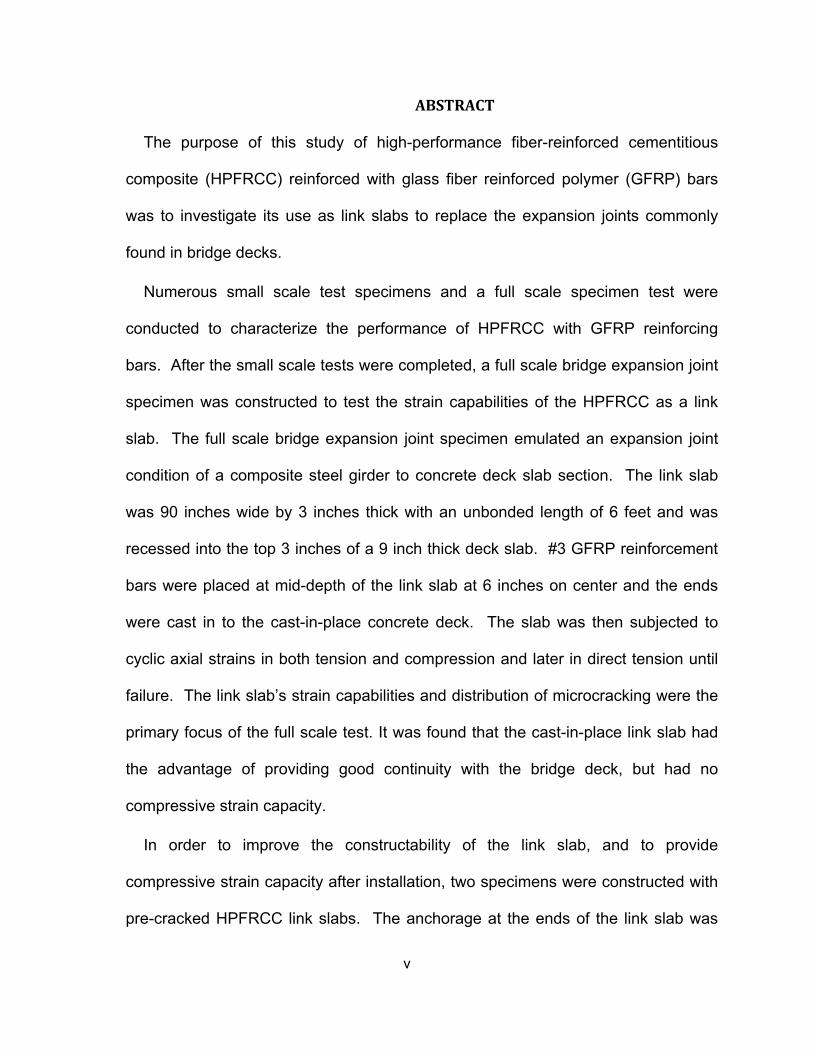
ABSTRACT
The purpose of this study of high-performance fiber-reinforced cementitious
composite (HPFRCC) reinforced with glass fiber reinforced polymer (GFRP) bars
was to investigate its use as link slabs to replace the expansion joints commonly
found in bridge decks.
Numerous small scale test specimens and a full scale specimen test were
conducted to characterize the performance of HPFRCC with GFRP reinforcing
bars. After the small scale tests were completed, a full scale bridge expansion joint
specimen was constructed to test the strain capabilities of the HPFRCC as a link
slab. The full scale bridge expansion joint specimen emulated an expansion joint
condition of a composite steel girder to concrete deck slab section. The link slab
was 90 inches wide by 3 inches thick with an unbonded length of 6 feet and was
recessed into the top 3 inches of a 9 inch thick deck slab. #3 GFRP reinforcement
bars were placed at mid-depth of the link slab at 6 inches on center and the ends
were cast in to the cast-in-place concrete deck. The slab was then subjected to
cyclic axial strains in both tension and compression and later in direct tension until
failure. The link slab’s strain capabilities and distribution of microcracking were the
primary focus of the full scale test. It was found that the cast-in-place link slab had
the advantage of providing good continuity with the bridge deck, but had no
compressive strain capacity.
In order to improve the constructability of the link slab, and to provide
compressive strain capacity after installation, two specimens were constructed with
pre-cracked HPFRCC link slabs. The anchorage at the ends of the link slab was

vi
changed for the two specimens to try and simplify the installation process. The
precast link slabs were able to accommodate limited compressive strains, and the
same tensile strain as the cast-in-place link slab. Failure occurred due to rupture of
the anchorage at the ends of the link slab.

vii
ACKNOWLEDGEMENTS
This report is based on a Masters’ Plan B report prepared by Joel Reyes under
the direction of Dr. Ian Robertson at the Department of Civil and Environmental
Engineering at the University of Hawaii at Manoa. The authors wish to thank Dr. Lin
Shen and Dr. Tianwei Ma for their assistance in reviewing this report.
The authors also wish to thank Dr. Gregor Fischer and Bryan Lum for their
assistance with the design, testing, and analysis of the link slab test specimens.

viii
ix
Table of Contents
1 Introduction ................................................................................................................ 1
1.1 Background ......................................................................................................... 1
1.2 Jointless Bridge Decks ....................................................................................... 3
1.3 Previous Research ............................................................................................. 4
2 Materials .................................................................................................................... 7
2.1 High-Performance Fiber-Reinforced Cementitious Composite (HPFRCC)
Polymer.......................................................................................................................... 7
2.2 Glass Fiber Reinforced Polymer(GFRP) Bars .................................................. 10
2.3 Test Setup ........................................................................................................ 11
2.4 Measurement Devices ...................................................................................... 14
2.5 Objective ........................................................................................................... 18
3 Approach .................................................................................................................. 21
3.1 Test Specimens #1 ........................................................................................... 21
3.2 Test Specimens #2 ........................................................................................... 23
3.3 Test Specimens #3 ........................................................................................... 29
4 Analysis .................................................................................................................... 33
4.1 Specimen #1 ..................................................................................................... 33
4.2 Specimen #2 ..................................................................................................... 41
4.3 Specimen #3 ..................................................................................................... 47
5 Discussion ................................................................................................................ 55
5.1 Specimen #1 ..................................................................................................... 55
5.2 Specimen #2 ..................................................................................................... 57
5.3 Specimen #3 ..................................................................................................... 59
6 Conclusions/Recommendations .............................................................................. 61
7 References ............................................................................................................... 63
8 Appendix A: Test Photos ......................................................................................... 66
8.1 Specimen #1 Observation Photo's .................................................................... 67
8.2 Specimen #2 Observation Photo's .................................................................... 71
8.3 Specimen #3 Observation Photo's .................................................................... 73
9 Appendix B: Test Specimen Layout ......................................................................... 76

x
xi
List of Figures
Figure 1-1: Neoprene pad supporting concrete girder ...................................................... 1
Figure 1-2: Typical Bridge Joint Sealer(Left), Cracks in Joint Sealer(Right) ..................... 2
Figure 1-3: Corrosion in pier or support beam .................................................................. 3
Figure 1-4: Bridge deck cold joint ...................................................................................... 3
Figure 2-1: Portland Cement(Left), #90 Orange County Silica Sand(Right) ..................... 8
Figure 2-2: #90 Silica Sand(Left), Polyethylene Fibers(Right) .......................................... 8
Figure 2-3: Polycarboxylic Ether Admixture(Left), Methyl Cellulose Admixture(Right) ..... 8
Figure 2-4: Hobart Mixer(Left), HPFRCC mix(Right) ......................................................... 9
Figure 2-5: #3 Glass Fiber Reinforced Bars .................................................................... 10
Figure 2-6: Framing Sections .......................................................................................... 11
Figure 2-7: Reinforced concrete slab viewed from cantilevered end of the girder
support(Left), Outer steel girder viewed from fixed end(Right) ....................................... 12
Figure 2-8: Girder support anchored to concrete slab below .......................................... 12
Figure 2-9: Expansion joint and girder gap viewed from outside(Left), viewed from
inside(Right) .................................................................................................................... 13
Figure 2-10: Unmounted clevis attached to actuator above ............................................ 14
Figure 2-11: Rectangular steel tubing viewed from above(Left), LVDT's measuring
displacement of steel section .......................................................................................... 15
Figure 2-12: Anchoring of the steel tubing at the bonded and unbonded sections ......... 15
Figure 2-13: LVDT measuring gap displacement ............................................................ 16
Figure 2-14: LVDT measuring steel girder displacement ................................................ 16
Figure 2-15: Strain Gauges ............................................................................................. 17
Figure 2-16: Sensor Layout ............................................................................................. 17
Figure 2-17: Sensor Layout ............................................................................................. 18
Figure 2-18: Specimen Frame Diagram .......................................................................... 19
Figure 3-1: Specimen Frame Diagram ............................................................................ 21
Figure 3-2: GFRP bar layout(Left), Bonded section and anchor hooks(Right) ................ 22
Figure 3-3: Debonding plexiglass .................................................................................... 22
Figure 3-4: Finished link slab and wood forming(Left), Link slab surface(Right) ............. 23
Figure 3-5: GFRP Layout and Formwork ........................................................................ 24
Figure 3-6: Precracking ................................................................................................... 24
xii
Figure 3-7: Precracking Setup ........................................................................................ 25
Figure 3-8: Anchors and Dowels ..................................................................................... 27
Figure 3-9: Vertical Dowels ............................................................................................. 28
Figure 3-10: Horizontal Dowels ....................................................................................... 28
Figure 3-11: Dowel Layout .............................................................................................. 29
Figure 3-12: Hydraulic Actuator ...................................................................................... 30
Figure 3-13: Link Slab ..................................................................................................... 30
Figure 3-14: Precracking Setup ...................................................................................... 31
Figure 3-15: Installed HPFRCC Link Slab ....................................................................... 32
Figure 4-1: Specimen #1 Actuator Load vs Cycles ......................................................... 33
Figure 4-2: Specimen #1 Actuator Load vs Displacement .............................................. 34
Figure 4-3: Specimen #1 Unbonded Section Stress vs Strain ........................................ 36
Figure 4-4: Specimen #1 Bonded Section Stress vs Strain ............................................ 37
Figure 4-5: Specimen #1 Unbonded Section vs Gap ...................................................... 39
Figure 4-6: Specimen #1 Bonded Section vs Gap Displacement ................................... 40
Figure 4-7: Specimen #2 Actuator Load vs Cycles ......................................................... 41
Figure 4-8: Specimen #2 Actuator Load vs Displacement .............................................. 42
Figure 4-9: Specimen #2 Unbonded Section Stress vs Strain ........................................ 43
Figure 4-10: Specimen #2 Bonded Section Stress vs Strain: Load to Failure ................ 44
Figure 4-11: Specimen #2 Unbonded Section Displacement vs Gap ............................. 45
Figure 4-12: Specimen #2 Bonded Section Displacement vs Gap: Load to Failure ....... 46
Figure 4-13: Specimen #1 Actuator Load vs Cycles ....................................................... 48
Figure 4-14: Specimen #3 Actuator Load vs Displacement ............................................ 49
Figure 4-15: Specimen #3 Unbonded Section Stress vs Strain ...................................... 50
Figure 4-16: Specimen #3 Bonded Section Stress vs Strain .......................................... 51
Figure 4-17: Specimen #3 Unbonded Section vs Gap .................................................... 52
Figure 4-18: Specimen #3 Bonded Section vs Gap ........................................................ 53
Figure 5-1: Specimen #1 Failure Diagram ...................................................................... 55
Figure 5-2: Specimen #2 Failure Diagram ...................................................................... 58
Figure 5-3: Specimen #3 Failure Diagram ...................................................................... 60

xiii
List of Tables
Table 1: HPFRCC Mixture Percentage by Weight ............................................................ 9
Table 2: Specimen #2 Precracking ................................................................................. 26
Table 3: Specimen #3 Precracking ................................................................................. 32
Table 4: Measuring Device Abbreviations and Descriptions ........................................... 79

xiv
1
1 Introduction
1.1 Background
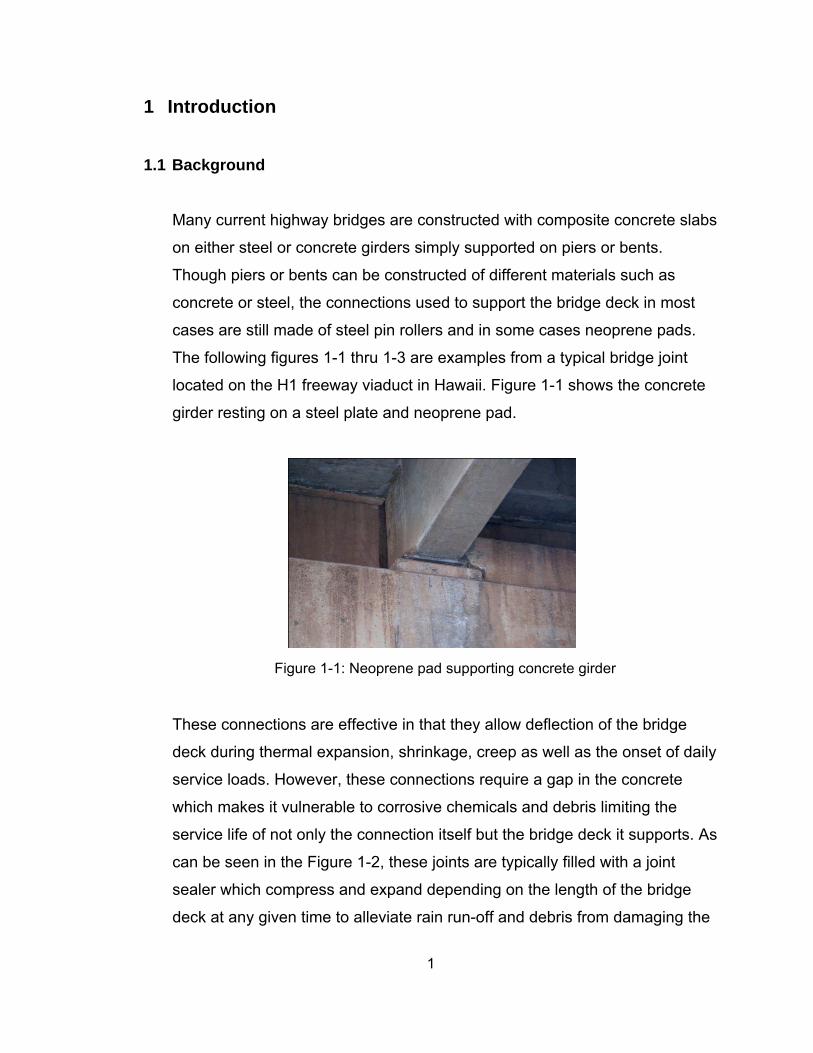
Many current highway bridges are constructed with composite concrete slabs
on either steel or concrete girders simply supported on piers or bents.
Though piers or bents can be constructed of different materials such as
concrete or steel, the connections used to support the bridge deck in most
cases are still made of steel pin rollers and in some cases neoprene pads.
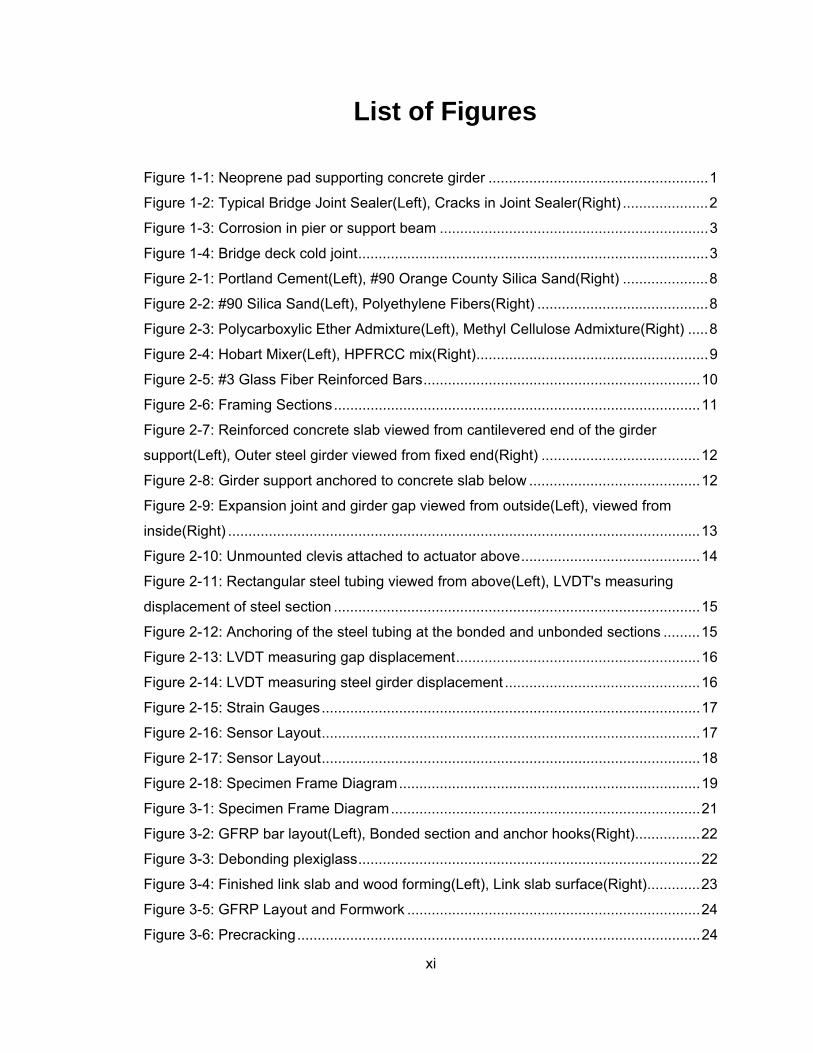
The following figures 1-1 thru 1-3 are examples from a typical bridge joint
located on the H1 freeway viaduct in Hawaii. Figure 1-1 shows the concrete
girder resting on a steel plate and neoprene pad.
Figure 1-1: Neoprene pad supporting concrete girder
These connections are effective in that they allow deflection of the bridge
deck during thermal expansion, shrinkage, creep as well as the onset of daily
service loads. However, these connections require a gap in the concrete
which makes it vulnerable to corrosive chemicals and debris limiting the
service life of not only the connection itself but the bridge deck it supports. As
can be seen in the Figure 1-2, these joints are typically filled with a joint
sealer which compress and expand depending on the length of the bridge
deck at any given time to alleviate rain run-off and debris from damaging the
2
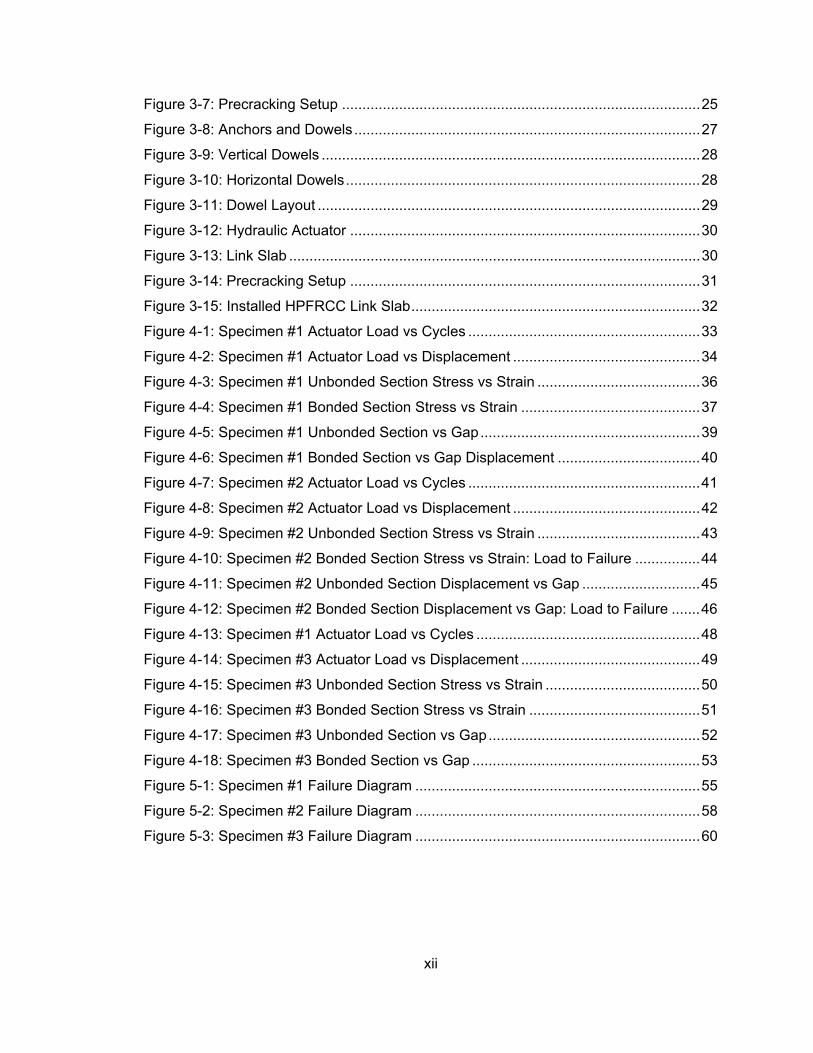
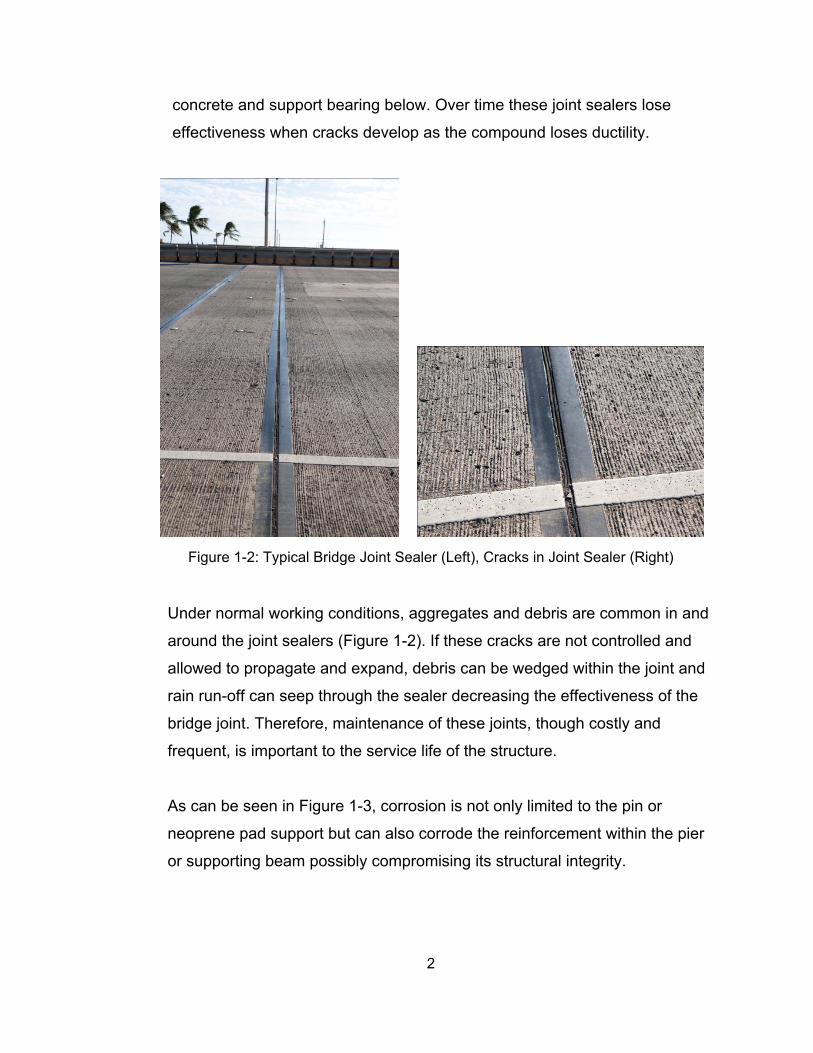
concrete and support bearing below. Over time these joint sealers lose
effectiveness when cracks develop as the compound loses ductility.
Figure 1-2: Typical Bridge Joint Sealer (Left), Cracks in Joint Sealer (Right)
Under normal working conditions, aggregates and debris are common in and
around the joint sealers (Figure 1-2). If these cracks are not controlled and
allowed to propagate and expand, debris can be wedged within the joint and
rain run-off can seep through the sealer decreasing the effectiveness of the
bridge joint. Therefore, maintenance of these joints, though costly and
frequent, is important to the service life of the structure.
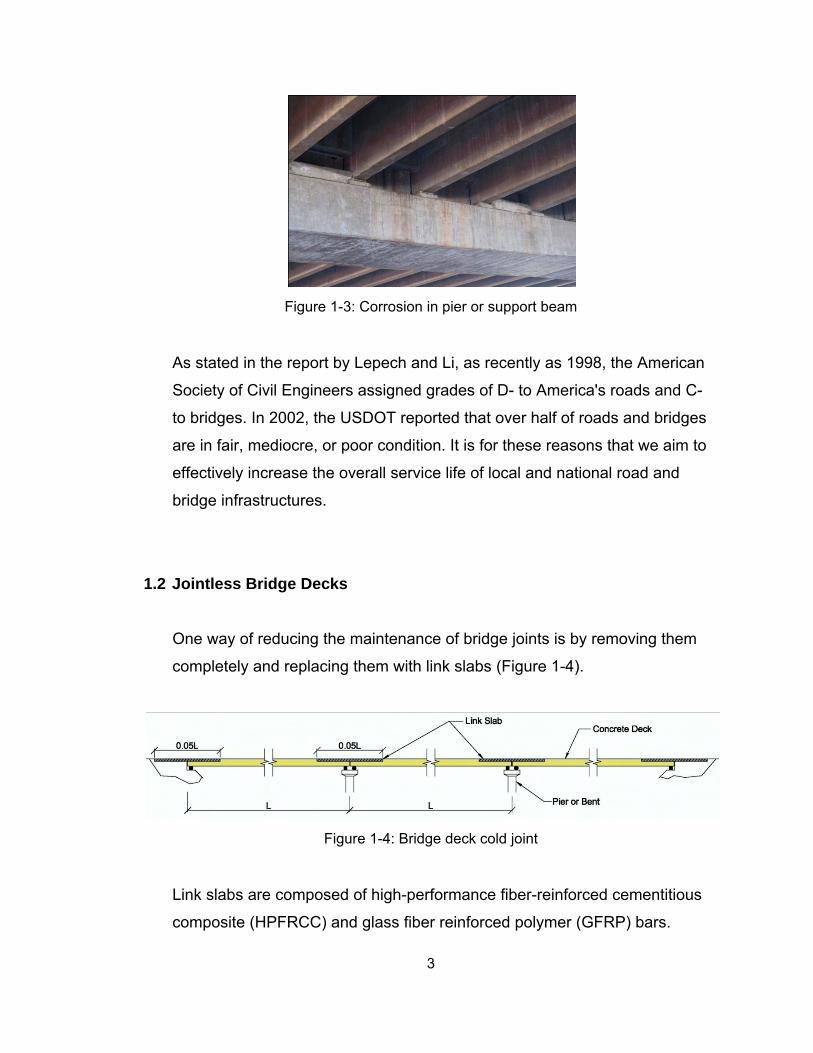
As can be seen in Figure 1-3, corrosion is not only limited to the pin or
neoprene pad support but can also corrode the reinforcement within the pier
or supporting beam possibly compromising its structural integrity.
3
Figure 1-3: Corrosion in pier or support beam
As stated in the report by Lepech and Li, as recently as 1998, the American
Society of Civil Engineers assigned grades of D- to America's roads and C-
to bridges. In 2002, the USDOT reported that over half of roads and bridges
are in fair, mediocre, or poor condition. It is for these reasons that we aim to
effectively increase the overall service life of local and national road and
bridge infrastructures.
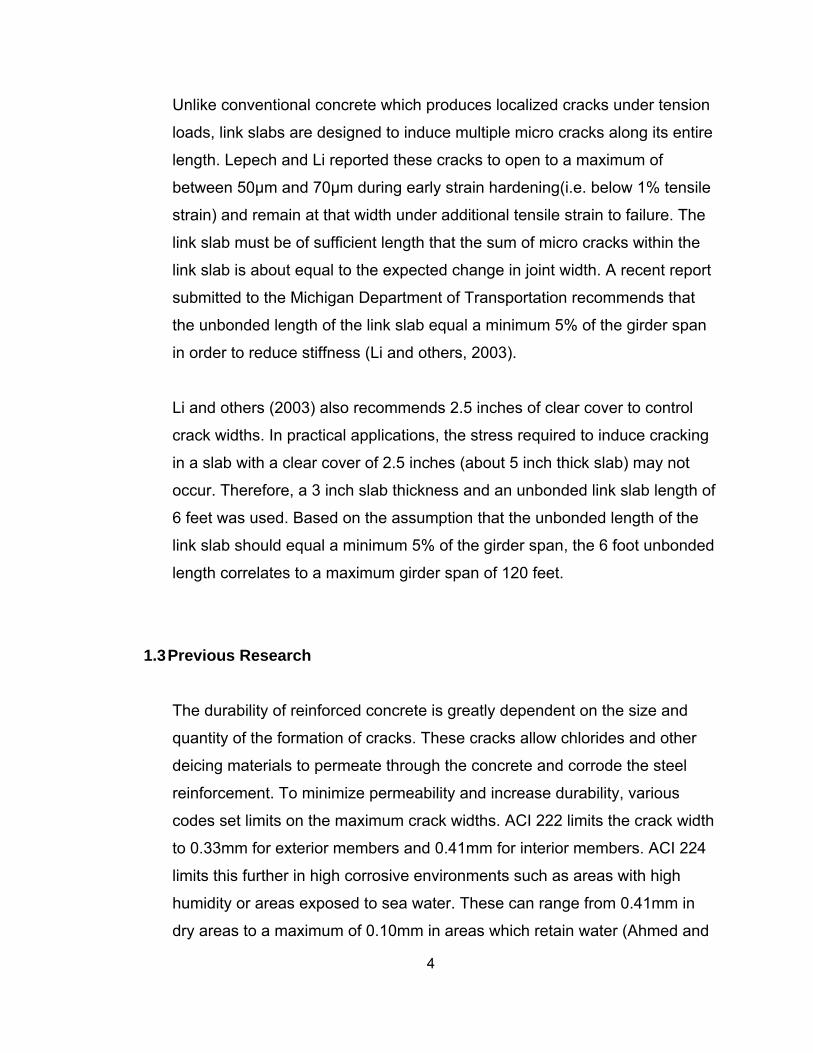
1.2 Jointless Bridge Decks
One way of reducing the maintenance of bridge joints is by removing them
completely and replacing them with link slabs (Figure 1-4).
Figure 1-4: Bridge deck cold joint
Link slabs are composed of high-performance fiber-reinforced cementitious
composite (HPFRCC) and glass fiber reinforced polymer (GFRP) bars.
4
Unlike conventional concrete which produces localized cracks under tension
loads, link slabs are designed to induce multiple micro cracks along its entire
length. Lepech and Li reported these cracks to open to a maximum of
between 50µm and 70µm during early strain hardening(i.e. below 1% tensile
strain) and remain at that width under additional tensile strain to failure. The
link slab must be of sufficient length that the sum of micro cracks within the
link slab is about equal to the expected change in joint width. A recent report
submitted to the Michigan Department of Transportation recommends that
the unbonded length of the link slab equal a minimum 5% of the girder span
in order to reduce stiffness (Li and others, 2003).
Li and others (2003) also recommends 2.5 inches of clear cover to control
crack widths. In practical applications, the stress required to induce cracking
in a slab with a clear cover of 2.5 inches (about 5 inch thick slab) may not
occur. Therefore, a 3 inch slab thickness and an unbonded link slab length of
6 feet was used. Based on the assumption that the unbonded length of the
link slab should equal a minimum 5% of the girder span, the 6 foot unbonded
length correlates to a maximum girder span of 120 feet.
1.3 Previous Research
The durability of reinforced concrete is greatly dependent on the size and
quantity of the formation of cracks. These cracks allow chlorides and other
deicing materials to permeate through the concrete and corrode the steel
reinforcement. To minimize permeability and increase durability, various
codes set limits on the maximum crack widths. ACI 222 limits the crack width
to 0.33mm for exterior members and 0.41mm for interior members. ACI 224
limits this further in high corrosive environments such as areas with high
humidity or areas exposed to sea water. These can range from 0.41mm in
dry areas to a maximum of 0.10mm in areas which retain water (Ahmed and

5
Mihashi, 2007). Ahmed and Mihashi (2007) found that under service loads,
the bottom of the HPFRCC beams tested had an average crack width of
10mm. Because crack width is well controlled in HPFRCC even at service
loads, the material can be used in lieu of reinforced concrete in most
applications with the benefit of increased durability.
Ahmed and Mihashi (2007) also summarized various research done on
HPFRCC including the permeability characteristics of cracked HPFRCC.
Research found that under a tensile strain of 1.5%, cracked HPFRCC had
about the same permeability before the onset of cracking. At these
conditions, HPFRCC had closely spaced crack widths of about 0.06mm
which is compared to conventional reinforced concrete that had crack widths
varying between 0.15mm and over 2.5mm. It is apparent, that HPFRCC is
much less permeable than conventional concrete.
The deformation of HPFRCC is a material property and independent of the
gage length of the reinforcement fiber (Li and Fischer). Li and Fischer
reported that HPFRCC has an ultimate strain of 5-8Mpa and a strain capacity
of 3-5%. These HPFRCC mixtures typically consist of cement, sand, fly ash,
water, additive, and 1.5-2% of polymeric fibers, such as polyethylene.
Polyethylene fibers are different than others available, in that the fiber resist
forces exclusively by its frictional bond (Li and Fischer). Essentially, the fiber
continues to resist load even after complete debonding until it reaches a
peak tensile load and then suddenly decreases in capacity until the fiber is
completely pulled out.
Because HPFRCC uses larger quantities of cement and water than
conventional concrete, higher shrinkage can be observed (Ahmed and
Mihashi, 2007). However, when a restrained shrinkage test was performed,
crack widths remained below 0.050mm.

6
Similar to conventional concrete, the effectiveness of HPFRCC is dependent
on the mix design. In a link slab test performed by Li and others (2003), a mix
design using 2% fibers and 1.0 cement, 0.53 water, 0.8 sand, 1.2 type F fly
ash, and 0.03 super-plasticizer proportioned by weight was used. These
properties were chosen because the HPFRCC mix was found to have good
workability, had a compressive stress of about 8700psi after curing, and a
tensile strain capacity of 3% at 28days.
Although extensive tests have been performed to determine the shrinkage as
well as other material properties, it is important to note that majority of the
tests are not standardized and the HPFRCC mix design usually vary
between research done.

7
2 Materials
2.1 High-Performance Fiber-Reinforced Cementitious Composite (HPFRCC)
Polymer
High-Performance Fiber-Reinforced Cementitious Composite (HPFRCC)
polymer is a cement based material that has the ability to strain harden in
tension. That is, it has the ability to undergo large tensile strains caused by
both tensile and bending stresses. Under these tensile and bending stresses,
multiple micro cracks are induced allowing the material to elongate. For link
slab applications as well as the experiment reported herein, Engineered
Cementitious Composite (ECC) is ideal. ECC is a type of HPFRCC that has
about the same compressive capabilities of conventional concrete. Within
this report, ECC and HPFRCC shall be used interchangeably but shall both
refer to ECC.
HPFRCC is able to strain harden because it does not use coarse aggregate
but instead the concrete is held together and strengthened by small fibers.
When the concrete reaches its elastic limit, the fibers slip between the many
microscopic cracks, this action is referred to as fiber bridging. Strain
hardening occurs when the peak bridging stress between fibers in a
developing crack is larger than stress required to first initiate cracking (Li and
Fischer). This ensures that the stress applied prior cracking can be carried by
the embedded fibers. This allows the internal forces to be evenly distributed
rather than become localized as what is expected with conventional
concrete.
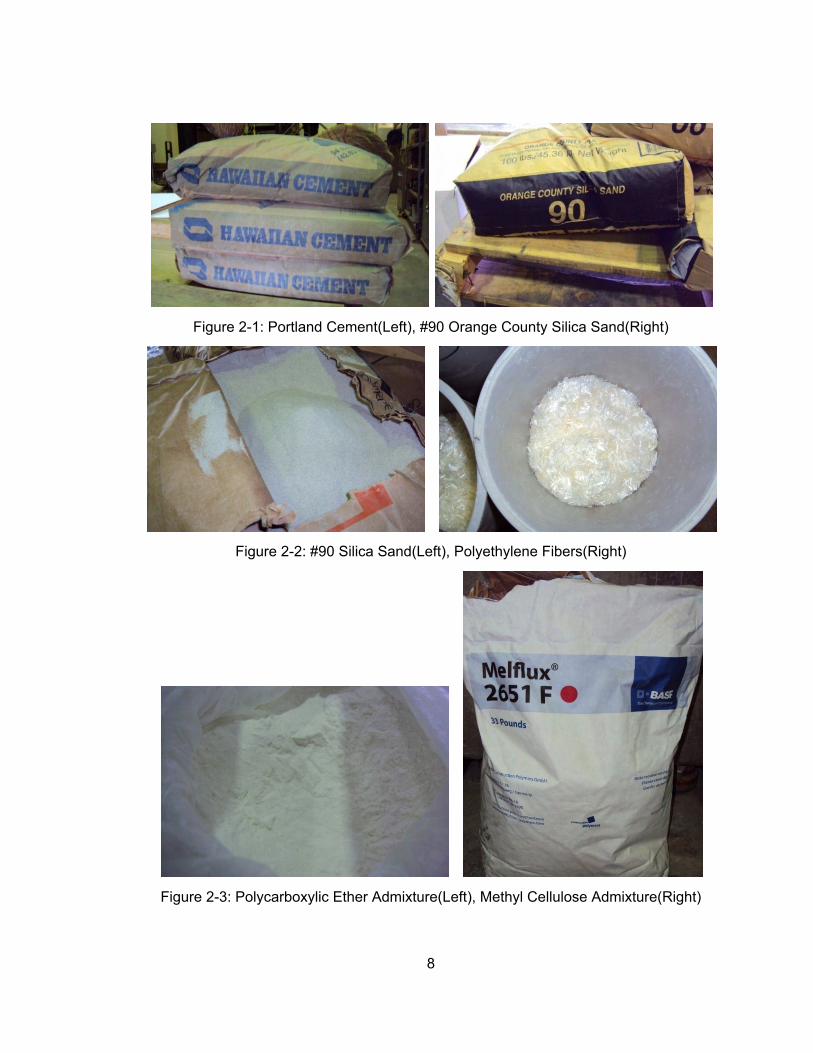
The HPFRCC mix used in the experimental tests was comprised of Portland
Cement (Figure 2-1), #90 Silica Sand (Figure 2-1 and Figure 2-2), fly ash,
water, Polyethylene Fibers (Figures 2-2), Polycarboxylic Ether (Figure 2-3),
and Methyl Cellulose admixtures (Figures 2-3).
8
Figure 2-1: Portland Cement(Left), #90 Orange County Silica Sand(Right)
Figure 2-2: #90 Silica Sand(Left), Polyethylene Fibers(Right)
Figure 2-3: Polycarboxylic Ether Admixture(Left), Methyl Cellulose Admixture(Right)
9
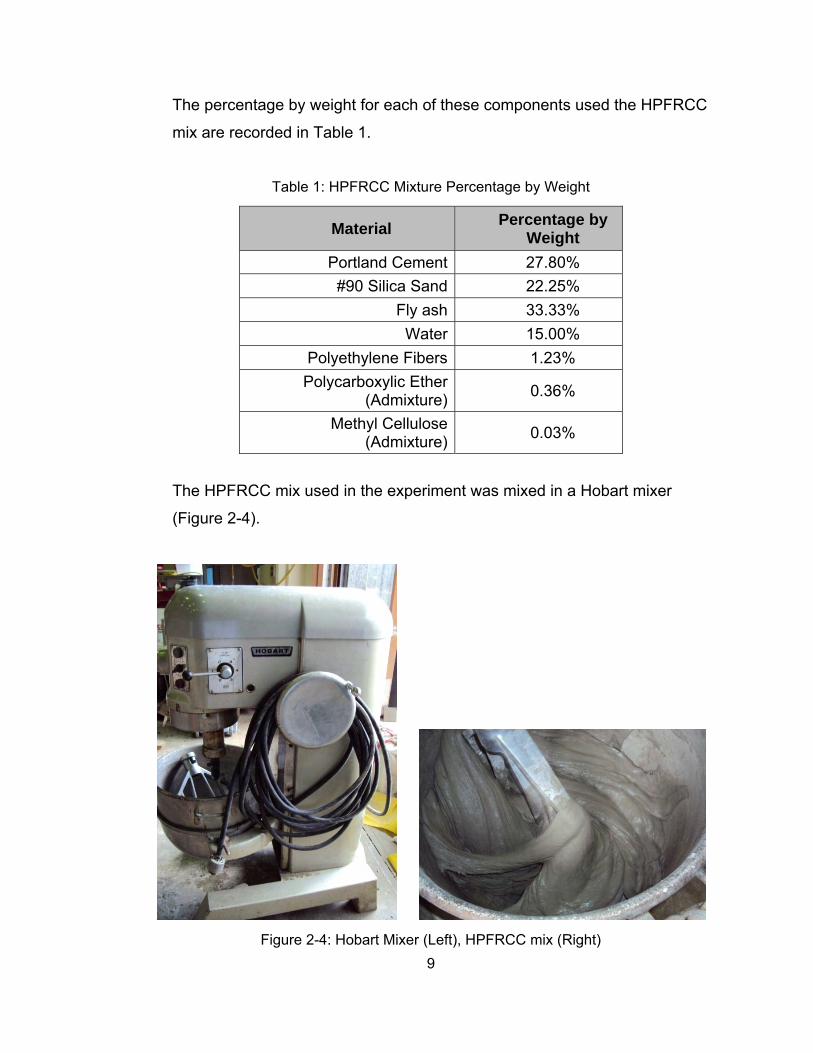
The percentage by weight for each of these components used the HPFRCC
mix are recorded in Table 1.
Table 1: HPFRCC Mixture Percentage by Weight
Material Percentage by
Weight
Portland Cement 27.80%
#90 Silica Sand 22.25%
Fly ash 33.33%
Water 15.00%
Polyethylene Fibers 1.23%
Polycarboxylic Ether (Admixture)
0.36%
Methyl Cellulose (Admixture)
0.03%
The HPFRCC mix used in the experiment was mixed in a Hobart mixer
(Figure 2-4).
Figure 2-4: Hobart Mixer (Left), HPFRCC mix (Right)
10
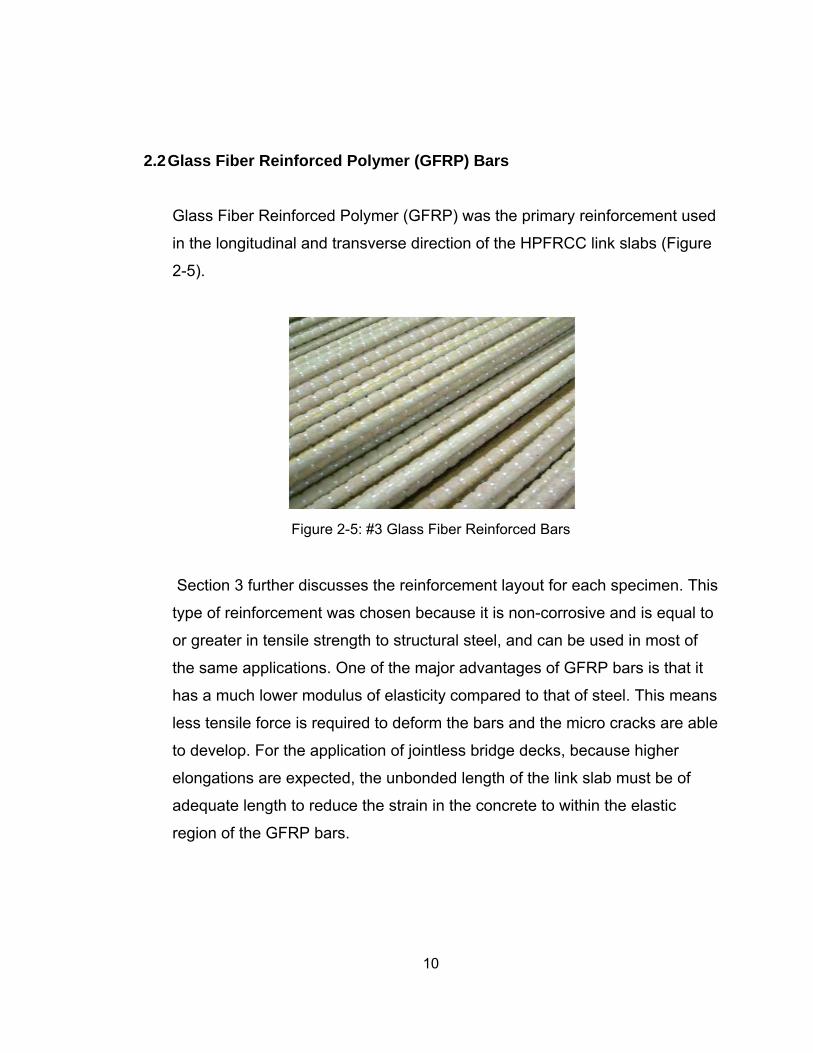
2.2 Glass Fiber Reinforced Polymer (GFRP) Bars
Glass Fiber Reinforced Polymer (GFRP) was the primary reinforcement used
in the longitudinal and transverse direction of the HPFRCC link slabs (Figure
2-5).
Figure 2-5: #3 Glass Fiber Reinforced Bars
Section 3 further discusses the reinforcement layout for each specimen. This
type of reinforcement was chosen because it is non-corrosive and is equal to
or greater in tensile strength to structural steel, and can be used in most of
the same applications. One of the major advantages of GFRP bars is that it
has a much lower modulus of elasticity compared to that of steel. This means
less tensile force is required to deform the bars and the micro cracks are able
to develop. For the application of jointless bridge decks, because higher
elongations are expected, the unbonded length of the link slab must be of
adequate length to reduce the strain in the concrete to within the elastic
region of the GFRP bars.
11
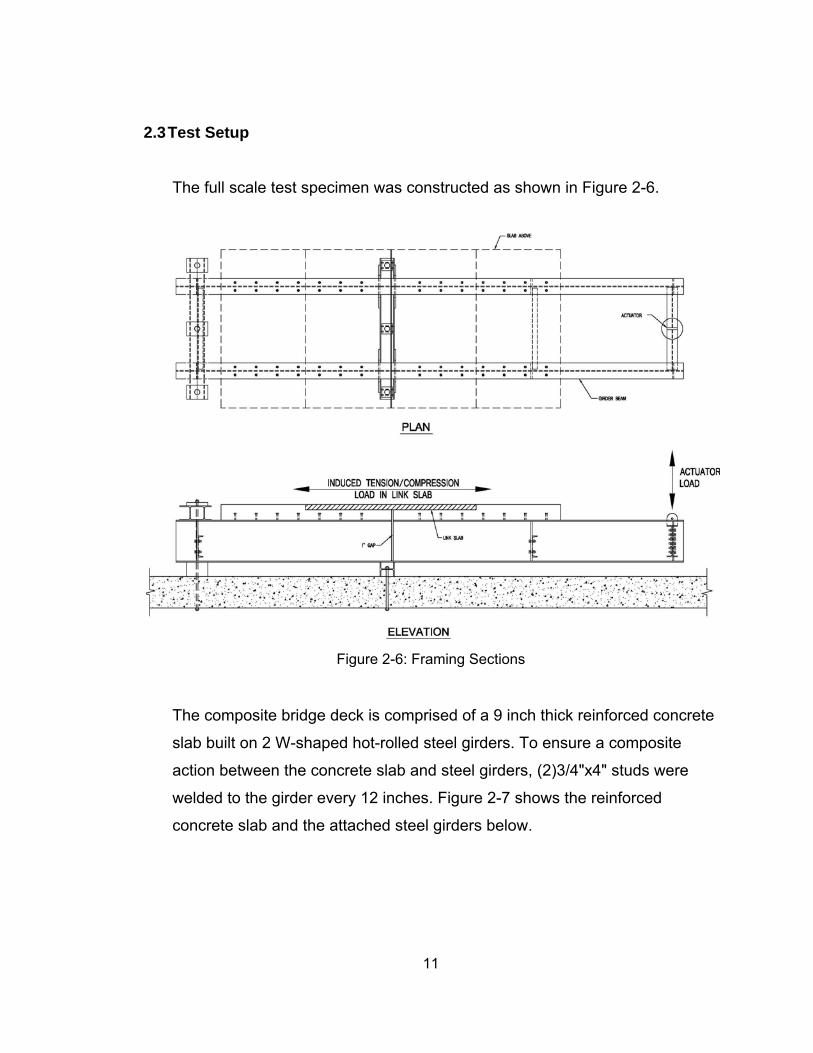
2.3 Test Setup
The full scale test specimen was constructed as shown in Figure 2-6.
Figure 2-6: Framing Sections
The composite bridge deck is comprised of a 9 inch thick reinforced concrete
slab built on 2 W-shaped hot-rolled steel girders. To ensure a composite
action between the concrete slab and steel girders, (2)3/4"x4" studs were
welded to the girder every 12 inches. Figure 2-7 shows the reinforced
concrete slab and the attached steel girders below.
12
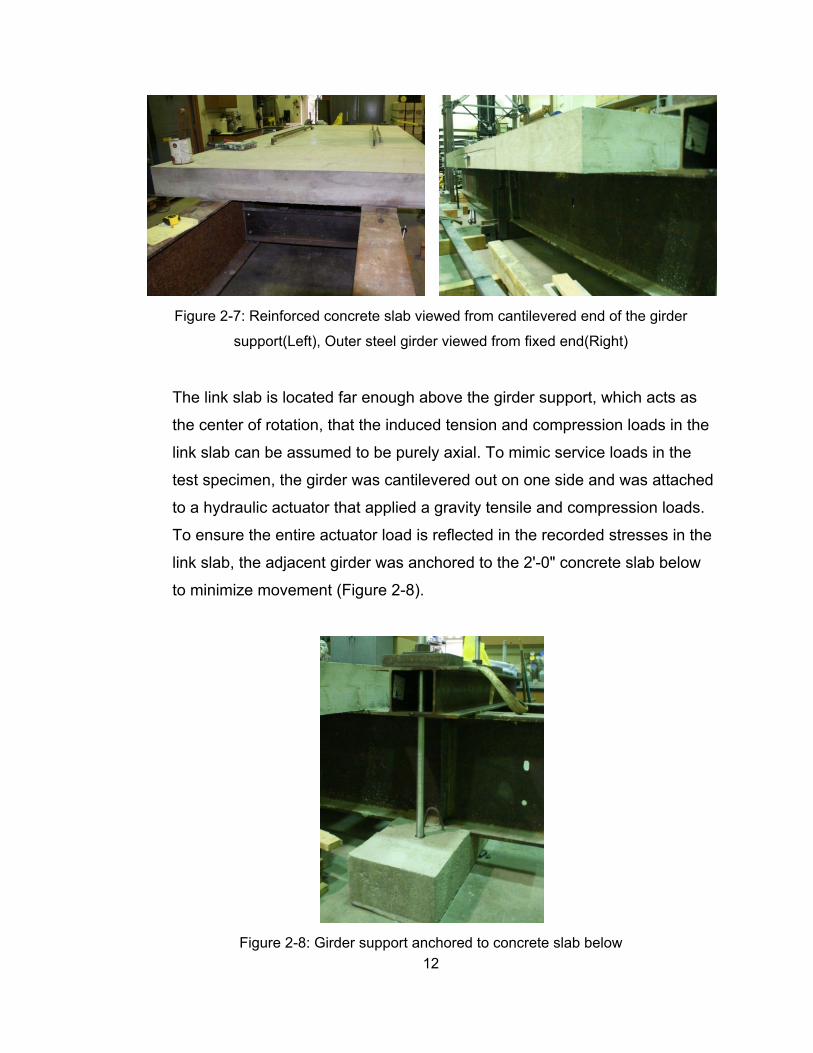
Figure 2-7: Reinforced concrete slab viewed from cantilevered end of the girder
support(Left), Outer steel girder viewed from fixed end(Right)
The link slab is located far enough above the girder support, which acts as
the center of rotation, that the induced tension and compression loads in the
link slab can be assumed to be purely axial. To mimic service loads in the
test specimen, the girder was cantilevered out on one side and was attached
to a hydraulic actuator that applied a gravity tensile and compression loads.
To ensure the entire actuator load is reflected in the recorded stresses in the
link slab, the adjacent girder was anchored to the 2'-0" concrete slab below
to minimize movement (Figure 2-8).
Figure 2-8: Girder support anchored to concrete slab below

13
Figure 2-9 shows the 1 inch expansion joint in the reinforced concrete slab
as well as the gap between the girder supports. These supports are welded
to the W-shape section below and reinforced with steel plates which acts as
pin connection. The expansion joint was measured and compared to the
elongation in the link slab to evaluate its effectiveness.
Figure 2-9: Expansion joint and girder gap viewed from outside(Left), viewed from
inside(Right)
Figure 2-10 shows the clevis and mounting point used to attach the actuator
to the test specimen. As the actuator deflects upwards, it induced a
compressive force in the link slab. Similarly, a downward deflection
correlated to a tensile force in the link slab

14
Figure 2-10: Unmounted clevis attached to actuator above
2.4 Measurement Devices
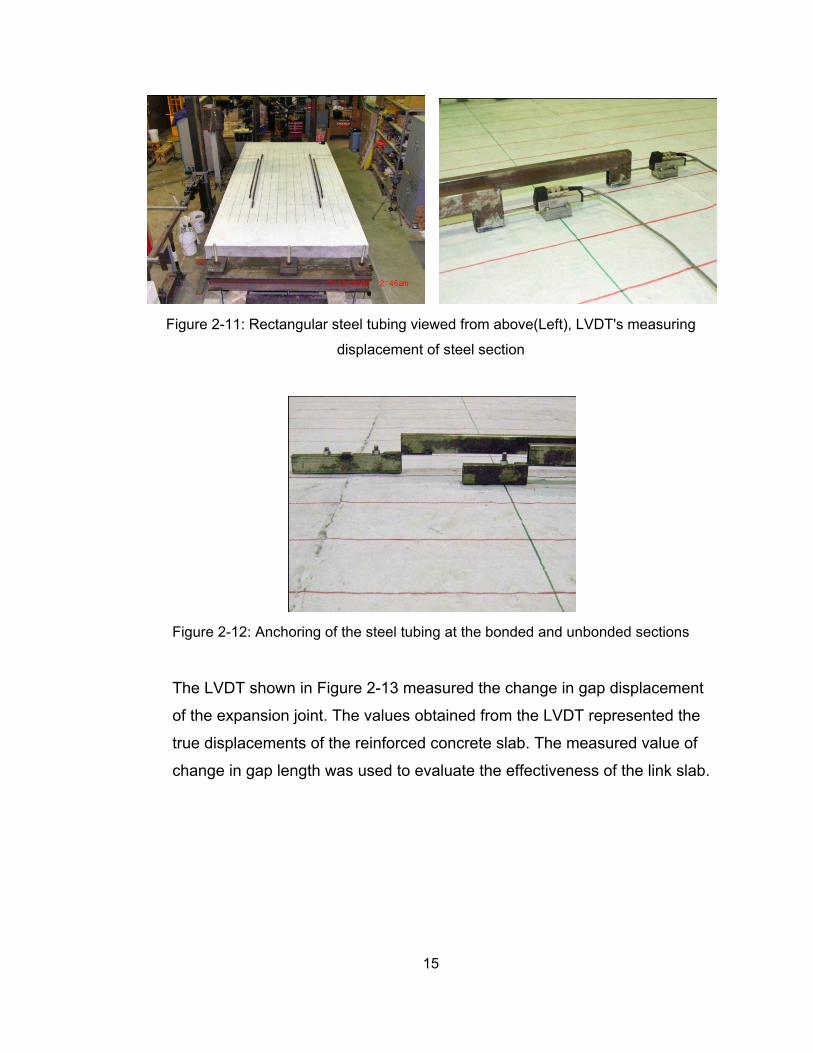
To measure the displacements in the link slab and test specimen, a total of 8
Linear Variable Displacement Transducers (LVDT) were used. The overall
elongation of the link slab was captured using 4 relatively undeformable
rectangular steel tubes, as shown in Figure 2-11 and 2-12. These rectangular
tubes are anchored on one side and are free to slide on the opposing side,
which is measured with an LVDT. Two of these steel LVDT combinations
were used to measure the elongation from unbonded section of the link slab
to the opposing unbonded section, and two were used to measure the
elongation from the end of the bonded section on one side to the end of the
bonded section on the opposing side.
15
Figure 2-11: Rectangular steel tubing viewed from above(Left), LVDT's measuring
displacement of steel section
Figure 2-12: Anchoring of the steel tubing at the bonded and unbonded sections
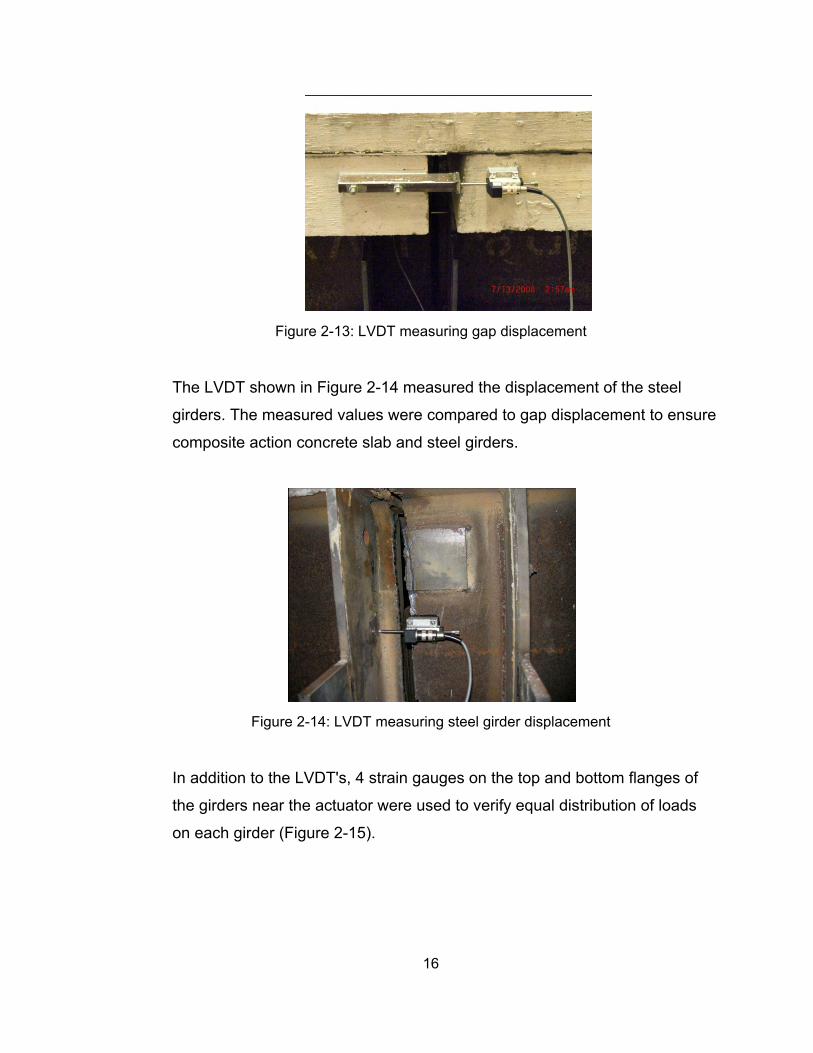
The LVDT shown in Figure 2-13 measured the change in gap displacement
of the expansion joint. The values obtained from the LVDT represented the
true displacements of the reinforced concrete slab. The measured value of
change in gap length was used to evaluate the effectiveness of the link slab.
16
Figure 2-13: LVDT measuring gap displacement
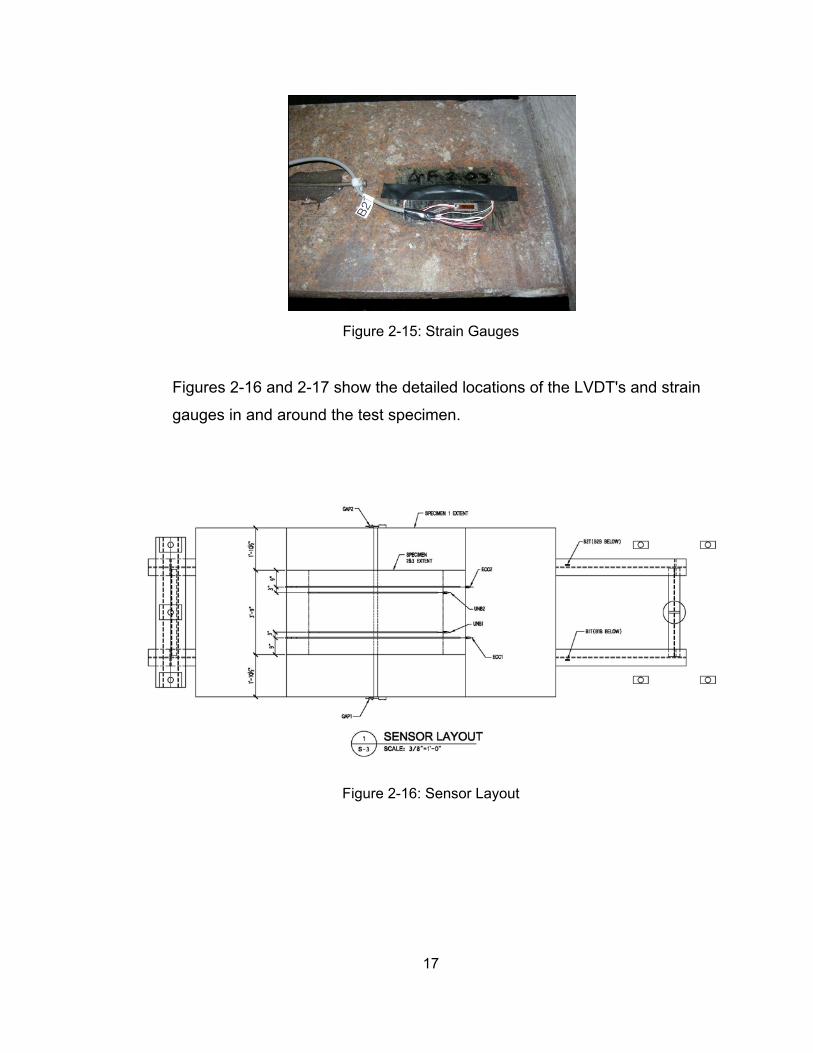
The LVDT shown in Figure 2-14 measured the displacement of the steel
girders. The measured values were compared to gap displacement to ensure
composite action concrete slab and steel girders.
Figure 2-14: LVDT measuring steel girder displacement
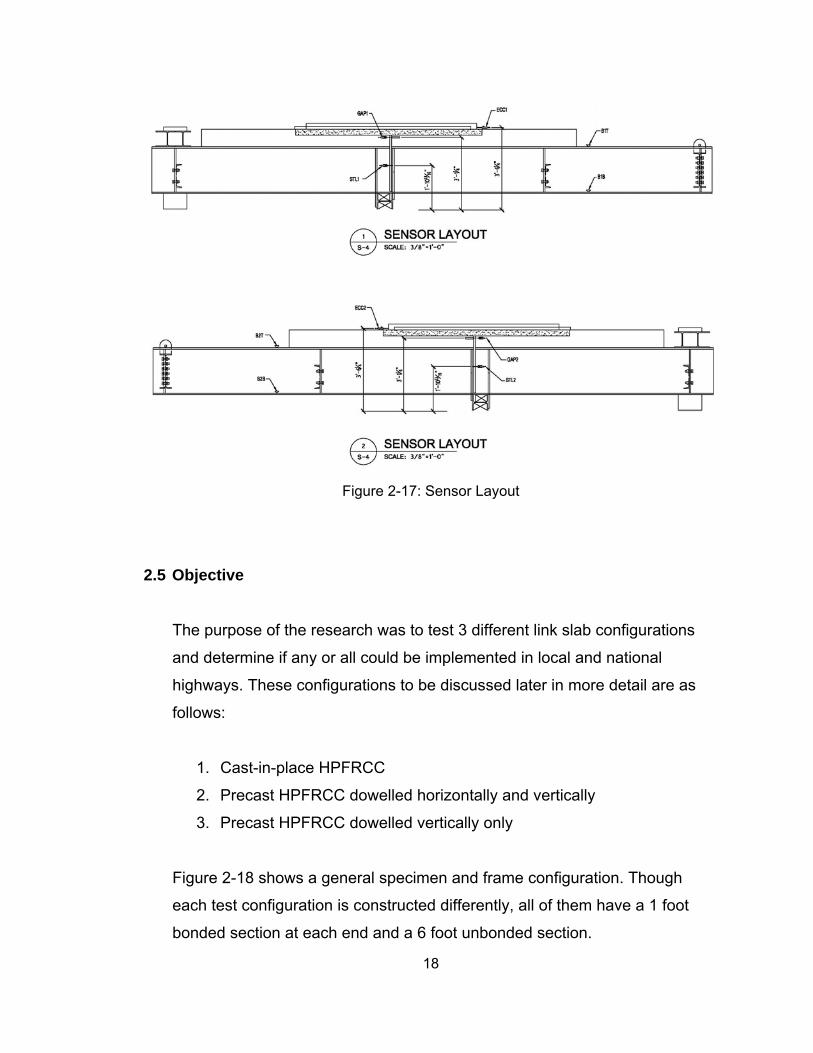
In addition to the LVDT's, 4 strain gauges on the top and bottom flanges of
the girders near the actuator were used to verify equal distribution of loads
on each girder (Figure 2-15).
17
Figure 2-15: Strain Gauges
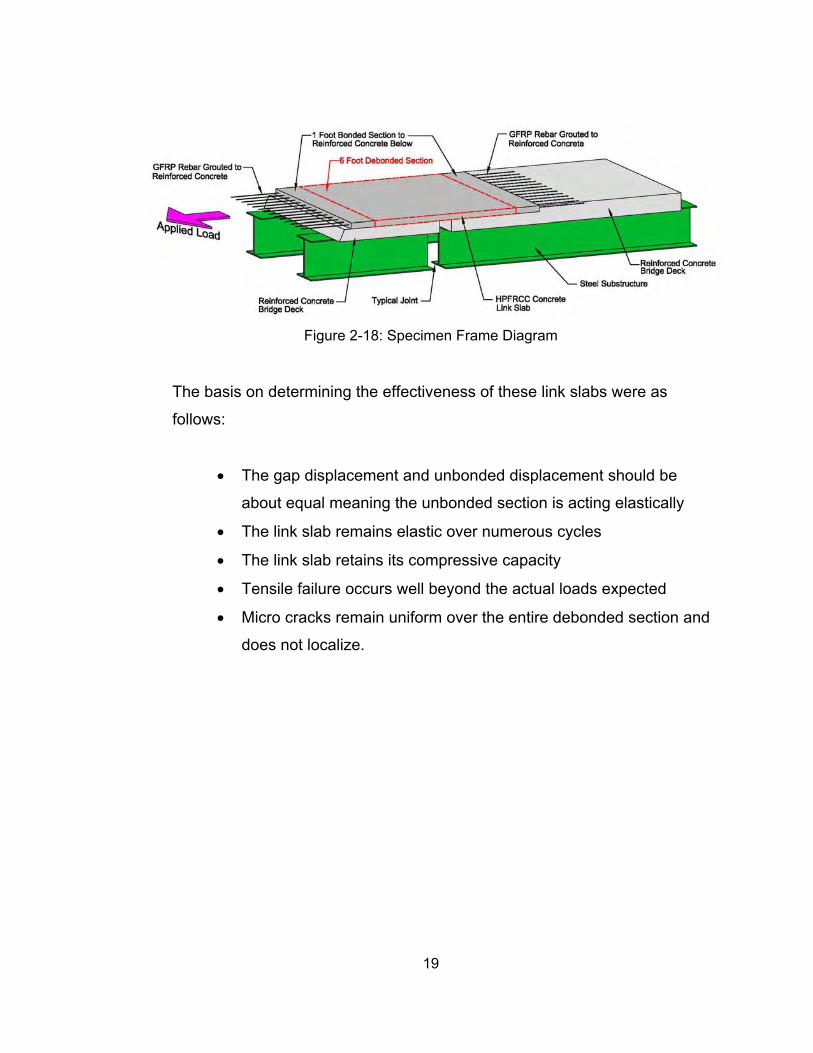
Figures 2-16 and 2-17 show the detailed locations of the LVDT's and strain
gauges in and around the test specimen.
Figure 2-16: Sensor Layout
18
Figure 2-17: Sensor Layout
2.5 Objective
The purpose of the research was to test 3 different link slab configurations
and determine if any or all could be implemented in local and national
highways. These configurations to be discussed later in more detail are as
follows:
1. Cast-in-place HPFRCC
2. Precast HPFRCC dowelled horizontally and vertically
3. Precast HPFRCC dowelled vertically only
Figure 2-18 shows a general specimen and frame configuration. Though
each test configuration is constructed differently, all of them have a 1 foot
bonded section at each end and a 6 foot unbonded section.
19
Figure 2-18: Specimen Frame Diagram
The basis on determining the effectiveness of these link slabs were as
follows:
The gap displacement and unbonded displacement should be
about equal meaning the unbonded section is acting elastically
The link slab remains elastic over numerous cycles
The link slab retains its compressive capacity
Tensile failure occurs well beyond the actual loads expected
Micro cracks remain uniform over the entire debonded section and
does not localize.

20

21
3 Approach
3.1 Test Specimens #1
Specimen #1 was a 7'-6" wide 3 inch thick cast in place HPFRCC link slab
reinforced with #3 GFRP bars spaced 6 inches on center in the longitudinal
and transverse directions. For this specimen, the 2'-0" bonded section on
both sides of the link slab were cast simultaneously into the reinforced
concrete slab. This setup would only be appropriate for new construction or
major reconstruction where the use of a link slab is predetermined in design.
One advantage of using a cast-in-place HPFRCC link slab is that the GFRP
bars of the link slab are well bonded to the reinforced concrete and hooked
bars can used in the 1'-0" bonded section. For this specimen, each GFRP
bar were doweled to the reinforced concrete with (2) #3 steel anchor
hooks(Figure 3-1). This ensured the link slab was well bonded to the
reinforced concrete. With the cast-in-place HPFRCC link slab, it was
expected that there would be little slippage of the GFRP bar within the
bonded section.
Figure 3-1: Specimen Frame Diagram
22
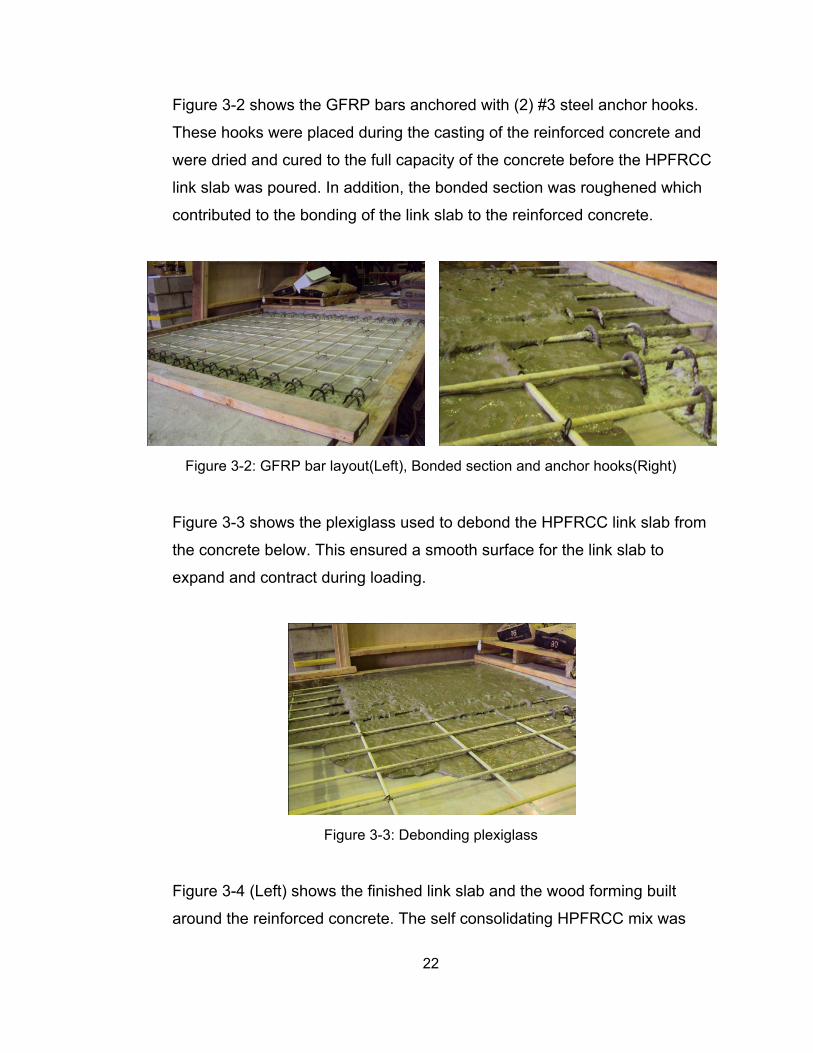
Figure 3-2 shows the GFRP bars anchored with (2) #3 steel anchor hooks.
These hooks were placed during the casting of the reinforced concrete and
were dried and cured to the full capacity of the concrete before the HPFRCC
link slab was poured. In addition, the bonded section was roughened which
contributed to the bonding of the link slab to the reinforced concrete.
Figure 3-2: GFRP bar layout(Left), Bonded section and anchor hooks(Right)
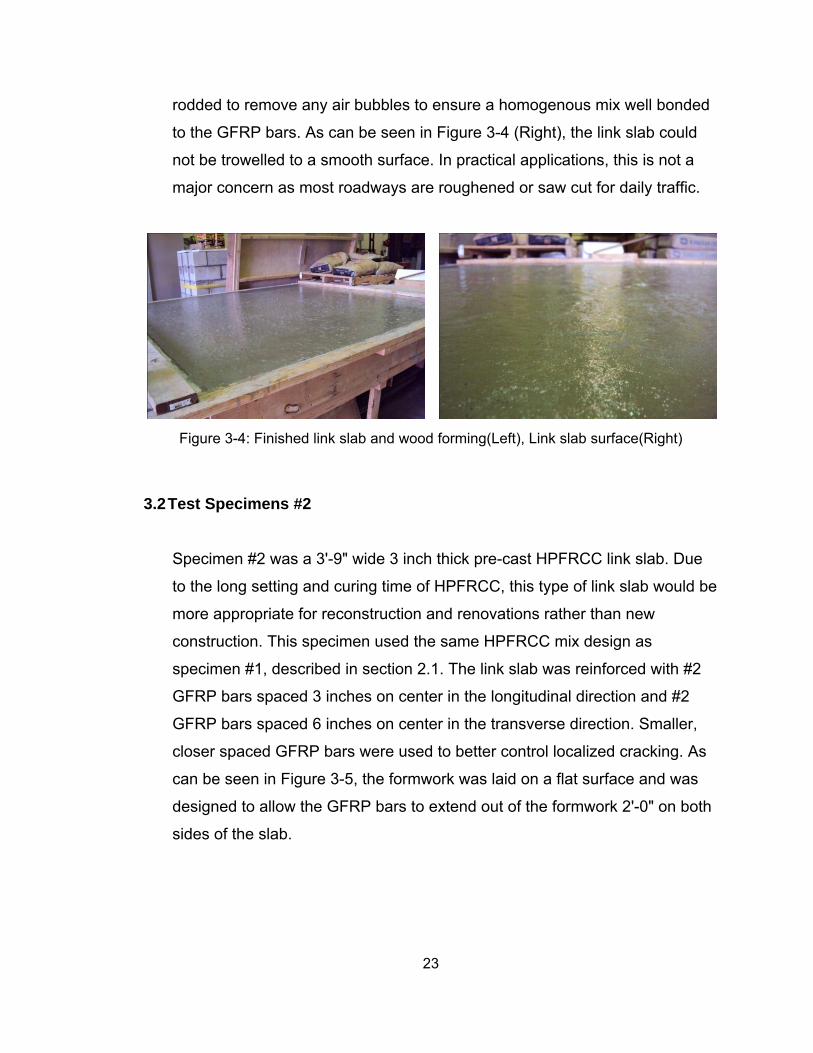
Figure 3-3 shows the plexiglass used to debond the HPFRCC link slab from
the concrete below. This ensured a smooth surface for the link slab to
expand and contract during loading.
Figure 3-3: Debonding plexiglass
Figure 3-4 (Left) shows the finished link slab and the wood forming built
around the reinforced concrete. The self consolidating HPFRCC mix was
23
rodded to remove any air bubbles to ensure a homogenous mix well bonded
to the GFRP bars. As can be seen in Figure 3-4 (Right), the link slab could
not be trowelled to a smooth surface. In practical applications, this is not a
major concern as most roadways are roughened or saw cut for daily traffic.
Figure 3-4: Finished link slab and wood forming(Left), Link slab surface(Right)
3.2 Test Specimens #2
Specimen #2 was a 3'-9" wide 3 inch thick pre-cast HPFRCC link slab. Due
to the long setting and curing time of HPFRCC, this type of link slab would be
more appropriate for reconstruction and renovations rather than new
construction. This specimen used the same HPFRCC mix design as
specimen #1, described in section 2.1. The link slab was reinforced with #2
GFRP bars spaced 3 inches on center in the longitudinal direction and #2
GFRP bars spaced 6 inches on center in the transverse direction. Smaller,
closer spaced GFRP bars were used to better control localized cracking. As
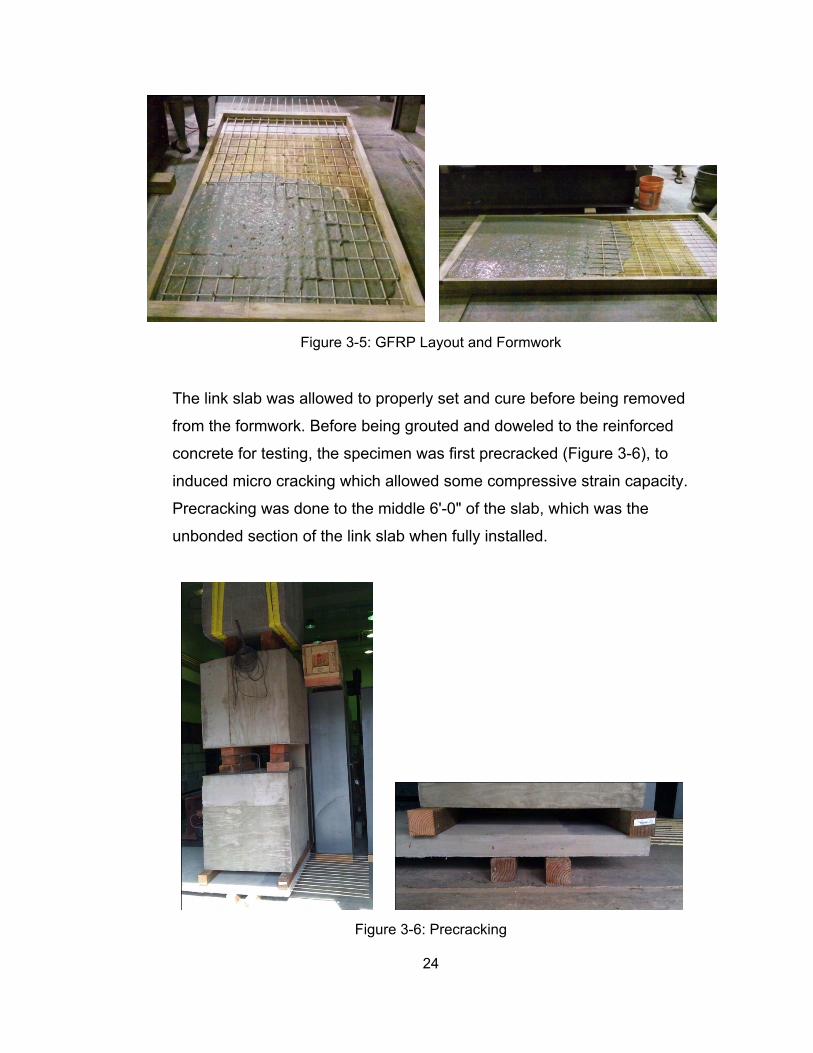
can be seen in Figure 3-5, the formwork was laid on a flat surface and was
designed to allow the GFRP bars to extend out of the formwork 2'-0" on both
sides of the slab.
24
Figure 3-5: GFRP Layout and Formwork
The link slab was allowed to properly set and cure before being removed
from the formwork. Before being grouted and doweled to the reinforced
concrete for testing, the specimen was first precracked (Figure 3-6), to
induced micro cracking which allowed some compressive strain capacity.
Precracking was done to the middle 6'-0" of the slab, which was the
unbonded section of the link slab when fully installed.
Figure 3-6: Precracking
25
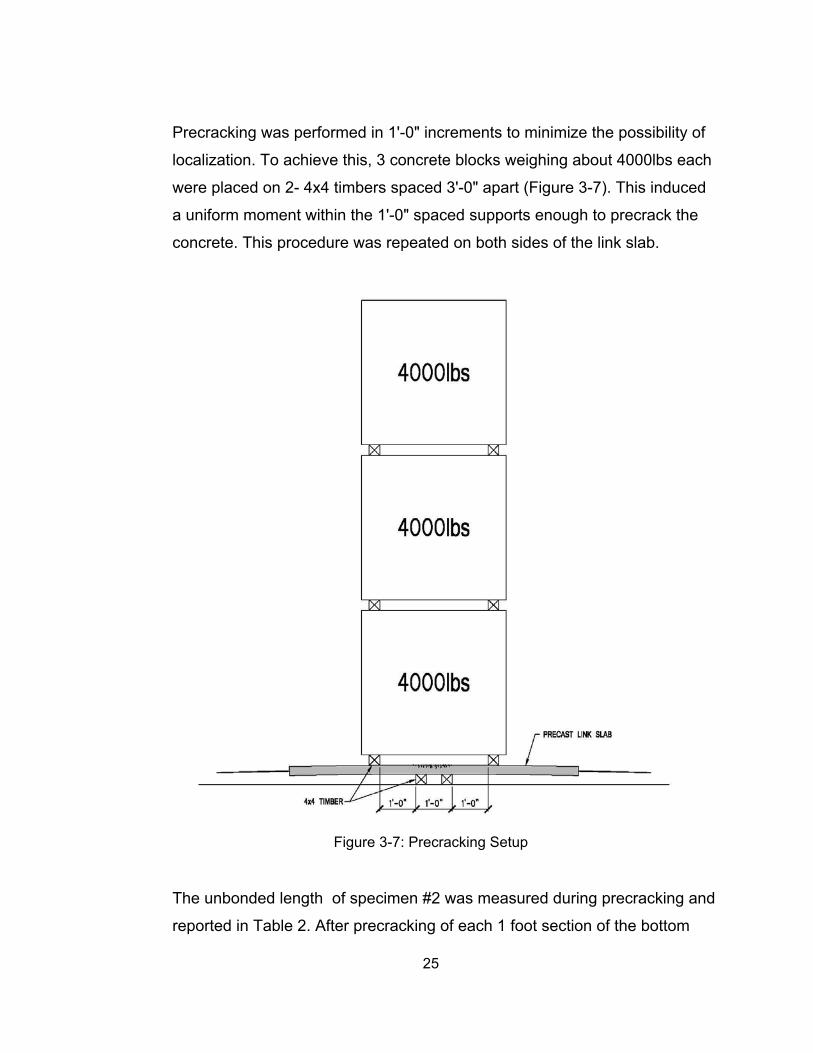
Precracking was performed in 1'-0" increments to minimize the possibility of
localization. To achieve this, 3 concrete blocks weighing about 4000lbs each
were placed on 2- 4x4 timbers spaced 3'-0" apart (Figure 3-7). This induced
a uniform moment within the 1'-0" spaced supports enough to precrack the
concrete. This procedure was repeated on both sides of the link slab.
Figure 3-7: Precracking Setup
The unbonded length of specimen #2 was measured during precracking and
reported in Table 2. After precracking of each 1 foot section of the bottom
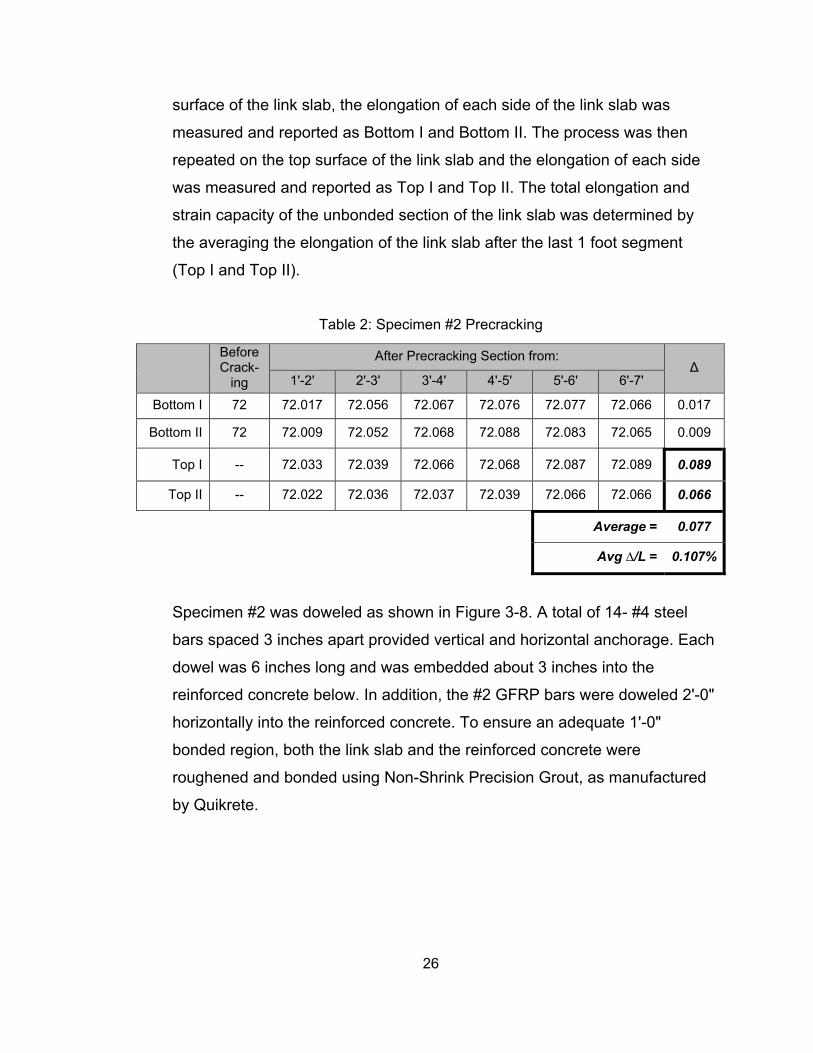
26
surface of the link slab, the elongation of each side of the link slab was
measured and reported as Bottom I and Bottom II. The process was then
repeated on the top surface of the link slab and the elongation of each side
was measured and reported as Top I and Top II. The total elongation and
strain capacity of the unbonded section of the link slab was determined by
the averaging the elongation of the link slab after the last 1 foot segment
(Top I and Top II).
Table 2: Specimen #2 Precracking
Before Crack-
ing
After Precracking Section from: Δ
1'-2' 2'-3' 3'-4' 4'-5' 5'-6' 6'-7'
Bottom I 72 72.017 72.056 72.067 72.076 72.077 72.066 0.017
Bottom II 72 72.009 72.052 72.068 72.088 72.083 72.065 0.009
Top I -- 72.033 72.039 72.066 72.068 72.087 72.089 0.089
Top II -- 72.022 72.036 72.037 72.039 72.066 72.066 0.066
Average = 0.077
Avg ∆/L = 0.107%
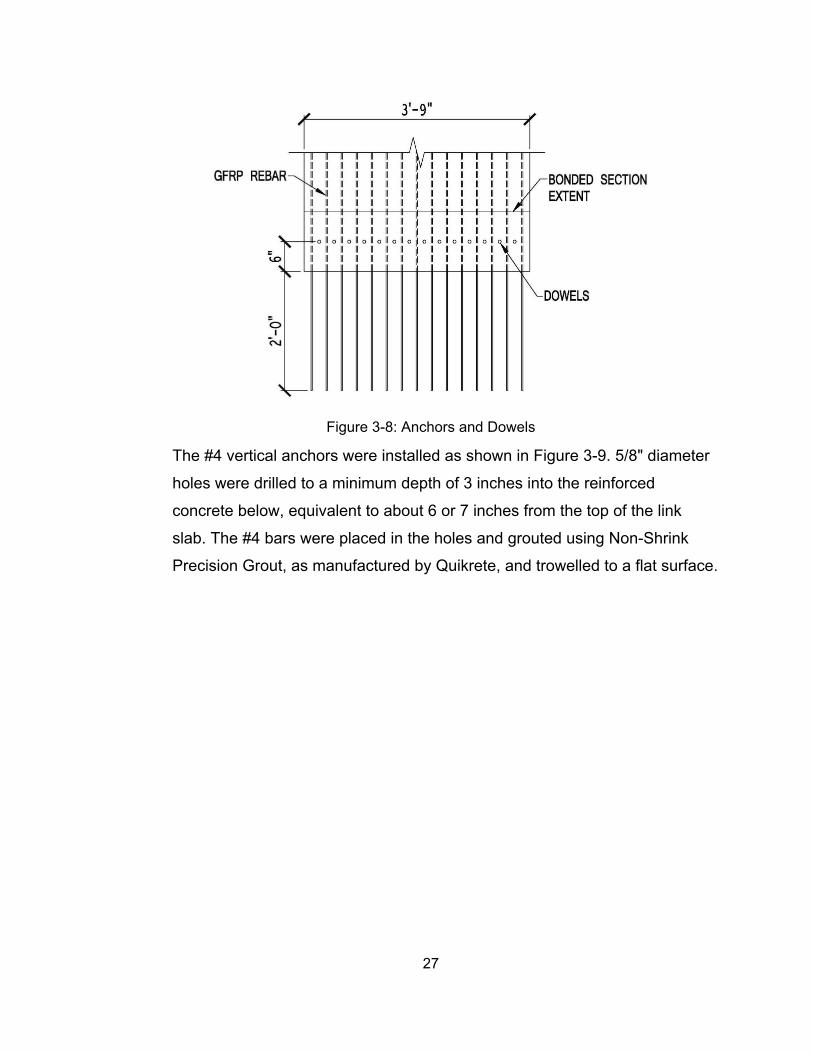
Specimen #2 was doweled as shown in Figure 3-8. A total of 14- #4 steel
bars spaced 3 inches apart provided vertical and horizontal anchorage. Each
dowel was 6 inches long and was embedded about 3 inches into the
reinforced concrete below. In addition, the #2 GFRP bars were doweled 2'-0"
horizontally into the reinforced concrete. To ensure an adequate 1'-0"
bonded region, both the link slab and the reinforced concrete were
roughened and bonded using Non-Shrink Precision Grout, as manufactured
by Quikrete.
27
Figure 3-8: Anchors and Dowels
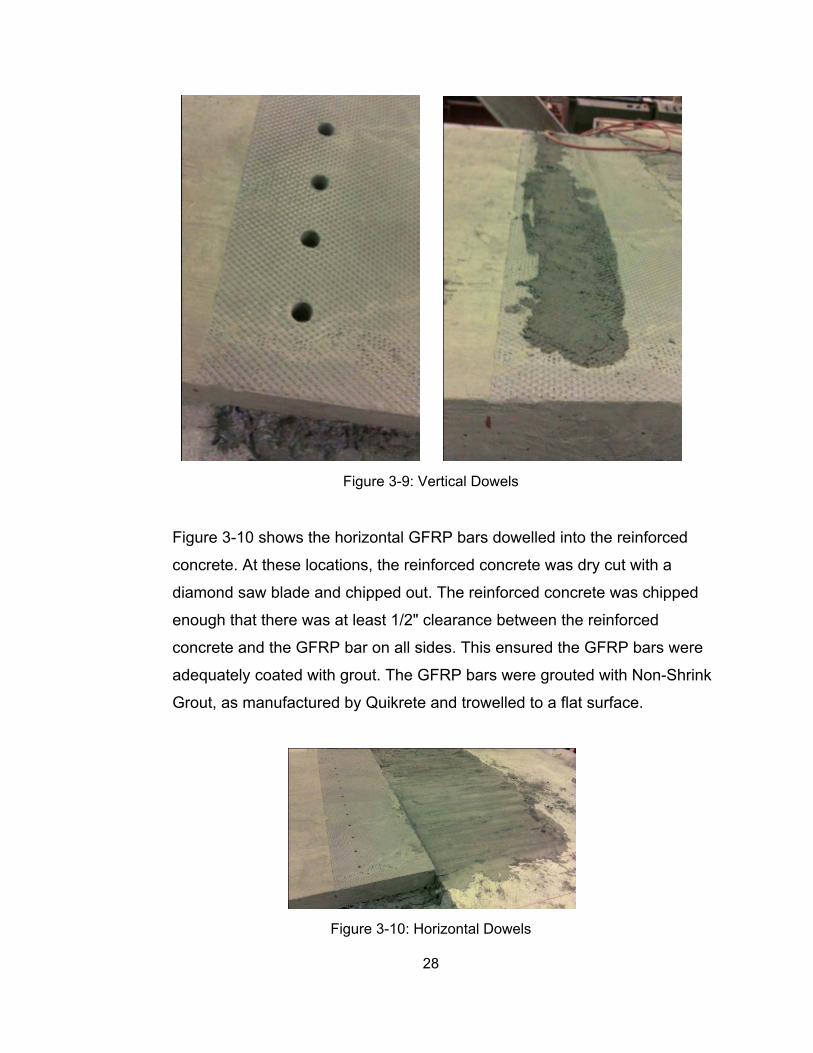
The #4 vertical anchors were installed as shown in Figure 3-9. 5/8" diameter
holes were drilled to a minimum depth of 3 inches into the reinforced
concrete below, equivalent to about 6 or 7 inches from the top of the link
slab. The #4 bars were placed in the holes and grouted using Non-Shrink
Precision Grout, as manufactured by Quikrete, and trowelled to a flat surface.
28
Figure 3-9: Vertical Dowels
Figure 3-10 shows the horizontal GFRP bars dowelled into the reinforced
concrete. At these locations, the reinforced concrete was dry cut with a
diamond saw blade and chipped out. The reinforced concrete was chipped
enough that there was at least 1/2" clearance between the reinforced
concrete and the GFRP bar on all sides. This ensured the GFRP bars were
adequately coated with grout. The GFRP bars were grouted with Non-Shrink
Grout, as manufactured by Quikrete and trowelled to a flat surface.
Figure 3-10: Horizontal Dowels
29
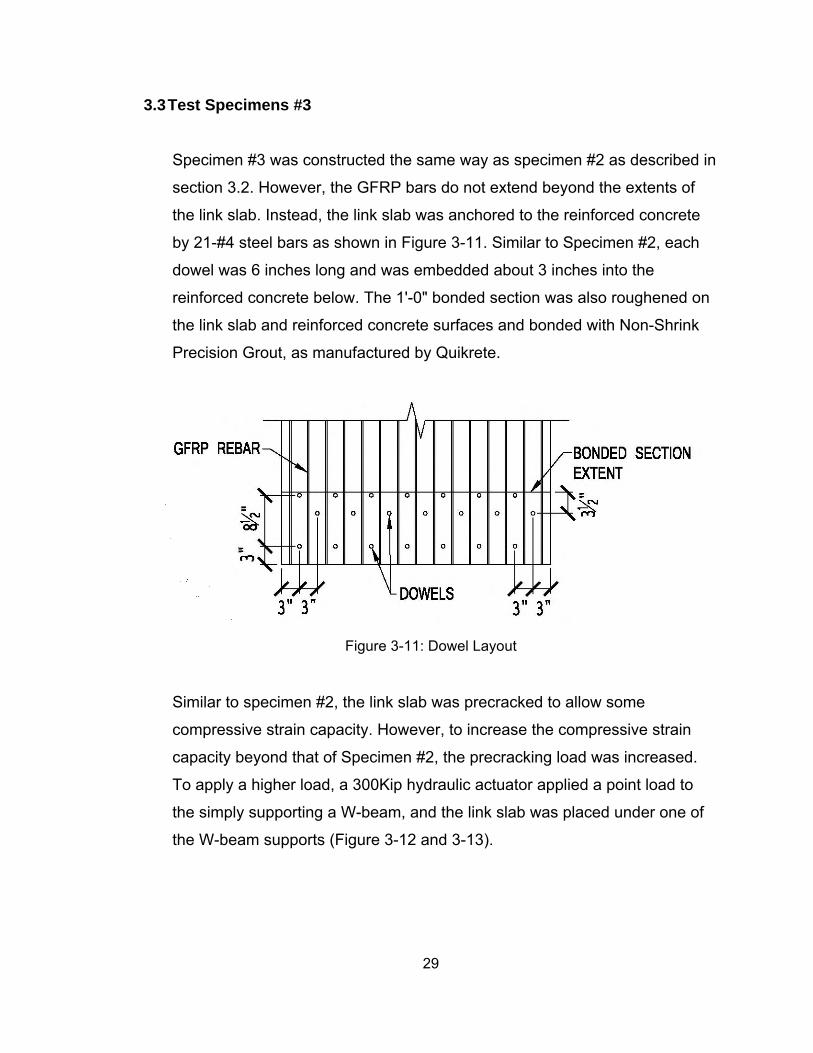
3.3 Test Specimens #3
Specimen #3 was constructed the same way as specimen #2 as described in
section 3.2. However, the GFRP bars do not extend beyond the extents of
the link slab. Instead, the link slab was anchored to the reinforced concrete
by 21-#4 steel bars as shown in Figure 3-11. Similar to Specimen #2, each
dowel was 6 inches long and was embedded about 3 inches into the
reinforced concrete below. The 1'-0" bonded section was also roughened on
the link slab and reinforced concrete surfaces and bonded with Non-Shrink
Precision Grout, as manufactured by Quikrete.
Figure 3-11: Dowel Layout
Similar to specimen #2, the link slab was precracked to allow some
compressive strain capacity. However, to increase the compressive strain
capacity beyond that of Specimen #2, the precracking load was increased.
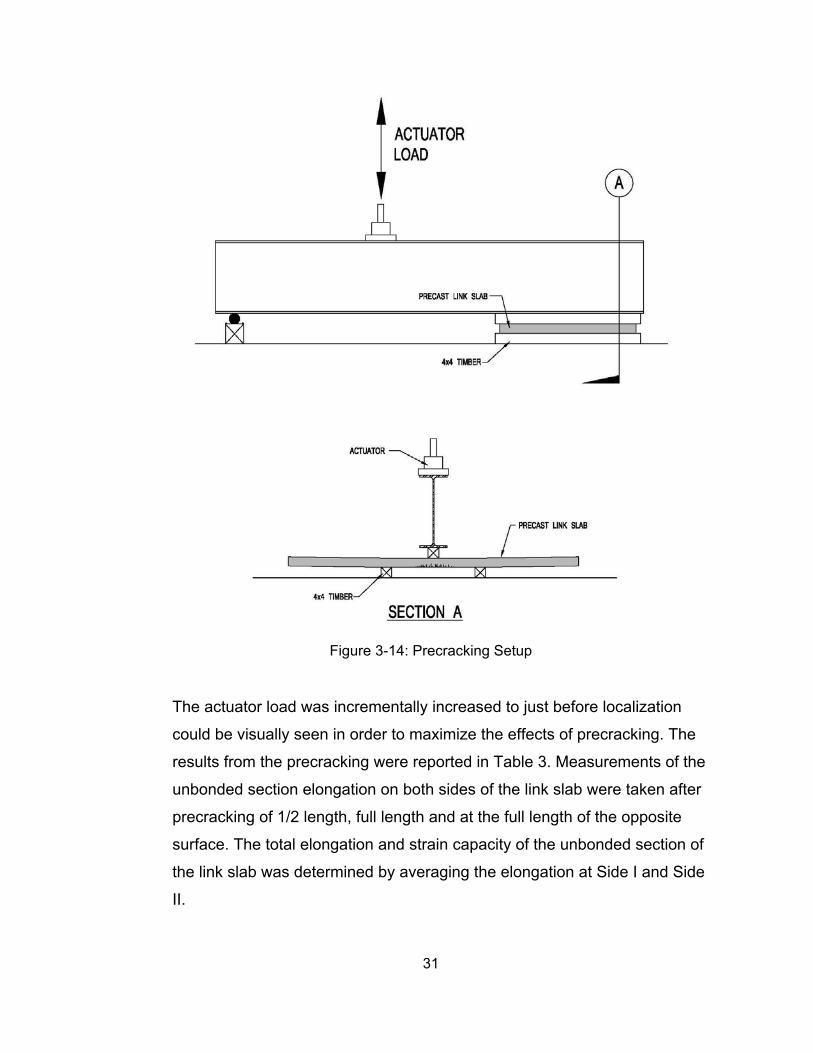
To apply a higher load, a 300Kip hydraulic actuator applied a point load to
the simply supporting a W-beam, and the link slab was placed under one of
the W-beam supports (Figure 3-12 and 3-13).
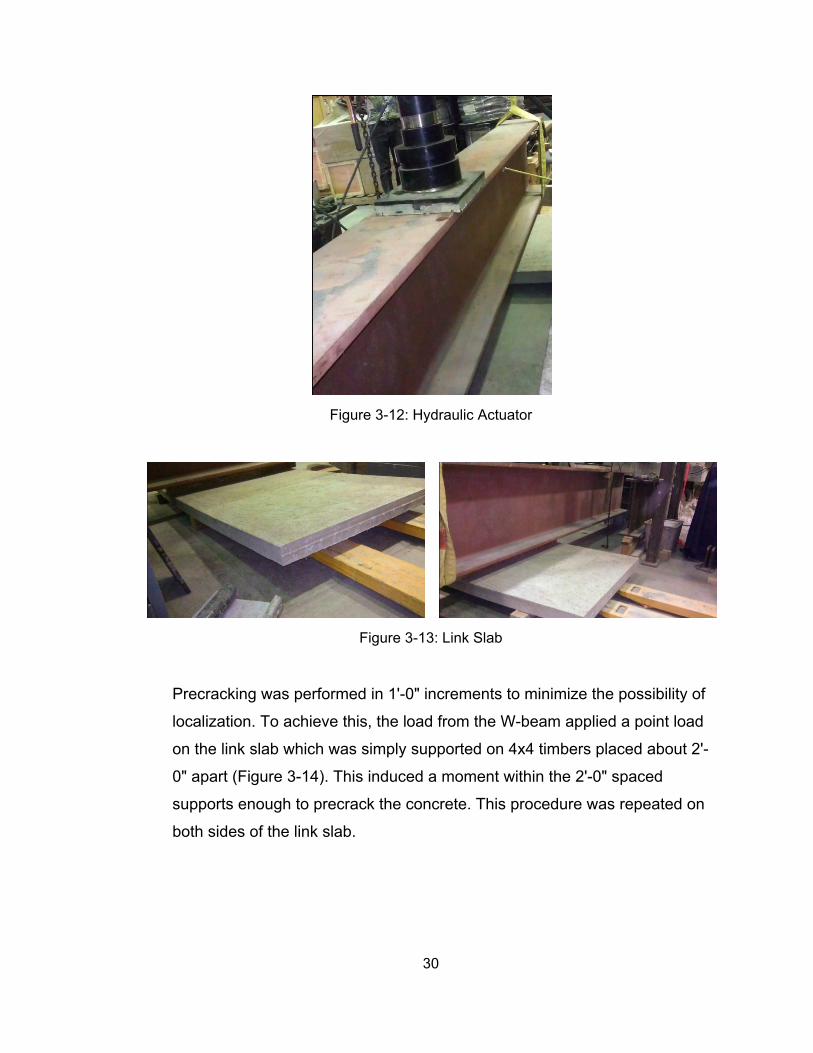
30
Figure 3-12: Hydraulic Actuator
Figure 3-13: Link Slab
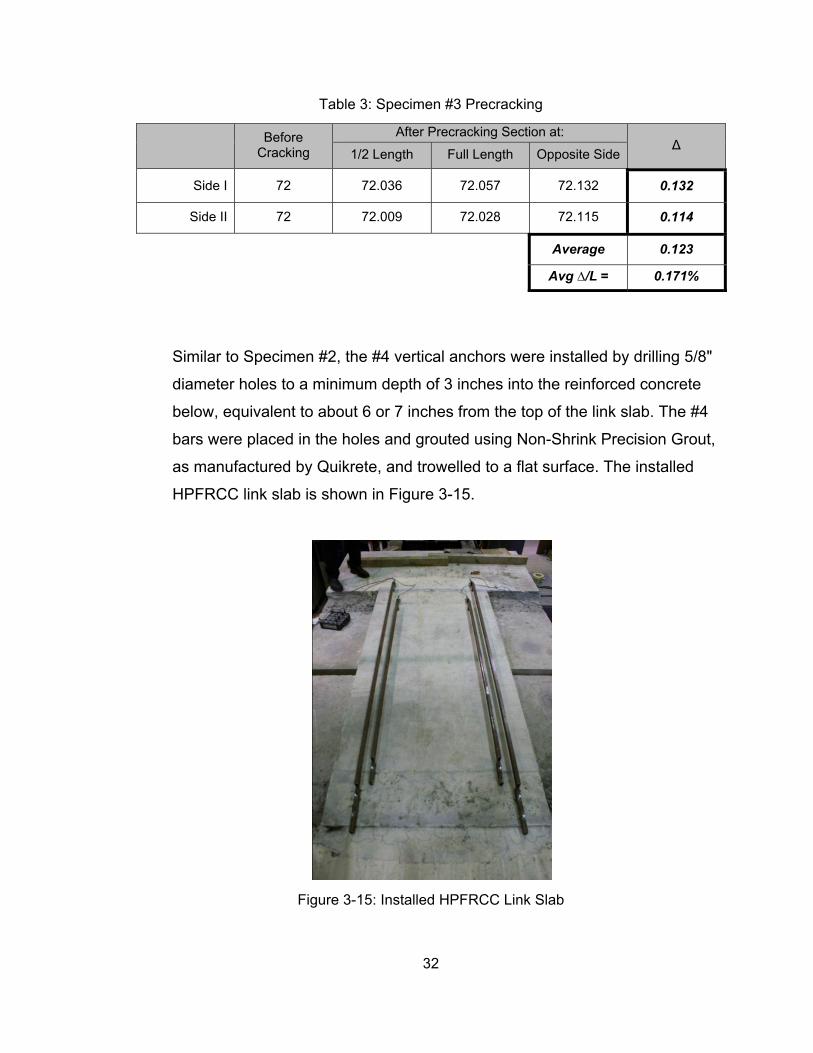
Precracking was performed in 1'-0" increments to minimize the possibility of
localization. To achieve this, the load from the W-beam applied a point load
on the link slab which was simply supported on 4x4 timbers placed about 2'-
0" apart (Figure 3-14). This induced a moment within the 2'-0" spaced
supports enough to precrack the concrete. This procedure was repeated on
both sides of the link slab.
31
Figure 3-14: Precracking Setup
The actuator load was incrementally increased to just before localization
could be visually seen in order to maximize the effects of precracking. The
results from the precracking were reported in Table 3. Measurements of the
unbonded section elongation on both sides of the link slab were taken after
precracking of 1/2 length, full length and at the full length of the opposite
surface. The total elongation and strain capacity of the unbonded section of
the link slab was determined by averaging the elongation at Side I and Side
II.
32
Table 3: Specimen #3 Precracking
Before
Cracking
After Precracking Section at: Δ
1/2 Length Full Length Opposite Side
Side I 72 72.036 72.057 72.132 0.132
Side II 72 72.009 72.028 72.115 0.114
Average 0.123
Avg ∆/L = 0.171%
Similar to Specimen #2, the #4 vertical anchors were installed by drilling 5/8"
diameter holes to a minimum depth of 3 inches into the reinforced concrete
below, equivalent to about 6 or 7 inches from the top of the link slab. The #4
bars were placed in the holes and grouted using Non-Shrink Precision Grout,
as manufactured by Quikrete, and trowelled to a flat surface. The installed
HPFRCC link slab is shown in Figure 3-15.
Figure 3-15: Installed HPFRCC Link Slab
33
4 Analysis
4.1 Specimen #1
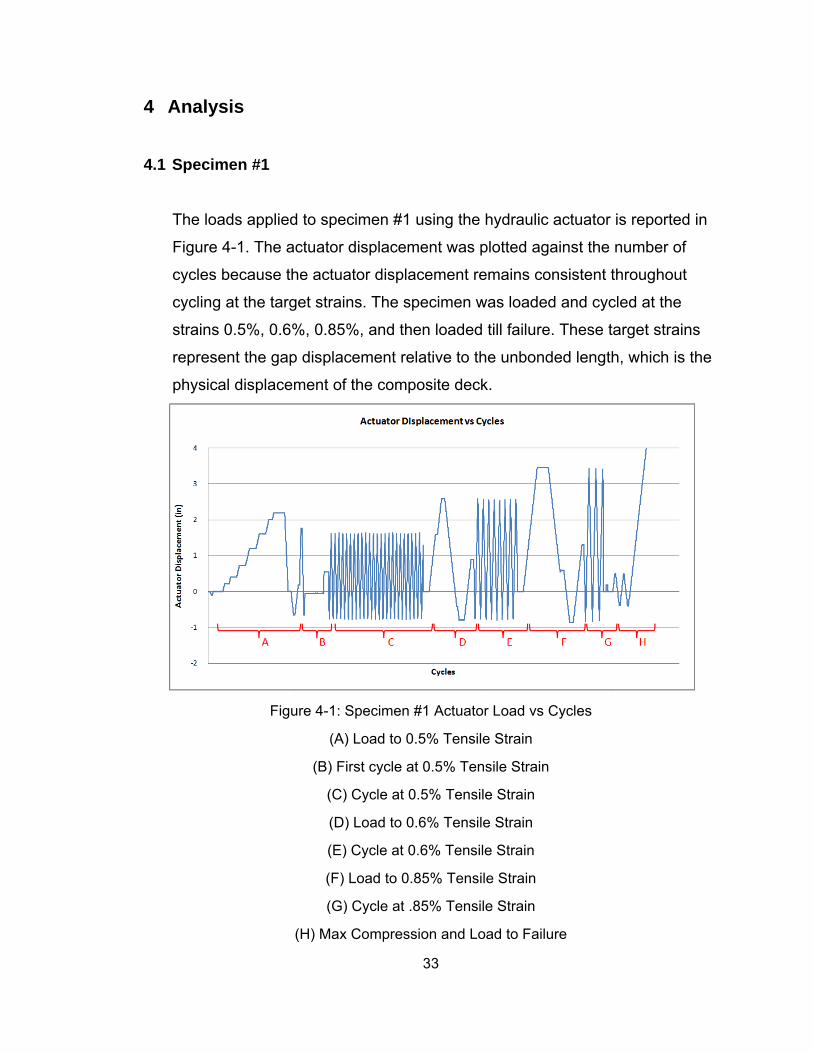
The loads applied to specimen #1 using the hydraulic actuator is reported in
Figure 4-1. The actuator displacement was plotted against the number of
cycles because the actuator displacement remains consistent throughout
cycling at the target strains. The specimen was loaded and cycled at the
strains 0.5%, 0.6%, 0.85%, and then loaded till failure. These target strains
represent the gap displacement relative to the unbonded length, which is the
physical displacement of the composite deck.
Figure 4-1: Specimen #1 Actuator Load vs Cycles
(A) Load to 0.5% Tensile Strain
(B) First cycle at 0.5% Tensile Strain
(C) Cycle at 0.5% Tensile Strain
(D) Load to 0.6% Tensile Strain
(E) Cycle at 0.6% Tensile Strain
(F) Load to 0.85% Tensile Strain
(G) Cycle at .85% Tensile Strain
(H) Max Compression and Load to Failure
34
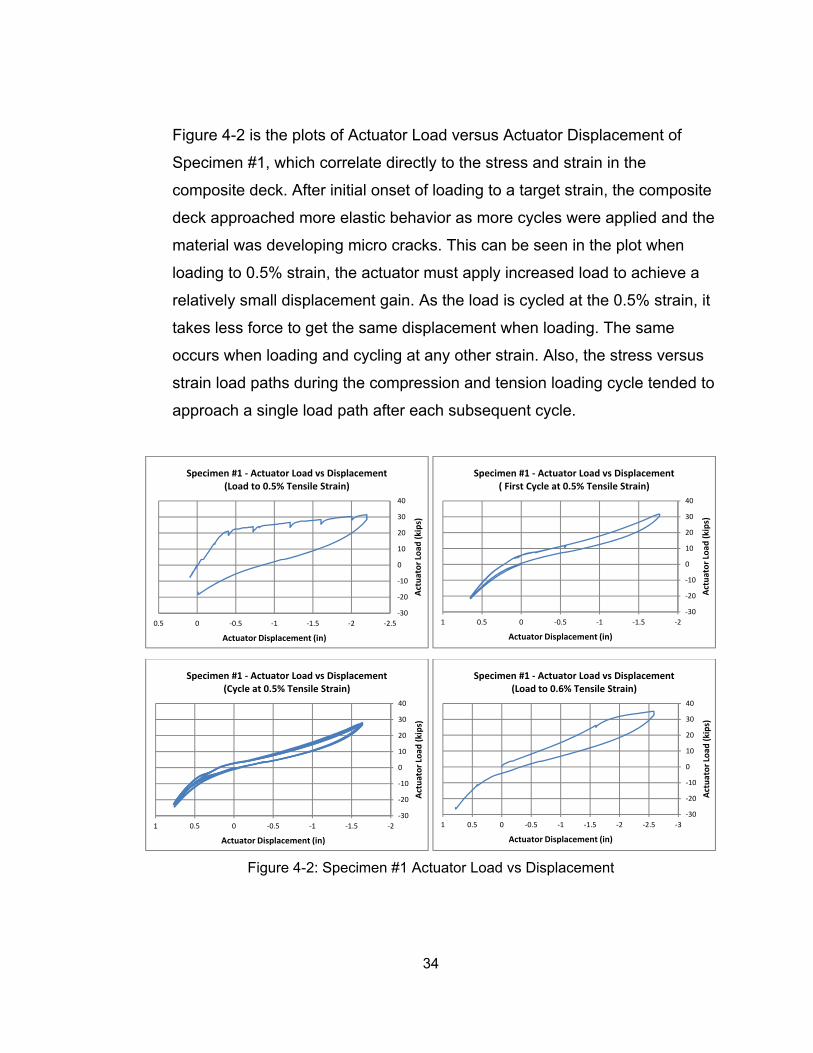
Figure 4-2 is the plots of Actuator Load versus Actuator Displacement of
Specimen #1, which correlate directly to the stress and strain in the
composite deck. After initial onset of loading to a target strain, the composite
deck approached more elastic behavior as more cycles were applied and the
material was developing micro cracks. This can be seen in the plot when
loading to 0.5% strain, the actuator must apply increased load to achieve a
relatively small displacement gain. As the load is cycled at the 0.5% strain, it
takes less force to get the same displacement when loading. The same
occurs when loading and cycling at any other strain. Also, the stress versus
strain load paths during the compression and tension loading cycle tended to
approach a single load path after each subsequent cycle.
Figure 4-2: Specimen #1 Actuator Load vs Displacement
‐30
‐20
‐10
0
10
20
30
40
‐2.5‐2‐1.5‐1‐0.500.5
Actuator Load
(kips)
Actuator Displacement (in)
Specimen #1 ‐ Actuator Load vs Displacement (Load to 0.5% Tensile Strain)
‐30
‐20
‐10
0
10
20
30
40
‐2‐1.5‐1‐0.500.51
Actuator Load
(kips)
Actuator Displacement (in)
Specimen #1 ‐ Actuator Load vs Displacement ( First Cycle at 0.5% Tensile Strain)
‐30
‐20
‐10
0
10
20
30
40
‐2‐1.5‐1‐0.500.51
Actuator Load
(kips)
Actuator Displacement (in)
Specimen #1 ‐ Actuator Load vs Displacement (Cycle at 0.5% Tensile Strain)
‐30
‐20
‐10
0
10
20
30
40
‐3‐2.5‐2‐1.5‐1‐0.500.51
Actuator Load
(kips)
Actuator Displacement (in)
Specimen #1 ‐ Actuator Load vs Displacement (Load to 0.6% Tensile Strain)
35
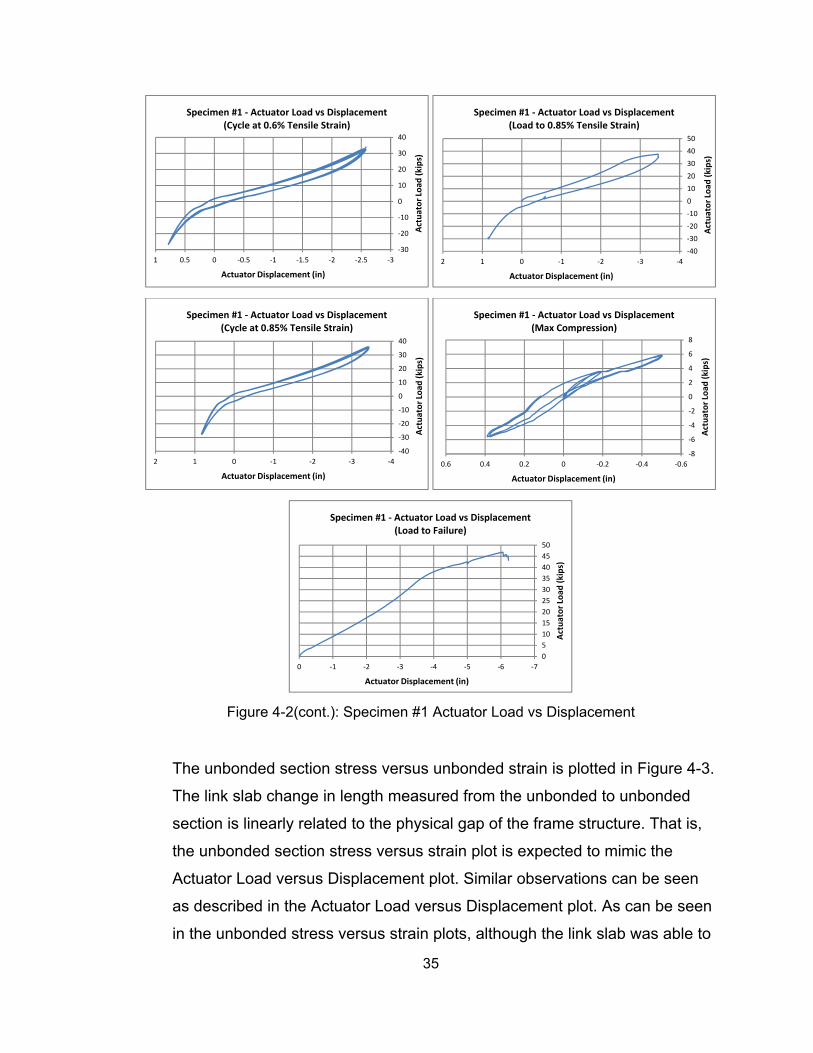
Figure 4-2(cont.): Specimen #1 Actuator Load vs Displacement
The unbonded section stress versus unbonded strain is plotted in Figure 4-3.
The link slab change in length measured from the unbonded to unbonded
section is linearly related to the physical gap of the frame structure. That is,
the unbonded section stress versus strain plot is expected to mimic the
Actuator Load versus Displacement plot. Similar observations can be seen
as described in the Actuator Load versus Displacement plot. As can be seen
in the unbonded stress versus strain plots, although the link slab was able to
‐30
‐20
‐10
0
10
20
30
40
‐3‐2.5‐2‐1.5‐1‐0.500.51
Actuator Load
(kips)
Actuator Displacement (in)
Specimen #1 ‐ Actuator Load vs Displacement (Cycle at 0.6% Tensile Strain)
‐40
‐30
‐20
‐10
0
10
20
30
40
50
‐4‐3‐2‐1012
Actuator Load
(kips)
Actuator Displacement (in)
Specimen #1 ‐ Actuator Load vs Displacement (Load to 0.85% Tensile Strain)
‐40
‐30
‐20
‐10
0
10
20
30
40
‐4‐3‐2‐1012
Actuator Load
(kips)
Actuator Displacement (in)
Specimen #1 ‐ Actuator Load vs Displacement (Cycle at 0.85% Tensile Strain)
‐8
‐6
‐4
‐2
0
2
4
6
8
‐0.6‐0.4‐0.200.20.40.6
Actuator Load
(kips)
Actuator Displacement (in)
Specimen #1 ‐ Actuator Load vs Displacement (Max Compression)
0
5
10
15
20
25
30
35
40
45
50
‐7‐6‐5‐4‐3‐2‐10
Actuator Load
(kips)
Actuator Displacement (in)
Specimen #1 ‐ Actuator Load vs Displacement (Load to Failure)
36
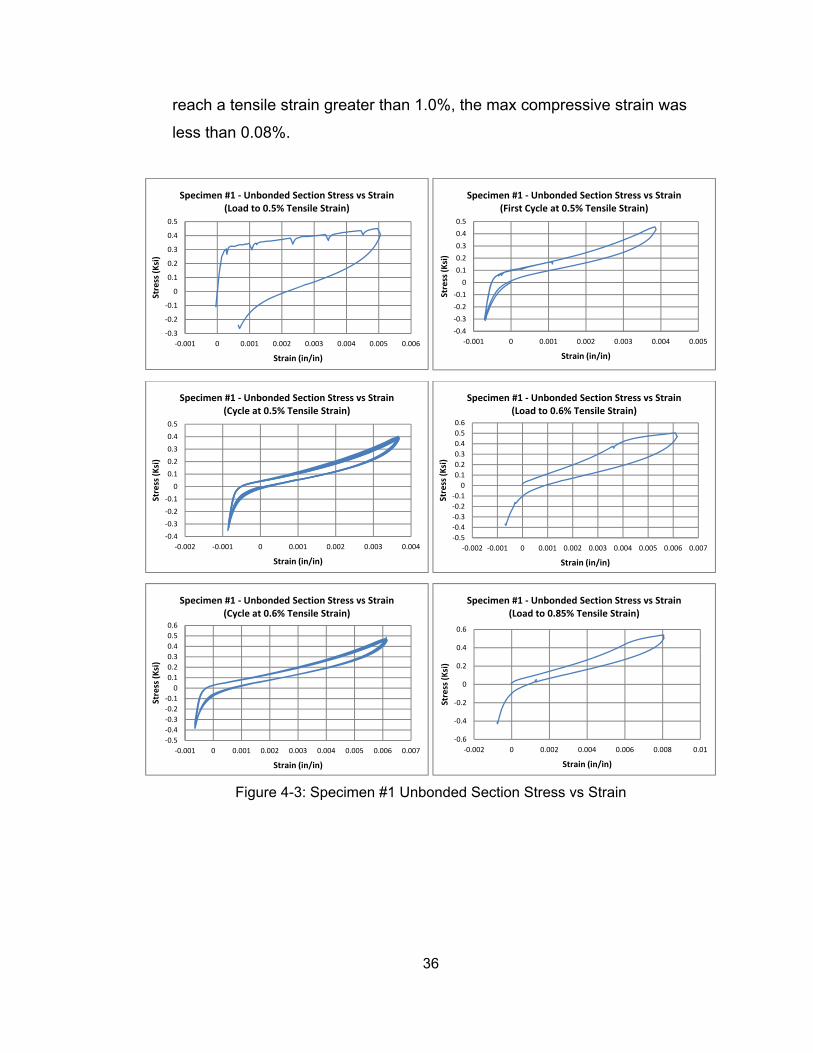
reach a tensile strain greater than 1.0%, the max compressive strain was
less than 0.08%.
Figure 4-3: Specimen #1 Unbonded Section Stress vs Strain
‐0.3
‐0.2
‐0.1
0
0.1
0.2
0.3
0.4
0.5
‐0.001 0 0.001 0.002 0.003 0.004 0.005 0.006
Stress (Ksi)
Strain (in/in)
Specimen #1 ‐ Unbonded Section Stress vs Strain(Load to 0.5% Tensile Strain)
‐0.4
‐0.3
‐0.2
‐0.1
0
0.1
0.2
0.3
0.4
0.5
‐0.001 0 0.001 0.002 0.003 0.004 0.005
Stress (Ksi)
Strain (in/in)
Specimen #1 ‐ Unbonded Section Stress vs Strain(First Cycle at 0.5% Tensile Strain)
‐0.4
‐0.3
‐0.2
‐0.1
0
0.1
0.2
0.3
0.4
0.5
‐0.002 ‐0.001 0 0.001 0.002 0.003 0.004
Stress (Ksi)
Strain (in/in)
Specimen #1 ‐ Unbonded Section Stress vs Strain(Cycle at 0.5% Tensile Strain)
‐0.5
‐0.4
‐0.3
‐0.2
‐0.1
0
0.1
0.2
0.3
0.4
0.5
0.6
‐0.002 ‐0.001 0 0.001 0.002 0.003 0.004 0.005 0.006 0.007
Stress (Ksi)
Strain (in/in)
Specimen #1 ‐ Unbonded Section Stress vs Strain(Load to 0.6% Tensile Strain)
‐0.5
‐0.4
‐0.3
‐0.2
‐0.1
0
0.1
0.2
0.3
0.4
0.5
0.6
‐0.001 0 0.001 0.002 0.003 0.004 0.005 0.006 0.007
Stress (Ksi)
Strain (in/in)
Specimen #1 ‐ Unbonded Section Stress vs Strain(Cycle at 0.6% Tensile Strain)
‐0.6
‐0.4
‐0.2
0
0.2
0.4
0.6
‐0.002 0 0.002 0.004 0.006 0.008 0.01
Stress (Ksi)
Strain (in/in)
Specimen #1 ‐ Unbonded Section Stress vs Strain(Load to 0.85% Tensile Strain)
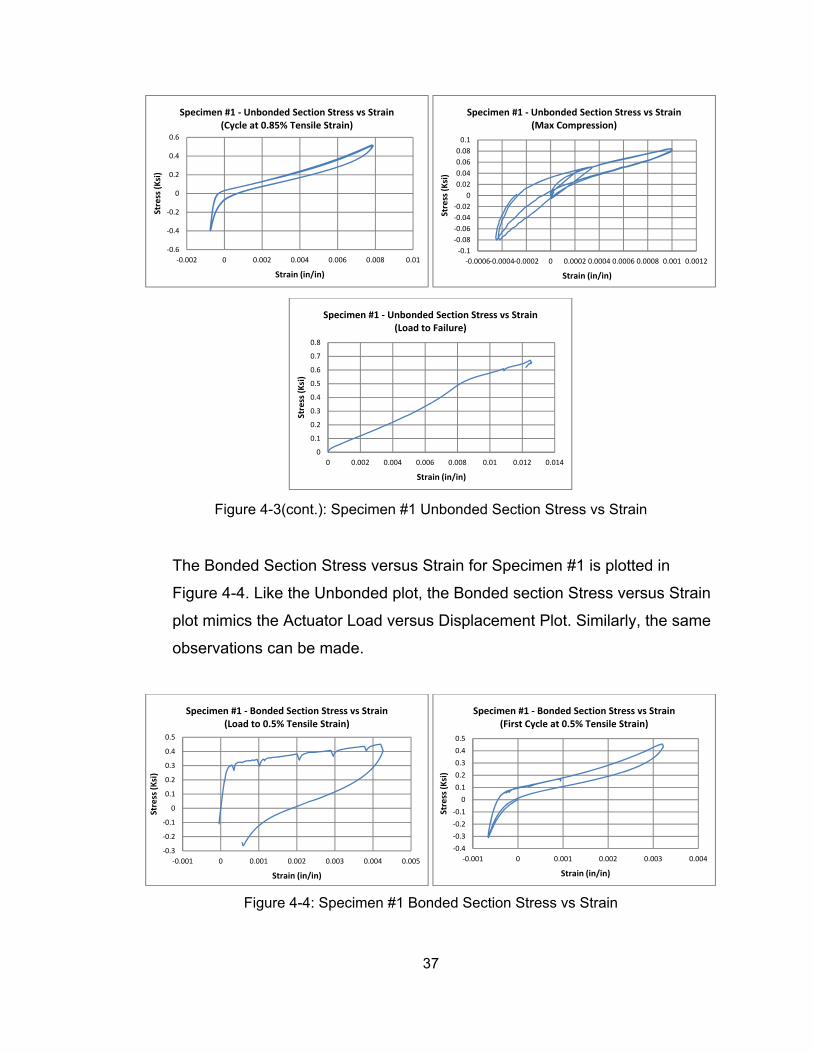
37
Figure 4-3(cont.): Specimen #1 Unbonded Section Stress vs Strain
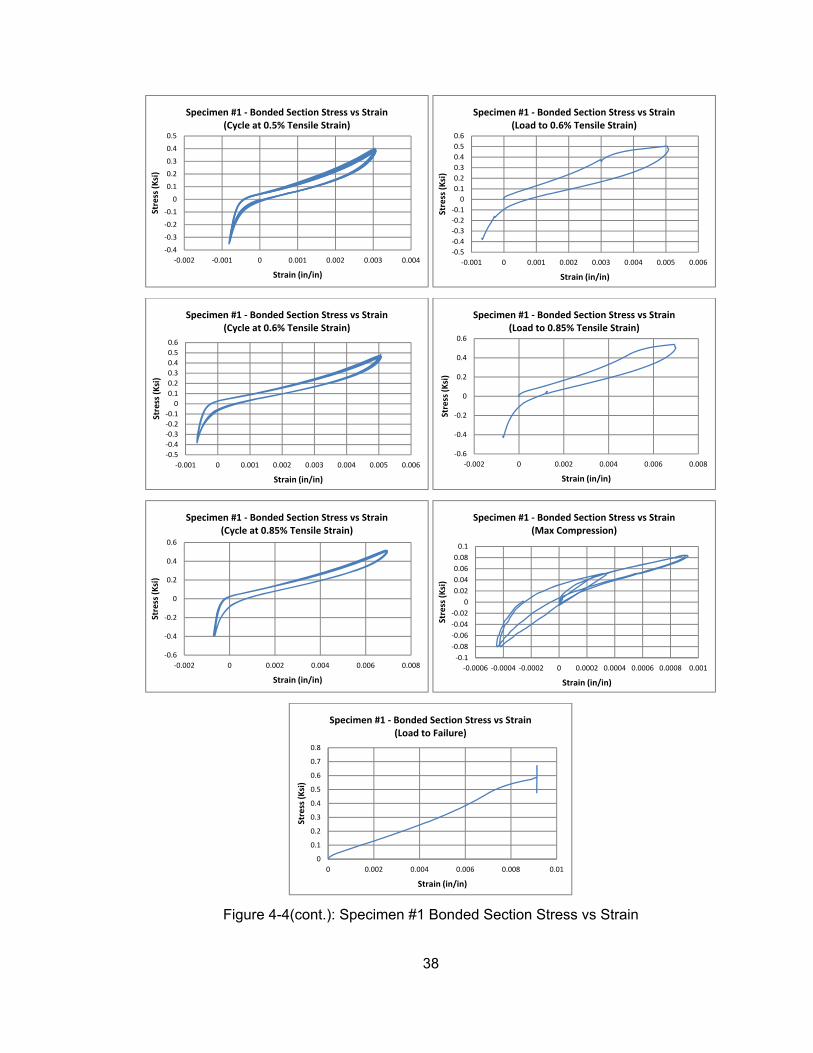
The Bonded Section Stress versus Strain for Specimen #1 is plotted in
Figure 4-4. Like the Unbonded plot, the Bonded section Stress versus Strain
plot mimics the Actuator Load versus Displacement Plot. Similarly, the same
observations can be made.
Figure 4-4: Specimen #1 Bonded Section Stress vs Strain
‐0.6
‐0.4
‐0.2
0
0.2
0.4
0.6
‐0.002 0 0.002 0.004 0.006 0.008 0.01
Stress (Ksi)
Strain (in/in)
Specimen #1 ‐ Unbonded Section Stress vs Strain(Cycle at 0.85% Tensile Strain)
‐0.1
‐0.08
‐0.06
‐0.04
‐0.02
0
0.02
0.04
0.06
0.08
0.1
‐0.0006‐0.0004‐0.0002 0 0.0002 0.0004 0.0006 0.0008 0.001 0.0012
Stress (Ksi)
Strain (in/in)
Specimen #1 ‐ Unbonded Section Stress vs Strain(Max Compression)
0
0.1
0.2
0.3
0.4
0.5
0.6
0.7
0.8
0 0.002 0.004 0.006 0.008 0.01 0.012 0.014
Stress (Ksi)
Strain (in/in)
Specimen #1 ‐ Unbonded Section Stress vs Strain(Load to Failure)
‐0.3
‐0.2
‐0.1
0
0.1
0.2
0.3
0.4
0.5
‐0.001 0 0.001 0.002 0.003 0.004 0.005
Stress (Ksi)
Strain (in/in)
Specimen #1 ‐ Bonded Section Stress vs Strain(Load to 0.5% Tensile Strain)
‐0.4
‐0.3
‐0.2
‐0.1
0
0.1
0.2
0.3
0.4
0.5
‐0.001 0 0.001 0.002 0.003 0.004
Stress (Ksi)
Strain (in/in)
Specimen #1 ‐ Bonded Section Stress vs Strain(First Cycle at 0.5% Tensile Strain)
38
Figure 4-4(cont.): Specimen #1 Bonded Section Stress vs Strain
‐0.4
‐0.3
‐0.2
‐0.1
0
0.1
0.2
0.3
0.4
0.5
‐0.002 ‐0.001 0 0.001 0.002 0.003 0.004
Stress (Ksi)
Strain (in/in)
Specimen #1 ‐ Bonded Section Stress vs Strain(Cycle at 0.5% Tensile Strain)
‐0.5
‐0.4
‐0.3
‐0.2
‐0.1
0
0.1
0.2
0.3
0.4
0.5
0.6
‐0.001 0 0.001 0.002 0.003 0.004 0.005 0.006
Stress (Ksi)
Strain (in/in)
Specimen #1 ‐ Bonded Section Stress vs Strain(Load to 0.6% Tensile Strain)
‐0.5
‐0.4
‐0.3
‐0.2
‐0.1
0
0.1
0.2
0.3
0.4
0.5
0.6
‐0.001 0 0.001 0.002 0.003 0.004 0.005 0.006
Stress (Ksi)
Strain (in/in)
Specimen #1 ‐ Bonded Section Stress vs Strain(Cycle at 0.6% Tensile Strain)
‐0.6
‐0.4
‐0.2
0
0.2
0.4
0.6
‐0.002 0 0.002 0.004 0.006 0.008
Stress (Ksi)
Strain (in/in)
Specimen #1 ‐ Bonded Section Stress vs Strain(Load to 0.85% Tensile Strain)
‐0.6
‐0.4
‐0.2
0
0.2
0.4
0.6
‐0.002 0 0.002 0.004 0.006 0.008
Stress (Ksi)
Strain (in/in)
Specimen #1 ‐ Bonded Section Stress vs Strain(Cycle at 0.85% Tensile Strain)
‐0.1
‐0.08
‐0.06
‐0.04
‐0.02
0
0.02
0.04
0.06
0.08
0.1
‐0.0006 ‐0.0004 ‐0.0002 0 0.0002 0.0004 0.0006 0.0008 0.001
Stress (Ksi)
Strain (in/in)
Specimen #1 ‐ Bonded Section Stress vs Strain(Max Compression)
0
0.1
0.2
0.3
0.4
0.5
0.6
0.7
0.8
0 0.002 0.004 0.006 0.008 0.01
Stress (Ksi)
Strain (in/in)
Specimen #1 ‐ Bonded Section Stress vs Strain(Load to Failure)
39
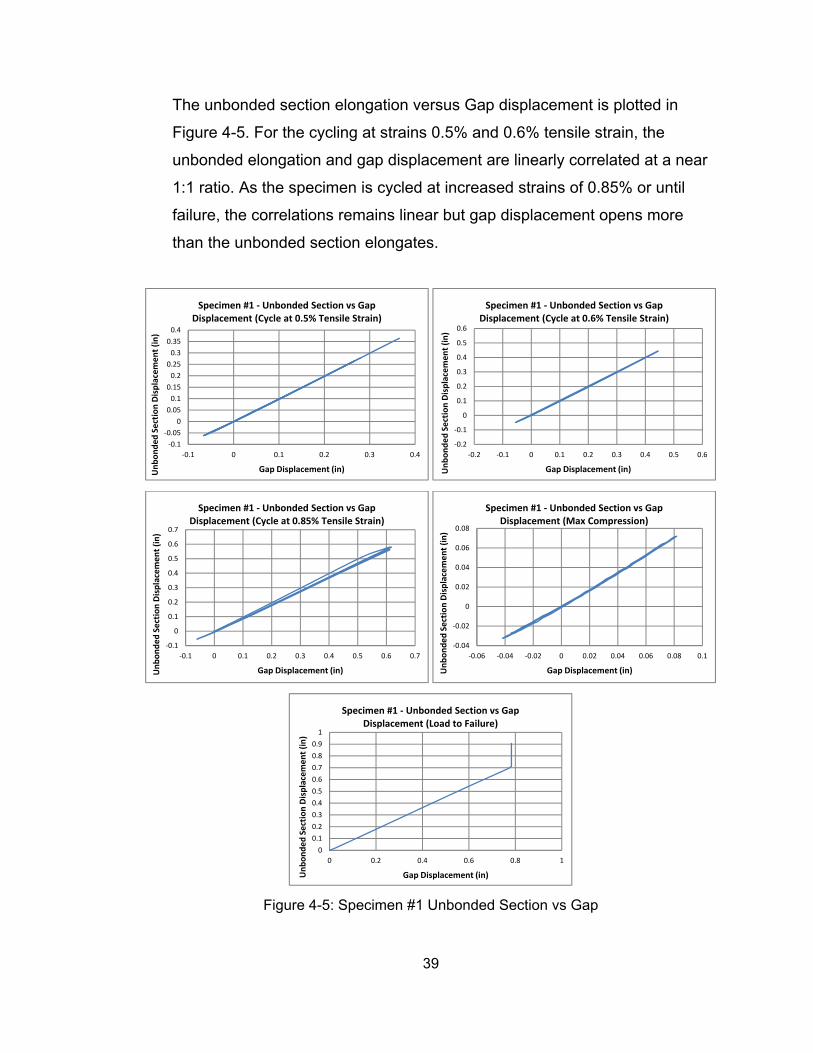
The unbonded section elongation versus Gap displacement is plotted in
Figure 4-5. For the cycling at strains 0.5% and 0.6% tensile strain, the
unbonded elongation and gap displacement are linearly correlated at a near
1:1 ratio. As the specimen is cycled at increased strains of 0.85% or until
failure, the correlations remains linear but gap displacement opens more
than the unbonded section elongates.
Figure 4-5: Specimen #1 Unbonded Section vs Gap
‐0.1
‐0.05
0
0.05
0.1
0.15
0.2
0.25
0.3
0.35
0.4
‐0.1 0 0.1 0.2 0.3 0.4
Unbonded Section Displacement (in)
Gap Displacement (in)
Specimen #1 ‐ Unbonded Section vs Gap Displacement (Cycle at 0.5% Tensile Strain)
‐0.2
‐0.1
0
0.1
0.2
0.3
0.4
0.5
0.6
‐0.2 ‐0.1 0 0.1 0.2 0.3 0.4 0.5 0.6Unbonded Section Displacement (in)
Gap Displacement (in)
Specimen #1 ‐ Unbonded Section vs Gap Displacement (Cycle at 0.6% Tensile Strain)
‐0.1
0
0.1
0.2
0.3
0.4
0.5
0.6
0.7
‐0.1 0 0.1 0.2 0.3 0.4 0.5 0.6 0.7
Unbonded Section Displacement (in)
Gap Displacement (in)
Specimen #1 ‐ Unbonded Section vs Gap Displacement (Cycle at 0.85% Tensile Strain)
‐0.04
‐0.02
0
0.02
0.04
0.06
0.08
‐0.06 ‐0.04 ‐0.02 0 0.02 0.04 0.06 0.08 0.1
Unbonded Section Displacement (in)
Gap Displacement (in)
Specimen #1 ‐ Unbonded Section vs Gap Displacement (Max Compression)
0
0.1
0.2
0.3
0.4
0.5
0.6
0.7
0.8
0.9
1
0 0.2 0.4 0.6 0.8 1
Unbonded Section Displacement (in)
Gap Displacement (in)
Specimen #1 ‐ Unbonded Section vs Gap Displacement (Load to Failure)
40
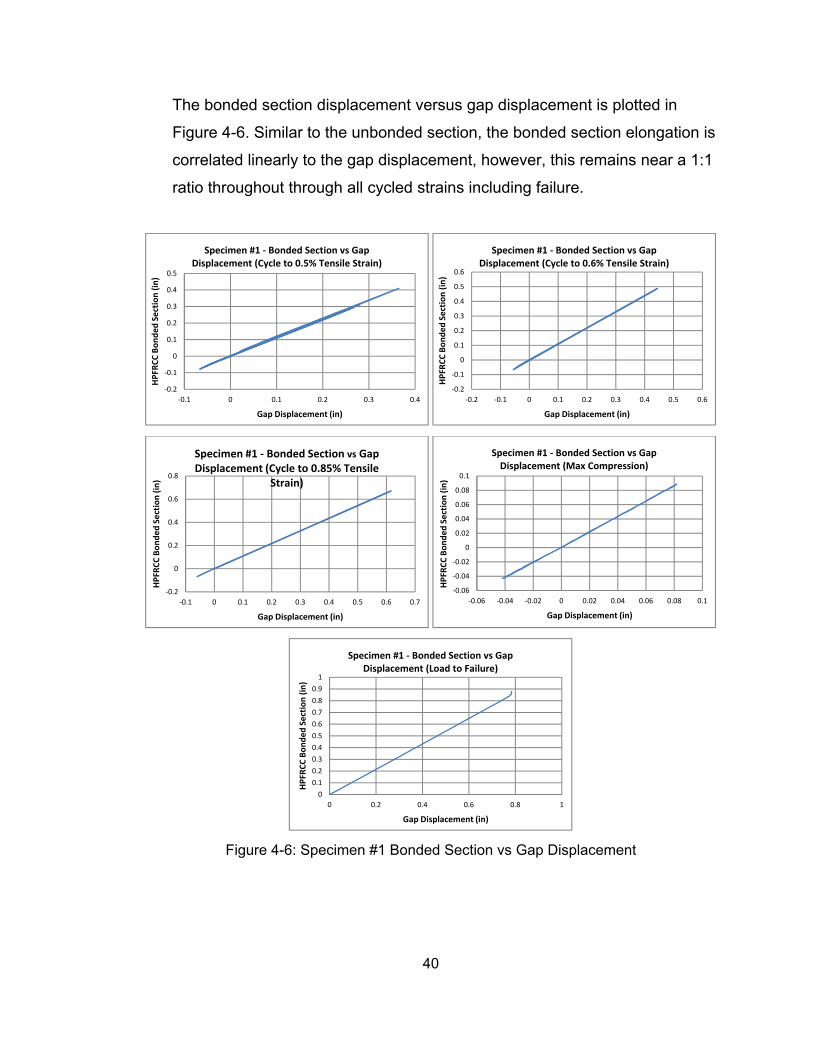
The bonded section displacement versus gap displacement is plotted in
Figure 4-6. Similar to the unbonded section, the bonded section elongation is
correlated linearly to the gap displacement, however, this remains near a 1:1
ratio throughout through all cycled strains including failure.
Figure 4-6: Specimen #1 Bonded Section vs Gap Displacement
‐0.2
‐0.1
0
0.1
0.2
0.3
0.4
0.5
‐0.1 0 0.1 0.2 0.3 0.4
HPFR
CC Bonded Section (in)
Gap Displacement (in)
Specimen #1 ‐ Bonded Section vs Gap Displacement (Cycle to 0.5% Tensile Strain)
‐0.2
‐0.1
0
0.1
0.2
0.3
0.4
0.5
0.6
‐0.2 ‐0.1 0 0.1 0.2 0.3 0.4 0.5 0.6
HPFR
CC Bonded Section (in)
Gap Displacement (in)
Specimen #1 ‐ Bonded Section vs Gap Displacement (Cycle to 0.6% Tensile Strain)
‐0.2
0
0.2
0.4
0.6
0.8
‐0.1 0 0.1 0.2 0.3 0.4 0.5 0.6 0.7
HPFR
CC Bonded Section (in)
Gap Displacement (in)
Specimen #1 ‐ Bonded Section vs Gap Displacement (Cycle to 0.85% Tensile
Strain)
‐0.06
‐0.04
‐0.02
0
0.02
0.04
0.06
0.08
0.1
‐0.06 ‐0.04 ‐0.02 0 0.02 0.04 0.06 0.08 0.1
HPFR
CC Bonded Section (in)
Gap Displacement (in)
Specimen #1 ‐ Bonded Section vs Gap Displacement (Max Compression)
0
0.1
0.2
0.3
0.4
0.5
0.6
0.7
0.8
0.9
1
0 0.2 0.4 0.6 0.8 1
HPFR
CC Bonded Section (in)
Gap Displacement (in)
Specimen #1 ‐ Bonded Section vs Gap Displacement (Load to Failure)
41
4.2 Specimen #2
Note: Specimen #2 was tested in a similar manner to Specimen #1. Much of
the same verbiage is repeated for convenience.
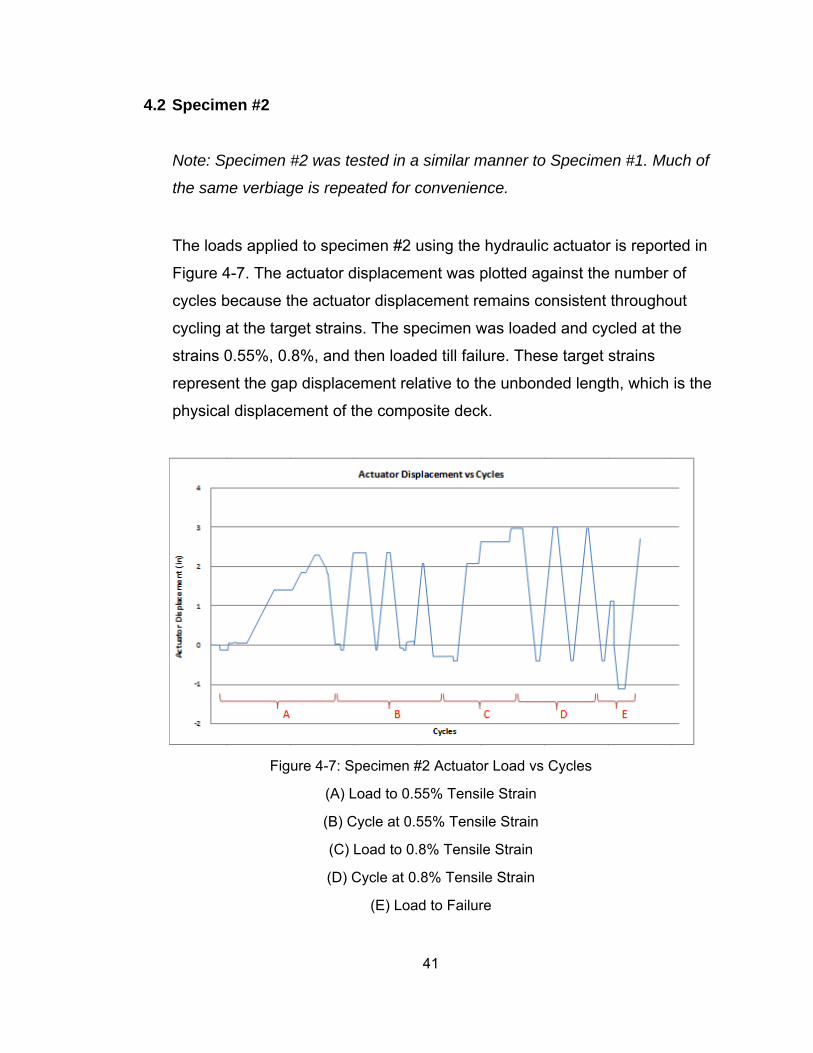
The loads applied to specimen #2 using the hydraulic actuator is reported in
Figure 4-7. The actuator displacement was plotted against the number of
cycles because the actuator displacement remains consistent throughout
cycling at the target strains. The specimen was loaded and cycled at the
strains 0.55%, 0.8%, and then loaded till failure. These target strains
represent the gap displacement relative to the unbonded length, which is the
physical displacement of the composite deck.
Figure 4-7: Specimen #2 Actuator Load vs Cycles
(A) Load to 0.55% Tensile Strain
(B) Cycle at 0.55% Tensile Strain
(C) Load to 0.8% Tensile Strain
(D) Cycle at 0.8% Tensile Strain
(E) Load to Failure
42
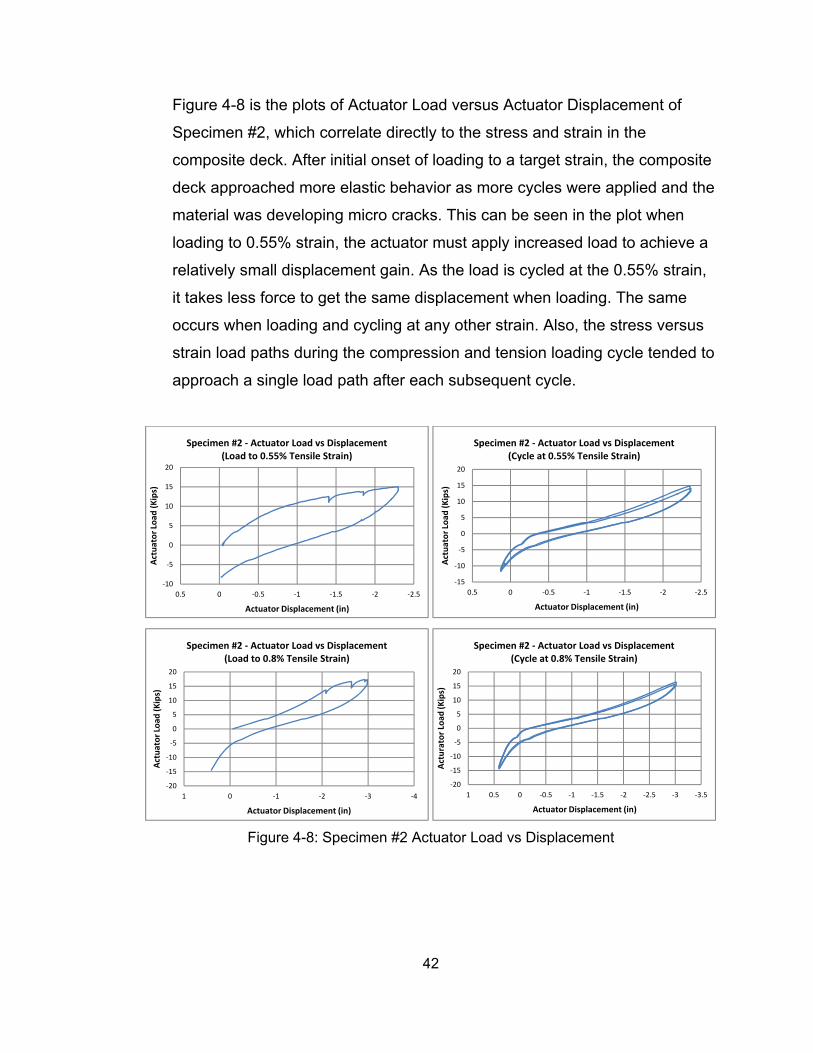
Figure 4-8 is the plots of Actuator Load versus Actuator Displacement of
Specimen #2, which correlate directly to the stress and strain in the
composite deck. After initial onset of loading to a target strain, the composite
deck approached more elastic behavior as more cycles were applied and the
material was developing micro cracks. This can be seen in the plot when
loading to 0.55% strain, the actuator must apply increased load to achieve a
relatively small displacement gain. As the load is cycled at the 0.55% strain,
it takes less force to get the same displacement when loading. The same
occurs when loading and cycling at any other strain. Also, the stress versus
strain load paths during the compression and tension loading cycle tended to
approach a single load path after each subsequent cycle.
Figure 4-8: Specimen #2 Actuator Load vs Displacement
‐10
‐5
0
5
10
15
20
‐2.5‐2‐1.5‐1‐0.500.5
Actuator Load
(Kips)
Actuator Displacement (in)
Specimen #2 ‐ Actuator Load vs Displacement (Load to 0.55% Tensile Strain)
‐15
‐10
‐5
0
5
10
15
20
‐2.5‐2‐1.5‐1‐0.500.5
Actuator Load
(Kips)
Actuator Displacement (in)
Specimen #2 ‐ Actuator Load vs Displacement (Cycle at 0.55% Tensile Strain)
‐20
‐15
‐10
‐5
0
5
10
15
20
‐4‐3‐2‐101
Actuator Load
(Kips)
Actuator Displacement (in)
Specimen #2 ‐ Actuator Load vs Displacement (Load to 0.8% Tensile Strain)
‐20
‐15
‐10
‐5
0
5
10
15
20
‐3.5‐3‐2.5‐2‐1.5‐1‐0.500.51
Acturator Load
(Kips)
Actuator Displacement (in)
Specimen #2 ‐ Actuator Load vs Displacement (Cycle at 0.8% Tensile Strain)
43
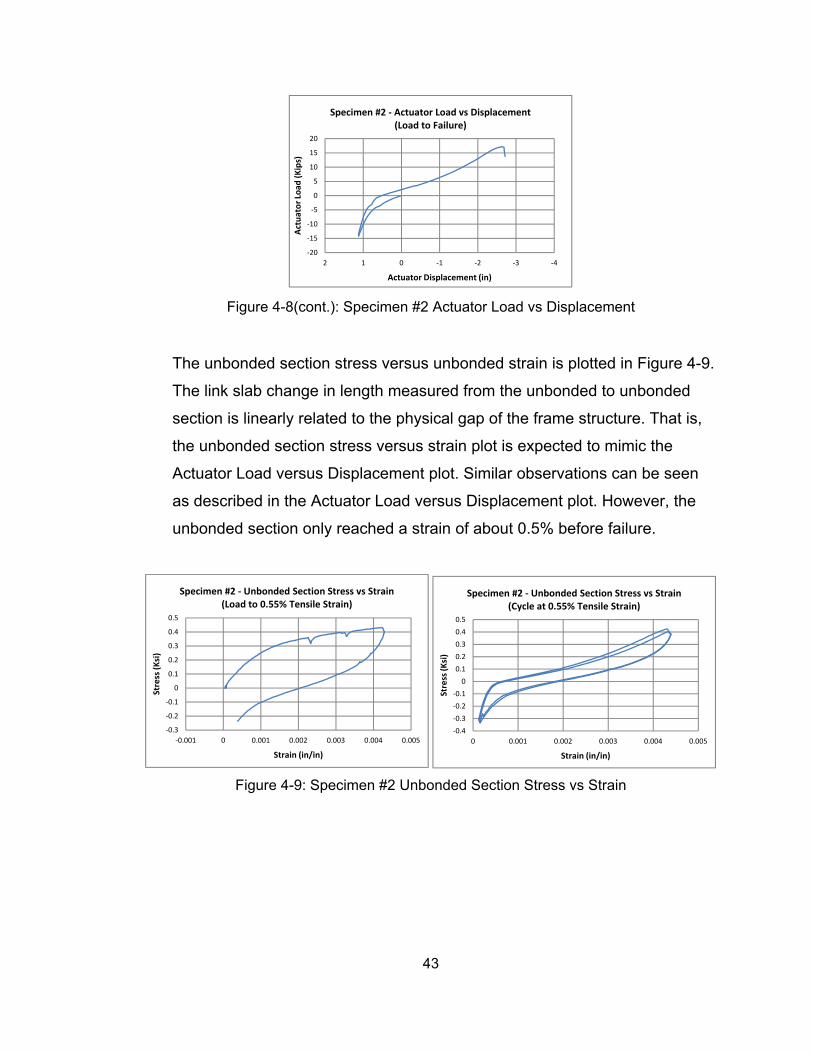
Figure 4-8(cont.): Specimen #2 Actuator Load vs Displacement
The unbonded section stress versus unbonded strain is plotted in Figure 4-9.
The link slab change in length measured from the unbonded to unbonded
section is linearly related to the physical gap of the frame structure. That is,
the unbonded section stress versus strain plot is expected to mimic the
Actuator Load versus Displacement plot. Similar observations can be seen
as described in the Actuator Load versus Displacement plot. However, the
unbonded section only reached a strain of about 0.5% before failure.
Figure 4-9: Specimen #2 Unbonded Section Stress vs Strain
‐20
‐15
‐10
‐5
0
5
10
15
20
‐4‐3‐2‐1012
Actuator Load
(Kips)
Actuator Displacement (in)
Specimen #2 ‐ Actuator Load vs Displacement (Load to Failure)
‐0.3
‐0.2
‐0.1
0
0.1
0.2
0.3
0.4
0.5
‐0.001 0 0.001 0.002 0.003 0.004 0.005
Stress (Ksi)
Strain (in/in)
Specimen #2 ‐ Unbonded Section Stress vs Strain (Load to 0.55% Tensile Strain)
‐0.4
‐0.3
‐0.2
‐0.1
0
0.1
0.2
0.3
0.4
0.5
0 0.001 0.002 0.003 0.004 0.005
Stress (Ksi)
Strain (in/in)
Specimen #2 ‐ Unbonded Section Stress vs Strain (Cycle at 0.55% Tensile Strain)
44
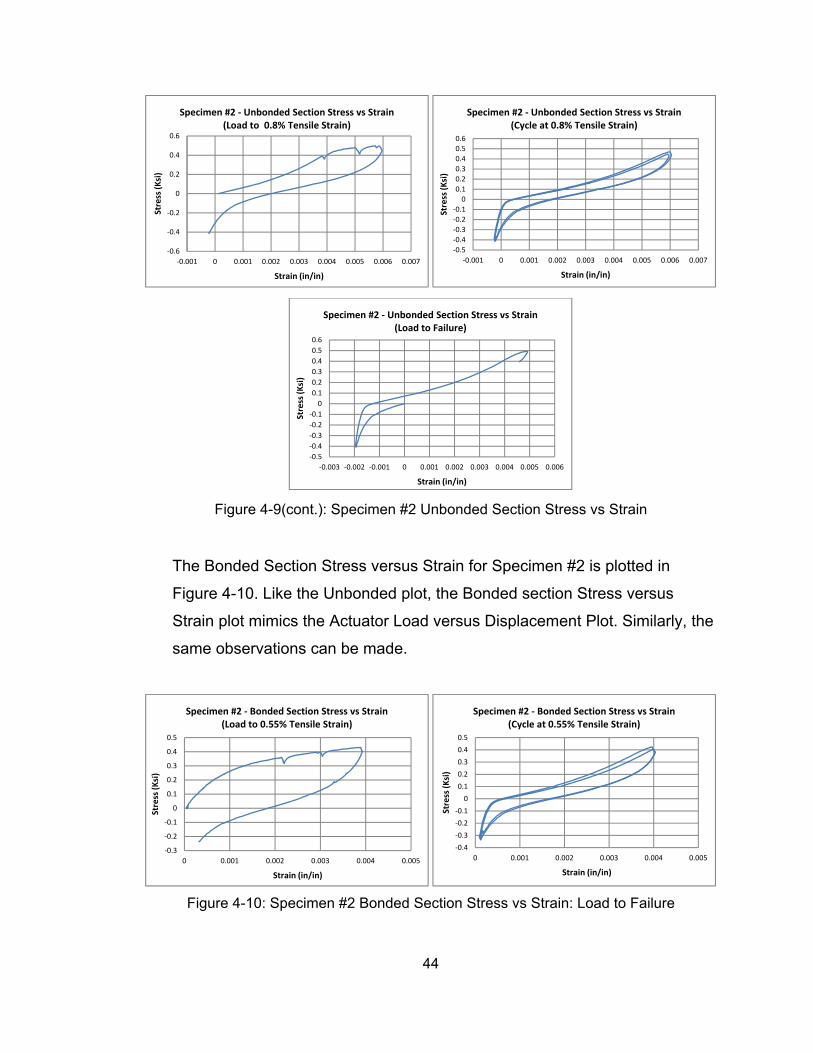
Figure 4-9(cont.): Specimen #2 Unbonded Section Stress vs Strain
The Bonded Section Stress versus Strain for Specimen #2 is plotted in
Figure 4-10. Like the Unbonded plot, the Bonded section Stress versus
Strain plot mimics the Actuator Load versus Displacement Plot. Similarly, the
same observations can be made.
Figure 4-10: Specimen #2 Bonded Section Stress vs Strain: Load to Failure
‐0.6
‐0.4
‐0.2
0
0.2
0.4
0.6
‐0.001 0 0.001 0.002 0.003 0.004 0.005 0.006 0.007
Stress (Ksi)
Strain (in/in)
Specimen #2 ‐ Unbonded Section Stress vs Strain (Load to 0.8% Tensile Strain)
‐0.5
‐0.4
‐0.3
‐0.2
‐0.1
0
0.1
0.2
0.3
0.4
0.5
0.6
‐0.001 0 0.001 0.002 0.003 0.004 0.005 0.006 0.007
Stress (Ksi)
Strain (in/in)
Specimen #2 ‐ Unbonded Section Stress vs Strain (Cycle at 0.8% Tensile Strain)
‐0.5
‐0.4
‐0.3
‐0.2
‐0.1
0
0.1
0.2
0.3
0.4
0.5
0.6
‐0.003 ‐0.002 ‐0.001 0 0.001 0.002 0.003 0.004 0.005 0.006
Stress (Ksi)
Strain (in/in)
Specimen #2 ‐ Unbonded Section Stress vs Strain (Load to Failure)
‐0.3
‐0.2
‐0.1
0
0.1
0.2
0.3
0.4
0.5
0 0.001 0.002 0.003 0.004 0.005
Stress (Ksi)
Strain (in/in)
Specimen #2 ‐ Bonded Section Stress vs Strain (Load to 0.55% Tensile Strain)
‐0.4
‐0.3
‐0.2
‐0.1
0
0.1
0.2
0.3
0.4
0.5
0 0.001 0.002 0.003 0.004 0.005
Stress (Ksi)
Strain (in/in)
Specimen #2 ‐ Bonded Section Stress vs Strain (Cycle at 0.55% Tensile Strain)

45
Figure 4-10(cont.): Specimen #2 Bonded Section Stress vs Strain: Load to Failure
The unbonded section elongation versus Gap displacement is plotted in
Figure 4-11. As the specimen is cycled, the correlation between the
unbonded elongation and the gap displacement remains relatively linear,
however, the gap displacement opens more than the unbonded section
elongates.
Figure 4-11: Specimen #2 Unbonded Section Displacement vs Gap
‐0.6
‐0.4
‐0.2
0
0.2
0.4
0.6
‐0.001 0 0.001 0.002 0.003 0.004 0.005 0.006
Stress (Ksi)
Strain (in/in)
Specimen #2 ‐ Bonded Section Stress vs Strain (Load to 0.8% Tensile Strain)
‐0.5‐0.4‐0.3‐0.2‐0.1
00.10.20.30.40.50.6
‐0.001 0 0.001 0.002 0.003 0.004 0.005 0.006
Stress (Ksi)
Strain (in/in)
Specimen #2 ‐ Bonded Section Stress vs Strain (Cycle at 0.8% Tensile Strain)
‐0.5‐0.4‐0.3
‐0.2‐0.1
00.1
0.20.30.4
0.50.6
‐0.003 ‐0.002 ‐0.001 0 0.001 0.002 0.003 0.004 0.005
Stress (Ksi)
Strain (in/in)
Specimen #2 ‐ Bonded Section Stress vs Strain (Load to Failure)
0
0.05
0.1
0.15
0.2
0.25
0.3
0.35
0 0.1 0.2 0.3 0.4 0.5
Unbonded Section (in)
Gap Displacement (in)
Specimen #2 ‐ Unbonded Section vs Gap Displacement (Load to 0.55% Tensile Strain)
0
0.05
0.1
0.15
0.2
0.25
0.3
0.35
0 0.1 0.2 0.3 0.4 0.5
Unbonded Section (in)
Gap Displacement (in)
Specimen #2 ‐ Unbonded Section vs Gap Displacement (Cycle at 0.55% Tensile Strain)
46
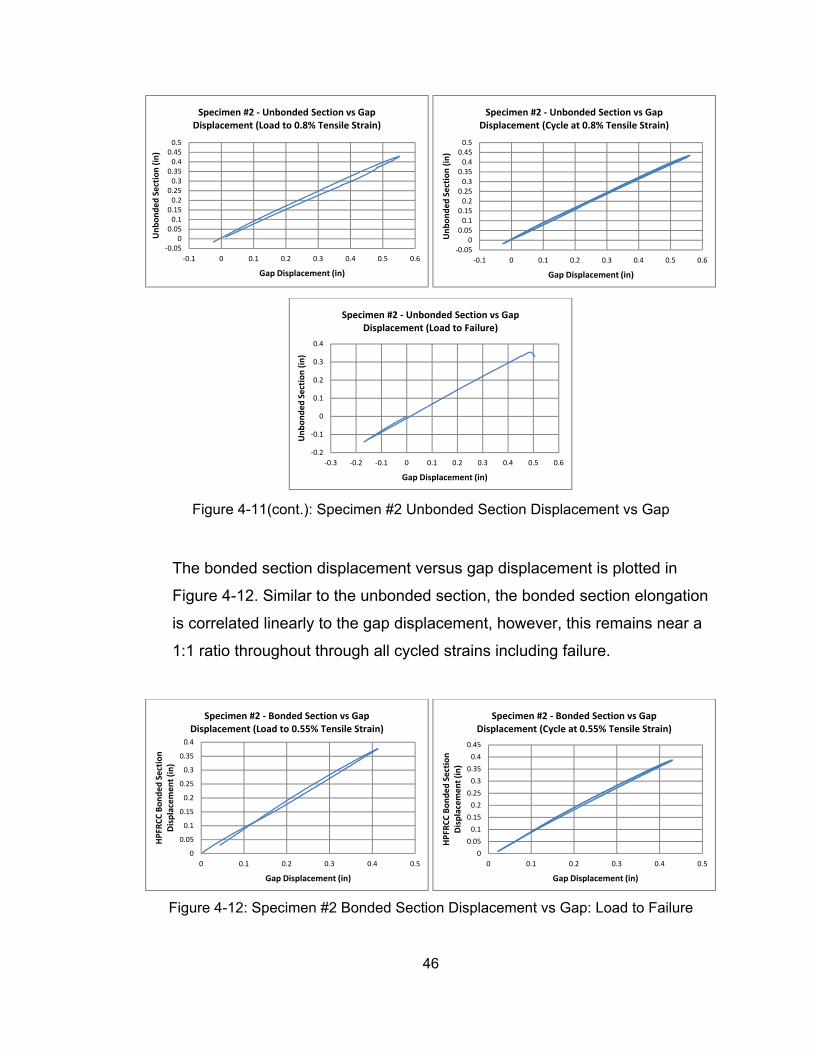
Figure 4-11(cont.): Specimen #2 Unbonded Section Displacement vs Gap
The bonded section displacement versus gap displacement is plotted in
Figure 4-12. Similar to the unbonded section, the bonded section elongation
is correlated linearly to the gap displacement, however, this remains near a
1:1 ratio throughout through all cycled strains including failure.
Figure 4-12: Specimen #2 Bonded Section Displacement vs Gap: Load to Failure
‐0.050
0.050.10.150.20.250.30.350.40.450.5
‐0.1 0 0.1 0.2 0.3 0.4 0.5 0.6
Unbonded Section (in)
Gap Displacement (in)
Specimen #2 ‐ Unbonded Section vs Gap Displacement (Load to 0.8% Tensile Strain)
‐0.050
0.050.10.150.20.250.30.350.40.450.5
‐0.1 0 0.1 0.2 0.3 0.4 0.5 0.6
Unbonded Section (in)
Gap Displacement (in)
Specimen #2 ‐ Unbonded Section vs Gap Displacement (Cycle at 0.8% Tensile Strain)
‐0.2
‐0.1
0
0.1
0.2
0.3
0.4
‐0.3 ‐0.2 ‐0.1 0 0.1 0.2 0.3 0.4 0.5 0.6
Unbonded Section (in)
Gap Displacement (in)
Specimen #2 ‐ Unbonded Section vs Gap Displacement (Load to Failure)
0
0.05
0.1
0.15
0.2
0.25
0.3
0.35
0.4
0 0.1 0.2 0.3 0.4 0.5
HPFR
CC Bonded Section
Displacement (in)
Gap Displacement (in)
Specimen #2 ‐ Bonded Section vs Gap Displacement (Load to 0.55% Tensile Strain)
0
0.05
0.1
0.15
0.2
0.25
0.3
0.35
0.4
0.45
0 0.1 0.2 0.3 0.4 0.5
HPFR
CC Bonded Section
Displacement (in)
Gap Displacement (in)
Specimen #2 ‐ Bonded Section vs Gap Displacement (Cycle at 0.55% Tensile Strain)
47
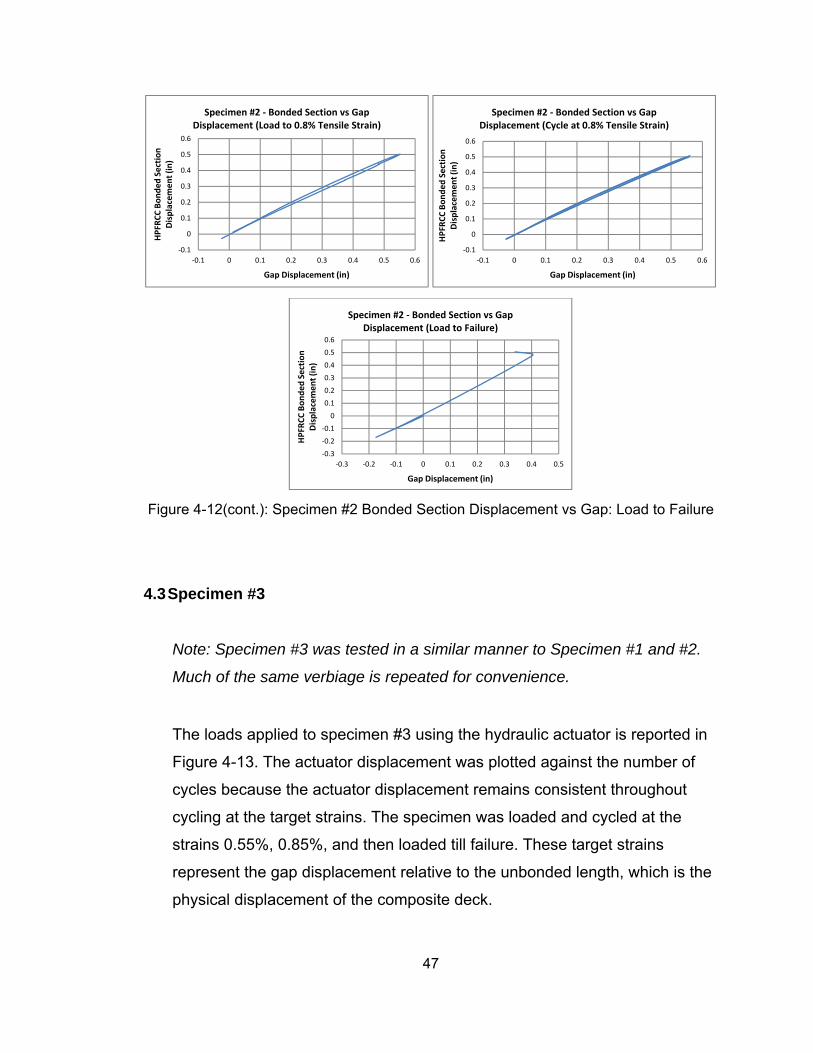
Figure 4-12(cont.): Specimen #2 Bonded Section Displacement vs Gap: Load to Failure
4.3 Specimen #3
Note: Specimen #3 was tested in a similar manner to Specimen #1 and #2.
Much of the same verbiage is repeated for convenience.
The loads applied to specimen #3 using the hydraulic actuator is reported in
Figure 4-13. The actuator displacement was plotted against the number of
cycles because the actuator displacement remains consistent throughout
cycling at the target strains. The specimen was loaded and cycled at the
strains 0.55%, 0.85%, and then loaded till failure. These target strains
represent the gap displacement relative to the unbonded length, which is the
physical displacement of the composite deck.
‐0.1
0
0.1
0.2
0.3
0.4
0.5
0.6
‐0.1 0 0.1 0.2 0.3 0.4 0.5 0.6
HPFR
CC Bonded Section
Displacement (in)
Gap Displacement (in)
Specimen #2 ‐ Bonded Section vs Gap Displacement (Load to 0.8% Tensile Strain)
‐0.1
0
0.1
0.2
0.3
0.4
0.5
0.6
‐0.1 0 0.1 0.2 0.3 0.4 0.5 0.6
HPFR
CC Bonded Section
Displacement (in)
Gap Displacement (in)
Specimen #2 ‐ Bonded Section vs Gap Displacement (Cycle at 0.8% Tensile Strain)
‐0.3
‐0.2
‐0.1
0
0.1
0.2
0.3
0.4
0.5
0.6
‐0.3 ‐0.2 ‐0.1 0 0.1 0.2 0.3 0.4 0.5
HPFR
CC Bonded Section
Displacement (in)
Gap Displacement (in)
Specimen #2 ‐ Bonded Section vs Gap Displacement (Load to Failure)
48
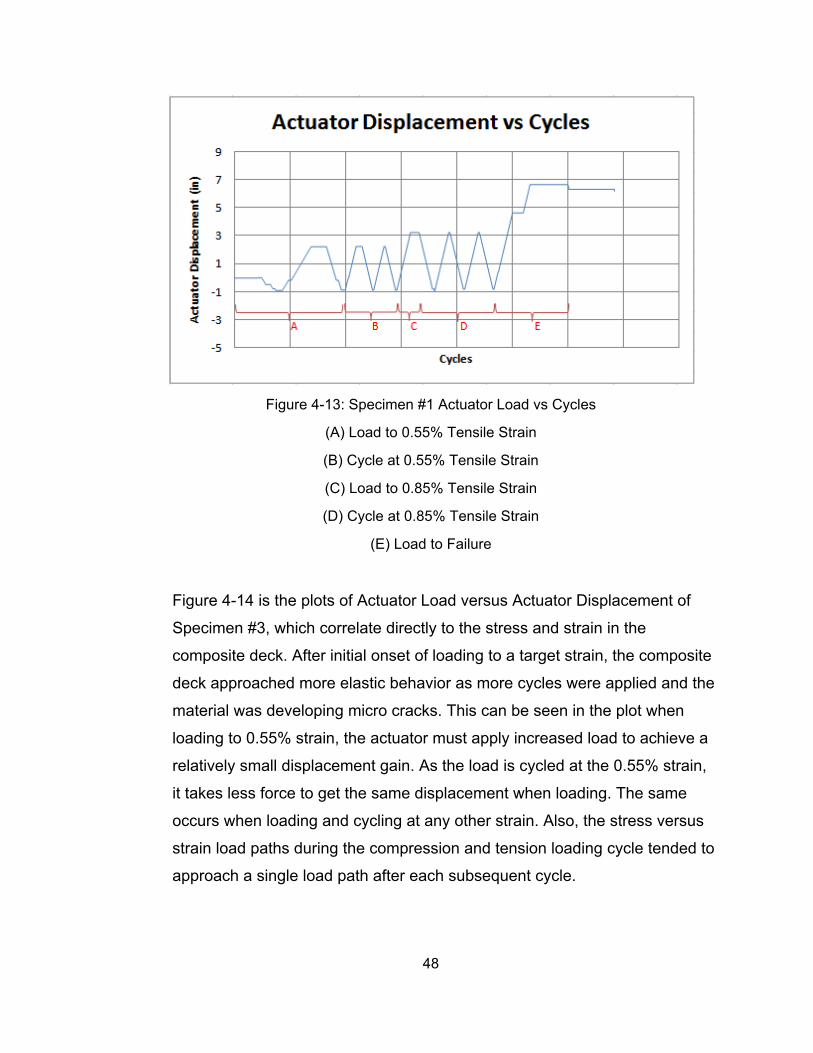
Figure 4-13: Specimen #1 Actuator Load vs Cycles
(A) Load to 0.55% Tensile Strain
(B) Cycle at 0.55% Tensile Strain
(C) Load to 0.85% Tensile Strain
(D) Cycle at 0.85% Tensile Strain
(E) Load to Failure
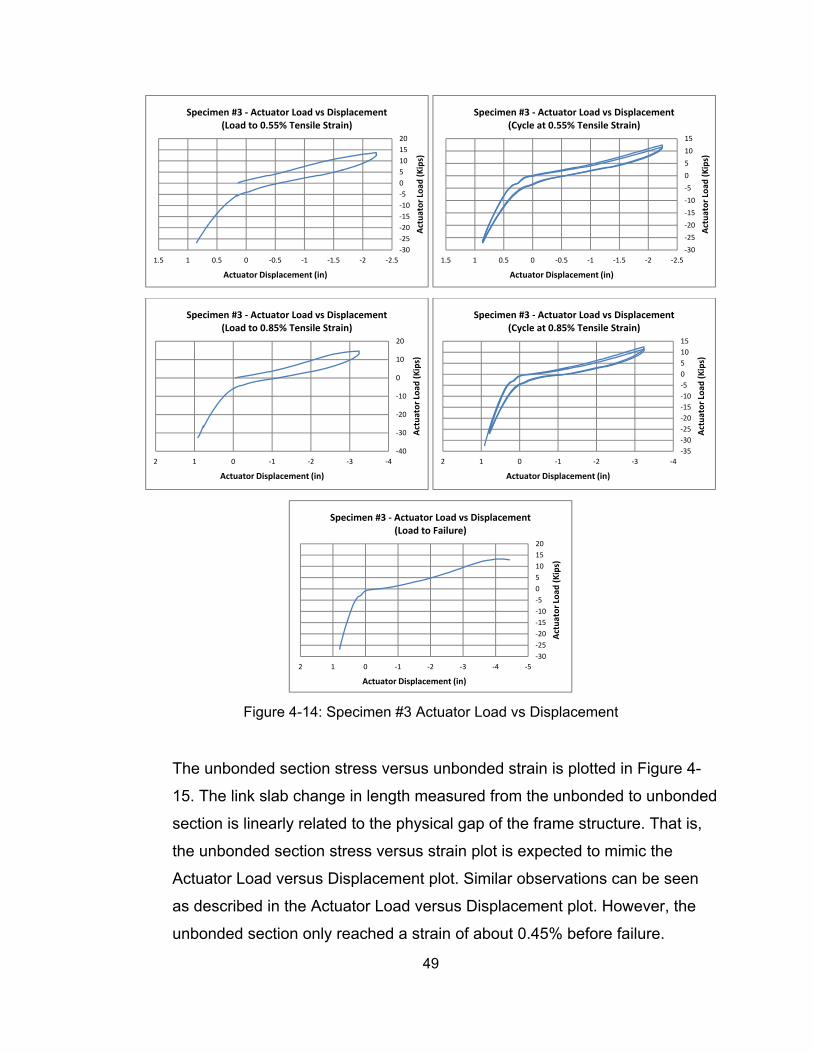
Figure 4-14 is the plots of Actuator Load versus Actuator Displacement of
Specimen #3, which correlate directly to the stress and strain in the
composite deck. After initial onset of loading to a target strain, the composite
deck approached more elastic behavior as more cycles were applied and the
material was developing micro cracks. This can be seen in the plot when
loading to 0.55% strain, the actuator must apply increased load to achieve a
relatively small displacement gain. As the load is cycled at the 0.55% strain,
it takes less force to get the same displacement when loading. The same
occurs when loading and cycling at any other strain. Also, the stress versus
strain load paths during the compression and tension loading cycle tended to
approach a single load path after each subsequent cycle.
49
Figure 4-14: Specimen #3 Actuator Load vs Displacement
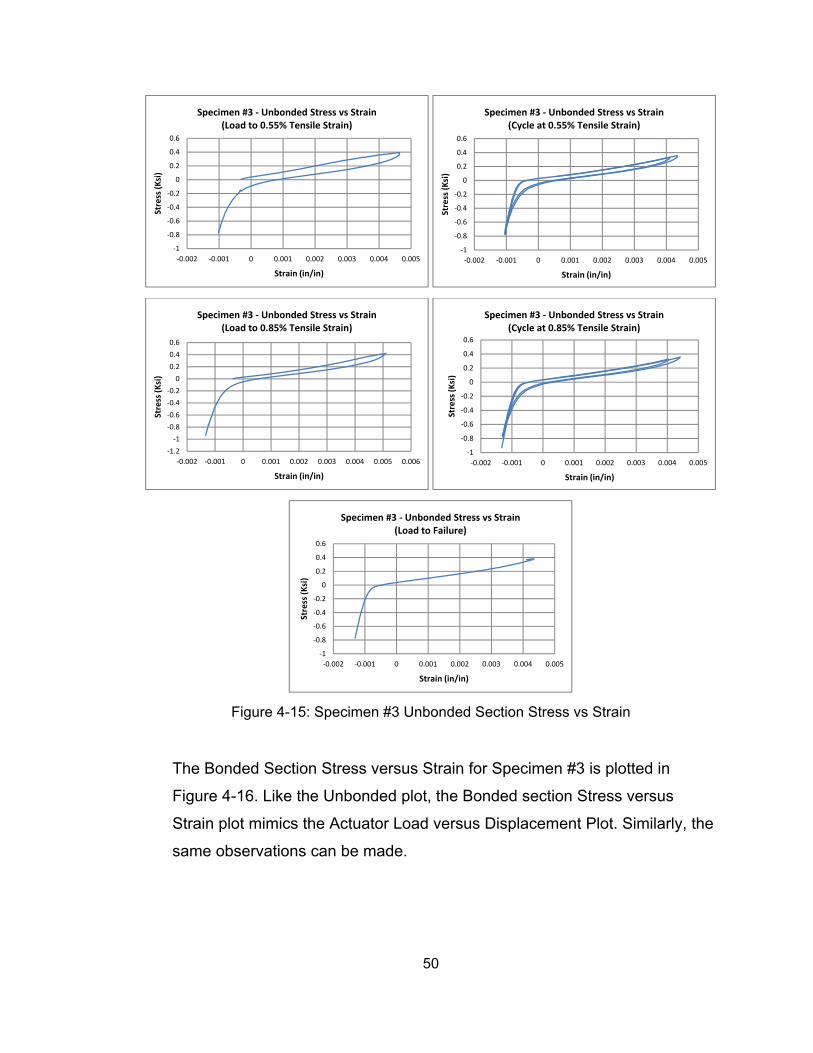
The unbonded section stress versus unbonded strain is plotted in Figure 4-
15. The link slab change in length measured from the unbonded to unbonded
section is linearly related to the physical gap of the frame structure. That is,
the unbonded section stress versus strain plot is expected to mimic the
Actuator Load versus Displacement plot. Similar observations can be seen
as described in the Actuator Load versus Displacement plot. However, the
unbonded section only reached a strain of about 0.45% before failure.
‐30
‐25
‐20
‐15
‐10
‐5
0
5
10
15
20
‐2.5‐2‐1.5‐1‐0.500.511.5
Actuator Load
(Kips)
Actuator Displacement (in)
Specimen #3 ‐ Actuator Load vs Displacement (Load to 0.55% Tensile Strain)
‐30
‐25
‐20
‐15
‐10
‐5
0
5
10
15
‐2.5‐2‐1.5‐1‐0.500.511.5
Actuator Load
(Kips)
Actuator Displacement (in)
Specimen #3 ‐ Actuator Load vs Displacement (Cycle at 0.55% Tensile Strain)
‐40
‐30
‐20
‐10
0
10
20
‐4‐3‐2‐1012
Actuator Load
(Kips)
Actuator Displacement (in)
Specimen #3 ‐ Actuator Load vs Displacement (Load to 0.85% Tensile Strain)
‐35
‐30
‐25
‐20
‐15
‐10
‐5
0
5
10
15
‐4‐3‐2‐1012
Actuator Load
(Kips)
Actuator Displacement (in)
Specimen #3 ‐ Actuator Load vs Displacement (Cycle at 0.85% Tensile Strain)
‐30
‐25
‐20
‐15
‐10
‐5
0
5
10
15
20
‐5‐4‐3‐2‐1012
Actuator Load
(Kips)
Actuator Displacement (in)
Specimen #3 ‐ Actuator Load vs Displacement (Load to Failure)
50
Figure 4-15: Specimen #3 Unbonded Section Stress vs Strain
The Bonded Section Stress versus Strain for Specimen #3 is plotted in
Figure 4-16. Like the Unbonded plot, the Bonded section Stress versus
Strain plot mimics the Actuator Load versus Displacement Plot. Similarly, the
same observations can be made.
‐1
‐0.8
‐0.6
‐0.4
‐0.2
0
0.2
0.4
0.6
‐0.002 ‐0.001 0 0.001 0.002 0.003 0.004 0.005
Stress (Ksi)
Strain (in/in)
Specimen #3 ‐ Unbonded Stress vs Strain (Load to 0.55% Tensile Strain)
‐1
‐0.8
‐0.6
‐0.4
‐0.2
0
0.2
0.4
0.6
‐0.002 ‐0.001 0 0.001 0.002 0.003 0.004 0.005
Stress (Ksi)
Strain (in/in)
Specimen #3 ‐ Unbonded Stress vs Strain (Cycle at 0.55% Tensile Strain)
‐1.2
‐1
‐0.8
‐0.6
‐0.4
‐0.2
0
0.2
0.4
0.6
‐0.002 ‐0.001 0 0.001 0.002 0.003 0.004 0.005 0.006
Stress (Ksi)
Strain (in/in)
Specimen #3 ‐ Unbonded Stress vs Strain (Load to 0.85% Tensile Strain)
‐1
‐0.8
‐0.6
‐0.4
‐0.2
0
0.2
0.4
0.6
‐0.002 ‐0.001 0 0.001 0.002 0.003 0.004 0.005
Stress (Ksi)
Strain (in/in)
Specimen #3 ‐ Unbonded Stress vs Strain (Cycle at 0.85% Tensile Strain)
‐1
‐0.8
‐0.6
‐0.4
‐0.2
0
0.2
0.4
0.6
‐0.002 ‐0.001 0 0.001 0.002 0.003 0.004 0.005
Stress (Ksi)
Strain (in/in)
Specimen #3 ‐ Unbonded Stress vs Strain (Load to Failure)
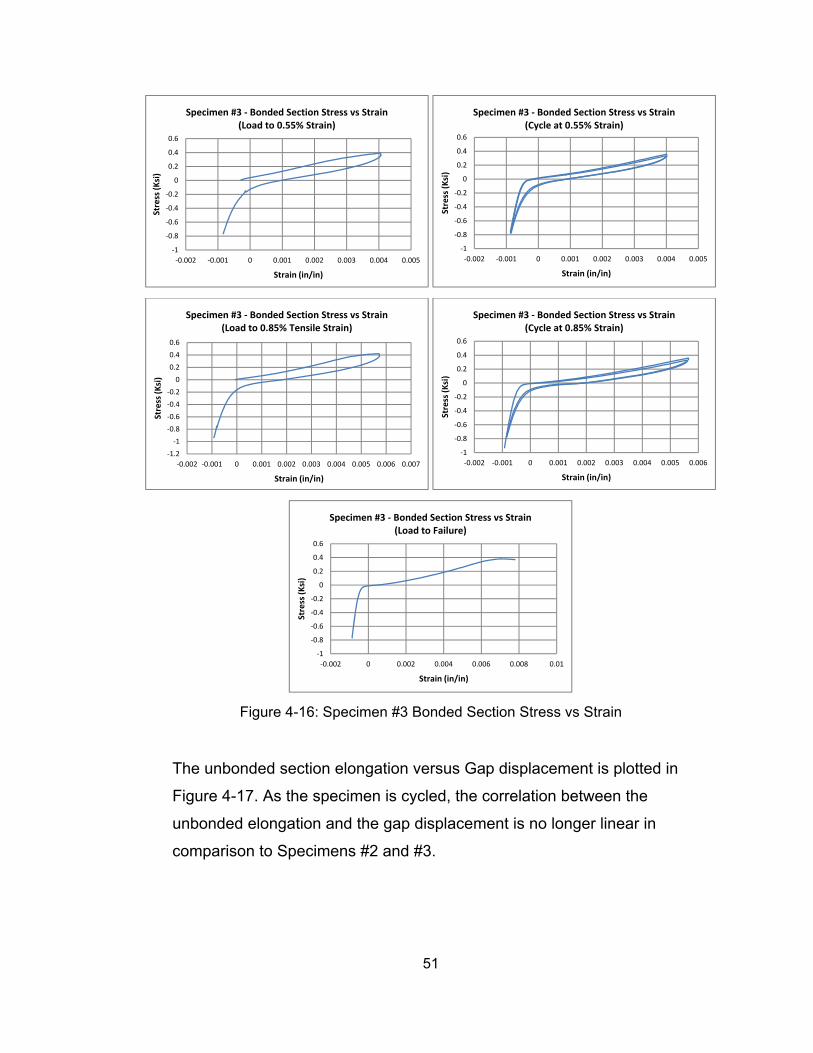
51
Figure 4-16: Specimen #3 Bonded Section Stress vs Strain
The unbonded section elongation versus Gap displacement is plotted in
Figure 4-17. As the specimen is cycled, the correlation between the
unbonded elongation and the gap displacement is no longer linear in
comparison to Specimens #2 and #3.
‐1
‐0.8
‐0.6
‐0.4
‐0.2
0
0.2
0.4
0.6
‐0.002 ‐0.001 0 0.001 0.002 0.003 0.004 0.005
Stress (Ksi)
Strain (in/in)
Specimen #3 ‐ Bonded Section Stress vs Strain (Load to 0.55% Strain)
‐1
‐0.8
‐0.6
‐0.4
‐0.2
0
0.2
0.4
0.6
‐0.002 ‐0.001 0 0.001 0.002 0.003 0.004 0.005
Stress (Ksi)
Strain (in/in)
Specimen #3 ‐ Bonded Section Stress vs Strain (Cycle at 0.55% Strain)
‐1.2
‐1
‐0.8
‐0.6
‐0.4
‐0.2
0
0.2
0.4
0.6
‐0.002 ‐0.001 0 0.001 0.002 0.003 0.004 0.005 0.006 0.007
Stress (Ksi)
Strain (in/in)
Specimen #3 ‐ Bonded Section Stress vs Strain (Load to 0.85% Tensile Strain)
‐1
‐0.8
‐0.6
‐0.4
‐0.2
0
0.2
0.4
0.6
‐0.002 ‐0.001 0 0.001 0.002 0.003 0.004 0.005 0.006
Stress (Ksi)
Strain (in/in)
Specimen #3 ‐ Bonded Section Stress vs Strain (Cycle at 0.85% Strain)
‐1
‐0.8
‐0.6
‐0.4
‐0.2
0
0.2
0.4
0.6
‐0.002 0 0.002 0.004 0.006 0.008 0.01
Stress (Ksi)
Strain (in/in)
Specimen #3 ‐ Bonded Section Stress vs Strain (Load to Failure)
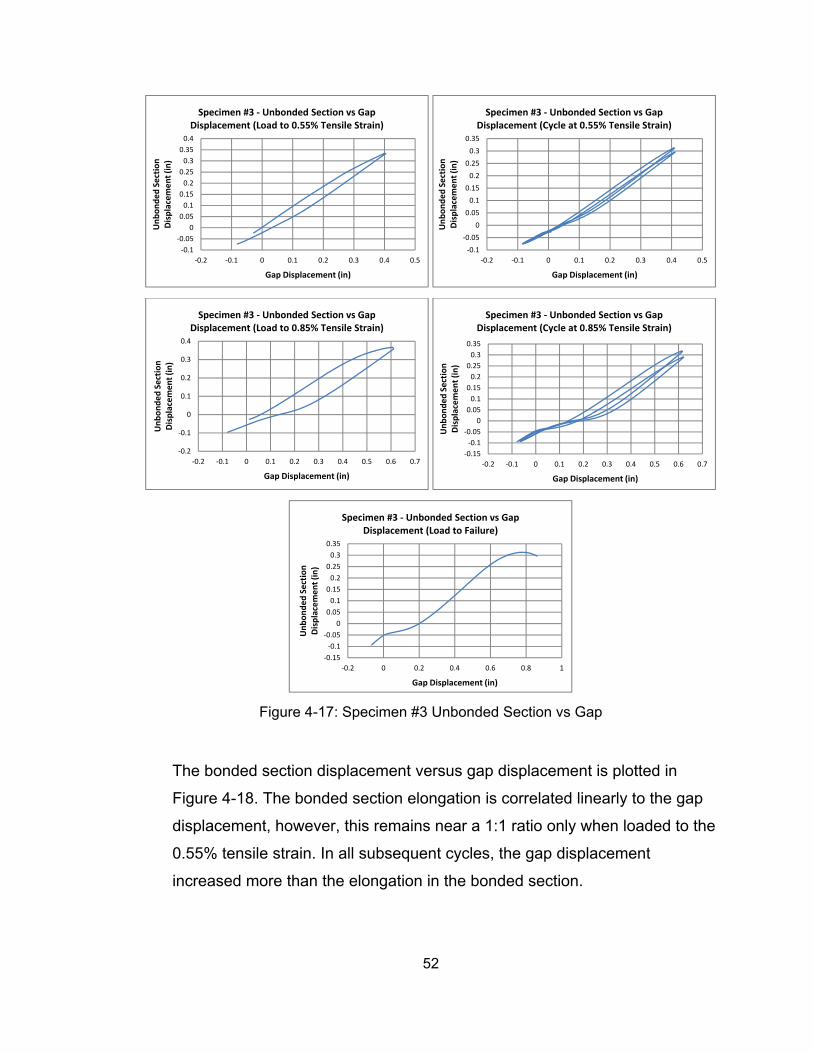
52
Figure 4-17: Specimen #3 Unbonded Section vs Gap
The bonded section displacement versus gap displacement is plotted in
Figure 4-18. The bonded section elongation is correlated linearly to the gap
displacement, however, this remains near a 1:1 ratio only when loaded to the
0.55% tensile strain. In all subsequent cycles, the gap displacement
increased more than the elongation in the bonded section.
‐0.1
‐0.05
0
0.05
0.1
0.15
0.2
0.25
0.3
0.35
0.4
‐0.2 ‐0.1 0 0.1 0.2 0.3 0.4 0.5
Unbonded Section
Displacement (in)
Gap Displacement (in)
Specimen #3 ‐ Unbonded Section vs Gap Displacement (Load to 0.55% Tensile Strain)
‐0.1
‐0.05
0
0.05
0.1
0.15
0.2
0.25
0.3
0.35
‐0.2 ‐0.1 0 0.1 0.2 0.3 0.4 0.5
Unbonded Section
Displacement (in)
Gap Displacement (in)
Specimen #3 ‐ Unbonded Section vs Gap Displacement (Cycle at 0.55% Tensile Strain)
‐0.2
‐0.1
0
0.1
0.2
0.3
0.4
‐0.2 ‐0.1 0 0.1 0.2 0.3 0.4 0.5 0.6 0.7
Unbonded Section
Displacement (in)
Gap Displacement (in)
Specimen #3 ‐ Unbonded Section vs Gap Displacement (Load to 0.85% Tensile Strain)
‐0.15
‐0.1
‐0.05
0
0.05
0.1
0.15
0.2
0.25
0.3
0.35
‐0.2 ‐0.1 0 0.1 0.2 0.3 0.4 0.5 0.6 0.7
Unbonded Section
Displacement (in)
Gap Displacement (in)
Specimen #3 ‐ Unbonded Section vs Gap Displacement (Cycle at 0.85% Tensile Strain)
‐0.15
‐0.1
‐0.05
0
0.05
0.1
0.15
0.2
0.25
0.3
0.35
‐0.2 0 0.2 0.4 0.6 0.8 1
Unbonded Section
Displacement (in)
Gap Displacement (in)
Specimen #3 ‐ Unbonded Section vs Gap Displacement (Load to Failure)
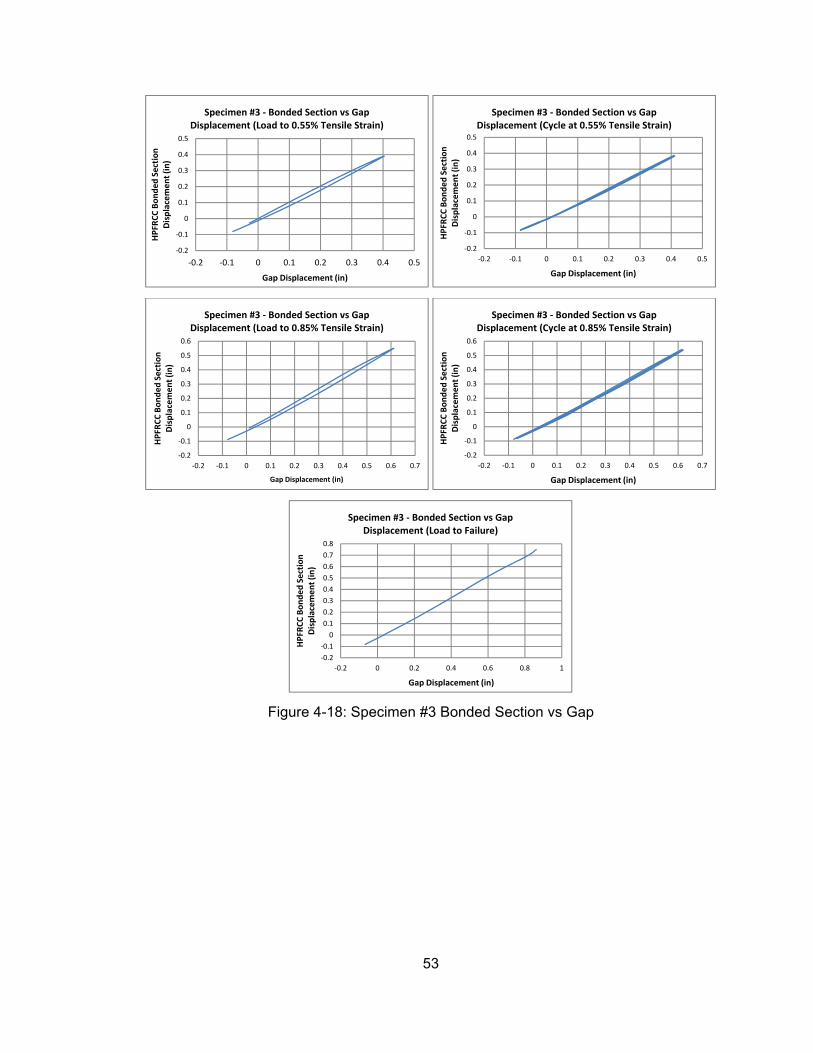
53
Figure 4-18: Specimen #3 Bonded Section vs Gap
‐0.2
‐0.1
0
0.1
0.2
0.3
0.4
0.5
‐0.2 ‐0.1 0 0.1 0.2 0.3 0.4 0.5
HPFR
CC Bonded Section
Displacement (in)
Gap Displacement (in)
Specimen #3 ‐ Bonded Section vs Gap Displacement (Load to 0.55% Tensile Strain)
‐0.2
‐0.1
0
0.1
0.2
0.3
0.4
0.5
‐0.2 ‐0.1 0 0.1 0.2 0.3 0.4 0.5
HPFR
CC Bonded Section
Displacement (in)
Gap Displacement (in)
Specimen #3 ‐ Bonded Section vs Gap Displacement (Cycle at 0.55% Tensile Strain)
‐0.2
‐0.1
0
0.1
0.2
0.3
0.4
0.5
0.6
‐0.2 ‐0.1 0 0.1 0.2 0.3 0.4 0.5 0.6 0.7
HPFR
CC Bonded Section
Displacement (in)
Gap Displacement (in)
Specimen #3 ‐ Bonded Section vs Gap Displacement (Load to 0.85% Tensile Strain)
‐0.2
‐0.1
0
0.1
0.2
0.3
0.4
0.5
0.6
‐0.2 ‐0.1 0 0.1 0.2 0.3 0.4 0.5 0.6 0.7
HPFR
CC Bonded Section
Displacement (in)
Gap Displacement (in)
Specimen #3 ‐ Bonded Section vs Gap Displacement (Cycle at 0.85% Tensile Strain)
‐0.2
‐0.1
0
0.1
0.2
0.3
0.4
0.5
0.6
0.7
0.8
‐0.2 0 0.2 0.4 0.6 0.8 1
HPFR
CC Bonded Section
Displacement (in)
Gap Displacement (in)
Specimen #3 ‐ Bonded Section vs Gap Displacement (Load to Failure)

54
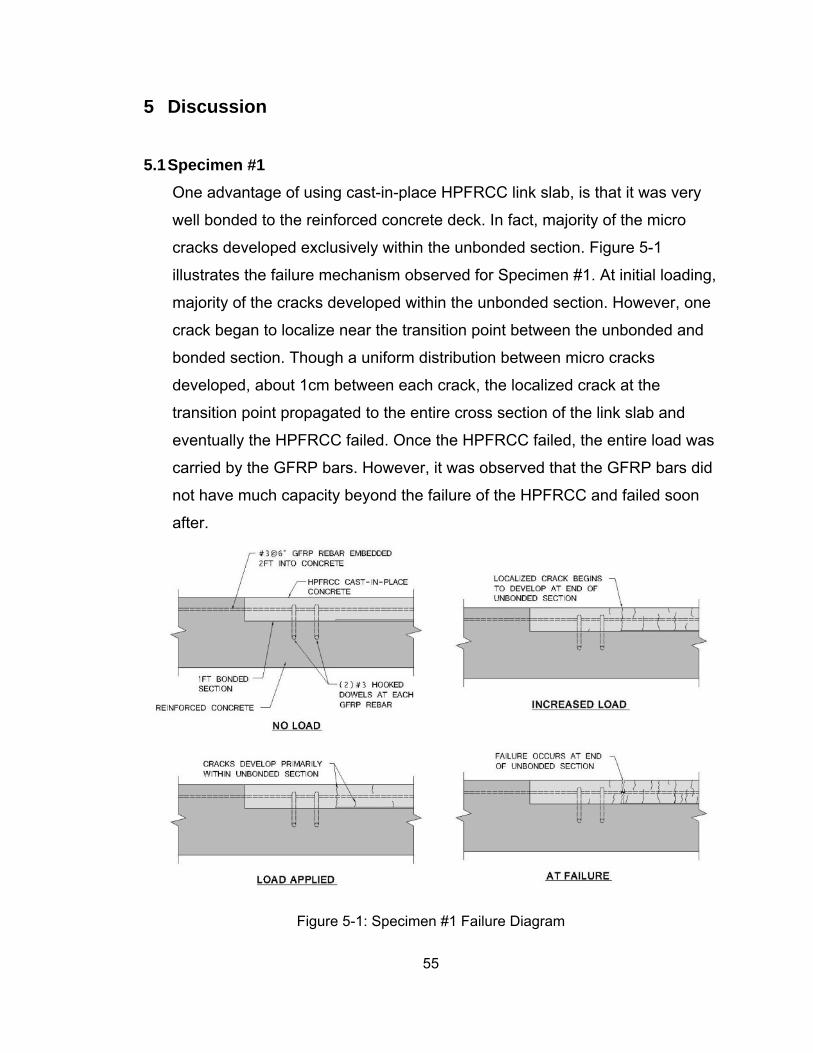
55
5 Discussion
5.1 Specimen #1
One advantage of using cast-in-place HPFRCC link slab, is that it was very
well bonded to the reinforced concrete deck. In fact, majority of the micro
cracks developed exclusively within the unbonded section. Figure 5-1
illustrates the failure mechanism observed for Specimen #1. At initial loading,
majority of the cracks developed within the unbonded section. However, one
crack began to localize near the transition point between the unbonded and
bonded section. Though a uniform distribution between micro cracks
developed, about 1cm between each crack, the localized crack at the
transition point propagated to the entire cross section of the link slab and
eventually the HPFRCC failed. Once the HPFRCC failed, the entire load was
carried by the GFRP bars. However, it was observed that the GFRP bars did
not have much capacity beyond the failure of the HPFRCC and failed soon
after.
Figure 5-1: Specimen #1 Failure Diagram
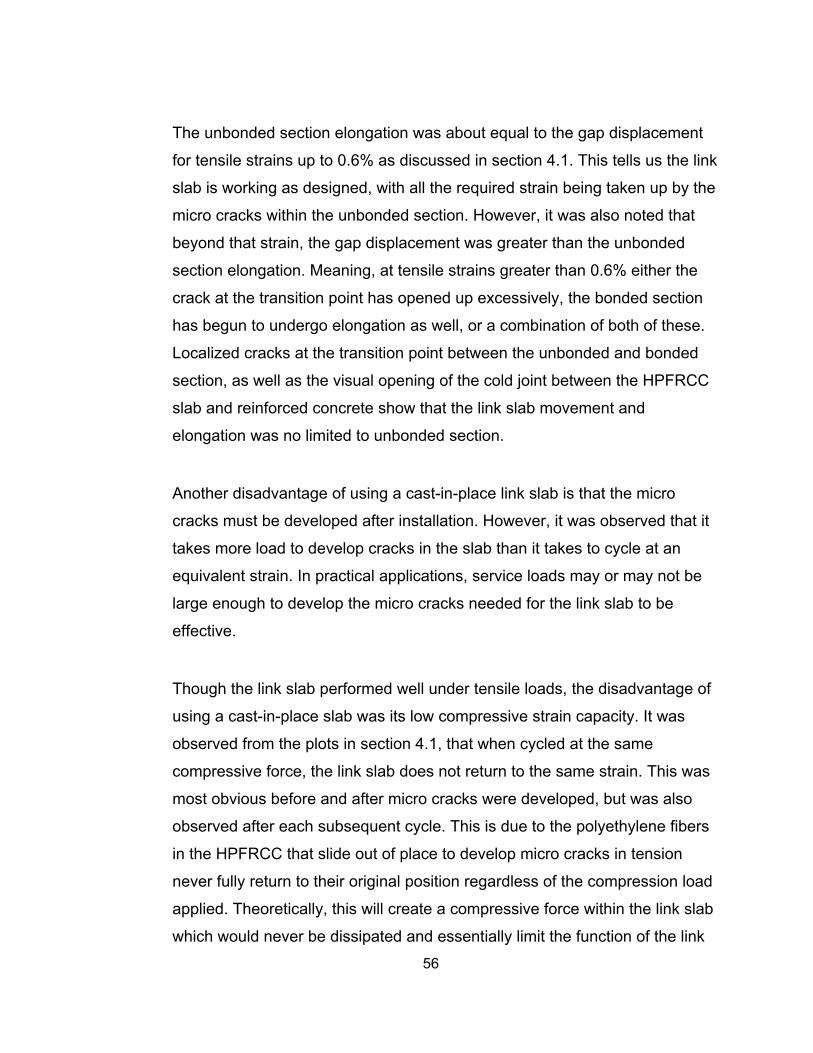
56
The unbonded section elongation was about equal to the gap displacement
for tensile strains up to 0.6% as discussed in section 4.1. This tells us the link
slab is working as designed, with all the required strain being taken up by the
micro cracks within the unbonded section. However, it was also noted that
beyond that strain, the gap displacement was greater than the unbonded
section elongation. Meaning, at tensile strains greater than 0.6% either the
crack at the transition point has opened up excessively, the bonded section
has begun to undergo elongation as well, or a combination of both of these.
Localized cracks at the transition point between the unbonded and bonded
section, as well as the visual opening of the cold joint between the HPFRCC
slab and reinforced concrete show that the link slab movement and
elongation was no limited to unbonded section.
Another disadvantage of using a cast-in-place link slab is that the micro
cracks must be developed after installation. However, it was observed that it
takes more load to develop cracks in the slab than it takes to cycle at an
equivalent strain. In practical applications, service loads may or may not be
large enough to develop the micro cracks needed for the link slab to be
effective.
Though the link slab performed well under tensile loads, the disadvantage of
using a cast-in-place slab was its low compressive strain capacity. It was
observed from the plots in section 4.1, that when cycled at the same
compressive force, the link slab does not return to the same strain. This was
most obvious before and after micro cracks were developed, but was also
observed after each subsequent cycle. This is due to the polyethylene fibers
in the HPFRCC that slide out of place to develop micro cracks in tension
never fully return to their original position regardless of the compression load
applied. Theoretically, this will create a compressive force within the link slab
which would never be dissipated and essentially limit the function of the link

57
slab. To mediate this problem, precracking was used in specimens #2 and
#3. By precracking the specimens, the permanent strain in the link slab from
micro cracking is achieved before the slab is in place. This ensures, that the
link slab has already achieved some elasticity before installation.
5.2 Specimen #2
Specimen #2 was a precast HPFRCC link slab designed to have some
compressive strain capacity. This was achieved by precracking the link slab
as described in section 3.2. The advantage of precracking the link slab is that
micro cracks were developed before placing the link slab into the reinforced
concrete deck. As discussed in section 5.1, the load required to initiate micro
cracking may be higher than actual service loads. By precracking the link
slab, it ensures some elastic action even at smaller loads. Similarly, because
the micro cracks in the link slab are open when installed, they have some
capacity to close when a compressive force is applied. In Specimen #1, the
maximum compressive strain was about 0.08%. In specimen #2 with
precracking, the maximum compressive strain was increased to 0.2%. This
gain in compressive strain capacity may be adequate enough to for daily
thermal expansion or other compressive forces.
In practical applications, using a precast link slab is more suitable for retrofits
due to the long setting and curing times of HPFRCC.
However, the primary problem with using a precast link slab was the
anchoring method of the bonded section, which was the failure mechanism of
Specimen #2. Figure 5-2 illustrates the failure mechanism observed. The
bonded section in Specimen #2 was anchored using vertical dowels,
horizontal GFRP bars, and grout below the 1 foot bonded section. At the first
application of load, though some of the micro cracks opened, majority of the
movement was at the cold joint between the HPFRCC link slab and the

58
reinforced concrete deck. This tells us (1) the grout below the bonded section
was not effective, (2) the vertical steel dowels had some capacity to deflect
before they could resist load, and (3) the grout was not bonded well to the
horizontal GFRP bars. As the applied load was increased, the bonded
section began to lift up on one end and pivot about the vertical dowels, which
was due to the vertical dowels placed in a single row. Additionally, though
micro cracks opened within the unbonded section, localized cracking was
observed at the transition point between the unbonded and bonded section.
Eventually, the bonded section lifted up enough and the GFRP bars failed in
shear.
Figure 5-2: Specimen #2 Failure Diagram
As discussed in section 4.2, the elongation of the bonded section was
greater than the elongation in the unbonded section. This confirms that much
of the cracks that developed occurred outside of the unbonded section.
Additionally, cracks were observed in the grouted horizontal GFRP bars that

59
propagated 45 degrees to the application of tensile load. This shows that the
doweled GFRP bars were resisting load.
Though Specimen #2 had a higher compressive strain capacity, the
anchoring of the link slab limited the maximum tensile strain capacity to
0.6%. It should be noted that this maximum tensile strain did not occur at the
failure of the link slab. Failure of the slab occurred during cycling at a tensile
strain capacity of 0.5% when the GFRP bars reached their shear capacity
limit.
To mediate this problem, it was proposed to dowel 2 alternating rows of
vertical anchors to keep the bonded section from lifting. Similarly, it was
noted that doweling the horizontal GFRP bars were more difficult to install
than the vertical steel dowels. Also, neither Specimen #1 or #2 showed
evidence that the horizontal GFRP bars required more than the 1 foot
bonded section to reach its full tensile capacity. These were tested in
Specimen #3.
5.3 Specimen #3
Specimen #3 was constructed similar to Specimen #2 but was only anchored
with vertical dowels and grout below the 1 foot bonded section. Because of
the lifting of the bonded section in Specimen #2, the dowels used in
Specimen #3 were placed in 2 alternating rows. However, this did not
improve the results from Specimen #2. It was found that the maximum
compressive strain and tensile strain were about 0.14% and 0.45%
respectively.
Figure 5-3 illustrates the failure mechanism of Specimen #3. At the
application of load, the cold joint between the HPFRCC link slab and the
reinforced concrete deck began to open up. As more load was applied the
60
entire link slab began to lift up and eventually slip out of the vertical dowels.
Though the vertical dowels were adequate enough to anchor the link slab
horizontally, the bond between the grout and the vertical dowels were not
adequate enough to hold the link slab in place. During cycling, the link slab
would lift during tensile loads and would not return to its original position
regardless of the compression loads.
Figure 5-3: Specimen #3 Failure Diagram
Specimens #2 and #3 showed that precracking a link slab gave adequate
compressive strain capacity and if precracked and anchored properly can
attain higher tensile strain capacities.
61
6 Conclusions/Recommendations
A cast-in-place link slab has the advantage of providing good continuity at
the ends of the FRCC section to the concrete or bridge deck, meaning it
can be built to be flush with the bridge deck. However, because of the
limitation of permanent strain in the link slab, the effectiveness of the slab
in compression is reduced. Therefore, a precracked link slab would be
more appropriate in most applications.
Because HPFRCC concrete requires a long setting and curing time to
reach its optimal strength, it may not be practical to cast-in-place
especially when time is a construction consideration.
Precracking of the link slab though effective requires a different means of
pre cracking than used in specimens #2 and #3. In these specimens,
precracking was done by inducing an internal moment in the link slab
which induced some localized cracking. To minimize crack localization,
physical bending of the link slab may be more effective. The possibility of
sliding the link slab through a series of rollers may be a possible solution
for this.
Pre-cast slabs has the advantage of pre-cracking but are limited by the
bond of the link slab to the existing concrete. The following bonding
methods may be considered:
a. Vertical dowels can be installed at an angle so that the slab is
essentially pulled downward during tension loads.
b. A combination of vertical dowels and horizontal GFRP bars
similar to specimens #2 and #3 would be more effective than
either acting alone.
62
Because localized cracking became a problem in all 3 specimens it may
be worth considering increasing the depth of the HPFRCC link slab (i.e.
3.5" or 4")
Water or rain run-off may seep through and get trapped below the link slab
causing the unbonded section to be susceptible to deterioration and traffic
induced damage.
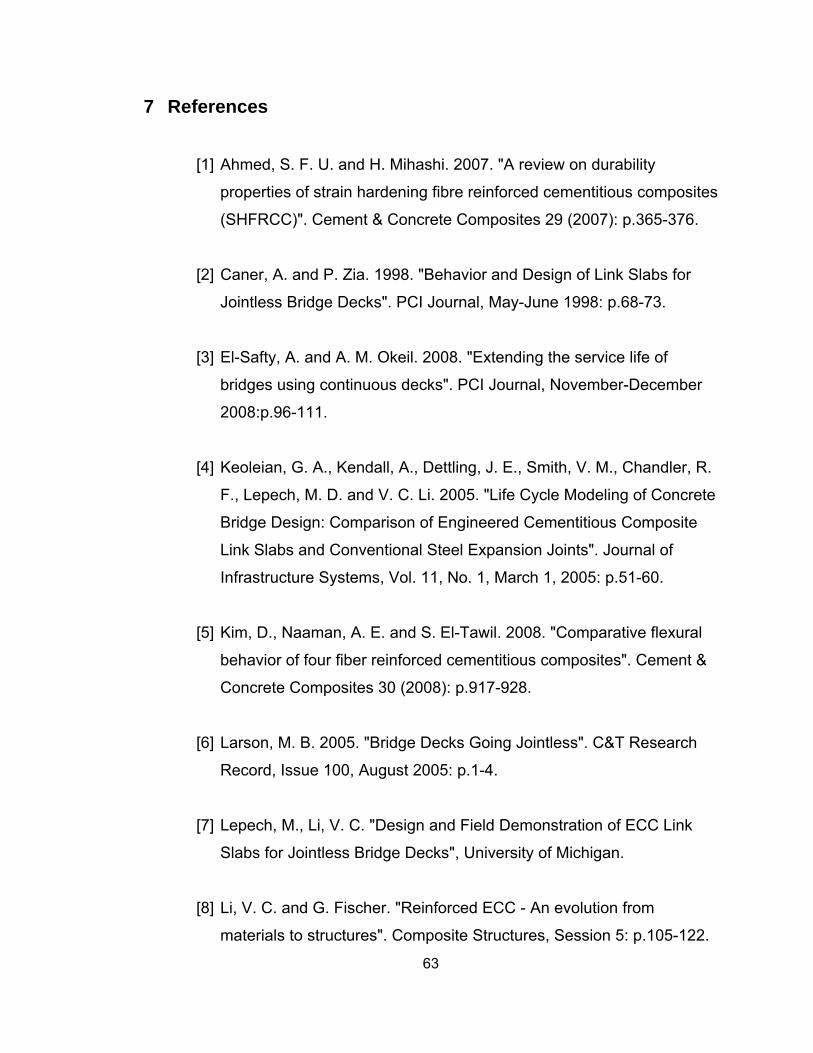
63
7 References
[1] Ahmed, S. F. U. and H. Mihashi. 2007. "A review on durability
properties of strain hardening fibre reinforced cementitious composites
(SHFRCC)". Cement & Concrete Composites 29 (2007): p.365-376.
[2] Caner, A. and P. Zia. 1998. "Behavior and Design of Link Slabs for
Jointless Bridge Decks". PCI Journal, May-June 1998: p.68-73.
[3] El-Safty, A. and A. M. Okeil. 2008. "Extending the service life of
bridges using continuous decks". PCI Journal, November-December
2008:p.96-111.
[4] Keoleian, G. A., Kendall, A., Dettling, J. E., Smith, V. M., Chandler, R.
F., Lepech, M. D. and V. C. Li. 2005. "Life Cycle Modeling of Concrete
Bridge Design: Comparison of Engineered Cementitious Composite
Link Slabs and Conventional Steel Expansion Joints". Journal of
Infrastructure Systems, Vol. 11, No. 1, March 1, 2005: p.51-60.
[5] Kim, D., Naaman, A. E. and S. El-Tawil. 2008. "Comparative flexural
behavior of four fiber reinforced cementitious composites". Cement &
Concrete Composites 30 (2008): p.917-928.
[6] Larson, M. B. 2005. "Bridge Decks Going Jointless". C&T Research
Record, Issue 100, August 2005: p.1-4.
[7] Lepech, M., Li, V. C. "Design and Field Demonstration of ECC Link
Slabs for Jointless Bridge Decks", University of Michigan.
[8] Li, V. C. and G. Fischer. "Reinforced ECC - An evolution from
materials to structures". Composite Structures, Session 5: p.105-122.
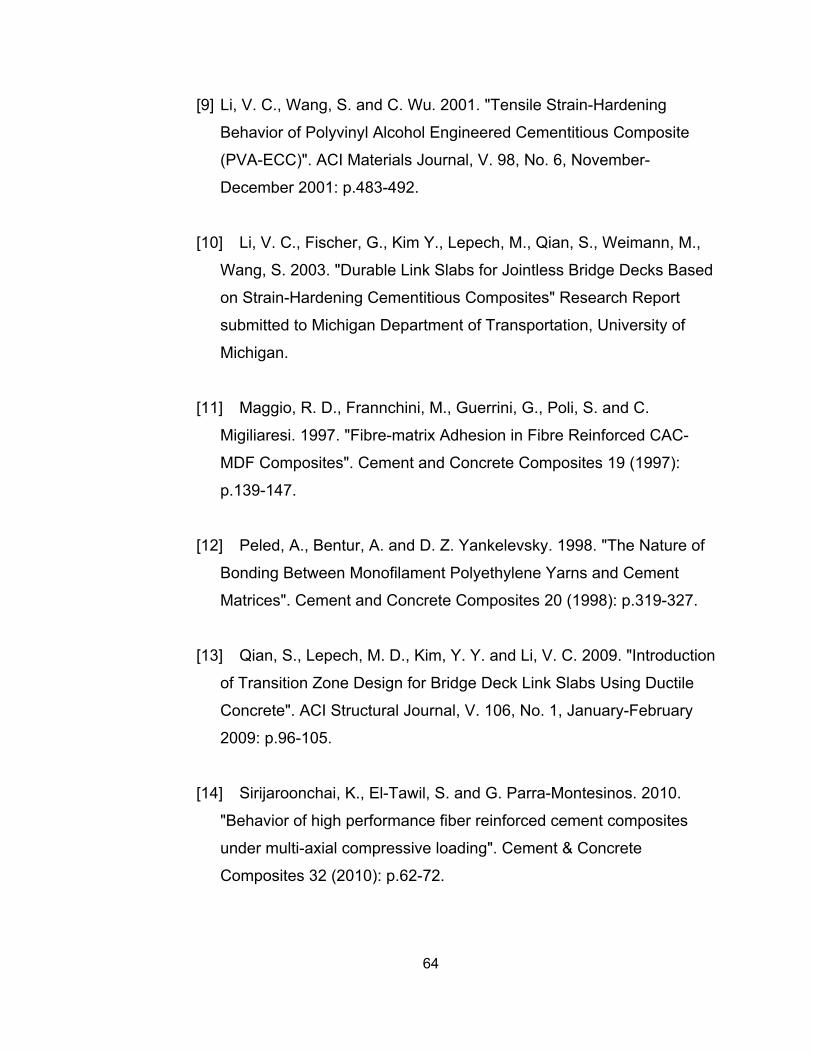
64
[9] Li, V. C., Wang, S. and C. Wu. 2001. "Tensile Strain-Hardening
Behavior of Polyvinyl Alcohol Engineered Cementitious Composite
(PVA-ECC)". ACI Materials Journal, V. 98, No. 6, November-
December 2001: p.483-492.
[10] Li, V. C., Fischer, G., Kim Y., Lepech, M., Qian, S., Weimann, M.,
Wang, S. 2003. "Durable Link Slabs for Jointless Bridge Decks Based
on Strain-Hardening Cementitious Composites" Research Report
submitted to Michigan Department of Transportation, University of
Michigan.
[11] Maggio, R. D., Frannchini, M., Guerrini, G., Poli, S. and C.
Migiliaresi. 1997. "Fibre-matrix Adhesion in Fibre Reinforced CAC-
MDF Composites". Cement and Concrete Composites 19 (1997):
p.139-147.
[12] Peled, A., Bentur, A. and D. Z. Yankelevsky. 1998. "The Nature of
Bonding Between Monofilament Polyethylene Yarns and Cement
Matrices". Cement and Concrete Composites 20 (1998): p.319-327.
[13] Qian, S., Lepech, M. D., Kim, Y. Y. and Li, V. C. 2009. "Introduction
of Transition Zone Design for Bridge Deck Link Slabs Using Ductile
Concrete". ACI Structural Journal, V. 106, No. 1, January-February
2009: p.96-105.
[14] Sirijaroonchai, K., El-Tawil, S. and G. Parra-Montesinos. 2010.
"Behavior of high performance fiber reinforced cement composites
under multi-axial compressive loading". Cement & Concrete
Composites 32 (2010): p.62-72.

65
[15] Younsi, A., Turcry, P., Roziere, E., Ait-Mokhtar, A. and A. Loukili.
2011. "Performance-based design and carbonation of concrete with
high fly ash content". Cement & Concrete Composites 33 (2011):
p.993-1000.

66
8 Appendix A: Test Photos
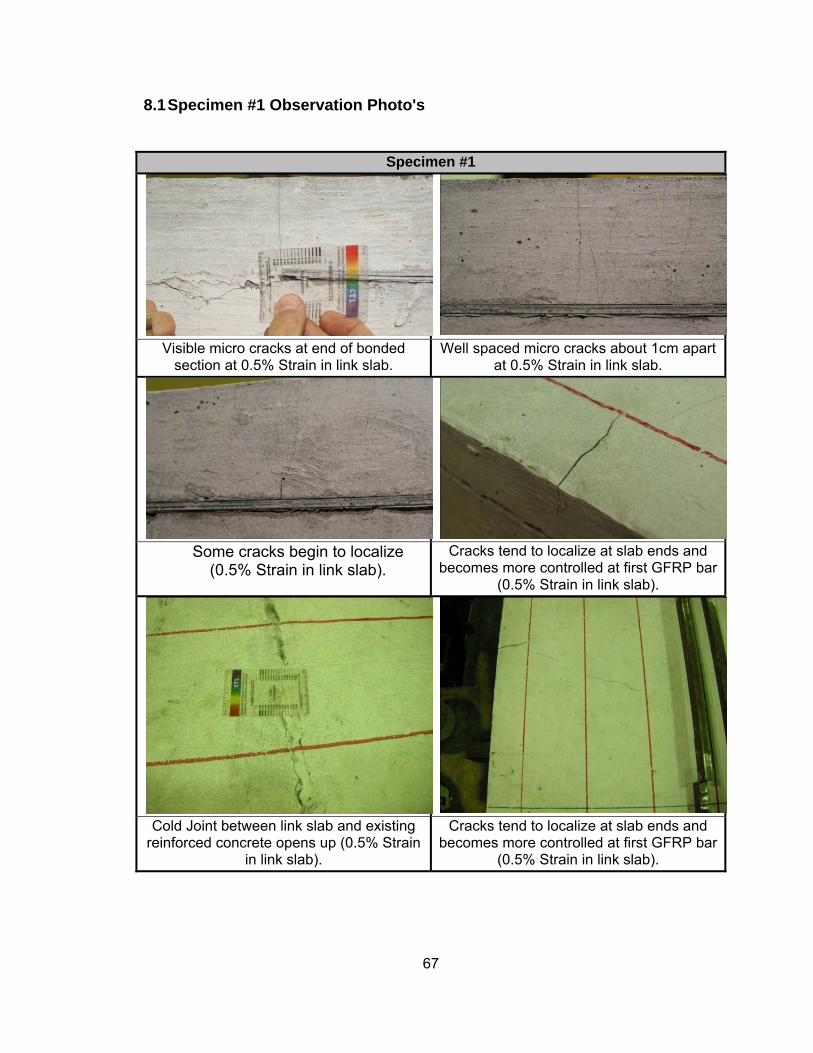
67
8.1 Specimen #1 Observation Photo's
Specimen #1
Visible micro cracks at end of bonded section at 0.5% Strain in link slab.
Well spaced micro cracks about 1cm apart at 0.5% Strain in link slab.
Some cracks begin to localize (0.5% Strain in link slab).
Cracks tend to localize at slab ends and becomes more controlled at first GFRP bar
(0.5% Strain in link slab).
Cold Joint between link slab and existing reinforced concrete opens up (0.5% Strain
in link slab).
Cracks tend to localize at slab ends and becomes more controlled at first GFRP bar
(0.5% Strain in link slab).
68
Cracking is more controlled at reinforcement (0.5% Strain in link slab).
Cracking is more prevalent at end of bonded section and slab edges (0.5%
Strain in link slab).
Localized cracking at 0.75% Strain. Crack between GFRP reinforcement (0.75% Strain).
Localized crack between GFRP reinforcement (0.75% Strain).
Localized crack at slab edge (0.75% Strain).
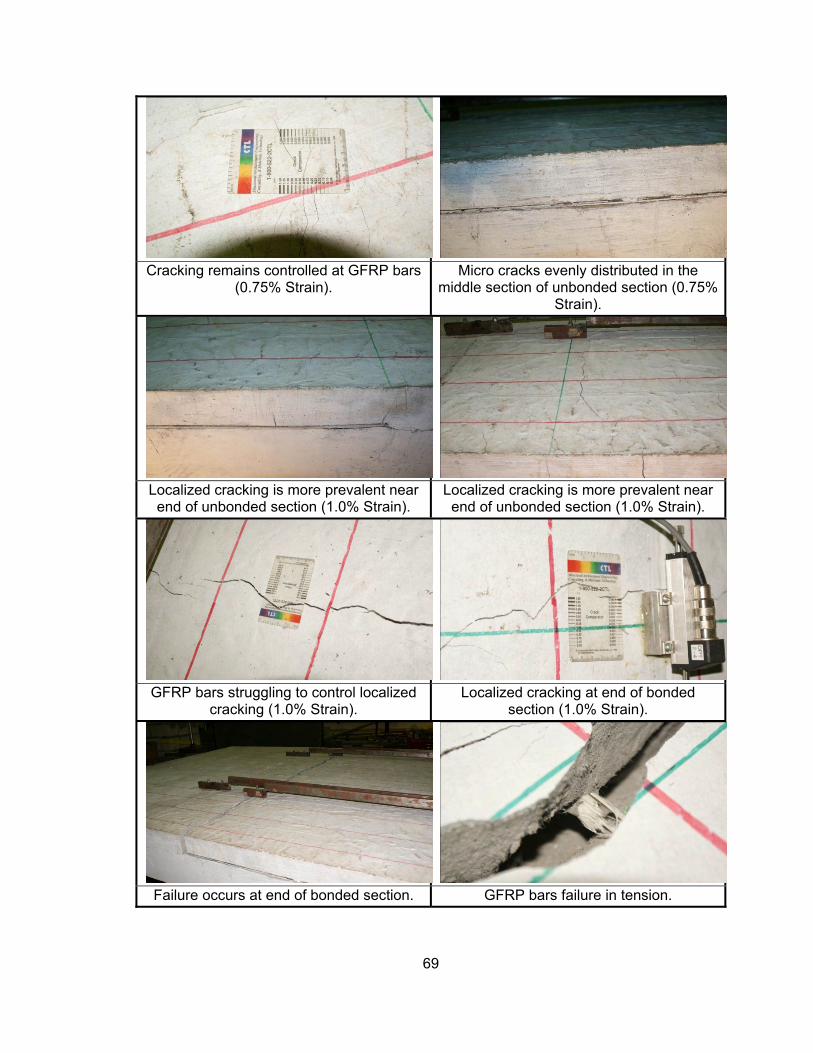
69
Cracking remains controlled at GFRP bars (0.75% Strain).
Micro cracks evenly distributed in the middle section of unbonded section (0.75%
Strain).
Localized cracking is more prevalent near end of unbonded section (1.0% Strain).
Localized cracking is more prevalent near end of unbonded section (1.0% Strain).
GFRP bars struggling to control localized cracking (1.0% Strain).
Localized cracking at end of bonded section (1.0% Strain).
Failure occurs at end of bonded section. GFRP bars failure in tension.
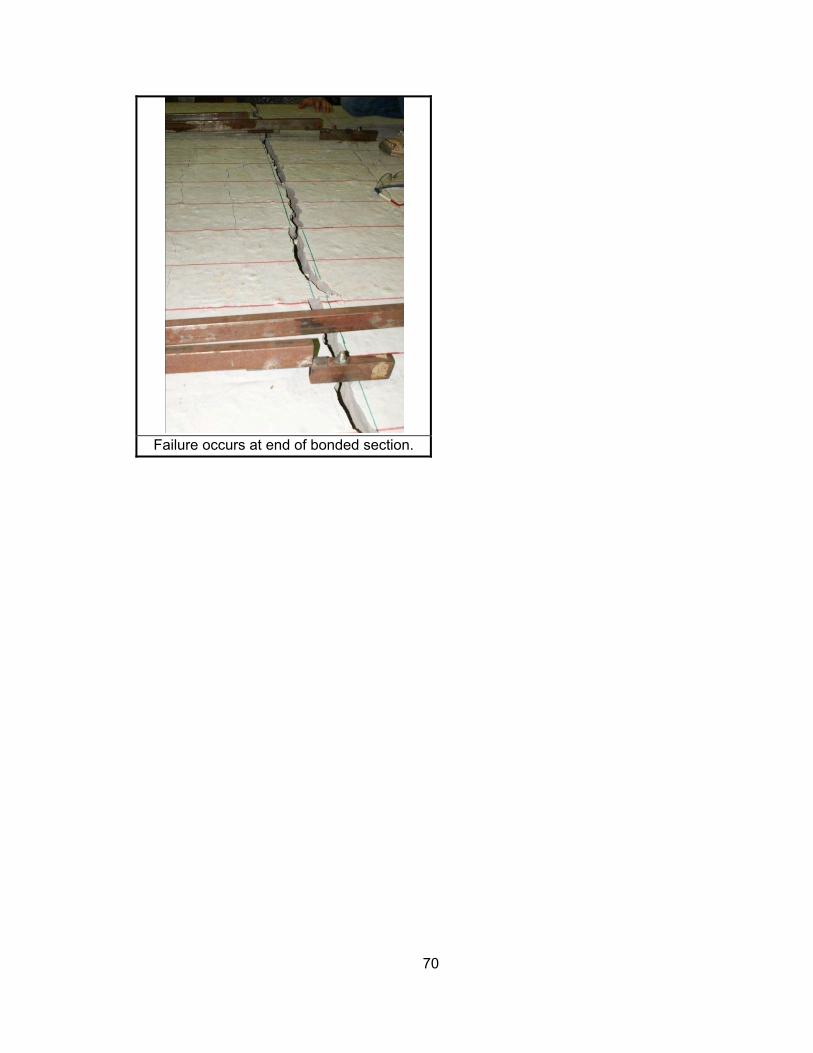
70
Failure occurs at end of bonded section.
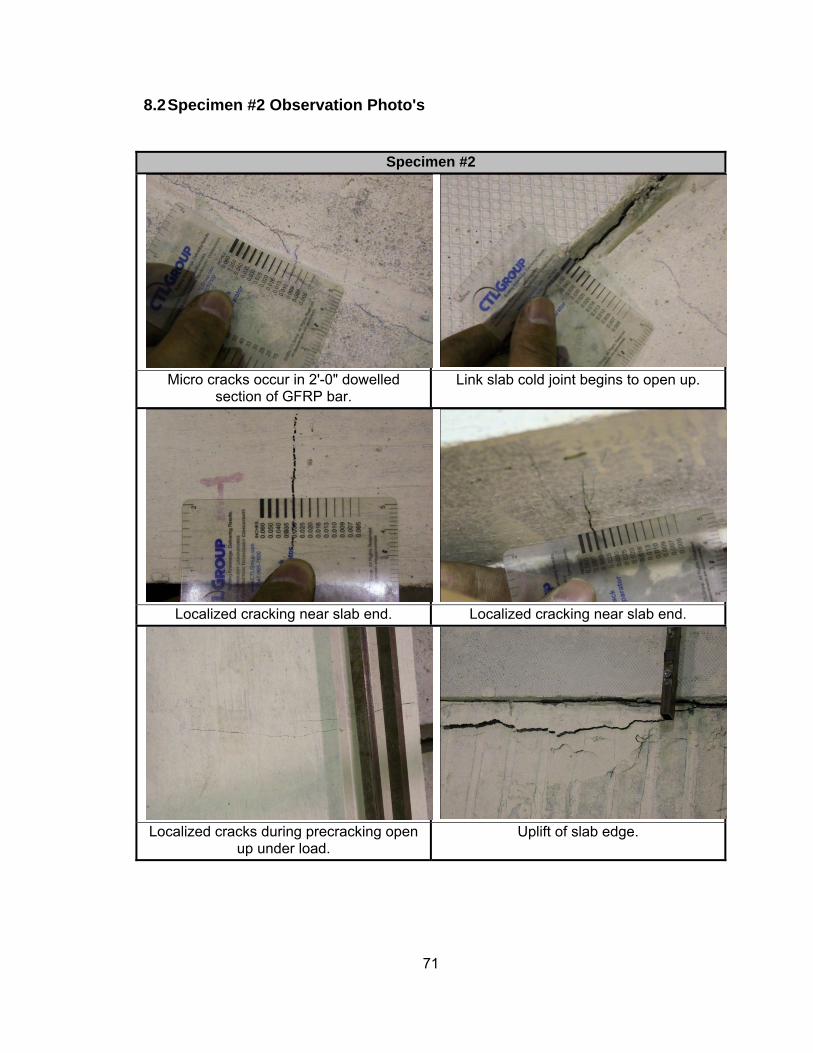
71
8.2 Specimen #2 Observation Photo's
Specimen #2
Micro cracks occur in 2'-0" dowelled section of GFRP bar.
Link slab cold joint begins to open up.
Localized cracking near slab end. Localized cracking near slab end.
Localized cracks during precracking open up under load.
Uplift of slab edge.

72
Slab edge uplifts and GFRP bars fail in shear at link slab cold joint.
After GFRP bars fail in shear, link slab is still able to resist little force but eventually
fails at end of unbonded section.
After GFRP bars fail in shear, link slab is still able to resist little force but eventually
fails at end of unbonded section.
Shear failure in GFRP bar at cold joint.

73
8.3 Specimen #3 Observation Photo's
Specimen #3
Cracking from precracking visible before any load is applied
Shrinkage cracks in unreinforced grout.
Cracks from precracking open up under load.
Localized crack along middle section of link slab.
Cracks from precracking begin to localize. Link slab cold joint opens up on both sides.
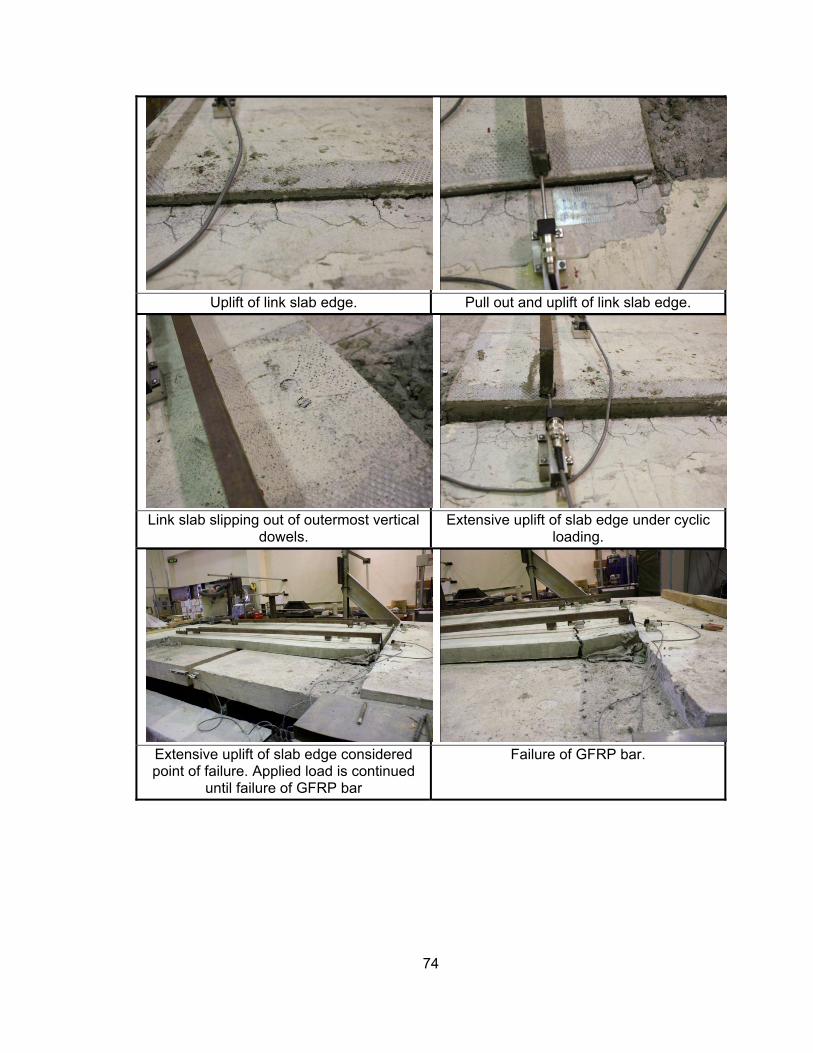
74
Uplift of link slab edge. Pull out and uplift of link slab edge.
Link slab slipping out of outermost vertical dowels.
Extensive uplift of slab edge under cyclic loading.
Extensive uplift of slab edge considered point of failure. Applied load is continued
until failure of GFRP bar
Failure of GFRP bar.
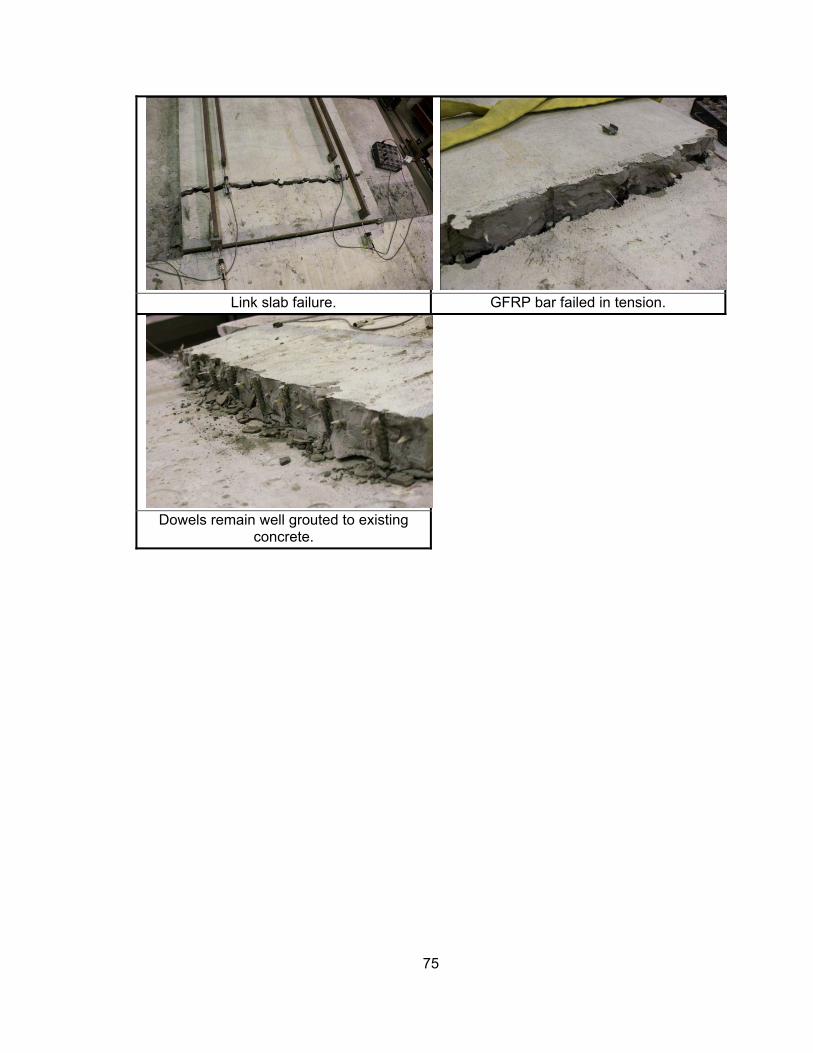
75
Link slab failure. GFRP bar failed in tension.
Dowels remain well grouted to existing concrete.

76
9 Appendix B: Test Specimen Layout
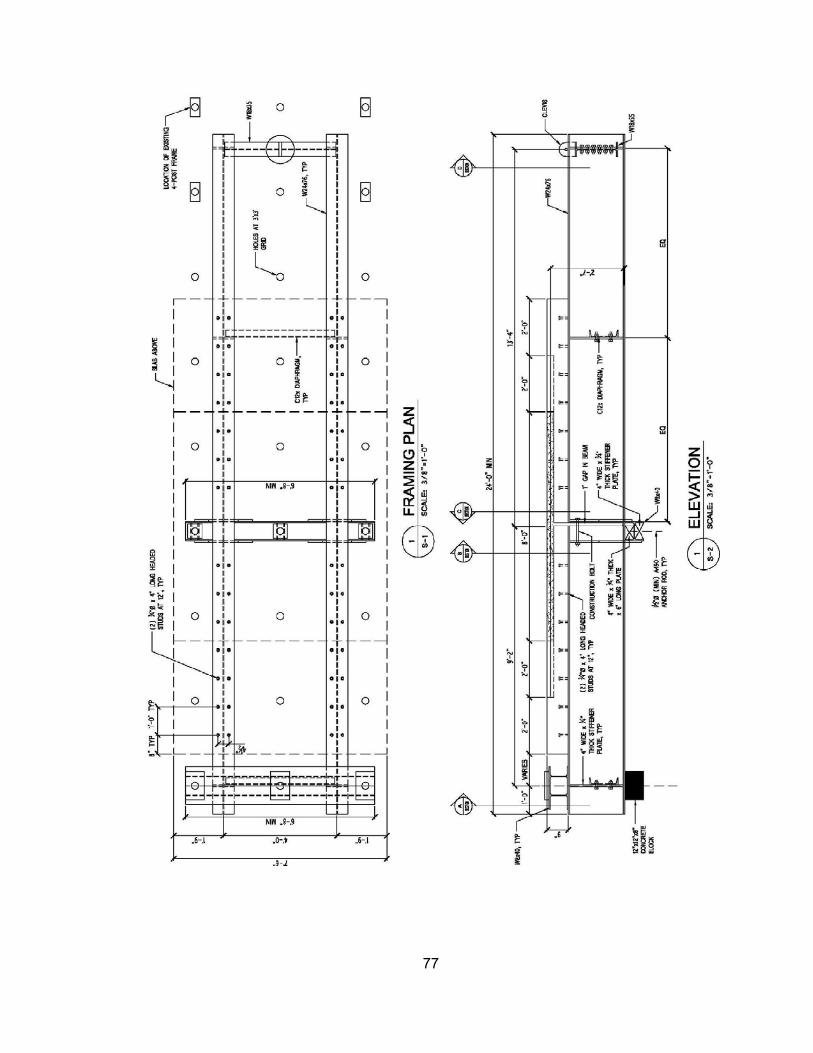
77
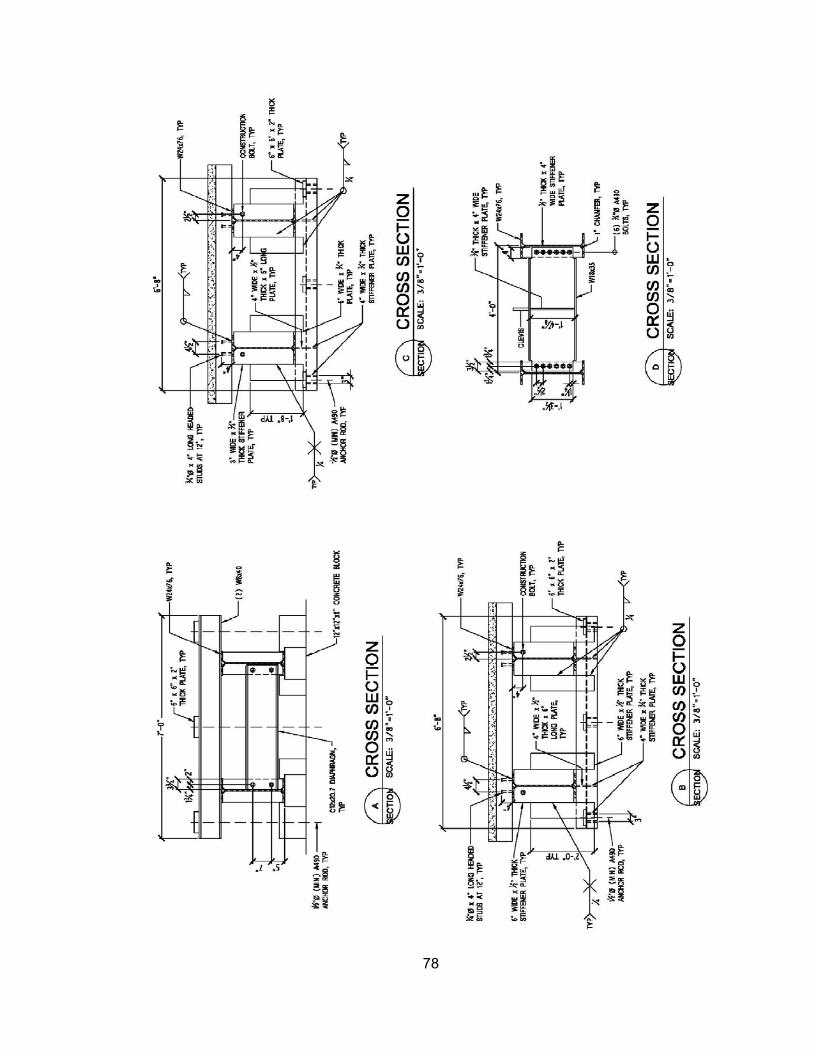
78
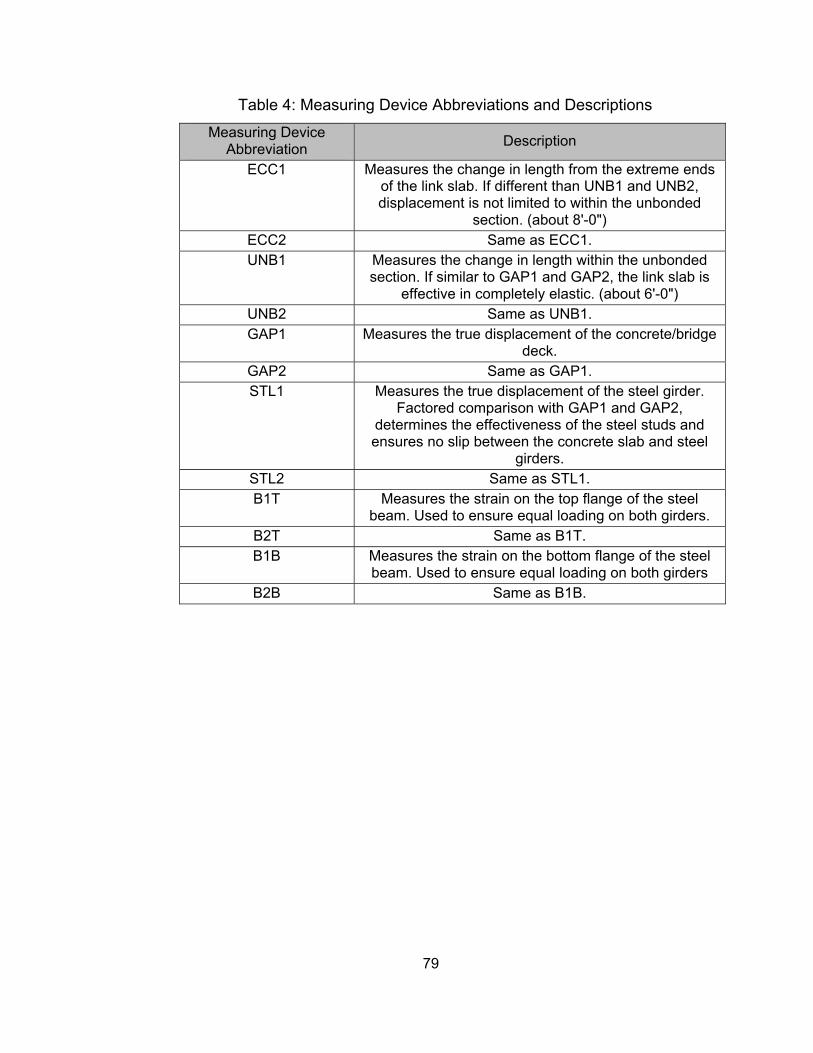
79
Table 4: Measuring Device Abbreviations and Descriptions
Measuring Device Abbreviation
Description
ECC1 Measures the change in length from the extreme ends of the link slab. If different than UNB1 and UNB2, displacement is not limited to within the unbonded
section. (about 8'-0") ECC2 Same as ECC1. UNB1 Measures the change in length within the unbonded
section. If similar to GAP1 and GAP2, the link slab is effective in completely elastic. (about 6'-0")
UNB2 Same as UNB1. GAP1 Measures the true displacement of the concrete/bridge
deck. GAP2 Same as GAP1. STL1 Measures the true displacement of the steel girder.
Factored comparison with GAP1 and GAP2, determines the effectiveness of the steel studs and ensures no slip between the concrete slab and steel
girders. STL2 Same as STL1. B1T Measures the strain on the top flange of the steel
beam. Used to ensure equal loading on both girders. B2T Same as B1T. B1B Measures the strain on the bottom flange of the steel
beam. Used to ensure equal loading on both girders B2B Same as B1B.